Pharmacological Validation of Candidate Causal Sleep Genes Identified in an N2 Cross
25
Pharmacological Validation of Candidate Causal Sleep Genes Identified in an N2 Cross Joseph I. Brunner 1 , Anthony L. Gotter 1 , Joshua Millstein 2,# , Susan Garson 1 , Jacquelyn Binns 3 , Steven V. Fox 3 , Alan T. Savitz 3 , He S. Yang 4 , Karrie Fitzpatrick 4 , Lili Zhou 4 , Joseph R. Owens 4 , Andrea L. Webber 6 , Martha H. Vitaterna 4 , Andrew Kasarskis 2,‡ , Victor N. Uebele 5 , Fred Turek 4 , John J. Renger 1 , and Christopher J. Winrow 1,* 1 Department of Neuroscience, Research Laboratories, West Point, PA, USA 2 Genetics Department, Rosetta Inpharmatics LLC, Seattle, WA, USA 3 Department of In Vivo Pharmacology, Research Laboratories, West Point, PA, USA 4 Center for Sleep and Circadian Biology, Northwestern University, Evanston, IL, USA 5 Department of In Vitro Pharmacology, Research Laboratories, West Point, PA, USA 6 Biomarkers Merck Research Laboratories, West Point, PA, USA Abstract Despite the substantial impact of sleep disturbances on human health and the many years of study dedicated to understanding sleep pathologies, the underlying genetic mechanisms that govern sleep and wake largely remain unknown. Recently, we completed large scale genetic and gene expression analyses in a segregating inbred mouse cross and identified candidate causal genes that regulate the mammalian sleep-wake cycle, across multiple traits including total sleep time, amounts of REM, non-REM, sleep bout duration and sleep fragmentation. Here we describe a novel approach toward validating candidate causal genes, while also identifying potential targets for sleep-related indications. Select small molecule antagonists and agonists were used to interrogate candidate causal gene function in rodent sleep polysomnography assays to determine impact on overall sleep architecture and to evaluate alignment with associated sleep-wake traits. Significant effects on sleep architecture were observed in validation studies using compounds targeting the muscarinic acetylcholine receptor M3 subunit (Chrm3)(wake promotion), nicotinic acetylcholine receptor alpha4 subunit (Chrna4)(wake promotion), dopamine receptor D5 subunit (Drd5)(sleep induction), serotonin 1D receptor (Htr1d)(altered REM fragmentation), glucagon- like peptide-1 receptor (Glp1r)(light sleep promotion and reduction of deep sleep), and Calcium channel, voltage-dependent, T type, alpha 1I subunit (Cacna1i)(increased bout duration slow wave sleep). Taken together, these results show the complexity of genetic components that regulate sleep-wake traits and highlight the importance of evaluating this complex behavior at a systems level. Pharmacological validation of genetically identified putative targets provides a rapid alternative to generating knock out or transgenic animal models, and may ultimately lead towards new therapeutic opportunities. * To whom correspondence should be addressed: Neuroscience Department, Merck Research Laboratories, 770 Sumneytown Pike, West Point, PA, 19486 Phone: 215-652-2425 FAX: 215-652-1658 [email protected]. # Current address: Department of Preventive Medicine, Keck School of Medicine, University of Southern California, Los Angeles, CA, USA ‡ Current address: Pacific Biosciences, Menlo Park, CA, USA Authors contributions Participated in research design: Brunner, Gotter, Kasarskis, Renger, Turek, Webber, Winrow Conducted experiments: Brunner, Garson, Savitz, Yang, Fitzpatrick, Zhou, Owens, Vitaterna Performed data analysis: Brunner, Garson, Fox, Millstein Wrote or contributed to the writing of the manuscript: Brunner, Gotter, Kasarskis, Millstein, Renger, Turek, Uebele, Webber, Winrow. NIH Public Access Author Manuscript J Neurogenet. Author manuscript; available in PMC 2013 February 11. Published in final edited form as: J Neurogenet. 2011 December ; 25(4): 167–181. doi:10.3109/01677063.2011.628426. NIH-PA Author Manuscript NIH-PA Author Manuscript NIH-PA Author Manuscript
-
Upload
independent -
Category
Documents
-
view
2 -
download
0
Transcript of Pharmacological Validation of Candidate Causal Sleep Genes Identified in an N2 Cross
Pharmacological Validation of Candidate Causal Sleep GenesIdentified in an N2 Cross
Joseph I. Brunner1, Anthony L. Gotter1, Joshua Millstein2,#, Susan Garson1, JacquelynBinns3, Steven V. Fox3, Alan T. Savitz3, He S. Yang4, Karrie Fitzpatrick4, Lili Zhou4, JosephR. Owens4, Andrea L. Webber6, Martha H. Vitaterna4, Andrew Kasarskis2,‡, Victor N.Uebele5, Fred Turek4, John J. Renger1, and Christopher J. Winrow1,*
1Department of Neuroscience, Research Laboratories, West Point, PA, USA2Genetics Department, Rosetta Inpharmatics LLC, Seattle, WA, USA3Department of In Vivo Pharmacology, Research Laboratories, West Point, PA, USA4Center for Sleep and Circadian Biology, Northwestern University, Evanston, IL, USA5Department of In Vitro Pharmacology, Research Laboratories, West Point, PA, USA6Biomarkers Merck Research Laboratories, West Point, PA, USA
AbstractDespite the substantial impact of sleep disturbances on human health and the many years of studydedicated to understanding sleep pathologies, the underlying genetic mechanisms that governsleep and wake largely remain unknown. Recently, we completed large scale genetic and geneexpression analyses in a segregating inbred mouse cross and identified candidate causal genes thatregulate the mammalian sleep-wake cycle, across multiple traits including total sleep time,amounts of REM, non-REM, sleep bout duration and sleep fragmentation. Here we describe anovel approach toward validating candidate causal genes, while also identifying potential targetsfor sleep-related indications. Select small molecule antagonists and agonists were used tointerrogate candidate causal gene function in rodent sleep polysomnography assays to determineimpact on overall sleep architecture and to evaluate alignment with associated sleep-wake traits.Significant effects on sleep architecture were observed in validation studies using compoundstargeting the muscarinic acetylcholine receptor M3 subunit (Chrm3)(wake promotion), nicotinicacetylcholine receptor alpha4 subunit (Chrna4)(wake promotion), dopamine receptor D5 subunit(Drd5)(sleep induction), serotonin 1D receptor (Htr1d)(altered REM fragmentation), glucagon-like peptide-1 receptor (Glp1r)(light sleep promotion and reduction of deep sleep), and Calciumchannel, voltage-dependent, T type, alpha 1I subunit (Cacna1i)(increased bout duration slow wavesleep). Taken together, these results show the complexity of genetic components that regulatesleep-wake traits and highlight the importance of evaluating this complex behavior at a systemslevel. Pharmacological validation of genetically identified putative targets provides a rapidalternative to generating knock out or transgenic animal models, and may ultimately lead towardsnew therapeutic opportunities.
*To whom correspondence should be addressed: Neuroscience Department, Merck Research Laboratories, 770 Sumneytown Pike,West Point, PA, 19486 Phone: 215-652-2425 FAX: 215-652-1658 [email protected].#Current address: Department of Preventive Medicine, Keck School of Medicine, University of Southern California, Los Angeles,CA, USA‡Current address: Pacific Biosciences, Menlo Park, CA, USA
Authors contributions Participated in research design: Brunner, Gotter, Kasarskis, Renger, Turek, Webber, Winrow Conductedexperiments: Brunner, Garson, Savitz, Yang, Fitzpatrick, Zhou, Owens, Vitaterna Performed data analysis: Brunner, Garson, Fox,Millstein Wrote or contributed to the writing of the manuscript: Brunner, Gotter, Kasarskis, Millstein, Renger, Turek, Uebele,Webber, Winrow.
NIH Public AccessAuthor ManuscriptJ Neurogenet. Author manuscript; available in PMC 2013 February 11.
Published in final edited form as:J Neurogenet. 2011 December ; 25(4): 167–181. doi:10.3109/01677063.2011.628426.
NIH
-PA Author Manuscript
NIH
-PA Author Manuscript
NIH
-PA Author Manuscript
Keywordssleep; genetics; rodent; pharmacology; translation
INTRODUCTIONSleep is a primordial, vital process that is observed across species, and is marked by changesin behavior, neuronal activity, cellular processes, and gene expression. Disordered sleep hasbeen central to a number of human pathological conditions including, but not limited to,metabolic, neurological, psychiatric and cardiovascular disorders (Cohrs, 2008; Compta etal., 2009; Zee & Turek, 2006). The fundamental purpose of sleep is not fully defined andefforts to characterize its molecular basis and underlying genetic regulation are ongoing.While a number of genetic and molecular studies have sought to determine mRNAexpression profiles which correlate with sleep/wake state, such approaches have not focusedon the determination of the underlying genes that regulate specific sleep-wake states(Thompson et al., 2010; Mackiewicz et al., 2009; Cirelli et al., 2004; Mackiewicz et al.,2007). More recently, genome-wide studies in humans and model organisms have beencarried out in order to identify genes which underlie the regulation of sleepwake traits(Millstein et al., 2011; Sehgal & Mignot, 2011; Winrow et al., 2009; Jiang et al., 2011;Miyagawa et al., 2008).
Familial inheritance of sleep disorders, including studies involving monozygotic twins in the1930’s, have long indicated the genetic basis of sleep (Dauviltiers et al., 2005). Suchapproaches have led to the discovery of molecular correlates for a spectrum of sleepdisorders, including chronic hypersomnia, insomnia, parasomnia, and circadian phasedisorders (Sehgal & Mignot, 2011). The hypersomnia disorder, narcolepsy, has wellestablished positive genetic associations that implicate multiple genes in humans (Caylak,2009; Nishino & Okuro, 2010; Sehgal & Mignot, 2011; Tafti, 2009). While the disorder ismultifactorial, predominant genetic factors associated with human narcolepsy include locifor Human Leukocyte Antigen (HLA), T cell receptor variants, and P2RY11 (Chabas et al.,2003; Franken & Tafti, 2003; Hallmayer et al., 2009; Hor et al., 2010; Kornum et al., 2011;Nishino & Okuro, 2010; Sehgal & Mignot, 2011; Tafti, 2009). A seminal discovery wasmade involving narcolepsy in dogs; a single mutation in the orexin 2 gene results in a fullypenetrant, autosomal recessive heritable condition (Lin et al., 1999). Although the humandisorder is complex and multifactorial, the findings in dogs identified a genetic target that isleading to potential advances in the treatment of insomnia (Brisbare-Roch et al., 2007; DiFabio et al., 2011; Winrow et al., 2011).
Significant and categorical changes in gene expression occur between sleep and wake thatare consistent with the synaptic homeostasis theory of sleep. Through microarray studiesinvolving different brain regions, signature mRNA expression patterns have emerged forsleep and wake states. For example, in rat cerebral cortex, wakefulness is associated withupregulation of mRNA’s involved in energy metabolism, cellular stress, and synapticpotentiation. In contrast, during sleep, transcripts related to protein anabolism, synthesis ofother macromolecules, and synaptic downscaling are upregulated. These changes inexpression during sleep and wake support the theory that maintenance of synaptic plasticityis a primary function of sleep (Cirelli, 2009). According to this model, sleep restoresbaseline synaptic strength, which enables learning, memory and other processes (Tononi &Cirelli, 2003). While the transition that occurs in gene expression between behavioral statesprovides important insight into processes that are consequential to being awake or asleep,such an approach does not allow for the identification of the genes or genetic networks that
Brunner et al. Page 2
J Neurogenet. Author manuscript; available in PMC 2013 February 11.
NIH
-PA Author Manuscript
NIH
-PA Author Manuscript
NIH
-PA Author Manuscript

are involved, or the factors that ultimately underlie the regulation of sleep/wake states andtraits responsible for these expression changes.
Genomic studies involving humans and model organisms, including mice, have begun toidentify the genetic basis for sleep and wake. In particular, Quantitative Trait Loci (QTL)analysis, dependant on natural allelic variation or mutagenized alleles (e.g. forward geneticapproach), has enabled mapping of sleep-related genes in model organisms (Cirelli, 2009;Winrow et al., 2009). We have previously described an association study in mice thatuncovered the genetic landscape for multiple sleep-wake traits, using a forward genetics,phenotype-driven approach to the functional genomics of sleep that enabled identification ofQTL. In that study, genetic variation was induced for QTL analysis, by crossing two strainsof mice (C57BL/6, and BALB/cByJ ) having substantially different sleep-wakecharacteristics.The analysis of 20 sleep-wake traits across 269 N2 BALB.B6 hybrid animalsrevealed 52 significant cQTL representing a minimum of 20 genomic loci (Winrow et al.,2009). Additionally, for each tissue analyzed (cerebral cortex, hypothalamus, thalamus andliver), eQTL’s, defined as genetic loci associated with specific expression changes, weredetermined for all sleep-wake traits. Causal inference identified candidate genes that governsleep where cQTL and eQTL regions overlapped, defined as a peak to peak distance nogreater than 15 cM and LOD score greater than 3 (Millstein et al., 2011).
Here, we validate a subset of pharmacologically tractable candidate causal genes identifiedin our previous studies (Winrow et al., 2009)(Millstein et al 2011 sleep). Selected targetgenes relate specifically to cholinergic (Chrna4 and Chrm3) and monaminergic neuronalsignaling (Htr1d and Drd5), as well as insulin synthesis and secretion (Glp1r), and finallymediation of neuronal calcium conductance (Cacna1i). Traditionally, validation of candidategenetic targets has relied on development of genetically engineered animals carrying loss-of-function and/or gain-of-function of candidate genes to determine the impact on a complextrait (i.e. reverse genetic approach). However, time (and cost) needed to develop the animalmodel, as well as compensatory molecular and developmental mechanisms are potentialconfounds with this approach and may interfere with rapid phenotype evaluation. Tomitigate these challenges, we employed a pharmacological approach to candidate causalsleep gene validation, by using small molecule reagents in rodents that target geneticallyidentified candidates to objectively determine their impact on behavioral state, as defined byelectroencephalogram (EEG) and electromyogram (EMG) measurements. Study resultsindicate significant effects of modulating target gene products (CHRM3, CHRNA4, GLP1r,DRD5, CACNA1I) on rat sleep that are consistent and in alignment with associated sleep/wake traits that were identified in a genetic cross. The results highlight the success of anovel approach to validating genetically identified candidate causal genes, and theexploration of potential pharmaceutical targets.
MATERIALS AND METHODSAll animal studies were performed in accordance with the United States Department ofAgriculture (USDA) Guide for the Care and Use of Laboratory Animals and were approvedby the Merck Institutional Animal Care and Use Committee.
AnimalsExperiments were conducted using adult male Sprague-Dawley rats (450-600g; TaconicFarms, Germantown, NY). Animals were maintained on a reverse, 12 h light/dark cycle(lights on at 16:00) under standard laboratory conditions (22-24°C, ambient humidity), withfood and water ad libitum.
Brunner et al. Page 3
J Neurogenet. Author manuscript; available in PMC 2013 February 11.
NIH
-PA Author Manuscript
NIH
-PA Author Manuscript
NIH
-PA Author Manuscript
CompoundsAll drugs were administered at a dose volume of 1 mL per 600 grams body weight.Exendin-4, cytisine, scopolamine hydrochloride, risperidone, and R(+)-SCH-23390 werepurchased from Sigma-Aldrich, INC. (St.Louis, MO, USA), dissolved in saline, andadministered intraperitoneally (i.p.). Liraglutide (Novo Nordisk A/S, Bagsvaerd, Denmark)and PNU 109291 (Tocris Bioscience, Ellisville, IN) were dissolved in saline, and injectedsubcutaneously (s.c.). Sumatriptan succinate was purchased from Sigma-Aldrich, INC.,dissolved in distilled water and dosed orally. Varenicline tartrate (Pfizer Ireland Labs,Dublin, Ireland) and darifenacin hydrobromide (AmplaChem, Carmal, IN) were dissolved in0.5% methylcellulose solution, and dosed orally (p.o.). TTA-A2 was synthesized in house aspreviously described (Shipe et al., 2008), suspended in 0.5% methylcellulose, and dosedorally at 10 mg/kg.
Dose selectionWhenever possible, compound dosages were predetermined from literary references that citedrug-mediated central effects or from available pharmacokinetic data. Doses used in thepresent study met or exceeded these referenced dosages to ensure CNS exposure.Darifenacin hydrobromide (10 mg/kg, p.o.), a CHRM3 antagonist, and its metabolites havedemonstrated brain exposure in Sprague-Dawley rats as quantified in cerebral spinal fluidwithin 1 to 4 hours of dosing (Devineni et al., 2005). Varenicline tartrate (0.3 to 3 mg/kg,s.c.) increased locomotion in rats, and blocked nicotine mediated hyperlocomotion(Zaniewska et al., 2008). Cytisine (1.5 or 3 mg/kg, s.c.) reduces voluntary ethanolconsumption in C57BL/6J mice (Sajja & Rahman, 2011) . SCH-23390 (0.1-0.3 mg/kg, i.p.),the first dopamine D1-like receptor antagonist, demonstrates efficacy in the pilocarpineseizure model in rats (Bourne, 2001). The high affinity D2-like molecule, risperidone (0.33mg/kg, s.c.) has efficacy in the rat conditioned avoidance response model (Zhang et al.,2011). Sumatriptan, the 5-HT1B/1D receptor antagonist, attenuates rat pain-related behaviorat doses as low as 0.1 mg/kg, dosed subcutaneously (Kayser et al., 2002). In a model ofguinea pig hypothermia, BRL-15572 (0.1 and 10 mg/kg), a 5-HT1D receptor antagonist, didnot have an impact on body temperature, but was found to sufficiently penetrate the CNS(Hagan et al., 1997). The 5-HT1D agonist, PNU-109291 has demonstrated effects in vitroand peripheral effects in vivo, but lacks efficacy in the clinical treatment of migraine (Cutreret al., 1999; Slassi et al., 2001). PNU-109291 (10 mg/kg and 15 mg/kg, s.c.) was dosed withthe understanding that selected doses may not sufficiently cross the blood brain barrier inorder to impact arousal. The GLP1R agonists, liraglutide (0.01 mg/kg, i.p.) and exendin-4(0.003 mg/kg, i.p.) demonstrate anorectic effects in Sprague-Dawley rats within 1 hour ofdosing (Kanoski et al., 2011). The potent T-type calcium channel inhibitor, TTA-A2 (3, 10,30 mg/kg, p.o.) demonstrates central affects on arousal (Uebele et al., 2009).
Rat Sleep Architecture StudiesElectrocorticogram/electroencephalogram (ECoG/EEG) and electromyogram (EMG) werecontinuously monitored in single housed male Sprague Dawley rats surgically implantedwith TL10M3-F50-EEE radio telemetry transmitters and automated sleep stage analysisperformed as described previously (Renger et al., 2004; Whitman et al., 2009; Winrow et al.,2011). Current studies employed one of two counterbalanced cross-over designs in which allanimals were alternatively treated with drug and vehicle daily. 3 day crossover design: 1-dayvehicle-only run-in, a 2-day arm of drug or vehicle treatment, then 3 days of conditionalcrossover following an appropriate wash-out period (1 to 4 days). 7 day crossover design: 1day vehicle-only run in, a 7-day arm of drug or vehicle treatment, then 7 days of conditionalcrossover. Effects of compound relative to vehicle were evaluated following administrationat the onset of the active phase (14:30-15:30). Results for all animals were averaged bycondition over administration nights and conditional effects statistically compared applying
Brunner et al. Page 4
J Neurogenet. Author manuscript; available in PMC 2013 February 11.
NIH
-PA Author Manuscript
NIH
-PA Author Manuscript
NIH
-PA Author Manuscript
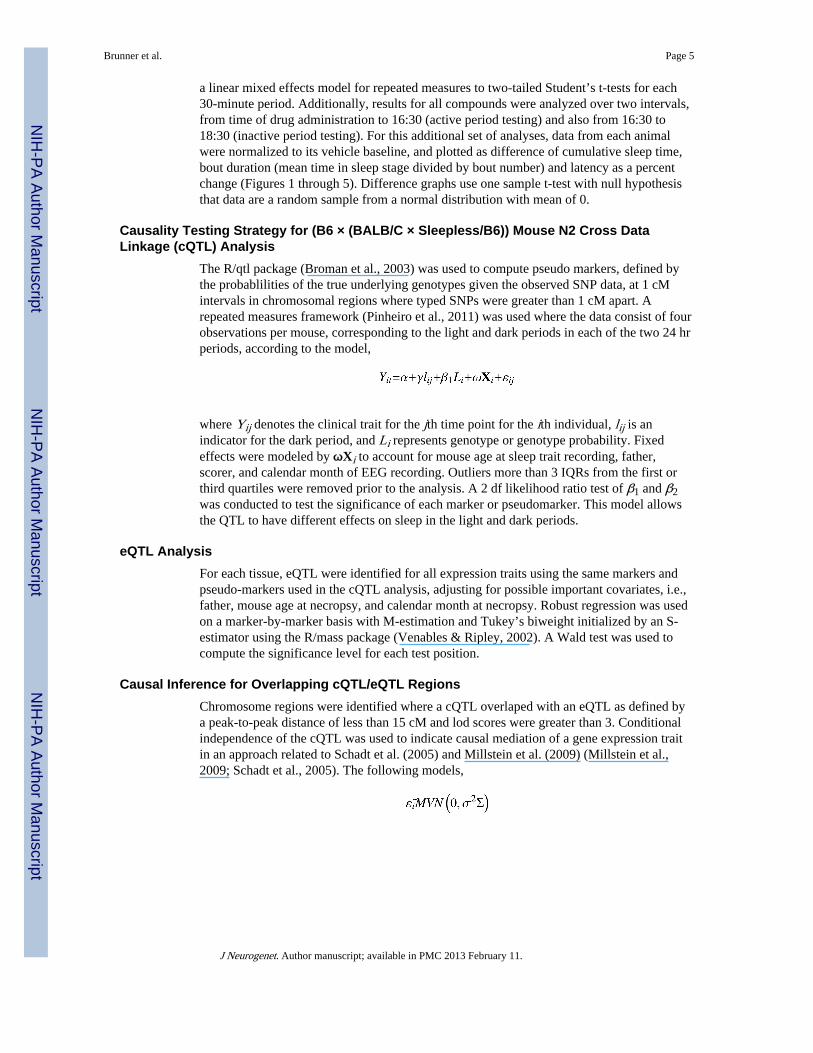
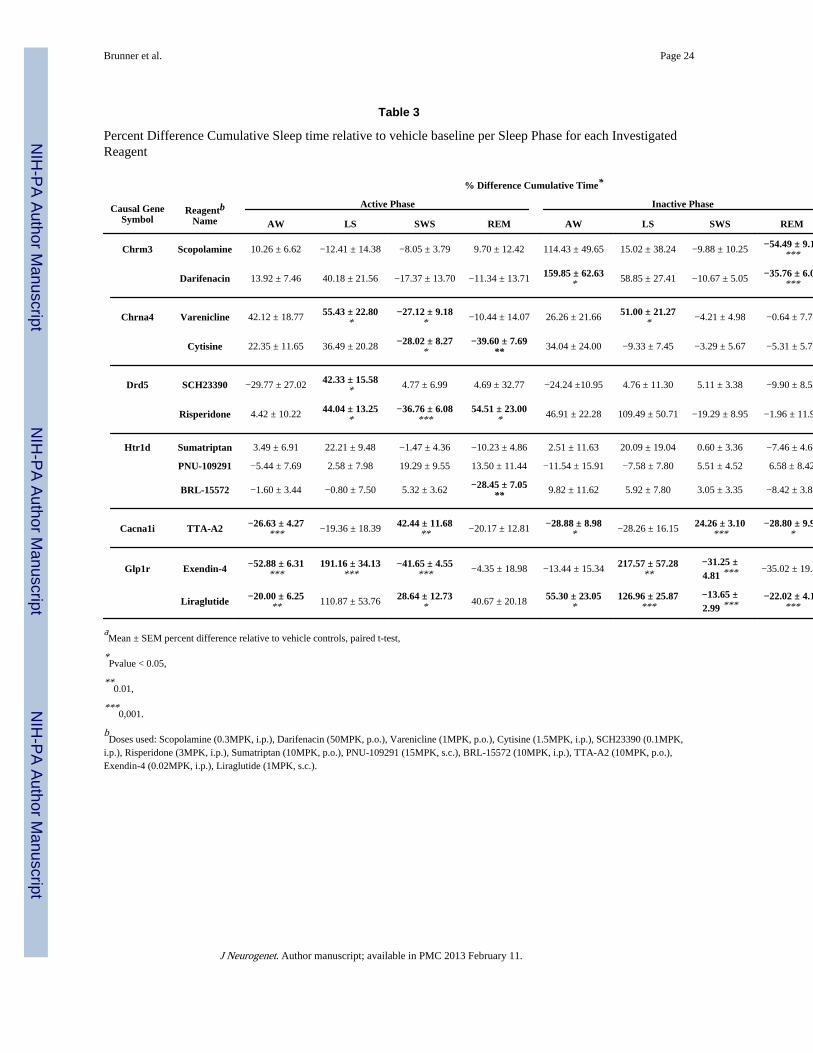
a linear mixed effects model for repeated measures to two-tailed Student’s t-tests for each30-minute period. Additionally, results for all compounds were analyzed over two intervals,from time of drug administration to 16:30 (active period testing) and also from 16:30 to18:30 (inactive period testing). For this additional set of analyses, data from each animalwere normalized to its vehicle baseline, and plotted as difference of cumulative sleep time,bout duration (mean time in sleep stage divided by bout number) and latency as a percentchange (Figures 1 through 5). Difference graphs use one sample t-test with null hypothesisthat data are a random sample from a normal distribution with mean of 0.
Causality Testing Strategy for (B6 × (BALB/C × Sleepless/B6)) Mouse N2 Cross DataLinkage (cQTL) Analysis
The R/qtl package (Broman et al., 2003) was used to compute pseudo markers, defined bythe probablilities of the true underlying genotypes given the observed SNP data, at 1 cMintervals in chromosomal regions where typed SNPs were greater than 1 cM apart. Arepeated measures framework (Pinheiro et al., 2011) was used where the data consist of fourobservations per mouse, corresponding to the light and dark periods in each of the two 24 hrperiods, according to the model,
where Yij denotes the clinical trait for the jth time point for the ith individual, lij is anindicator for the dark period, and Li represents genotype or genotype probability. Fixedeffects were modeled by ωXi to account for mouse age at sleep trait recording, father,scorer, and calendar month of EEG recording. Outliers more than 3 IQRs from the first orthird quartiles were removed prior to the analysis. A 2 df likelihood ratio test of β1 and β2was conducted to test the significance of each marker or pseudomarker. This model allowsthe QTL to have different effects on sleep in the light and dark periods.
eQTL AnalysisFor each tissue, eQTL were identified for all expression traits using the same markers andpseudo-markers used in the cQTL analysis, adjusting for possible important covariates, i.e.,father, mouse age at necropsy, and calendar month at necropsy. Robust regression was usedon a marker-by-marker basis with M-estimation and Tukey’s biweight initialized by an S-estimator using the R/mass package (Venables & Ripley, 2002). A Wald test was used tocompute the significance level for each test position.
Causal Inference for Overlapping cQTL/eQTL RegionsChromosome regions were identified where a cQTL overlaped with an eQTL as defined bya peak-to-peak distance of less than 15 cM and lod scores were greater than 3. Conditionalindependence of the cQTL was used to indicate causal mediation of a gene expression traitin an approach related to Schadt et al. (2005) and Millstein et al. (2009) (Millstein et al.,2009; Schadt et al., 2005). The following models,
Brunner et al. Page 5
J Neurogenet. Author manuscript; available in PMC 2013 February 11.
NIH
-PA Author Manuscript
NIH
-PA Author Manuscript
NIH
-PA Author Manuscript
were used to select between causal, reactive, or independent QTL/expression trait/sleep traitcompeting scenarios. Here, equation 1 is fitted using ordinary least squares regression andequation 2 is a repeated measures approach in a generalization of the cQTL analysisdescribed above. In equation 1, Yl and Yd denote the sleep trait measured over the light anddark periods, respectively, and R denotes gene expression. A causal scenario is characterizedby the expression trait mediating the effect of the cQTL on the sleep trait; in the reactivescenario, the sleep trait mediates the effect of the eQTL on the expression trait; and in theindependent scenario, the QTL independently affects the expression and sleep traits. Theselection criteria according to estimates generated from 1 and 2 were, causal: (β3,{β4,β5}≠=0)^({β6,β7}=0); reactive: ({β1,β2},{β6,β7}≠0)^(β3=0); and independent: ({β6,β7}≠0)^(β3≠0)
RESULTSIdentification of Pharmacologically Tractable Candidate Causal Genes Impacting SleepArchitecture
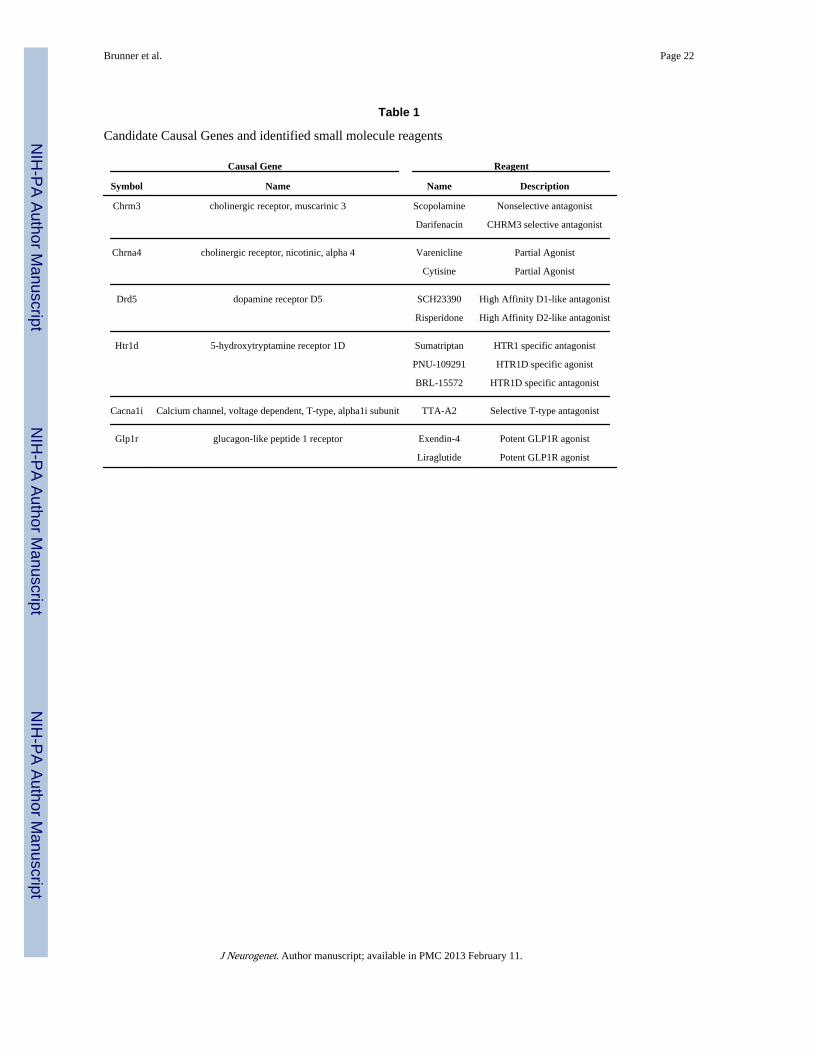
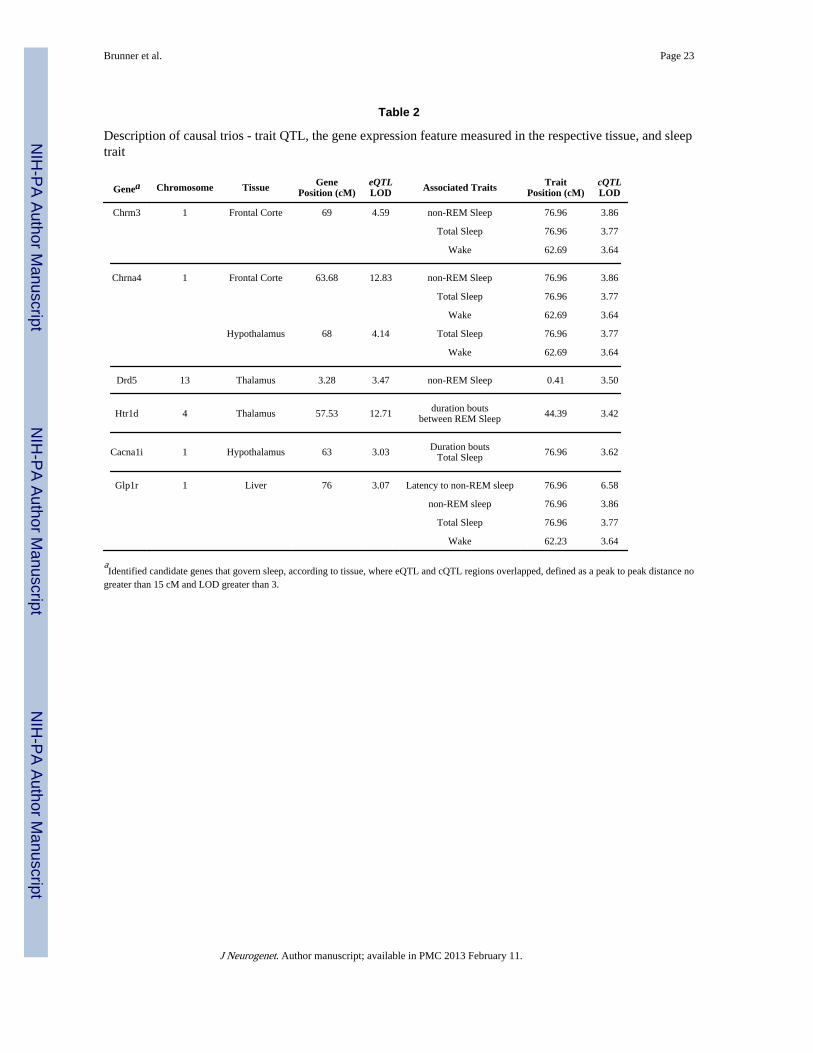
Statistical methods employed yielded a comprehensive list of 2,257 causal scenarios(supplemental Table 1), that is, scenarios in which a gene expression feature was statisticallyconsistent with causal mediation of the sleep trait QTL, derived from the previouslydescribed cross in mice (Winrow et al., 2009; Millstein et al., 2011). Each scenario describesa trio consisting of the sleep trait QTL, the gene expression feature measured in therespective tissue, and the sleep trait itself. There was a large amount of redundancy, as manyidentified genes were associated with multiple traits or tissue type gene expression changes.Out of the total 2,257 causal scenarios, there were 1,034 unique candidate causal genes. Weexplored potential reagents using Ingenuity Pathway Analysis software and internal searchmethods, and narrowed the candidates to 21 pharmacologically tractable genes. For thepurpose of these studies, we chose to focus on a refined set of six target genes for whichselective pharmacological tools were readily available (Table 1). Four of these six, Chrm3,Chrna4, Cacna1i, and Glp1r, were identified for a sleep QTL on chromosome one atapproximately 76 cM based on associated gene expression pattern changes in the liver,hypothalamus, and frontal cortex, and the remaining two, Htr1d and Drd5 were identifiedbased on associated gene expression profile changes in the thalamus for sleep QTL onchromosomes four and 13, respectively (Table 2).
Modulation of Cholinergic Neurotransmission Promotes Wakefulness in RatsMuscarinic Acetylcholine Receptor M3—According to genetic causality testing, themuscarinic acetylcholine receptor M3 subunit is associated with wake, total sleep, and non-REM sleep (Table 2). To probe the effects of muscarinic Acetylcholine receptor modulation,we examined scopolamine, a nonselective muscarinic receptor antagonist, and darifenacin, aselective muscarinic M3 receptor antagonist. Both molecules have overlappingpharmacological profiles and effects on rat electroencephalography. From our studies, bothcompounds impacted associated sleep parameters.
Scopolamine hydrochloride (0.3 mg/kg, i.p) significantly induced active wake and slowwave sleep (SWS) at the expense of REM sleep. Scopolamine treatment had significant
Brunner et al. Page 6
J Neurogenet. Author manuscript; available in PMC 2013 February 11.
NIH
-PA Author Manuscript
NIH
-PA Author Manuscript
NIH
-PA Author Manuscript
effects on overall sleep architecture for approximately 7 hours post-dose (Figure 1A).Decreased bout duration during the active period indicated increased fragmentation of activewake and SWS. Effects on SWS bout duration persisted into the inactive period (Figure 1D,Table 4). Significant reductions in REM cumulative sleep time (Figure 1C, Table 3) duringthe inactive period correlated with reduced bout duration (Figure 1D, Table 4).
Darifenacin hydrobromide (50 mg/kg, p.o.) significantly induced arousal, with increases inboth wake and light sleep with simultaneous reductions in both SWS and REM sleep (Figure1B, Supplemental Figure 1). Compound effects on rat polysomnography persistedapproximately 9 hours post-dose (Supplemental Figure 1). The effects of darifenacin on ratsleep attenuated over time, and by the last day of dosing only minor effects were observed(supplemental figure 2). Significant fragmentation of REM sleep (reduced bout duration)during the active period occurred (Figure 1D, Table 4). Increased wakefulness during theinactive period were observed, along with compensatory reductions in REM cumulativesleep time (Figure 1C, Table 3) that correlated with reduced REM bout duration (Figure 1D,Table 4).
Darifenacin had more profound effects on wakefulness, especially when accounting for theobserved tachyphylaxis. Increases in SWS sleep were observed following administrationwith scopolamine treatment, but not following darifenacin treatment. This effect may beattributed to another muscarinic receptor subunit or off target interaction.
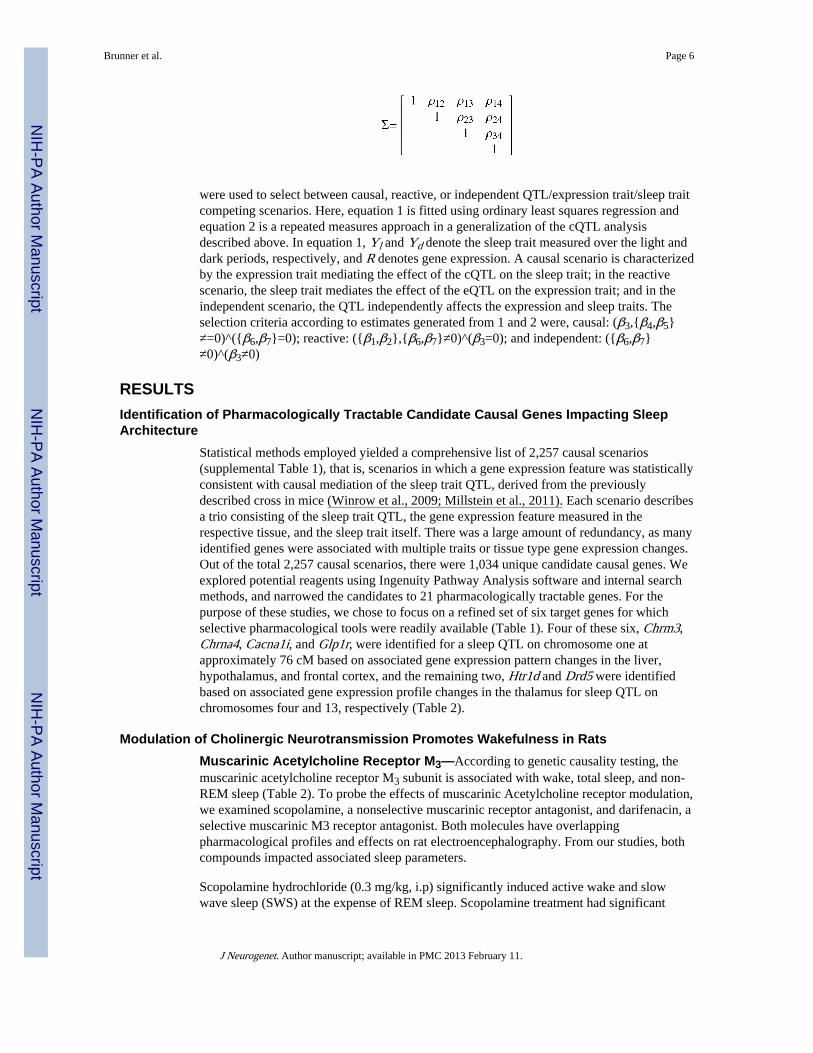
Nicotinic Receptor α4—The neuronal nicotinic receptor alpha-4 subunit was associatedwith wake, total sleep, and non-REM sleep, as determined by genetic causality testing(Table 2). To probe the role of nicotinic receptor alpha-4 agonism on sleep architecture, weutilized cytisine and varenicline tartrate, both partial agonists. Varenicline and cytisine havesimilar pharmacological profiles, but differing potencies and efficacies with regard toneuronal nicotinic receptor subunits (Gonzales et al., 2006).
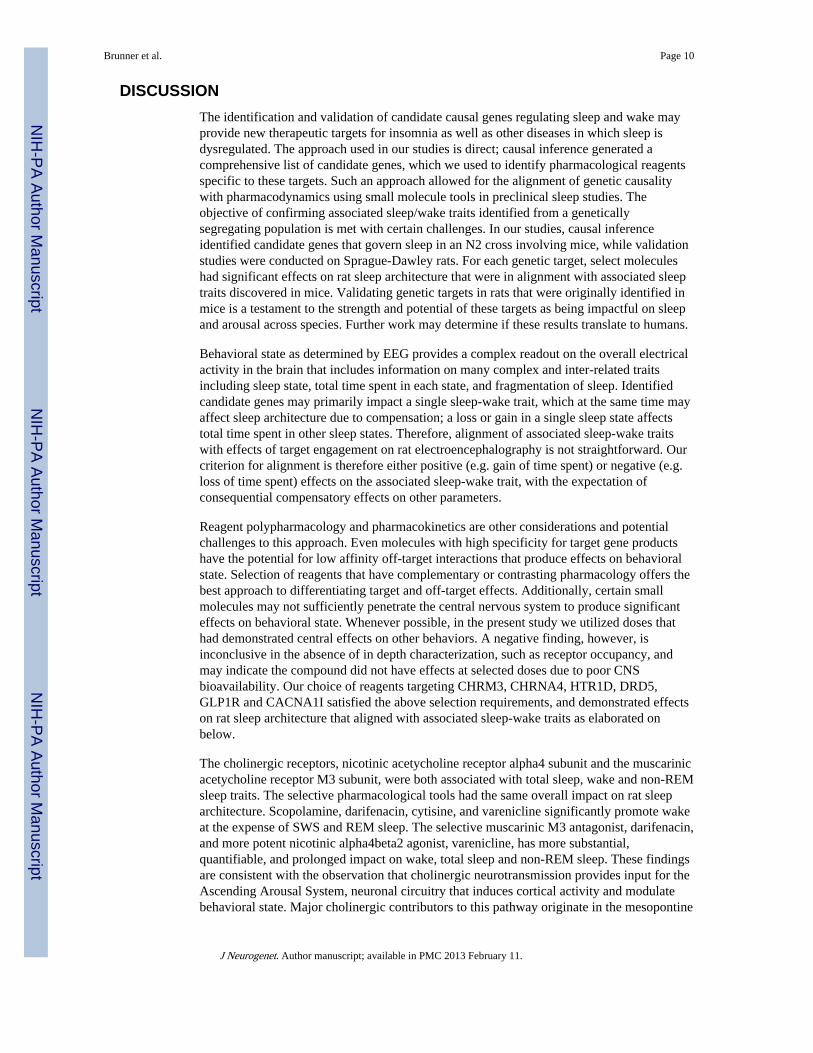
Varenicline tartrate (1 mg/kg, p.o.), a partial agonist, is a derivative of cytisine with greaterpotency and efficacy for the alpha4beta2 neuronal nicotinic receptor subunit (Gonzales etal., 2006). Increased wake and light sleep, with concurrent reductions in SWS sleep wereobserved after treatment, and effects on light sleep persisted for roughly 7 hours (Figure2A). Significant effects on SWS and REM sleep dissipated over the course of study, withonly minor effects observed by the last day of administration (supplemental Figure 3).Cytisine treatment (1.5 mg/kg, i.p.) had only modest and short acting effects on ratelectroencephalography. Generally, cytisine treatment had similar effects on rat sleep as didvarenicline treatment, but observed effects were relatively brief. Increased wake and lightsleep with coincident reduced SWS and REM sleep were observed in the first hour post-dose (Figure 2B). Cytisine treatment altered arousal state during the active phase only, withno significant effects persisting into the inactive period.
More significant effects on rat polysomnography were observed following treatment withvarenicline than following treatment with cytisine. Varenicline treatment increased lightsleep and reduced SWS during the active period (Figure 2C, Table 3). Treatment withvarenicline also significantly increased the number of entries into SWS and REM sleep,which resulted in decreased average bouts of SWS and REM during the active period(Figure 2D, Table 4). During the subsequent inactive phase, light sleep was significantlyinduced (Figure 2C, Table 3), and SWS and REM sleep consolidation continued, withincreased SWS and REM bout duration (Figure 2D, Table 4). Treatment with vareniclineincreased latency to both SWS (41.9 ± 15.2%, p<0.05) and REM sleep (42.4 ± 14.3%,p<0.05), which is consistent with its wake promoting effects. Acute suppression of REMsleep was the only specific effect that differentiates treatment with cytisine from treatment
Brunner et al. Page 7
J Neurogenet. Author manuscript; available in PMC 2013 February 11.
NIH
-PA Author Manuscript
NIH
-PA Author Manuscript
NIH
-PA Author Manuscript
with varenicline (Figure 2C, Table 3). Both compounds significantly impact each associatedtrait and promote wake and light sleep. However varenicline has a more profound effect oncumulative time and entries into all stages, which may be attributed to the increased efficacyof varenicline at the alpha4beta2 subunit.
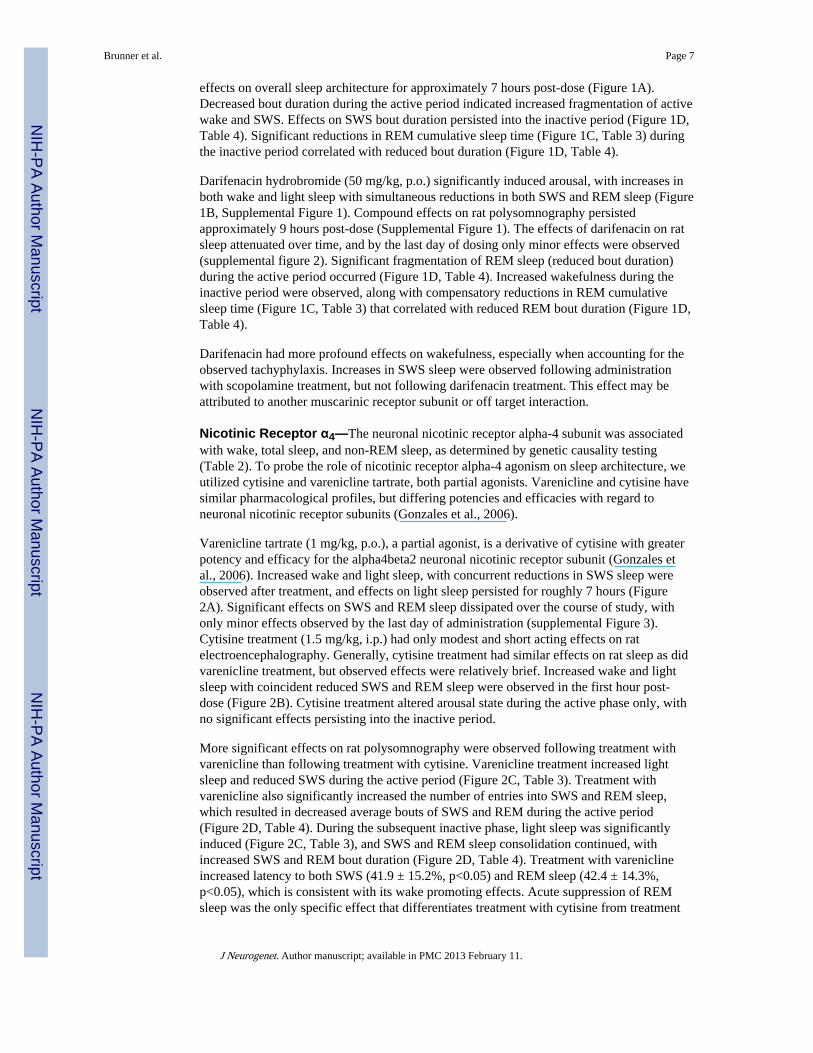
Modulation of Dopaminergic Neurotransmission Promotes Light Sleep in RatsDopamine receptor D5 was identified as a candidate causal gene associated with non-REMsleep (Table 2). In general, modulation of dopaminergic neurotransmission induced lightsleep at the expense of reduced SWS sleep in our studies. Specific day after induction oflight sleep was observed following treatment with SCH23390 and coincided with reductionof SWS and REM sleep, which differed from risperidone study results, and may beconsidered specific DRD5 mediated effects. Additionally, dopamine receptor D1-likeantagonism decreased latency time to light sleep.
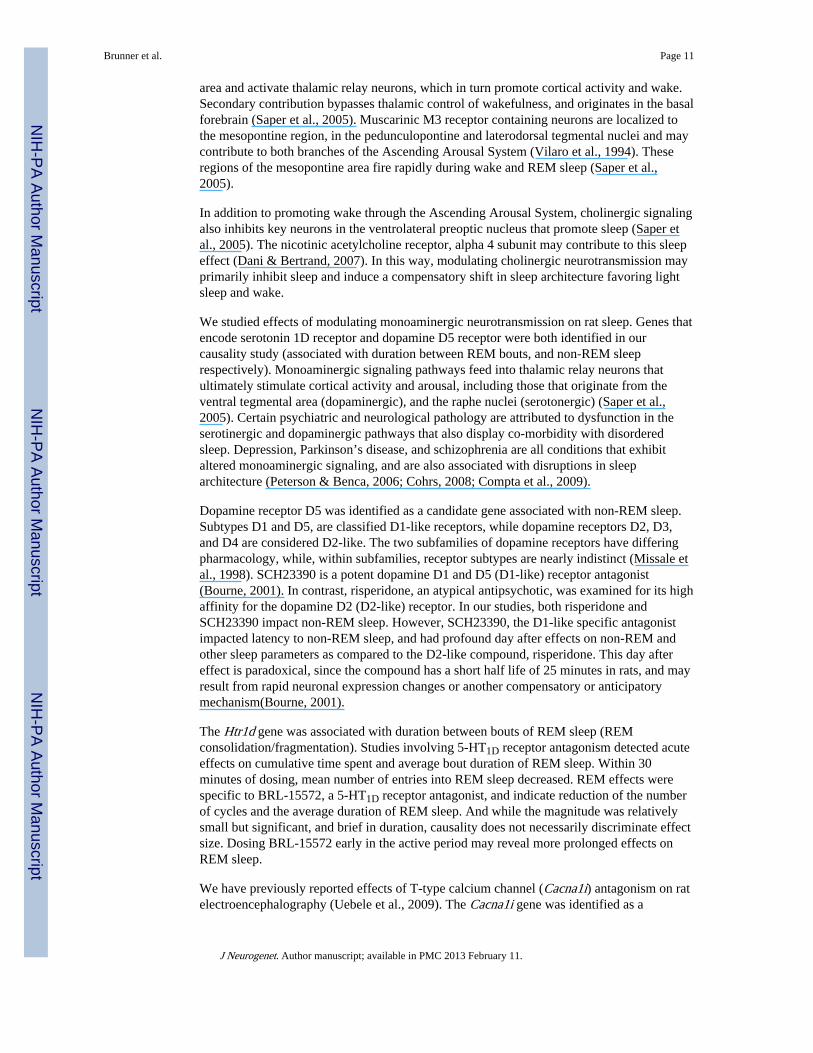
Overall, risperidone treatment (3 mg/kg, i.p.) resulted in significant induction of Light sleepand reduction of SWS sleep. Drug effects persisted for approximately 3 hours post-dose(Figure 3A). Potentiation to drug treatment was observed, with only minor effects observedon the first day of dosing (Supplemental Figure 4). SCH23390 treatment (0.1 mg/kg, s.c)resulted in an immediate decrease in active wake and an increase in light sleep (Figure 3B).Significant day after effects were also observed; increased light sleep and SWS and reducedREM sleep were recorded during the following active period (Supplemental Figure 5).
Both drugs increased light sleep cumulative time immediately post-dose (Figure 3C, Table3), and light sleep bout duration for the duration of both active and inactive periods (Figure3D, Table 4). While there were many more observed effects specific to risperidonetreatment, only treatment with SCH23390 resulted in reduced active wake mean boutduration during the active period (wake fragmentation) (Figure 3D, Table 4). Also,SCH23390 significantly reduced the latency time to light sleep (50.0 ± 12.7%, p<0.05),which is consistent with its sleep promoting effects.
Modulation of Serotonergic Neurotransmission via the 1D Receptor Subtype Results inModest Effects on REM Sleep
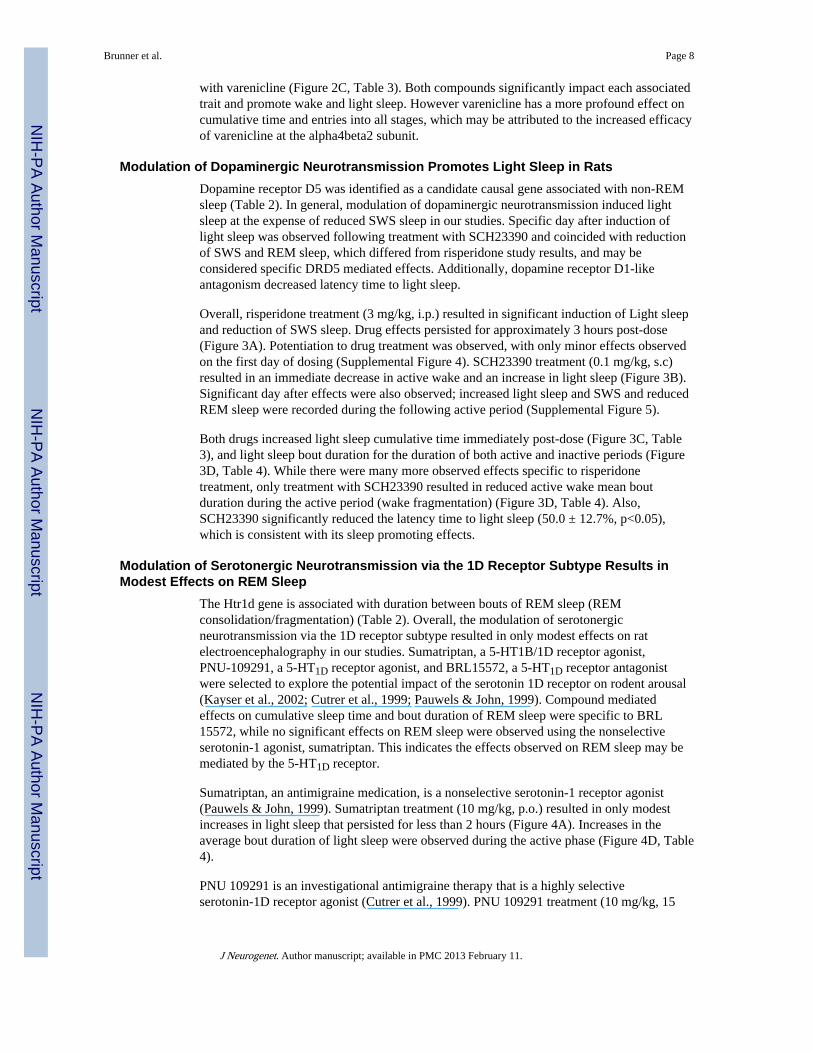
The Htr1d gene is associated with duration between bouts of REM sleep (REMconsolidation/fragmentation) (Table 2). Overall, the modulation of serotonergicneurotransmission via the 1D receptor subtype resulted in only modest effects on ratelectroencephalography in our studies. Sumatriptan, a 5-HT1B/1D receptor agonist,PNU-109291, a 5-HT1D receptor agonist, and BRL15572, a 5-HT1D receptor antagonistwere selected to explore the potential impact of the serotonin 1D receptor on rodent arousal(Kayser et al., 2002; Cutrer et al., 1999; Pauwels & John, 1999). Compound mediatedeffects on cumulative sleep time and bout duration of REM sleep were specific to BRL15572, while no significant effects on REM sleep were observed using the nonselectiveserotonin-1 agonist, sumatriptan. This indicates the effects observed on REM sleep may bemediated by the 5-HT1D receptor.
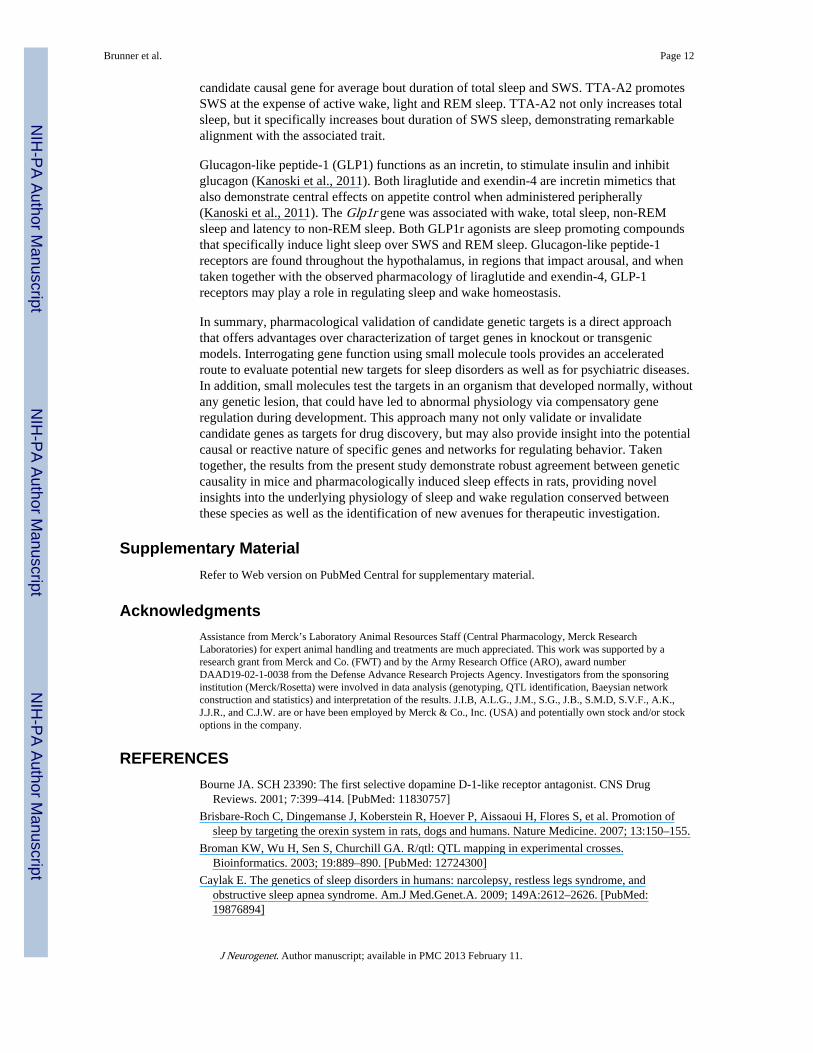
Sumatriptan, an antimigraine medication, is a nonselective serotonin-1 receptor agonist(Pauwels & John, 1999). Sumatriptan treatment (10 mg/kg, p.o.) resulted in only modestincreases in light sleep that persisted for less than 2 hours (Figure 4A). Increases in theaverage bout duration of light sleep were observed during the active phase (Figure 4D, Table4).
PNU 109291 is an investigational antimigraine therapy that is a highly selectiveserotonin-1D receptor agonist (Cutrer et al., 1999). PNU 109291 treatment (10 mg/kg, 15
Brunner et al. Page 8
J Neurogenet. Author manuscript; available in PMC 2013 February 11.
NIH
-PA Author Manuscript
NIH
-PA Author Manuscript
NIH
-PA Author Manuscript
mg/kg, s.c.) resulted in only minor effects, with no observed trends of treatment on overallrat sleep architecture (Supplemental Figure 6).
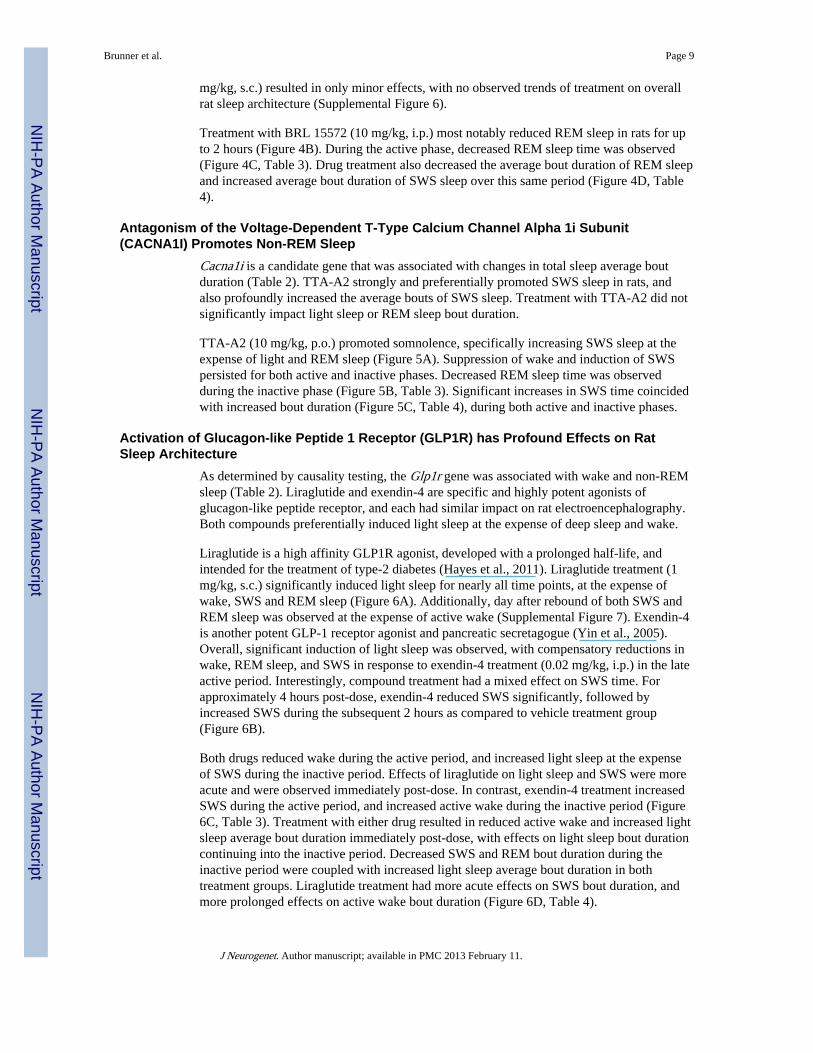
Treatment with BRL 15572 (10 mg/kg, i.p.) most notably reduced REM sleep in rats for upto 2 hours (Figure 4B). During the active phase, decreased REM sleep time was observed(Figure 4C, Table 3). Drug treatment also decreased the average bout duration of REM sleepand increased average bout duration of SWS sleep over this same period (Figure 4D, Table4).
Antagonism of the Voltage-Dependent T-Type Calcium Channel Alpha 1i Subunit(CACNA1I) Promotes Non-REM Sleep
Cacna1i is a candidate gene that was associated with changes in total sleep average boutduration (Table 2). TTA-A2 strongly and preferentially promoted SWS sleep in rats, andalso profoundly increased the average bouts of SWS sleep. Treatment with TTA-A2 did notsignificantly impact light sleep or REM sleep bout duration.
TTA-A2 (10 mg/kg, p.o.) promoted somnolence, specifically increasing SWS sleep at theexpense of light and REM sleep (Figure 5A). Suppression of wake and induction of SWSpersisted for both active and inactive phases. Decreased REM sleep time was observedduring the inactive phase (Figure 5B, Table 3). Significant increases in SWS time coincidedwith increased bout duration (Figure 5C, Table 4), during both active and inactive phases.
Activation of Glucagon-like Peptide 1 Receptor (GLP1R) has Profound Effects on RatSleep Architecture
As determined by causality testing, the Glp1r gene was associated with wake and non-REMsleep (Table 2). Liraglutide and exendin-4 are specific and highly potent agonists ofglucagon-like peptide receptor, and each had similar impact on rat electroencephalography.Both compounds preferentially induced light sleep at the expense of deep sleep and wake.
Liraglutide is a high affinity GLP1R agonist, developed with a prolonged half-life, andintended for the treatment of type-2 diabetes (Hayes et al., 2011). Liraglutide treatment (1mg/kg, s.c.) significantly induced light sleep for nearly all time points, at the expense ofwake, SWS and REM sleep (Figure 6A). Additionally, day after rebound of both SWS andREM sleep was observed at the expense of active wake (Supplemental Figure 7). Exendin-4is another potent GLP-1 receptor agonist and pancreatic secretagogue (Yin et al., 2005).Overall, significant induction of light sleep was observed, with compensatory reductions inwake, REM sleep, and SWS in response to exendin-4 treatment (0.02 mg/kg, i.p.) in the lateactive period. Interestingly, compound treatment had a mixed effect on SWS time. Forapproximately 4 hours post-dose, exendin-4 reduced SWS significantly, followed byincreased SWS during the subsequent 2 hours as compared to vehicle treatment group(Figure 6B).
Both drugs reduced wake during the active period, and increased light sleep at the expenseof SWS during the inactive period. Effects of liraglutide on light sleep and SWS were moreacute and were observed immediately post-dose. In contrast, exendin-4 treatment increasedSWS during the active period, and increased active wake during the inactive period (Figure6C, Table 3). Treatment with either drug resulted in reduced active wake and increased lightsleep average bout duration immediately post-dose, with effects on light sleep bout durationcontinuing into the inactive period. Decreased SWS and REM bout duration during theinactive period were coupled with increased light sleep average bout duration in bothtreatment groups. Liraglutide treatment had more acute effects on SWS bout duration, andmore prolonged effects on active wake bout duration (Figure 6D, Table 4).
Brunner et al. Page 9
J Neurogenet. Author manuscript; available in PMC 2013 February 11.
NIH
-PA Author Manuscript
NIH
-PA Author Manuscript
NIH
-PA Author Manuscript
DISCUSSIONThe identification and validation of candidate causal genes regulating sleep and wake mayprovide new therapeutic targets for insomnia as well as other diseases in which sleep isdysregulated. The approach used in our studies is direct; causal inference generated acomprehensive list of candidate genes, which we used to identify pharmacological reagentsspecific to these targets. Such an approach allowed for the alignment of genetic causalitywith pharmacodynamics using small molecule tools in preclinical sleep studies. Theobjective of confirming associated sleep/wake traits identified from a geneticallysegregating population is met with certain challenges. In our studies, causal inferenceidentified candidate genes that govern sleep in an N2 cross involving mice, while validationstudies were conducted on Sprague-Dawley rats. For each genetic target, select moleculeshad significant effects on rat sleep architecture that were in alignment with associated sleeptraits discovered in mice. Validating genetic targets in rats that were originally identified inmice is a testament to the strength and potential of these targets as being impactful on sleepand arousal across species. Further work may determine if these results translate to humans.
Behavioral state as determined by EEG provides a complex readout on the overall electricalactivity in the brain that includes information on many complex and inter-related traitsincluding sleep state, total time spent in each state, and fragmentation of sleep. Identifiedcandidate genes may primarily impact a single sleep-wake trait, which at the same time mayaffect sleep architecture due to compensation; a loss or gain in a single sleep state affectstotal time spent in other sleep states. Therefore, alignment of associated sleep-wake traitswith effects of target engagement on rat electroencephalography is not straightforward. Ourcriterion for alignment is therefore either positive (e.g. gain of time spent) or negative (e.g.loss of time spent) effects on the associated sleep-wake trait, with the expectation ofconsequential compensatory effects on other parameters.
Reagent polypharmacology and pharmacokinetics are other considerations and potentialchallenges to this approach. Even molecules with high specificity for target gene productshave the potential for low affinity off-target interactions that produce effects on behavioralstate. Selection of reagents that have complementary or contrasting pharmacology offers thebest approach to differentiating target and off-target effects. Additionally, certain smallmolecules may not sufficiently penetrate the central nervous system to produce significanteffects on behavioral state. Whenever possible, in the present study we utilized doses thathad demonstrated central effects on other behaviors. A negative finding, however, isinconclusive in the absence of in depth characterization, such as receptor occupancy, andmay indicate the compound did not have effects at selected doses due to poor CNSbioavailability. Our choice of reagents targeting CHRM3, CHRNA4, HTR1D, DRD5,GLP1R and CACNA1I satisfied the above selection requirements, and demonstrated effectson rat sleep architecture that aligned with associated sleep-wake traits as elaborated onbelow.
The cholinergic receptors, nicotinic acetycholine receptor alpha4 subunit and the muscarinicacetycholine receptor M3 subunit, were both associated with total sleep, wake and non-REMsleep traits. The selective pharmacological tools had the same overall impact on rat sleeparchitecture. Scopolamine, darifenacin, cytisine, and varenicline significantly promote wakeat the expense of SWS and REM sleep. The selective muscarinic M3 antagonist, darifenacin,and more potent nicotinic alpha4beta2 agonist, varenicline, has more substantial,quantifiable, and prolonged impact on wake, total sleep and non-REM sleep. These findingsare consistent with the observation that cholinergic neurotransmission provides input for theAscending Arousal System, neuronal circuitry that induces cortical activity and modulatebehavioral state. Major cholinergic contributors to this pathway originate in the mesopontine
Brunner et al. Page 10
J Neurogenet. Author manuscript; available in PMC 2013 February 11.
NIH
-PA Author Manuscript
NIH
-PA Author Manuscript
NIH
-PA Author Manuscript
area and activate thalamic relay neurons, which in turn promote cortical activity and wake.Secondary contribution bypasses thalamic control of wakefulness, and originates in the basalforebrain (Saper et al., 2005). Muscarinic M3 receptor containing neurons are localized tothe mesopontine region, in the pedunculopontine and laterodorsal tegmental nuclei and maycontribute to both branches of the Ascending Arousal System (Vilaro et al., 1994). Theseregions of the mesopontine area fire rapidly during wake and REM sleep (Saper et al.,2005).
In addition to promoting wake through the Ascending Arousal System, cholinergic signalingalso inhibits key neurons in the ventrolateral preoptic nucleus that promote sleep (Saper etal., 2005). The nicotinic acetylcholine receptor, alpha 4 subunit may contribute to this sleepeffect (Dani & Bertrand, 2007). In this way, modulating cholinergic neurotransmission mayprimarily inhibit sleep and induce a compensatory shift in sleep architecture favoring lightsleep and wake.
We studied effects of modulating monoaminergic neurotransmission on rat sleep. Genes thatencode serotonin 1D receptor and dopamine D5 receptor were both identified in ourcausality study (associated with duration between REM bouts, and non-REM sleeprespectively). Monoaminergic signaling pathways feed into thalamic relay neurons thatultimately stimulate cortical activity and arousal, including those that originate from theventral tegmental area (dopaminergic), and the raphe nuclei (serotonergic) (Saper et al.,2005). Certain psychiatric and neurological pathology are attributed to dysfunction in theserotinergic and dopaminergic pathways that also display co-morbidity with disorderedsleep. Depression, Parkinson’s disease, and schizophrenia are all conditions that exhibitaltered monoaminergic signaling, and are also associated with disruptions in sleeparchitecture (Peterson & Benca, 2006; Cohrs, 2008; Compta et al., 2009).
Dopamine receptor D5 was identified as a candidate gene associated with non-REM sleep.Subtypes D1 and D5, are classified D1-like receptors, while dopamine receptors D2, D3,and D4 are considered D2-like. The two subfamilies of dopamine receptors have differingpharmacology, while, within subfamilies, receptor subtypes are nearly indistinct (Missale etal., 1998). SCH23390 is a potent dopamine D1 and D5 (D1-like) receptor antagonist(Bourne, 2001). In contrast, risperidone, an atypical antipsychotic, was examined for its highaffinity for the dopamine D2 (D2-like) receptor. In our studies, both risperidone andSCH23390 impact non-REM sleep. However, SCH23390, the D1-like specific antagonistimpacted latency to non-REM sleep, and had profound day after effects on non-REM andother sleep parameters as compared to the D2-like compound, risperidone. This day aftereffect is paradoxical, since the compound has a short half life of 25 minutes in rats, and mayresult from rapid neuronal expression changes or another compensatory or anticipatorymechanism(Bourne, 2001).
The Htr1d gene was associated with duration between bouts of REM sleep (REMconsolidation/fragmentation). Studies involving 5-HT1D receptor antagonism detected acuteeffects on cumulative time spent and average bout duration of REM sleep. Within 30minutes of dosing, mean number of entries into REM sleep decreased. REM effects werespecific to BRL-15572, a 5-HT1D receptor antagonist, and indicate reduction of the numberof cycles and the average duration of REM sleep. And while the magnitude was relativelysmall but significant, and brief in duration, causality does not necessarily discriminate effectsize. Dosing BRL-15572 early in the active period may reveal more prolonged effects onREM sleep.
We have previously reported effects of T-type calcium channel (Cacna1i) antagonism on ratelectroencephalography (Uebele et al., 2009). The Cacna1i gene was identified as a
Brunner et al. Page 11
J Neurogenet. Author manuscript; available in PMC 2013 February 11.
NIH
-PA Author Manuscript
NIH
-PA Author Manuscript
NIH
-PA Author Manuscript
candidate causal gene for average bout duration of total sleep and SWS. TTA-A2 promotesSWS at the expense of active wake, light and REM sleep. TTA-A2 not only increases totalsleep, but it specifically increases bout duration of SWS sleep, demonstrating remarkablealignment with the associated trait.
Glucagon-like peptide-1 (GLP1) functions as an incretin, to stimulate insulin and inhibitglucagon (Kanoski et al., 2011). Both liraglutide and exendin-4 are incretin mimetics thatalso demonstrate central effects on appetite control when administered peripherally(Kanoski et al., 2011). The Glp1r gene was associated with wake, total sleep, non-REMsleep and latency to non-REM sleep. Both GLP1r agonists are sleep promoting compoundsthat specifically induce light sleep over SWS and REM sleep. Glucagon-like peptide-1receptors are found throughout the hypothalamus, in regions that impact arousal, and whentaken together with the observed pharmacology of liraglutide and exendin-4, GLP-1receptors may play a role in regulating sleep and wake homeostasis.
In summary, pharmacological validation of candidate genetic targets is a direct approachthat offers advantages over characterization of target genes in knockout or transgenicmodels. Interrogating gene function using small molecule tools provides an acceleratedroute to evaluate potential new targets for sleep disorders as well as for psychiatric diseases.In addition, small molecules test the targets in an organism that developed normally, withoutany genetic lesion, that could have led to abnormal physiology via compensatory generegulation during development. This approach many not only validate or invalidatecandidate genes as targets for drug discovery, but may also provide insight into the potentialcausal or reactive nature of specific genes and networks for regulating behavior. Takentogether, the results from the present study demonstrate robust agreement between geneticcausality in mice and pharmacologically induced sleep effects in rats, providing novelinsights into the underlying physiology of sleep and wake regulation conserved betweenthese species as well as the identification of new avenues for therapeutic investigation.
Supplementary MaterialRefer to Web version on PubMed Central for supplementary material.
AcknowledgmentsAssistance from Merck’s Laboratory Animal Resources Staff (Central Pharmacology, Merck ResearchLaboratories) for expert animal handling and treatments are much appreciated. This work was supported by aresearch grant from Merck and Co. (FWT) and by the Army Research Office (ARO), award numberDAAD19-02-1-0038 from the Defense Advance Research Projects Agency. Investigators from the sponsoringinstitution (Merck/Rosetta) were involved in data analysis (genotyping, QTL identification, Baeysian networkconstruction and statistics) and interpretation of the results. J.I.B, A.L.G., J.M., S.G., J.B., S.M.D, S.V.F., A.K.,J.J.R., and C.J.W. are or have been employed by Merck & Co., Inc. (USA) and potentially own stock and/or stockoptions in the company.
REFERENCESBourne JA. SCH 23390: The first selective dopamine D-1-like receptor antagonist. CNS Drug
Reviews. 2001; 7:399–414. [PubMed: 11830757]
Brisbare-Roch C, Dingemanse J, Koberstein R, Hoever P, Aissaoui H, Flores S, et al. Promotion ofsleep by targeting the orexin system in rats, dogs and humans. Nature Medicine. 2007; 13:150–155.
Broman KW, Wu H, Sen S, Churchill GA. R/qtl: QTL mapping in experimental crosses.Bioinformatics. 2003; 19:889–890. [PubMed: 12724300]
Caylak E. The genetics of sleep disorders in humans: narcolepsy, restless legs syndrome, andobstructive sleep apnea syndrome. Am.J Med.Genet.A. 2009; 149A:2612–2626. [PubMed:19876894]
Brunner et al. Page 12
J Neurogenet. Author manuscript; available in PMC 2013 February 11.
NIH
-PA Author Manuscript
NIH
-PA Author Manuscript
NIH
-PA Author Manuscript
Chabas D, Taheri S, Renier C, Mignot E. The genetics of narcolepsy. Annual Review of Genomics andHuman Genetics. 2003; 4:459–483.
Cirelli C. The genetic and molecular regulation of sleep: from fruit flies to humans. Nature ReviewsNeuroscience. 2009; 10:549–560.
Cirelli C, Gutierrez CM, Tononi G. Extensive and divergent effects of sleep and wakefulness on braingene expression. Neuron. 2004; 41:35–43. [PubMed: 14715133]
Cohrs S. Sleep Disturbances in Patients with Schizophrenia Impact and Effect of Antipsychotics. CnsDrugs. 2008; 22:939–962. [PubMed: 18840034]
Compta Y, Santamaria J, Ratti L, Tolosa E, Iranzo A, Munoz E, et al. Cerebrospinal hypocretin,daytime sleepiness and sleep architecture in Parkinson’s disease dementia. Brain. 2009; 132:3308–3317. [PubMed: 19858078]
Cutrer FM, Yu XJ, Ayata G, Moskowitz MA, Waeber C. Effects of PNU-109,291, a selective 5-HT1Dreceptor agonist, on electrically induced dural plasma extravasation and capsaicin-evoked c-fosimmunoreactivity within trigeminal nucleus caudalis. Neuropharmacology. 1999; 38:1043–1053.[PubMed: 10428423]
Dani JA, Bertrand D. Nicotinic acetylcholine receptors and nicotinic cholinergic mechanisms of thecentral nervous system. Annual Review of Pharmacology and Toxicology. 2007; 47:699–729.
Dauviltiers Y, Maret S, Tafti M. Genetics of normal and pathological sleep in humans. Sleep MedicineReviews. 2005; 9:91–100. [PubMed: 15737788]
Devineni D, Skerjanec A, Woodworth TG. Low Central Nervous System (CNS) Penetration byDarifenacin, a Muscarinic M3 Selective Receptor Antagonist, in Rats. pA2 Online E-journal of theBritish Pharmacological Society. 2005
Di Fabio R, Pellacani A, Faedo S, Roth A, Piccoli L, Gerrard P, et al. Discovery process andpharmacological characterization of a novel dual orexin 1 and orexin 2 receptor antagonist usefulfor treatment of sleep disorders. Bioorganic & Medicinal Chemistry Letters. 2011; 21:5562–5567.[PubMed: 21831639]
Franken P, Tafti M. Genetics of sleep and sleep disorders. Frontiers in Bioscience. 2003; 8:E381–E397. [PubMed: 12700094]
Gonzales D, Rennard SI, Nides M, Oncken C, Azoulay S, Billing CB, et al. Varenicline, an alpha 4beta 2 nicotinic acetylcholine receptor partial agonist, vs sustained-release bupropion and placebofor smoking cessation - A randomized controlled trial. Jama-Journal of the American MedicalAssociation. 2006; 296:47–55.
Hagan JJ, Slade PD, Gaster L, Jeffrey P, Hatcher JP, Middlemiss DN. Stimulation of 5-HT1Breceptors causes hypothermia in the guinea pig. European Journal of Pharmacology. 1997;331:169–174. [PubMed: 9274976]
Hallmayer J, Faraco J, Lin L, Hesselson S, Winkelmann J, Kawashima M, et al. Narcolepsy is stronglyassociated with the T-cell receptor alpha locus. Nature Genetics. 2009; 41:708–711. [PubMed:19412176]
Hayes MR, Kanoski SE, Alhadeff AL, Grill HJ. Comparative Effects of the Long-Acting GLP-1Receptor Ligands, Liraglutide and Exendin-4, on Food Intake and Body Weight Suppression inRats. Obesity. 2011; 19:1342–1349. [PubMed: 21415845]
Hor H, Kutalik Z, Dauvilliers Y, Valsesia A, Lammers GJ, Donjacour CEHM, et al. Genome-wideassociation study identifies new HLA class II haplotypes strongly protective against narcolepsy.Nature Genetics. 2010; 42:786–U80. [PubMed: 20711174]
Jiang P, Striz M, Wisor JP, O’Hara BF. Behavioral and genetic dissection of a mouse model foradvanced sleep phase syndrome. SLEEP. 2011; 34:39–48. [PubMed: 21203370]
Kanoski SE, Fortin SM, Arnold M, Grill HJ, Hayes MR. Peripheral and Central GLP-1 ReceptorPopulations Mediate the Anorectic Effects of Peripherally Administered GLP-1 ReceptorAgonists, Liraglutide and Exendin-4. Endocrinology. 2011; 152:3103–3112. [PubMed: 21693680]
Kayser V, Aubel B, Hamon M, Bourgoin S. The antimigraine 5-HT1B/1D receptor agonists,sumatriptan, zolmitriptan and dihydroergotamine, attenuate pain-related behaviour in a rat modelof trigeminal neuropathic pain. British Journal of Pharmacology. 2002; 137:1287–1297. [PubMed:12466238]
Brunner et al. Page 13
J Neurogenet. Author manuscript; available in PMC 2013 February 11.
NIH
-PA Author Manuscript
NIH
-PA Author Manuscript
NIH
-PA Author Manuscript

Kornum BR, Kawashima M, Faraco J, Lin L, Rico TJ, Hesselson S, et al. Common variants inP2RY11 are associated with narcolepsy. Nature Genetics. 2011; 43:66–U90. [PubMed: 21170044]
Lin L, Faraco J, Li R, Kadotani H, Rogers W, Lin XY, et al. The sleep disorder canine narcolepsy iscaused by a mutation in the hypocretin (orexin) receptor 2 gene. Cell. 1999; 98:365–376.[PubMed: 10458611]
Mackiewicz M, Shockley KR, Romer MA, Galante RJ, Zimmerman JE, Naidoo N, et al.Macromolecule biosynthesis: a key function of sleep. Physiol Genomics. 2007; 31:441–457.[PubMed: 17698924]
Mackiewicz M, Zimmerman JE, Shockley KR, Churchill GA, Pack AI. What are microarrays teachingus about sleep? Trends Mol.Med. 2009; 15:79–87. [PubMed: 19162550]
Millstein J, Winrow CJ, Kasarskis A, Owens JR, Zhou L, Summa KC, et al. Identification of CausalGenes, Networks and Transcriptional Regulators of REM Sleep and Wake. SLEEP. (in press).
Millstein J, Zhang B, Zhu J, Schadt EE. Disentangling molecular relationships with a causal inferencetest. Bmc Genetics. 2009; 10
Missale C, Nash SR, Robinson SW, Jaber M, Caron MG. Dopamine receptors: From structure tofunction. Physiological Reviews. 1998; 78:189–225. [PubMed: 9457173]
Miyagawa T, Kawashima M, Nishida N, Ohashi J, Kimura R, Fujimoto A, et al. Variant betweenCPT1B and CHKB associated with susceptibility to narcolepsy. Nat.Genet. 2008; 40:1324–1328.[PubMed: 18820697]
Nishino S, Okuro M. Emerging treatments for narcolepsy and its related disorders. ExpertOpin.Emerg.Drugs. 2010; 15:139–158. [PubMed: 20166851]
Pauwels PJ, John GW. Present and future of 5-HT receptor agonists as antimigraine drugs. ClinicalNeuropharmacology. 1999; 22:123–136. [PubMed: 10367177]
Peterson MJ, Benca RM. Sleep in mood disorders. Psychiatric Clinics of North America. 2006;29:1009. + [PubMed: 17118279]
Pinheiro, J.; Bates, D.; DebRoy, S.; Sarkar, D.; the R Development Core Team. nlme: Linear andNonlinear Mixed Effects Models. R package version 3.1-982011. [Computer software]
Renger JJ, Dunn SL, Motzel SL, Johnson C, Koblan KS. Sub-chronic administration of zolpidemaffects modifications to rat sleep architecture. Brain Research. 2004; 1010:45–54. [PubMed:15126116]
Sajja RK, Rahman S. Lobeline and cytisine reduce voluntary ethanol drinking behavior in maleC57BL/6J mice. Progress in Neuro-Psychopharmacology & Biological Psychiatry. 2011; 35:257–264. [PubMed: 21111768]
Saper CB, Scammell TE, Lu J. Hypothalamic regulation of sleep and circadian rhythms. Nature. 2005;437:1257–1263. [PubMed: 16251950]
Schadt EE, Lamb J, Yang X, Zhu J, Edwards S, GuhaThakurta D, et al. An integrative genomicsapproach to infer causal associations between gene expression and disease. Nature Genetics. 2005;37:710–717. [PubMed: 15965475]
Sehgal A, Mignot E. Genetics of Sleep and Sleep Disorders. Cell. 2011; 146:194–207. [PubMed:21784243]
Shipe WD, Barrow JC, Yang ZQ, Lindsley CW, Yang FV, Schlegel KA, et al. Design, Synthesis, andEvaluation of a Novel 4-Aminomethyl-4-fluoropiperidine as a T-Type Ca(2+) ChannelAntagonist. J Med Chem. 2008; 51:3692–3695. [PubMed: 18540666]
Slassi A, Isaac M, Arora J. Novel serotonergic and non-serotonergic migraine headache therapies.Expert Opinion on Therapeutic Patents. 2001; 11:625–649.
Tafti M. Genetic aspects of normal and disturbed sleep. Sleep Med. 2009; 10(Suppl 1):S17–S21.[PubMed: 19660984]
Thompson CL, Wisor JP, Lee CK, Pathak SD, Gerashchenko D, Smith KA, et al. Molecular andanatomical signatures of sleep deprivation in the mouse brain. Front Neurosci. 2010; 4:165.[PubMed: 21088695]
Tononi G, Cirelli C. Sleep and synaptic homeostasis: a hypothesis. Brain Research Bulletin. 2003;62:143–150. [PubMed: 14638388]
Brunner et al. Page 14
J Neurogenet. Author manuscript; available in PMC 2013 February 11.
NIH
-PA Author Manuscript
NIH
-PA Author Manuscript
NIH
-PA Author Manuscript
Uebele VN, Gotter AL, Nuss CE, Kraus RL, Doran SM, Garson SL, et al. Antagonism of T-typecalcium channels inhibits high-fat diet-induced weight gain in mice. Journal of ClinicalInvestigation. 2009; 119:1659–1667. [PubMed: 19451696]
Venables, WN.; Ripley, BD. Modern Applied Statistics with S. Fourth ed. Springer; New York: 2002.
Vilaro MT, Palacios JM, Mengod G. Multiplicity of Muscarinic Autoreceptor Subtypes - Comparisonof the Distribution of Cholinergic Cells and Cells Containing Messenger-Rna for 5 Subtypes ofMuscarinic Receptors in the Rat-Brain. Molecular Brain Research. 1994; 21:30–46. [PubMed:8164520]
Whitman DB, Cox CD, Breslin MJ, Brashear KM, Schreier JD, Bogusky MJ, et al. Discovery of aPotent, CNS-Penetrant Orexin Receptor Antagonist Based on an N,N-Disubstituted-1,4-diazepaneScaffold that Promotes Sleep in Rats. Chemmedchem. 2009; 4:1069–1074. [PubMed: 19418500]
Winrow CJ, Gotter AL, Cox CD, Doran SM, Tannenbaum PL, Breslin MJ, et al. Promotion of Sleepby Suvorexant--A Novel Dual Orexin Receptor Antagonist. Journal of Neurogenetics. 2011;25:52–61. [PubMed: 21473737]
Winrow CJ, Williams DL, Kasarskis A, Millstein J, Laposky AD, Yang HS, et al. Uncovering theGenetic Landscape for Multiple Sleep-Wake Traits. Plos One. 2009; 4
Yin XP, Wei DZ, Yi LN, Tao XY, Ma YS. Expression and purification of exendin-4, a GLP-1 receptoragonist, in Escherichia coli. Protein Expression and Purification. 2005; 41:259–265. [PubMed:15866711]
Zaniewska M, McCreary AC, Stefanski R, Przegalinski E, Filip M. Effect of Varenicline on the Acuteand Repeated Locomotor Responses to Nicotine in Rats. Synapse. 2008; 62:935–939. [PubMed:18798299]
Zee PC, Turek FW. Sleep and health - Everywhere and in both directions. Archives of InternalMedicine. 2006; 166:1686–1688. [PubMed: 16983044]
Zhang C, Fang YR, Li M. Olanzapine and risperidone disrupt conditioned avoidance responding byselectively weakening motivational salience of conditioned stimulus: Further evidence.Pharmacology Biochemistry and Behavior. 2011; 98:155–160.
Brunner et al. Page 15
J Neurogenet. Author manuscript; available in PMC 2013 February 11.
NIH
-PA Author Manuscript
NIH
-PA Author Manuscript
NIH
-PA Author Manuscript
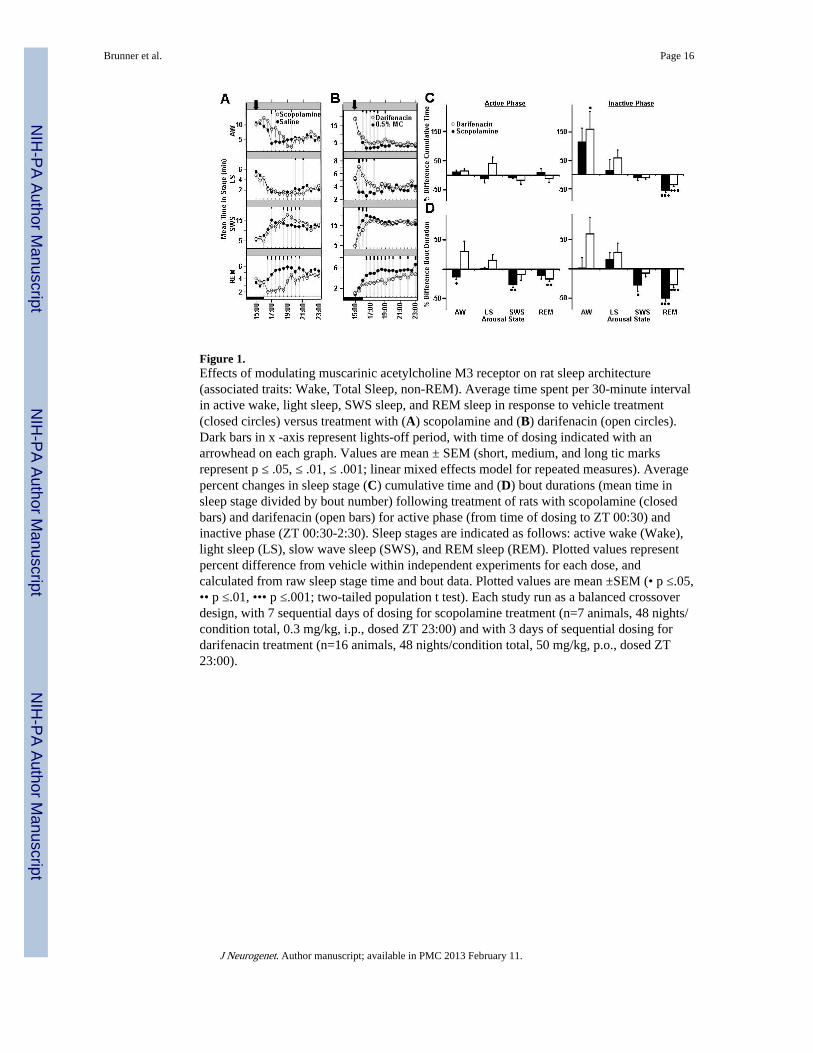
Figure 1.Effects of modulating muscarinic acetylcholine M3 receptor on rat sleep architecture(associated traits: Wake, Total Sleep, non-REM). Average time spent per 30-minute intervalin active wake, light sleep, SWS sleep, and REM sleep in response to vehicle treatment(closed circles) versus treatment with (A) scopolamine and (B) darifenacin (open circles).Dark bars in x -axis represent lights-off period, with time of dosing indicated with anarrowhead on each graph. Values are mean ± SEM (short, medium, and long tic marksrepresent p ≤ .05, ≤ .01, ≤ .001; linear mixed effects model for repeated measures). Averagepercent changes in sleep stage (C) cumulative time and (D) bout durations (mean time insleep stage divided by bout number) following treatment of rats with scopolamine (closedbars) and darifenacin (open bars) for active phase (from time of dosing to ZT 00:30) andinactive phase (ZT 00:30-2:30). Sleep stages are indicated as follows: active wake (Wake),light sleep (LS), slow wave sleep (SWS), and REM sleep (REM). Plotted values representpercent difference from vehicle within independent experiments for each dose, andcalculated from raw sleep stage time and bout data. Plotted values are mean ±SEM (• p ≤.05,•• p ≤.01, ••• p ≤.001; two-tailed population t test). Each study run as a balanced crossoverdesign, with 7 sequential days of dosing for scopolamine treatment (n=7 animals, 48 nights/condition total, 0.3 mg/kg, i.p., dosed ZT 23:00) and with 3 days of sequential dosing fordarifenacin treatment (n=16 animals, 48 nights/condition total, 50 mg/kg, p.o., dosed ZT23:00).
Brunner et al. Page 16
J Neurogenet. Author manuscript; available in PMC 2013 February 11.
NIH
-PA Author Manuscript
NIH
-PA Author Manuscript
NIH
-PA Author Manuscript
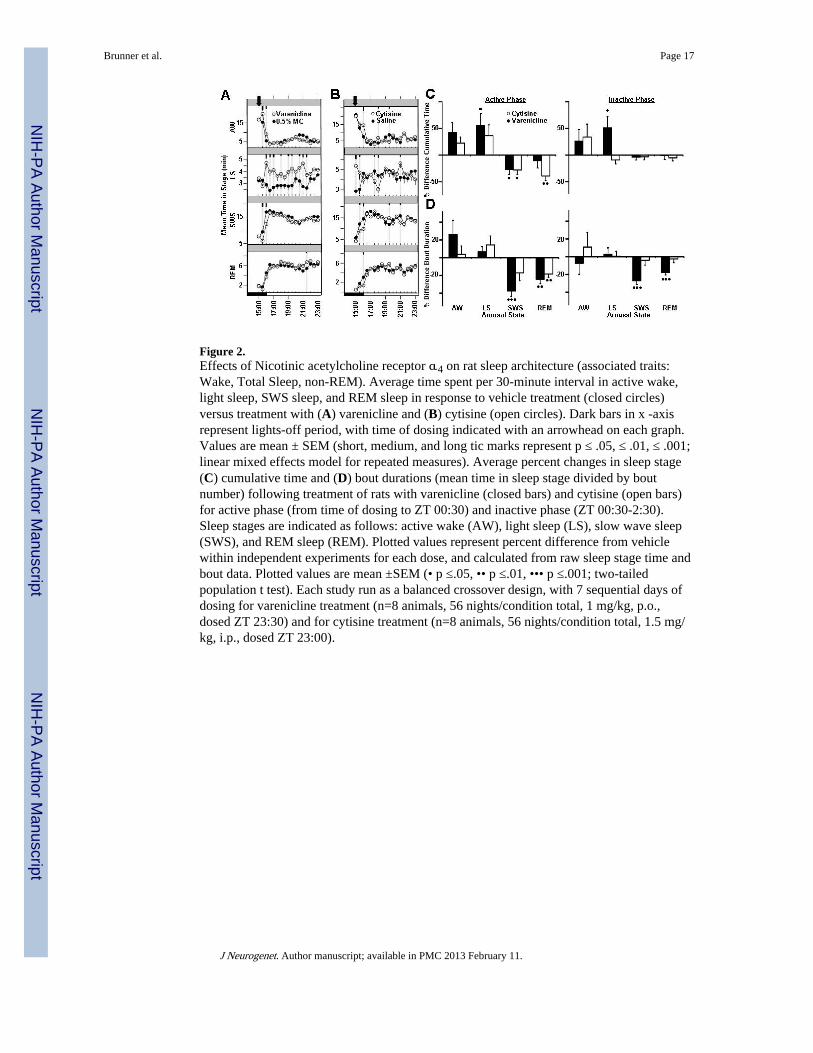
Figure 2.Effects of Nicotinic acetylcholine receptor α4 on rat sleep architecture (associated traits:Wake, Total Sleep, non-REM). Average time spent per 30-minute interval in active wake,light sleep, SWS sleep, and REM sleep in response to vehicle treatment (closed circles)versus treatment with (A) varenicline and (B) cytisine (open circles). Dark bars in x -axisrepresent lights-off period, with time of dosing indicated with an arrowhead on each graph.Values are mean ± SEM (short, medium, and long tic marks represent p ≤ .05, ≤ .01, ≤ .001;linear mixed effects model for repeated measures). Average percent changes in sleep stage(C) cumulative time and (D) bout durations (mean time in sleep stage divided by boutnumber) following treatment of rats with varenicline (closed bars) and cytisine (open bars)for active phase (from time of dosing to ZT 00:30) and inactive phase (ZT 00:30-2:30).Sleep stages are indicated as follows: active wake (AW), light sleep (LS), slow wave sleep(SWS), and REM sleep (REM). Plotted values represent percent difference from vehiclewithin independent experiments for each dose, and calculated from raw sleep stage time andbout data. Plotted values are mean ±SEM (• p ≤.05, •• p ≤.01, ••• p ≤.001; two-tailedpopulation t test). Each study run as a balanced crossover design, with 7 sequential days ofdosing for varenicline treatment (n=8 animals, 56 nights/condition total, 1 mg/kg, p.o.,dosed ZT 23:30) and for cytisine treatment (n=8 animals, 56 nights/condition total, 1.5 mg/kg, i.p., dosed ZT 23:00).
Brunner et al. Page 17
J Neurogenet. Author manuscript; available in PMC 2013 February 11.
NIH
-PA Author Manuscript
NIH
-PA Author Manuscript
NIH
-PA Author Manuscript
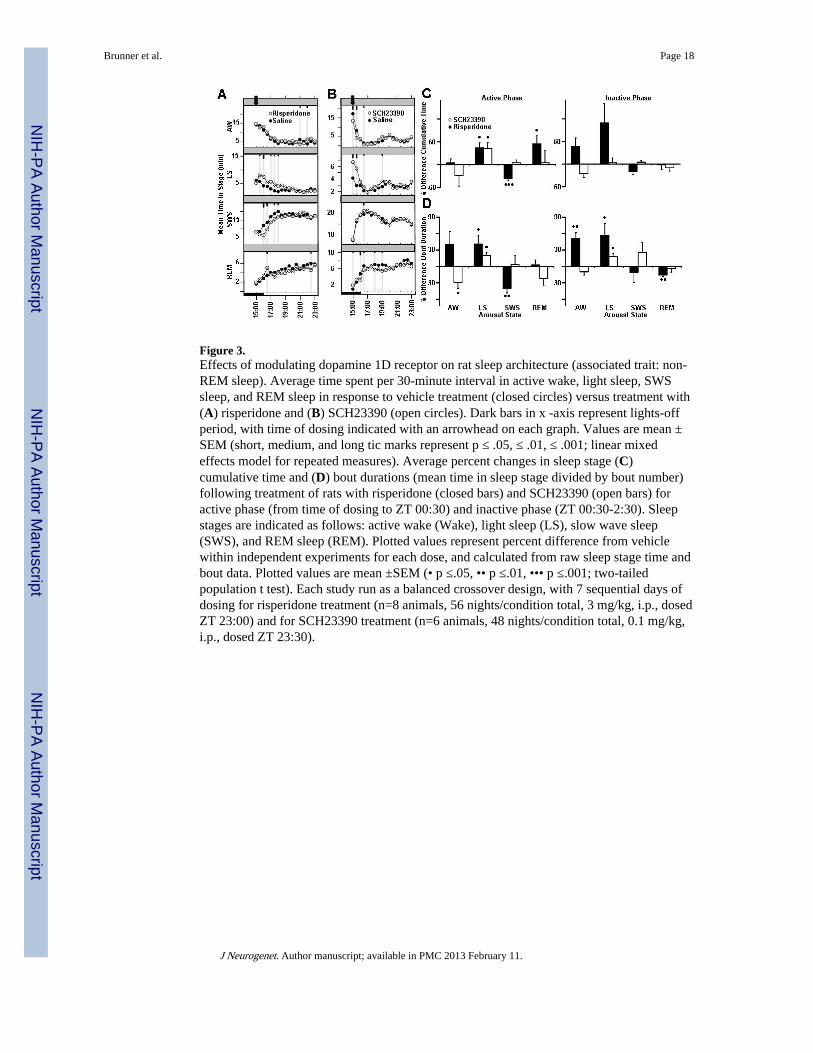
Figure 3.Effects of modulating dopamine 1D receptor on rat sleep architecture (associated trait: non-REM sleep). Average time spent per 30-minute interval in active wake, light sleep, SWSsleep, and REM sleep in response to vehicle treatment (closed circles) versus treatment with(A) risperidone and (B) SCH23390 (open circles). Dark bars in x -axis represent lights-offperiod, with time of dosing indicated with an arrowhead on each graph. Values are mean ±SEM (short, medium, and long tic marks represent p ≤ .05, ≤ .01, ≤ .001; linear mixedeffects model for repeated measures). Average percent changes in sleep stage (C)cumulative time and (D) bout durations (mean time in sleep stage divided by bout number)following treatment of rats with risperidone (closed bars) and SCH23390 (open bars) foractive phase (from time of dosing to ZT 00:30) and inactive phase (ZT 00:30-2:30). Sleepstages are indicated as follows: active wake (Wake), light sleep (LS), slow wave sleep(SWS), and REM sleep (REM). Plotted values represent percent difference from vehiclewithin independent experiments for each dose, and calculated from raw sleep stage time andbout data. Plotted values are mean ±SEM (• p ≤.05, •• p ≤.01, ••• p ≤.001; two-tailedpopulation t test). Each study run as a balanced crossover design, with 7 sequential days ofdosing for risperidone treatment (n=8 animals, 56 nights/condition total, 3 mg/kg, i.p., dosedZT 23:00) and for SCH23390 treatment (n=6 animals, 48 nights/condition total, 0.1 mg/kg,i.p., dosed ZT 23:30).
Brunner et al. Page 18
J Neurogenet. Author manuscript; available in PMC 2013 February 11.
NIH
-PA Author Manuscript
NIH
-PA Author Manuscript
NIH
-PA Author Manuscript
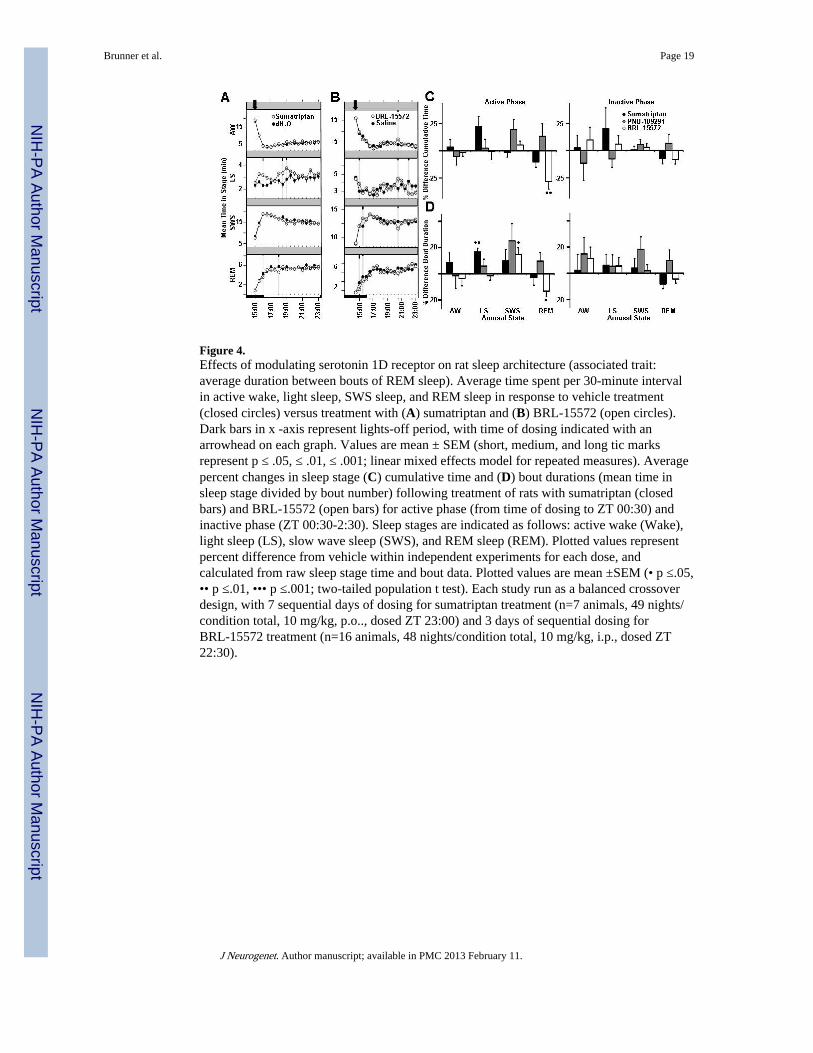
Figure 4.Effects of modulating serotonin 1D receptor on rat sleep architecture (associated trait:average duration between bouts of REM sleep). Average time spent per 30-minute intervalin active wake, light sleep, SWS sleep, and REM sleep in response to vehicle treatment(closed circles) versus treatment with (A) sumatriptan and (B) BRL-15572 (open circles).Dark bars in x -axis represent lights-off period, with time of dosing indicated with anarrowhead on each graph. Values are mean ± SEM (short, medium, and long tic marksrepresent p ≤ .05, ≤ .01, ≤ .001; linear mixed effects model for repeated measures). Averagepercent changes in sleep stage (C) cumulative time and (D) bout durations (mean time insleep stage divided by bout number) following treatment of rats with sumatriptan (closedbars) and BRL-15572 (open bars) for active phase (from time of dosing to ZT 00:30) andinactive phase (ZT 00:30-2:30). Sleep stages are indicated as follows: active wake (Wake),light sleep (LS), slow wave sleep (SWS), and REM sleep (REM). Plotted values representpercent difference from vehicle within independent experiments for each dose, andcalculated from raw sleep stage time and bout data. Plotted values are mean ±SEM (• p ≤.05,•• p ≤.01, ••• p ≤.001; two-tailed population t test). Each study run as a balanced crossoverdesign, with 7 sequential days of dosing for sumatriptan treatment (n=7 animals, 49 nights/condition total, 10 mg/kg, p.o.., dosed ZT 23:00) and 3 days of sequential dosing forBRL-15572 treatment (n=16 animals, 48 nights/condition total, 10 mg/kg, i.p., dosed ZT22:30).
Brunner et al. Page 19
J Neurogenet. Author manuscript; available in PMC 2013 February 11.
NIH
-PA Author Manuscript
NIH
-PA Author Manuscript
NIH
-PA Author Manuscript
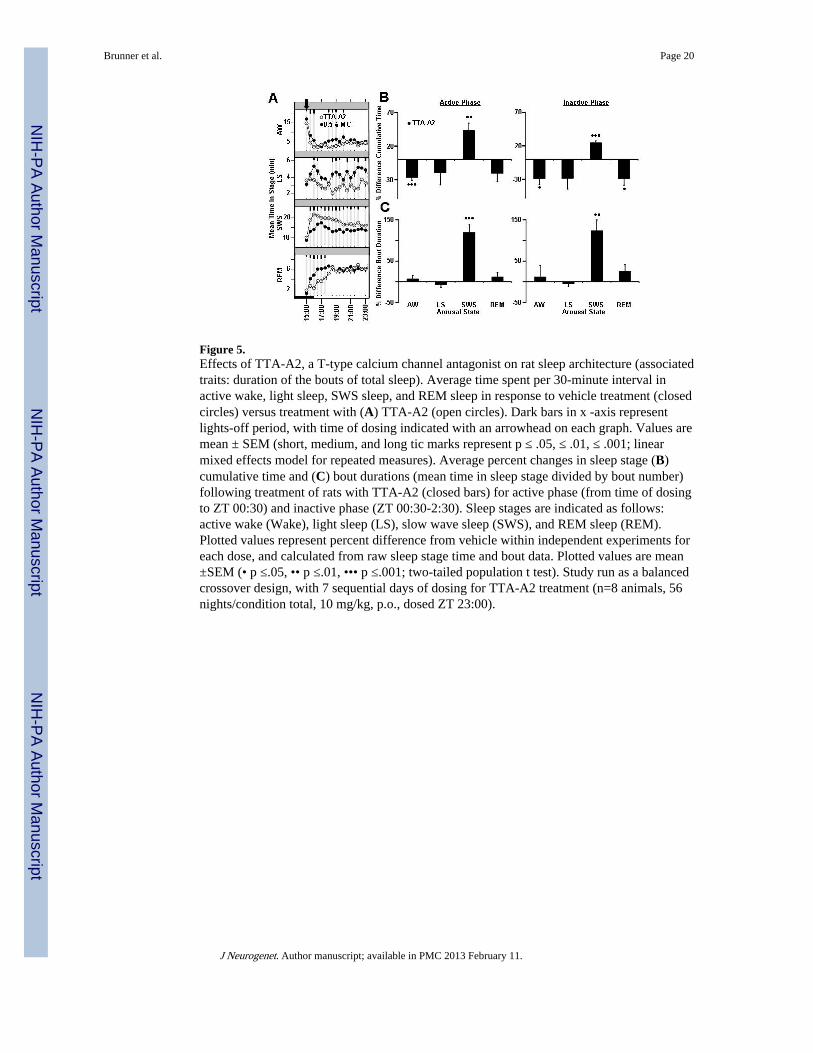
Figure 5.Effects of TTA-A2, a T-type calcium channel antagonist on rat sleep architecture (associatedtraits: duration of the bouts of total sleep). Average time spent per 30-minute interval inactive wake, light sleep, SWS sleep, and REM sleep in response to vehicle treatment (closedcircles) versus treatment with (A) TTA-A2 (open circles). Dark bars in x -axis representlights-off period, with time of dosing indicated with an arrowhead on each graph. Values aremean ± SEM (short, medium, and long tic marks represent p ≤ .05, ≤ .01, ≤ .001; linearmixed effects model for repeated measures). Average percent changes in sleep stage (B)cumulative time and (C) bout durations (mean time in sleep stage divided by bout number)following treatment of rats with TTA-A2 (closed bars) for active phase (from time of dosingto ZT 00:30) and inactive phase (ZT 00:30-2:30). Sleep stages are indicated as follows:active wake (Wake), light sleep (LS), slow wave sleep (SWS), and REM sleep (REM).Plotted values represent percent difference from vehicle within independent experiments foreach dose, and calculated from raw sleep stage time and bout data. Plotted values are mean±SEM (• p ≤.05, •• p ≤.01, ••• p ≤.001; two-tailed population t test). Study run as a balancedcrossover design, with 7 sequential days of dosing for TTA-A2 treatment (n=8 animals, 56nights/condition total, 10 mg/kg, p.o., dosed ZT 23:00).
Brunner et al. Page 20
J Neurogenet. Author manuscript; available in PMC 2013 February 11.
NIH
-PA Author Manuscript
NIH
-PA Author Manuscript
NIH
-PA Author Manuscript
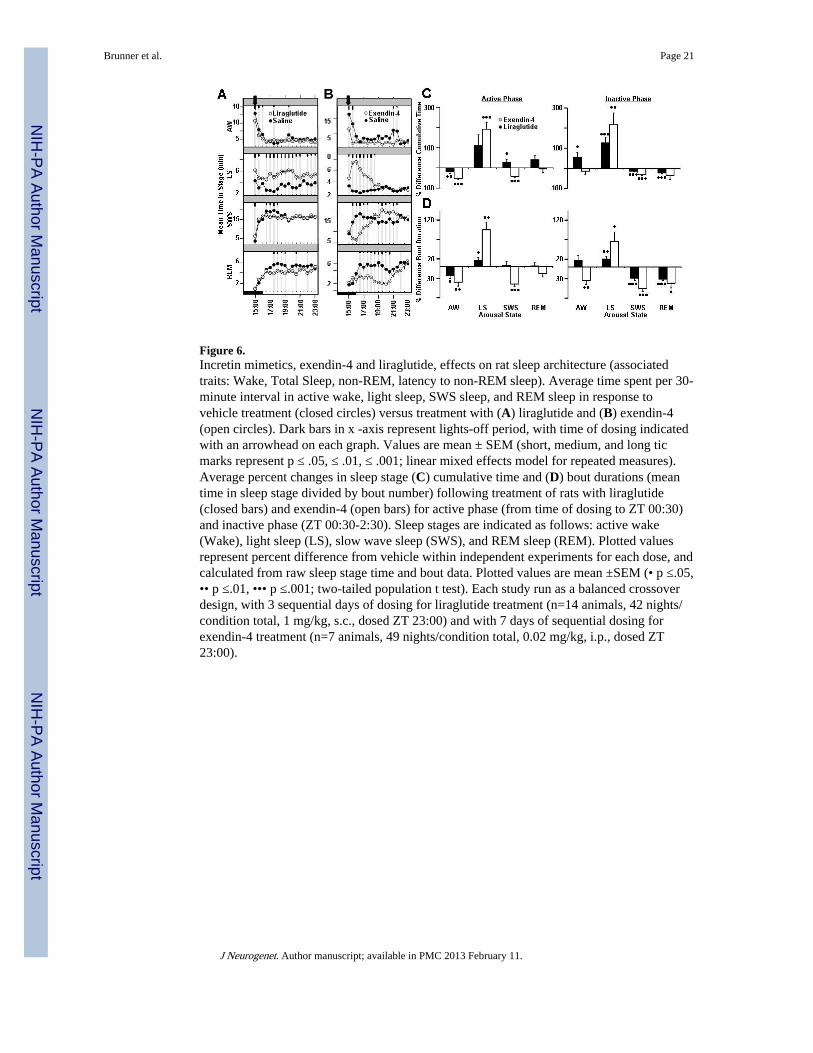
Figure 6.Incretin mimetics, exendin-4 and liraglutide, effects on rat sleep architecture (associatedtraits: Wake, Total Sleep, non-REM, latency to non-REM sleep). Average time spent per 30-minute interval in active wake, light sleep, SWS sleep, and REM sleep in response tovehicle treatment (closed circles) versus treatment with (A) liraglutide and (B) exendin-4(open circles). Dark bars in x -axis represent lights-off period, with time of dosing indicatedwith an arrowhead on each graph. Values are mean ± SEM (short, medium, and long ticmarks represent p ≤ .05, ≤ .01, ≤ .001; linear mixed effects model for repeated measures).Average percent changes in sleep stage (C) cumulative time and (D) bout durations (meantime in sleep stage divided by bout number) following treatment of rats with liraglutide(closed bars) and exendin-4 (open bars) for active phase (from time of dosing to ZT 00:30)and inactive phase (ZT 00:30-2:30). Sleep stages are indicated as follows: active wake(Wake), light sleep (LS), slow wave sleep (SWS), and REM sleep (REM). Plotted valuesrepresent percent difference from vehicle within independent experiments for each dose, andcalculated from raw sleep stage time and bout data. Plotted values are mean ±SEM (• p ≤.05,•• p ≤.01, ••• p ≤.001; two-tailed population t test). Each study run as a balanced crossoverdesign, with 3 sequential days of dosing for liraglutide treatment (n=14 animals, 42 nights/condition total, 1 mg/kg, s.c., dosed ZT 23:00) and with 7 days of sequential dosing forexendin-4 treatment (n=7 animals, 49 nights/condition total, 0.02 mg/kg, i.p., dosed ZT23:00).
Brunner et al. Page 21
J Neurogenet. Author manuscript; available in PMC 2013 February 11.
NIH
-PA Author Manuscript
NIH
-PA Author Manuscript
NIH
-PA Author Manuscript
NIH
-PA Author Manuscript
NIH
-PA Author Manuscript
NIH
-PA Author Manuscript
Brunner et al. Page 22
Table 1
Candidate Causal Genes and identified small molecule reagents
Causal Gene Reagent
Symbol Name Name Description
Chrm3 cholinergic receptor, muscarinic 3 Scopolamine Nonselective antagonist
Darifenacin CHRM3 selective antagonist
Chrna4 cholinergic receptor, nicotinic, alpha 4 Varenicline Partial Agonist
Cytisine Partial Agonist
Drd5 dopamine receptor D5 SCH23390 High Affinity D1-like antagonist
Risperidone High Affinity D2-like antagonist
Htr1d 5-hydroxytryptamine receptor 1D Sumatriptan HTR1 specific antagonist
PNU-109291 HTR1D specific agonist
BRL-15572 HTR1D specific antagonist
Cacna1i Calcium channel, voltage dependent, T-type, alpha1i subunit TTA-A2 Selective T-type antagonist
Glp1r glucagon-like peptide 1 receptor Exendin-4 Potent GLP1R agonist
Liraglutide Potent GLP1R agonist
J Neurogenet. Author manuscript; available in PMC 2013 February 11.
NIH
-PA Author Manuscript
NIH
-PA Author Manuscript
NIH
-PA Author Manuscript
Brunner et al. Page 23
Table 2
Description of causal trios - trait QTL, the gene expression feature measured in the respective tissue, and sleeptrait
Genea Chromosome Tissue GenePosition (cM)
eQTLLOD Associated Traits Trait
Position (cM)cQTLLOD
Chrm3 1 Frontal Corte 69 4.59 non-REM Sleep 76.96 3.86
Total Sleep 76.96 3.77
Wake 62.69 3.64
Chrna4 1 Frontal Corte 63.68 12.83 non-REM Sleep 76.96 3.86
Total Sleep 76.96 3.77
Wake 62.69 3.64
Hypothalamus 68 4.14 Total Sleep 76.96 3.77
Wake 62.69 3.64
Drd5 13 Thalamus 3.28 3.47 non-REM Sleep 0.41 3.50
Htr1d 4 Thalamus 57.53 12.71 duration boutsbetween REM Sleep 44.39 3.42
Cacna1i 1 Hypothalamus 63 3.03 Duration boutsTotal Sleep 76.96 3.62
Glp1r 1 Liver 76 3.07 Latency to non-REM sleep 76.96 6.58
non-REM sleep 76.96 3.86
Total Sleep 76.96 3.77
Wake 62.23 3.64
aIdentified candidate genes that govern sleep, according to tissue, where eQTL and cQTL regions overlapped, defined as a peak to peak distance no
greater than 15 cM and LOD greater than 3.
J Neurogenet. Author manuscript; available in PMC 2013 February 11.
NIH
-PA Author Manuscript
NIH
-PA Author Manuscript
NIH
-PA Author Manuscript
Brunner et al. Page 24
Table 3
Percent Difference Cumulative Sleep time relative to vehicle baseline per Sleep Phase for each InvestigatedReagent
% Difference Cumulative Time*
Causal GeneSymbol
ReagentbName
Active Phase Inactive Phase
AW LS SWS REM AW LS SWS REM
Chrm3 Scopolamine 10.26 ± 6.62 −12.41 ± 14.38 −8.05 ± 3.79 9.70 ± 12.42 114.43 ± 49.65 15.02 ± 38.24 −9.88 ± 10.25 −54.49 ± 9.13***
Darifenacin 13.92 ± 7.46 40.18 ± 21.56 −17.37 ± 13.70 −11.34 ± 13.71 159.85 ± 62.63* 58.85 ± 27.41 −10.67 ± 5.05 −35.76 ± 6.04
***
Chrna4 Varenicline 42.12 ± 18.77 55.43 ± 22.80*
−27.12 ± 9.18* −10.44 ± 14.07 26.26 ± 21.66 51.00 ± 21.27
* −4.21 ± 4.98 −0.64 ± 7.75
Cytisine 22.35 ± 11.65 36.49 ± 20.28 −28.02 ± 8.27*
−39.60 ± 7.69** 34.04 ± 24.00 −9.33 ± 7.45 −3.29 ± 5.67 −5.31 ± 5.71
Drd5 SCH23390 −29.77 ± 27.02 42.33 ± 15.58* 4.77 ± 6.99 4.69 ± 32.77 −24.24 ±10.95 4.76 ± 11.30 5.11 ± 3.38 −9.90 ± 8.58
Risperidone 4.42 ± 10.22 44.04 ± 13.25*
−36.76 ± 6.08***
54.51 ± 23.00* 46.91 ± 22.28 109.49 ± 50.71 −19.29 ± 8.95 −1.96 ± 11.97
Htr1d Sumatriptan 3.49 ± 6.91 22.21 ± 9.48 −1.47 ± 4.36 −10.23 ± 4.86 2.51 ± 11.63 20.09 ± 19.04 0.60 ± 3.36 −7.46 ± 4.68
PNU-109291 −5.44 ± 7.69 2.58 ± 7.98 19.29 ± 9.55 13.50 ± 11.44 −11.54 ± 15.91 −7.58 ± 7.80 5.51 ± 4.52 6.58 ± 8.42
BRL-15572 −1.60 ± 3.44 −0.80 ± 7.50 5.32 ± 3.62 −28.45 ± 7.05** 9.82 ± 11.62 5.92 ± 7.80 3.05 ± 3.35 −8.42 ± 3.88
Cacna1i TTA-A2 −26.63 ± 4.27*** −19.36 ± 18.39 42.44 ± 11.68
** −20.17 ± 12.81 −28.88 ± 8.98* −28.26 ± 16.15 24.26 ± 3.10
***−28.80 ± 9.90
*
Glp1r Exendin-4 −52.88 ± 6.31***
191.16 ± 34.13***
−41.65 ± 4.55*** −4.35 ± 18.98 −13.44 ± 15.34 217.57 ± 57.28
**−31.25 ±4.81 *** −35.02 ± 19.42
Liraglutide −20.00 ± 6.25** 110.87 ± 53.76 28.64 ± 12.73
* 40.67 ± 20.18 55.30 ± 23.05*
126.96 ± 25.87***
−13.65 ±2.99 ***
−22.02 ± 4.10***
aMean ± SEM percent difference relative to vehicle controls, paired t-test,
*Pvalue < 0.05,
**0.01,
***0,001.
bDoses used: Scopolamine (0.3MPK, i.p.), Darifenacin (50MPK, p.o.), Varenicline (1MPK, p.o.), Cytisine (1.5MPK, i.p.), SCH23390 (0.1MPK,
i.p.), Risperidone (3MPK, i.p.), Sumatriptan (10MPK, p.o.), PNU-109291 (15MPK, s.c.), BRL-15572 (10MPK, i.p.), TTA-A2 (10MPK, p.o.),Exendin-4 (0.02MPK, i.p.), Liraglutide (1MPK, s.c.).
J Neurogenet. Author manuscript; available in PMC 2013 February 11.

NIH
-PA Author Manuscript
NIH
-PA Author Manuscript
NIH
-PA Author Manuscript
Brunner et al. Page 25
Table 4
Percent Difference Bout duration relative to vehicle baseline per Sleep Phase for each Investigated Reagent
% Difference Bout Durationa
Causal GeneSymbol
ReagentbName
Active Phase Inactive Phase
AW LS SWS REM AW LS SWS REM
Chrm3 Scopolamine−12.83 ±
4.60 *0.57 ± 2.51
−26.19 ±5.05 ** −10.53 ± 6.17 1.25 ± 17.51 15.83 ± 12.06
−27.47 ±10.73 *
−49.93 ±5.09 ***
Darifenacin 29.92 ± 17.85 15.02 ± 10.30 −9.34 ± 9.36 −16.61 ± 4.64** 59.19 ± 28.37 27.61 ± 15.89 −7.20 ± 6.37
−26.90 ±5.26 ***
Chrna4 Varenicline 26.14 ± 15.69 6.56 ± 5.77−37.56 ±6.36 ***
−24.24 ± 5.02** −7.43 ± 12.33 2.60 ± 7.42 −26.99 ± 4.33
***−17.85 ±2.59 ***
Cytisine 3.67 ± 9.62 14.47 ± 9.96 −17.06 ± 8.62 −18.49 ± 3.55** 10.81 ± 16.46 0.35 ± 5.72 −3.87 ± 5.50 −2.50 ± 4.22
Drd5 SCH23390−29.87 ±10.81 *
20.18 ± 5.82* 3.79 ± 16.23 −22.11 ± 12.15 −9.96 ± 5.81 18.65 ± 5.57
* 25.67 ± 18.45 −3.81 ± 6.56
Risperidone 40.49 ± 23.5340.62 ±15.60 *
−40.00 ±8.50 ** 2.56 ± 9.15 51.31 ± 10.57
**56.83 ±21.38 *
−11.33 ± 18.35−15.76 ±3.19 **
Htr1d Sumatriptan 8.39 ± 7.40 16.52 ± 2.93** 9.91 ± 8.59 −3.00 ± 5.67 2.13 ± 12.22 6.07 ± 8.10 3.86 ± 7.29 −8.11 ± 3.59
PNU-109291 −1.60 ± 9.68 5.79 ± 5.20 25.13 ± 13.05 9.58 ± 6.70 14.73 ± 12.56 5.23 ± 8.75 18.17 ± 9.67 9.57 ± 8.15
BRL-15572 −3.68 ± 5.49 −1.51 ± 3.55 14.59 ± 5.19*
−13.28 ± 4.47* 11.32 ± 8.63 5.43 ± 6.52 1.93 ± 4.66 −4.40 ± 3.12
Cacna1i TTA-A2 6.59 ± 8.82 −5.79 ± 7.18119.14 ±20.72 *** 11.73 ± 11.33 11.60 ± 27.54 −3.55 ± 8.49 123.17 ± 26.33
** 24.67 ± 16.47
Glp1r Exendin-4−52.88 ±6.31 **
94.97 ±17.96 **
−44.70 ±5.87 *** −17.67 ± 8.51
−34.97 ±9.68 **
65.39 ±24.39 *
−55.34 ± 7.17***
−41.87 ±11.73 *
Liraglutide−22.15 ±
8.56 *16.42 ± 7.12
* 2.38 ± 10.39 1.50 ± 9.57 16.59 ±12.60 20.16 ± 6.15**
−28.70 ± 5.99***
−30.55 ±4.28 ***
aMean ± SEM percent difference relative to vehicle controls, paired t-test,
*Pvalue < * 0.05,
**0.01,
***0,001.
bDoses used: Scopolamine (0.3MPK, i.p.), Darifenacin (50MPK, p.o.), Varenicline (1MPK, p.o.), Cytisine (1.5MPK, i.p.), SCH23390 (0.1MPK,
i.p.), Risperidone (3MPK, i.p.), Sumatriptan (10MPK, p.o.), PNU-109291 (15MPK, s.c.), BRL-15572 (10MPK, i.p.), TTA-A2 (10MPK, p.o.),Exendin-4 (0.02MPK, i.p.), Liraglutide (1MPK, s.c.).
J Neurogenet. Author manuscript; available in PMC 2013 February 11.