
Petrophysics of the B-Reservoir in Eyram Field, Onshore Niger Delta
24
____________________________________________________________________________________________ *Corresponding author: E-mail: [email protected]; British Journal of Applied Science & Technology 3(4): 1481-1504, 2013 SCIENCEDOMAIN international www.sciencedomain.org Petrophysics of the B-Reservoir in Eyram Field, Onshore Niger Delta G. E. Omolaiye 1* and O. A. Sanuade 2 1 Orion Energy Services Limited, Plot 14 Dapo Sholanke Close, Off Emeka Nweze Strret, Lekki Phase one, Victoria Island, Lagos, Nigeria. 2 Professionals Experts and Energy Company Limited, 45 Agodogba Avenue, Parkview, Estate, Lagos, Nigeria. Authors’ contributions This work was carried out in collaboration between all authors. All authors read and approved the final manuscript Received 21 st June 2013 Accepted 7 th September 2013 Published 27 th September 2013 ABSTRACT Evaluation of Eyram field reservoir has been undertaken in this work for determination and distribution of petrophysical properties, fluid type and hydrocarbon contact within B- Horizon using log data. Eyram field is located in onshore area of the Niger Delta and it essentially contains oil and gas producing reservoirs. The field consists of the reservoirs of the Agbada Formation, Niger Delta, a succession of alternating deltaic sands and shale layers. Well log data from 21 wells of the field were studied to characterize the porosity, permeability and water saturation of the B-reservoir. The logs were environmentally corrected and normalized, volume of shale, permeability and porosities were calculated, water saturation were determined by Archie’s equation and dual water model, and net pay was calculated. Within the B-reservoir of the Eyram field, the average well has 103.94ft of net sandstone, having average porosity of 26%. Shale volume ranges from 2% to 31% with an average of 21%.The average permeability is 399mD, average water saturation is 48% while average hydrocarbon saturation is 52%. Porosity and permeability in the field is high on the average due to very good to excellent sand quality. Keywords: Petrophysical properties; B-reservoir; eyram field; Niger delta; Archie’s equation; porosity; permeability. Research Article
Transcript of Petrophysics of the B-Reservoir in Eyram Field, Onshore Niger Delta

____________________________________________________________________________________________
*Corresponding author: E-mail: [email protected];
British Journal of Applied Science & Technology3(4): 1481-1504, 2013
SCIENCEDOMAIN internationalwww.sciencedomain.org
Petrophysics of the B-Reservoir in Eyram Field,Onshore Niger Delta
G. E. Omolaiye1* and O. A. Sanuade2
1Orion Energy Services Limited, Plot 14 Dapo Sholanke Close, Off Emeka Nweze Strret,Lekki Phase one, Victoria Island, Lagos, Nigeria.
2Professionals Experts and Energy Company Limited, 45 Agodogba Avenue, Parkview,Estate, Lagos, Nigeria.
Authors’ contributions
This work was carried out in collaboration between all authors. All authors read andapproved the final manuscript
Received 21st June 2013Accepted 7th September 2013
Published 27th September 2013
ABSTRACT
Evaluation of Eyram field reservoir has been undertaken in this work for determinationand distribution of petrophysical properties, fluid type and hydrocarbon contact within B-Horizon using log data. Eyram field is located in onshore area of the Niger Delta and itessentially contains oil and gas producing reservoirs. The field consists of the reservoirsof the Agbada Formation, Niger Delta, a succession of alternating deltaic sands and shalelayers. Well log data from 21 wells of the field were studied to characterize the porosity,permeability and water saturation of the B-reservoir. The logs were environmentallycorrected and normalized, volume of shale, permeability and porosities were calculated,water saturation were determined by Archie’s equation and dual water model, and netpay was calculated. Within the B-reservoir of the Eyram field, the average well has103.94ft of net sandstone, having average porosity of 26%. Shale volume ranges from2% to 31% with an average of 21%.The average permeability is 399mD, average watersaturation is 48% while average hydrocarbon saturation is 52%. Porosity and permeabilityin the field is high on the average due to very good to excellent sand quality.
Keywords: Petrophysical properties; B-reservoir; eyram field; Niger delta; Archie’s equation;porosity; permeability.
Research Article

British Journal of Applied Science & Technology, 3(4): 1481-1504, 2013
1482
ABBREVIATIONS
‘a’ is Tortuosity factor; BVW is bulk volume water taken as fraction; F is formation factor; Kis permeability in millidarcy (mD) (Timur, 1968); KT is permeability in millidarcy (mD) (Tixier,1949); KCD is permeability in millidarcy (mD) (Coates and Dumanoir, 1973, 1974); NET isnet reservoir thickness after removing shale thicknesses in or feet; NTG is net to grossreservoir thick taken as a ratio; Pay is pay column thickness in meters or feet; PHIA is thetotal porosity measured in percentage or fraction; PHIE is effective porosity measured in
percentage or fraction; is porosity given in percentage or fraction; e is the effective
porosity given in percentage or fraction; h is hydrocarbon density (g/cm3); o is
formation fluid density (g/cm3); w is formation water density (g/cm3); oR is the formation
rock matrix resistivity; tiR is correction factor for oil density ; wR is formation water
resistivity; tR is true resistivity of un-invaded zone; Sh is hydrocarbon saturation; SwT istotal water saturation measured in percentage or fraction; Vsh is shale volume in thereservoirs, taken as fraction or percentage; ODT is Oil Down Tool; GDT is Gas Down Tool;OWC is Oil Water Contact; HC is hydrocarbon.
1. INTRODUCTION
Eyram is located in onshore area of the Niger Delta. The field consists of the reservoirs ofthe Agbada Formation, Niger Delta, a succession of alternating deltaic sands and shalelayers. Three major lithostratigraphic units have been recognized in the Niger Delta [1,2,3,4].These are the Akata, Agbada and Benin Formations. These Formations were deposited inthe continental transitional and marine environments, and together they form a thick, overallprogradational passive margin wedge.
The evaluation of reservoir rocks in terms of their porosity, water saturation and permeabilitydeterminations, enhances the ability to predict abnormally pressured zones, to estimatehydrocarbon reserves and reservoir bed thickness, and to distinguish between gas, oil andwater bearing strata, by observing their electrical resistivity and relative permeability values[5,6,7].
The aim of this paper is to compute various petrophysical parameters, with sometechniques, in B-reservoir of Eyram field with information from 21 wells. These techniquesinclude using well log data and combining various mathematical equations which rangesfrom the linear, non-linear (Vsh Stieber) and the Archie’s equations.
1.1 Objectives of Petrophysical Evaluation
The objectives of the petrophysical evaluation include:
Determination of the distribution of petrophysical properties within B-reservoir inEyram Field
Determination of fluid type and hydrocarbon contact from logs, where possible; and Determination of net gas, oil and net reservoir intervals.
British Journal of Applied Science & Technology, 3(4): 1481-1504, 2013
1483
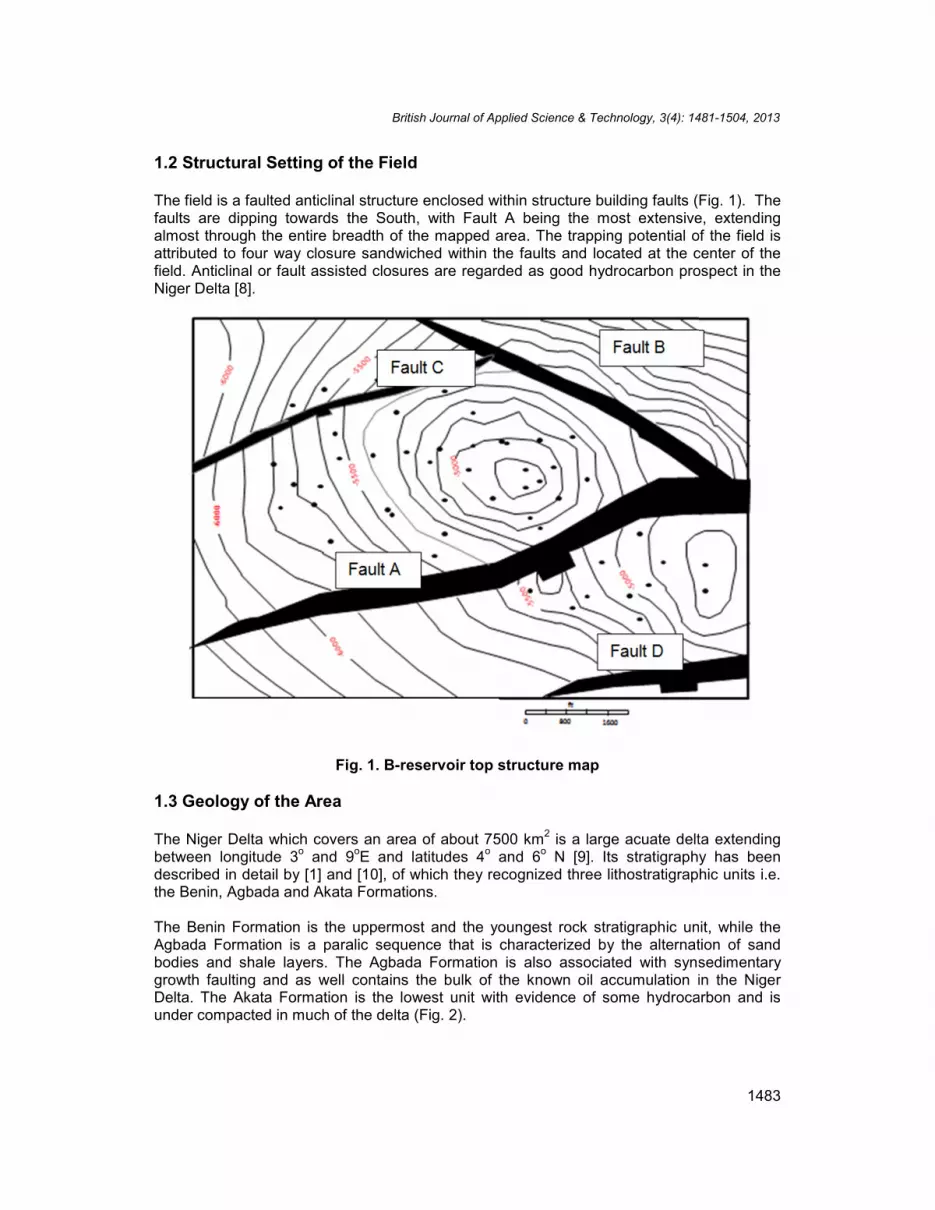
1.2 Structural Setting of the Field
The field is a faulted anticlinal structure enclosed within structure building faults (Fig. 1). Thefaults are dipping towards the South, with Fault A being the most extensive, extendingalmost through the entire breadth of the mapped area. The trapping potential of the field isattributed to four way closure sandwiched within the faults and located at the center of thefield. Anticlinal or fault assisted closures are regarded as good hydrocarbon prospect in theNiger Delta [8].
Fig. 1. B-reservoir top structure map
1.3 Geology of the Area
The Niger Delta which covers an area of about 7500 km2 is a large acuate delta extendingbetween longitude 3o and 9oE and latitudes 4o and 6o N [9]. Its stratigraphy has beendescribed in detail by [1] and [10], of which they recognized three lithostratigraphic units i.e.the Benin, Agbada and Akata Formations.
The Benin Formation is the uppermost and the youngest rock stratigraphic unit, while theAgbada Formation is a paralic sequence that is characterized by the alternation of sandbodies and shale layers. The Agbada Formation is also associated with synsedimentarygrowth faulting and as well contains the bulk of the known oil accumulation in the NigerDelta. The Akata Formation is the lowest unit with evidence of some hydrocarbon and isunder compacted in much of the delta (Fig. 2).
British Journal of Applied Science & Technology, 3(4): 1481-1504, 2013
1483
1.2 Structural Setting of the Field
The field is a faulted anticlinal structure enclosed within structure building faults (Fig. 1). Thefaults are dipping towards the South, with Fault A being the most extensive, extendingalmost through the entire breadth of the mapped area. The trapping potential of the field isattributed to four way closure sandwiched within the faults and located at the center of thefield. Anticlinal or fault assisted closures are regarded as good hydrocarbon prospect in theNiger Delta [8].
Fig. 1. B-reservoir top structure map
1.3 Geology of the Area
The Niger Delta which covers an area of about 7500 km2 is a large acuate delta extendingbetween longitude 3o and 9oE and latitudes 4o and 6o N [9]. Its stratigraphy has beendescribed in detail by [1] and [10], of which they recognized three lithostratigraphic units i.e.the Benin, Agbada and Akata Formations.
The Benin Formation is the uppermost and the youngest rock stratigraphic unit, while theAgbada Formation is a paralic sequence that is characterized by the alternation of sandbodies and shale layers. The Agbada Formation is also associated with synsedimentarygrowth faulting and as well contains the bulk of the known oil accumulation in the NigerDelta. The Akata Formation is the lowest unit with evidence of some hydrocarbon and isunder compacted in much of the delta (Fig. 2).

British Journal of Applied Science & Technology, 3(4): 1481-1504, 2013
1484
The growth faults in the Niger Delta according to [11] are considered to be the majormigration conduit and leading factor controlling the hydrocarbon distribution pattern in theNiger Delta.
Fig. 2. Lithofacies of Niger Delta Basin [12]
2. METHODS
2.1 Data Sources
A comprehensive suite of logs acquired in the wells were examined and the relevant curveswere integrated (Fig. 3). A reservoir called 'B-reservoir' was discussed in this study.
The basic analysis procedure used involves the following steps, each of which is describedin the following sections:
Loaded and validated log data
QC and depth matched logs
Environmental corrections and
Formation evaluation

British Journal of Applied Science & Technology, 3(4): 1481-1504, 2013
1485
Fig. 3. Lithologic correlation of some wells in Eyram field
2.2 Environmental Corrections and Log Normalization
Most petrophysical field studies begin by normalizing the log data to minimize differencescaused by random logging errors and other noise in the data set. This noise results from avariety of causes. Logging tools built by different vendors can have different responses toidentical formation conditions [13].
The environmental corrections applied to this data included (1) borehole size and mudweight correction to the gamma-ray logs; and (2) matrix corrections to the neutron porosity.Gamma-ray logs were offset to match a consistent clean sandstone line, and a gaincorrection was applied to match the sandstone-to-shale span of the composite histogram inthe same wells used for the porosity normalization (Fig. 4). The form of the equation usedwas:
where GR is the environmentally corrected log value at each depth, GRcl_T is the targetclean sandstone value from the type histogram (45 API units), GRsh_T is the target shalevalue from the type histogram (110 API units), GRsd is the observed sandstone reading onthe subject well histogram, and GRsh is the observed shale on the subject well histogram.

British Journal of Applied Science & Technology, 3(4): 1481-1504, 2013
1486
Fig. 4. Type histogram for gamma ray (GR) log normalization
Neutron-porosity and bulk-density logs were normalized to match a suite of ‘‘type’’ logs.Composite histograms for each measurement were constructed from the data over the top ofreservoirs in these wells (Figs. 5 and 6).
Fig. 5. Type histogram for neutron-porosity (PHIA) log normalization

British Journal of Applied Science & Technology, 3(4): 1481-1504, 2013
1487
Fig. 6. Type histogram for bulk-density (RHOB) log normalization
2.3 Log Evaluation
The petrophysical evaluation of all the twenty one wells was performed and are statedbelow:
2.3.1 Shale volume, total porosity and effective porosity
Shale volume (Vsh) was computed from the gamma ray curve. Gamma ray log values werefirst applied to calculate Gamma Ray Index (IGR), a very essential step. This is because IGR isindependent of clay types. The IGR was determined as follows:
miinGR GRGR
GRGRI
max
minlog
[2]
Where GRI is the gamma ray index, logGR is the actual gamma value for the formation at a
given depth, minGR is the minimum gamma ray or cleanest sand reading and maxGR is themaximum gamma ray or shaliest reading. [14] equation was used to calculate shale volume.This equation is given as:
GR
GRsh I
IV
2.3 [3]
where shV is the shale volume and GRI is the gamma ray index.

British Journal of Applied Science & Technology, 3(4): 1481-1504, 2013
1488
‘‘Total porosity’’ is the total pore volume of the rock and includes porosity filled withhydrocarbons, moveable water, capillary-bound water, and clay-bound water [15].
Both the density and neutron logs are considered total porosity tools, because they detect allthe porosity in a region surrounding the logging tool, although they have different volumes ofinvestigation and are responding to different physical phenomena that are indirectly relatedto porosity (electron density in the case of the bulk-density log and hydrogen density in thecase of the neutron log). In shaly formations, they read very different values; in particular,the neutron log is strongly affected by hydrogen associated with clay-bound water and readsa much higher apparent porosity than the density log. ‘‘Effective porosity’’ is normallyconsidered that part of the total porosity that is available for hydrocarbon storage and is alsophysically interconnected so that fluids can actually move between the pores. In vuggycarbonate rocks, for example, there may be isolated vugs that are part of the total porosity,but which have no pore throats that would allow fluids to move in or out of the vugs. Theseare not considered part of the effective pore system. In shaly sandstones, a significantportion of the porosity is occupied by clay bound water that is immobile under all conditionsand consequently is not part of the effective pore space. We use effective porosity for thefraction of the total porosity that is not associated with clay minerals, thus excluding thevolume of clay-bound water but including capillary-bound water on grain surfaces. By thisdefinition, the effective porosity of shale is zero, whereas a clean sandstone has an effectiveporosity equal to the total porosity. Because it is unlikely that there is much truly isolatedporosity in fine-grained clastic rocks, this definition of effective porosity is very close to thehydraulically connected pore volume.
The total porosity (PHIA) of reservoir intervals was calculated based on the equation below:
PHIA = (RhoM - RHOB) / (RhoM - RhoF) [4]
Where PHIA ( ) = Total Porosity,
RhoM = Matrices Density; RHOB = Log Density Interpreted, RhoF = Fluid Density.
In this work the value of RhoM was taken as 2.65 g/cm3, while RhoF is 1g/cm3 for water,0.8g/cm3 for oil and 0.6g/cm3 for gas.
Effective porosity was computed separately for each porosity tool from the matrix-correctedtotal porosity, Vsh, and average values for the total porosity of shale by equations of the form
PHIDE (Øe) = PHIA- (V
Shx PHIA
Sh) [5]
where PHIDE (Øe) is the effective porosity, PHIA is the total porosity from density log,
PHIASh is the total density porosity of shale and shV is the linear shale index from equation3.
2.3.2 Water saturation
Water saturations were computed using the dual water model [16] with a constant Rw andArchie’s water saturation equation [17]. In this study, the Rw was derived from Pickett Plots(Fig. 7) and found to be 0.244 ohm.m.

British Journal of Applied Science & Technology, 3(4): 1481-1504, 2013
1489
Fig. 7. B-Reservoir Pickett Plot of E-5 Well showing Rw Value
The Archie’s (1942) Method
The refined form of Archie’s (1942) equation is given as;
t
wnw R
RFS [6]
While the general form of the (Archie, 1942) equation is given thus;
n
mt
ww R
RaS
1
[7]
where wS is the connate water saturation, wR is the formation water resistivity, tR is the trueformation resistivity, m is the cementation factor and n is the saturation exponent, both wereassigned the value of 2 respectively in this work, ‘a’ is tortousity and taken as 1, while isthe log derived porosity.
The Dual Water Method
The content of clay in sand, such as, deltaic sand of the Niger Delta, makes the use of(Archie, 1942) equation associated with incorrect water saturation values. Therefore, DualWater Model (DWM), [18,19] was used for this study. A simplified dual-water-model equationis given as;

British Journal of Applied Science & Technology, 3(4): 1481-1504, 2013
1490
22 YRRYSwT
t
w
[8]
Where Y is given by;
ndw
wndwshl BR
RBRVY *2*[9]
Where SwT is the total water saturation, tR is the true or deep resistivity, ndB is the bond
water resistivity, taken as 15 ohms, wR is the formation water resistivity and Vsh is volume ofshale.
2.3.3 Permeability
Three empirical methods were used to calculate the field permeability for the purpose ofcomparison and reliability checks. The methods used were those of [20,21] and [22,23]. [21]worked on [24] permeability equation and gave an expression thus;
k = 0.136 2
4.4
wiS
, [10]
[20] further modified his equations to a simpler form, as given thus;
wiSk
321250 , 11]
where Swi is the irreducible water saturation.
[22] contributed to empirical permeability derivation with the equation;
k 21
=
ti
w
w
RRW
C 2
4
, [12]
where C is given as; C = 23 + 465 h - 188 2h , and [13]
W2 = (3.75 - ) +
2
10 2.2log0.21
ti
w
RR
, [14]
For shaly formation, they gave another equation;

British Journal of Applied Science & Technology, 3(4): 1481-1504, 2013
1491
ti
w
RR
= 11 w
sh
wcnwirr
cnwirrsh
shw
VS
SRVR
, [15]
In this work, the [22, 23] equations were reduced to a simplified form, thus;
k = 22 )/)1(**70( SwSwe [16]
2.3.4 Lithology determination
The lithology of the reservoirs was determined applying electrofacies analysis of the gammaray logs. The Sand/Shale ratio was used as shown in Table 1:
Table 1. Sand/Shale ratio for the determination of lithology
Shale volume (Vsh) LithologyVsh > = 0 and Vsh < 33% » SandVsh > = 34 and Vsh < 69% » Shaly SandVsh > = 70 and Vsh < 100% » Shale
2.3.5 Determination of hydrocarbon types
The hydrocarbon fluid type was defined from the neutron/density log signature as follows:
The neutron-density cross-over criteria (large Neutron-Density cross-over) were used todefine gas zones and gas reservoirs. The tracking of the neutron and density curves atintervals with high resistivity was used as general hydrocarbon criteria, attributed to oil in lowVsh interval.
2.3.6 Net pay determination
This conventional notion of net pay leads to the common use of three log- or core-basedpetrophysical cut-offs to separate pay from non-pay:
(1) Shaliness: A volume of shale cut-off, commonly a gamma-ray or spontaneouspotential cut-off, is used to separate potentially permeable clean formation frompresumably impermeable shaly formation.
(2) Porosity: A porosity cut-off is used as a proxy for a permeability or flow cut-off. Aporosity-permeability cross-plot can be used to define a porosity equivalent to aminimum permeability considered capable of flowing hydrocarbons at commercialrates. Alternatively, a comparison of production test or drillstem test flow rates on alarge number of zones can be used to determine the minimum porosity required fora commercial completion.
(3) Water saturation: A calculated water saturation cut-off is used to separate wetzones from oil-bearing or gas-bearing pay intervals. In high-porosity and highpermeability sandstones, the transition zone from water wet to hydrocarbonsaturation is commonly very thin, with a significant difference in water saturationbetween high water saturation wet zones and low water saturation pay zones. Thus,the actual water saturation cutoff may not be critical, as long as it is between theaverage wet saturation and the typical hydrocarbon saturation.

British Journal of Applied Science & Technology, 3(4): 1481-1504, 2013
1492
3. RESULTS AND DISCUSSION
3.1 Petrophysics of the Eyram Field
Because wells in Eyram field were drilled to different total depths and few wells penetrate theentire reservoirs, it is difficult to sum the petrophysical properties in a manner that allowsmeaningful well-to-well comparisons without the thickness of section drilled becoming asignificant variable.
Reservoir B was evaluated for the formation evaluation in this study.
3.2 Net Sandstone Thickness
A reservoir cut-off porosity value of 0.1, 0.7 cut-off for Vsh (Fig. 8) and 0.7 cutoff for SwTwere used, including the cross-plots for B-Reservoir encountered in E-1 well (Figs. 9 and10).
Fig. 8. Cross plot of E-1 WELL porosity (PHIA) versus shale volume (Vsh)

British Journal of Applied Science & Technology, 3(4): 1481-1504, 2013
1493
Fig. 9. A crossplot of RHOB vs PHIN(NPHI) for B-reservoir in E-1 well
Fig. 10. A crossplot of RHOB vs PHIN(NPHI) for B-reservoir in E-1 well, showing theSWS chart which plots in the sand facies.
British Journal of Applied Science & Technology, 3(4): 1481-1504, 2013
1493
Fig. 9. A crossplot of RHOB vs PHIN(NPHI) for B-reservoir in E-1 well
Fig. 10. A crossplot of RHOB vs PHIN(NPHI) for B-reservoir in E-1 well, showing theSWS chart which plots in the sand facies.
British Journal of Applied Science & Technology, 3(4): 1481-1504, 2013
1493
Fig. 9. A crossplot of RHOB vs PHIN(NPHI) for B-reservoir in E-1 well
Fig. 10. A crossplot of RHOB vs PHIN(NPHI) for B-reservoir in E-1 well, showing theSWS chart which plots in the sand facies.

British Journal of Applied Science & Technology, 3(4): 1481-1504, 2013
1494
The net thickness of sandstone in B-reservoir ranges from 11.74 to 142.46 ft with anaverage of 103.94 ft (Fig. 11). The net/gross ratio ranges from 83% to 99% and averagesabout 91% (Fig. 12). These values are high and are indication of good reservoir sanddevelopment. Figs. 13 and 14 show areal distribution of both net sandstone net/grossrespectively.
Fig. 11. Distribution of total net sandstone thickness by well in B-reservoir of Eyramfield
Fig. 12. Distribution of the ratio of net sandstone to gross interval, by well, of B-reservoir

British Journal of Applied Science & Technology, 3(4): 1481-1504, 2013
1495
Fig. 13. Net feet of sandstone in the B-reservoir of the Eyram field
Fig. 14. Ratio of net sand to gross interval in the B-reservoir of the Eyram field
3.3 Porosity
The total porosity ranges from 15% to 40% with an average of 31% while the effectiveporosity ranges from 12% to 34% with an average of 26% (Figs. 15 and 16). Fig. 17 showsthe essentially random variation in average porosity over the study area. Most wells exhibit agreater range of porosity values than the range of averaged porosities.

British Journal of Applied Science & Technology, 3(4): 1481-1504, 2013
1496
Fig. 15. Distribution of total porosity values for B-reservoir
Fig. 16. Distribution of effective porosity values for B-reservoir
British Journal of Applied Science & Technology, 3(4): 1481-1504, 2013
1496
Fig. 15. Distribution of total porosity values for B-reservoir
Fig. 16. Distribution of effective porosity values for B-reservoir
British Journal of Applied Science & Technology, 3(4): 1481-1504, 2013
1496
Fig. 15. Distribution of total porosity values for B-reservoir
Fig. 16. Distribution of effective porosity values for B-reservoir

British Journal of Applied Science & Technology, 3(4): 1481-1504, 2013
1497
Fig. 17. Contour map of average sandstone porosity (PHIE) in the B-reservoir of theEyram Field
According to [25], Table 2 gives better explanation of porosity description of reservoirs.
Table 2. Qualitative evaluation of porosity
Percentage porosity (%) Qualitative description0 - 5 Negligible5 - 10 Poor15 - 20 Good20 – 30 Very Good> 30 Excellent
From this classification, it could be said that most of the wells have porosity between verygood and excellent. This may be due to very good to excellent sand quality in the area.
3.4 Permeability
It was observed that the [20] method of permeability determination yielded the highestpermeability values in the studied area and also more reliable. Permeability values rangefrom 155 to 987 mD, 122 to 1364 and 75 to 395 with averages of 359mD, 399mD and157mD for [21,20] and [22,23] respectively. Fig. 18 shows the essentially random variation inaverage permeability of [21] over the study area. Most wells exhibit a greater range ofpermeability values than the range of averaged permeabilities.

British Journal of Applied Science & Technology, 3(4): 1481-1504, 2013
1498
[25] gave better explanation of permeability description of reservoirs (Table 3). Thepermeability values in all the wells are between good to excellent. This is as a result of verygood to excellent sand quality.
Fig. 18. Contour map of average permeability for sandstones in the B-reservoir of theEyram Field
Table 3. Qualitative evaluation of permeability
Average K_value (mD) Qualitative description<15 Poor to fair15 – 50 Moderate50 – 250 Good250 – 1000 Very Good> 1000 Excellent
3.5 Water Saturation
The water saturation per well by log analysis ranged from 8% to 58%, with an average of48% (Fig. 19). Water saturation correlates with porosity (Fig. 20). Fig. 21 gives the range ofaverage water saturation for sandstones in the B-reservoir of the Eyram field.

British Journal of Applied Science & Technology, 3(4): 1481-1504, 2013
1499
Fig. 19. Distribution of average water saturation from log analysis, per well, for B-reservoir
Fig. 20. Trend of decreasing average water saturation with increasing averageporosity in B-reservoir of the Eyram field
British Journal of Applied Science & Technology, 3(4): 1481-1504, 2013
1499
Fig. 19. Distribution of average water saturation from log analysis, per well, for B-reservoir
Fig. 20. Trend of decreasing average water saturation with increasing averageporosity in B-reservoir of the Eyram field
British Journal of Applied Science & Technology, 3(4): 1481-1504, 2013
1499
Fig. 19. Distribution of average water saturation from log analysis, per well, for B-reservoir
Fig. 20. Trend of decreasing average water saturation with increasing averageporosity in B-reservoir of the Eyram field

British Journal of Applied Science & Technology, 3(4): 1481-1504, 2013
1500
Fig. 21. Contour map of average water saturation for sandstones in the B-reservoir ofthe Eyram field
3.6 Bulk Volume Water (BVW)
The product of water saturation and porosity (Bulk Volume Water) is nearly constant in allthe wells at 12% to 17% (Fig. 22) which suggests that the sandstones in Eyram field arehomogenous and nearly irreducible water saturation conditions [19]. The only exception is inwell EY-7H which has BVW of 3%. This low value may be as a result of faulting or pinch out.Calculated bulk volume water (BVW) correlate with hydrocarbon occurrences; intervals withhigh BVW is either wet or have hydrocarbon traces.
Fig. 22. Contour map of bulk volume water for sandstones in the B-reservoir of theEyram Field

British Journal of Applied Science & Technology, 3(4): 1481-1504, 2013
1501
3.7 Shale Volume
The volume of shale in Eyram field ranges from 2% to 31% with an average of 21% (Fig.23). Most wells have VSh that ranged between 20 and 25% (Fig. 24)
Fig. 23. Distribution of shale volume per well for B-reservoir of Eyram field
Fig. 24. Contour map of average volume of shale in the B-reservoir of the Eyram field

British Journal of Applied Science & Technology, 3(4): 1481-1504, 2013
1502
3.8 Hydrocarbon Types and Contact
Sequel to shale layers intercalations and oil and gas association, different hydrocarboncontact types were observed in the field. The contact types include Oil Down Tool, GasDown Tool and Oil Water Contact. Most of the wells are Oil Down Tool and the field containsmostly oil.
3.9 Net Pay
A reservoir cut-off porosity value of 0.1, while 0.7 cut-off for Vsh (Fig. 8) and 0.7 cut-off forSwT were used for the determination of net pay. The total net pay of oil column in thereservoir is given as 1278.01ft while gas column is given as 172.91ft. The net/gross payrange from 8% to 88% with an average of 69%.
3.10 Hydrocarbon Saturation
This range from 43% to 92% with an average of 52%.
4. CONCLUSION
This research evaluates the petrophysical properties of Eyram field. This field is located inonshore area of the Niger Delta. Twenty one ell log data from the field were evaluated tocharacterize the porosity, permeability and water saturation of the B-reservoir. Sand lobe inthe reservoir bifurcated by shale lenses was assessed in terms of thickness, fluid contentand types. The logs were environmentally corrected and normalized, volume of shale andporosities were calculated, water saturation were determined by Archie’s equation and dualwater model, and net pay was calculated.
Within the B-reservoir of the Eyram field, the average well has 103.94ft of net sandstone,having average porosity of 26%. The average permeability is 399mD while the averagewater saturation is 48%.
Evaluation of Eyram field reservoirs; their petrophysical properties and fluid contentsrevealed predominant oil reservoirs in the area with minor amount of gas. The oil-bearingcolumns thickness cumulatively is 1278.01 ft, while gas columns summed to 172.91 ft.Porosity and permeability in the field are high on the average due to very good to excellentsand quality.
For effective reservoir management, field development strategies that take these variouspetrophysical parameters and contact types into consideration should be implemented.
ACKNOWLEDGEMENTS
We acknowledge Dr. Michael Ilesanmi Oladapo of the Applied Geophysics Department,Federal University of Technology, Akure, Ondo State for reading through the manuscript andmaking useful suggestions.
British Journal of Applied Science & Technology, 3(4): 1481-1504, 2013
1503
COMPETING INTERESTS
Authors have declared that no competing interests exist.
REFERENCES
1. Short KC, Stauble AJ. Outline of the Geology of Niger Delta. American Association ofPetroleum Geologist Bulletin. 1967;761-777.
2. Franky EJ, Cordy EA. The Niger Delta oil province: recent developments onshoreand offshore. Geological Society of American Bulletin. 1967;19:195-199.
3. Maron P. Stratigraphical aspect of the Niger Delta. Journal of Mining and Geology.1969;4:1-3.
4. Tuttle LWM, Charpentier RR, Brownfield EM. The Niger Delta petroleum system: NigerDelta Province, Nigeria, Cameroon and Equatorial Guinea, Africa. U.S. GeologicalSurvey Open-File Report 99-50-H, Denver, Colorado. 1999;70.
5. Hilchie DW. Wireline. A history of the well logging and perforation business in the oilfields. D. W. Hilchie Inc., Boulder, Colorado, U. S.A. 1990;25–86.
6. Schlumberger. Log interpretation charts. Schlumberger Well Services, Houston.1996;2–34.
7. Uguru, CI, Onyeagoro, OU and Sikiru IO. Permeability modeling for reservoirs in theNiger Delta based on geological descriptions and core data. SIPM Review Report.2002;4 –98.
8. Weber KJ. Hydrocarbon Distribution Pattern in Nigeria growth fault structurescontrolled by structural style and stratigraphy. J. Petrol. Sci. Engine. Elsevier SciencePublishers B.V. Amsterdam. 1987;1-12.
9. Doust H, Omatsola E. Niger Delta. In Divergent/Passive Margin Basins, J.D. Edwardsand P.A. Santogrossi, editors. AAPG Memoir 48. American Association of PetroleumGeologists. Tulsa, USA. 1990;239–248.
10. Kulke H. Nigeria:In Regional Petroleum Geology of the World. Part II: Africa, America,Australia and Antarctica, H. Kulke, editor. Gebrüder Borntraeger, Berlin, Germany.1995:143-172.
11. Weber KJ. Hydrocarbon Distribution Pattern in Nigeria growth fault structurescontrolled by structural style and stratigraphy. J. Petrol. Sci. Engine. Elsevier SciencePublishers B.V. Amsterdam. 1987;1-12.
12. Doust H, Omatsola E. The Niger Delta: Hydrocarbon Potential of a Major TertiaryDelta Province”. Proceedings, KNGMG Symposium “Coastal Lowland Geology andGeo-technology. Dordrecht: Kluwe. 1989;203-212.
13. Cluff SG, Cluff RM. Jonah Field: Case Study of a Giant Tight-Gas Fluvial Reservoir, J.W. Robinson and K. W. Shanley, eds.: AAPG Studies in Geology 52 and RockyMountain Association of Geologists; 2004.
14. Steiber SJ. Pulse Neutron capture log evaluation in the Louisiana Gulf Coast” SPEpaper 2961, presented at the SPE Annual Meeting, Houston. 1970;October:4-7.
15. Hook JR. An introduction to porosity: Petrophysics. 2003;44(3):205– 212.16. Clavier C, Coates G, Dumanoir J. Theoretical and experimental bases for the dual-
water model for interpretation of shaly sands: Society of Petroleum Engineers Journal.1977;24(2):153–168.
17. Archie GE. The electrical resistivity log as an aid in determining some reservoircharacteristics. Trans. Am. Inst. Mech. Eng. 1942;146:54-62.

British Journal of Applied Science & Technology, 3(4): 1481-1504, 2013
1504
18. Clavier C, Hoyle WR, Meunier D. Quantitative interpretation of thermal neutron decaytime logs: Part 1- Fundamentals and Techniques. Journal of Petroleum Technology.1971;743–755.
19. Asquith G, Krygowski D. Basic Well Log Analysis, 2nd edition. American Association ofPetroleum Geologists: Methods in Exploration Series. 2004;244:28.
20. Tixier MP. Evaluation of permeability from electric log resistivity gradient. EarthScience Journ. 1949;2:113.
21. Timur A. An investigation of permeability, porosity and residual water saturationrelations for sandstone reservoirs. The Log Analyst. 1968;9(4):8-17.
22. Coates GR, Dumanoir JL. A new approach to improved log-derived 252 permeability.In: Proceedings of SPWLA 14th Annual Logging Symposium, Transaction, Paper;1973.
23. Coates GR, Dumanoir JL. A new approach to improved log-derived permeability. TheLog Analyst. 1974;15 (1):17–29.
24. Kozeny J. Ober kapillare Leitung des Wassers in Boden: Sitzungsbericht der WienerAkademie, Abteilung Пa. 1927;136:271. German.
25. Rider M. The Geological Interpretation of Well Logs. Blackie, Glasgow. 1986;151–165._________________________________________________________________________© 2013 Omolaiye and Sanuade; This is an Open Access article distributed under the terms of the CreativeCommons Attribution License (http://creativecommons.org/licenses/by/3.0), which permits unrestricted use,distribution, and reproduction in any medium, provided the original work is properly cited.
Peer-review history:The peer review history for this paper can be accessed here:
http://www.sciencedomain.org/review-history.php?iid=226&id=5&aid=2066