
Performance of Multiprocessor Interconnection Networks
13
Performance of Multiprocessor Interconnection Networks Laxmi N. Bhuyan, University of Southwestern Louisiana Qing Yang, University of Rhode Island Dharma P. Agrawal, North Carolina State University w ith device characteristics approaching physical limits, parallel or distributed process- ing has been widely advocated as a promis- ing approach for building high per- formance computing systems. The con- tinued impetus in research in these areas arises from two factors: (a) the technolog- ical development in the areaof VLSI chips and (b) the observation that significant exploitable software parallelism is inher- ent in many scientific and engineering applications. To exploit this parallelism efficiently, a parallel/distributed system must be designed to considerably reduce the com- munication overhead between the proces- sors. The communication architecture of the system might support one application well but might prove inefficient for others. Therefore, we need to take a general approach, independent of the application, while designing the communication system or the interconnection network (IN) of a general-purpose parallel/distributed sys- tem. The IN must be efficient, reliable, and cost effective. A complete intercon- nection, such as a crossbar, might be cost prohibitive, but a shared-bus interconnec- tion might be inefficient and unreliable. Thus, present research is directed to designing INS whose cost and performance lie somewhere between the two extremes. Multiprocessor designers need analytical techniques to evaluate network performance. This article presents a tutorial on these evaluation tools to guide designers through the design process. Ongoing research in the area of paral- lel and distributed processing suggests a number of promising INS. Because of the high cost involved in hardware implemen- tation or software simulation of these INS, performance evaluation of these networks needs to be carried out through analytical techniques so that we can make a choice between various alternatives. A mathe- matical model makes it possible to study the efficiency of the IN in terms of various design parameters used as inputs to a model. Therefore, the intent of this arti- cle is to provide a tutorial on the subject of performance evaluation of multiprocessor interconnection networks to guide system designers in their design process. A classification of parallel/distributed systems. We can divide general-purpose parallel/distributed computer systems into two categories : multiprocessors and multicomputers. The main difference between them lies in the level at which interactions between the processors occur. A multiprocessor must permit all processors to directly share the main mem- ory. All the processors address a common main memory space. In a multicomputer, however, each processor has its own mem- ory space, and sharing between the proces- sors occurs at a higher level as with a complete file or data set. A processor can- not directly access another processor’s local memory. Multiprocessors can be further divided as tightlycoupled and loosely coupled. In a tightly coupled system, the main mem- ory is situated at a central location so that the access time from any processor to the February 1989 001 8-9l62/89/02oO-oO25S0l .WO I989 IEEE 25
-
Upload
independent -
Category
Documents
-
view
0 -
download
0
Transcript of Performance of Multiprocessor Interconnection Networks
Performance of Multiprocessor
Interconnection Networks Laxmi N. Bhuyan, University of Southwestern Louisiana
Qing Yang, University of Rhode Island
Dharma P. Agrawal, North Carolina State University
w ith device characterist ics approaching physical limits, parallel or distributed process-
ing has been widely advocated as a promis- ing approach for building high per- formance computing systems. The con- tinued impetus in research in these areas arises from two factors: (a) the technolog- ical development in the areaof VLSI chips and (b) the observation that significant exploitable software parallelism is inher- ent in many scientific and engineering applications.
To exploit this parallelism efficiently, a parallel/distributed system must be designed to considerably reduce the com- munication overhead between the proces- sors. The communication architecture of the system might support one application well but might prove inefficient for others.
Therefore, we need to take a general approach, independent of the application, while designing the communication system or the interconnection network (IN) of a general-purpose parallel/distributed sys- tem. The IN must be efficient, reliable, and cost effective. A complete intercon- nection, such as a crossbar, might be cost prohibitive, but a shared-bus interconnec- tion might be inefficient and unreliable. Thus, present research is directed to designing INS whose cost and performance lie somewhere between the two extremes.
Multiprocessor designers need
analytical techniques to evaluate network performance. This article presents a tutorial on these
evaluation tools to guide designers
through the design process.
Ongoing research in the area of paral- lel and distributed processing suggests a number of promising INS. Because of the high cost involved in hardware implemen- tation or software simulation of these INS, performance evaluation of these networks needs t o be carried out through analytical
techniques so that we can make a choice between various alternatives. A mathe- matical model makes it possible t o study the efficiency of the IN in terms of various design parameters used as inputs to a model. Therefore, the intent of this arti- cle is t o provide a tutorial on the subject of performance evaluation of multiprocessor interconnection networks to guide system designers in their design process.
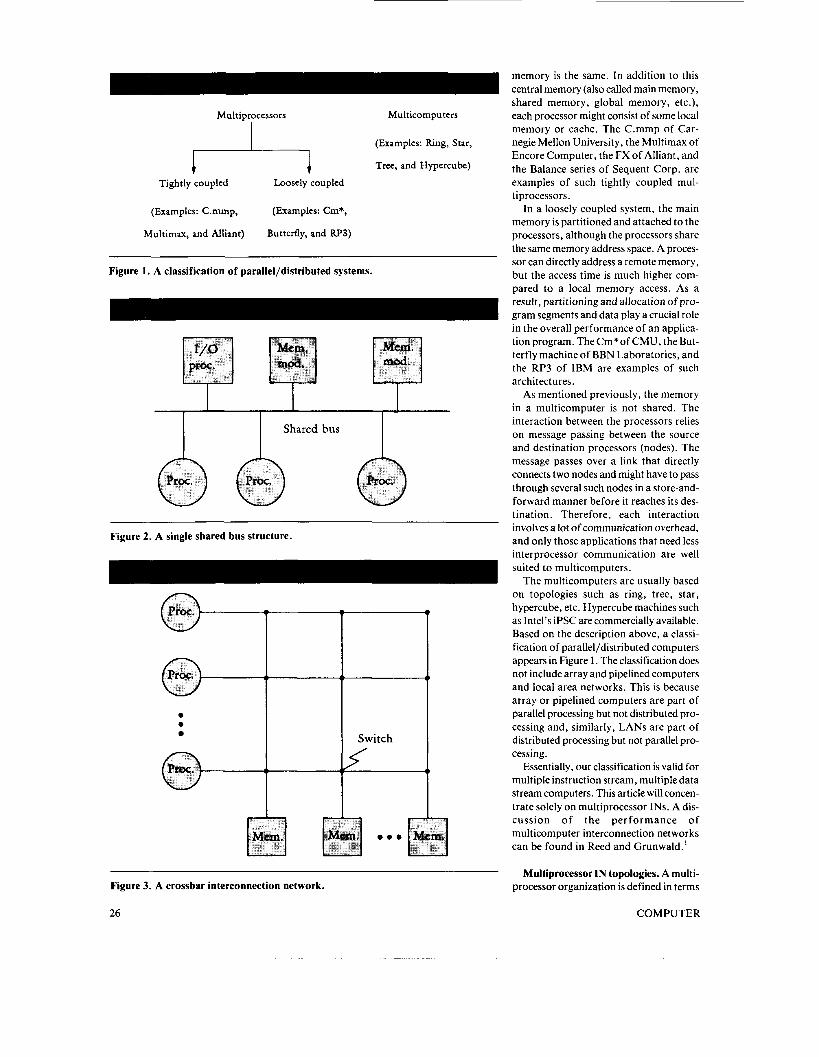
A classification of parallel/distributed systems. We can divide general-purpose parallel/distributed computer systems into two categories : multiprocessors and multicomputers. The main difference between them lies in the level at which interactions between the processors occur.
A multiprocessor must permit all processors to directly share the main mem- ory. All the processors address a common main memory space. In a multicomputer, however, each processor has its own mem- ory space, and sharing between the proces- sors occurs a t a higher level as with a complete file or data set. A processor can- not directly access another processor’s local memory.
Multiprocessors can be further divided as tightlycoupled and loosely coupled. In a tightly coupled system, the main mem- ory is situated at a central location so that the access time from any processor t o the
February 1989 001 8-9l62/89/02oO-oO25S0l .WO I989 IEEE 25
Multiprocessors Multicomputers
(Examples: Ring, Star, A Tree, and Hypercube)
Tightly coupled Loosely coupled
(Examples: C.mmp, (Examples: Cm*,
Multimax, and Alliant) Butterfly, and RP3)
Figure 1. A classification of parallel/distributed systems.
S h a r e d bus
Figure 2. A single shared bus structure.
0 0 I
I 1 Switch
f I
Figure 3. A crossbar interconnection network.
memory is the same. In addition to this central memory (also called main memory, shared memory, global memory, etc.), each processor might consist of some local memory or cache. The C.mmp of Car- negie Mellon University, the Multimax of Encore Computer, the FX of Alliant, and the Balance series of Sequent Corp. are examples of such tightly coupled mul- tiprocessors.
In a loosely coupled system, the main memory is partitioned and attached to the processors, although the processors share the same memory address space. A proces- sor can directly address a remote memory, but the access time is much higher com- pared to a local memory access. As a result, partitioning and allocation of pro- gram segments and data play a crucial role in the overall performance of an applica- tion program. The Cm*of CMU, the But- terfly machine of BBN Laboratories, and the RP3 of IBM are examples of such architectures.
As mentioned previously, the memory in a multicomputer is not shared. The interaction between the processors relies on message passing between the source and destination processors (nodes). The message passes over a link that directly connects two nodes and might have to pass through several such nodes in a store-and- forward manner before it reaches its des- tination. Therefore, each interaction involves a lot of communication overhead, and only those applications that need less interprocessor communication are well suited to multicomputers.
The multicomputers are usually based on topologies such as ring, tree, star, hypercube, etc. Hypercube machines such as Intel's iPSC are commercially available. Based on the description above, a classi- fication of parallel/distributed computers appears in Figure 1. The classification does not include array and pipelined computers and local area networks. This is because array or pipelined computers are part of parallel processing but not distributed pro- cessing and, similarly, LANs are part of distributed processing but not parallel pro- cessing.
Essentially, our classification is valid for multiple instruction stream, multiple data stream computers. This article will concen- trate solely on multiprocessor INS. A dis- cuss ion o f t he p e r f o r m a n c e o f multicomputer interconnection networks can be found in Reed and Grunwald. '
Multiprocessor IN topologies. A multi- processor organization is defined in terms
26 COMPUTER
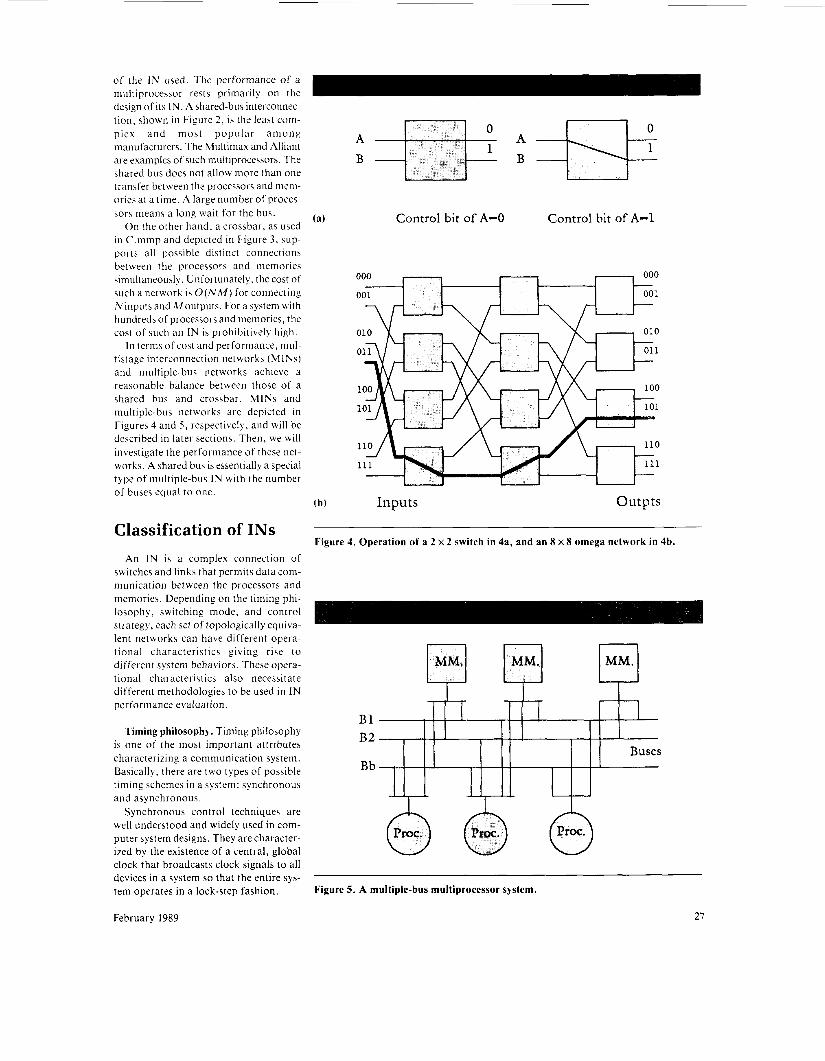
design of its IN. A shared-bus interconnec- tion, shobn in Figure 2 , is the least com- plex a n d most popu la r a m o n g manufacturers. The Multimax and Alliant
shared bus does not allow more than one transfer bemeen the processors and mem- ories at a time. A large number o f proces- Fors means a long uait for the bus.
O n the other hand, a crossbar, as used in C .mmp and depicted in Figure 3, sup- ports all possible distinct connections between the processors and memories simultaneously. Unfortunately, the cost of such a network is O ( N M ) for connecting Ninputs and Moutputs. For a system with hundreds of processors and memories, the cost of such an IN is prohibitibely high
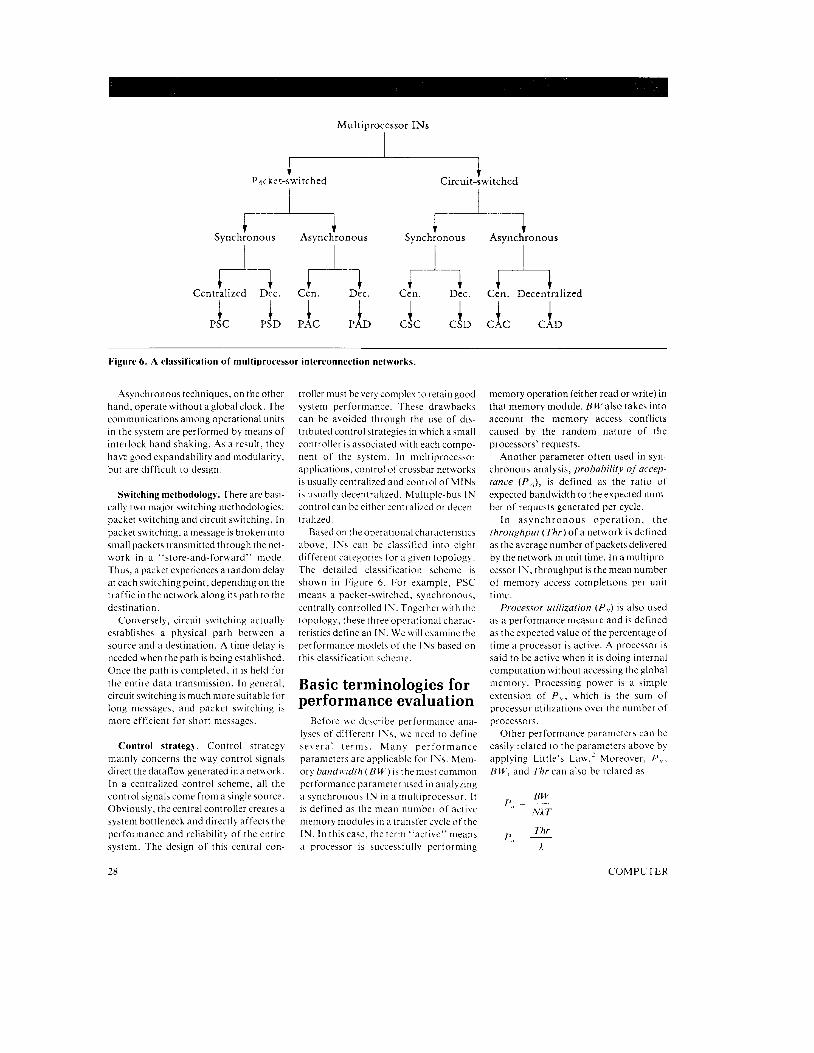
In terms. of cost and performance, mul- tistage interconnection netuorks (MINs) and multiple-bus networks achiebe a reasonable balance between those of a shared bus and crossbar. MINs and multiple-bus networks are depicted in Figures 4 and 5 , respectively, and will be described in later sections. Then, u e wi l l investigate the performance of these net- works. A shared bus IS essentially a special type of multiple-bus IN with the number of buses equal t o one.
A A are examples of such multiprocessors. The B B
(a) Control bit of A-0 Control bit of A-1
(b) Inputs Outpts
Classification of INS Figure 4. Operation of a 2 x 2 switch in 4a, and an 8 x 8 omega network in 4b.
An IN is a complex connection of switches and links that permits da ta com- munication between the processors and
lent networks can have different opera- t ional characteristics giving rise to different system behaviors. These opera- tional characteristics also necessitate different methodologies t o be used in IN performance evaluation.
B1 B 2
Fib
Timing philosophy. Timing philosophy is one of the most important attributes characterizing a communication system. Basically, there are two types of possible timing schemes in a system: synchronous and asynchronous.
Synchronous control techniques are well understood and widely used in com- puter system designs. They are character- ized by the existence of a central, global clock that broadcasts clock signals t o all devices in a system so that the entire sys- tem operates in a lock-step fashion. Figure 5. A multiple-bus multiprocessor system.
February 1989 21
Multiprocessor INS
i P dc kc‘ t-swi tc hed
.f Circuit-switched
PSC i PSD i l PAC PAD C f C C f h c L D C C
Figure 6. A classification of multiprocessor interconnection networks.
Asynchronous techniques, on the other hand, operate without a global clock. The communications among operational units in the system are performed by means of interlock hand shaking. As a result, they havt, good expandability and modularity, but are difficult to design.
Switching methodology. There are basi- cally two major switching methodologies: packet switching and circuit switching. In packet switching, a message is broken into small packets transmitted through the net- work in a “store-and-forward” mode. Thus, a packet experiences a random delay at each switching point, depending on the traffic in the network along its path to the destination.
Conversely, circuit switching actually establishes a physical path between a source and a destination. A time delay is needed when the path is being established. Once the path is completed, it is held for the entire data transmission. In general, circuit switching is much more suitable for long messages, and packet switching is more efficient for short messages.
Control strategy. Control strategy mainly concerns the way control signals direct the dataflow generated in a network. In a centralized control scheme, all the control signals come from a single source. Obviously, the central controller creates a system bottleneck and directly affects the performance and reliability of the entire system. The design of this central con-
troller must be very complex to retain good system performance. These drawbacks can be avoided through the use of dis- tributed control strategies in which a small controller is associated with each compo- nent of the system. In multiprocessor applications, control of crossbar networks is usually centralized and control of MINs is usually decentralized. Multiple-bus IN control can be either centralired or decen- tralized.
Based on the operational characteristics above, INS can be classified into eight different categories for a giLen topology. The detailed classification scheme is shown in Figure 6. For example, PSC means a packet-switched, synchronous, centrally controlled IN. Together with the topology, these three operational charac- teristics define an IN. We will examine the performance models of the IN, based on t his cl ass i fica t ion scheni e .
Basic terminologies for performance evaluation
Before n e describe performance ana- lyses of different INS, we need to define several t e rms . Many performance parameters are applicable for INS. Mem- ory bandwidrh (BU’) is the most common performance parameter used in analyzing a synchronous IN in a multiprocessor. I t is defined as the mean number of active memory modules in a transfer cycle of the IN. In this case, the term “active” means a processor is successfully performing
memory operation (either read or write) in that memory module. BWalsc takes into account the memory access conflicts caused by the random nature of the processors’ requests.
Another parameter often used in syn- chronous analysis, probability of accep- tance (P,,,), is defined as the ratio of expected bandwidth to the expected num- ber of requests generated per cycle.
In asynchronous opera t ion , the throughput ( T h r ) of a network is defined as the average number of packets delivered by the network in unit time. In a multipro- cessor IN, throughput is the mean number of memory access completions per unit time.
Processor utilization (PI , ) is also used as a performance measure and is defined as the expected value of the percentage of time a processor is active. A processor is said to be active when i t is doing internal computation without accessing the global memory. Processing power is a simple extension of PI , , which is the sum of processor utilizations over the number of processors.
Other performance parameters can be easily related to the parameters above by applying Little’s Law.’ Moreover, P ,, , BU‘, and Thr can also be related as
BW p = - ‘ I NAT
Thr p = - ‘ I A
28 COMPUTER
where N i s the number of processors, Tis the time taken for a memory read or write operation, and A is the memory request rate.
Analytical modeling is a cost effective technique used to study the performance of a computer system. However, any real system is too complex to be modeled exactly.
To make an analytical model tractable, certain approximation assumptions are necessary. Most of the IN analyses assume identical processors and a uniform refer- ence model. The URM implies that, when a processor makes a memory request to the global memory, the request will be directed to any one of Mmemory modules with the same probability 1/M. That is, the desti- nation address of a memory request is uni- formly distributed among M memory modules. This assumption provides us with the symmetric property, significantly simplifying the modeling.
If the memory system is M-way inter- leaved, this assumption also represents the program behavior reasonably accurately. When the main memory is not interleaved, there is a locality of reference and a favor- ite memory assumption3 is more accurate.
The request rate of a processor identi- fies how often a processor accesses global memory. This indirectly reflects the aver- age execution time of an instruction.
In synchronous systems, therequest rate can be specified by a probability that a processor generates a memory request at the beginning of a cycle. In asynchronous systems, on the other hand, a memory request could be generated at any instant in time since there is no global clock. How- ever, an exponential thinking time for a processor is commonly assumed, which means that the duration between the com- pletion of a request and generation of the next request to the global memory is an exponentially distributed random variable.
The request independence assumption (also called Strecker’s approximation4) in a synchronous system analysis states that a memory request generated in a cycle is independent of the requests of the previ- ous cycles. In reality, this is not true because a request that was rejected in the previous cycle will be resubmitted in the current cycle. However, as we shall see, this assumption simplifies the analysis to a great extent while keeping the results reasonably accurate.
Performance of crossbar interconnection networks
A crossbar interconnection network is an array of individually operated contact pairs in which there is one pair for each input-output combination, as shown in Figure 3. A crossbar network with N inputs and Moutputs is referred to as an N x M crossbar. As long as there is no memory interference among a set of mem- ory requests generated by the processors (that is, no two or more processors request the same memory module), all connections can be established at the same time. Thus, all memory accesses can proceed simul- taneously.
But this capability comes at a high switching cost, which is (O(NM)). Although the crossbar network can pro- vide all simultaneous connections, mem- ory bandwidth is much less than its actual capacity. This reduction is due to the mem- ory interference caused by the random nature of the memory requests in a multi- processor environment. Therefore, the performance analysis of a crossbar net- work becomes the analysis of memory interference.
The literature’ contains a number of memory interference models for central- ized, synchronous, and circuit-switched crossbar systems. In most of these models, system operations are approximated by stochastic processes as follows: At the beginning of the system cycle, a processor selects a memory module at random and makes a request to access that module with some probability p. If more than one request is made to the same memory mod- ule, the memory controller will choose one at random, and the rejected processors will retry in the next cycle. The behavior of the processors is considered independent and statistically identical, as is the behavior of the memory modules.
Bhandarkar4 studied the memory inter- ference problem in detail in which several discrete Markov chain models were devel- oped. In these models, a memory module is characterized by its cycle time t,, which consists of an access time t o , followed by a rewrite time t , . Processor behavior is modeled as an ordered sequence, consist- ing of a memory request followed by a cer- tain amount of execution time t , . The processing time t, is measured from the time data were obtained from the previous
request to the time the next request is issued to the memory.
In real systems, the processor can start execution when the memory is in its rewrite cycle. So, when t , . = t,, the situation would be equivalent to the case where the processor generates a memory request at the beginning of each memory cycle. In this study, an exact model for the case t , = t , and with URM was presented. However, the model becomes very unwieldy for a large number of processors and memory modules.
The complexity of the memory interfer- ence model is simplified if one assumes that a blocked processor discards the request and generates a new independent request at the start of the next cycle (request independence assumption). For a system with Nprocessors and M memory modules, if a processor generates a request with probability p in a cycle directed to each memory with equal probability (URM), then the memory bandwidth is given by Strecker4 as
(1) P M
BW = M(l-(1- -Y)
A simple explanation of this formula is as follows: SinceplMis the probability that a processor requests a particular memory module, [ l - (p /M)INis the probability that none of the Nprocessors requests the memory module in a particular cycle. Sub- tracting this term from 1 gives the proba- bility that at least one request to this memory is issued. Multiplying by Myields the expected number of distinct memory modules being requested in a cycle and hence the bandwidth. The maximum per- centage of error with this approximation is limited to 8 percent for M / N > 0.75.4 As a result, this simple formula, Equation 1, is widely used for predicting the perfor- mance of crossbar networks. The accuracy can be further increased by a “rate adjust- ment” technique6 where the input request rate is adjusted upward to take into account the resubmission of rejected requests. Yen6 provides a comparison of various memory interference models for synchronous crossbars.
The model described above assumes a URM. However, as mentioned previously, the distribution of memory requests in real systems depends on program behavior, and such distributions are not necessarily uniform. Bhuyan3 has examined this nonuniform reference problem by introducing the concept of favorite mem- ory of a processor. The memory module requested most often by a processor is
February 1989 29
Processors
A Memory modules
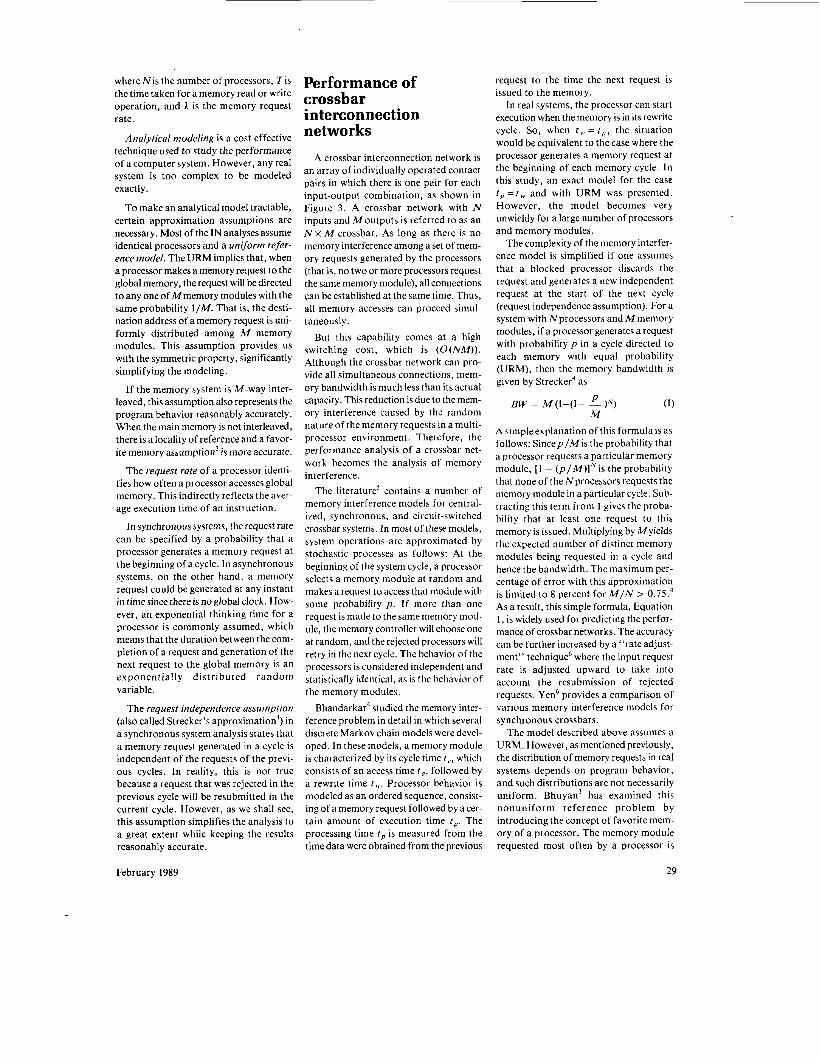
Figure 7. A queueing model for asynchronous crossbar multiprocessors.
called the favorite memory of the proces- sor. Let tn represent the probability with which a processor addreses its favorite memory given that the processor generates a request in a cycle. Then, the memory bandwidth for an N x N crossbar-based multiprocessor is given by
1-m B W = N [l-(l-pm) (l-P---)~'-'l (2)
N- 1
Solutions for favorite memory cases are also provided for M 5 N a n d M 2 N.? By substituting m = 1/M, the analysis reduces to that of URM (Equation 1).
In the descriptions above, we have con- sidered only circuit-switched and syn- chronous systems. The analysis of asynchronous circuit-switched systems can be done by assuming a random period of processor thinking time and memory access time. The processors are then modeled by a set of delay servers and mem- ory modules by a set of first-come, first- serve (FCFS) queues, as shown in Figure 7 . This figure depicts a well-known closed queueing network in performance evalu-
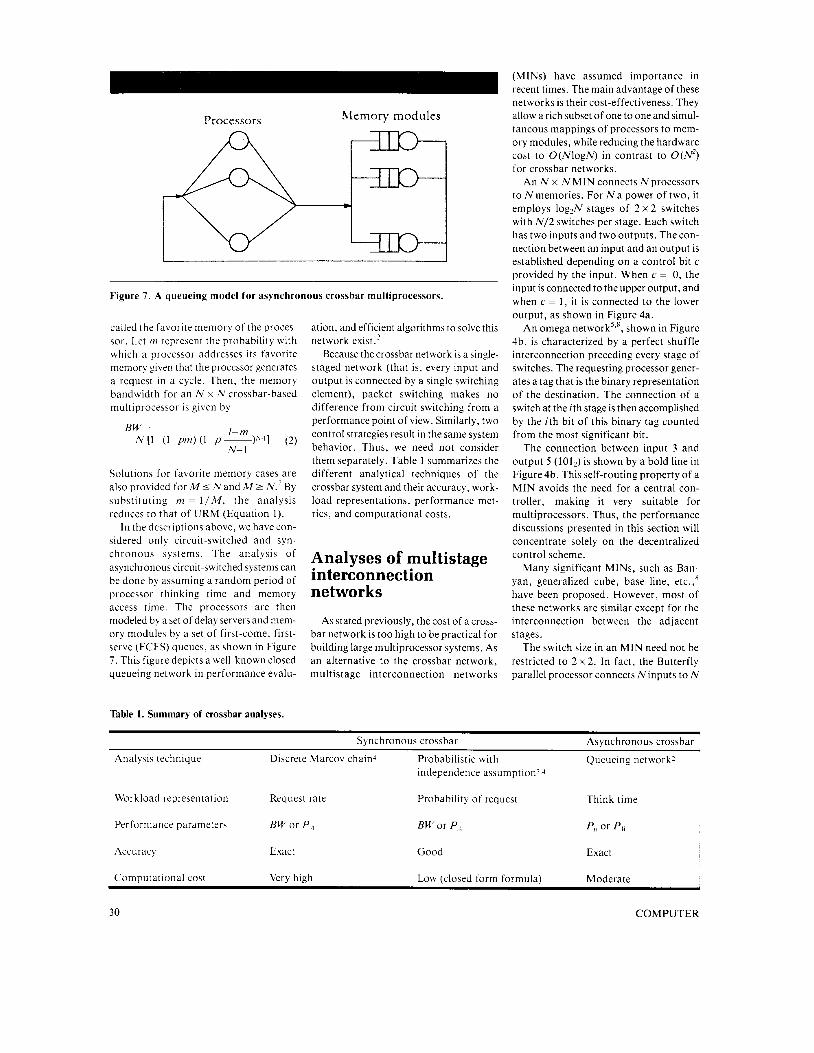
Table 1. Summary of crossbar analyses.
ation, and efficient algorithms to solve this network exist.'
Because the crossbar network is a single- staged network (that is, every input and output is connected by a single switching element), packet switching makes no difference from circuit switching from a performance point of view. Similarly, two control strategies result in the same system behavior. Thus, we need not consider them separately. Table 1 summarizes the different analytical techniques of the crossbar system and their accuracy, work- load representations, performance met- rics, and computational costs.
Analyses of multistage interconnection networks
As stated previously, the cost of a cross- bar network is too high to be practical for building large multiprocessor systems. As an alternative to the crossbar network, multistage interconnection networks
(MINs) have assumed importance in recent times. The main advantage of these networks is their cost-effectiveness. They allow a rich subset of one to one and simul- taneous mappings of processors to mem- ory modules, while reducing the hardware cost to O(N1ogN) in contrast to O(N2) for crossbar networks.
An N x N MIN connects N processors to N memories. For N a power of two, it employs log,N stages of 2 x 2 switches with N/2 switches per stage. Each switch has two inputs and two outputs. The con- nection between an input and an output is established depending on a control bit c provided by the input. When c = 0, the input is connected to the upper output, and when c = 1, it is connected to the lower output, as shown in Figure 4a.
An omega network538, shown in Figure 4b, is characterized by a perfect shuffle interconnection preceding every stage of switches. The requesting processor gener- ates a tag that is the binary representation of the destination. The connection of a switch at the ith stage is then accomplished by the i th bit of this binary tag counted from the most significant bit.
The connection between input 3 and output 5 (1012) is shown by a bold line in Figure 4b. This self-routing property of a MIN avoids the need for a central con- troller, making it very suitable for multiprocessors. Thus, the performance discussions presented in this section will concentrate solely on the decentralized control scheme.
Many significant MINs, such as Ban- yan, generalized cube, base line, etc.,' have been proposed. However, most of these networks are similar except for the interconnection between the adjacent stages.
The switch size in an MIN need not be restricted to 2 x 2. In fact, the Butterfly parallel processor connects Ninputs to N
Synchronous crossbar Asynchronous crossbar
Analqsis technique Discrete Marcok chain' Probabilistic with Queueing network? independence assumption7 4
Workload representation Request rate Probabilits of request Think time
Performance parameters BWor P , BWor P , p,, or PI,
Accuracy Exact Good Exact
Low (closed form formula) Moderate Computational cost Very high
30 COMPUTER
outputs using 4 x 4 crossbar switches and logfistages with N/4 switches per stage. A delta network can connect M = a" inputs to N = b" outputs through n stages of a x b crossbar switches.' The general- ized shuffle network (GSN) is capable of connecting any M = tn I *mz * . . . , * tn, i n p u t s t o N = n l * n , * . . . . *n,outputs through r stages of switches.' The ith stage employs m, x n, crossbar switches and is preceded by a generalized shuffle interconnection that is essentially a super- set of the omega and delta interconnec- tions. This is the most generalized version of an MIN that allows different input and output sizes, and all the other networks can be obtained by choosing the m,s and n,s, appropriately. For example, when m, = a, n, =b for all i s , i t is a delta net- work; m, = n, = 2 for all is gives an omega network; r = 1 gives a crossbar; and M = M * l and N = l * N provides a shared-bus connection.
The advantages of MINs were widely recognized by researchers, and a lot of research projects started at universities and industries. Examples of university projects include TRAC (the Texas Reconfigurable Array Computer) at the University of Texas at Austin, Pasm (partitionable sin- gle instruction, multiple data [SIMD], multiple instruction, multiple data [MIMD]) at Purdue University, Ultra- Computer at New York University, and Cedar at the University of Illinois at Urbana-Champaign. RP3 is a notable industry project at IBM, and Butterfly is a successfully marketed product by BBN Laboratories.
As these projects were starting, a serious drawback of the MINs surfaced. There is only one path from an input to an output. I t was necessary to incorporate some fault- tolerance into these networks so that at least a single fault in a switch or a link could be tolerated. This has given rise to an abundance of research during the past few years devoted to the design and evalu- ation of fault-tolerant MINs. Adams"' contains a survey and comparison of such fault-tolerant networks. The evaluation techniques for basic MINs are explained below, but can be extended to fault- tolerant MINs.
Patel' suggested a probabilistic approach to analyze the delta network based on U R M and the request indepen- dence assumption. Assume a delta net- work of size d x b " constructed from a x b crossbar modules. Each stage of the delta network is controlled by a distinct destination digit (in base b) for setting of
individual a x b switches. Since the desti- nations are independent and uniformly distributed, the requests at any a x b mod- ules are independent and uniformly dis- tributed over b different destihations. In addition, the switches at a particular stage behave similarly. Therefore, Equation 1 can be applied to any switching element in the delta network.
The expected number of requests that pass to the b outputs is obtained by setting N = a and M = b in Equation 1 . Dividing this number by b gives us the probability of request on any of the b output lines of an a x b switch as a function of its input probability. Since the output of a stage is the input of the next stage, one can recur- sively evaluate the output probability of any stage starting at stage I . If p , is the probability that there is a request at the output of a switch at stage 1 , then
for 1 5 i 5 n. In particular, the output probability of the final stage determines the bandwidth of a delta network, that is, B W = p,b". This analytical technique has been widely used to evaluate various MINs.
Bhuyan3 extended the analysis to favorite-memory cases. For N x N net- works, with N = a", the processors are defined to be connected to their favorite memories when all the switches are straight connected, that is, input i of a switch is connected to theoutput iof theswitch. In an omega network memory, M M , becomes the favorite memory of processor P,. Let 4 , ~ I be the probability that there is a favorite request to the input at stage i. In an N x N ( N = a") delta network,
About six other equations are needed to determine 4,- I at stage i3 and, finally, BW = N p n . The analyses above'.' are valid for synchronous packet-switched MINs provided that (a) packets are gener- ated only at the beginning of the network cycle and (b) switches do not have buffers (are unbuffered) so that packets are ran- domly chosen in case of conflicts and unsuccessful packets are lost.
The above analyses presented a recur- rence relation for the performance of unbuffered networks, but not a closed- form solution. Kruskal and Snir" obtained an asymptotic expression for the output request probability of a stage for an
cess. cacn snarea resource, sucn as a DUS
or a memory module, is considered a queueing service center.
Because of circuit switching. the Droces-
February 1989
pacrtet-swircnea snarea DUS Detween processors and memories.
Yang studiedI5 packet-switched multiple-bus systems where analytical
unbuffered delta network. Let p,,, denote the probability that there is a packet on any particular input at the mth stage of a square MIN composed of k x k switches. Through some algebraic manipulations, Kruskal and Snir" approximated the asymptotic formula for p , , , as
2k ( k - l ) m + k
P,,, = ( 5 )
P
wherep is the probability of request gener- ation by a processor. From this expression, one can see that the probability that a mes- sage is not deleted is inversely proportional to the number of stages in the network. The solution for an unbuffered network by Kruskal and Snir has been shown to be a strict upper bound in the throughput of a delta network. For buffered networks, Kruskal and Snir assume an infinite buffer associated with each output of a switching element. I n each cycle, a random number of packets join an output queue without any packet being lost. This random num- ber has a B,ernoulli distribution, since all incoming packets from the inputs of the switch have an equal probability (for URM) of going to that output. The aver- age transit time through the network can be derived by means of the M / C / 1 queueing formula. '
Dias ancl Jump" have studied buffered delta networks by means of petri nets, which were introduced first as a useful graphical tool for the precise description of the system operations and as a model- ing technique that permits easy evaluation of the performance of small systems.
These graph models have recently become very popular for the representa- tion of distributed computing systems because of their ability to clearly describe concurrency, conflicts, and synchroniza- tion of tasks. However, the complexity of petri nets increases exponentially with the increase in system size. With this model- ing technique, 14 distinguishable states of a (2 x 2) switch exist with a single buffer between stages." The state transition tables and the probabilities in each state are derived. The steady state throughput and turnaround time (network delay) are obtained by iterating through use of the transition tables and probability equa- tions. The results of analysis and simula- tion indicate that buffering produces a considerable improvement in the perfor- mance of these networks.
All the analyses above pertain to syn- chronous circuit-switched or packet- switched environments. For large MINs,
31
rnrougn a DUS. I O tnis poinr, me pacKer finishes one rotation through the network, and the processor resumes its background activity. The model can be solved using
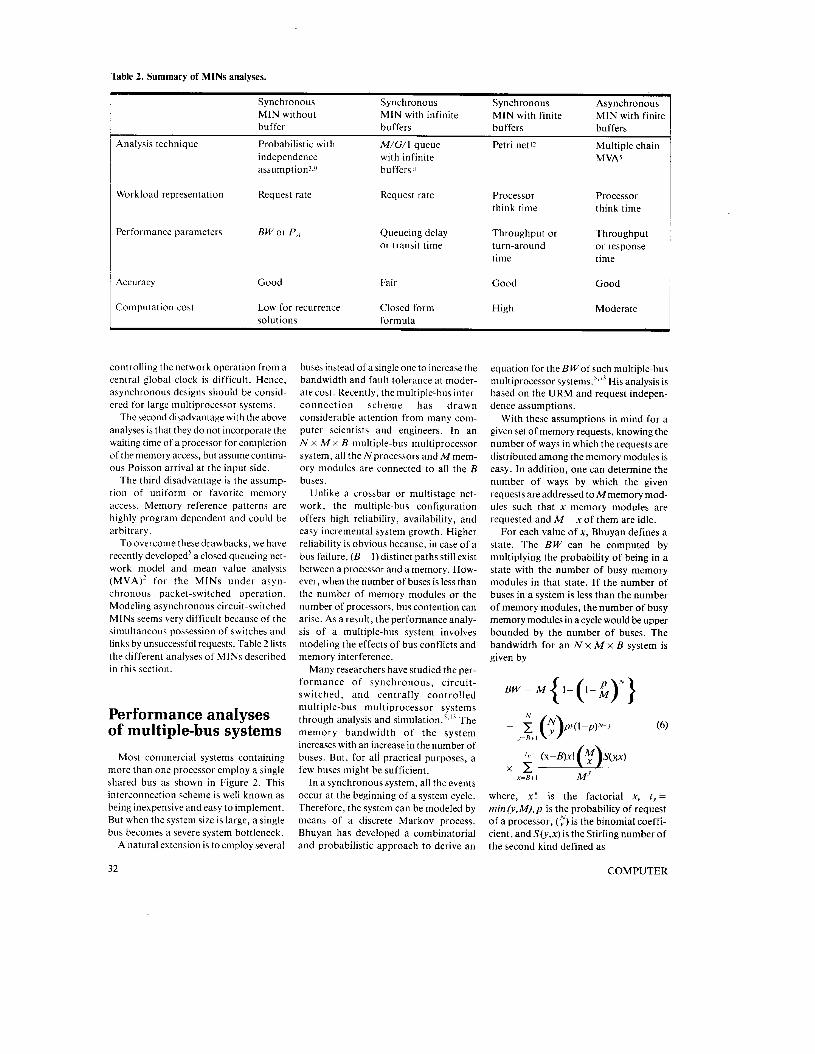
Table 2. Summary of MINs analyses.
Synchronous Synchronous Synchronous Asynchronous MIN without MIN with infinite MIN with finite MIN with finite buffer buffers buffers buffers
Analysis technique Probabilistic with M/G/I queue Petri net 12 Multiple chain independence with infinite assumption3.~ buffers)'
Workload representation Request rate
Performance parameters BW or P,,
Request rate Processor think time
MVAS
Processor think time
Queueing delay Throughput or Throughput or transit time turn-around or response
time time
Accuracy Good Fair Good Good
Computation cost Low for recurrence Closed form High solutions formula
Moderate
controlling the network operation from a central global clock is difficult. Hence, asynchronous designs should be consid- ered for large multiprocessor systems.
The second disadvantage with the above analyses is that they do not incorporate the waiting time of a processor for completion of the memory access, but assume continu- ous Poisson arrival at the input side.
The third disadvantage is the assump- tion of uniform or favorite memory access. Memory reference patterns are highly program dependent and could be arbitrary.
To overcome these drawbacks, we have recently developed5 a closed queueing net- work model and mean value analysis (MVA)' for the MINs under asyn- chronous packet-switched operation. Modeling asynchronous circuit-switched MINs seems very difficult because of the simultaneous possession of switches and links by unsuccessful requests. Table 2 lists the different analyses of MlNs described in this section.
Performance analyses of multiple-bus systems
Most commercial systems containing more than one processor employ a single shared bus as shown in Figure 2. This interconnection scheme is well known as being inexpensive and easy to implement. But when the system size is large, a single bus becomes a severe system bottleneck.
A natural extension is to employ several
buses instead of a single one to increase the bandwidth and fault tolerance at moder- ate cost. Recently, the multiple-bus inter- connection scheme has drawn considerable attention from many com- puter scientists and engineers. In an N x M x B multiple-bus multiprocessor system, all the Nprocessors and Mmem- ory modules are connected to all the B buses.
Unlike a crossbar or multistage net- work, the multiple-bus configuration offers high reliability, availability, and easy incremental system growth. Higher reliability is obvious because, in case of a bus failure, ( B - 1) distinct paths still exist between a processor and a memory. How- ever, when the number of buses is less than the number of memory modules or the number of processors, bus contention can arise. As a result, the performance analy- sis of a multiple-bus system involves modeling the effects of bus conflicts and memory interference.
Many researchers have studied the per- formance of synchronous, circuit- switched, and centrally contro!led multiple-bus multiprocessor systems through analysis and The memory bandwidth of the system increases with an increase in the number of buses. But, for all practical purposes, a few buses might be sufficient.
In a synchronous system, all the events occur at the beginning of a system cycle. Therefore, the system can be modeled by means of a discrete Markov process. Bhuyan has developed a combinatorial and probabilistic approach to derive an
equation for the BWof such multiple-bus multiprocessor system^.^.'^ His analysis is based on the URM and request indepen- dence assumptions.
With these assumptions in mind for a given set of memory requests, knowing the number of ways in which the requests are distributed among the memory modules is easy. In addition, one can determine the number of ways by which the given requests are addressed to Mmemory mod- ules such that x memory modules are requested and M - x of them are idle.
For each value of x, Bhuyan defines a state. The BW can be computed by multiplying the probability of being in a state with the number of busy memory modules in that state. If the number of buses in a system is less than the number of memory modules, the number of busy memory modules in a cycle would be upper bounded by the number of buses. The bandwidth for an N X M x B system is given by
B W = M { l-(I-fi)N}
where, x ! is the factorial x, ty = rnin(y,M),p is the probability of request of a processor, (:) is the binomial coeffi- cient, and S(y,x) is the Stirling number of the second kind defined as
32 COMPUTER
Processors n
A
Memories
Bus system queue I I -1
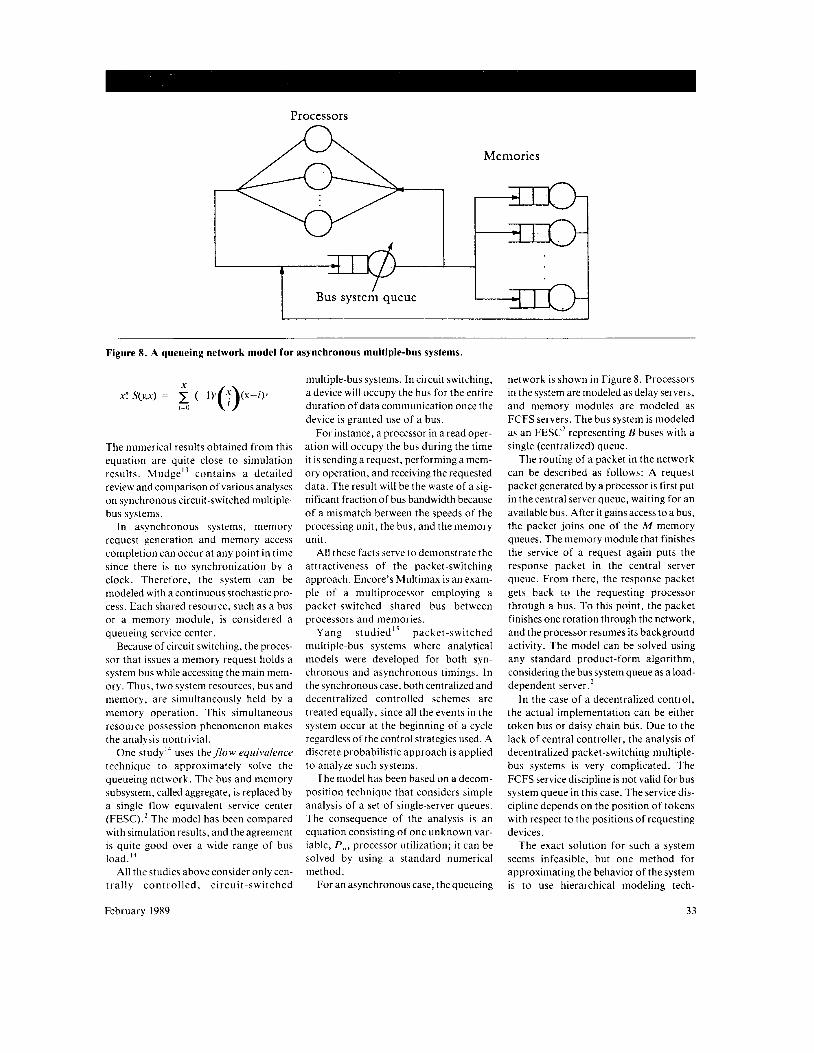
Figure 8. A queueing network model for asynchronous multiple-bus systems.
X x! S&X) = (-1) (X-i)V
r=O (9 The numerical results obtained from this equation are quite close to simulation results. MudgeI3 contains a detailed review and comparison of various analyses on synchronous circuit-switched multiple- bus systems.
In asynchronous systems, memory request generation and memory access completion can occur a t any point in time since there is no synchronization by a clock. Therefore, the system can be modeled with a continuous stochastic pro- cess. Each shared resource, such as a bus or a memory module, is considered a queueing service center.
Because of circuit switching, the proces- sor that issues a memory request holds a system bus while accessing the main mem- ory. Thus, two system resources, bus and memory, are simultaneously held by a memory operation. This simultaneous resource possession phenomenon makes the analysis nontrivial.
One study‘‘ uses the flow equivalence technique to approximately solve the queueing network. The bus and memory subsystem, called aggregate, is replaced by a single flow equivalent service center (FESC).’ The model has been compared with simulation results, and the agreement is quite good over a wide range of bus load. l 4
All the studies above consider only cen- t ra l ly c o n t r o l l e d , c i rcu i t - swi tched
multiple-bus systems. In circuit switching, a device will occupy the bus for the entire duration of data communication once the device is granted use of a bus.
For instance, a processor in a read oper- ation will occupy the bus during the time it is sending a request, performing a mem- ory operation, and receiving the requested data. The result will be the waste of a sig- nificant fraction of bus bandwidth because of a mismatch between the speeds of the processing unit, the bus, and the memory unit.
All these facts serve to demonstrate the attractiveness of the packet-switching approach. Encore’s Multimax is an exam- ple of a multiprocessor employing a packet-switched shared bus between processors and memories.
Yang s tudied” packet-switched multiple-bus systems where analytical models were developed for both syn- chronous and asynchronous timings. In the synchronous case, both centralized and decentralized controlled schemes a re treated equally, since all the events in the system occur a t the beginning of a cycle regardless of the control strategies used. A discrete probabilistic approach is applied t o analyze such systems.
The model has been based on a decom- position technique that considers simple analysis of a set of single-server queues. The consequence of the analysis is an equation consisting of one unknown var- iable, P, , , processor utilization; it can be solved by using a standard numerical method.
For an asynchronous case, the queueing
network is shown in Figure 8. Processors in the system are modeled as delay servers, and memory modules are modeled as FCFS servers. The bus system is modeled as an FESC’ representing B buses with a single (centralized) queue.
The routing of a packet in the network can be described as follows: A request packet generated by a processor is first put in the central server queue, waiting for an available bus. After it gains access to a bus, the packet joins one of the M memory queues. The memory module that finishes the service of a request again puts the response packet in the central server queue. From there, the response packet gets back t o the requesting processor through a bus. To this point, the packet finishes one rotation through the network, and the processor resumes its background activity. The model can be solved using any standard product-form algorithm, considering the bus system queue as a load- dependent server.’
In the case of a decentralized control, the actual implementation can be either token bus or daisy chain bus. Due t o the lack of central controller, the analysis of decentralized packet-switching multiple- bus systems is very complicated. The FCFS service discipline is not valid for bus system queue in this case. The service dis- cipline depends on the position of tokens with respect to the positions of requesting devices.
The exact solution for such a system seems infeasible, but one method for approximating the behavior of the system is to use hierarchical modeling tech-
February 1989 33
Table 3. Summary of multiple- bus analyses.
I
~ Workload representation Request rate Processor think Request rate Processor think time time
1 Performance parameters BW or P , Throughput PI, i or p,, I
Fair Good Good Fair I
I 1 Computation cost Low Moderate Low, but iteration
Moderate I
Table 4. Summary of hardware features of the three INS.
Cro5Fbar MlNs Multiple-bus
N o switches N*M NlogN B*(N+M) or connection5
1 Lodd of buses N I B
I NO of wire5 M N B
!
I !
i arbiters M I-of-N arbiten 1 M I-of-N arbiter5 M o g N I-of-2 I B-of-Mand
Fault-tolerant ~ and expansion
Fair Poor, but fair with additional hardware
Good
niques." As in the previous case, the bus system is represented by FESC (Figure 8) with the service rate obtained by shorting out the processors and the memory mod- ules. The model is then solved by using the mean value analysis algorithm.'
Numerical results obtained from the models have shown that packet switching reduces the communication bottlcneck of shared bus systems. '' Table 3 summarizes analyses of different categories of multiple-bus systems.
Comparison and discussions
As indicated in the previous sections, the three types of interconnection networks possess different hardware features and different system performances. In this sec- tion, we will look into these differences
quantitatively. In particular, we will com- pare the hardware cost and system perfor- mance of the three interconnection networks.
Table 4 lists selective hardware features of the three networks. As we already know, the number of switching elements used in an N x M crossbar is N x M in contrast to Nlog N o f MINs. The number of connections necessary in an N x M x B multiple-bus system is proportional to R(N + M). Since each bus in the multiple- bus system needs to drive N + Mmodules, the bus load is proportional to N + M , while the bus load of an MIN is one due to the one-to-one connection.
All three of these networks require cer- tain types of arbiters to resolve the request conflicts. In a crossbar network, M N- users 1-server arbiters are necessary, each of which selects one of up to N outstand- ing requests for a memory during a mem-
ory cycle. The MINs, on the other hand, require two 2-user I-server arbiters for each switching element for ( N / 2 ) l o g z N switches.
In a multiple-bus system, an M-users B- servers arbiter is needed to assign the B buses to the outstanding requests. Once a bus is granted to a memory, only one of the processors that requests the memory can proceed while the others, if any, are delayed. This choice is implemented by an N-users I-server arbiter. Thus, a multiple- bus system requires M + 1 arbiters, one arbiter of the M-users B-servers type and Marbi te rs of the N-users I-server type.
Expandability and reliability are two other very important hardware features. In this context, a multiple-bus system shows its advantages over the other two because of its reconfigurability and multiple-data paths between every proces- sor and memory. I t can still operate in a
34 COMPUTER
Prob. of Acceptance ( P A )
t
0.0
p - 1.0
I I I I b
Figure 9. Probability of acceptance as a function of system size for synchronous circuit-switched systems.
degraded mode after the failure of a sub- set of the buses.
A lot of research has gone into the reconfigurable and fault-tolerant MINs. l o
The fault-tolerance of a MIN can be real- ized by adding additional hardware such as extra stages or duplicated data paths. I t is easier to reconfigure a crossbar than an MIN. In case of a fault, a particular row or a column in Figure 3 can be removed and the network can operate in a degraded mode.
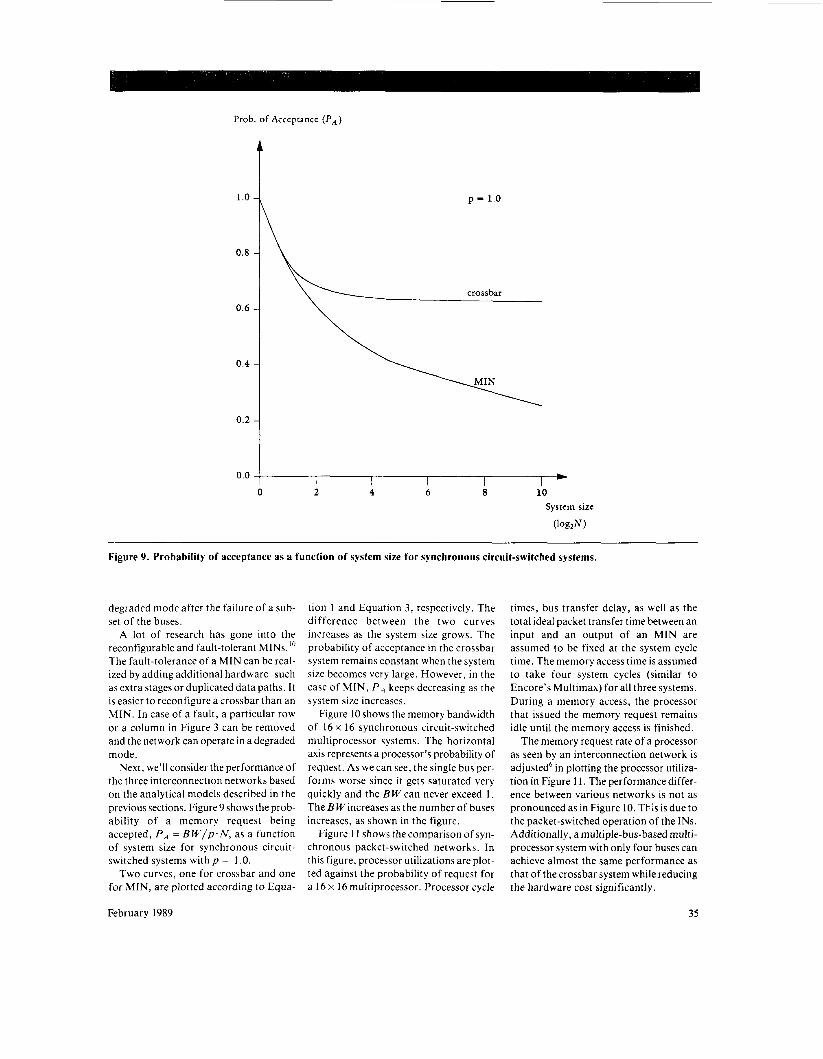
Next, we’ll consider the performance of the three interconnection networks based on the analytical models described in the previous sections. Figure 9 shows the prob- ability of a memory request being accepted, PA = B W / p . N , as a function o f system size for synchronous circuit- switched systems with p = 1 .O.
Two curves, one for crossbar and one for MIN, are plotted according to Equa-
tion 1 and Equation 3, respectively. The difference between the two curves increases as the system size grows. The probability of acceptance in the crossbar system remains constant when the system size becomes very large. However, in the case of MIN, P A keeps decreasing as the system size increases.
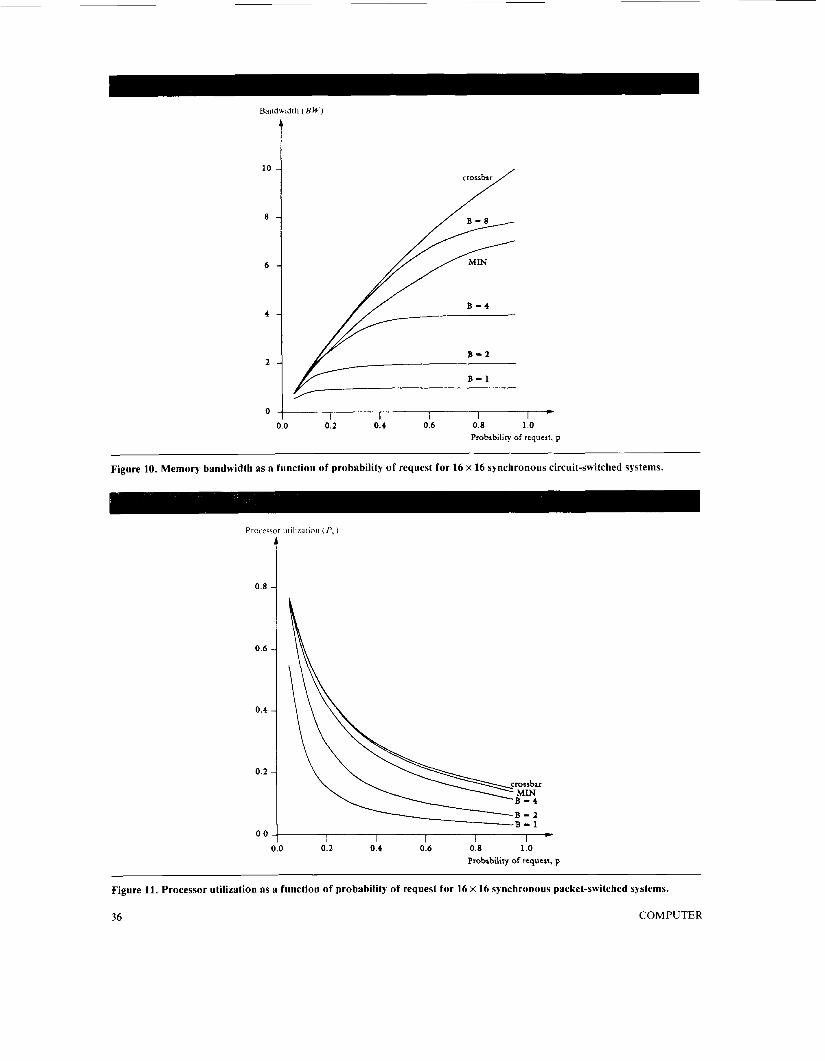
Figure 10 shows the memory bandwidth of 16 x 16 synchronous circuit-switched multiprocessor systems. The horizontal axis represents a processor’s probability of request. As we can see, the single bus per- forms worse since it gets saturated very quickly and the B W can never exceed 1. The BWincreases as the number of buses increases, as shown in the figure.
Figure 11 shows the comparison of syn- chronous packet-switched networks. In this figure, processor utilizations are plot- ted against the probability of request for a 16 x 16multiprocessor. Processor cycle
times, bus transfer delay, as well as the total ideal packet transfer time between an input and an output of an MIN are assumed to be fixed at the system cycle time. The memory access time is assumed to take four system cycles (similar to Encore’s Multimax) for all three systems. During a memory access, the processor that issued the memory request remains idle until the memory access is finished.
The memory request rate of a processor as seen by an interconnection network is adjusted6 in plotting the processor utiliza- tion in Figure I I . The performance differ- ence between various networks is not as pronounced as in Figure 10. This is due to the packet-switched operation of the INS. Additionally, a multiple-bus-based multi- processor system with only four buses can achieve almost the same performance as that of the crossbar system while reducing the hardware cost significantly.
February 1989 35
Bandwidth ( B W )
crossbar /
I I I I I t 0.2 0.4 0.6 0.8 1.0
Probability of rcqucrt, p
Figure 10. Memory bandwidth as a function of probability of request for 16 x 16 synchronous circuit-switched systems.
Proce\
0.8
0.6
0.4
0.2
0.0
utili7atior ( f,,)
I I I 1 - 0.0 0.2 0.4 0.6 0.8 1 .o
Protmbilitv of rcouert D I 1 I .
Figure 11. Processor utilization as a function of probability of request for 16 x 16 synchronous packet-switched systems.
COMPUTER 36
11 the comparisons above apply to synchronous systems based on system cycle. We have intention-
ally avoided comparing asynchronous sys- tems because their performance is so dependent on the input parameters that choosing the wrong parameters might give rise to the wrong conclusions. However, the analytical techniques that can be applied to evaluate those systems are given in this article. The information provided here is useful for predicting the approxi- mate performance of an IN structure before its design and implementation. Fur- ther references and a more detailed survey on the performance evaluation of multi- processor INS can be found in Bhuyan.’
It seems that enough research has already been done in evaluating INS in iso- lation. We strongly feel that more work is needed at the system level that includes the IN as a major component. For example, evaluation of multiprocessor systems with prefetching, bulk data read or write, and solving cache coherence with INS shows promise for future research.
Similarly, task (application) level modeling on multiprocessor architectures might produce some good insight into the trade-offs between computation versus c o m m u n i c a t i o n , low versus la rge granularity, static versus dynamic schedul- ing, etc.
Finally, some actual measurements (traces) should be obtained on real mul- tiprocessors and applied to the analytical models as their input parameters. 0
Acknowledgments
Bhuyan’s research was supported by National Science Foundation grant No. MIP-8807761 and by a grant from the Louisiana Board of Regents. Agrawal’s research was partly sup- ported by US Army Research Office contract NO. DAAG 29-85-K-0236.
References 1 , D.A. Reed and D.C. Grunwald, “The Per-
formance of Multicomputer Interconnec- tion Networks,” Computer, Vol. 20, No. 6, June 1987, pp. 63-73.
2. E.D. Lazowska et al., QuantitativeSystem Performance-Computer System Analysis Using Queueing Network Models, Prentice Hall, Englewood Cliffs, N.J., 1984.
3. L.N. Bhuyan, “An Analysisof Processor- Memory Interconnection Networks, ” IEEE Trans. Computers, Vol. C-34, No. 3, Mar. 1985, pp. 279-283.
4. D.P. Bhandarkar, “Analysis of Memory Interference in Multiprocessors,” IEEE Trans. Computers, Vol. C-24, Sept. 1975, pp. 897-908.
5. L.N. Bhuyan, “Performance Evaluation of Multiprocessor Interconnection Net- works,” Tutorial Note, ACM SIGMetrics Conf., May 1988.
6. D.W. Yen, J .H. Patel, and E.S. Davidson, “Memory Interference in Synchronous Multiprocessor Systems,” IEEE Trans. Computers, Vol. C-31, Nov. 1982, pp. 1,116-1,121.
7. L.N. Bhuyan and D.P. Agrawal, “Design and Performance of Generalized Intercon- nection Networks,” IEEE Trans. Com- puters, V o l . C-32, Dec. 1983, pp. 1,081-1,090.
8. Tse-Yun Feng, “A Survey of Interconnec- tion Networks,” Computer, Vol. 14, No. 12, Dec. 1981, pp. 12-27.
9. J.H. Patel, “Performance of Processor- Memory Interconnections for Multiproces- sors,” IEEE Trans. Computers, Vol . C-30, Oct. 1981, pp. 771-780.
IO. G.B. Adams 111, D.P. Agrawal, and H.J. Siegel, “A Survey and Comparison of Fault-Tolerant Multistage Interconnection Networks,” Computer, Vol. 20, No. 6, June 1987, pp. 14-27.
11. C.P. Kruskal and M. Snir, “The Perfor- mance of Multistage Interconnection Net- works for Multiprocessors,” IEEE Trans. Computers, Vol . ‘2-32, Dec. 1983, pp. 1,091 - 1,098.
12. D.M. Diasand J.R. Jump, “Analysis and Simulation of Buffered Delta Networks,” IEEE Trans. Computers, Vol . (2-30, Apr. 1981, pp. 273-282.
13. T.N. Mudgeet al., “Analysis of Multiple- Bus Interconnection Networks,” J . Paral- leland Distributed Computing, Vol. 3, No. 3, Sept. 1986, pp. 328-343.
14. D. Towsley, “Approximate Models of Mul- tiple Bus Multiprocessor Systems,” IEEE Trans. Computers, Vol. C-35, Mar. 1986, pp. 220-228.
15. Q. Yang, L.N. Bhuyan, and R. Pavaskar, “Performance Analysis of Packet-Switched Multiple-Bus Multiprocessor Systems,” Proc. 8th Real- Time System Symp., Dec. 1987, CS Press, Los Alamitos, Calif., pp. 170- 178.
Laxmi N. Bhuyan is an associate professor at the Center for Advanced Computer Studies at the University of Southwestern Louisiana in Lafayette. His research interests include parallel and distributed computer architecture, perfor- mance and reliability evaluation, and local area networks.
Bhuyan received BS and MS degrees in elec- trical engineering from the Regional Engineer- ing College, Rourkela under Sambalpur University in India. He received a PhD in com- puter engineering from Wayne State University in Detroit in 1982. Bhuyan is a senior member of the IEEE, a distinguished visitor of the IEEE Computer Society, and served as guest editor of the Computer issue on interconnection net- works in June 1987.
I I
Qing Yang is an assistant professor in the Department of Electrical Engineering at the University of Rhode Island. His research interests include parallel and distributed com- puter systems, design of digital systems, perfor- mance evaluation, and local area networks.
Yang received a BSc degree in computer science from Huazhong University of Science and Technology in China in 1982 and an MASc in electrical engineering from the University of Toronto in 1985. He received a PhD in com- puter engineering from the Center for Advanced Computer Studies, University of Southwestern Louisiana. Yang is a member of the IEEE Com- puter Society.
Dharma P. Agrawal is a professor of electrical and computer engineering at North Carolina State University in Raleigh. He is the group leader for the B-Hive multicomputer project at NCSU. His research interests include both soft- ware and hardware aspects of parallel and dis- tributed processing, computer architecture, and fault tolerant computing.
Agrawal received the BE degree from Ravishankar University in India, the ME degree from the University of Roorkee in India, and the DScTech degree in 1975 from the Federal Insti- tute of Technology in Switzerland. He is the author of the tutorial text Advanced Computer Architecture published by the IEEE Computer Society; a member of the’computer Editorial Board; an editor of the Journalof Paralleland Distributed Computing and the International Journal on High-speed Computing; a fellow of the IEEE; a member of the IEEE Computer Society; and a recipient of the society’s Certifi- cate of Appreciation.
Readers may write to Bhuyan at the Center for Advanced Computer Studies, University of Southwestern Louisiana, Lafayette, LA 70504-4330.
February 1989 37