
Design and Implementation of Multistage Interconnection Networks for SoC Networks
11
International Journal of Computer Science, Engineering and Information Technology (IJCSEIT), Vol.2, No.5, October 2012 DOI : 10.5121/ijcseit.2012.2501 1 Design and Implementation of Multistage Interconnection Networks for SoC Networks Mahsa Moazez 1 , Farshad Safaei 2 , Majid Rezazadeh 2 1 Department of Electrical, Computer and IT Engineering, QIAU, Qazvin, IRAN 2 Faculty of ECE, Shahid Beheshti University G.C., Evin 1983963113, Tehran, IRAN [email protected], [email protected], [email protected] Abstract In this paper the focus is on a family of Interconnection Networks (INs) known as Multistage Interconnection Networks (MINs). When it is exploited in Network-on-Chip (NoC) architecture designs, smaller circuit area, lower power consumption, less junctions and broader bandwidth can be achieved. Each MIN can be considered as an alternative for an NoC architecture design for its simple topology and easy scalability with low degree. This paper includes two major contributions. First, it compares the performance of seven prominent MINs (i.e. Omega, Butterfly, Flattened Butterfly, Flattened Baseline, Generalized Cube, Beneš and Clos networks) based on 45nm-CMOS technology and under different types of Synthetic and Trace-driven workloads. Second, a network called Meta-Flattened Network (MFN), was introduced that can decrease the blocking probability by means of reduction the number of hops and increase the intermediate paths between stages. This is also led into significant decrease in power consumption. Keywords System on Chip (SoC), Multistage Interconnection Network (MIN), Performance Evaluation, Flattened Butterfly 1. INTRODUCTION Multiprocessor systems are the only way to achieve high signal processing. The performance evaluation of such systems is dependent on the number of system processors and the access time of each processor to the processing unit. The processors get access to the memory unit through an interconnection network. Multistage interconnection networks (MINs) are a novel approach to implement connections among processors and memory modules. In fact, MINs assign available resources to network components efficiently and cause appropriate trade-off between performance and cost in Networks-on-Chip (NoCs). Furthermore, the bandwidth division is made in the best possible form among different partitions of a MIN with regard to links connectivity [1]. Indeed, a good interconnection design for processors is a key point to evaluate the performance of a system. For example, injection of uniform workload is responded by a linear increment in assigned bandwidth and logarithmic increment in latency proportional to number of nodes [7]. Therefore, a multiprocessor system could be analyzed and evaluated as an NoC using
-
Upload
independent -
Category
Documents
-
view
0 -
download
0
Transcript of Design and Implementation of Multistage Interconnection Networks for SoC Networks

International Journal of Computer Science, Engineering and Information Technology (IJCSEIT), Vol.2, No.5, October 2012
DOI : 10.5121/ijcseit.2012.2501 1
Design and Implementation of Multistage Interconnection Networks for SoC Networks
Mahsa Moazez1, Farshad Safaei
2, Majid Rezazadeh
2
1Department of Electrical, Computer and IT Engineering, QIAU, Qazvin, IRAN
2 Faculty of ECE, Shahid Beheshti University G.C., Evin 1983963113, Tehran, IRAN [email protected], [email protected], [email protected]
Abstract
In this paper the focus is on a family of Interconnection Networks (INs) known as Multistage
Interconnection Networks (MINs). When it is exploited in Network-on-Chip (NoC) architecture designs,
smaller circuit area, lower power consumption, less junctions and broader bandwidth can be achieved.
Each MIN can be considered as an alternative for an NoC architecture design for its simple topology and
easy scalability with low degree. This paper includes two major contributions. First, it compares the
performance of seven prominent MINs (i.e. Omega, Butterfly, Flattened Butterfly, Flattened Baseline,
Generalized Cube, Beneš and Clos networks) based on 45nm-CMOS technology and under different types
of Synthetic and Trace-driven workloads. Second, a network called Meta-Flattened Network (MFN), was
introduced that can decrease the blocking probability by means of reduction the number of hops and
increase the intermediate paths between stages. This is also led into significant decrease in power
consumption.
Keywords
System on Chip (SoC), Multistage Interconnection Network (MIN), Performance Evaluation, Flattened
Butterfly
1. INTRODUCTION
Multiprocessor systems are the only way to achieve high signal processing. The performance
evaluation of such systems is dependent on the number of system processors and the access time
of each processor to the processing unit. The processors get access to the memory unit through an
interconnection network. Multistage interconnection networks (MINs) are a novel approach to
implement connections among processors and memory modules. In fact, MINs assign available
resources to network components efficiently and cause appropriate trade-off between
performance and cost in Networks-on-Chip (NoCs). Furthermore, the bandwidth division is made
in the best possible form among different partitions of a MIN with regard to links connectivity
[1]. Indeed, a good interconnection design for processors is a key point to evaluate the
performance of a system. For example, injection of uniform workload is responded by a linear
increment in assigned bandwidth and logarithmic increment in latency proportional to number of
nodes [7]. Therefore, a multiprocessor system could be analyzed and evaluated as an NoC using

International Journal of Computer Science, Engineering and Information Technology (IJCSEIT), Vol.2, No.5, October 2012
2
MINs [3, 4]. Considering availability of paths to establish new connections, MINs are classified
into three categories: blocking, non-blocking, and re-arrangeable networks [2, 8, 9].
The most obvious problem of MINs is the blocking problem and impossibility of the
implementation of appropriate routing algorithms since there is only a unique path between every
input-output pair. A connection between a free input-output pair is not always available because
of probable conflicts between the existing connections. Hence, in this paper, a novel structure
which referred to as Meta-Flattened Network (MF) is introduced in order to increase the number of
paths between every pair of sources and destinations. By using this structure we can reduce the
likelihood of the blockage using different routing algorithms.
The paper is structured as four major sections. In the first section, MINs are briefly introduced.
Then, the main idea of Dally’s flattened network is proposed [10]. MF-MINs are presented in
Section 3. Finally, the performance of MF-MINs and the conventional MINs are compared in
terms of three parameters; i.e., the power consumption, the message latency, and the network
throughput under both Trace-driven and Synthetic workloads.
2. DELTA NETWORKS
Delta networks were proposed by Patel [10, 11] as an inexpensive alternative for crossbars. They
are composed of sub-networks called Banyan. It is a kind of blocking networks which have self-
routing property. Therefore, a Delta network can be viewed as a fundamental topology for
Omega, Baseline, Butterfly, and Generalized-cube networks structure [1, 2]. Figure 1 illustrates
two popular structures of delta networks.
(a) (b)
Figure 1. (a) Butterfly network; (b) Baseline network

International Journal of Computer Science, Engineering and Information Technology (IJCSEIT), Vol.2, No.5, October 2012
3
(a) (b)
Figure 2. (a) A generic schema of Delta networks; (b) Flattened Delta network
3. META FLATTENED DELTA NETWORK AS AN APPROACH FOR
IMPROVEMENT OF PERFORMANCE
There is no path diversity in Delta networks, which leads to poor performance for inconsistence
workloads. Reduction in the number of stages decreases the number of possible places for
conflict, which consequently brings about increment of the throughput. So, the flattened structure
is proposed for MINs [12, 13]. To create a flattened structure, all of the routers in each level of a
MIN are merged into one router (see Figure 2). This structure reduces the number of hops
between the source and destination nodes. Further, it might reduce the probability of blocking to
zero with the implementation of different types of the routing algorithms.
3.1. Meta Flattened Delta Network (MF)
As it was discussed in the previous sections, MINs facilitated the passage into parallel processing,
but a big challenge in these networks relates to no implementation of routing algorithms as a
result of a unique path in a pair of source and destination nodes. Moreover, a flattened structure
better fit high-radix interconnection networks; however, radix growth increases the complexity of
implementation of a flattened structure exponentially. Since the number of routers, inputs and
outputs and control signals increase, more area is occupied and the complexity of routing
algorithms increases. Hence, the idea of Meta-Flattened (MF) structure for on-chip
interconnection networks presents in order to create parallel processing. Using this structure, the
blocking problem is solved fairly in MINs and the number of hops among sources and
destinations is decreased too. In addition, MF structure is less complex than flattened one and
occupies smaller area.
3.1.1. The sketch
In MF networks, the structure of the first and the last stages remains constant. Also, similar to a
flattened network, the intermediate stages are merged to form a single stage. Two methods can be
adopted to flatten intermediate stages. First, the stages can be flattened in groups of two, which is
mainly applicable to networks with the even number of stages. Second, all intermediate stages

International Journal of Computer Science, Engineering and Information Technology (IJCSEIT), Vol.2, No.5, October 2012
4
can be implemented as a flattened network. In the first method, the router degree is low and it can
be implemented more easily than the second one. In this case, the network structure is more
similar to a MIN rather than a flattened network. In the second approach, the structure is
analogous to the structure of a flattened network. The degree of intermediate stages increases and
the blocking problem mitigates partly comparing with the first method.
(a) (b)
Figure 3. (a) MF-Butterfly; (b) MF-Baseline
3.1.2. MF-Butterfly and MF-Baseline networks
Figures 3(a) and 3(b) represent the organizations of MF-Butterfly and MF-Baseline with 16
inputs, respectively. In these structures, the second and third stages of Butterfly and Baseline
networks in Figure 1 are merged together and are flattened while the first and the last stages
remain unchanged. As shown in this figure, the number of stages is reduced to three. Moreover,
the number of inputs and outputs in the intermediate routers increases.
4. SIMULATION AND RESULTS
Verilog language is used to simulate the proposed structures in this section. Synopsys DC is
utilized to synthesis on-chip with 45nm Nangate technology. All of the designs are simulated at
1.1V supply voltage using Modelsim 6.5b with 16nm CMOS technology. In this simulation, the
following assumptions are made [1, 3-5]:
• There are 32 processors as inputs of the networks
• Wormhole switching [1] is used
• The number of the physical channels and the number of inputs are the same
• The networks performance is compared to each other under six workloads including three
Synthetic [14] (i.e. uniform, exponential, and normal) and three splash Trace-driven
workloads [15] (i.e. FFT, Water-Squared, and Water-Spatial) for all MINs (i.e. Omega,
Butterfly, Baseline, Generalized Cube, Beneš, and Clos). Moreover, we reported the
performance merits of suggested MF networks (i.e. MF-Baseline and MF-Butterfly)
compare with the traditional MINs
• The size of each message is supposed to 2 flits under Synthetic workloads
• In MF Networks, the applied routing algorithm is fortified with the adaptive routing [1]

International Journal of Computer Science, Engineering and Information Technology (IJCSEIT), Vol.2, No.5, October 2012
5
4.1. The power consumption
According to Table 1, the power consumption of networks is different. Omega, Butterfly,
Baseline and Generalized-cube networks have almost the same power consumption. The
difference in their values does not exceed a ten-thousandth of milli Watts (mW) because these
networks have equal number of routers and wires. The only difference among these networks
relates to the permutation of connections among routers. For the same reason, Beneš and Clos
networks have approximately equal power consumption. This is true for MF-Baseline and MF-
Butterfly networks too. Further, the table illustrates that MF networks have less power
consumption compared with conventional Baseline or Butterfly in order to decrease in the stages
despite of the fact that intermediate routers are getting larger.
Table 1. The power consumption of the networks
Power Consumption (mw) Network
168.55 Omega
168.58 Baseline
168.6 Butterfly
168.6 General-cube
300.11 Beneš
300.09 Clos
149.65 Meta-Flattened Baseline
149.66 Meta-Flattened Butterfly
According to the results, the power consumption of MF MINs has 13% improvement versus
MINs ones.
4.2. Message Latency
The network workload refers to the pattern of traffic which is applied at the network terminals
over the time. Understanding and modeling the load is led to design and evaluate networks and
routing functions [1]. Figure 4 shows the abundance of FFT workload. In this figure, horizontal
and vertical axes indicates the node number and the amount of usage that node in inputs and
outputs, respectively. As seen in the figure, nodes 15 and 24 tolerate the most traffic in inputs. On
the other hand, nodes 0 to 3 are most used as the destination of messages. Hence, buffers of these
routers become more congested and this leads to increase in the total message latency.
Frequency of nodes in FFT workload for input
0
10
20
30
40
50
60
70
80
0000 1111 2222 3333 4444 5555 6666 7777 8888 9999 10101010 11111111 12121212 13131313 14141414 1515151516161616 17171717 18181818 19191919 2020202021212121 2222222223232323 24242424 2525252526262626 2727272728282828 29292929 3030303031313131
Node No.
Frequency
Frequency of nodes in FFT workload for output
0
20
40
60
80
100
120
0 1 2 3 4 5 6 7 8 9 10 11 12 1314 15 16 1718 19 20 2122 2324 2526 27 28 2930 31
Node No.
Frequency
(a) (b)
Figure 4. The frequency of the nodes in FFT workload; (a) input nodes; (b) output nodes

International Journal of Computer Science, Engineering and Information Technology (IJCSEIT), Vol.2, No.5, October 2012
6
Figure 5 shows the traffic distribution over the inputs and outputs for Water-Nsquared workload.
Due to the traffic distribution, nodes 16 and 23 are most selected nodes as the source and
destination of messages while the others have the same conditions.
Frequency of nodes in water-nsquared for input
0
50
100
150
200
250
0 1 2 3 4 5 6 7 8 9 10 11121314 151617181920 21222324252627282930 31
Node No.
Frequency
Frequency of nodes in water-nsquared for output
0
50
100
150
200
250
0 1 2 3 4 5 6 7 8 9 10 11121314 151617181920 21222324252627282930 31
Node No.
Frequency
(a) (b)
Figure 5. The frequency of the nodes in Water-Nsquared workload; (a) input nodes; (b) output
nodes
Figure 6 represents the traffic distribution over the inputs and outputs for exponential workload.
As we can see, this traffic is distributed equally among all the nodes throughout the networks.
The message latency is increased due to increase the number of messages with high hop count.
Frequency of nodes in Expotential traffic for input
0
10
20
30
40
50
0 1 2 3 4 5 6 7 8 9 10 11121314 151617 181920 21222324 2526 27282930 31
Node No.
Frequency
Frequency of nodes in Expotential traffic for output
0
5
10
15
20
25
30
35
0 1 2 3 4 5 6 7 8 9 10 11121314 151617181920 212223242526 27282930 31
Node No.
Frequency
(a) (b)
Figure 6. The frequency of the nodes in Exponential workload; (a) input nodes; (b) output nodes
Figures 7 to 10 exhibit the network latency under different workloads. The latency for various
networks operating under different workloads is of different values. For example, in MF-Baseline
network, there are routers with two and six I/O numbers and this difference in the number of I/Os
is an important factor which determines the latency of the network under various types of
workloads. MF-Butterfly network is similar to MF-Baseline network, but all intermediate routers
are similar to each other and have the same number of inputs and outputs.
In Figure 7, the message latency for different networks under Trace-driven workloads are
demonstrated. It shows the average message latency for FFT, Water-Nsquared, and Water-Spatial
workloads. Under FFT workload, the latency of MF networks is near to the conventional MINs.
As we addressed (see Figure 4), the frequency of nodes 2, 15, 23, 24, 26 is more than the other
nodes under this workload. The nodes belong to the routers with minimum inputs and outputs

International Journal of Computer Science, Engineering and Information Technology (IJCSEIT), Vol.2, No.5, October 2012
7
which tolerate the maximum traffic; hence the flits of the message must expend more time to
cross over them and it leads to increase of total message latency. So, compared to the traditional
MINs a significant improvement in the latency is perceived for MF networks.
0
500
1000
1500
2000
2500
Workload
Message Latency (Cycles)
BaselineBaselineBaselineBaseline
BenesBenesBenesBenes
ButterflyButterflyButterflyButterfly
ClosClosClosClos
G_CubeG_CubeG_CubeG_Cube
OmegaOmegaOmegaOmega
MFBaselineMFBaselineMFBaselineMFBaseline
MFButterflyMFButterflyMFButterflyMFButterfly
FFT Water-nsquared Water-spatial
Figure 7. The message latency of the networks under Trace-driven workloads
Figure 8 demonstrates the message latency under Exponential workload. MF-Butterfly network
has the minimum latency and Beneš network has the maximum latency in order to have several
stages among the networks. The reason of the proper operation of MF networks under this
workload is related to usage of the same nodes in inputs and outputs. This phenomenon reflects
the impact of the several paths for inputs and outputs and improvement of MF networks
operation.
0
200
400
600
800
1000
1200
1400
1600
0 0.2 0.4 0.6 0.8 1
Traffic Rate
Latency (Cycles)
BaselineBaselineBaselineBaseline
BenesBenesBenesBenes
ButterflyButterflyButterflyButterfly
ClosClosClosClos
G_CubeG_CubeG_CubeG_Cube
OmegaOmegaOmegaOmega
MFBaselineMFBaselineMFBaselineMFBaseline
MFButterflyMFButterflyMFButterflyMFButterfly
Figure 8. The message latency of the networks under Exponential workload
Similarly, Figure 9 exhibits the message latency under Uniform workload. In this traffic, MF-
Baseline has shown minimum latency compared with the other networks. Gradually, when the
traffic volume increases the message latency lengthens too, even longer than the conventional
MINs. The reason of the better performance refers to the irregular structure of the network and
difference in the number of inputs and outputs routers. For example, there are routers with 6
inputs and 4 outputs, also routers with 3 inputs and 3 outputs. Hence, messages must wait in
queues to traverse the network. But, routers of MF-Butterfly network have regular structure and
the latency improves considerably.

International Journal of Computer Science, Engineering and Information Technology (IJCSEIT), Vol.2, No.5, October 2012
8
0
200
400
600
800
1000
1200
1400
1600
1800
0 0.2 0.4 0.6 0.8 1
Traffic Rate
Latency (Cycles)
BaselineBaselineBaselineBaseline
BenesBenesBenesBenes
ButterflyButterflyButterflyButterfly
ClosClosClosClos
G_CubeG_CubeG_CubeG_Cube
OmegaOmegaOmegaOmega
MFBaselineMFBaselineMFBaselineMFBaseline
MFButterflyMFButterflyMFButterflyMFButterfly
Figure 9. The message latency of the networks under Uniform workload
Figure 10 compares the message latency of MINs under Normal workload. Baseline network has
minimum latency among MINs. Despite the same structure of the routers in conventional MINs,
network structure has a key role on the performance parameters. Moreover, MF networks have
little difference in the performance compared with the conventional MINs because the volume of
the traffic is over the nodes which have minimum inputs and outputs. Under this workload, MF-
Butterfly network has the best performance because of its regular structure and the path diversity
between every input-output pair.
0
200
400
600
800
1000
1200
1400
0 0.2 0.4 0.6 0.8 1
Traffic Rate
Latency (Cycles)
ButterflyButterflyButterflyButterfly
BaselineBaselineBaselineBaseline
BenesBenesBenesBenes
ClosClosClosClos
G_CubeG_CubeG_CubeG_Cube
OmegaOmegaOmegaOmega
MFBaselineMFBaselineMFBaselineMFBaseline
MFButterflyMFButterflyMFButterflyMFButterfly
Figure 10. The message latency of the networks under Normal workload
4.3. Throughput Evaluation
Figures 11 to 14 show the throughput of different networks under various workloads. In Figure
11, the throughput of Trace-driven workloads is illustrated. In this figure, horizontal axis
indicates the type of workload and the vertical axis represents the throughput. As explained in the
previous section, under Water-Nsquared workload, MF-Baseline has minimum latency while in

International Journal of Computer Science, Engineering and Information Technology (IJCSEIT), Vol.2, No.5, October 2012
9
Generalized-cube network the same number of flits has been crossed in the longer period of time.
Furthermore, under Water-Spatial workload, MF-Butterfly network has increase of 30% in the
throughput compared with Butterfly network in order to decrease the number of hops and the
number of paths between each input-output pair.
0
0.1
0.2
0.3
0.4
0.5
0.6
0.7
0.8
0.9
1
Workload
#Fllits/Cycle
BaselineBaselineBaselineBaseline
BenesBenesBenesBenes
ButterflyButterflyButterflyButterfly
ClosClosClosClos
G_CubeG_CubeG_CubeG_Cube
OmegaOmegaOmegaOmega
MFBaselineMFBaselineMFBaselineMFBaseline
MFButterflyMFButterflyMFButterflyMFButterfly
FFT Water-nsquared Water-spatial
Figure 11. The throughput of the networks under Trace-driven workloads
Figure 12 shows the throughput under Exponential workload. The horizontal axis represents the
traffic rate and the vertical axis shows the throughput. The performance of networks under this
workload is inversely proportional to the message latency; In other words, the network which has
the lowest latency shows a greater throughput. As can be seen in this figure, for traffic rate of 0.4,
the throughput increases with a lower slope, then it increases with an appropriate slope. The
reason of such behavior refers to increase of the traffic volume that causes the routers can tolerate
larger amount of traffic and the messages have to wait more cycles in the queues.
0
10
20
30
40
50
60
0 0.2 0.4 0.6 0.8 1
Traffic Rate
# Flits/Cycle
BaselineBaselineBaselineBaselineBenesBenesBenesBenesButterflyButterflyButterflyButterflyClosClosClosClosG_CubeG_CubeG_CubeG_CubeOmegaOmegaOmegaOmegaFMBaselineFMBaselineFMBaselineFMBaselineFMButterflyFMButterflyFMButterflyFMButterfly
Figure 12. The throughput of the networks under Exponential workload
International Journal of Computer Science, Engineering and Information Technology (IJCSEIT), Vol.2, No.5, October 2012
10
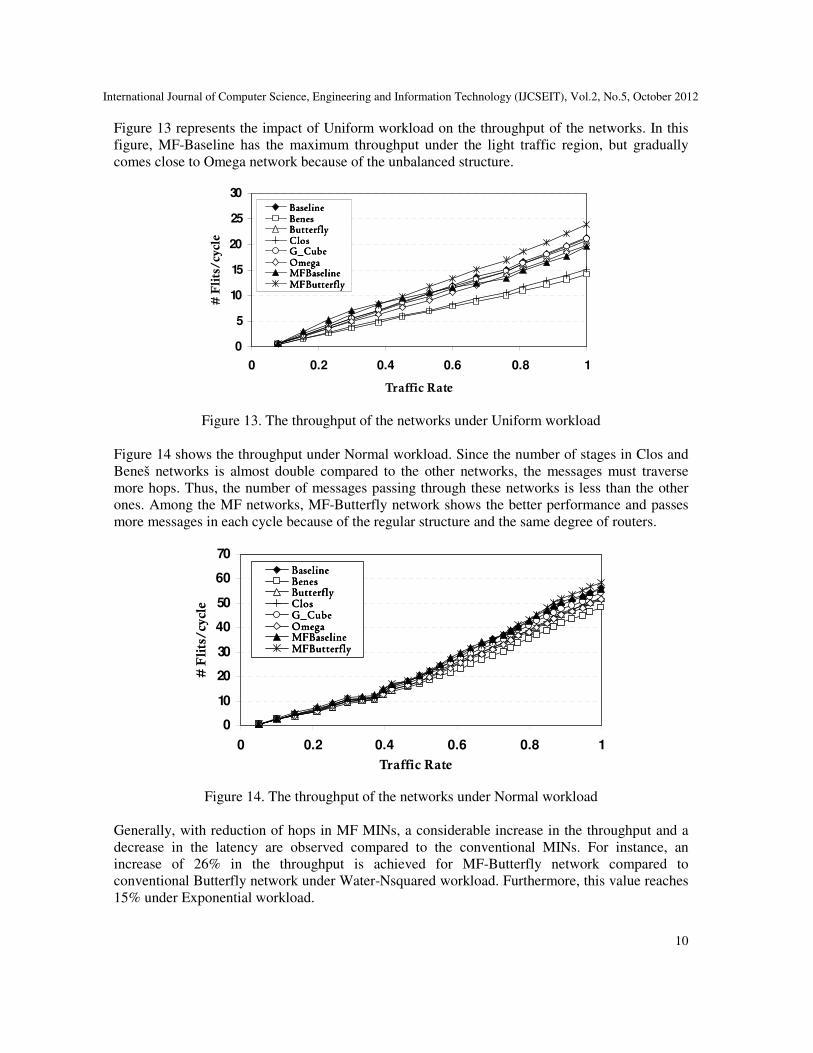
Figure 13 represents the impact of Uniform workload on the throughput of the networks. In this
figure, MF-Baseline has the maximum throughput under the light traffic region, but gradually
comes close to Omega network because of the unbalanced structure.
0
5
10
15
20
25
30
0 0.2 0.4 0.6 0.8 1
Traffic Rate
# Flits/cycle
BaselineBaselineBaselineBaselineBenesBenesBenesBenesButterflyButterflyButterflyButterflyClosClosClosClosG_CubeG_CubeG_CubeG_CubeOmegaOmegaOmegaOmegaMFBaselineMFBaselineMFBaselineMFBaselineMFButterflyMFButterflyMFButterflyMFButterfly
Figure 13. The throughput of the networks under Uniform workload
Figure 14 shows the throughput under Normal workload. Since the number of stages in Clos and
Beneš networks is almost double compared to the other networks, the messages must traverse
more hops. Thus, the number of messages passing through these networks is less than the other
ones. Among the MF networks, MF-Butterfly network shows the better performance and passes
more messages in each cycle because of the regular structure and the same degree of routers.
0
10
20
30
40
50
60
70
0 0.2 0.4 0.6 0.8 1
Traffic Rate
# Flits/cycle
BaselineBaselineBaselineBaselineBenesBenesBenesBenesButterflyButterflyButterflyButterflyClosClosClosClosG_CubeG_CubeG_CubeG_CubeOmegaOmegaOmegaOmegaMFBaselineMFBaselineMFBaselineMFBaselineMFButterflyMFButterflyMFButterflyMFButterfly
Figure 14. The throughput of the networks under Normal workload
Generally, with reduction of hops in MF MINs, a considerable increase in the throughput and a
decrease in the latency are observed compared to the conventional MINs. For instance, an
increase of 26% in the throughput is achieved for MF-Butterfly network compared to
conventional Butterfly network under Water-Nsquared workload. Furthermore, this value reaches
15% under Exponential workload.

International Journal of Computer Science, Engineering and Information Technology (IJCSEIT), Vol.2, No.5, October 2012
11
5. CONCLUSIONS
One of the fundamental problems in Multi-Stage Interconnection Networks (MINs) is the
occurrence of blocking and impossibility of the implementation of appropriate routing algorithms.
In this paper, we proposed a novel structure named to Meta-Flattened MIN (MF-MIN) which is
able to overcome such problems as well. The suggested structure synthesized with aid of
simulation results under Trace-driven and Synthetic workloads. It was shown that the proposed
structure is able to largely improve the important performance parameters compared with MINs.
The path diversity in each NoC makes it potentially to tolerate faults and failures. However, the
occurrence of faults and failures in a network leads to the loss of the global information-carrying
ability. This issue provides a much fuller characterization of the vulnerability of the networks. In
future work, we will aim to propose metrics to estimate the vulnerability of introduced
architecture in the presence of faults.
REFERENCES
[1] W. J. Dally and B. Towlesm, Principles and practices of Interconnection Networks, Morgan
Kaufmann, San Francisco, CA, 2004.
[2] J. Duato, S. Yalamanchili, L.M. Ni, Interconnection networks: An engineering approach, Morgan
Kaufmann Publishers, 2003.
[3] T. Bjerregaard and S. Mahadevan, “A Survey of Research and Practices of Network-on-Chip,” ACM
Computing Surveys, Vol. 38, Issue 1, No.1, March 2006.
[4] A. Agarwal, C. Iskander R. Shankar, “Survey of Network on Chip (NoC) Architectures &
Contributions”, Journal of Engineering computing and architecture, Vol. 3, Issue 1, 2009.
[5] S. Kumar, A.Jantsch, J.-P.Soininen and M.Forsell, “A network on chip architecture and design
methodology,” IEEE Computer Society Annual Symposium on VLSI, August 2002, pp. 105-112.
[6] E. Salminen, A. Kulmala, T. D. Hamalainen, “Survey of Network-on-chip Proposals,” White Paper,
OCP-IP, March 2008.
[7] J. Garofalakis and E. Stergiou,”Mechanisms and analysis for supporting multicast traffic by using
multilayer multistage interconnection networks,” International Journal of Network Management, Vol.
21, Issue 2, September 2010.
[8] J. Kim, W. J. Dally, D. Abts, “Adaptive routing in high radix Clos network,” Proceedings of the 2006
ACM/IEEE conference on Supercomputing (SC’06), 2006.
[9] C. Clos, “A study of non-blocking switching networks,” Bell System Tech. Journal, Vol.32, No. 2,
1953, pp. 406-424.
[10] J. H. Patel, “Processor-memory Interconnections for Multiprocessors,” 6th Annual Symposium on
Computer Arch. NewYork, 1979, pp. 168-177.
[11] J. H. Patel, “Performance of processor-memory interconnections for Multiprocessors,” IEEE. Trans.
On Computer, Vol. 30, No. 10, pp. 771-780, 1981.
[12] J. Kim and W.J. Dally, “Flattened butterfly: A cost-efficient topology for high-radix networks,” ISCA
'07 Proceedings of the 34th annual international symposium on Computer architecture, Vol. 35, Issue
2, May 2007.
[13] H.Ahmadi and W.E.Denzal, “A survey of modern high-Performance switching htechniques,” IEEE
Journal on Selected Areas in Communications, Vol.7, September 1988, PP.1091-1103
[14] L. Tedesco, et al, “Traffic Generation and Performance Evaluation for Mesh-Base NoCs,” SBCCI '05
Proceedings of the 18th annual symposium on Integrated circuits and system design, September 2005,
pp. 184-189.
[15] SPLASH-2, 2008 [Online], Available: http://www-flash.stanford.edu/apps/SPLASH.