
Power saving in regular interconnection networks
17
Power saving in regular interconnection networks q Marina Alonso a , Salvador Coll b,⇑ , Juan-Miguel Martínez a , Vicente Santonja a , Pedro López a , José Duato a a Department of Computer Engineering, Universidad Politécnica de Valencia, 46022 Valencia, Spain b Department of Electronic Engineering, Universidad Politécnica de Valencia, 46022 Valencia, Spain article info Article history: Received 18 September 2009 Received in revised form 1 June 2010 Accepted 12 August 2010 Available online 25 August 2010 Keywords: Power saving Interconnection networks Routing abstract The high level of computing power required for some applications can only be achieved by multiprocessor systems. These systems consist of several processors that communicate by means of an interconnection network. The huge increase both in size and complexity of high-end multiprocessor systems has triggered up their power consumption. Complex cooling systems are needed, which, in turn, increases power consumption. Power con- sumption reduction techniques are being applied everywhere in computer systems and the interconnection network is not an exception, as its contribution is not negligible. In this paper, we propose a mechanism to reduce interconnect power consumption that combines two alternative techniques: (i) dynamically switching on and off network links as a function of traffic (any link can be switched off, provided that network connectivity is guaranteed), (ii) dynamically reducing the available network bandwidth when traffic becomes low. In both cases, the topology of the network is not modified. Therefore, the same routing algorithm can be used regardless of the power saving actions taken, thus sim- plifying router design. Our simulation results show that the network power consumption can be greatly reduced, at the expense of some increase in latency. However, the achieved power reduc- tion is always higher than the latency penalty. Ó 2010 Elsevier B.V. All rights reserved. 1. Introduction Many compute-intensive applications require a huge amount of processing power. This can only be achieved with mas- sively parallel computers. The increased transistor densities and the use of very high clock frequencies have led to very high power consumption where both problems of current supply and heat dissipation have to be addressed. The interconnection network used in these systems has been considered as one of the key factors to achieve high performance. Hence, a lot of research effort has been made in order to increase interconnection network performance. However, as power consumption has arisen as an important problem in current multiprocessor systems, it must be also considered in the interconnect design of these machines. In fact, interconnection networks consume a significant fraction of total system power, with the link cir- cuitry being the main source of power consumption. As a reference, the integrated router and links of the Alpha 21364 microprocessor consume about 20% of the total power (23 W out of 125 W), where 58% of this power is consumed in the link circuitry [19]. Similar metrics are obtained for an IBM InfiniBand 8-port 12X switch, where the links take up to 65% 0167-8191/$ - see front matter Ó 2010 Elsevier B.V. All rights reserved. doi:10.1016/j.parco.2010.08.003 q This work has been jointly supported by the Spanish MEC and European Commission FEDER funds under grants Consolider Ingenio-2010 CSD2006- 00046, TIN2006-15516-C04-01 and by European Commission SARC integrated project #27648 (FP6). ⇑ Corresponding author. E-mail addresses: [email protected] (M. Alonso), [email protected] (S. Coll), [email protected] (J.-M. Martínez), [email protected] (V. Santonja), [email protected] (P. López), [email protected] (J. Duato). Parallel Computing 36 (2010) 696–712 Contents lists available at ScienceDirect Parallel Computing journal homepage: www.elsevier.com/locate/parco
-
Upload
independent -
Category
Documents
-
view
0 -
download
0
Transcript of Power saving in regular interconnection networks
Parallel Computing 36 (2010) 696–712
Contents lists available at ScienceDirect
Parallel Computing
journal homepage: www.elsevier .com/ locate /parco
Power saving in regular interconnection networks q
Marina Alonso a, Salvador Coll b,⇑, Juan-Miguel Martínez a, Vicente Santonja a,Pedro López a, José Duato a
a Department of Computer Engineering, Universidad Politécnica de Valencia, 46022 Valencia, Spainb Department of Electronic Engineering, Universidad Politécnica de Valencia, 46022 Valencia, Spain
a r t i c l e i n f o
Article history:Received 18 September 2009Received in revised form 1 June 2010Accepted 12 August 2010Available online 25 August 2010
Keywords:Power savingInterconnection networksRouting
0167-8191/$ - see front matter � 2010 Elsevier B.Vdoi:10.1016/j.parco.2010.08.003
q This work has been jointly supported by the Sp00046, TIN2006-15516-C04-01 and by European Co⇑ Corresponding author.
E-mail addresses: [email protected] (M. [email protected] (P. López), [email protected]
a b s t r a c t
The high level of computing power required for some applications can only be achieved bymultiprocessor systems. These systems consist of several processors that communicate bymeans of an interconnection network. The huge increase both in size and complexity ofhigh-end multiprocessor systems has triggered up their power consumption. Complexcooling systems are needed, which, in turn, increases power consumption. Power con-sumption reduction techniques are being applied everywhere in computer systems andthe interconnection network is not an exception, as its contribution is not negligible.
In this paper, we propose a mechanism to reduce interconnect power consumption thatcombines two alternative techniques: (i) dynamically switching on and off network links asa function of traffic (any link can be switched off, provided that network connectivity isguaranteed), (ii) dynamically reducing the available network bandwidth when trafficbecomes low. In both cases, the topology of the network is not modified. Therefore, thesame routing algorithm can be used regardless of the power saving actions taken, thus sim-plifying router design.
Our simulation results show that the network power consumption can be greatlyreduced, at the expense of some increase in latency. However, the achieved power reduc-tion is always higher than the latency penalty.
� 2010 Elsevier B.V. All rights reserved.
1. Introduction
Many compute-intensive applications require a huge amount of processing power. This can only be achieved with mas-sively parallel computers. The increased transistor densities and the use of very high clock frequencies have led to very highpower consumption where both problems of current supply and heat dissipation have to be addressed. The interconnectionnetwork used in these systems has been considered as one of the key factors to achieve high performance. Hence, a lot ofresearch effort has been made in order to increase interconnection network performance. However, as power consumptionhas arisen as an important problem in current multiprocessor systems, it must be also considered in the interconnect designof these machines. In fact, interconnection networks consume a significant fraction of total system power, with the link cir-cuitry being the main source of power consumption. As a reference, the integrated router and links of the Alpha 21364microprocessor consume about 20% of the total power (23 W out of 125 W), where 58% of this power is consumed in thelink circuitry [19]. Similar metrics are obtained for an IBM InfiniBand 8-port 12X switch, where the links take up to 65%
. All rights reserved.
anish MEC and European Commission FEDER funds under grants Consolider Ingenio-2010 CSD2006-mmission SARC integrated project #27648 (FP6).
nso), [email protected] (S. Coll), [email protected] (J.-M. Martínez), [email protected] (V. Santonja),(J. Duato).
M. Alonso et al. / Parallel Computing 36 (2010) 696–712 697
of the total power (20 W out of 31 W) [3]. In a Terabit Internet router, the power consumed by the interconnection networkcircuitry is about a third of the power dissipated by the entire line card [24]. Greater power consumption requires sophis-ticated high temperature dissipation mechanisms. Furthermore, the probability of certain failures increases withtemperature.
All these aspects emphasize the importance of controlling power consumption in the system as a whole and, in particular,in the interconnection network. In fact, a novel initiative has recently started to raise awareness on the importance of energyefficiency in the supercomputing field [1].
In this paper, we present a new mechanism to reduce network power consumption in systems that use regular topologiesbuilt with high-degree switches.
On the one hand, regular topologies, in particular 3-D tori, hold a prevalent position as the preferred interconnects for themost powerful supercomputers. A close look to the TOP500 list [7] shows that, as the position in the list gets closer to the top,the fraction of computers based on regular interconnect topologies increases: 30% for the top 100, 80% for the top 10. As net-work size increases, the length of wires and wiring complexity also increases. By using regular direct topologies (e.g. 2-D/3-Dtori or meshes) large networks can be built without compromising neither wire length nor wiring complexity. For instance,the recently announced SGI Altix ICE 8200 uses an InfiniBand based 3-D torus to interconnect up to 32 K processors [6].
On the other hand, there are available commercial switches with large number of high speed ports. For instance, Mellanoxoffers InfiniBand switches with 36 ports at 40 Gb/s [4]; and Myricom has crossbar switches with up to 32 ports [5]. In thedesign of regular interconnects, the availability of high-degree switches allows the designer to implement the links in eachdimension with several physical channels in parallel. Indeed, narrow physical channels (e.g. serial channels) can be com-bined to work as a single wider physical link (thus increasing channel bandwidth) or can be used as parallel independentlinks to increase the number of paths in the network thus increasing routing flexibility (interconnecting switches by severallinks in parallel is commonly known as port trunking, inter-switch link trunking or link aggregation). Even a combination ofboth approaches is possible. For instance, four InfiniBand 1X ports can be combined to work as 4X ports which, in turn, formtrunk links composed of four 4X links.
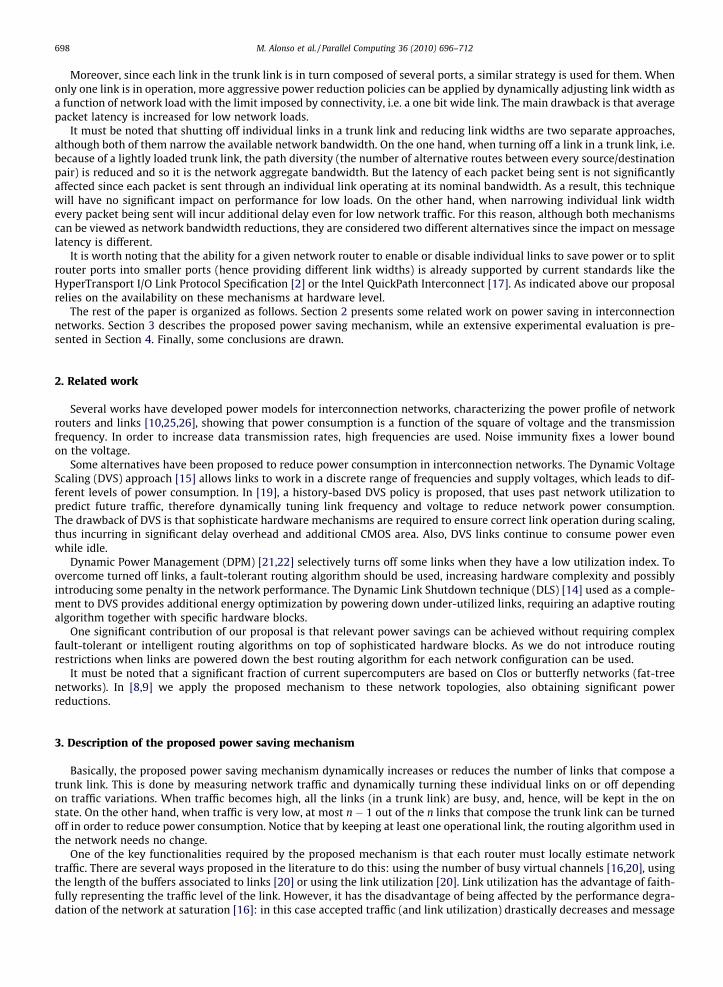
Fig. 1 shows an example of a 2-D mesh where switches are connected by four links, each of them composed of four portsworking as a single link. By using trunking in every link of the network, there are several physical replicas of the topology.Link trunking clearly adds routing flexibility, as the number of routing options is strongly increased, thus improving through-put and reducing congestion. On the other hand, if several narrow links are combined into a wide link, the number of routingoptions is reduced, but link bandwidth is increased, which reduces packet latency.
Although it is important to have a network that offers a good connectivity to the applications that have high inter-processcommunication demands, not always this high bandwidth is needed. Vetter and Mueller show that applications that scalemost efficiently to large numbers of processors use point-to-point communications where the average number of distinctdestinations is relatively small [23]. This provides strong evidence that many application communication topologies exercisea small fraction of the resources provided by the network [18]. Moreover, traffic in an interconnection network exhibits largespatial and temporal variance, leading to inactivity periods at several links in the network [21].
Our proposal considers this scenario, where the availability of high degree switches is exploited to obtain a balance be-tween routing flexibility and available bandwidth. The mechanism presented in this paper is based on turning on and offindividual links of the network according to their utilization, with the particular characteristic that trunk links are nevercompletely switched off. Thus, the basic connectivity throughout the network is not affected and the same routing algorithmcan be used regardless of the power consumption level, which simplifies the router design.
Fig. 1. 2-D mesh with four 4� links per trunk link.
698 M. Alonso et al. / Parallel Computing 36 (2010) 696–712
Moreover, since each link in the trunk link is in turn composed of several ports, a similar strategy is used for them. Whenonly one link is in operation, more aggressive power reduction policies can be applied by dynamically adjusting link width asa function of network load with the limit imposed by connectivity, i.e. a one bit wide link. The main drawback is that averagepacket latency is increased for low network loads.
It must be noted that shutting off individual links in a trunk link and reducing link widths are two separate approaches,although both of them narrow the available network bandwidth. On the one hand, when turning off a link in a trunk link, i.e.because of a lightly loaded trunk link, the path diversity (the number of alternative routes between every source/destinationpair) is reduced and so it is the network aggregate bandwidth. But the latency of each packet being sent is not significantlyaffected since each packet is sent through an individual link operating at its nominal bandwidth. As a result, this techniquewill have no significant impact on performance for low loads. On the other hand, when narrowing individual link widthevery packet being sent will incur additional delay even for low network traffic. For this reason, although both mechanismscan be viewed as network bandwidth reductions, they are considered two different alternatives since the impact on messagelatency is different.
It is worth noting that the ability for a given network router to enable or disable individual links to save power or to splitrouter ports into smaller ports (hence providing different link widths) is already supported by current standards like theHyperTransport I/O Link Protocol Specification [2] or the Intel QuickPath Interconnect [17]. As indicated above our proposalrelies on the availability on these mechanisms at hardware level.
The rest of the paper is organized as follows. Section 2 presents some related work on power saving in interconnectionnetworks. Section 3 describes the proposed power saving mechanism, while an extensive experimental evaluation is pre-sented in Section 4. Finally, some conclusions are drawn.
2. Related work
Several works have developed power models for interconnection networks, characterizing the power profile of networkrouters and links [10,25,26], showing that power consumption is a function of the square of voltage and the transmissionfrequency. In order to increase data transmission rates, high frequencies are used. Noise immunity fixes a lower boundon the voltage.
Some alternatives have been proposed to reduce power consumption in interconnection networks. The Dynamic VoltageScaling (DVS) approach [15] allows links to work in a discrete range of frequencies and supply voltages, which leads to dif-ferent levels of power consumption. In [19], a history-based DVS policy is proposed, that uses past network utilization topredict future traffic, therefore dynamically tuning link frequency and voltage to reduce network power consumption.The drawback of DVS is that sophisticate hardware mechanisms are required to ensure correct link operation during scaling,thus incurring in significant delay overhead and additional CMOS area. Also, DVS links continue to consume power evenwhile idle.
Dynamic Power Management (DPM) [21,22] selectively turns off some links when they have a low utilization index. Toovercome turned off links, a fault-tolerant routing algorithm should be used, increasing hardware complexity and possiblyintroducing some penalty in the network performance. The Dynamic Link Shutdown technique (DLS) [14] used as a comple-ment to DVS provides additional energy optimization by powering down under-utilized links, requiring an adaptive routingalgorithm together with specific hardware blocks.
One significant contribution of our proposal is that relevant power savings can be achieved without requiring complexfault-tolerant or intelligent routing algorithms on top of sophisticated hardware blocks. As we do not introduce routingrestrictions when links are powered down the best routing algorithm for each network configuration can be used.
It must be noted that a significant fraction of current supercomputers are based on Clos or butterfly networks (fat-treenetworks). In [8,9] we apply the proposed mechanism to these network topologies, also obtaining significant powerreductions.
3. Description of the proposed power saving mechanism
Basically, the proposed power saving mechanism dynamically increases or reduces the number of links that compose atrunk link. This is done by measuring network traffic and dynamically turning these individual links on or off dependingon traffic variations. When traffic becomes high, all the links (in a trunk link) are busy, and, hence, will be kept in the onstate. On the other hand, when traffic is very low, at most n � 1 out of the n links that compose the trunk link can be turnedoff in order to reduce power consumption. Notice that by keeping at least one operational link, the routing algorithm used inthe network needs no change.
One of the key functionalities required by the proposed mechanism is that each router must locally estimate networktraffic. There are several ways proposed in the literature to do this: using the number of busy virtual channels [16,20], usingthe length of the buffers associated to links [20] or using the link utilization [20]. Link utilization has the advantage of faith-fully representing the traffic level of the link. However, it has the disadvantage of being affected by the performance degra-dation of the network at saturation [16]: in this case accepted traffic (and link utilization) drastically decreases and message
M. Alonso et al. / Parallel Computing 36 (2010) 696–712 699
latency grows exponentially. As a consequence, by using link utilization without any additional metric, a link may be incor-rectly disconnected when the network is congested, thus making a bad situation worse.
While a litmus test based on input buffer utilization is used in [20], our experiments showed that when the network iscongested, actual traffic pattern becomes atypical due to routing constraints (i.e. availability of escape channels, atomicchannel allocation requirements). As a consequence, this approach is not adequate. We use an alternative simpler approach.Assuming that all nodes are injecting messages into the network (which should be the common case), when the network iscongested, newly generated messages can not be routed because all the required channels are busy for a long time. As a con-sequence, these messages are locally queued. The size of this queue is the proposed litmus test. Therefore, the power savingmechanism should reduce link width only if network utilization is low and the message injection queue of the local proces-sor to the router is empty. In this way, links are not powered down when their utilization is low due to network congestion.
On the other hand, when network utilization becomes high, the number of active links in the trunk link should be pro-gressively increased, up to its original value. In this case, network congestion may also lower link utilization. For instance, letus assume that, as traffic was low in the past, most of the trunk links are working at a fraction of their full width. Then, atraffic burst arises into the network significantly increasing the load. Even if the maximum load generated by the traffic burstis not high enough to saturate the network with all its links fully operational, it may congest the powered down network,thus decreasing utilization (as stated above) and never switching links to 100%. Therefore, again, the injection queue shouldbe used as a litmus test to detect network congestion. When this happens, links should be powered up to work again at fullwidth.
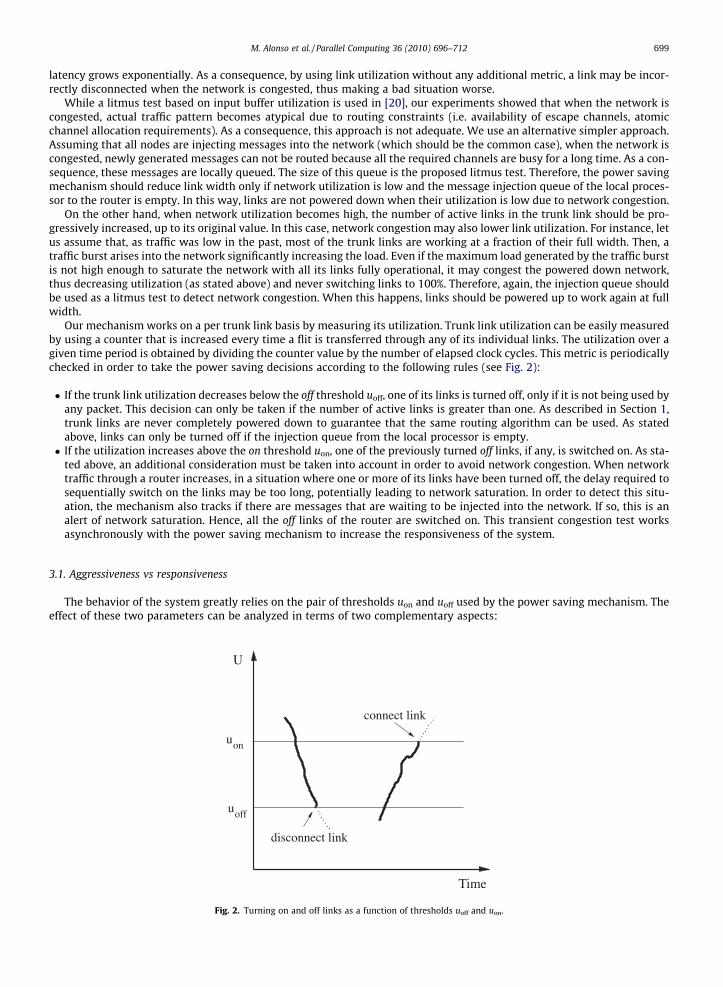
Our mechanism works on a per trunk link basis by measuring its utilization. Trunk link utilization can be easily measuredby using a counter that is increased every time a flit is transferred through any of its individual links. The utilization over agiven time period is obtained by dividing the counter value by the number of elapsed clock cycles. This metric is periodicallychecked in order to take the power saving decisions according to the following rules (see Fig. 2):
� If the trunk link utilization decreases below the off threshold uoff, one of its links is turned off, only if it is not being used byany packet. This decision can only be taken if the number of active links is greater than one. As described in Section 1,trunk links are never completely powered down to guarantee that the same routing algorithm can be used. As statedabove, links can only be turned off if the injection queue from the local processor is empty.� If the utilization increases above the on threshold uon, one of the previously turned off links, if any, is switched on. As sta-
ted above, an additional consideration must be taken into account in order to avoid network congestion. When networktraffic through a router increases, in a situation where one or more of its links have been turned off, the delay required tosequentially switch on the links may be too long, potentially leading to network saturation. In order to detect this situ-ation, the mechanism also tracks if there are messages that are waiting to be injected into the network. If so, this is analert of network saturation. Hence, all the off links of the router are switched on. This transient congestion test worksasynchronously with the power saving mechanism to increase the responsiveness of the system.
3.1. Aggressiveness vs responsiveness
The behavior of the system greatly relies on the pair of thresholds uon and uoff used by the power saving mechanism. Theeffect of these two parameters can be analyzed in terms of two complementary aspects:
u
Time
on
U
uoff
disconnect link
connect link
Fig. 2. Turning on and off links as a function of thresholds uoff and uon.
700 M. Alonso et al. / Parallel Computing 36 (2010) 696–712
� Mechanism aggressiveness: this is controlled by the average value of the thresholds, uavg = (uon + uoff)/2. High averagethresholds provide an aggressive policy, since the mechanism keeps links disconnected even with high loads. On the otherhand, if uavg is low, a conservative policy is applied since power savings are only tried for low loads.� Mechanism responsiveness: the hysteresis band, defined by the difference uon–uoff controls the mechanism responsive-
ness against traffic variations. Higher hysteresis bands will require higher traffic variations for the mechanism to be acti-vated, while lower traffic variations will not modify the system state, and vice versa.
According to the above considerations, our proposal can be tuned to meet different requirements by adjusting aggressive-ness and responsiveness. However, a number of limitations apply to the set of possible threshold values. First of all, uon mustbe higher than uoff. Secondly, uon must be lower than the maximum utilization achieved by the links for the highest loadsthat the network can accept (UMAX), or otherwise the network will enter saturation before trying to connect links. And, fi-nally, an additional limitation that depends on the particular system configuration must be taken into account. This con-straint is conditioned by the fraction of trunk link bandwidth available for each trunk link state. We will explain thisissue by using a simple example.
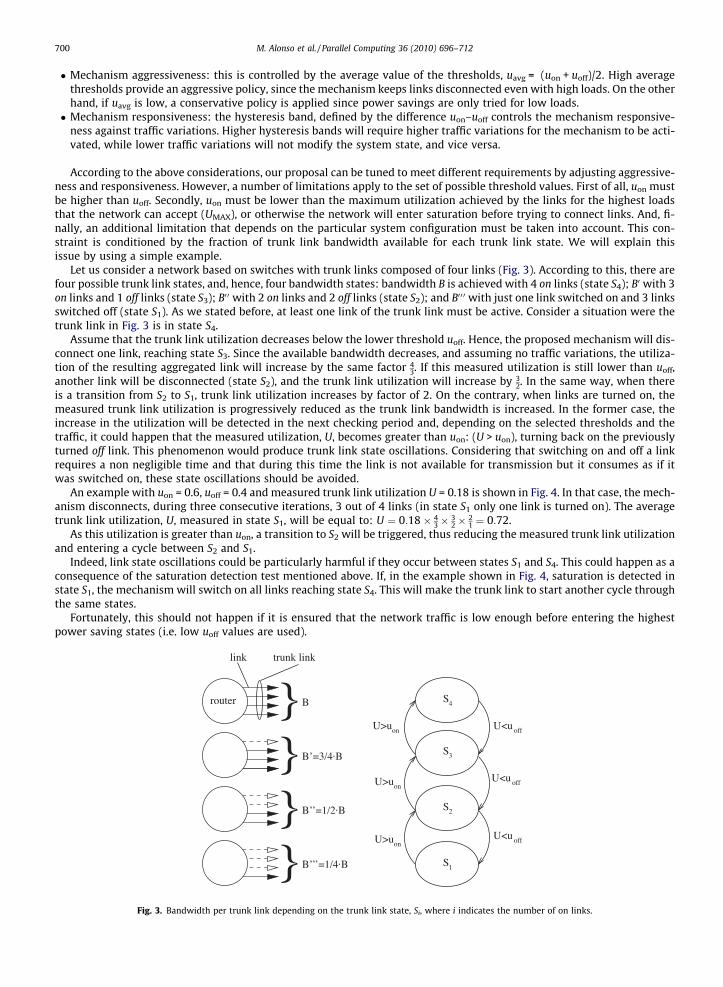
Let us consider a network based on switches with trunk links composed of four links (Fig. 3). According to this, there arefour possible trunk link states, and, hence, four bandwidth states: bandwidth B is achieved with 4 on links (state S4); B0 with 3on links and 1 off links (state S3); B0 0 with 2 on links and 2 off links (state S2); and B0 0 0 with just one link switched on and 3 linksswitched off (state S1). As we stated before, at least one link of the trunk link must be active. Consider a situation were thetrunk link in Fig. 3 is in state S4.
Assume that the trunk link utilization decreases below the lower threshold uoff. Hence, the proposed mechanism will dis-connect one link, reaching state S3. Since the available bandwidth decreases, and assuming no traffic variations, the utiliza-tion of the resulting aggregated link will increase by the same factor 4
3. If this measured utilization is still lower than uoff,another link will be disconnected (state S2), and the trunk link utilization will increase by 3
2. In the same way, when thereis a transition from S2 to S1, trunk link utilization increases by factor of 2. On the contrary, when links are turned on, themeasured trunk link utilization is progressively reduced as the trunk link bandwidth is increased. In the former case, theincrease in the utilization will be detected in the next checking period and, depending on the selected thresholds and thetraffic, it could happen that the measured utilization, U, becomes greater than uon: (U > uon), turning back on the previouslyturned off link. This phenomenon would produce trunk link state oscillations. Considering that switching on and off a linkrequires a non negligible time and that during this time the link is not available for transmission but it consumes as if itwas switched on, these state oscillations should be avoided.
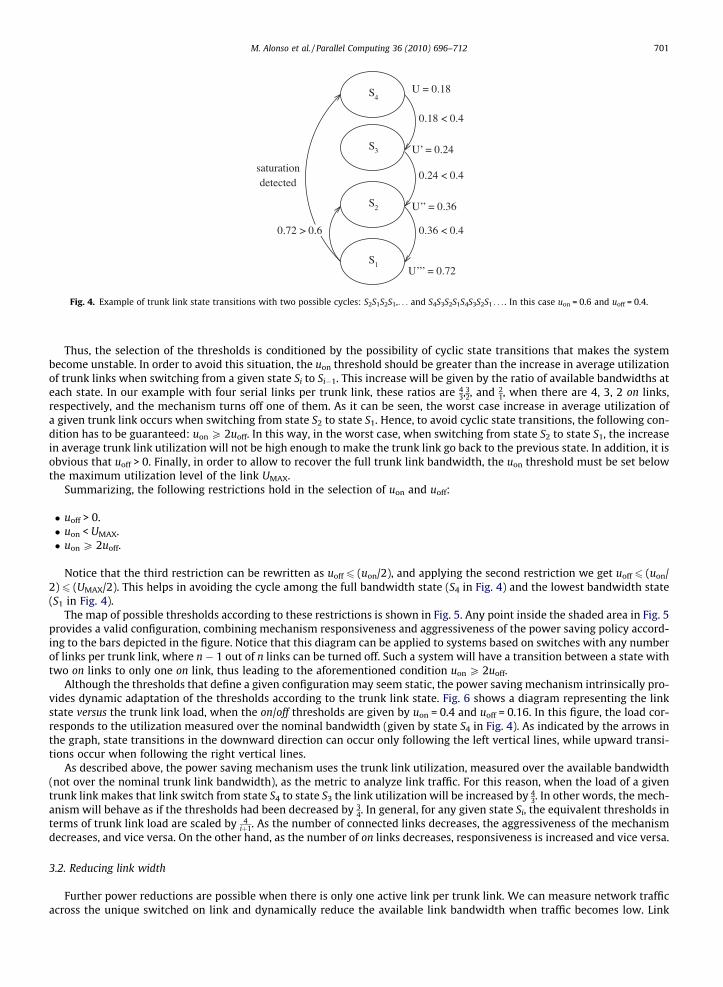
An example with uon = 0.6, uoff = 0.4 and measured trunk link utilization U = 0.18 is shown in Fig. 4. In that case, the mech-anism disconnects, during three consecutive iterations, 3 out of 4 links (in state S1 only one link is turned on). The averagetrunk link utilization, U, measured in state S1, will be equal to: U ¼ 0:18� 4
3� 32� 2
1 ¼ 0:72.As this utilization is greater than uon, a transition to S2 will be triggered, thus reducing the measured trunk link utilization
and entering a cycle between S2 and S1.Indeed, link state oscillations could be particularly harmful if they occur between states S1 and S4. This could happen as a
consequence of the saturation detection test mentioned above. If, in the example shown in Fig. 4, saturation is detected instate S1, the mechanism will switch on all links reaching state S4. This will make the trunk link to start another cycle throughthe same states.
Fortunately, this should not happen if it is ensured that the network traffic is low enough before entering the highestpower saving states (i.e. low uoff values are used).
U<u
U<u
U<u
U>u
U>u
U>u
}}}}
B’’=1/2·B
B’=3/4·B
B’’’=1/4·B
link trunk link
Brouter S4
S3
S2
S1
off
off
off
on
on
on
Fig. 3. Bandwidth per trunk link depending on the trunk link state, Si, where i indicates the number of on links.
0.18 < 0.4
0.24 < 0.4
0.36 < 0.4
U’’’ = 0.72
U = 0.18
U’ = 0.24
U’’ = 0.36
S4
S3
S2
S1
0.72 > 0.6
detectedsaturation
Fig. 4. Example of trunk link state transitions with two possible cycles: S2S1S2S1,. . . and S4S3S2S1S4S3S2S1 . . . . In this case uon = 0.6 and uoff = 0.4.
M. Alonso et al. / Parallel Computing 36 (2010) 696–712 701
Thus, the selection of the thresholds is conditioned by the possibility of cyclic state transitions that makes the systembecome unstable. In order to avoid this situation, the uon threshold should be greater than the increase in average utilizationof trunk links when switching from a given state Si to Si�1. This increase will be given by the ratio of available bandwidths ateach state. In our example with four serial links per trunk link, these ratios are 4
3,32, and 21, when there are 4, 3, 2 on links,
respectively, and the mechanism turns off one of them. As it can be seen, the worst case increase in average utilization ofa given trunk link occurs when switching from state S2 to state S1. Hence, to avoid cyclic state transitions, the following con-dition has to be guaranteed: uon P 2uoff. In this way, in the worst case, when switching from state S2 to state S1, the increasein average trunk link utilization will not be high enough to make the trunk link go back to the previous state. In addition, it isobvious that uoff > 0. Finally, in order to allow to recover the full trunk link bandwidth, the uon threshold must be set belowthe maximum utilization level of the link UMAX.
Summarizing, the following restrictions hold in the selection of uon and uoff:
� uoff > 0.� uon < UMAX.� uon P 2uoff.
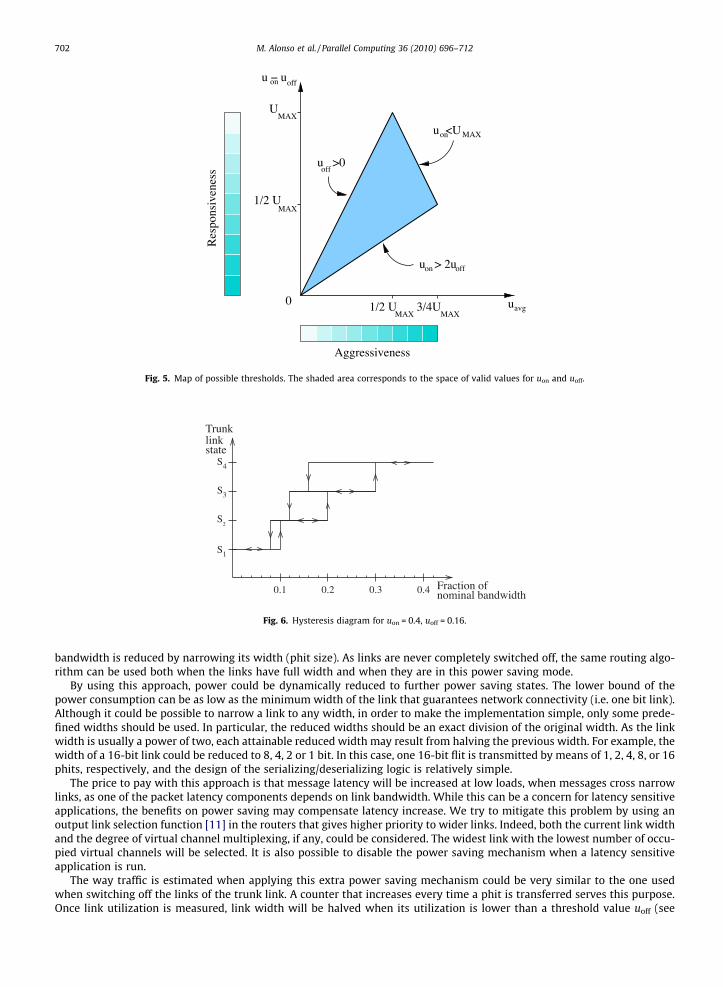
Notice that the third restriction can be rewritten as uoff 6 (uon/2), and applying the second restriction we get uoff 6 (uon/2) 6 (UMAX/2). This helps in avoiding the cycle among the full bandwidth state (S4 in Fig. 4) and the lowest bandwidth state(S1 in Fig. 4).
The map of possible thresholds according to these restrictions is shown in Fig. 5. Any point inside the shaded area in Fig. 5provides a valid configuration, combining mechanism responsiveness and aggressiveness of the power saving policy accord-ing to the bars depicted in the figure. Notice that this diagram can be applied to systems based on switches with any numberof links per trunk link, where n � 1 out of n links can be turned off. Such a system will have a transition between a state withtwo on links to only one on link, thus leading to the aforementioned condition uon P 2uoff.
Although the thresholds that define a given configuration may seem static, the power saving mechanism intrinsically pro-vides dynamic adaptation of the thresholds according to the trunk link state. Fig. 6 shows a diagram representing the linkstate versus the trunk link load, when the on/off thresholds are given by uon = 0.4 and uoff = 0.16. In this figure, the load cor-responds to the utilization measured over the nominal bandwidth (given by state S4 in Fig. 4). As indicated by the arrows inthe graph, state transitions in the downward direction can occur only following the left vertical lines, while upward transi-tions occur when following the right vertical lines.
As described above, the power saving mechanism uses the trunk link utilization, measured over the available bandwidth(not over the nominal trunk link bandwidth), as the metric to analyze link traffic. For this reason, when the load of a giventrunk link makes that link switch from state S4 to state S3 the link utilization will be increased by 4
3. In other words, the mech-anism will behave as if the thresholds had been decreased by 3
4. In general, for any given state Si, the equivalent thresholds interms of trunk link load are scaled by 4
iþ1. As the number of connected links decreases, the aggressiveness of the mechanismdecreases, and vice versa. On the other hand, as the number of on links decreases, responsiveness is increased and vice versa.
3.2. Reducing link width
Further power reductions are possible when there is only one active link per trunk link. We can measure network trafficacross the unique switched on link and dynamically reduce the available link bandwidth when traffic becomes low. Link
avgu1/2 UMAX
1/2 UMAX
UMAX
3/4UMAX
onu − uoff
0
Res
pons
iven
ess
Aggressiveness
u >0off
u > 2uon off
u <Uon MAX
Fig. 5. Map of possible thresholds. The shaded area corresponds to the space of valid values for uon and uoff.
linkTrunk
state
0.1 0.2 0.3 0.4
S1
Fraction ofnominal bandwidth
S2
S3
S4
Fig. 6. Hysteresis diagram for uon = 0.4, uoff = 0.16.
702 M. Alonso et al. / Parallel Computing 36 (2010) 696–712
bandwidth is reduced by narrowing its width (phit size). As links are never completely switched off, the same routing algo-rithm can be used both when the links have full width and when they are in this power saving mode.
By using this approach, power could be dynamically reduced to further power saving states. The lower bound of thepower consumption can be as low as the minimum width of the link that guarantees network connectivity (i.e. one bit link).Although it could be possible to narrow a link to any width, in order to make the implementation simple, only some prede-fined widths should be used. In particular, the reduced widths should be an exact division of the original width. As the linkwidth is usually a power of two, each attainable reduced width may result from halving the previous width. For example, thewidth of a 16-bit link could be reduced to 8, 4, 2 or 1 bit. In this case, one 16-bit flit is transmitted by means of 1, 2, 4, 8, or 16phits, respectively, and the design of the serializing/deserializing logic is relatively simple.
The price to pay with this approach is that message latency will be increased at low loads, when messages cross narrowlinks, as one of the packet latency components depends on link bandwidth. While this can be a concern for latency sensitiveapplications, the benefits on power saving may compensate latency increase. We try to mitigate this problem by using anoutput link selection function [11] in the routers that gives higher priority to wider links. Indeed, both the current link widthand the degree of virtual channel multiplexing, if any, could be considered. The widest link with the lowest number of occu-pied virtual channels will be selected. It is also possible to disable the power saving mechanism when a latency sensitiveapplication is run.
The way traffic is estimated when applying this extra power saving mechanism could be very similar to the one usedwhen switching off the links of the trunk link. A counter that increases every time a phit is transferred serves this purpose.Once link utilization is measured, link width will be halved when its utilization is lower than a threshold value uoff (see
M. Alonso et al. / Parallel Computing 36 (2010) 696–712 703
Fig. 2). On the contrary, link width is doubled when its utilization reaches another threshold uon. The considerations tochoose the thresholds are very similar to the ones discussed in Section 3.1. The number of allowed nested reductions is adesign parameter that imposes a lower bound on link power consumption. We propose up to two nested link width reduc-tions, thus imposing a lower bound of 25% of the power consumption of a link. Hence, a link may work at 100%, 50% or 25% ofits nominal width. Further link width reductions are possible, but they impose a severe penalty in latency for low-workloads.The lowest possible bound is achieved when link width narrows down to one bit. On the other hand, every time the width ofa link is modified, the destination node of the link should be notified in order to properly configure the deserializing logic.This can be done by means of dedicated control signals or sending in-band control packets.
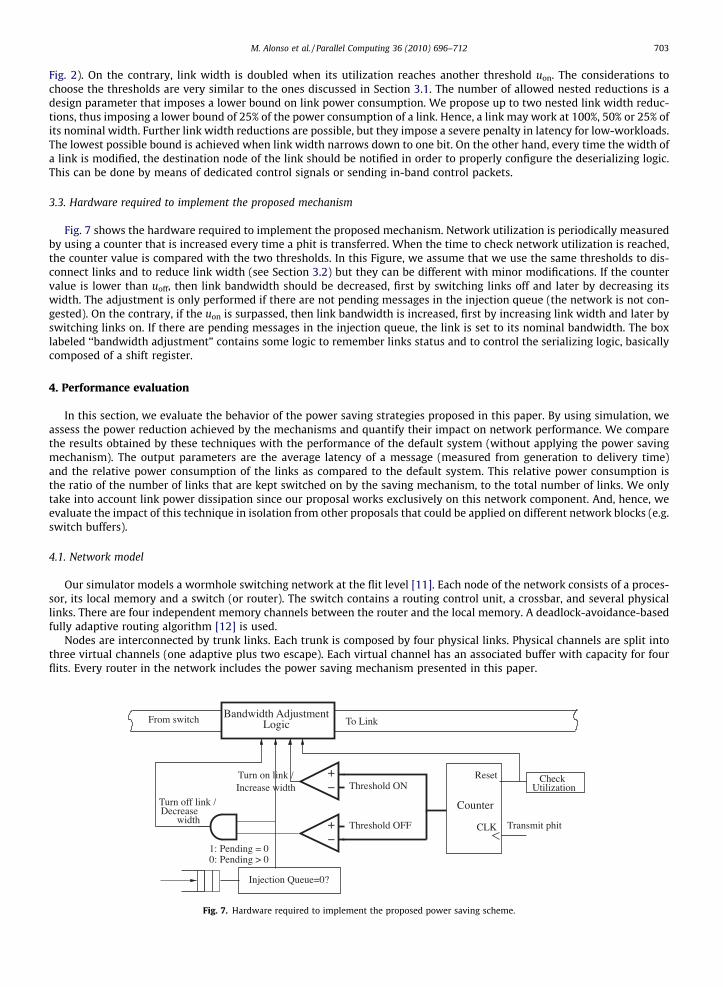
3.3. Hardware required to implement the proposed mechanism
Fig. 7 shows the hardware required to implement the proposed mechanism. Network utilization is periodically measuredby using a counter that is increased every time a phit is transferred. When the time to check network utilization is reached,the counter value is compared with the two thresholds. In this Figure, we assume that we use the same thresholds to dis-connect links and to reduce link width (see Section 3.2) but they can be different with minor modifications. If the countervalue is lower than uoff, then link bandwidth should be decreased, first by switching links off and later by decreasing itswidth. The adjustment is only performed if there are not pending messages in the injection queue (the network is not con-gested). On the contrary, if the uon is surpassed, then link bandwidth is increased, first by increasing link width and later byswitching links on. If there are pending messages in the injection queue, the link is set to its nominal bandwidth. The boxlabeled ‘‘bandwidth adjustment” contains some logic to remember links status and to control the serializing logic, basicallycomposed of a shift register.
4. Performance evaluation
In this section, we evaluate the behavior of the power saving strategies proposed in this paper. By using simulation, weassess the power reduction achieved by the mechanisms and quantify their impact on network performance. We comparethe results obtained by these techniques with the performance of the default system (without applying the power savingmechanism). The output parameters are the average latency of a message (measured from generation to delivery time)and the relative power consumption of the links as compared to the default system. This relative power consumption isthe ratio of the number of links that are kept switched on by the saving mechanism, to the total number of links. We onlytake into account link power dissipation since our proposal works exclusively on this network component. And, hence, weevaluate the impact of this technique in isolation from other proposals that could be applied on different network blocks (e.g.switch buffers).
4.1. Network model
Our simulator models a wormhole switching network at the flit level [11]. Each node of the network consists of a proces-sor, its local memory and a switch (or router). The switch contains a routing control unit, a crossbar, and several physicallinks. There are four independent memory channels between the router and the local memory. A deadlock-avoidance-basedfully adaptive routing algorithm [12] is used.
Nodes are interconnected by trunk links. Each trunk is composed by four physical links. Physical channels are split intothree virtual channels (one adaptive plus two escape). Each virtual channel has an associated buffer with capacity for fourflits. Every router in the network includes the power saving mechanism presented in this paper.
Increase width
−
Turn on link /
Logic
Threshold ON
Threshold OFF
Injection Queue=0?
From switch To Link
Reset
CLK Transmit phit
Counter
Bandwidth Adjustment
0: Pending > 01: Pending = 0
CheckUtilization
DecreaseTurn off link /
width
+
+
−
Fig. 7. Hardware required to implement the proposed power saving scheme.
704 M. Alonso et al. / Parallel Computing 36 (2010) 696–712
4.2. Traffic model
The traffic pattern in the network depends on different parameters: the message generation rate at each node, the size ofthe messages, and the destination of each message.
Message injection times have been generated according to an exponential or self-similar distribution. As we evaluated thenetwork under both static and dynamic injection rate conditions, the injection rate average value is constant for the staticevaluation and variable for the dynamic load analysis. First, we analyze the network static behavior running independentsimulations with constant average message injection rates, evaluating the full range of traffic, from low load to saturation(Section 4.4). A second group of experiments is aimed at studying the dynamic behavior of the network, using variable injec-tion rates during each simulation (Section 4.5).
Message length is fixed to 16 flits, except for the analysis of message length where 64 and 256 flit long messages have alsobeen tested. For message destinations a uniform distribution has been used. It must be noted that the workload being mod-eled provides the worst case performance, for our power saving policy, since this workload does not exhibit spatial nor tem-poral variances [20].
4.3. Parameters of the proposed mechanism
The dynamics of the model is driven by the off threshold uoff and the on threshold uon. Fig. 5 depicts the allowed area fromwhich these thresholds can be chosen. In the following experiments, we explore this area by selecting different values of uoff
and uon in order to achieve different goals of responsiveness and aggressiveness for the power saving mechanism.On the other hand, a link cannot be instantaneously turned on, but it requires a time Ton. Turning off a link also needs
some time Toff to decrease the circuit voltage level to zero. When a link is turned off, we assume that it becomes immediatelyunavailable but it continues consuming power until Toff cycles have elapsed. On the contrary, when a link is turned on, thenew link is available to messages after Ton cycles, but power consumption increases at once. Based on the values reported in[15,20], we have used conservative values for these parameters (Ton = Toff = 1000 clock cycles). The state of the network is
65
70
75
80
85
90
95
100
105
110
0.1 0.2 0.3 0.4 0.5 0.6Aver
age
Mes
sage
Lat
ency
from
Gen
erat
ion
Tim
e (c
ycle
s)
Traffic (flits/cycle/switch)
32x32 2-D Torus
0.15-0.300.20-0.400.25-0.50
0.325-0.65nominal
(a)
35
40
45
50
55
60
0.05 0.1 0.15 0.2 0.25 0.3 0.35 0.4 0.45Aver
age
Mes
sage
Lat
ency
from
Gen
erat
ion
Tim
e (c
ycle
s)
Traffic (flits/cycle/switch)
8x8x8 3-D Torus
0.10-0.200.15-0.300.20-0.40
nominal
(b)
0.2
0.3
0.4
0.5
0.6
0.7
0.8
0.9
1
0.1 0.2 0.3 0.4 0.5 0.6
Rel
ativ
e Po
wer
Con
sum
ptio
n
Traffic (flits/cycle/switch)
32x32 2-D Torus
0.15-0.300.20-0.400.25-0.50
0.325-0.65
(c)
0.2
0.3
0.4
0.5
0.6
0.7
0.8
0.9
1
0.05 0.1 0.15 0.2 0.25 0.3 0.35 0.4 0.45
Rel
ativ
e Po
wer
Con
sum
ptio
n
Traffic (flits/cycle/switch)
8x8x8 3-D Torus
0.10-0.200.15-0.300.20-0.40
(d)
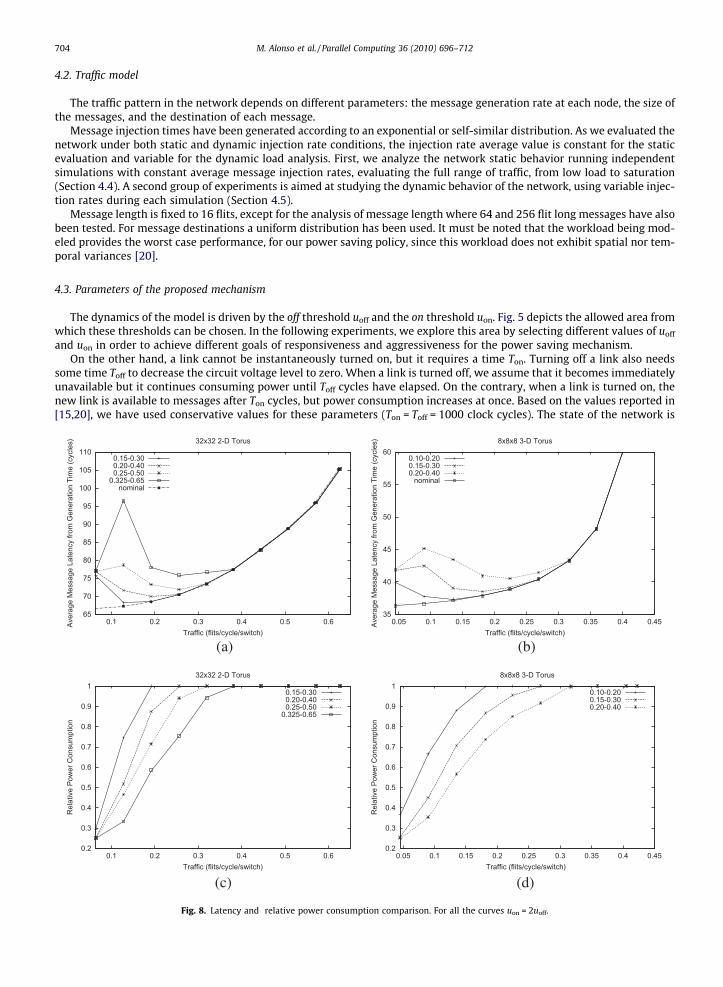
Fig. 8. Latency and relative power consumption comparison. For all the curves uon = 2uoff.
M. Alonso et al. / Parallel Computing 36 (2010) 696–712 705
periodically checked to decide if it is necessary to turn on or off any link. We use a period greater than Ton and Toff in order toallow network stabilization after the changes. Specifically, the check period used is 2000 clock cycles.
Network links are initially set to 100% of their nominal width. We assume that the power consumption of each link isproportional to its actual width.
4.4. Static evaluation
In this section, we analyze the power reduction achieved by the power saving mechanism proposed in Section 3, which isbased on switching on and off the links of a trunk link. Each trunk link is able to operate in four different consumption levels:from one active link up to four active links. At a given time, the operational level of a trunk link depends on its utilization.
We will show results for a 32 � 32 2-D torus and a 8 � 8 � 8 3-D torus. In the 2-D torus with trunk links, we have foundthat the maximum utilization achievable by network links is given by UMAX = 0.65, while the maximum utilization for the 3-D torus is UMAX = 0.45. Based on these limits and the restrictions described in Fig. 5, we analyze the effect of thresholds inpower consumption and performance of the network.
Fig. 8 compares the latency of the messages and the relative power consumption for different on-off thresholds indicatedwith the label uoff–uon. The left column shows results for the 2-D torus network while the right column presents results forthe 3-D torus. For all the curves, uon = 2uoff. Thus, given a value for uon, the interval (uoff, uon) has the minimum width that isallowed to avoid cycles. Results show that using a higher value for uon, implies a more aggressive approach. As uon is closer toUMAX, we achieve higher power savings at the expense of higher latency. Latency graphs (Fig. 8a and b) also include a curverepresenting the latency of the network when non power reduction mechanism is applied (labeled nominal). As we can ob-serve, latency increases are moderate except for one point in the curves with more aggressive thresholds. The reason is that,in this case, we are using very tight values for the thresholds. On average, the network is cycle-free, but the randomness ofthe workload could generate some turn on/off cycles in some points of the network. As we can see, this behavior disappearswhen we use lower values for the thresholds uoff and uon (i.e., less aggressive policy). Fig. 8c and d show that by using an
65
70
75
80
85
90
95
100
105
110
0.1 0.2 0.3 0.4 0.5 0.6Aver
age
Mes
sage
Lat
ency
from
Gen
erat
ion
Tim
e (c
ycle
s)
Traffic (relative to saturation load)
32x32 2-D Torus
0.10-0.300.13-0.400.17-0.500.22-0.65
nominal
(a)
35
40
45
50
55
60
0.05 0.1 0.15 0.2 0.25 0.3 0.35 0.4 0.45Aver
age
Mes
sage
Lat
ency
from
Gen
erat
ion
Tim
e (c
ycle
s)
Traffic (flits/cycle/switch)
8x8x8 3-D Torus
0.06-0.200.10-0.300.13-0.40
nominal
(b)
0.2
0.3
0.4
0.5
0.6
0.7
0.8
0.9
1
0.1 0.2 0.3 0.4 0.5 0.6
Rel
ativ
e Po
wer
Con
sum
ptio
n
Traffic (relative to saturation load)
32x32 2-D Torus
0.10-0.300.13-0.400.17-0.500.22-0.65
(c)
0.2
0.3
0.4
0.5
0.6
0.7
0.8
0.9
1
0.05 0.1 0.15 0.2 0.25 0.3 0.35 0.4 0.45
Rel
ativ
e Po
wer
Con
sum
ptio
n
Traffic (flits/cycle/switch)
8x8x8 3-D Torus
0.06-0.200.10-0.300.13-0.40
(d)
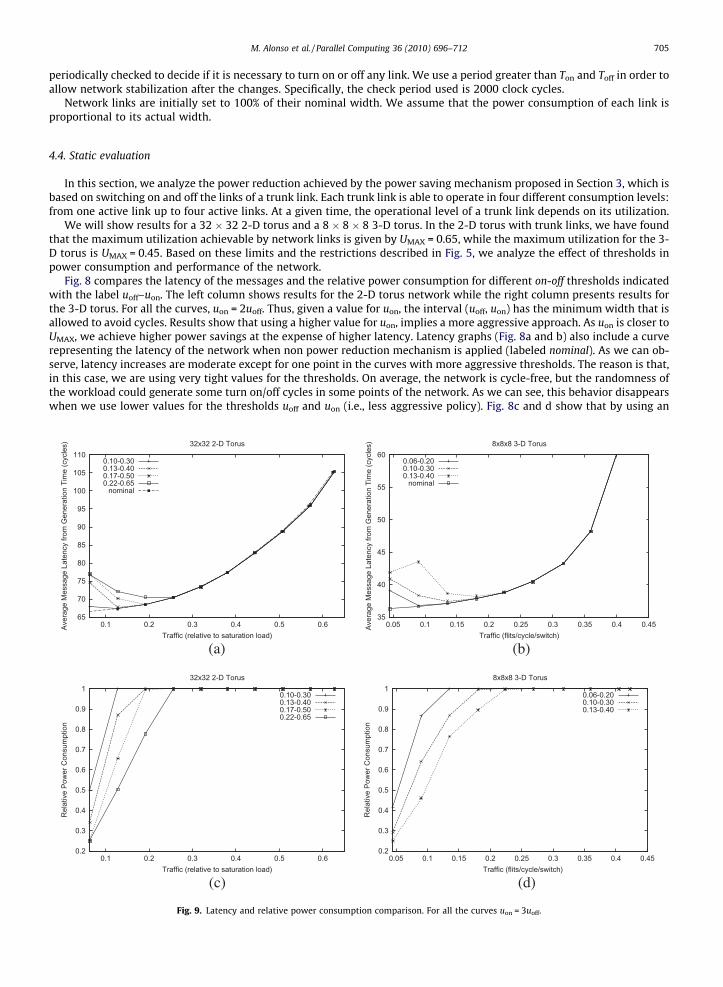
Fig. 9. Latency and relative power consumption comparison. For all the curves uon = 3uoff.
706 M. Alonso et al. / Parallel Computing 36 (2010) 696–712
aggressive choice for (uoff,uon) we can obtain important power savings, in particular for low loads. For instance, in the 2-Dtorus with uoff = 0.325, uon = 0.65 there are important power savings for low loads. When the traffic increases, we obtain low-er power savings, and when the traffic reaches 0.38 flits/cycle/switch, the network becomes fully connected: the four links inevery trunk link are active. If we use lower values for uoff and uon, the power consumption is higher and the network becomesfully connected with lower traffic levels. Note that maximum power saving achieves 75% (3 off links/4 available links).
0.3
0.4
0.5
0.6
0.7
0.8
0.9
1
1.1
1.2
0.1 0.2 0.3 0.4 0.5 0.6
Rel
ativ
e La
tenc
y * P
ower
Con
sum
ptio
n
Traffic (flits/cycle/switch)
0.15-0.300.20-0.400.25-0.50
0.325-0.65
0.3
0.4
0.5
0.6
0.7
0.8
0.9
1
1.1
1.2
0.1 0.2 0.3 0.4 0.5 0.6
Rel
ativ
e La
tenc
y * P
ower
Con
sum
ptio
n
Traffic (flits/cycle/switch)
0.10-0.300.13-0.400.17-0.500.22-0.65
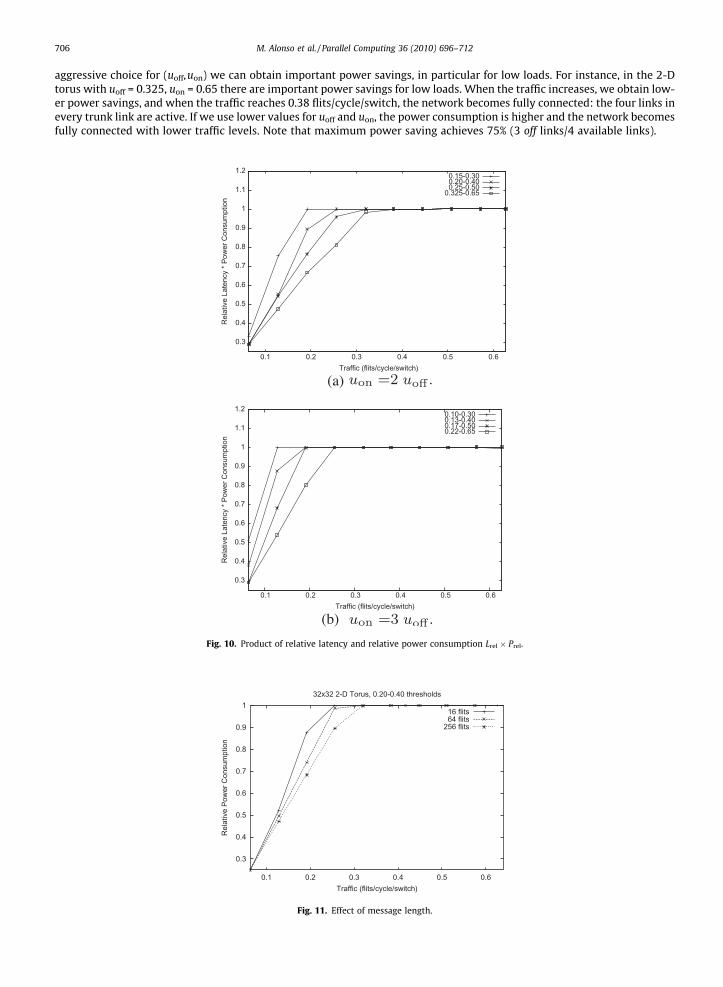
Fig. 10. Product of relative latency and relative power consumption Lrel � Prel.
0.3
0.4
0.5
0.6
0.7
0.8
0.9
1
0.1 0.2 0.3 0.4 0.5 0.6
Rel
ativ
e Po
wer
Con
sum
ptio
n
Traffic (flits/cycle/switch)
32x32 2-D Torus, 0.20-0.40 thresholds
16 flits64 flits
256 flits
Fig. 11. Effect of message length.
M. Alonso et al. / Parallel Computing 36 (2010) 696–712 707
Fig. 9 shows latency and power consumption results for uon = 3uoff. Now the choices for (uoff,uon) are not so tight, and thesystem avoids turn on/off cycles. As can be observed the latency penalty is reduced for all curves. The use of wider (uoff,uon)intervals implies that, for a given value of uon, the value of uoff is lower. Thus, requiring lower values of link utilization toswitch off the link and, as a consequence, the power consumption of the network is higher.
Our experiments indicate that message length has no significant impact on power consumption when the power savingmechanism is being applied. Slight reductions on power consumption are observed for all the tested configurations whenmessage length is increased. Fig. 11 shows this effect for the 3-D torus using uoff = 0.20 and uon = 0.40.
In order to provide a complementary indication of the effectiveness of the power saving strategy, we evaluate the productLrel � Prel, where Lrel is the relative latency with respect to the latency obtained when no power saving mechanism is in use;and Prel is the relative power consumption. If we do not use the power saving strategy, then Lrel � Prel = 1, as both factors areequal to one. When we apply our mechanism, the relative latency increases and the relative power consumption decreases(as has been shown in previous figures). When Lrel � Prel 6 1, we obtain a good balance as the power savings tend to com-pensate for the latency growth. Fig. 10a and b show these results for the 2-D torus experiments, similar results are obtainedfor the 3-D torus. As can be seen, both for uon = 2uoff and uon = 3uoff we obtain a good balance as always Lrel � Prel 6 1.
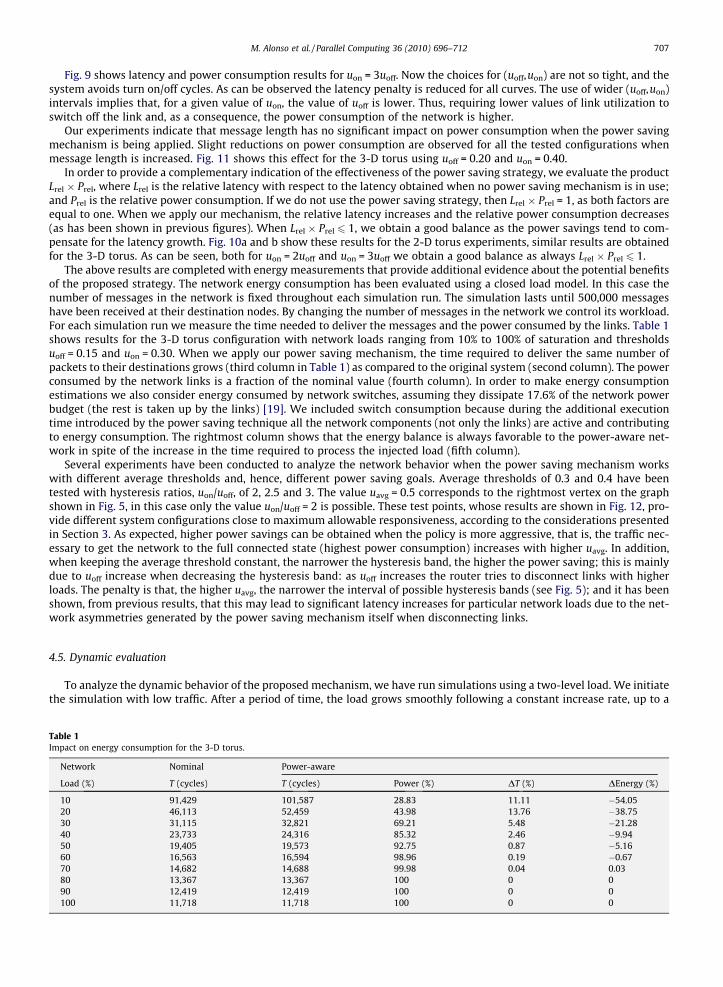
The above results are completed with energy measurements that provide additional evidence about the potential benefitsof the proposed strategy. The network energy consumption has been evaluated using a closed load model. In this case thenumber of messages in the network is fixed throughout each simulation run. The simulation lasts until 500,000 messageshave been received at their destination nodes. By changing the number of messages in the network we control its workload.For each simulation run we measure the time needed to deliver the messages and the power consumed by the links. Table 1shows results for the 3-D torus configuration with network loads ranging from 10% to 100% of saturation and thresholdsuoff = 0.15 and uon = 0.30. When we apply our power saving mechanism, the time required to deliver the same number ofpackets to their destinations grows (third column in Table 1) as compared to the original system (second column). The powerconsumed by the network links is a fraction of the nominal value (fourth column). In order to make energy consumptionestimations we also consider energy consumed by network switches, assuming they dissipate 17.6% of the network powerbudget (the rest is taken up by the links) [19]. We included switch consumption because during the additional executiontime introduced by the power saving technique all the network components (not only the links) are active and contributingto energy consumption. The rightmost column shows that the energy balance is always favorable to the power-aware net-work in spite of the increase in the time required to process the injected load (fifth column).
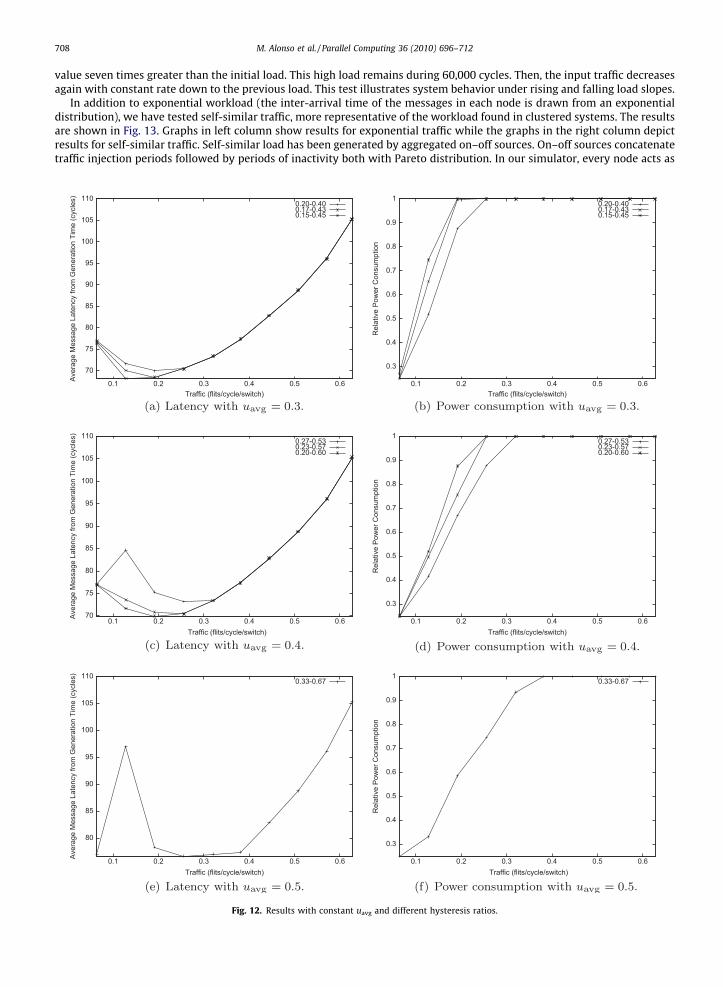
Several experiments have been conducted to analyze the network behavior when the power saving mechanism workswith different average thresholds and, hence, different power saving goals. Average thresholds of 0.3 and 0.4 have beentested with hysteresis ratios, uon/uoff, of 2, 2.5 and 3. The value uavg = 0.5 corresponds to the rightmost vertex on the graphshown in Fig. 5, in this case only the value uon/uoff = 2 is possible. These test points, whose results are shown in Fig. 12, pro-vide different system configurations close to maximum allowable responsiveness, according to the considerations presentedin Section 3. As expected, higher power savings can be obtained when the policy is more aggressive, that is, the traffic nec-essary to get the network to the full connected state (highest power consumption) increases with higher uavg. In addition,when keeping the average threshold constant, the narrower the hysteresis band, the higher the power saving; this is mainlydue to uoff increase when decreasing the hysteresis band: as uoff increases the router tries to disconnect links with higherloads. The penalty is that, the higher uavg, the narrower the interval of possible hysteresis bands (see Fig. 5); and it has beenshown, from previous results, that this may lead to significant latency increases for particular network loads due to the net-work asymmetries generated by the power saving mechanism itself when disconnecting links.
4.5. Dynamic evaluation
To analyze the dynamic behavior of the proposed mechanism, we have run simulations using a two-level load. We initiatethe simulation with low traffic. After a period of time, the load grows smoothly following a constant increase rate, up to a
Table 1Impact on energy consumption for the 3-D torus.
Network Nominal Power-aware
Load (%) T (cycles) T (cycles) Power (%) DT (%) DEnergy (%)
10 91,429 101,587 28.83 11.11 �54.0520 46,113 52,459 43.98 13.76 �38.7530 31,115 32,821 69.21 5.48 �21.2840 23,733 24,316 85.32 2.46 �9.9450 19,405 19,573 92.75 0.87 �5.1660 16,563 16,594 98.96 0.19 �0.6770 14,682 14,688 99.98 0.04 0.0380 13,367 13,367 100 0 090 12,419 12,419 100 0 0100 11,718 11,718 100 0 0
708 M. Alonso et al. / Parallel Computing 36 (2010) 696–712
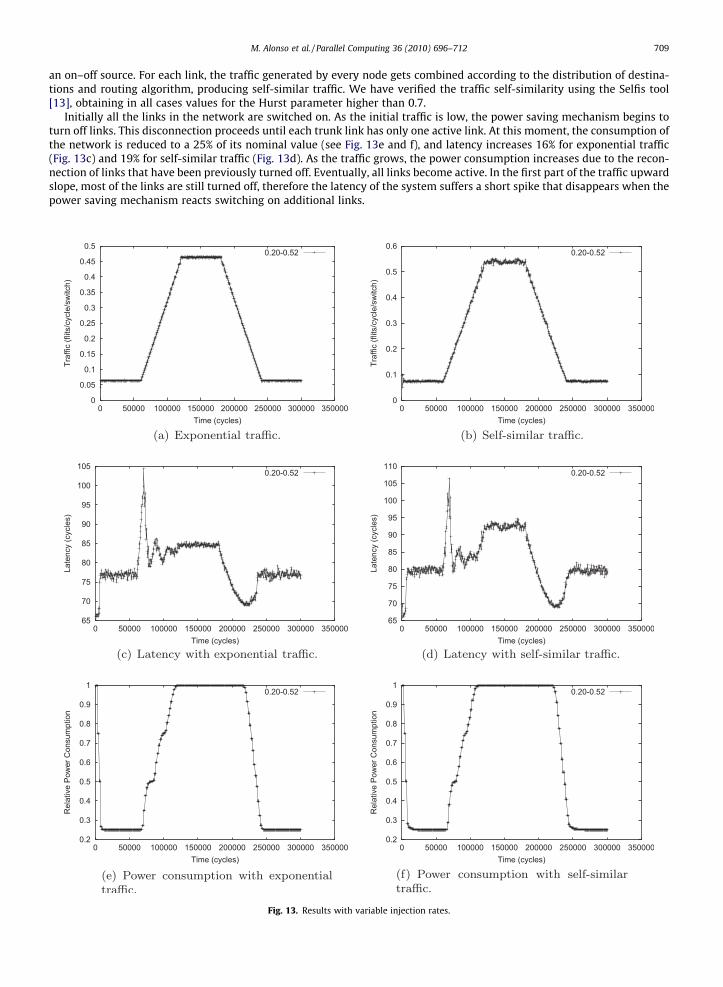
value seven times greater than the initial load. This high load remains during 60,000 cycles. Then, the input traffic decreasesagain with constant rate down to the previous load. This test illustrates system behavior under rising and falling load slopes.
In addition to exponential workload (the inter-arrival time of the messages in each node is drawn from an exponentialdistribution), we have tested self-similar traffic, more representative of the workload found in clustered systems. The resultsare shown in Fig. 13. Graphs in left column show results for exponential traffic while the graphs in the right column depictresults for self-similar traffic. Self-similar load has been generated by aggregated on–off sources. On–off sources concatenatetraffic injection periods followed by periods of inactivity both with Pareto distribution. In our simulator, every node acts as
Fig. 12. Results with constant uavg and different hysteresis ratios.
M. Alonso et al. / Parallel Computing 36 (2010) 696–712 709
an on–off source. For each link, the traffic generated by every node gets combined according to the distribution of destina-tions and routing algorithm, producing self-similar traffic. We have verified the traffic self-similarity using the Selfis tool[13], obtaining in all cases values for the Hurst parameter higher than 0.7.
Initially all the links in the network are switched on. As the initial traffic is low, the power saving mechanism begins toturn off links. This disconnection proceeds until each trunk link has only one active link. At this moment, the consumption ofthe network is reduced to a 25% of its nominal value (see Fig. 13e and f), and latency increases 16% for exponential traffic(Fig. 13c) and 19% for self-similar traffic (Fig. 13d). As the traffic grows, the power consumption increases due to the recon-nection of links that have been previously turned off. Eventually, all links become active. In the first part of the traffic upwardslope, most of the links are still turned off, therefore the latency of the system suffers a short spike that disappears when thepower saving mechanism reacts switching on additional links.
Fig. 13. Results with variable injection rates.
710 M. Alonso et al. / Parallel Computing 36 (2010) 696–712
When the traffic reaches its highest value and all links are fully operational, the latency becomes stable in the same valueachieved by the network when no power reduction technique is in use. The downward slope of the traffic is followed by adecrease in latency and power consumption. As the links are being disconnected (until only one active link remains in eachtrunk link) there is a small increase in latency.
4.6. Obtaining additional power savings
As has been explained in Section 3.2, when the previous technique has reduced the number of active physical links in atrunk link to one, we can obtain further power savings by dynamically reducing the link width of the remaining active link asthe traffic becomes lower and lower. In this section, we assess the additional power reduction that can be achieved with thistechnique, and quantify its impact on network performance.
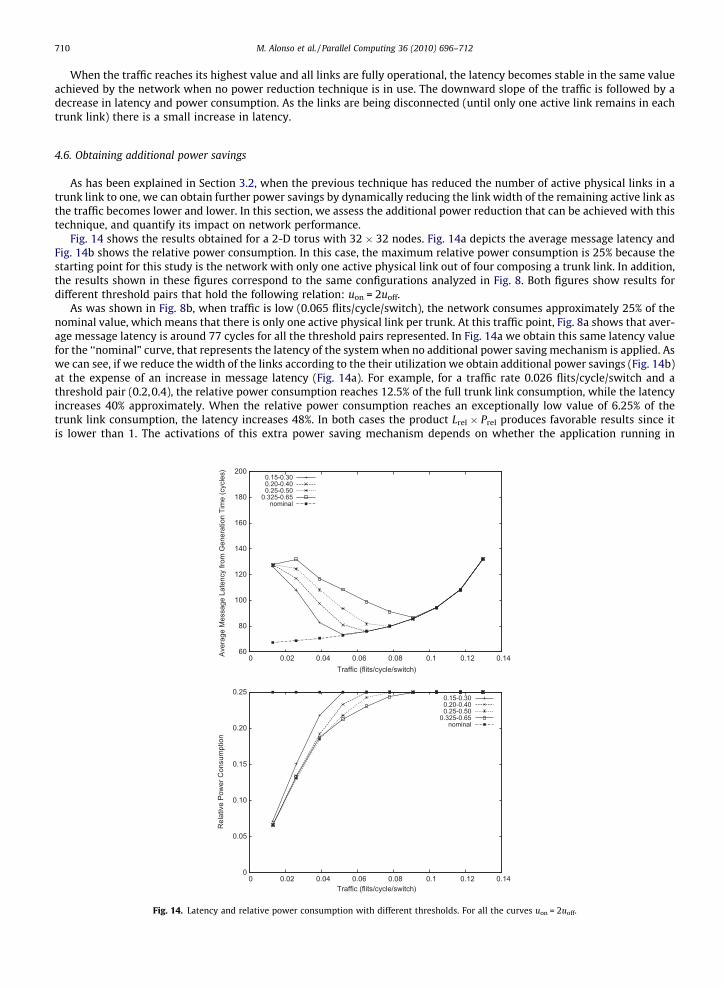
Fig. 14 shows the results obtained for a 2-D torus with 32 � 32 nodes. Fig. 14a depicts the average message latency andFig. 14b shows the relative power consumption. In this case, the maximum relative power consumption is 25% because thestarting point for this study is the network with only one active physical link out of four composing a trunk link. In addition,the results shown in these figures correspond to the same configurations analyzed in Fig. 8. Both figures show results fordifferent threshold pairs that hold the following relation: uon = 2uoff.
As was shown in Fig. 8b, when traffic is low (0.065 flits/cycle/switch), the network consumes approximately 25% of thenominal value, which means that there is only one active physical link per trunk. At this traffic point, Fig. 8a shows that aver-age message latency is around 77 cycles for all the threshold pairs represented. In Fig. 14a we obtain this same latency valuefor the ‘‘nominal” curve, that represents the latency of the system when no additional power saving mechanism is applied. Aswe can see, if we reduce the width of the links according to the their utilization we obtain additional power savings (Fig. 14b)at the expense of an increase in message latency (Fig. 14a). For example, for a traffic rate 0.026 flits/cycle/switch and athreshold pair (0.2,0.4), the relative power consumption reaches 12.5% of the full trunk link consumption, while the latencyincreases 40% approximately. When the relative power consumption reaches an exceptionally low value of 6.25% of thetrunk link consumption, the latency increases 48%. In both cases the product Lrel � Prel produces favorable results since itis lower than 1. The activations of this extra power saving mechanism depends on whether the application running in
60
80
100
120
140
160
180
200
0 0.02 0.04 0.06 0.08 0.1 0.12 0.14Aver
age
Mes
sage
Lat
ency
from
Gen
erat
ion
Tim
e (c
ycle
s)
Traffic (flits/cycle/switch)
0.15-0.300.20-0.400.25-0.50
0.325-0.65nominal
0
0.05
0.10
0.15
0.20
0.25
0 0.02 0.04 0.06 0.08 0.1 0.12 0.14
Rel
ativ
e Po
wer
Con
sum
ptio
n
Traffic (flits/cycle/switch)
0.15-0.300.20-0.400.25-0.50
0.325-0.65nominal
Fig. 14. Latency and relative power consumption with different thresholds. For all the curves uon = 2uoff.
60
80
100
120
140
160
180
200
0 0.02 0.04 0.06 0.08 0.1 0.12 0.14
Aver
age
Mes
sage
Lat
ency
from
Gen
erat
ion
Tim
e (c
ycle
s)
Traffic (flits/cycle/switch)
0.10-0.300.13-0.400.17-0.500.22-0.65
nominal
0
0.05
0.1
0.15
0.2
0.25
0 0.02 0.04 0.06 0.08 0.1 0.12 0.14
Rel
ativ
e Po
wer
Con
sum
ptio
n
Traffic (flits/cycle/switch)
0.30-0.100.40-0.130.50-0.170.65-0.22
nominal
Fig. 15. Latency and relative power consumption with different thresholds. For all the curves uon = 3uoff.
M. Alonso et al. / Parallel Computing 36 (2010) 696–712 711
the system is latency bounded or not. The system administrator should decide for this particular application whether it isappropriate to activate the mechanism in order to obtain an acceptable power-latency balance. What Fig. 14 shows is thatthere is a chance for further power savings, but the performance penalty should be considered in order to apply this extrapower reductions.
Fig. 14a shows that the width reduction technique is activated for a traffic level lower than 0.1 flits/cycle/switch (depend-ing on the threshold pair). When we used a combination of both power saving strategies, for workloads lower than 0.1 flits/cycle/switch, we will have both mechanisms working in parallel. Thus there will be a few links with several active links pertrunk, some links with just one link per trunk, and finally many links that are reducing their width to a half or a quarter of itsoriginal size. For one particular link, we can only apply the width reduction technique when the first mechanism has discon-nected all but one physical link in the trunk link.
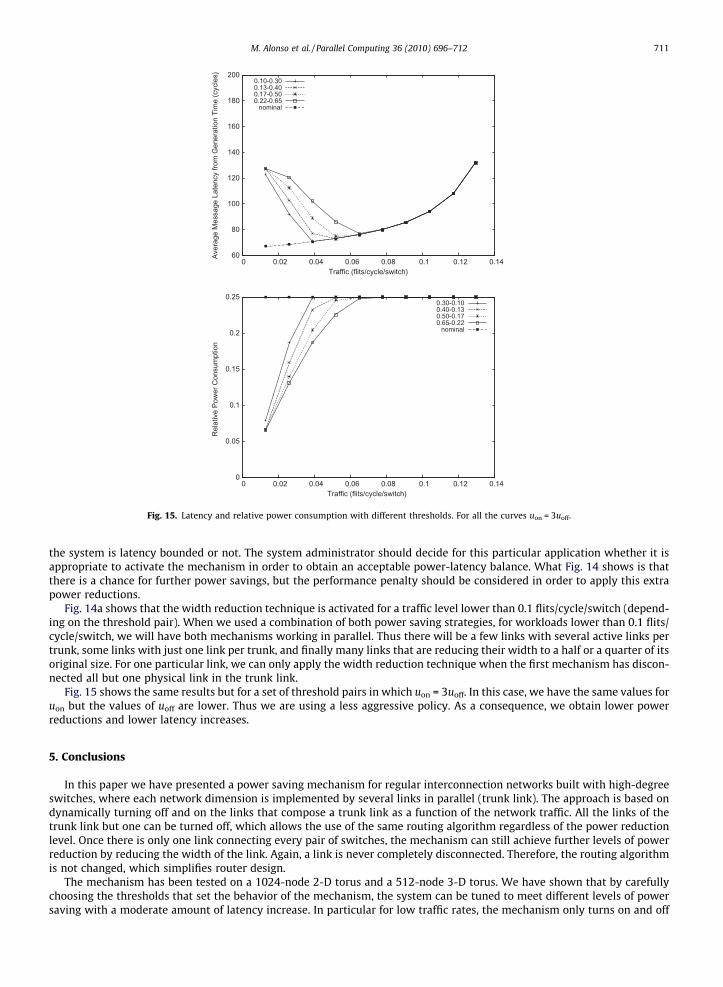
Fig. 15 shows the same results but for a set of threshold pairs in which uon = 3uoff. In this case, we have the same values foruon but the values of uoff are lower. Thus we are using a less aggressive policy. As a consequence, we obtain lower powerreductions and lower latency increases.
5. Conclusions
In this paper we have presented a power saving mechanism for regular interconnection networks built with high-degreeswitches, where each network dimension is implemented by several links in parallel (trunk link). The approach is based ondynamically turning off and on the links that compose a trunk link as a function of the network traffic. All the links of thetrunk link but one can be turned off, which allows the use of the same routing algorithm regardless of the power reductionlevel. Once there is only one link connecting every pair of switches, the mechanism can still achieve further levels of powerreduction by reducing the width of the link. Again, a link is never completely disconnected. Therefore, the routing algorithmis not changed, which simplifies router design.
The mechanism has been tested on a 1024-node 2-D torus and a 512-node 3-D torus. We have shown that by carefullychoosing the thresholds that set the behavior of the mechanism, the system can be tuned to meet different levels of powersaving with a moderate amount of latency increase. In particular for low traffic rates, the mechanism only turns on and off

712 M. Alonso et al. / Parallel Computing 36 (2010) 696–712
the links that compose the trunk link and the network consumes only less than 30% of its nominal value with an almost neg-ligible impact on network latency. For very low traffic rates, the mechanism also reduces the width of the unique on linkconnecting switches and the consumed power can be as low as 7% of its nominal value with some penalty in message latencyof approximately 50%.
References
[1] Green500 list home page. http://www.green500.org.[2] HyperTransport(TM) I/O Link Protocol Specification, Revision 3.10. <http://www.hypertransport.org>.[3] InfiniBand Trade Alliance, The InfiniBand Architecture. <http://www.infinibandta.org>.[4] Mellanox home page. <http://www.mellanox.com>.[5] Myricom Inc. home page. <http://www.myricom.com>.[6] Sgi home page. <http://www.sgi.com>.[7] Top500 list home page. <http://www.top500.org>.[8] Marina Alonso, Salvador Coll, Juan Miguel Martínez, Vicente Santonja, Pedro López, José Duato, Dynamic power saving in fat-tree interconnection
networks using on/off links, in: International Parallel and Distributed Processing Symposium, IPDPS, IEEE, 2006.[9] Marina Alonso, Salvador Coll, Vicente Santonja, Juan Miguel Martínez, Pedro López, José Duato, Power-aware fat-tree networks using on/off links, in:
High Perforance Computation Conference, Lecture Notes in Computer Science, 4782, Springer, 2007, pp. 472–483.[10] C.S. Patel, S.M. Chai, S.Yalamanchili, D.E. Schimmel, Power-constrained design of multiprocessor interconnection networks, in: Proceedings of the IEEE
International Conference on Computer Design (ICCD’97), October 1997, pp. 408–416.[11] José Duato, A new theory of deadlock-free adaptive routing in wormhole networks, IEEE Transactions on Parallel and Distributed Systems 4 (12) (1993)
1320–1331.[12] José Duato, Pedro López, Performance evaluation of adaptive routing algorithms for k-ary n-cubes, in: Parallel Computer Routing and Communication
Workshop, vol. 853 of LNCS, May 1994, Seattle, Washington, USA, pp. 45–59.[13] Thomas Karagiannis, Michalis Faloutsos, SELFIS: a tool for self-similarity and long-range dependence analysis, in: First Workshop on Fractals and Self-
Similarity in Data Mining: Issues and Approaches, Edmonton, Canada, 2002.[14] E.J. Kim, K.H. Yum, G.M. Link, N. Vijaykrishnan, M. Kandemir, M.J. Irwin, M. Yousif, C.R. Das, Energy optimization techniques in cluster interconnects, in:
ISLPED ’03: Proceedings of the 2003 International Symposium on Low Power Electronics and Design, ACM, New York, USA, 2003, pp. 459–464.[15] Jaeha Kim, Mark A. Horowitz, Adaptive supply serial links with sub-1V operation and per-pin clock recovery, IEEE Journal of Solid State Circuits (2002)
1403–1413. November.[16] Pedro López, José Duato, Deadlock-free adaptive routing algorithms for the 3D torus: limitations and solutions, in: Proceedings of Parallel Architectures
and Languages Europe 93, June 1993.[17] Robert A. Maddox, Gurbir Singh, Robert J. Safranek, The Architecture of the Intel(r) QuickPath Interconnect. <http://www.intel.com/technology/
quickpath/>.[18] John Shalf, Shoaib Kamil, Leonid Oliker, David Skinner, Analyzing ultrascale application communication requirements for a reconfigurable hybrid
interconnect, in: Super Computing, 2005.[19] Li Shang, Li-Shiuan Peh, Niraj K. Jha, Dynamic voltage scaling with links for power optimization of interconnection networks, in: Proceedings of the 9th
International Symposium on High-Performance Computer Architecture (HPCA), Anaheim, CA, 2003.[20] Vassos Soteriou, Li-Shiuan Peh, Dynamic power management for power optimization of interconnection networks using on/off links, in: Hot
Interconnects 11, Stanford University, Palo Alto, CA, August 2003.[21] Vassos Soteriou and Li-Shiuan Peh. Design-space exploration of power-aware on/off interconnection networks, in: Proceedings of the 22nd
International Conference on Computer Design (ICCD’04), October 2004, San Jose, pp. 510–517.[22] Vassos Soteriou, Li-Shiuan Peh, Exploring the design space of self-regulating power-aware on/off interconnection networks, IEEE Transactions on
Parallel and Distributed Systems 18 (2007) 393–408.[23] J.S. Vetter, F. Mueller. Communication characteristics of large-scale scientific applications for contemporary cluster architectures, in: Proceedings
International Parallel and Distributed Processing Symposium (IPDPS), 2002.[24] W. J. Dally, P. Carvey, L. Dennison. Architecture of the Avici terabit switch/router, in: Proceedings of the Hot Interconnects 6 Symposium, August 1998,
pp. 41–50,[25] Hang-Sheng Wang, Li-Shiuan Peh, Sharad Malik, A power model for routers: modeling alpha 21364 and infiniband routers, IEEE Micro (2003) 26–34.
January–February.[26] Hang-Sheng Wang, Xinping Zhu, Li-Shiuan Peh, Sharad Malik. Orion: a power-performance simulator for interconnection networks, in: Proceedings of
the 35th International Symposium on Microarchitecture (MICRO), November 2002, pp. 294–305.