Performance of Anidolic Daylighting Systems in tropical climates – Parametric studies for...
10
Performance of Anidolic Daylighting Systems in tropical climates – Parametric studies for identification of main influencing factors Friedrich Linhart a, * ,1 , Stephen K. Wittkopf b , Jean-Louis Scartezzini a,1 a Solar Energy and Building Physics Laboratory (LESO-PB), Swiss Federal Institute of Technology in Lausanne (EPFL), 1015 Lausanne, Switzerland b School of Design and Environment, Department of Architecture, National University of Singapore, 4 Architecture Drive, Singapore 117566, Singapore Received 29 July 2008; received in revised form 20 August 2009; accepted 14 January 2010 Available online 27 April 2010 Communicated by: Associate Editor Harvey Bryan Abstract Making daylight more available in buildings is highly desirable, not only for reasons of energy-efficiency, but also for improvement of occupants’ health and well-being. Core-daylighting, that is daylight provision in areas situated at considerable distances from fac ßades and windows, is currently one of the main challenges in sustainable building design. Anidolic Daylighting Systems (ADSs) are one very promising technology in the field of core-daylighting, but commercial solutions that are not only well-performing but also financially competitive are not yet widely available. This article presents results of parametric studies on Anidolic Integrated Ceilings (AICs), a spe- cial type of ADS, for identification of main influencing factors. The article describes a reliable method for simulating ADS and AIC performance under given sky conditions. Various simulation results for the example location Singapore are discussed in detail, it is con- cluded that the main influencing factors are coating material, system dimensions and external obstruction, and those influencing factors’ potential impacts are quantified. It is shown that AIC overall efficiencies can reach up to almost 50% in Singapore. The essentially new results presented in this article can be of great help to architects, engineers and scientists in the future, when it comes to precisely dimen- sioning ADS for various buildings and daylight conditions. Ó 2010 Elsevier Ltd. All rights reserved. Keywords: Daylight; Anidolic; Office lighting 1. Introduction Reducing the artificial lighting load is one important step towards sustainable and energy-efficient buildings. It can be supposed to have a major impact on the CO 2 -foot- print of buildings because the demand for artificial lighting usually peaks at times of high electricity demand (i.e. dur- ing peak load) when fossil fuel consuming power genera- tors are used to meet our societies’ electricity needs (Aries and Newsham, 2008). Artificial lighting load reduction is particularly important in office buildings, where up to 40% of the overall electricity consumption can be caused by electric lighting (Jenkins and Newborough, 2007; Li et al., 2006; Wah Tong To et al., 2002). Outdoor illumi- nances often exceed the required workplane illuminances inside office buildings by several orders of magnitude. If sufficient daylight flux can be made available in office spaces without disturbing the occupants (e.g. through dis- comfort glare), the artificial lighting load can be drastically reduced and large amounts of electricity can be saved (Li et al., 2006; Wah Tong To et al., 2002). Ideally, artificial lighting might be less needed, depending on the glazing’s optical properties, window orientation and time of day (Linhart and Scartezzini, 2007, 2009). Making daylight more available in buildings is not only highly desirable for reasons of energy efficiency, but also for improvement of occupants’ health and well-being (Veitch, 2006). Core-daylighting, that is daylight provision in areas sit- uated at considerable distances from fac ßades and windows, 0038-092X/$ - see front matter Ó 2010 Elsevier Ltd. All rights reserved. doi:10.1016/j.solener.2010.01.014 * Corresponding author. Tel.: +41 21 6934540; fax: +41 21 6932722. E-mail address: friedrich.linhart@epfl.ch (F. Linhart). 1 ISES member. www.elsevier.com/locate/solener Available online at www.sciencedirect.com Solar Energy 84 (2010) 1085–1094
Transcript of Performance of Anidolic Daylighting Systems in tropical climates – Parametric studies for...

Available online at www.sciencedirect.com
www.elsevier.com/locate/solener
Solar Energy 84 (2010) 1085–1094
Performance of Anidolic Daylighting Systems in tropical climates– Parametric studies for identification of main influencing factors
Friedrich Linhart a,*,1, Stephen K. Wittkopf b, Jean-Louis Scartezzini a,1
a Solar Energy and Building Physics Laboratory (LESO-PB), Swiss Federal Institute of Technology in Lausanne (EPFL), 1015 Lausanne, Switzerlandb School of Design and Environment, Department of Architecture, National University of Singapore, 4 Architecture Drive, Singapore 117566, Singapore
Received 29 July 2008; received in revised form 20 August 2009; accepted 14 January 2010Available online 27 April 2010
Communicated by: Associate Editor Harvey Bryan
Abstract
Making daylight more available in buildings is highly desirable, not only for reasons of energy-efficiency, but also for improvement ofoccupants’ health and well-being. Core-daylighting, that is daylight provision in areas situated at considerable distances from fac�adesand windows, is currently one of the main challenges in sustainable building design. Anidolic Daylighting Systems (ADSs) are one verypromising technology in the field of core-daylighting, but commercial solutions that are not only well-performing but also financiallycompetitive are not yet widely available. This article presents results of parametric studies on Anidolic Integrated Ceilings (AICs), a spe-cial type of ADS, for identification of main influencing factors. The article describes a reliable method for simulating ADS and AICperformance under given sky conditions. Various simulation results for the example location Singapore are discussed in detail, it is con-cluded that the main influencing factors are coating material, system dimensions and external obstruction, and those influencing factors’potential impacts are quantified. It is shown that AIC overall efficiencies can reach up to almost 50% in Singapore. The essentially newresults presented in this article can be of great help to architects, engineers and scientists in the future, when it comes to precisely dimen-sioning ADS for various buildings and daylight conditions.� 2010 Elsevier Ltd. All rights reserved.
Keywords: Daylight; Anidolic; Office lighting
1. Introduction
Reducing the artificial lighting load is one importantstep towards sustainable and energy-efficient buildings. Itcan be supposed to have a major impact on the CO2-foot-print of buildings because the demand for artificial lightingusually peaks at times of high electricity demand (i.e. dur-ing peak load) when fossil fuel consuming power genera-tors are used to meet our societies’ electricity needs (Ariesand Newsham, 2008). Artificial lighting load reduction isparticularly important in office buildings, where up to40% of the overall electricity consumption can be causedby electric lighting (Jenkins and Newborough, 2007; Li
0038-092X/$ - see front matter � 2010 Elsevier Ltd. All rights reserved.
doi:10.1016/j.solener.2010.01.014
* Corresponding author. Tel.: +41 21 6934540; fax: +41 21 6932722.E-mail address: [email protected] (F. Linhart).
1 ISES member.
et al., 2006; Wah Tong To et al., 2002). Outdoor illumi-nances often exceed the required workplane illuminancesinside office buildings by several orders of magnitude. Ifsufficient daylight flux can be made available in officespaces without disturbing the occupants (e.g. through dis-comfort glare), the artificial lighting load can be drasticallyreduced and large amounts of electricity can be saved (Liet al., 2006; Wah Tong To et al., 2002). Ideally, artificiallighting might be less needed, depending on the glazing’soptical properties, window orientation and time of day(Linhart and Scartezzini, 2007, 2009). Making daylightmore available in buildings is not only highly desirablefor reasons of energy efficiency, but also for improvementof occupants’ health and well-being (Veitch, 2006).
Core-daylighting, that is daylight provision in areas sit-uated at considerable distances from fac�ades and windows,

1086 F. Linhart et al. / Solar Energy 84 (2010) 1085–1094
is currently one of the main challenges in sustainable build-ing design. Horizontal mirror light ducts are one verypromising technology in the field of core-daylighting, butcommercial solutions that are not only well-performingbut also financially competitive are rare. Rosemann et al.have recently presented a “cost-effective solar illuminationsystem” and have shown its large potential for daylightingunder clear sky conditions (Rosemann et al., 2008). Fortropical locations with predominantly overcast skies,cost-effective daylighting systems are nevertheless not yetwidely available. Anidolic Daylighting Systems (ADSs)(Scartezzini and Courret, 2002), often composed of a fac�-ade-integrated collector system and a horizontal mirrorlight duct inside the building, have proven to perform wellunder overcast skies (Wittkopf, 2006; Wittkopf et al., 2006)and are therefore considered to be a very interesting optionfor daylighting in tropical regions. But so far, mainly pro-totype ADS exist (Linhart and Scartezzini, 2007). If ADSare to become a real option for grand scale building inte-gration, it is necessary to take a close look at the differentparameters that influence such systems’ performances inorder to find appropriate solutions for different types ofbuildings. The study presented in this article had twoobjectives:
(1) Quantifying the influences of different design criteriaon the overall efficiency of the Anidolic IntegratedCeiling, one common ADS type.
(2) Giving a sound overview of a convenient, quick andreliable method for simulating the performance ofADS under given sky conditions.
This article presents results of parametric studies onADS recently carried out at the National University of Sin-gapore and the Swiss Federal Institute of Technology inLausanne using the lighting simulation tool “Photopia”
(Lighting Technologies Inc., 2008). Section 2 of this articlegives an overview of the Photopia computer model. Thesetup of appropriate Virtual Sky Domes (VSDs) to repre-sent the typical Singapore daylight climate and their inte-gration into the computer model are explained. The ADSthat served as a reference case for our parametric studiesis also presented in Section 2. Section 3 introduces a setof relevant design criteria (i.e. coating material, systemdimensions and external shading) and appropriate perfor-mance indicators (global and partial efficiencies). Section4 then explains how modifying these design parametersaffects the system’s performance. A summarizing conclu-sion is finally given in Section 5 and scope for further workis discussed.
2. Computer model
2.1. Simulated Anidolic Daylighting System (ADS)
The ADS, on which the parametric studies presented inthis article are based, has first been presented by Courret
et al. (1998). Its performance has been thoroughly com-pared to other ADS by Courret et al. (1999) and by Scar-tezzini and Courret (2002), who have referred to it as theAnidolic Integrated Ceiling (AIC). Its performance underdifferent sky types (i.e. in tropical, subtropical and tem-pered climates) has been simulated by Wittkopf (2006)and Wittkopf et al. (2006). These simulations have shownthat the AIC is particularly interesting for tropical loca-tions with predominantly overcast skies like, for example,Singapore. One main reason for this good performance isthe fact that the highest sky luminances are often foundwithin the zenithal area of the sky at such locations. TheAIC makes it possible to collect much more light fromthe zenithal sky areas than a normal vertical windowbecause it is tilted towards the sky (whereas normal win-dows rather face opposite buildings than the much moreluminous sky). In 2007, a highly energy-efficient officelighting solution based on the AIC for a Singapore officeroom has been presented by Linhart and Scartezzini(2007). Fig. 1 shows an overview of the AIC.
The system has three major components: the collectoron the external side of the fac�ade, the rectangular mirrorlight duct and the distributing element (distributor) at theend of the duct. The system has been designed followingthe non-imaging optics theory (Welford and Wilson,1989): roughly speaking, non-imaging optics providedesign methods for applications, where high concentrationfactors matter more than clear images. For the sake of theimage being distorted, very high concentration factorsbecome possible (Wilson et al., 2005). The term “anidolic”has been chosen to describe non-image-forming daylightingdevices that are strictly based on non-imaging optics: inAncient Greek, “an” means “without” whereas “eidolon”
signifies “image”. The system collects daylight from thesky vault through the Compound Parabolic Concentrator(CPC) – type collector. The latter has been designed usingthe method of variable extreme rays introduced by Gordonand Rabl (1992), making the system particularly interestingfor multi-storey applications where the shading effects ofthe collectors on superior floors on the ones situated onlower floors have to be minimized (Scartezzini and Courret,2002; Courret et al., 1998).
2.2. Virtual Sky Domes (VSDs) and definition
of a representative sky for Singapore
The use of software tools for simulating lighting condi-tions in buildings and exterior spaces is nowadays wide-spread (Reinhart and Fitz, 2006). However, in terms ofdaylight simulation, many of the currently available basiclighting simulation tools have one significant shortcoming:they tend to over-simplify the daylight calculations by tak-ing into account only a very limited number of sky types.As shown by Wittkopf et al. (2006), it is highly desirableto make use of the entire set of 15 CIE/ISO standard skytypes when simulating daylight, as over-simplification atthis point of the simulations can heavily bias their

2.650.67
3.59 0.92
0.51
Roller blindDoubleglazing
Doubleglazing
Organic glazing
Light-duct
Anidolic distributor element
Anidolic collector elements
6m5m4m3m1m 2m0m
Fig. 1. AIC as introduced by Courret et al. (1998). Sunlight and diffuse daylight emitted from the sky vault enters the AIC’s protruding part and hits theanidolic collector element. From there, it is redirected into the light duct.
Fig. 2. Virtual Sky Dome (VSD) composed of 145 distinct sky patchesused for our simulations. The sky patch luminances given in Table 2 havebeen used for setting up the VSD in Photopia.
F. Linhart et al. / Solar Energy 84 (2010) 1085–1094 1087
accuracy. The Virtual Sky Dome (VSD) approach is oneway to overcome these problems (Kittler et al., 2006) andhas proven to be applicable to simulations with differentsoftware tools (Wittkopf, 2004, 2005). In particular, itwas shown in 2006 that the VSD-method yields similarresults with the software tools Lightscape, Radiance andPhotopia and that such simulations are in good accordancewith measured data (Wittkopf et al., 2006). A VSD is basi-cally a hemisphere composed of 145 patches. It imitates thespatial luminance distribution of the sky vault by 145 dis-tinct light sources whose distribution over the hemispherefollows the conventions of sky patch luminance measure-ments and whose individual luminous flux are calculatedusing a special set of equations for the 15 sky types (Kittleret al., 2006; Kittler and Darula, 2002). Fig. 2 shows anillustration of the VSD. The VSD approach is based onthe daylight coefficient approach introduced by Tregenzaand Waters (1983), the shape of the sky elements being,however, slightly modified. As shown by Tregenza (1999),four sky types out of the 15 CIE standard sky types canbe considered sufficient for representing the daylight condi-tions in Singapore. Table 1 gives an overview of these skytypes and their relative occurrence.
As it is was not the objective of this study to predict theactual performance of one specific daylighting system, butrather to investigate how changing the system’s parametersinfluences its performance at a given location, we havedefined a representative sky for Singapore based on thefour predominant sky types shown in Table 1. This Singa-pore Representative Sky (SPRS) was then used for all sim-ulations. A similar approach has already been used byWittkopf et al. (2006). Sky patch luminances for VSDsbased on the most recent knowledge on real sky luminancescan be obtained from www.virtualskydomes.org (VirtualSky Domes, 2009). The user must specify the radius of
the desired sky hemisphere as well as sun azimuth and alti-tude and can then obtain various data for the resulting
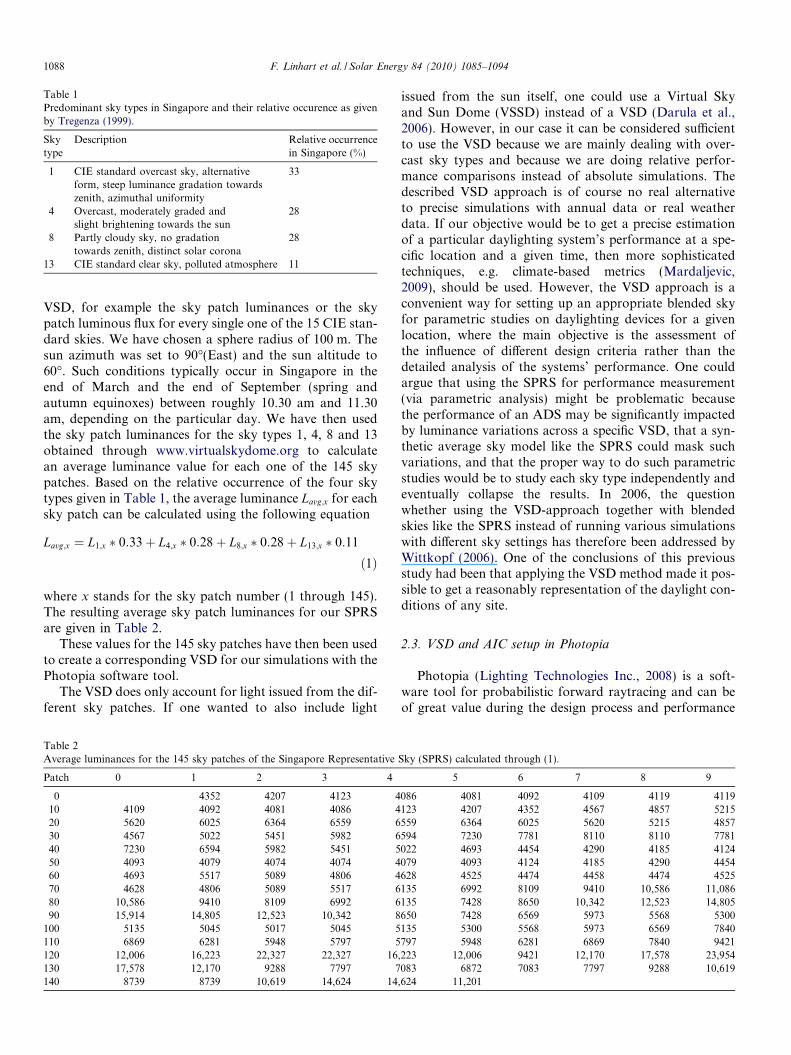
Table 1Predominant sky types in Singapore and their relative occurence as givenby Tregenza (1999).
Skytype
Description Relative occurrencein Singapore (%)
1 CIE standard overcast sky, alternativeform, steep luminance gradation towardszenith, azimuthal uniformity
33
4 Overcast, moderately graded andslight brightening towards the sun
28
8 Partly cloudy sky, no gradationtowards zenith, distinct solar corona
28
13 CIE standard clear sky, polluted atmosphere 11
1088 F. Linhart et al. / Solar Energy 84 (2010) 1085–1094
VSD, for example the sky patch luminances or the skypatch luminous flux for every single one of the 15 CIE stan-dard skies. We have chosen a sphere radius of 100 m. Thesun azimuth was set to 90�(East) and the sun altitude to60�. Such conditions typically occur in Singapore in theend of March and the end of September (spring andautumn equinoxes) between roughly 10.30 am and 11.30am, depending on the particular day. We have then usedthe sky patch luminances for the sky types 1, 4, 8 and 13obtained through www.virtualskydome.org to calculatean average luminance value for each one of the 145 skypatches. Based on the relative occurrence of the four skytypes given in Table 1, the average luminance Lavg;x for eachsky patch can be calculated using the following equation
Lavg;x ¼ L1;x � 0:33þ L4;x � 0:28þ L8;x � 0:28þ L13;x � 0:11
ð1Þ
where x stands for the sky patch number (1 through 145).The resulting average sky patch luminances for our SPRSare given in Table 2.
These values for the 145 sky patches have then been usedto create a corresponding VSD for our simulations with thePhotopia software tool.
The VSD does only account for light issued from the dif-ferent sky patches. If one wanted to also include light
Table 2Average luminances for the 145 sky patches of the Singapore Representative
Patch 0 1 2 3 4
0 4352 4207 4123 410 4109 4092 4081 4086 420 5620 6025 6364 6559 630 4567 5022 5451 5982 640 7230 6594 5982 5451 550 4093 4079 4074 4074 460 4693 5517 5089 4806 470 4628 4806 5089 5517 680 10,586 9410 8109 6992 690 15,914 14,805 12,523 10,342 8
100 5135 5045 5017 5045 5110 6869 6281 5948 5797 5120 12,006 16,223 22,327 22,327 16130 17,578 12,170 9288 7797 7140 8739 8739 10,619 14,624 14
issued from the sun itself, one could use a Virtual Skyand Sun Dome (VSSD) instead of a VSD (Darula et al.,2006). However, in our case it can be considered sufficientto use the VSD because we are mainly dealing with over-cast sky types and because we are doing relative perfor-mance comparisons instead of absolute simulations. Thedescribed VSD approach is of course no real alternativeto precise simulations with annual data or real weatherdata. If our objective would be to get a precise estimationof a particular daylighting system’s performance at a spe-cific location and a given time, then more sophisticatedtechniques, e.g. climate-based metrics (Mardaljevic,2009), should be used. However, the VSD approach is aconvenient way for setting up an appropriate blended skyfor parametric studies on daylighting devices for a givenlocation, where the main objective is the assessment ofthe influence of different design criteria rather than thedetailed analysis of the systems’ performance. One couldargue that using the SPRS for performance measurement(via parametric analysis) might be problematic becausethe performance of an ADS may be significantly impactedby luminance variations across a specific VSD, that a syn-thetic average sky model like the SPRS could mask suchvariations, and that the proper way to do such parametricstudies would be to study each sky type independently andeventually collapse the results. In 2006, the questionwhether using the VSD-approach together with blendedskies like the SPRS instead of running various simulationswith different sky settings has therefore been addressed byWittkopf (2006). One of the conclusions of this previousstudy had been that applying the VSD method made it pos-sible to get a reasonably representation of the daylight con-ditions of any site.
2.3. VSD and AIC setup in Photopia
Photopia (Lighting Technologies Inc., 2008) is a soft-ware tool for probabilistic forward raytracing and can beof great value during the design process and performance
Sky (SPRS) calculated through (1).
5 6 7 8 9
086 4081 4092 4109 4119 4119123 4207 4352 4567 4857 5215559 6364 6025 5620 5215 4857594 7230 7781 8110 8110 7781022 4693 4454 4290 4185 4124079 4093 4124 4185 4290 4454628 4525 4474 4458 4474 4525135 6992 8109 9410 10,586 11,086135 7428 8650 10,342 12,523 14,805650 7428 6569 5973 5568 5300135 5300 5568 5973 6569 7840797 5948 6281 6869 7840 9421
,223 12,006 9421 12,170 17,578 23,954083 6872 7083 7797 9288 10,619
,624 11,201

VSD centre
Fig. 3. Schematic view of the AIC used during our simulations. The AICmodel is split into the three distinct components “collector”, “duct” and“distributor”. The centre of the VSD lies in the centre of the collector’slower rim.
F. Linhart et al. / Solar Energy 84 (2010) 1085–1094 1089
evaluation of complex luminaire geometries and non-punc-tual light sources. An extensive material database withdirectional reflectance data for various luminaire materialsis also available for Photopia. The software allows import-ing from and exporting to CAD software (using .dxf or.dwg files), it offers different possibilities to create lampsand luminaries, gives the user various possibilities to assesstheir performance and finally allows exporting some of theperformance data directly into standard lamp descriptionfiles (i.e. IES or EULUMDAT formats).
In the beginning of the study presented in this article, wehave used AutoCAD to create a VSD corresponding to ourSPRS previously presented and have imported it to Photopiaas a lamp. We have also created a model of the previouslypresented AIC with AutoCAD and have imported it to Pho-topia as a luminaire. In order to make the approach abso-lutely clear and to ease further similar simulations, adetailed manual has been written within the framework ofthis study. This manual can be obtained directly from themain author; including it here would be far beyond the scopeof this article. This section therefore only gives an overviewof the VSD and AIC setup in Photopia.
First of all, a generic structure of the VSD has beenestablished with AutoCAD. This structure is composedof the 145 sky patches; one separate layer is used for everysingle patch. In a second step, an appropriate luminancevalue has been associated with every single one of the145 sky patches. This has been done based on the sky patchluminance values given in Table 2. In a third step, the AICintroduced in Section 2.1 has been set up using AutoCAD.The geometry of the system is highly similar to the onesthat served during the simulations of Courret et al.(1998), Wittkopf et al. (2006), Wittkopf (2006), Scartezziniand Courret (2002) and Linhart and Scartezzini (2007). Butunlike in their simulations, no actual room has been mod-eled in our study. The reason for this is that we are onlyinvestigating selected parameters’ influences on this sys-tem’s overall efficiency. The actual light distribution withinan adjacent office room is not the main concern of ourstudy. Our reference planes for measuring illuminancesand daylight flux are situated within the duct and not onthe workplane within the office. Therefore, the room itselfis not necessarily needed in our case. Fig. 3 shows a pictureof the resulting AIC model. The three main components ofthe AIC (i.e. collector, duct and distributor) have each beensaved on a different layer. This makes it possible to use dif-ferent coating materials for each component in Photopia.The AIC was placed in a central location beneath theVSD, the centre point of the VSD being located in the mid-dle of the AIC’s entry aperture’s lower rim (cf. Fig. 3). It isoriented towards the East (azimuth of 90�). This choice isnot arbitrary but has been made due to real case con-straints: the simulations have been carried out within theframework of the planning for a Zero Energy Building inSingapore, which is oriented in this direction. Runningadditional simulations with differently oriented AICs mightbe an interesting option for future studies.
2.4. Reference model definition and performance assessment
As it was the objective of this study to investigate theinfluence of parameter modifications on the AIC’s overallperformance, the definition of an appropriate reference sys-tem was necessary. We have decided to take the model pre-sented by Wittkopf et al. (2006) as our reference. Inaccordance with these simulations, the AIC’s reflective sur-faces were considered to have a perfectly specular reflec-tance of 90%. In a first step, the horizontal diffuseilluminance at the centre of the VSD was calibrated. Thehorizontal diffuse illuminances equaling 12,220, 24,450,48,890 and 36,670 lux for sky types 1, 4, 8 and 13, respec-tively, we find a resulting horizontal diffuse illuminance forthe Singapore Representative Sky (SPRS) ESPRS:
ESPRS ¼ E1 � 0:33þ E4 � 0:28þ E8 � 0:28þ E13 � 0:11 ð2ÞThis equation leads to a value of 28,602 lux for ESPRS.Using linear interpolation, we have found that the “initialrated lumens” – value in the VSD’s .ldf-file has to be setto 441,423 klm to obtain these 28,602 lux at the centre ofour model’s VSD. In a second step, the overall efficiencyof our reference model has been assessed. In order to doso, we have placed two main virtual reference planes inour model; the first one at the AIC’s entry aperture andthe second one at the exit aperture. The precise positionsof these main reference planes (as well as those of two addi-tional reference planes inside the system) are indicated inFig. 4. The reference planes have been divided into surfacesof 0.01 m2 and average illuminances for all surfaces havebeen determined through simulation. In accordance withthe simulations carried out by Courret et al. (1998), thedaylight flux through both reference planes have then becalculated by integrating the obtained average illuminancesover each reference plane. Once the AIC’s entry and exitflux are known, the AIC overall efficiency gAIC is calculatedas follows:
gAIC ¼/out
/in
ð3Þ

Duct
Entry aperture reference plane
Exit aperture reference plane
Collector Distributor
Additional reference planesfor calculating partial efficiencies
Fig. 4. Positions of the reference planes inside the AIC used during oursimulations.
1090 F. Linhart et al. / Solar Energy 84 (2010) 1085–1094
where /in stands for the calculated entry flux of the (unob-structed) AIC and /out stands for the calculated exit flux ofthe AIC. Partial efficiencies for collector, duct and distrib-utor can be calculated analogically by using the additionalreference planes inside the duct (cf. Fig. 4). We have foundan overall efficiency gAIC of 32.5% for our reference model.This value is in good accordance with the overall efficiencyfound by Courret et al. (1998).
3. Design criteria for Anidolic Daylighting Systems
3.1. Coating material
One of the design criteria that this study has focused onis the AIC’s coating material. As described in Section 2, thecoating material used during the simulations by Courretet al. (1998) and Wittkopf et al. (2006) was a hypothetical,perfectly specular coating with a reflectivity of 90%(SPEC90). The choice of this variable strongly influencesthe performance of an AIC and must indeed be considereda main design criterion. For our study, we have thereforechosen three supplementary coating materials from Photo-pia’s material database: one hypothetical, perfectly specu-lar coating with a reflectivity of 80% (SPEC80), onestandard aluminium coating with a reflectivity of 86%(ALU86) as well as one special coating for daylightingapplications with an extremely thin silver layer and a reflec-tivity of 98% (SILVER98). During our simulations, wehave compared the resulting AIC overall efficiency gAIC
when these different materials are used instead of (or incombination with) SPEC90 (our reference material).
3.2. Width and length modifications
The second design criteria examined during this studyare modifications of the AIC’s dimensions, i.e. the system’slength and width. It is easily understandable that an AIC’soverall efficiency will decrease gradually when its length isincreased (i.e. system distributor moving further and fur-ther into the building core). This is due to the fact thatno reflective coating is 100% reflective: each light ray thattravels through the system is damped (at least slightly) ateach interaction with the coating, and the remaining day-light flux therefore gets smaller and smaller. Comparably
long system lengths will nevertheless be indispensable forcore-daylighting applications in large buildings. In ourexperiments, we have determined the overall efficienciesof AIC’s for duct lengths between 0 and 18 m. Anotherobjective of our study was to find out whether width mod-ifications can also have an influence on the AIC’s perfor-mance. Narrow AIC’s of only 1–2 m of width might bedesirable for reasons of cost reduction in some cases, orfor practical reasons (e.g. ceiling space needed for air-con-ditioning installations) in others. At first sight, one mightthink that width modifications should not have a majorimpact on an AIC’s efficiency. Nevertheless, when an AIC’swidth is decreased, the ratios of lateral surfaces to anidolicelements for example change. This might lead to changingoverall efficiencies. We have attempted to quantify thesepossible variations by running simulations where the AIC’swidth is gradually decreased from the initial 5 m down toonly 1 m of width.
3.3. External shading
The third design criterion our study has attempted todeal with is external shading of the AIC. Fig. 5 visualisesa common type of external shading: the AIC is partlyshaded by a similar AIC on the superior floor. In principle,this type of external shading should only be a minor prob-lem in the case of the system that we are dealing with: asexplained in Section 2, the so-called variable extreme raymethod (Gordon and Rabl, 1992) has been used duringthe design process in order to keep the influence of AICson superior floors as low as possible. Other possiblesources of external shading are overhanging roofs. Thesecan decrease the opening angle available to an AIC’s col-lector much more than protruding collectors on superiorfloors. During our simulations, we have graduallydecreased the opening angle aopening available to our AICmodel from the unobstructed case (“no fac�ade”) to only50� and calculated the system’s performance. It is impor-tant to underline that the “no fac�ade”-case correspondsto a situation where there is not only no obstruction fromdifferent AICs on superior floor levels, but where there iseven no external vertical building surface above the AIC.One could imagine that even such a vertical building fac�adecould influence an AICs performance by blocking out lightrays issued from sky parts situated behind the building.
4. Simulation results
4.1. Material modifications
Our first simulation series focussed on modifications ofthe AIC’s reflective coating. During three initial simulationruns, the coating of the entire AIC was changed fromSPEC90 to SPEC80, then to ALU86 and finally to SIL-VER98. The AIC’s overall efficiency gAIC under our SPRSwas calculated for each of the three newly chosen materials.We found that the AIC overall efficiency gAIC varied

Light-duct
Light-duct
opening
Fig. 5. An AIC can be shaded by the collector element of another AIC situated on a superior floor. The opening angle aopening gets smaller the heavier theexternal obstruction gets.
F. Linhart et al. / Solar Energy 84 (2010) 1085–1094 1091
between 18% and 49% depending on the chosen reflectivecoating. These results are visualised in Fig. 6 (“Entire AIC”
section). Fig. 6 also shows the results of additional simula-tion runs, during which we have only changed the coatingof one AIC component (i.e. collector, duct or distributor)to one of the new materials. The rest of the duct hasremained unchanged (i.e. coated with SPEC90). For com-parison, the reference case (i.e. entire AIC coated withSPEC90, no modifications) is shown in each section ofFig. 6.
These results make it very clear that the choice of theAIC’s reflective coating has an important influence on itsefficiency. The largest variations occur, of course, whenthe entire AIC is coated with a different material. Modifica-tions of only the collector or the duct material can havelarge influences on the AIC overall efficiency as well (i.e.
49%
38%32% 32%
23%29%
18%26%
0%
20%
40%
60%
Entire AIC Collector
Modified
AIC
ove
rall
effic
ienc
y
SILVER98 SPEC90
Fig. 6. Overview of the simulation results for m
up to 12% and 15%, respectively), but the impact of mod-ifications in the distributor’s coating is somewhat smaller(maximum variation of 5%). It has to be kept in mind thatthese results only apply to the case where the AIC is rathershort (duct length of approximately 3 m). The influence ofcoating materials becomes more important in longer AICs.This will be discussed within Section 4.2.
4.2. Width and length modifications
During this second series of simulations, the influencesof length and width modifications on the AIC overall effi-ciency gAIC were examined. In a first step, our referencemodel’s width has been gradually reduced from the initial5 m down to 1 m of width. Fig. 7(left) quantifies the result-ing decrease of gAIC. At 1 m of width, it has dropped from
40%35%32% 32%
27% 31%25%
30%
Duct Distributor
component
ALU86 SPEC80
aterial modifications in the AIC’s coating.

32.5% 32.0% 31.1% 29.7%27.3%30%
40%
2%
AIC width [m]
0%
10%
20%-
5 4 3 2 1
AIC width [m]
0%5 4 3 2 1
-6%
-4%
2%
-8%
Collector Duct Distributor
AIC
ove
rall
effic
ienc
y
Par
tial e
ffici
ency
dec
reas
e
Fig. 7. Left: Decrease of gAIC when the AIC’s width is gradually decreased from 5 m down to 1 m. gAIC drops from 32.5% to 27.3%. Right: Partialefficiencies for collector (i.e. ratio of collector exit flux and collector entry flux), duct and distributor as a function of decreasing AIC width. The mainreason for the decrease in gAIC lies in the strong decrease of the duct’s partial efficiency.
1092 F. Linhart et al. / Solar Energy 84 (2010) 1085–1094
32.5% to only 27.3%. The reason for this decrease lieswithin a massive drop of the duct’s partial efficiency. Thisfact can be observed in Fig. 7(right). From approximately3 m of duct width downwards, its partial efficiency is moreand more reduced the thinner the duct gets. Partial effi-ciency decrease can also be observed for the collector andthe distributor, but it is far less pronounced for thesecomponents.
The decrease in the duct’s partial efficiency can beexplained by the fact that the influence of the duct’s sideelements becomes more important: when the AIC’s widthis reduced, the side elements remain unchanged while thebottom and the top elements of the duct become smaller.These findings can be very helpful for efficiency optimisa-tion in cases where small AIC widths are indispensable(see Section 3). One promising first step in such cases mightbe to focus on the optimisation of the duct’s partial effi-ciency, for example by using better reflective coatings.
Fig. 8 now shows how the AIC’s overall efficiencychanges as a function of duct length for different coatingmaterials. For the entire AIC being coated with SPEC90,gAIC drops from more than 40% (in the case of a very shortduct) to less than 12% for 18 m of duct length. If ALU86 isused for the entire AIC instead of SPEC90, gAIC evolves ina similar way, but the observed overall efficiencies are, of
0%
10%
20%
30%
40%
50%
60%
0 5 10 15 20
AIC
ove
rall
effic
ienc
y
Duct length [m]
SPEC90 SILVER98 ALU86
Fig. 8. gAIC as a function of increased duct length for different coatingmaterials.
course, lower. The best results are obtained when the entireAIC is coated with SILVER98. When SPEC80 is used forlong duct applications, the remaining light flux is quicklyreduced to very small amounts; this case is therefore notshown in Fig. 8. It is worth noting that coating only theduct (and not the entire AIC) with SILVER98 might bean interesting option for long AICs: in this case, thedecrease is quasi-linear and equals approximately 0.9%per meter. Using SILVER98 instead of ALU86 as ductcoating results in a gAIC increase of more than 20%.
4.3. External shading
Our third simulation series dealt with the effect of exter-nal shading on the performance of an AIC. It is obviousthat external shading will always decrease the light fluxdelivered by the system at the inside of a building. Dueto the CPC-like design (based on non-imaging optics) ofthe collector unit and the associated well-defined admissionangles (in our case between 90� and 55�), the performancewill however not decrease as rapidly as one could imagine.Fig. 9(left) shows the AIC’s exit flux for our SPRS againstthe opening angle. Our reference model corresponds to the“no fac�ade”-case where the AIC is installed on the highestfloor of a building. Already for an opening angle of 90�(created by the building’s fac�ade in a multi-storey build-ing), a slight decrease of the AIC’s exit flux can beobserved. The latter decreases more and more as the open-ing angle becomes smaller. The decrease is, however, notlinear but becomes more and more pronounced the smallerthe opening angle gets. This seems to confirm our initialassumption that the exit flux decrease of the system issomewhat smaller than one would expect, at least for nottoo severe shading.
The AIC efficiency gAIC is visualised in Fig. 9(right) fordecreasing opening angles. From the reference case with nofac�ade to an opening angle of only 50�, a decrease in theAIC’s efficiency of approximately 18% occurs. It is impor-tant to underline that we are using the calculated entry fluxof the unobstructed AIC (as in (3)) here, even though thecollector element is now obstructed. Almost no decreasein efficiency would occur if we would use the entry flux
10000
15000
20000
25000
30000
35000
AIC
exi
t flu
x [lm
]
Opening angle [°]
0%
10%
20%
30%
40%
AIC
effic
ienc
y
Opening angle [°]
Fig. 9. Left: AIC exit flux /out as a function of the opening angle aopening. Right: AIC efficiency gAIC as a function of the opening angle aopening.
F. Linhart et al. / Solar Energy 84 (2010) 1085–1094 1093
of each particular obstructed collector, but this would makecomparisons with the other influencing factors verydifficult.
31%
24%
18%
5%
0%
10%
20%
30%
40%
Max
imum
var
iatio
n of
ηA
IC
Influencing parameter
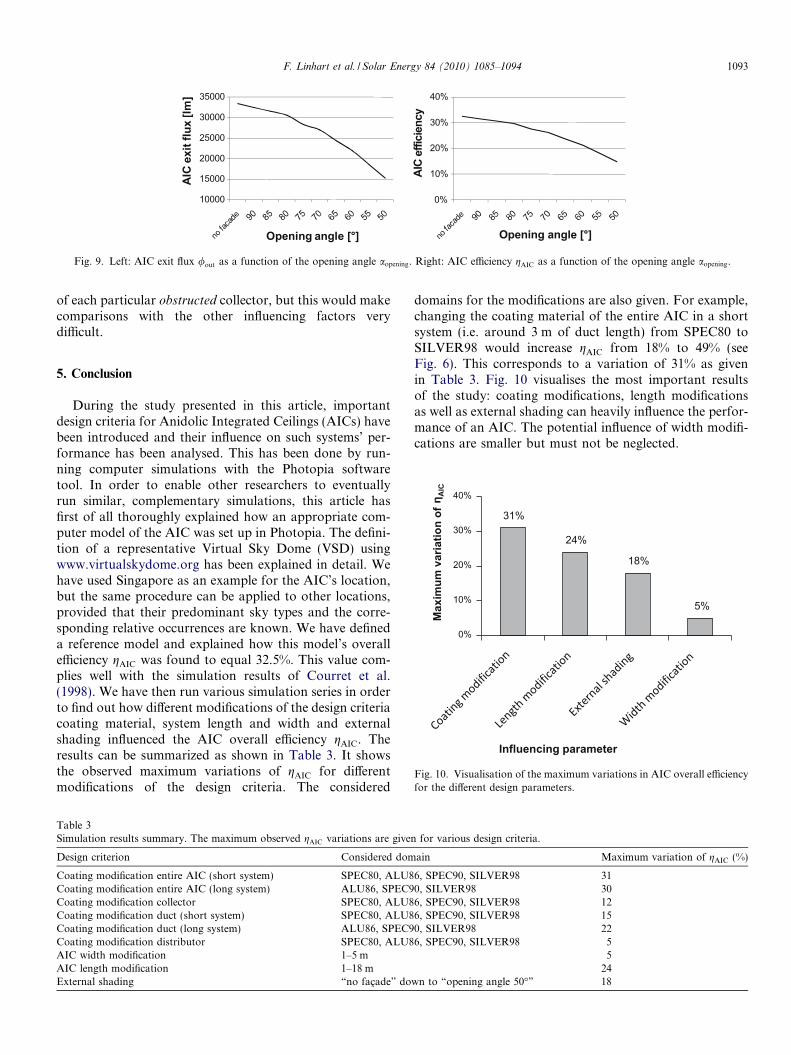
Fig. 10. Visualisation of the maximum variations in AIC overall efficiencyfor the different design parameters.
5. Conclusion
During the study presented in this article, importantdesign criteria for Anidolic Integrated Ceilings (AICs) havebeen introduced and their influence on such systems’ per-formance has been analysed. This has been done by run-ning computer simulations with the Photopia softwaretool. In order to enable other researchers to eventuallyrun similar, complementary simulations, this article hasfirst of all thoroughly explained how an appropriate com-puter model of the AIC was set up in Photopia. The defini-tion of a representative Virtual Sky Dome (VSD) usingwww.virtualskydome.org has been explained in detail. Wehave used Singapore as an example for the AIC’s location,but the same procedure can be applied to other locations,provided that their predominant sky types and the corre-sponding relative occurrences are known. We have defineda reference model and explained how this model’s overallefficiency gAIC was found to equal 32.5%. This value com-plies well with the simulation results of Courret et al.(1998). We have then run various simulation series in orderto find out how different modifications of the design criteriacoating material, system length and width and externalshading influenced the AIC overall efficiency gAIC. Theresults can be summarized as shown in Table 3. It showsthe observed maximum variations of gAIC for differentmodifications of the design criteria. The considered
Table 3Simulation results summary. The maximum observed gAIC variations are given
Design criterion Considered dom
Coating modification entire AIC (short system) SPEC80, ALU8Coating modification entire AIC (long system) ALU86, SPEC9Coating modification collector SPEC80, ALU8Coating modification duct (short system) SPEC80, ALU8Coating modification duct (long system) ALU86, SPEC9Coating modification distributor SPEC80, ALU8AIC width modification 1–5 mAIC length modification 1–18 mExternal shading “no fac�ade” do
domains for the modifications are also given. For example,changing the coating material of the entire AIC in a shortsystem (i.e. around 3 m of duct length) from SPEC80 toSILVER98 would increase gAIC from 18% to 49% (seeFig. 6). This corresponds to a variation of 31% as givenin Table 3. Fig. 10 visualises the most important resultsof the study: coating modifications, length modificationsas well as external shading can heavily influence the perfor-mance of an AIC. The potential influence of width modifi-cations are smaller but must not be neglected.
for various design criteria.
ain Maximum variation of gAIC (%)
6, SPEC90, SILVER98 310, SILVER98 306, SPEC90, SILVER98 126, SPEC90, SILVER98 150, SILVER98 226, SPEC90, SILVER98 5
524
wn to “opening angle 50�” 18

1094 F. Linhart et al. / Solar Energy 84 (2010) 1085–1094
This study not only explains a quick and reliable methodto study the performance of daylighting systems under Vir-tual Sky Domes and gives valuable information on thedependency of an AIC’s overall efficiency on various designcriteria (coating, dimensions, shading effects). It alsoclearly underlines the large potential of Anidolic Daylight-ing Systems in tropical climates with mainly overcast skies.For Singapore sky conditions, we have found a maximumoverall efficiency of 49% for an AIC with 3 m of ductlength. This efficiency corresponds to a light flux of over50 klm or about 20 T5 28 W fluorescent tubes. The essen-tially new results presented in this article can be of greathelp to architects, engineers and scientists in the future,when it comes to precisely dimensioning Anidolic Day-lighting Systems for “real” applications where goodtrade-offs between energy-efficiency and cost are needed.
Acknowledgments
The work described in the article was carried out duringa visiting scholarship at the National University of Singa-pore (NUS) in the end of 2007 and funded by a researchgrant from Singapore Ministry of National Developmentfor the project ’Advanced Daylighting and Photovoltaicin High Performance Envelopes of Buildings in the Tro-pics’. The stay was kindly supported by EPFL and theSwiss Federal Office of Energy. The authors thank MarkJongewaard for his help with the software Photopia.
References
Aries, M.B.C., Newsham, G.R., 2008. Effect of daylight saving time onlighting energy use: a literature review. Energy Policy 36, 1858–1866.
Courret, G., Scartezzini, J.-L., Francioli, D., Meyer, J.-J., 1998. Designand assessment of an anidolic light-duct. Energy and Buildings 28, 79–99.
Courret, G., Scartezzini, J.-L., 1999. Systemes anidoliques d’eclairagenaturel. Ph.D. thesis, Ecole Polytechnique Federale de Lausanne,Switzerland.
Darula, K., Kittler, R., Wittkopf, S.K., 2006. Outdoor illuminance levelsin the tropics and their representation in virtual sky domes. Architec-tural Science Review 49, 301–313.
Gordon, J.M., Rabl, A., 1992. Nonimaging compound parabolic concen-trator-type reflectors with variable extreme direction. Applied Optics31, 7332–7338.
Jenkins, D., Newborough, M., 2007. An approach for estimating thecarbon emissions associated with office lighting with a daylightcontribution. Applied Energy 84, 608–622.
Kittler, R., Darula, S., 2002. IE general sky standard defining luminancedistributions. In: Proceedings of Canadian Conference on BuildingEnergy Simulation (IBPSA-Canada), Montreal, Canada.
Kittler, R., Darula, S., Wittkopf, S.K., 2006. Outdoor illuminance levels inthe tropics and their representation in the virtual sky dome. Architec-tural Science Review 49, 301–313.
Li, D.H.W., Lam, T.N.T., Wong, S.L., 2006. Lighting and energyperformance for an office using high frequency dimming controls.Energy Conversion and Management 47, 1133–1145.
Lighting Technologies Inc.: Photopia website. Available from: <http://www.lighting-technologies.com/Products/Photopia/Photopia/>, lastvisited 07/2008.
Linhart, F., Scartezzini, J.-L., 2007. Efficient lighting strategies for officerooms in tropical climates. In: PLEA 2007. Singapore, pp. 360–367.
Linhart, F., Scartezzini, J.-L., 2009. Minimizing lighting power density inoffice rooms equipped with anidolic daylighting systems. Solar Energy.
Mardaljevic, J., 2009. Climate-based daylight analysis for residentialbuildings. Available from: <www.thedaylightsite.com/>, last visited08/2009.
Reinhart, C., Fitz, A., 2006. Findings from a survey on the current use ofdaylight simulations in building design. Energy and Buildings 38,824835.
Rosemann, A., Mossman, M., Whitehead, L., 2008. Development of acost-effective solar illumination system to bring natural light into thebuilding core. Solar Energy 82, 302–310.
Scartezzini, J.-L., Courret, G., 2002. Anidolic daylighting systems. SolarEnergy 73, 123–135.
Tregenza, P.R., 1999. Standard skies for maritime climates. LightingResearch and Technology 36, 97–106.
Tregenza, P.R., Waters, I.M., 1983. Daylight coefficients. LightingResearch and Technology 15, 6571.
Veitch, J., 2006. Lighting for high-quality work-places. In: Clements-Croome, Derek (Ed.), Creating the Productive Workplace, second ed.Taylor & Francis, London, pp. 206–222.
Virtual Sky Domes: Virtual Sky Domes website. Available from: <http://www.virtualskydome.org/>, last visited 07/2009.
Wah Tong To, D., Sing, L.K., Chung, T.M., Leung, C.S., 2002. Potentialenergy saving for a side-lit room using daylight-linked fluorescent lampinstallations. Lighting Research and Technology 34, 121–133.
Welford, W.T., Wilson, R., 1989. Non-Imaging Optics. Academic Press,New York.
Wilson, R., Miano, J.C., Bentez, P., 2005. Nonimaging Optics. ElsevierAcademic Press, Burlington, San Diego, London.
Wittkopf, S.K., 2004. A method to construct virtual sky domes for use instandards CAD-based light simulation software. Architectural ScienceReview 47, 275286.
Wittkopf, S.K., 2005. Evaluation of virtual sky domes for the predictionof daylight performance with radiosity-based light simulation soft-ware. Architectural Science Review 48.
Wittkopf, S.K., 2006. Daylight performance of anidolic ceiling underdifferent sky conditions. Solar Energy 81, 151–161.
Wittkopf, S.K., Yuniarti, E., Soon, L.K., 2006. Prediction of energysavings with anidolic integrated ceiling across different daylightclimates. Energy and Buildings 38, 1120–1129.
Wittkopf, S., Soon, L.K., Yuniarti, E., Grobe, L., 2006. Virtual sky domesmaking the CIE/ISO standard general sky available for CAD-basedlight simulation software. In: Proceedings IBPSA-Canadas 4th Bien-nial Building Performance Simulation Conference, Toronto, Canada.