Performance Evaluation of Quality of Service (QoS) based ...
24
Performance Evaluation of Quality of Service (QoS) based Web Service Selection Methods for Healthcare Product Shopping Domain Using Analysis of Variance (ANOVA) Maheswari S ( [email protected] ) National Engineering College Pitchai R B V Raju Institute of Technology Supraja P SRM Institute of Science and Technology Babu S SRM Institute of Science and Technology Research Article Keywords: QoS, Analytical Hierarchical preparing, Logical Scoring Preference, Fuzzy Topsis, ANOVA, Health care product shopping domain. Posted Date: March 17th, 2021 DOI: https://doi.org/10.21203/rs.3.rs-266535/v1 License: This work is licensed under a Creative Commons Attribution 4.0 International License. Read Full License
-
Upload
khangminh22 -
Category
Documents
-
view
1 -
download
0
Transcript of Performance Evaluation of Quality of Service (QoS) based ...
Performance Evaluation of Quality of Service (QoS)based Web Service Selection Methods forHealthcare Product Shopping Domain UsingAnalysis of Variance (ANOVA)Maheswari S ( [email protected] )
National Engineering CollegePitchai R
B V Raju Institute of TechnologySupraja P
SRM Institute of Science and TechnologyBabu S
SRM Institute of Science and Technology
Research Article
Keywords: QoS, Analytical Hierarchical preparing, Logical Scoring Preference, Fuzzy Topsis, ANOVA,Health care product shopping domain.
Posted Date: March 17th, 2021
DOI: https://doi.org/10.21203/rs.3.rs-266535/v1
License: This work is licensed under a Creative Commons Attribution 4.0 International License. Read Full License
Performance Evaluation of Quality of Service (QoS) based Web Service
Selection Methods for Healthcare Product Shopping Domain using Analysis of
Variance (ANOVA)
1Maheswari S, Pitchai R2, Supraja P3, Babu S4
1Department of Computer Science and Engineering, National Engineering College, Kovilpatti-623501, India. 2Department of Computer Science and Engineering, B V Raju Institute of Technology, Narsapur, Telangana, India.
3,4School of Computing, SRM Institute of Science and Technology, Kattankulathur, India [email protected], [email protected], [email protected], [email protected]
Abstract--- Guaranteeing Quality of Service (QoS) concerning web administrations is the capacity to respond to the
necessities and comprehend the prerequisites according to the tendencies of a client. It is resolved subject to the non-
practical properties of the web administrations. Dependent upon the conditions, administrations clients may have an
extent of tendencies for the non utilitarian principles. This made a way for different QoS based web administrations
assurance segments which along these lines require an evaluation plot for grasping a particular methodology.
Investigation of change is a particular kind of verifiable hypothesis testing used for making decisions using data.
The goal of the paper is to dismember the plans specifically Analytical Hierarchical preparing (AHP), Logical
Scoring Preference (LSP) and Fuzzy Topsis reliant on extent of customer tendency norms and investigate them
using Analysis of Variance (ANOVA). QWS dataset has been used for exploring recently referenced three plans.
Preliminary outcomes show that the Fuzzy Topsis contrive beats the other web organization assurance techniques.
Keywords--- QoS; Analytical Hierarchical preparing; Logical Scoring Preference; Fuzzy Topsis; ANOVA;
Health care product shopping domain.
I. INTRODUCTION
With the improvement of number of administrations over the Internet, it is astounding to pick sensible web
administrations among the distinctive web administrations which give similar functionalities proposed by [1]. Non-
practical standards are utilized for productive choice in a space. The ability to offer better types of assistance is
given by Quality of Service (QoS) [21]. While there are various structures available to pick the administrations with
the most imperative QoS score [21], the truth of building a model which takes in the customer's assessing of an
assistance as a huge commitment for assurance is less idea of. The key necessities are QoS limits, Customer
administrations essential, and Service commitments by the master association. This paper considers the QoS
boundaries, for example, reaction time, dependability, adaptability, notoriety, throughput and accessibility, openness
and cost.
There are two normalization techniques are available expected for normalize the QoS regards. Two strategies are
Distance based Normalization and Proportion based Normalization. Separation based standardization procedure
masterminded into two methodologies are Linear Normalization and Vector Normalization. Extent Based
Normalization procedure is Max-Min Normalization. In this paper considers three assistance determination
calculations [7] are Analytic Hierarchic Process (AHP), Logical Scoring Preference with Ordered Weighted
Averaging (LSP with OWA) and Fuzzy with Technique for Order Preference by Similarity to an ideal Solution
(Topsis).AHP is used for Linear Normalization, LSP with OWA is used for Max-Min Normalization and Fuzzy
Topsis using Vector Normalization. The AHP technique considers an arrangement of study guidelines and assorted
decision among which the most ideal decision is to be made by the customer tendencies. It creates a heap for every
assessment models; it's vital factor concerning the customer's pair adroit connections of the factors.
The LSP method uses OWA Operator for web administration determination. These OWA regards are utilized in the
figuring of LSP which continuously helps with situating the administration determination and maintained the
situation of each assist we with choosing the most elevated level assistance in light of the fact that the best one. The
system for Order Preference by Similarity to an ideal Solution (Topsis) to help administration clients and providers
to inspect open web administration determination with fluffy sentiments.
Linear normalization:
In Linear normalization, the weights are assigned directly based on consumer preferences.
Minimizing Maximizing
𝑁𝑜𝑟𝑚(𝑞𝑖,𝑗) = 𝑞𝑖,𝑗𝑚𝑖𝑛/𝑞𝑖,𝑗 𝑁𝑜𝑟𝑚(𝑞𝑖,𝑗) = 𝑞𝑖,𝑗/𝑞𝑖,𝑗𝑚𝑎𝑥 (1)
Vector normalization:
In vector normalization, the weights are allocated dependent on reviews chiefs' insight.
Minimizing 𝑁𝑜𝑟𝑚(𝑞𝑖,𝑗) = 𝑞𝑖,𝑗/𝑞𝑖,𝑗√∑ (𝑞𝑖,𝑗2𝑚𝑖=1 ) Maximizing 𝑁𝑜𝑟𝑚(𝑞𝑖,𝑗) = 1/𝑞𝑖,𝑗√∑ 1𝑞𝑖,𝑗2𝑚𝑖=1 (2)
Max‐Min normalization:
In Max-Min normalization weights are assigned supported user preferences. There are two processes to be
considered and that they are maximization and minimization. If the user wishes to normalize the parameter like
interval and price, then minimization is taken into account or if the user wants to normalize the parameters like
Accessibility, Availability, Reliability, Reputation, Scalability and Throughput, then maximization is taken into
account for service selection.
MinimizingNorm(q_(i,j))=(q_(i,j)-q_(i,jmin))/(q_(i,jmax)-q_(i,jmin))
MaximizingNorm(q_(i,j))=(q_(i,jmax)-q_(i,j))/(q_(i,jmax)-q_(i,jmin)) (3)
Where,
qi,j = the value of ith service and jth parameter, qi,jmin = the minimum value of jth parameter of the ith service,
qi,jmax =the utmost value of jth parameter of the ith service
The goal is to analyze the various strategies for improving the QoS based methodology. To assess the service
process, an analogous examination is formed keen about three Selection strategies. Testing strategies for Analysis of
Variance (ANOVA) device is conversant in lengthen the exhibition of each one in every of these normalization
methods.

The correlation is performed so just one normalization method are often followed and therefore the result yields best
web service to the service consumer. A statistical methodology is finished and that they are talked about in area 5.
The reminder of the paper consists as follows: area 2 examines related work, segment 3 talks about the service
selection methods, and segment 4 presents the exploratory outcomes and Section 6 concludes the paper.
II. RELATED WORK
[1], [2], [3], [10] and [23] proposed match making algorithm, it described using Inputs, Outputs, Pre-conditions and
Effects. The proposed techniques discovery the of relevant web services and also finding the relation between the
concepts.[8],[23] and [21] discussed QoS-based selection of best web service considering users preferences by using
normalization technique and the services are ranked based on the scores of each service. The analysis is made so that
the optimal service is retrieved based on the user’s constraint values of each of the quality attribute. The services
that are redundant are eliminated from those that are relevant. [5] Proposed a service selection based on service
providers.
[11] Proposes a methodology for planning and creating QoS metaphysics and its QoS-based positioning calculation
for assessing Web administrations. It utilizes QoS metaphysics for communicating QoS data and requirements and
an AHP-based positioning calculation for Web administration determination. [6],[9] proposed LSP based web
administration selection.[4],[12] proposed the Fuzzy Topsis technique is utilized to tackle the web administration
choice issue when a gathering of clients have various assessments on assessment. [22] Discussed the aftereffects of
two conventional examinations that researched Web Usability estimation utilizing t-test. This test used to says
invalid theory or substitute speculation. In this paper utilize same speculation test utilizing ANOVA and T-test for
matched methods was led to see which calculations are similarly acceptable. This paper utilize same ANOVA test
for web administration choice calculation.
III. Semantic web service selection Framework
In this paper considers the Health care item space web administration determination strategies. Web based shopping
offers immense comfort so individuals are getting a charge out of it. In the event that you purchase emergency clinic
and on the web, it will save your time that you would have spent wandering around your city searching for a specific
inventory from the nearby clinical stores. Visiting different stores is baffling other than being tedious. So purchasing
clinical items online will assist you with setting aside cash. Viable retailing requires executing an assortment of
strategies to stand out enough to be noticed of your purchaser so you help them deal with squeezing medical care
needs while empowering client dedication.
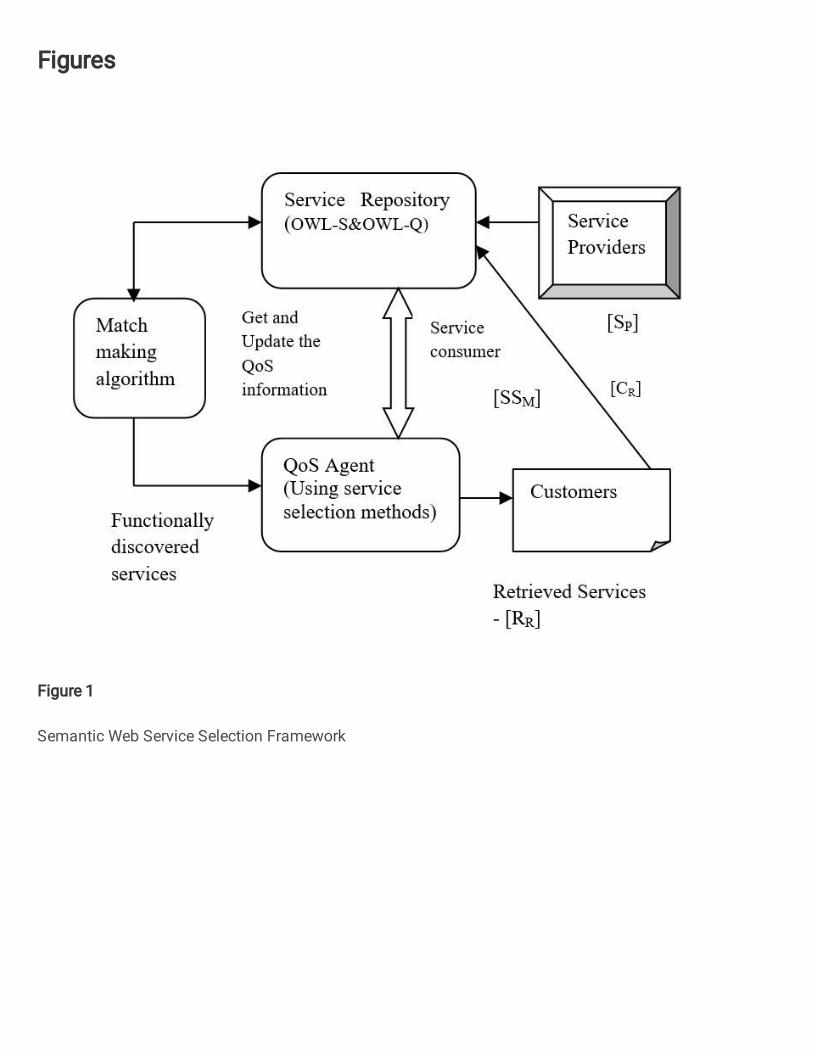
The target of the Framework is to choose the best technique. The Health care product shopping domain Semantic
Web Service Selection Framework is shown in Figure.2.
Where, SP - service provider, CR - Service consumer, SR - service repository, RR - Retrieved result, SSM – Health
care product shopping Service selection Methods
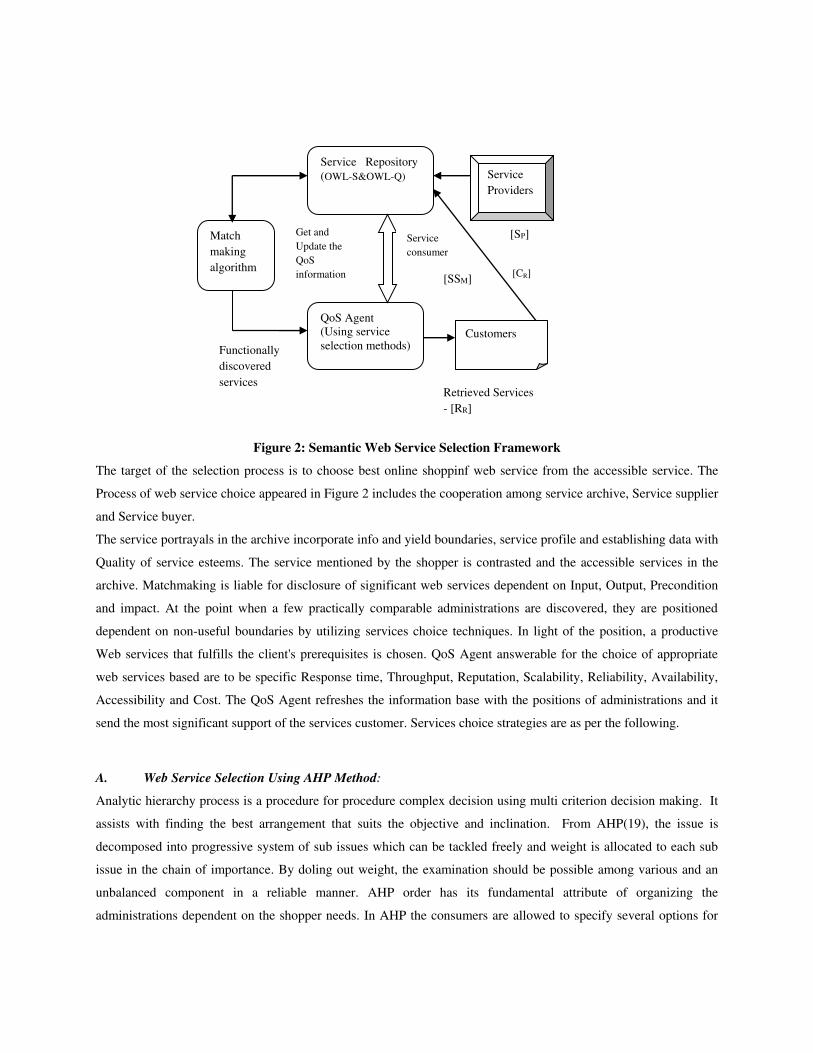
Figure 2: Semantic Web Service Selection Framework
The target of the selection process is to choose best online shoppinf web service from the accessible service. The
Process of web service choice appeared in Figure 2 includes the cooperation among service archive, Service supplier
and Service buyer.
The service portrayals in the archive incorporate info and yield boundaries, service profile and establishing data with
Quality of service esteems. The service mentioned by the shopper is contrasted and the accessible services in the
archive. Matchmaking is liable for disclosure of significant web services dependent on Input, Output, Precondition
and impact. At the point when a few practically comparable administrations are discovered, they are positioned
dependent on non-useful boundaries by utilizing services choice techniques. In light of the position, a productive
Web services that fulfills the client's prerequisites is chosen. QoS Agent answerable for the choice of appropriate
web services based are to be specific Response time, Throughput, Reputation, Scalability, Reliability, Availability,
Accessibility and Cost. The QoS Agent refreshes the information base with the positions of administrations and it
send the most significant support of the services customer. Services choice strategies are as per the following.
A. Web Service Selection Using AHP Method:
Analytic hierarchy process is a procedure for procedure complex decision using multi criterion decision making. It
assists with finding the best arrangement that suits the objective and inclination. From AHP(19), the issue is
decomposed into progressive system of sub issues which can be tackled freely and weight is allocated to each sub
issue in the chain of importance. By doling out weight, the examination should be possible among various and an
unbalanced component in a reliable manner. AHP order has its fundamental attribute of organizing the
administrations dependent on the shopper needs. In AHP the consumers are allowed to specify several options for
[CR]
Match
making
algorithm
Service Repository (OWL-S&OWL-Q)
QoS Agent (Using service selection methods)
Service
Providers
Customers
Functionally
discovered
services Retrieved Services
- [RR]
[SSM]
[SP] Get and
Update the
QoS
information
Service
consumer
selection criteria. Based on the specified criteria AHP takes decision for deciding the best services. Analytic
hierarchy process can be performed using the following steps:
Step 1 : Parameters Decomposition
The initial step is to structure a choice issue and choice standards. The unpredictable choice issue is decayed into its
constituent parts and a progressive system is framed (group1: Performance factor, group 2: Dependability factor,
group 3: Security factor, group4: Business factor). Let us expect that there are M web services and N QoS standards.
Let us take five web services and eight QoS boundaries. Accordingly, M = 5 and N = 8. The eight QoS boundaries
are, for example, Response time, Throughput, Reliability, Scalability, Availability, Accessibility, Reputation, and
Cost.
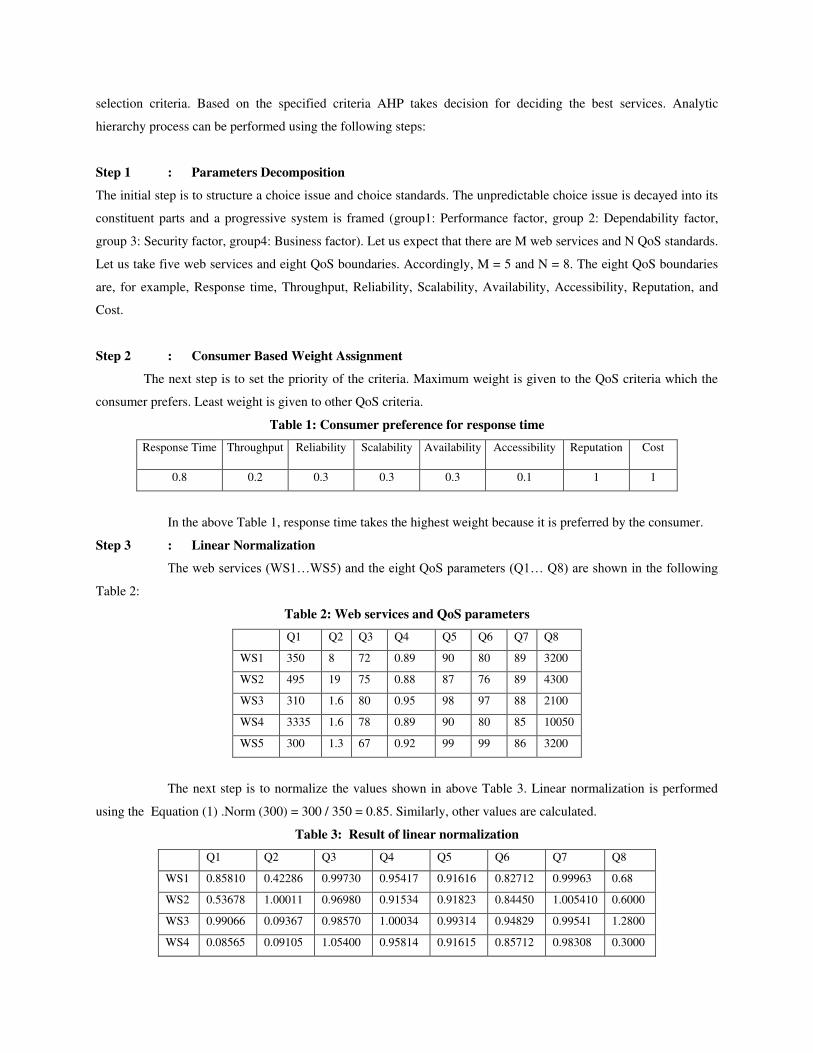
Step 2 : Consumer Based Weight Assignment
The next step is to set the priority of the criteria. Maximum weight is given to the QoS criteria which the
consumer prefers. Least weight is given to other QoS criteria.
Table 1: Consumer preference for response time
Response Time Throughput Reliability Scalability Availability Accessibility Reputation Cost
0.8 0.2 0.3 0.3 0.3 0.1 1 1
In the above Table 1, response time takes the highest weight because it is preferred by the consumer.
Step 3 : Linear Normalization
The web services (WS1…WS5) and the eight QoS parameters (Q1… Q8) are shown in the following
Table 2:
Table 2: Web services and QoS parameters
Q1 Q2 Q3 Q4 Q5 Q6 Q7 Q8
WS1 350 8 72 0.89 90 80 89 3200
WS2 495 19 75 0.88 87 76 89 4300
WS3 310 1.6 80 0.95 98 97 88 2100
WS4 3335 1.6 78 0.89 90 80 85 10050
WS5 300 1.3 67 0.92 99 99 86 3200
The next step is to normalize the values shown in above Table 3. Linear normalization is performed
using the Equation (1) .Norm (300) = 300 / 350 = 0.85. Similarly, other values are calculated.
Table 3: Result of linear normalization
Q1 Q2 Q3 Q4 Q5 Q6 Q7 Q8
WS1 0.85810 0.42286 0.99730 0.95417 0.91616 0.82712 0.99963 0.68
WS2 0.53678 1.00011 0.96980 0.91534 0.91823 0.84450 1.005410 0.6000
WS3 0.99066 0.09367 0.98570 1.00034 0.99314 0.94829 0.99541 1.2800
WS4 0.08565 0.09105 1.05400 0.95814 0.91615 0.85712 0.98308 0.3000
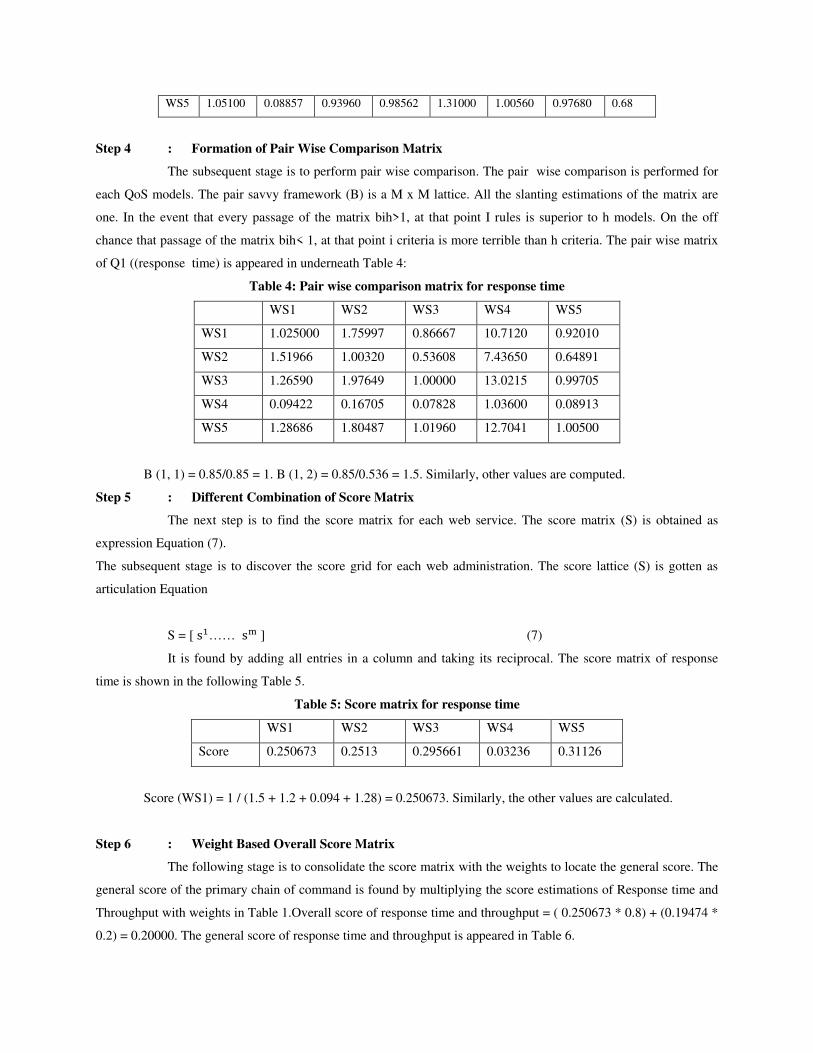
WS5 1.05100 0.08857 0.93960 0.98562 1.31000 1.00560 0.97680 0.68
Step 4 : Formation of Pair Wise Comparison Matrix
The subsequent stage is to perform pair wise comparison. The pair wise comparison is performed for
each QoS models. The pair savvy framework (B) is a M x M lattice. All the slanting estimations of the matrix are
one. In the event that every passage of the matrix bih>1, at that point I rules is superior to h models. On the off
chance that passage of the matrix bih< 1, at that point i criteria is more terrible than h criteria. The pair wise matrix
of Q1 ((response time) is appeared in underneath Table 4:
Table 4: Pair wise comparison matrix for response time
WS1 WS2 WS3 WS4 WS5
WS1 1.025000 1.75997 0.86667 10.7120 0.92010
WS2 1.51966 1.00320 0.53608 7.43650 0.64891
WS3 1.26590 1.97649 1.00000 13.0215 0.99705
WS4 0.09422 0.16705 0.07828 1.03600 0.08913
WS5 1.28686 1.80487 1.01960 12.7041 1.00500
B (1, 1) = 0.85/0.85 = 1. B (1, 2) = 0.85/0.536 = 1.5. Similarly, other values are computed.
Step 5 : Different Combination of Score Matrix
The next step is to find the score matrix for each web service. The score matrix (S) is obtained as
expression Equation (7).
The subsequent stage is to discover the score grid for each web administration. The score lattice (S) is gotten as
articulation Equation
S = [ s1…… sm ] (7)
It is found by adding all entries in a column and taking its reciprocal. The score matrix of response
time is shown in the following Table 5.
Table 5: Score matrix for response time
WS1 WS2 WS3 WS4 WS5
Score 0.250673 0.2513 0.295661 0.03236 0.31126
Score (WS1) = 1 / (1.5 + 1.2 + 0.094 + 1.28) = 0.250673. Similarly, the other values are calculated.
Step 6 : Weight Based Overall Score Matrix
The following stage is to consolidate the score matrix with the weights to locate the general score. The
general score of the primary chain of command is found by multiplying the score estimations of Response time and
Throughput with weights in Table 1.Overall score of response time and throughput = ( 0.250673 * 0.8) + (0.19474 *
0.2) = 0.20000. The general score of response time and throughput is appeared in Table 6.
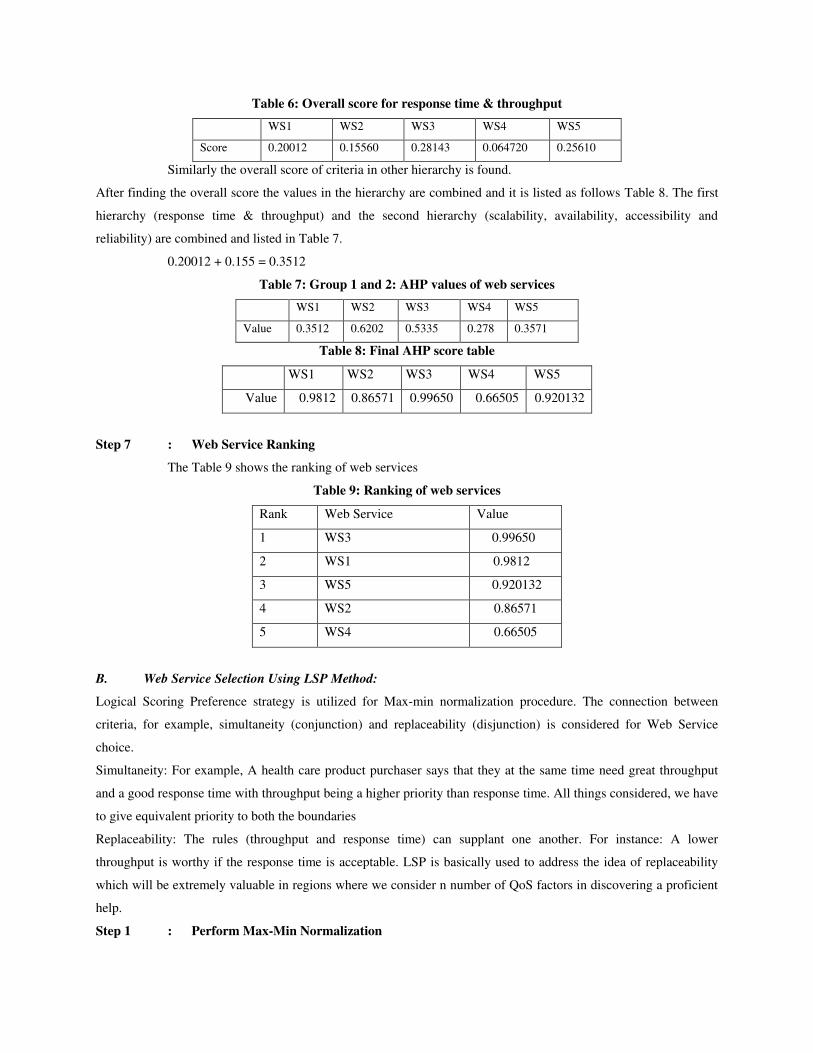
Table 6: Overall score for response time & throughput
WS1 WS2 WS3 WS4 WS5
Score 0.20012 0.15560 0.28143 0.064720 0.25610
Similarly the overall score of criteria in other hierarchy is found.
After finding the overall score the values in the hierarchy are combined and it is listed as follows Table 8. The first
hierarchy (response time & throughput) and the second hierarchy (scalability, availability, accessibility and
reliability) are combined and listed in Table 7.
0.20012 + 0.155 = 0.3512
Table 7: Group 1 and 2: AHP values of web services
WS1 WS2 WS3 WS4 WS5
Value 0.3512 0.6202 0.5335 0.278 0.3571
Table 8: Final AHP score table
WS1 WS2 WS3 WS4 WS5
Value 0.9812 0.86571 0.99650 0.66505 0.920132
Step 7 : Web Service Ranking
The Table 9 shows the ranking of web services
Table 9: Ranking of web services
Rank Web Service Value
1 WS3 0.99650
2 WS1 0.9812
3 WS5 0.920132
4 WS2 0.86571
5 WS4 0.66505
B. Web Service Selection Using LSP Method:
Logical Scoring Preference strategy is utilized for Max-min normalization procedure. The connection between
criteria, for example, simultaneity (conjunction) and replaceability (disjunction) is considered for Web Service
choice.
Simultaneity: For example, A health care product purchaser says that they at the same time need great throughput
and a good response time with throughput being a higher priority than response time. All things considered, we have
to give equivalent priority to both the boundaries
Replaceability: The rules (throughput and response time) can supplant one another. For instance: A lower
throughput is worthy if the response time is acceptable. LSP is basically used to address the idea of replaceability
which will be extremely valuable in regions where we consider n number of QoS factors in discovering a proficient
help.
Step 1 : Perform Max-Min Normalization
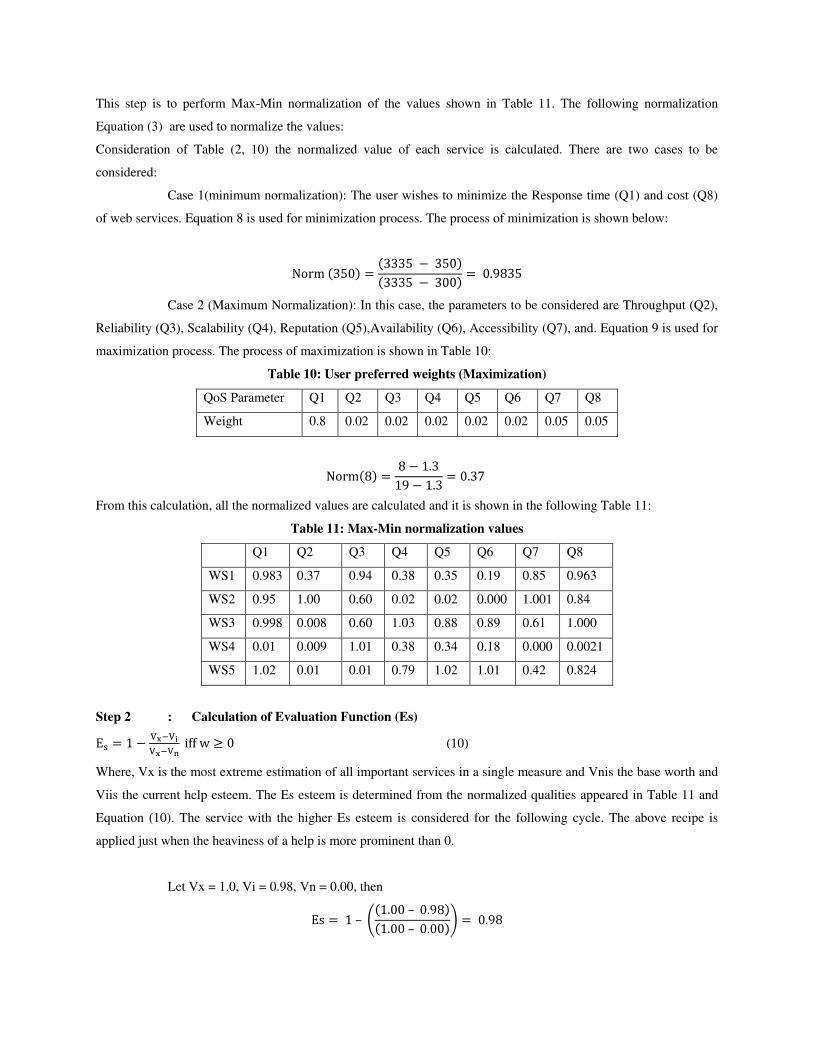
This step is to perform Max-Min normalization of the values shown in Table 11. The following normalization
Equation (3) are used to normalize the values:
Consideration of Table (2, 10) the normalized value of each service is calculated. There are two cases to be
considered:
Case 1(minimum normalization): The user wishes to minimize the Response time (Q1) and cost (Q8)
of web services. Equation 8 is used for minimization process. The process of minimization is shown below:
Norm (350) = (3335 − 350)(3335 − 300) = 0.9835
Case 2 (Maximum Normalization): In this case, the parameters to be considered are Throughput (Q2),
Reliability (Q3), Scalability (Q4), Reputation (Q5),Availability (Q6), Accessibility (Q7), and. Equation 9 is used for
maximization process. The process of maximization is shown in Table 10:
Table 10: User preferred weights (Maximization)
QoS Parameter Q1 Q2 Q3 Q4 Q5 Q6 Q7 Q8
Weight 0.8 0.02 0.02 0.02 0.02 0.02 0.05 0.05
Norm(8) = 8 − 1.319 − 1.3 = 0.37 From this calculation, all the normalized values are calculated and it is shown in the following Table 11:
Table 11: Max-Min normalization values
Q1 Q2 Q3 Q4 Q5 Q6 Q7 Q8
WS1 0.983 0.37 0.94 0.38 0.35 0.19 0.85 0.963
WS2 0.95 1.00 0.60 0.02 0.02 0.000 1.001 0.84
WS3 0.998 0.008 0.60 1.03 0.88 0.89 0.61 1.000
WS4 0.01 0.009 1.01 0.38 0.34 0.18 0.000 0.0021
WS5 1.02 0.01 0.01 0.79 1.02 1.01 0.42 0.824
Step 2 : Calculation of Evaluation Function (Es) Es = 1 − Vx−ViVx−Vn iff w ≥ 0 (10)
Where, Vx is the most extreme estimation of all important services in a single measure and Vnis the base worth and
Viis the current help esteem. The Es esteem is determined from the normalized qualities appeared in Table 11 and
Equation (10). The service with the higher Es esteem is considered for the following cycle. The above recipe is
applied just when the heaviness of a help is more prominent than 0.
Let Vx = 1.0, Vi = 0.98, Vn = 0.00, then Es = 1 – ((1.00 – 0.98)(1.00 – 0.00)) = 0.98
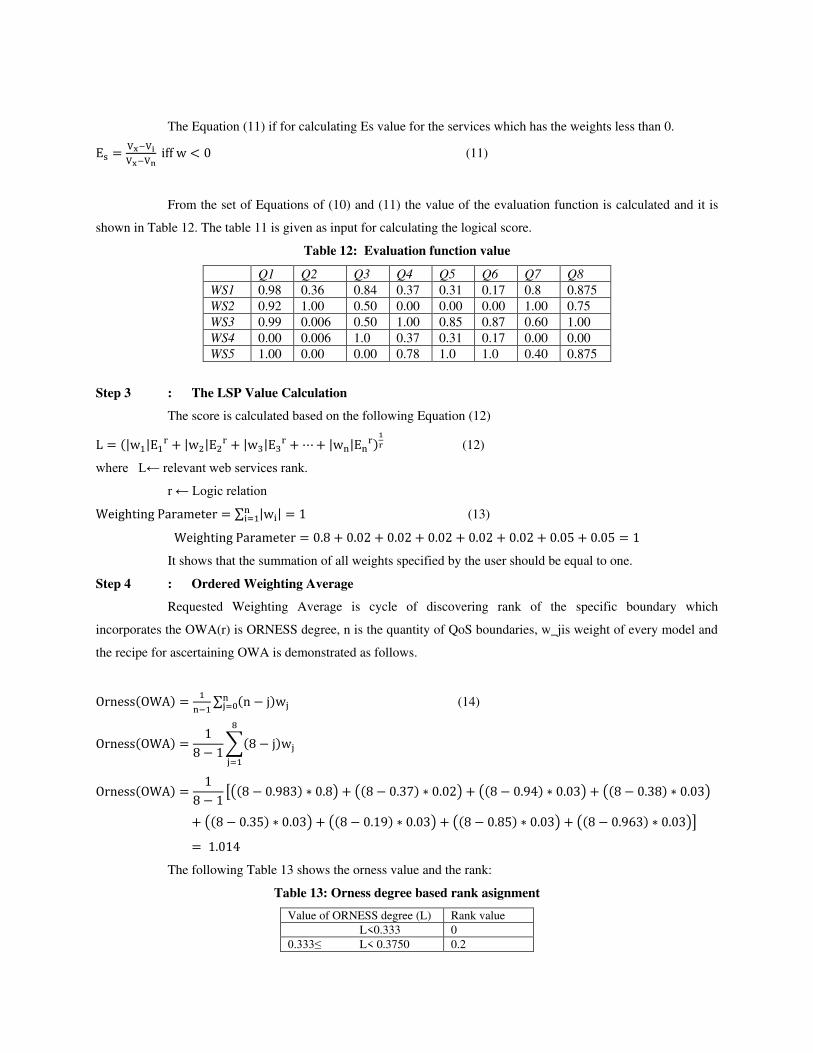
The Equation (11) if for calculating Es value for the services which has the weights less than 0. Es = Vx−ViVx−Vn iff w < 0 (11)
From the set of Equations of (10) and (11) the value of the evaluation function is calculated and it is
shown in Table 12. The table 11 is given as input for calculating the logical score.
Table 12: Evaluation function value
Q1 Q2 Q3 Q4 Q5 Q6 Q7 Q8 WS1 0.98 0.36 0.84 0.37 0.31 0.17 0.8 0.875 WS2 0.92 1.00 0.50 0.00 0.00 0.00 1.00 0.75 WS3 0.99 0.006 0.50 1.00 0.85 0.87 0.60 1.00 WS4 0.00 0.006 1.0 0.37 0.31 0.17 0.00 0.00 WS5 1.00 0.00 0.00 0.78 1.0 1.0 0.40 0.875
Step 3 : The LSP Value Calculation
The score is calculated based on the following Equation (12) L = (|w1|E1r + |w2|E2r + |w3|E3r + ⋯+ |wn|Enr)1r (12)
where L← relevant web services rank.
r ← Logic relation Weighting Parameter = ∑ |wi| = 1ni=1 (13) Weighting Parameter = 0.8 + 0.02 + 0.02 + 0.02 + 0.02 + 0.02 + 0.05 + 0.05 = 1
It shows that the summation of all weights specified by the user should be equal to one.
Step 4 : Ordered Weighting Average
Requested Weighting Average is cycle of discovering rank of the specific boundary which
incorporates the OWA(r) is ORNESS degree, n is the quantity of QoS boundaries, w_jis weight of every model and
the recipe for ascertaining OWA is demonstrated as follows.
Orness(OWA) = 1n−1 ∑ (n − j)wjnj=0 (14)
Orness(OWA) = 18 − 1∑(8 − j)wj8j=1
Orness(OWA) = 18 − 1 [((8 − 0.983) ∗ 0.8) + ((8 − 0.37) ∗ 0.02) + ((8 − 0.94) ∗ 0.03) + ((8 − 0.38) ∗ 0.03)+ ((8 − 0.35) ∗ 0.03) + ((8 − 0.19) ∗ 0.03) + ((8 − 0.85) ∗ 0.03) + ((8 − 0.963) ∗ 0.03)]= 1.014
The following Table 13 shows the orness value and the rank:
Table 13: Orness degree based rank asignment
Value of ORNESS degree (L) Rank value L<0.333 0 0.333≤ L< 0.3750 0.2
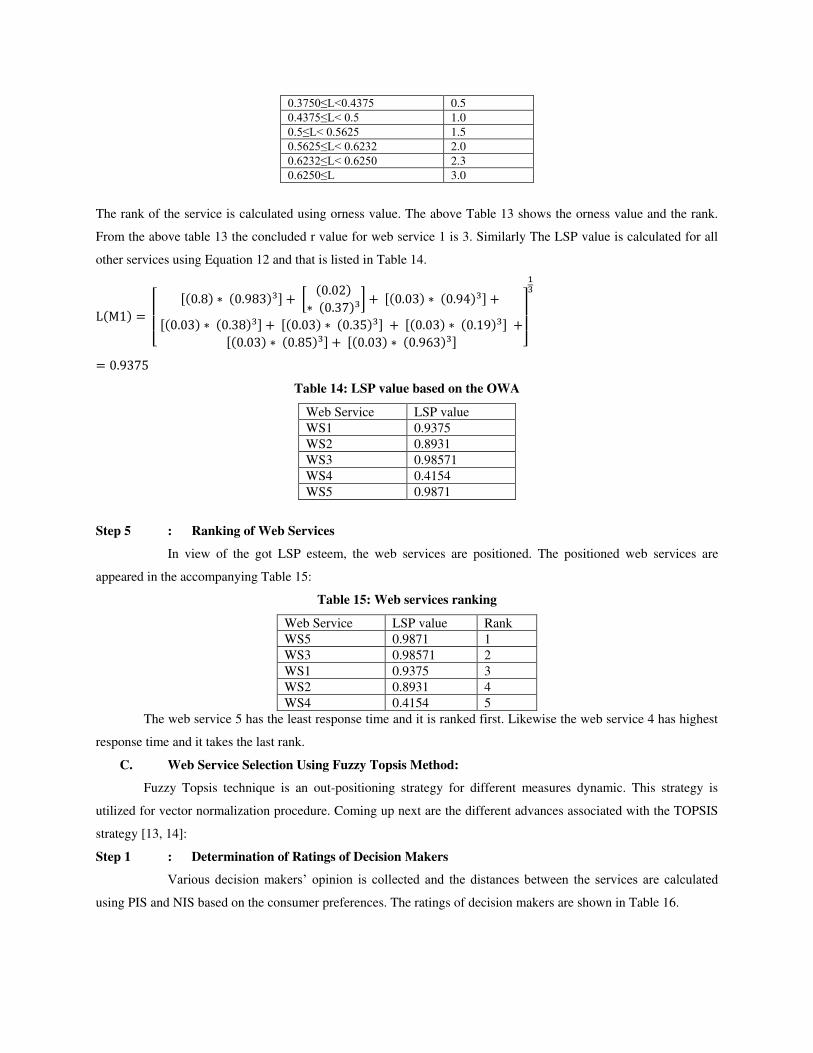
0.3750≤L<0.4375 0.5 0.4375≤L< 0.5 1.0 0.5≤L< 0.5625 1.5 0.5625≤L< 0.6232 2.0 0.6232≤L< 0.6250 2.3 0.6250≤L 3.0
The rank of the service is calculated using orness value. The above Table 13 shows the orness value and the rank.
From the above table 13 the concluded r value for web service 1 is 3. Similarly The LSP value is calculated for all
other services using Equation 12 and that is listed in Table 14.
L(M1) = [ [(0.8) ∗ (0.983)3] + [ (0.02)∗ (0.37)3] + [(0.03) ∗ (0.94)3] + [(0.03) ∗ (0.38)3] + [(0.03) ∗ (0.35)3] + [(0.03) ∗ (0.19)3] + [(0.03) ∗ (0.85)3] + [(0.03) ∗ (0.963)3] ]
13
= 0.9375
Table 14: LSP value based on the OWA
Web Service LSP value WS1 0.9375 WS2 0.8931 WS3 0.98571 WS4 0.4154 WS5 0.9871
Step 5 : Ranking of Web Services
In view of the got LSP esteem, the web services are positioned. The positioned web services are
appeared in the accompanying Table 15:
Table 15: Web services ranking
Web Service LSP value Rank WS5 0.9871 1 WS3 0.98571 2 WS1 0.9375 3 WS2 0.8931 4 WS4 0.4154 5
The web service 5 has the least response time and it is ranked first. Likewise the web service 4 has highest
response time and it takes the last rank.
C. Web Service Selection Using Fuzzy Topsis Method:
Fuzzy Topsis technique is an out-positioning strategy for different measures dynamic. This strategy is
utilized for vector normalization procedure. Coming up next are the different advances associated with the TOPSIS
strategy [13, 14]:
Step 1 : Determination of Ratings of Decision Makers
Various decision makers’ opinion is collected and the distances between the services are calculated
using PIS and NIS based on the consumer preferences. The ratings of decision makers are shown in Table 16.
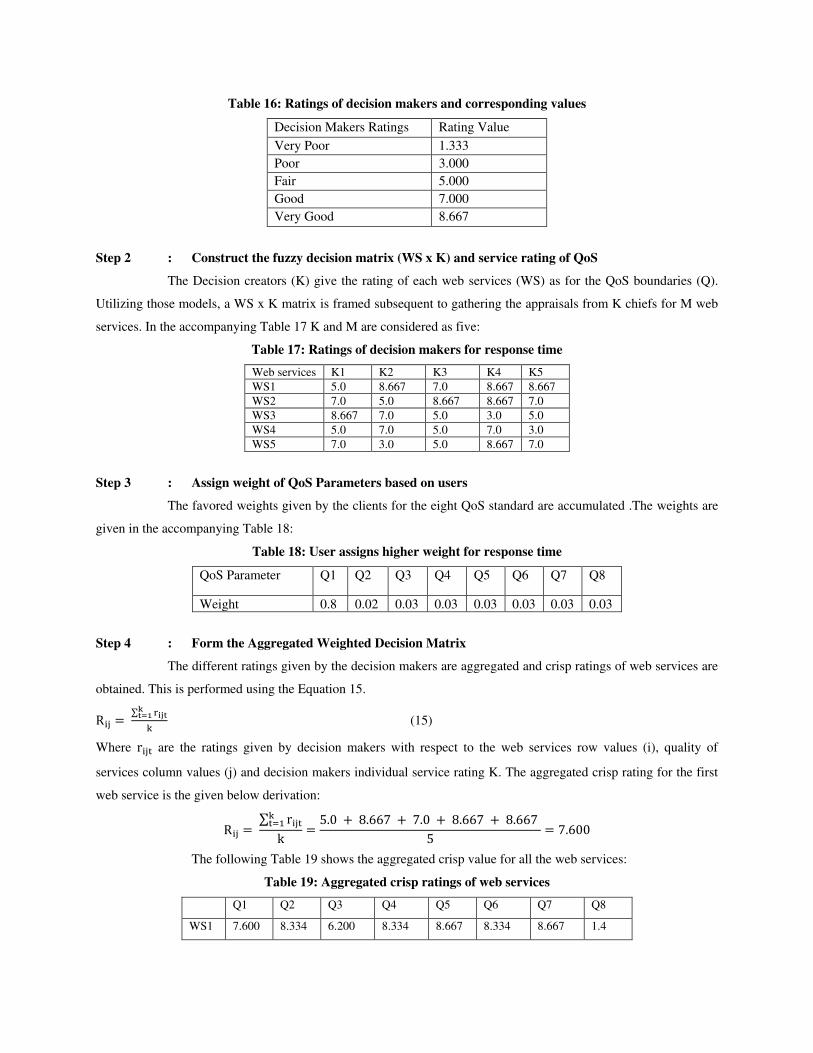
Table 16: Ratings of decision makers and corresponding values
Decision Makers Ratings Rating Value
Very Poor 1.333
Poor 3.000
Fair 5.000
Good 7.000
Very Good 8.667
Step 2 : Construct the fuzzy decision matrix (WS x K) and service rating of QoS
The Decision creators (K) give the rating of each web services (WS) as for the QoS boundaries (Q).
Utilizing those models, a WS x K matrix is framed subsequent to gathering the appraisals from K chiefs for M web
services. In the accompanying Table 17 K and M are considered as five:
Table 17: Ratings of decision makers for response time
Web services K1 K2 K3 K4 K5 WS1 5.0 8.667 7.0 8.667 8.667 WS2 7.0 5.0 8.667 8.667 7.0 WS3 8.667 7.0 5.0 3.0 5.0 WS4 5.0 7.0 5.0 7.0 3.0 WS5 7.0 3.0 5.0 8.667 7.0
Step 3 : Assign weight of QoS Parameters based on users
The favored weights given by the clients for the eight QoS standard are accumulated .The weights are
given in the accompanying Table 18:
Table 18: User assigns higher weight for response time
QoS Parameter Q1 Q2 Q3 Q4 Q5 Q6 Q7 Q8
Weight 0.8 0.02 0.03 0.03 0.03 0.03 0.03 0.03
Step 4 : Form the Aggregated Weighted Decision Matrix
The different ratings given by the decision makers are aggregated and crisp ratings of web services are
obtained. This is performed using the Equation 15. Rij = ∑ rijtkt=1k (15)
Where rijt are the ratings given by decision makers with respect to the web services row values (i), quality of
services column values (j) and decision makers individual service rating K. The aggregated crisp rating for the first
web service is the given below derivation: Rij = ∑ rijtkt=1k = 5.0 + 8.667 + 7.0 + 8.667 + 8.667 5 = 7.600
The following Table 19 shows the aggregated crisp value for all the web services:
Table 19: Aggregated crisp ratings of web services
Q1 Q2 Q3 Q4 Q5 Q6 Q7 Q8
WS1 7.600 8.334 6.200 8.334 8.667 8.334 8.667 1.4
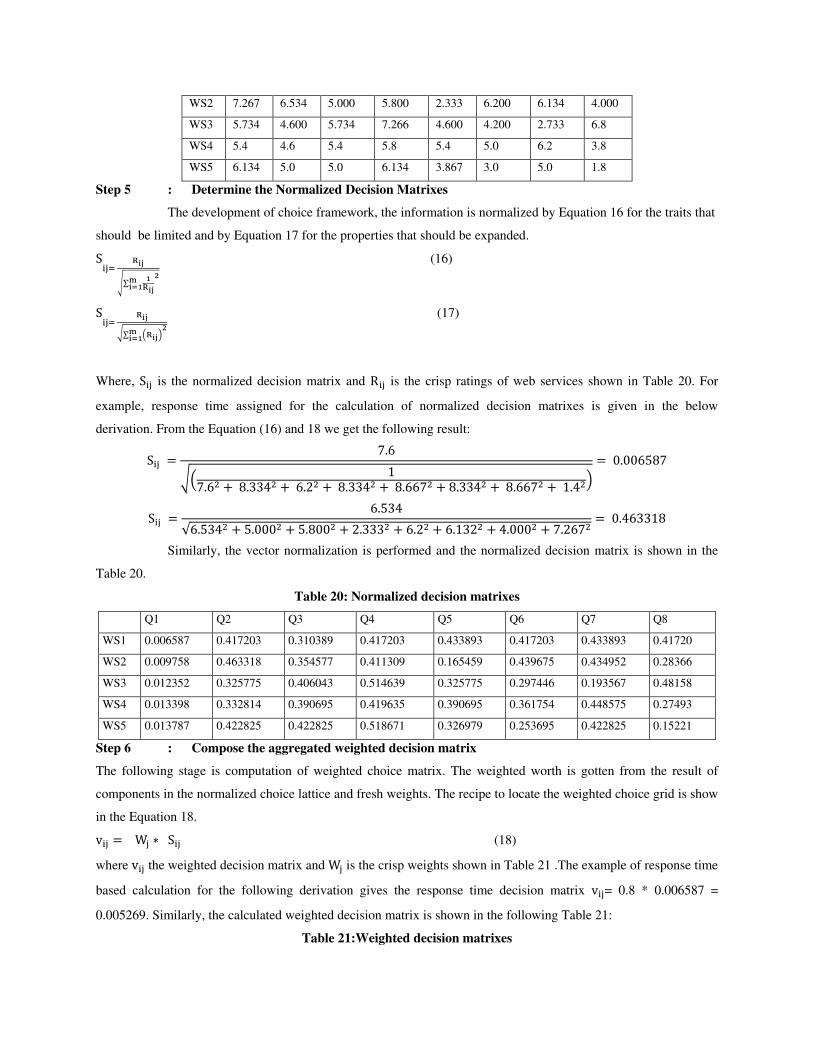
WS2 7.267 6.534 5.000 5.800 2.333 6.200 6.134 4.000
WS3 5.734 4.600 5.734 7.266 4.600 4.200 2.733 6.8
WS4 5.4 4.6 5.4 5.8 5.4 5.0 6.2 3.8
WS5 6.134 5.0 5.0 6.134 3.867 3.0 5.0 1.8
Step 5 : Determine the Normalized Decision Matrixes
The development of choice framework, the information is normalized by Equation 16 for the traits that
should be limited and by Equation 17 for the properties that should be expanded. Sij= Rij√∑ 1Rij2mi=1 (16)
Sij= Rij√∑ (Rij)2mi=1 (17)
Where, Sij is the normalized decision matrix and Rij is the crisp ratings of web services shown in Table 20. For
example, response time assigned for the calculation of normalized decision matrixes is given in the below
derivation. From the Equation (16) and 18 we get the following result: Sij = 7.6√( 17.62 + 8.3342 + 6.22 + 8.3342 + 8.6672 + 8.3342 + 8.6672 + 1.42) = 0.006587
Sij = 6.534√6.5342 + 5.0002 + 5.8002 + 2.3332 + 6.22 + 6.1322 + 4.0002 + 7.2672 = 0.463318
Similarly, the vector normalization is performed and the normalized decision matrix is shown in the
Table 20.
Table 20: Normalized decision matrixes
Q1 Q2 Q3 Q4 Q5 Q6 Q7 Q8
WS1 0.006587 0.417203 0.310389 0.417203 0.433893 0.417203 0.433893 0.41720
WS2 0.009758 0.463318 0.354577 0.411309 0.165459 0.439675 0.434952 0.28366
WS3 0.012352 0.325775 0.406043 0.514639 0.325775 0.297446 0.193567 0.48158
WS4 0.013398 0.332814 0.390695 0.419635 0.390695 0.361754 0.448575 0.27493
WS5 0.013787 0.422825 0.422825 0.518671 0.326979 0.253695 0.422825 0.15221
Step 6 : Compose the aggregated weighted decision matrix
The following stage is computation of weighted choice matrix. The weighted worth is gotten from the result of
components in the normalized choice lattice and fresh weights. The recipe to locate the weighted choice grid is show
in the Equation 18. vij = Wj ∗ Sij (18)
where vij the weighted decision matrix and Wj is the crisp weights shown in Table 21 .The example of response time
based calculation for the following derivation gives the response time decision matrix vij= 0.8 * 0.006587 =
0.005269. Similarly, the calculated weighted decision matrix is shown in the following Table 21:
Table 21:Weighted decision matrixes
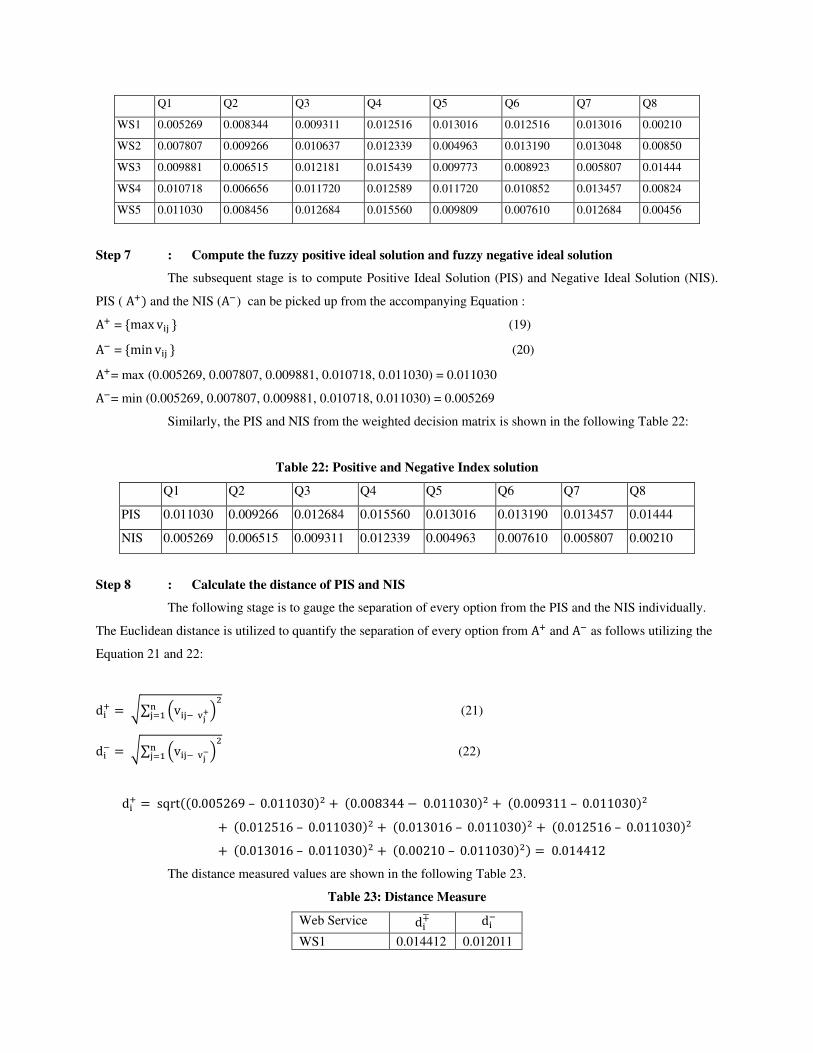
Q1 Q2 Q3 Q4 Q5 Q6 Q7 Q8
WS1 0.005269 0.008344 0.009311 0.012516 0.013016 0.012516 0.013016 0.00210
WS2 0.007807 0.009266 0.010637 0.012339 0.004963 0.013190 0.013048 0.00850
WS3 0.009881 0.006515 0.012181 0.015439 0.009773 0.008923 0.005807 0.01444
WS4 0.010718 0.006656 0.011720 0.012589 0.011720 0.010852 0.013457 0.00824
WS5 0.011030 0.008456 0.012684 0.015560 0.009809 0.007610 0.012684 0.00456
Step 7 : Compute the fuzzy positive ideal solution and fuzzy negative ideal solution
The subsequent stage is to compute Positive Ideal Solution (PIS) and Negative Ideal Solution (NIS).
PIS ( A+) and the NIS (A−) can be picked up from the accompanying Equation : A+ = {max vij } (19) A− = {min vij } (20) A+= max (0.005269, 0.007807, 0.009881, 0.010718, 0.011030) = 0.011030 A−= min (0.005269, 0.007807, 0.009881, 0.010718, 0.011030) = 0.005269
Similarly, the PIS and NIS from the weighted decision matrix is shown in the following Table 22:
Table 22: Positive and Negative Index solution
Q1 Q2 Q3 Q4 Q5 Q6 Q7 Q8
PIS 0.011030 0.009266 0.012684 0.015560 0.013016 0.013190 0.013457 0.01444
NIS 0.005269 0.006515 0.009311 0.012339 0.004963 0.007610 0.005807 0.00210
Step 8 : Calculate the distance of PIS and NIS
The following stage is to gauge the separation of every option from the PIS and the NIS individually.
The Euclidean distance is utilized to quantify the separation of every option from A+ and A− as follows utilizing the
Equation 21 and 22:
di+ = √∑ (vij− vj+)2nj=1 (21)
di− = √∑ (vij− vj−)2nj=1 (22)
di+ = sqrt((0.005269 – 0.011030)2 + (0.008344 − 0.011030)2 + (0.009311 – 0.011030)2+ (0.012516 – 0.011030)2 + (0.013016 – 0.011030)2 + (0.012516 – 0.011030)2+ (0.013016 – 0.011030)2 + (0.00210 – 0.011030)2) = 0.014412
The distance measured values are shown in the following Table 23.
Table 23: Distance Measure
Web Service di∓ di−
WS1 0.014412 0.012011
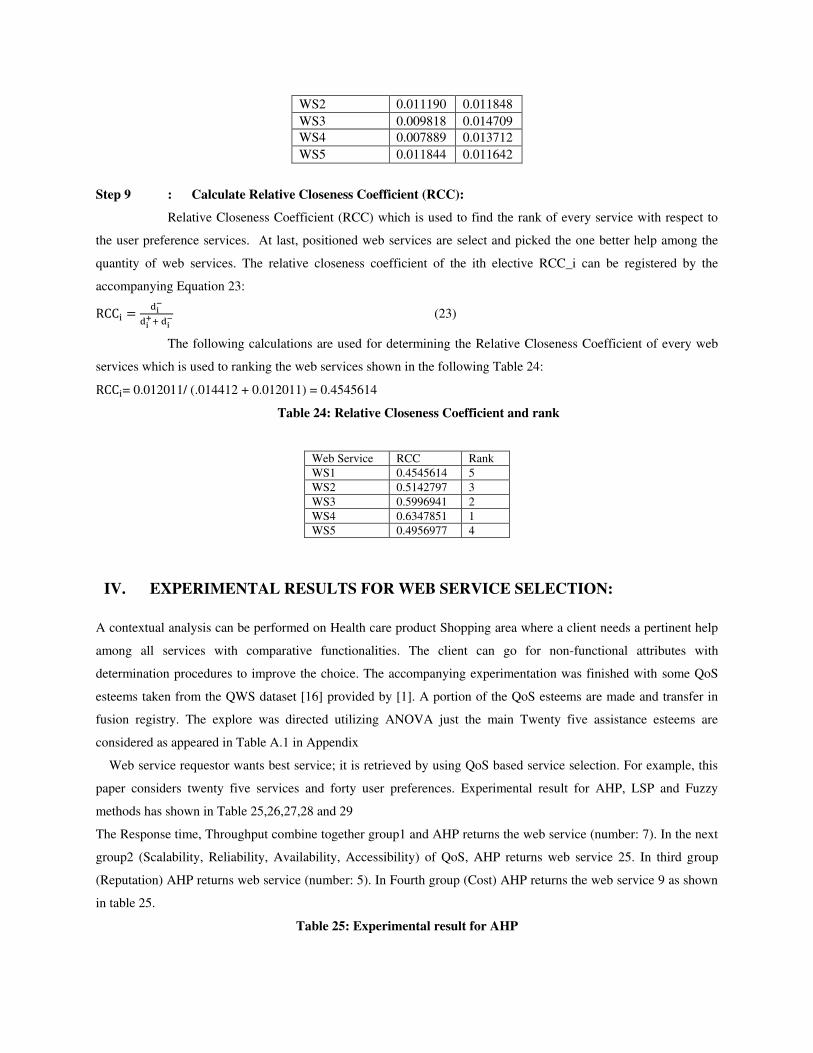
WS2 0.011190 0.011848
WS3 0.009818 0.014709 WS4 0.007889 0.013712
WS5 0.011844 0.011642
Step 9 : Calculate Relative Closeness Coefficient (RCC):
Relative Closeness Coefficient (RCC) which is used to find the rank of every service with respect to
the user preference services. At last, positioned web services are select and picked the one better help among the
quantity of web services. The relative closeness coefficient of the ith elective RCC_i can be registered by the
accompanying Equation 23: RCCi = di−di ++ di− (23)
The following calculations are used for determining the Relative Closeness Coefficient of every web
services which is used to ranking the web services shown in the following Table 24: RCCi= 0.012011/ (.014412 + 0.012011) = 0.4545614
Table 24: Relative Closeness Coefficient and rank
Web Service RCC Rank WS1 0.4545614 5 WS2 0.5142797 3 WS3 0.5996941 2 WS4 0.6347851 1 WS5 0.4956977 4
IV. EXPERIMENTAL RESULTS FOR WEB SERVICE SELECTION:
A contextual analysis can be performed on Health care product Shopping area where a client needs a pertinent help
among all services with comparative functionalities. The client can go for non-functional attributes with
determination procedures to improve the choice. The accompanying experimentation was finished with some QoS
esteems taken from the QWS dataset [16] provided by [1]. A portion of the QoS esteems are made and transfer in
fusion registry. The explore was directed utilizing ANOVA just the main Twenty five assistance esteems are
considered as appeared in Table A.1 in Appendix
Web service requestor wants best service; it is retrieved by using QoS based service selection. For example, this
paper considers twenty five services and forty user preferences. Experimental result for AHP, LSP and Fuzzy
methods has shown in Table 25,26,27,28 and 29
The Response time, Throughput combine together group1 and AHP returns the web service (number: 7). In the next
group2 (Scalability, Reliability, Availability, Accessibility) of QoS, AHP returns web service 25. In third group
(Reputation) AHP returns web service (number: 5). In Fourth group (Cost) AHP returns the web service 9 as shown
in table 25.
Table 25: Experimental result for AHP
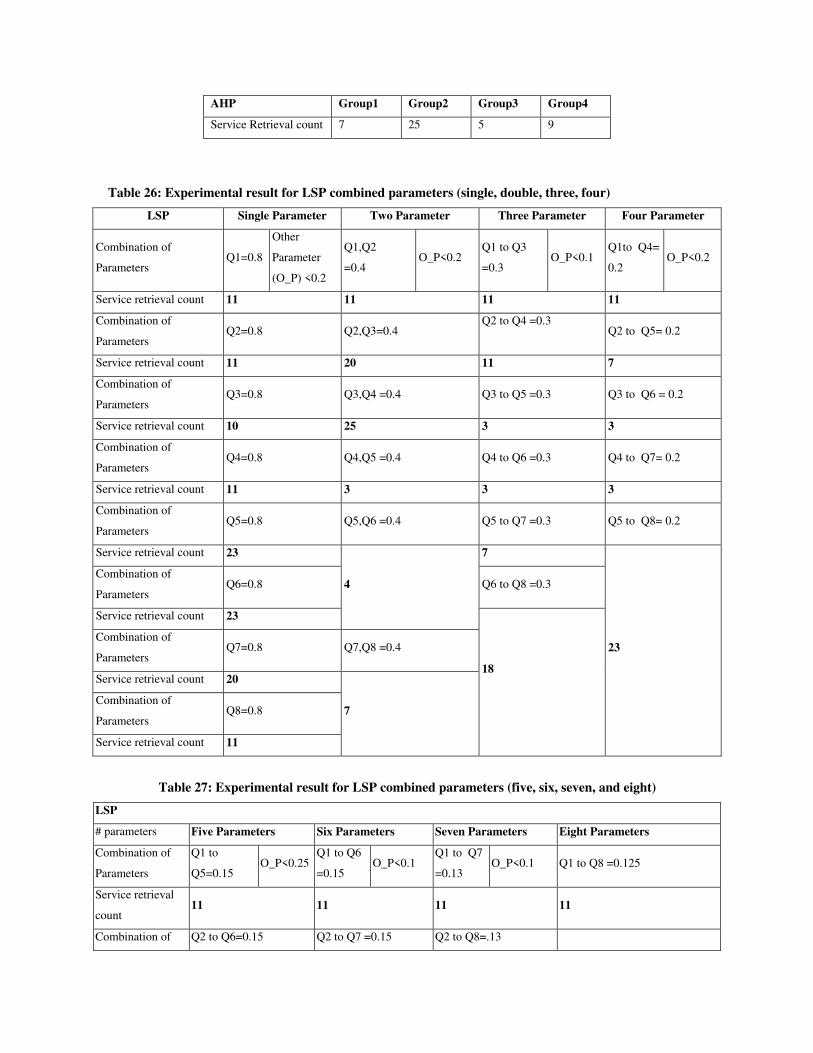
AHP Group1 Group2 Group3 Group4
Service Retrieval count 7 25 5 9
Table 26: Experimental result for LSP combined parameters (single, double, three, four)
LSP Single Parameter Two Parameter Three Parameter Four Parameter
Combination of
Parameters Q1=0.8
Other
Parameter
(O_P) <0.2
Q1,Q2
=0.4 O_P<0.2
Q1 to Q3
=0.3 O_P<0.1
Q1to Q4=
0.2 O_P<0.2
Service retrieval count 11 11 11 11
Combination of
Parameters Q2=0.8 Q2,Q3=0.4
Q2 to Q4 =0.3
Q2 to Q5= 0.2
Service retrieval count 11 20 11 7
Combination of
Parameters Q3=0.8 Q3,Q4 =0.4 Q3 to Q5 =0.3 Q3 to Q6 = 0.2
Service retrieval count 10 25 3 3
Combination of
Parameters Q4=0.8 Q4,Q5 =0.4 Q4 to Q6 =0.3 Q4 to Q7= 0.2
Service retrieval count 11 3 3 3
Combination of
Parameters Q5=0.8 Q5,Q6 =0.4 Q5 to Q7 =0.3 Q5 to Q8= 0.2
Service retrieval count 23
4
7
23
Combination of
Parameters Q6=0.8 Q6 to Q8 =0.3
Service retrieval count 23
18
Combination of
Parameters Q7=0.8 Q7,Q8 =0.4
Service retrieval count 20
7 Combination of
Parameters Q8=0.8
Service retrieval count 11
Table 27: Experimental result for LSP combined parameters (five, six, seven, and eight)
LSP
# parameters Five Parameters Six Parameters Seven Parameters Eight Parameters
Combination of
Parameters
Q1 to
Q5=0.15 O_P<0.25
Q1 to Q6
=0.15 O_P<0.1
Q1 to Q7
=0.13 O_P<0.1 Q1 to Q8 =0.125
Service retrieval
count 11 11 11 11
Combination of Q2 to Q6=0.15 Q2 to Q7 =0.15 Q2 to Q8=.13
Parameters
Service retrieval
count 3 4 11
Combination of
Parameters Q3 to Q7=0.15 Q3 to Q8=.15
Service retrieval
count 3
3 Combination of
Parameters Q4 to Q8=0.15
Service retrieval
count 23
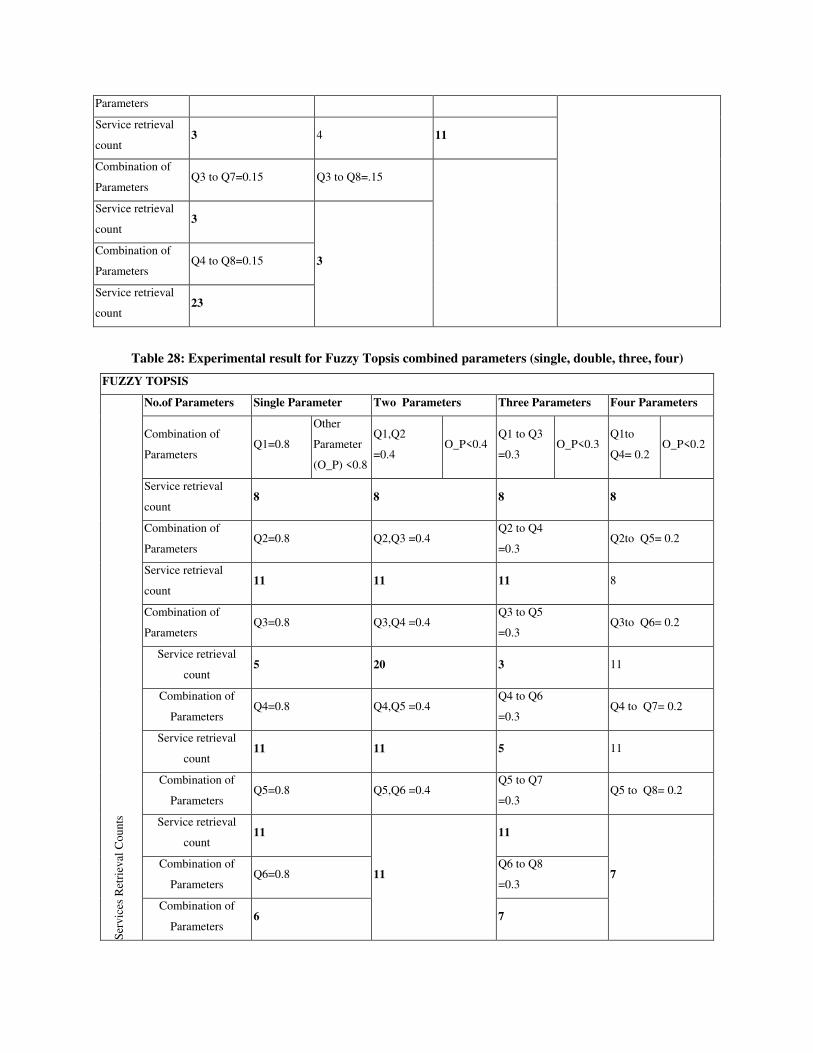
Table 28: Experimental result for Fuzzy Topsis combined parameters (single, double, three, four)
FUZZY TOPSIS
Ser
vic
es R
etri
eval
Count
s
No.of Parameters Single Parameter Two Parameters Three Parameters Four Parameters
Combination of
Parameters Q1=0.8
Other
Parameter
(O_P) <0.8
Q1,Q2
=0.4 O_P<0.4
Q1 to Q3
=0.3 O_P<0.3
Q1to
Q4= 0.2 O_P<0.2
Service retrieval
count 8 8 8 8
Combination of
Parameters Q2=0.8 Q2,Q3 =0.4
Q2 to Q4
=0.3 Q2to Q5= 0.2
Service retrieval
count 11 11 11 8
Combination of
Parameters Q3=0.8 Q3,Q4 =0.4
Q3 to Q5
=0.3 Q3to Q6= 0.2
Service retrieval
count 5 20 3 11
Combination of
Parameters Q4=0.8 Q4,Q5 =0.4
Q4 to Q6
=0.3 Q4 to Q7= 0.2
Service retrieval
count 11 11 5 11
Combination of
Parameters Q5=0.8 Q5,Q6 =0.4
Q5 to Q7
=0.3 Q5 to Q8= 0.2
Service retrieval
count 11
11
11
7 Combination of
Parameters Q6=0.8
Q6 to Q8
=0.3
Combination of
Parameters 6 7
Service retrieval
count
Combination of
Parameters Q7=0.8 Q7,Q8 =0.4
Combination of
Parameters 8
8
Service retrieval
count
Combination of
Parameters Q8=0.8
Service retrieval
count 8
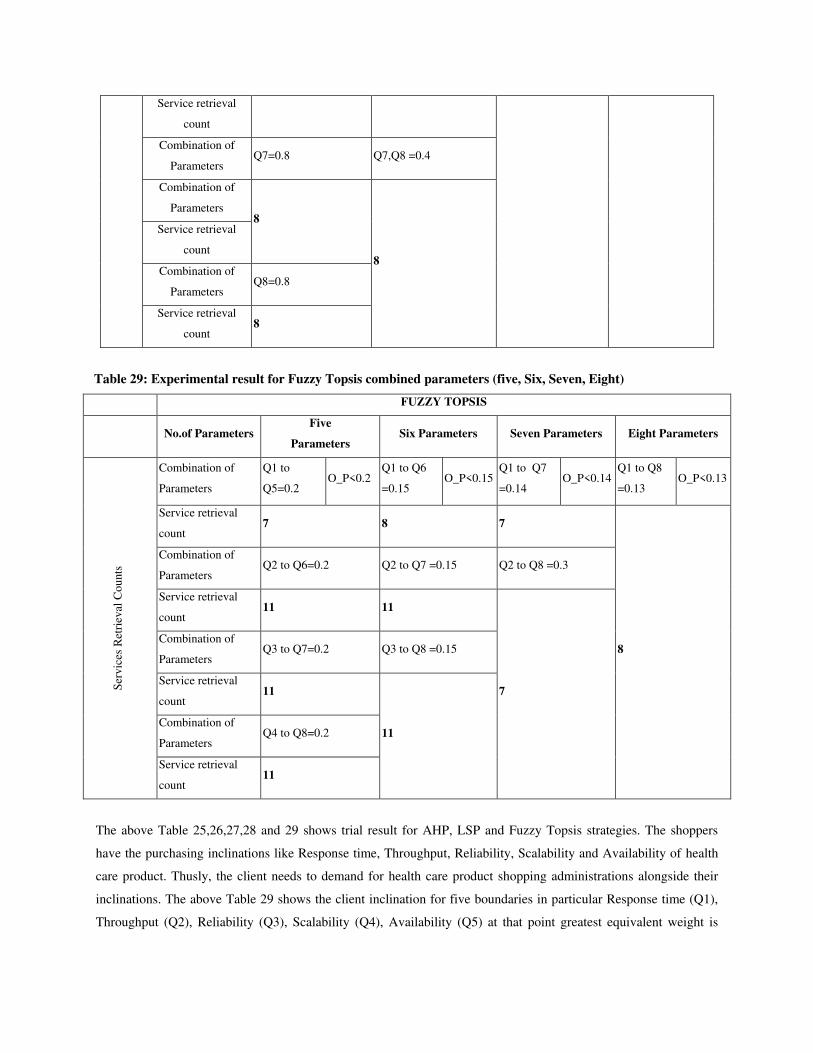
Table 29: Experimental result for Fuzzy Topsis combined parameters (five, Six, Seven, Eight)
FUZZY TOPSIS
No.of Parameters Five
Parameters Six Parameters Seven Parameters Eight Parameters
Ser
vic
es R
etri
eval
Count
s
Combination of
Parameters
Q1 to
Q5=0.2 O_P<0.2
Q1 to Q6
=0.15 O_P<0.15
Q1 to Q7
=0.14 O_P<0.14
Q1 to Q8
=0.13 O_P<0.13
Service retrieval
count 7 8 7
8
Combination of
Parameters Q2 to Q6=0.2 Q2 to Q7 =0.15 Q2 to Q8 =0.3
Service retrieval
count 11 11
7
Combination of
Parameters Q3 to Q7=0.2 Q3 to Q8 =0.15
Service retrieval
count 11
11 Combination of
Parameters Q4 to Q8=0.2
Service retrieval
count 11
The above Table 25,26,27,28 and 29 shows trial result for AHP, LSP and Fuzzy Topsis strategies. The shoppers
have the purchasing inclinations like Response time, Throughput, Reliability, Scalability and Availability of health
care product. Thusly, the client needs to demand for health care product shopping administrations alongside their
inclinations. The above Table 29 shows the client inclination for five boundaries in particular Response time (Q1),
Throughput (Q2), Reliability (Q3), Scalability (Q4), Availability (Q5) at that point greatest equivalent weight is
given to that five boundaries and least weight is given to all different boundaries which is equivalent to the unit
esteem one.
For the above weights, Service number 7 is recovered. Response time (Q1) is less and Throughput (Q2), Reliability
(Q3), Scalability (Q4), Availability (Q5) is high for service 7. Thus, client weights are given to other mix of QoS
boundaries. The acquired outcomes can be tried by utilizing ANOVA. It is utilized to investigation the presentation
of every one of determination strategies. The accompanying segment gives Statistical examination esteems to three
strategies.
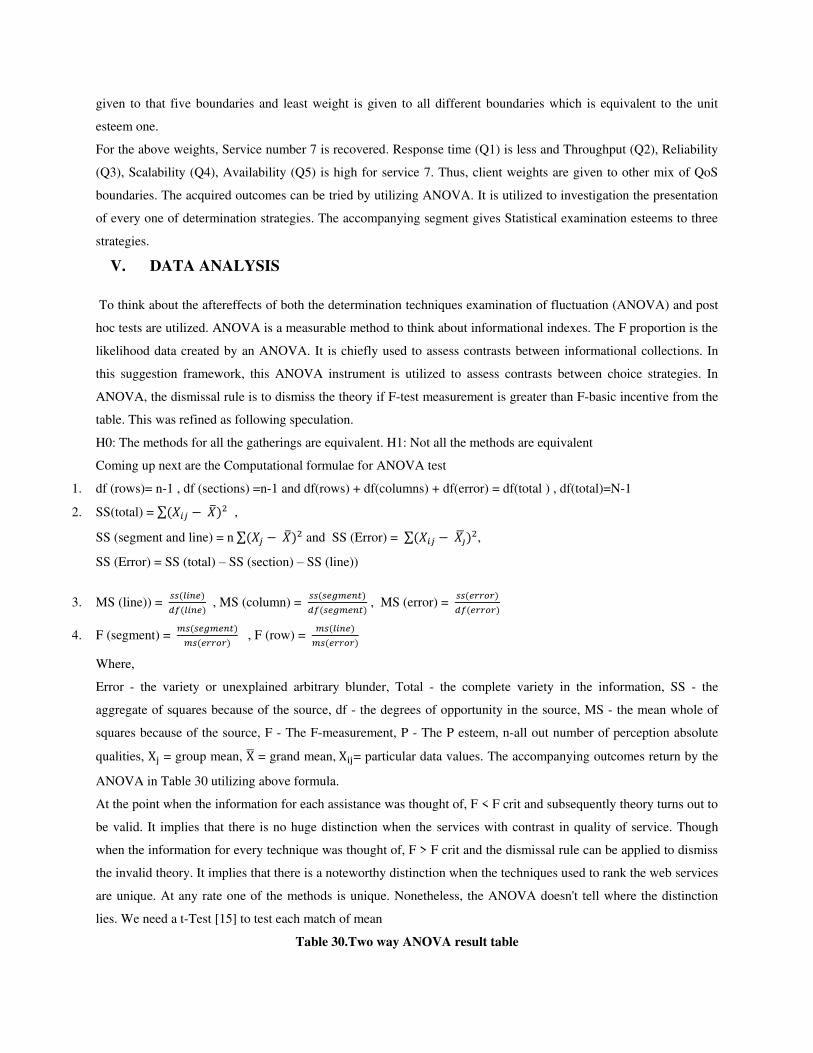
V. DATA ANALYSIS
To think about the aftereffects of both the determination techniques examination of fluctuation (ANOVA) and post
hoc tests are utilized. ANOVA is a measurable method to think about informational indexes. The F proportion is the
likelihood data created by an ANOVA. It is chiefly used to assess contrasts between informational collections. In
this suggestion framework, this ANOVA instrument is utilized to assess contrasts between choice strategies. In
ANOVA, the dismissal rule is to dismiss the theory if F-test measurement is greater than F-basic incentive from the
table. This was refined as following speculation.
H0: The methods for all the gatherings are equivalent. H1: Not all the methods are equivalent
Coming up next are the Computational formulae for ANOVA test
1. df (rows)= n-1 , df (sections) =n-1 and df(rows) + df(columns) + df(error) = df(total ) , df(total)=N-1
2. SS(total) = ∑(𝑋𝑖𝑗 − �̅�)2 ,
SS (segment and line) = n ∑(𝑋𝑗 − �̅�)2 and SS (Error) = ∑(𝑋𝑖𝑗 − 𝑋�̅�)2,
SS (Error) = SS (total) – SS (section) – SS (line))
3. MS (line)) = 𝑠𝑠(𝑙𝑖𝑛𝑒)𝑑𝑓(𝑙𝑖𝑛𝑒) , MS (column) = 𝑠𝑠(𝑠𝑒𝑔𝑚𝑒𝑛𝑡)𝑑𝑓(𝑠𝑒𝑔𝑚𝑒𝑛𝑡) , MS (error) = 𝑠𝑠(𝑒𝑟𝑟𝑜𝑟)𝑑𝑓(𝑒𝑟𝑟𝑜𝑟) 4. F (segment) = 𝑚𝑠(𝑠𝑒𝑔𝑚𝑒𝑛𝑡)𝑚𝑠(𝑒𝑟𝑟𝑜𝑟) , F (row) = 𝑚𝑠(𝑙𝑖𝑛𝑒)𝑚𝑠(𝑒𝑟𝑟𝑜𝑟)
Where,
Error - the variety or unexplained arbitrary blunder, Total - the complete variety in the information, SS - the
aggregate of squares because of the source, df - the degrees of opportunity in the source, MS - the mean whole of
squares because of the source, F - The F-measurement, P - The P esteem, n-all out number of perception absolute
qualities, Xj = group mean, X̅ = grand mean, Xij= particular data values. The accompanying outcomes return by the
ANOVA in Table 30 utilizing above formula.
At the point when the information for each assistance was thought of, F < F crit and subsequently theory turns out to
be valid. It implies that there is no huge distinction when the services with contrast in quality of service. Though
when the information for every technique was thought of, F > F crit and the dismissal rule can be applied to dismiss
the invalid theory. It implies that there is a noteworthy distinction when the techniques used to rank the web services
are unique. At any rate one of the methods is unique. Nonetheless, the ANOVA doesn't tell where the distinction
lies. We need a t-Test [15] to test each match of mean
Table 30.Two way ANOVA result table
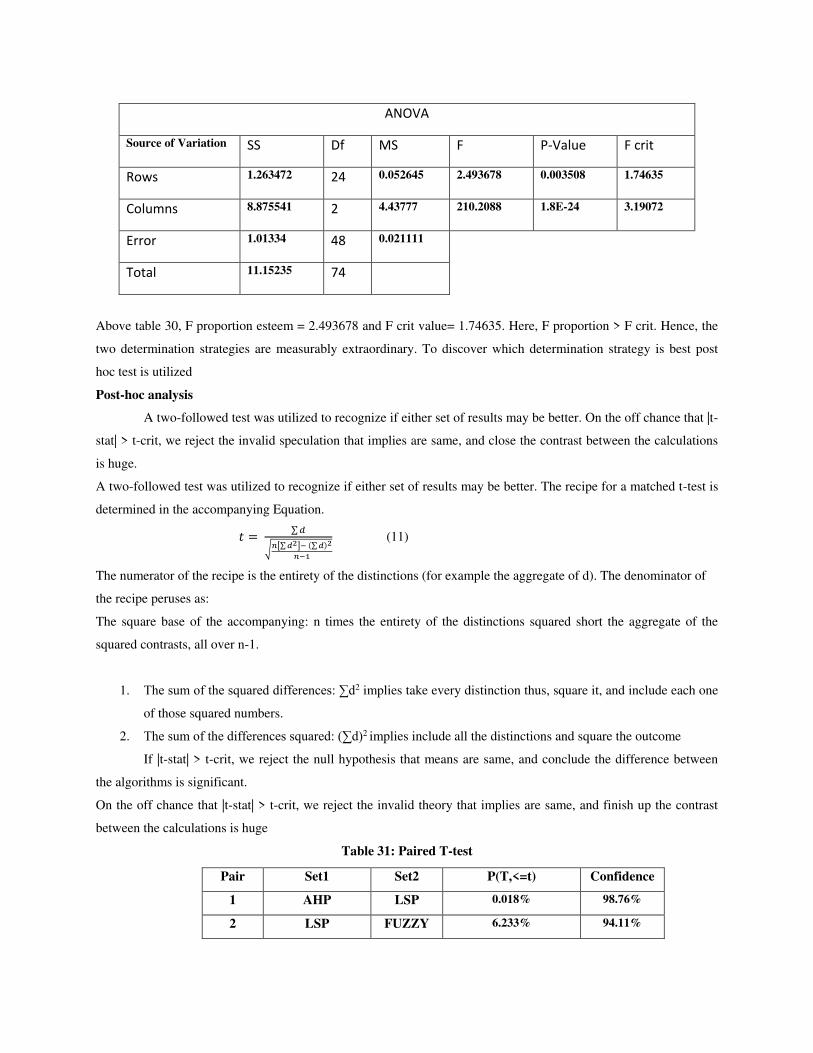
Above table 30, F proportion esteem = 2.493678 and F crit value= 1.74635. Here, F proportion > F crit. Hence, the
two determination strategies are measurably extraordinary. To discover which determination strategy is best post
hoc test is utilized
Post-hoc analysis
A two-followed test was utilized to recognize if either set of results may be better. On the off chance that |t-
stat| > t-crit, we reject the invalid speculation that implies are same, and close the contrast between the calculations
is huge.
A two-followed test was utilized to recognize if either set of results may be better. The recipe for a matched t-test is
determined in the accompanying Equation.
𝑡 = ∑𝑑√𝑛[∑𝑑2]− (∑𝑑)2𝑛−1 (11)
The numerator of the recipe is the entirety of the distinctions (for example the aggregate of d). The denominator of
the recipe peruses as:
The square base of the accompanying: n times the entirety of the distinctions squared short the aggregate of the
squared contrasts, all over n-1.
1. The sum of the squared differences: ∑d2 implies take every distinction thus, square it, and include each one
of those squared numbers.
2. The sum of the differences squared: (∑d)2 implies include all the distinctions and square the outcome
If |t-stat| > t-crit, we reject the null hypothesis that means are same, and conclude the difference between
the algorithms is significant.
On the off chance that |t-stat| > t-crit, we reject the invalid theory that implies are same, and finish up the contrast
between the calculations is huge
Table 31: Paired T-test
ANOVA
Source of Variation SS Df MS F P-Value F crit
Rows 1.263472 24 0.052645 2.493678 0.003508 1.74635
Columns 8.875541 2 4.43777 210.2088 1.8E-24 3.19072
Error 1.01334 48 0.021111
Total 11.15235 74
Pair Set1 Set2 P(T,<=t) Confidence
1 AHP LSP 0.018% 98.76%
2 LSP FUZZY 6.233% 94.11%
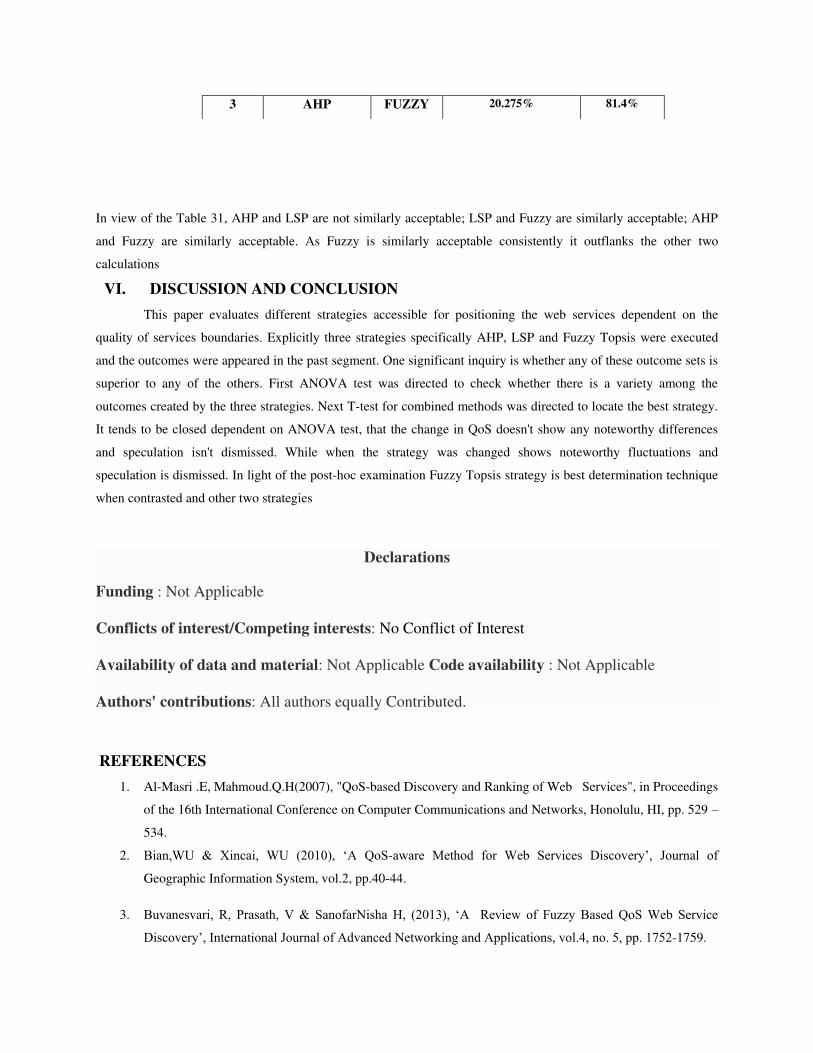
In view of the Table 31, AHP and LSP are not similarly acceptable; LSP and Fuzzy are similarly acceptable; AHP
and Fuzzy are similarly acceptable. As Fuzzy is similarly acceptable consistently it outflanks the other two
calculations
VI. DISCUSSION AND CONCLUSION
This paper evaluates different strategies accessible for positioning the web services dependent on the
quality of services boundaries. Explicitly three strategies specifically AHP, LSP and Fuzzy Topsis were executed
and the outcomes were appeared in the past segment. One significant inquiry is whether any of these outcome sets is
superior to any of the others. First ANOVA test was directed to check whether there is a variety among the
outcomes created by the three strategies. Next T-test for combined methods was directed to locate the best strategy.
It tends to be closed dependent on ANOVA test, that the change in QoS doesn't show any noteworthy differences
and speculation isn't dismissed. While when the strategy was changed shows noteworthy fluctuations and
speculation is dismissed. In light of the post-hoc examination Fuzzy Topsis strategy is best determination technique
when contrasted and other two strategies
Declarations
Funding : Not Applicable Conflicts of interest/Competing interests: No Conflict of Interest
Availability of data and material: Not Applicable Code availability : Not Applicable
Authors' contributions: All authors equally Contributed.
REFERENCES
1. Al-Masri .E, Mahmoud.Q.H(2007), "QoS-based Discovery and Ranking of Web Services", in Proceedings
of the 16th International Conference on Computer Communications and Networks, Honolulu, HI, pp. 529 –
534.
2. Bian,WU & Xincai, WU (2010), ‘A QoS-aware Method for Web Services Discovery’, Journal of
Geographic Information System, vol.2, pp.40-44.
3. Buvanesvari, R, Prasath, V & SanofarNisha H, (2013), ‘A Review of Fuzzy Based QoS Web Service
Discovery’, International Journal of Advanced Networking and Applications, vol.4, no. 5, pp. 1752-1759.
3 AHP FUZZY 20.275% 81.4%
4. Chi-Chun Lo & Ding-Yuan Chen (2010), ‘Service Selection Based on Fuzzy Topsis Method’, IEEE 24th
International Conference on Advanced Information Networking and Applications Workshops (WAINA),
pp. 367-372
5. Demian Antony, D, Mello & Ananthanarayana, VS 2008, ‘Semantic Web Service Selection Based on
Service Provider’s Business Offerings’, IJSSST, vol. 10, no. 2, pp.1473-8031.
6. Hong Qing,Yu, & Stephan Reiff-Marganiec 2007, ‘A Method for Automated Web Service Selection’,
Interaction and Context Based Technologies for Collaborative Teams, project. IST-2006-034718.
7. Manoharan .R, Archana .A and Siddhika Nitin Cowlagi (2011), Hybrid Web Services Ranking Algorithm,
International Journal of Computer Science Issues(IJCSI), Vol. 8, Issue 3, No. 2.
8. Maheswari,S,Dr. Karpagam. G.R(2011).QoS based efficient web service selection. European Journal of
Scientific Research; ISSN 1450-216X Vol.66 No.3, pp. 428-440.
9. Maheswari S., Dr. Karpagam G.R (2013),”Applying Logical Scoring Preference Method for Semantic Web
Service Selection” International Journal of Computer Applications (0975 – 8887) Volume 65– No.19.
10. Maheswari S., Dr. Karpagam G.R, S Manasaa (2014) , ”Design Of Standardization Engine for Semantic
Web Service Selection”, Journal of Theoretical and Applied Information Technology. Vol. 66 No.17.
11. Mamat.N.J.Z, Daniel .J.K (2007) ,Statistical analyses on time complexity and rank consistency between
singular value decomposition and the duality approach in AHP: A case study of faculty member selection,
Mathematical and Computer Modeling 1099–1106.
12. Maheswari, .S, Dr. Karpagam,G.R (2015) Enhancing Fuzzy Topsis for Web Service Selection,
International Journal of Computer Applications in Technology, Inderscience,Vol. 51, Issue.4:Pages.344-
351.
13. Melih Yucesan (2019) An Integrated Best-Worst and Interval Type-2 Fuzzy TOPSIS Methodology for
Green Supplier Selection, Mathematics 2019, 7, 182; doi:10.3390/math7020182
14. Neerja Negi, Satish Chandra (2019), Efficient Selection of QoS Based Web Services using Modified
TOPSIS Method, International Journal of Recent Technology and Engineering (IJRTE) ISSN: 2277-3878,
Volume-8 Issue-2.
15. Nikolaos Pandis (2016),Two-way analysis of variance, American Journal of Orthodontics and Dentofacial
Orthopedics Volume 149, Issue 1, Pages 137–139
16. QWS Datasets. http://www.uoguelph.ca/~mahmoud/qws/index.html.
17. Suganyakala.R, Aarthilakshmi.M, Dr.Karpagam.G.R, Maheswari.S (2011), Ontology Based QoS Driven
Web Service Discovery.IJCSI International Journal of Computer Science Issues, Vol. 8, Issue 4, No 1,
ISSN (Online): 1694-0814, PP.191-198.
18. Sathya.M, Swarnamugi.M, Dhavachelvan.P, Sureshkumar.G (2010), “Evaluation of QoS Based Web-
service Selection Techniques for Service Composition”, International Journal of Software Engineering
(IJSE), Volume (1): Issue (5)
19. Surendiran.B,Vadivel.A(2011),Feature Selection using Stepwise ANOVA Discriminate Analysis for
Mammogram Mass Classification,ACEEE Int. J. on Signal & Image Processing, Vol. 02, No. 01.
20. Tajudeen Adeyemi Ajao, Safaai-Deris (2013) Optimal Web Service Selection with Consideration for
User’s Preferences International Journal of Computer Science Issues(IJCSI),Vol. 10, Issue 2, No 3.
21. Tae Kyun Kim (2017), Understanding one-way ANOVA using conceptual figures, Korean Journal of
Anesthesiology, VOL. 70, NO. 1.
22. Xi Chen, Zibin Zheng, Qi Yu, & Michael R Lyu 2014, ‘Web service recommendation via exploiting
location and qos information’, IEEE Transactions On Parallel And Distributed Systems, vol. 25, no. 7.
23. Yuan Han , Zhonghui Wang 2020 , “Application of AHP to Road Selection”, International Journal of Geo-
Information, Vol. 9,no. 86.
Figures
Figure 1
Semantic Web Service Selection Framework