
HAVE ANOTHER LOOK ON SERVICE QUALITY IN THE TRACTOR INDUSTRY SERVICE
11
INTERNATIONAL JOURNAL OF RESEARCH IN AERONAUTICAL AND MECHANICAL ENGINEERING Vol.2 Issue.7, July 2014. Pgs: 58-68 Dashrath Kumar patidar, Praveen Singh Sisodiya, Prof. Praneeti Saxena 58 ISSN (ONLINE): 2321-3051 INTERNATIONAL JOURNAL OF RESEARCH IN AERONAUTICAL AND MECHANICAL ENGINEERING HAVE ANOTHER LOOK ON SERVICE QUALITY IN THE TRACTOR INDUSTRY SERVICE Dashrath Kumar patidar 1 , Praveen Singh Sisodiya 1 , Prof. Praneeti Saxena 2 1 Research Scholar, Department of Mechanical Engineering, Mahakal Institute of Technology, Ujjain, M.P., India Email- [email protected],[email protected] 2 Associate Professor, Department of Mechanical Engineering, Mahakal Institute of Technology, Ujjain, M.P., India [email protected] Abstract This paper presents results of a investigate designed to weigh up the potential for civilizing productivity and the quality of service for a tractor industries. Tractor is a specialized vehicle used for farming purpose. More than half of the tractors sold in the INDIA are Focus on more than 20 HP and less than 50 HP segment. This compact tractor market has been a growing sector for the last several years. This paper deals with the different issue which is generally important during the selection of tractor. And some another issue related to the service and quality of the tractor. The selection of the tractor done by the quality and what service is provided by the company. Keywords: Service, Quality, Gaps, SERVQUAL, Customer, Expectations, Perceptions, etc. --------------------------------------------------------------------------------------------------------------- 1. INTRODUCTION Now more than ever, farmers need to control their tractors efficiently because machinery's carve up of the total cost of crop production is exceeded only by land speculation. Farm managers can increase profits by selecting the right harmonize of equipment for their farm size, labor and tillage program. In many cases, economic survival of a farm operation depends on the farmer's ability to manage and select machinery efficiently. Well-timed information and performance data should be examined by the farmer during the resolution process so the tractor selected will meet the farm's economic and power requirements. Unfortunately, often a assessment will be made without this information or performance data because the source is unknown or unavailable to the farmer. Knowing what sources of information are typically used by farmers, and which are most beneficial, will enable the specialists, engineers, sales personnel, and educators to provide current and timely information in these sources so the machines selected are the most efficient complement for each individual farm [1].
-
Upload
independent -
Category
Documents
-
view
0 -
download
0
Transcript of HAVE ANOTHER LOOK ON SERVICE QUALITY IN THE TRACTOR INDUSTRY SERVICE

INTERNATIONAL JOURNAL OF RESEARCH IN AERONAUTICAL AND MECHANICAL ENGINEERING
Vol.2 Issue.7,
July 2014.
Pgs: 58-68
Dashrath Kumar patidar, Praveen Singh Sisodiya, Prof. Praneeti Saxena 58
ISSN (ONLINE): 2321-3051
INTERNATIONAL JOURNAL OF RESEARCH IN AERONAUTICAL AND MECHANICAL ENGINEERING
HAVE ANOTHER LOOK ON SERVICE QUALITY IN THE TRACTOR INDUSTRY SERVICE
Dashrath Kumar patidar 1, Praveen Singh Sisodiya1, Prof. Praneeti Saxena2
1Research Scholar, Department of Mechanical Engineering, Mahakal Institute of Technology, Ujjain, M.P., India
Email- [email protected],[email protected] 2Associate Professor, Department of Mechanical Engineering, Mahakal Institute of Technology, Ujjain, M.P., India
Abstract This paper presents results of a investigate designed to weigh up the potential for civilizing productivity and the quality of service for a tractor industries. Tractor is a specialized vehicle used for farming purpose. More than half of the tractors sold in the INDIA are Focus on more than 20 HP and less than 50 HP segment. This compact tractor market has been a growing sector for the last several years. This paper deals with the different issue which is generally important during the selection of tractor. And some another issue related to the service and quality of the tractor. The selection of the tractor done by the quality and what service is provided by the company.
Keywords: Service, Quality, Gaps, SERVQUAL, Customer, Expectations, Perceptions, etc. ---------------------------------------------------------------------------------------------------------------
1. INTRODUCTION Now more than ever, farmers need to control their tractors efficiently because machinery's carve up of the total cost of crop production is exceeded only by land speculation. Farm managers can increase profits by selecting the right harmonize of equipment for their farm size, labor and tillage program. In many cases, economic survival of a farm operation depends on the farmer's ability to manage and select machinery efficiently. Well-timed information and performance data should be examined by the farmer during the resolution process so the tractor selected will meet the farm's economic and power requirements. Unfortunately, often a assessment will be made without this information or performance data because the source is unknown or unavailable to the farmer. Knowing what sources of information are typically used by farmers, and which are most beneficial, will enable the specialists, engineers, sales personnel, and educators to provide current and timely information in these sources so the machines selected are the most efficient complement for each individual farm [1].

INTERNATIONAL JOURNAL OF RESEARCH IN AERONAUTICAL AND MECHANICAL ENGINEERING
Vol.2 Issue.7,
July 2014.
Pgs: 58-68
Dashrath Kumar patidar, Praveen Singh Sisodiya, Prof. Praneeti Saxena 59
2. LITERATURE REVIEW 2.1 QUALITY According to the Oxford Dictionary for the business world, Quality is defined as the degree of excellence [2]. Quality guru J.M.Juran defined quality as ‘Fitness for the purpose’ [2]. Quality guru Philip Crosby defines quality as ‘Conformation to specifications’ [2].
2.1.1 Various dimensions of quality
Eight dimensions of product quality management can be used at a strategic level to analyze quality characteristics. The concept was defined by David Garvin. Some of the dimensions are mutually reinforcing, whereas others are not—improvement in one may be at the expense of others. Understanding the trade-offs desired by customers among these dimensions can help build a competitive advantage. Garvin's eight dimensions can be summarized as follows: [3].
A. Performance: Performance refers to a product's primary operating characteristics. This dimension of quality involves measurable attributes; brands can usually be ranked objectively on individual aspects of performance.
B. Features: Features are additional characteristics that enhance the appeal of the product or service to the user.
C. Reliability : Reliability is the likelihood that a product will not fail within a specific time period. This is a key element for users who need the product to work without fail.
D. Conformance: Conformance is the precision with which the product or service meets the specified standards.
E. Durability : Durability measures the length of a product’s life. When the product can be repaired, estimating durability is more complicated. The item will be used until it is no longer economical to operate it. This happens when the repair rate and the associated costs increase significantly.
F. Serviceability: Serviceability is the speed with which the product can be put into service when it breaks down, as well as the competence and the behavior of the serviceperson.
G. Aesthetics: Aesthetics is the subjective dimension indicating the kind of response a user has to a product. It represents the individual’s personal preference.
H. Perceived Quality: Perceived Quality is the quality attributed to a good or service based on indirect measures.
Figure No.1 various dimensions of quality
QUALITY
PERFORMANCE Conformance Features Reliability
Perceived Quality Aesthetics Serviceability Durability

INTERNATIONAL JOURNAL OF RESEARCH IN AERONAUTICAL AND MECHANICAL ENGINEERING
Vol.2 Issue.7,
July 2014.
Pgs: 58-68
Dashrath Kumar patidar, Praveen Singh Sisodiya, Prof. Praneeti Saxena 60
2.2 SERVICE QUALITY Service quality is a concept that has aroused considerable interest and debate in the research literature because of the difficulties in both defining it and measuring it with no overall consensus emerging on either [4]. There are a number of different "definitions" as to what is meant by service quality. One that is commonly used defines service quality as the extent to which a service meets customers’ needs or expectations [5]. Service quality can thus be defined as the difference between customer expectations of service and perceived service. If expectations are greater than performance, then perceived quality is less than satisfactory and hence customer dissatisfaction occurs [6]. Always there exists an important question: why should service quality be measured? Measurement allows for comparison before and after changes, for the location of quality related problems and for the establishment of clear standards for service delivery. State that, in their experience, the starting point in developing quality in services is analysis and measurement. Today service industries dominate our economy. The service sector accounts for more than 70% of jobs, and the number continues to grow. Quality improvement looms large in the ongoing success of this sector of our economy. The statistical methods and procedures we examined in preceding chapters are also used for service operations. However major differences exist in the quality characteristics of manufacturing and service [7]. Accordingly, both the measurement process and managements focus different. In service industries not only the products meet the functional requirements of the customer, but the employee behavior must also meet high standards. The total service concept is a combination of technical and human behavioral aspects, and latter are much more difficult to quantify, measure, and control. Thus service quality means the satisfaction of customers about the service which he is getting. The quality of a service can be broken down into two categories: effectiveness and efficiency. Effectiveness deals with meeting the desirable service attributes that are expected by the customer. For example, the doctor and available facilities in a hospital room, the quality and quantity of food served in a restaurant and the types of checking and savings account available in a bank are related to service effectiveness. Efficiency on the other hand concerns the time required for the service to be rendered.
2.2.1 Service quality characteristics The quality characteristics are grouped into four categories although exceptions to this group exist; the categories generally summarize factors common to service function industries [8]. A. Human factors and behavioral characteristics: Service quality is influenced by the attitude and behavior of the provider. Since providers and customers are part of the product, the service their behavior affects the quality of the service. Human factors thus include intensity, eagerness to help, thoughtfulness, complacency, courtesy and so on. Some of these traits can be developed through adequate training some are inherent in the individual. Proper screening of employees and appropriate job assignment are ways to achieve desirable quality characteristics. A primary source of customer’s complaint is discourteous behavior.

INTERNATIONAL JOURNAL OF RESEARCH IN AERONAUTICAL AND MECHANICAL ENGINEERING
Vol.2 Issue.7,
July 2014.
Pgs: 58-68
Dashrath Kumar patidar, Praveen Singh Sisodiya, Prof. Praneeti Saxena 61
B. Timeliness characteristics: A service that is not used in a given span of time cannot be stored for later use. A hospital with empty beds during certain days of a month cannot save them for use in the following month. Thus the timeliness with which a service is performed is critical to customer satisfaction. How long did the customer have to wait in line to cash a check? Characteristics related to timeliness are categorized by the service phase with which they are associated. Categories might include the time to order the service, the waiting time before the service is performed, the time to serve, and the post service time. These characteristics are much more amenable to measurement than behavioral characteristics. C. Service non conformity characteristics: These characteristics deal with deviation from target performance levels; a non conformity is a deviation from the ideal level. Examples of such characteristics include the number of errors in processing per 100 vouchers by bank employees, the number of data entry errors per 1000 keystrokes by a data entry operator, the number of billing errors per 100 accounts by a utility company, the number of complaints per 100 guests in a hotel, and so on. The target performance level for these examples is zero nonconformity. The goal of the service organization is to achieve the target level, thus meeting customer expectations, and then exceed it through quality improvement measures. Quality characteristics in this category are well defined and are more readily measured than behavioral characteristics. D. Facility related characteristics: The physical characteristics of the facilities associated with a service and its delivery can impact customer satisfaction. The décor of a restaurant, the waiting area in a bus station, and the availabilities of such amenities as a swimming pool or spa in a hotel are examples of quality characteristics for physical facilities that are involved in providing a service. The appearances of a waiter or waitress, a bank teller or an insurance agent are attributes of individuals performing a service. These characteristics are not as clearly defined and measurable as service nonconformities characteristics. They are, however more quantifiable than behavioral characteristics.
Figure No.2 Service quality characteristics
Human factors and
behavioral Timeliness
Service non conformity Facility related
Service quality
characteristics

INTERNATIONAL JOURNAL OF RESEARCH IN AERONAUTICAL AND MECHANICAL ENGINEERING
Vol.2 Issue.7,
July 2014.
Pgs: 58-68
Dashrath Kumar patidar, Praveen Singh Sisodiya, Prof. Praneeti Saxena 62
2.2.2 Service quality dimensions Service quality has been the subject of considerable interest by both practitioners and researchers in recent years. Definitions of service quality hold that this is the result of the comparison that customers make between their expectations about a service and their perception of the way the service has been performed [9][10]. Several studies have been conducted to identify traditional service quality dimensions that contribute most significantly to relevant quality assessments in the traditional service environment [10]. Identification of the determinants of service quality is necessary in order to be able to specify measure, control and improve customer perceived service quality [11]. Parasuraman et al. identified 10 detailed determinant of service quality through focus group studies: Tangibles, reliability, responsiveness, communication, access, competence, courtesy, credibility, security, and understanding/Knowledge of customer. Later these ten dimensions were further purified and developed five dimensions-tangibles, reliability, responsiveness, assurance and empathy to measure service quality, SERVQUAL [10]. Tangibles refer to physical facilities, equipment, and appearance of personnel. Reliability means ability to perform the promised service dependency and accurately. Responsiveness means willingness to help customers and provide prompt service. Assurance indicates knowledge and courtesy of employees and their ability to inspire trust confidence. Empathy refers to caring, individualized attention the firm provides its customers. Walker suggested that the key determinants are product reliability, a quality environment and delivery system that work together with good personal service-staff attitude, knowledge and skills.[12] postulated six criteria of perceived good service quality: professionalism and skills; attitudes and behavior; accessibility and flexibility; reliability and trustworthiness; recovery; reputation and credibility and flexibility; reliability and dimensions attentiveness/helpfulness, responsiveness, care, availability, reliability, access, flexibility, aesthetics, cleanliness/tidiness, comfort and security. From the focus group interviews, [13] identified ten determinants of service quality. Virtually all comments consumers made in these interviews about service expectations, Priorities and experiences fall into one of these ten categories. These are reliability, responsiveness, competence, access, courtesy, communication, credibility, security, understanding and tangibles. Reliability involves consistency of performance and dependability. It means that the firm performs the service right the first time. It also means the firm honors its promises. Specially it involves: accuracy in billing, keeping record correctly, performing the service at the designated time. Responsiveness concerns the willingness or readiness of employees to provide service. It involves timeliness of services that means mailing a transaction slip immediately, calling the customer back quickly and giving prompt service. Competence means possession of the required skills and knowledge to perform the services. It involves: knowledge and skill of the contact personnel, knowledge and skill of operational support personnel, research capability of the organization. Access involves approach, ability and ease of contact. It means: the service is easily accessible by telephone, waiting time to receive service is not extensive, hours of operation are convenient and location of service facility is convenient. Courtesy involves politeness, respect, consideration, and friendliness of contact personnel. It includes- consideration for the consumer’s property, clean and neat appearance of public contact personnel. (ibid) Communication means keeping customers informed in language they can understand .It also means listening to customers. It may mean that the company has to adjust its language for different consumers-increasing the level of sophistication with a well-educated customers and speaking simply and plainly with a novice. It involves: explaining the service itself, explaining how much the service will cost, assuring the customer that a problem will be handled. Credibility involves trusts worthiness, believability, honesty; it involves having the customer’s best interests at heart. Contributing to credibility is: company reputation, personal characteristics of the contact personnel. The degree of

INTERNATIONAL JOURNAL OF RESEARCH IN AERONAUTICAL AND MECHANICAL ENGINEERING
Vol.2 Issue.7,
July 2014.
Pgs: 58-68
Dashrath Kumar patidar, Praveen Singh Sisodiya, Prof. Praneeti Saxena 63
hard sell involved in interaction with the customer. Security is the freedom from danger, risk or doubt. It involves: physical safety, financial security and confidentiality. Understanding the customer means making the effort to understand the customer’s need. It includes: learning the customer’s specific requirements, providing individualized attention, recognizing the regular custom. Tangibles includes the physical evidence of the service, physical representations of the service, such as a plastic credit card or bank statement, other customers in the service facilities. [14] developed an application for measuring retail banking service quality, which consists of 28 attributes including four service quality dimensions such as: accessibility; competence; accuracy and friendliness; and tangibles. The accuracy and friendliness dimension turned out to be the most important factor out of four determining banking preference, followed by competence, tangibles, and accessibility. [15] Proposed an alternative measure of perceived service quality in retail banking that comprises 31 items with six underlying key dimensions. These dimensions are: effectiveness and assurance, access, price, tangibles, service portfolio and reliability.
2.2.2 Five service quality characteristics that please any customers. Discover desired qualities of service providers
A. Responsiveness: willingness to help and provide services B. Assurance: knowledge and courtesy of staff C. Empathy: caring and individualized attention D. Tangibles: availability of equipment and appearance of physical environment E. Reliability: ability to perform the promised service dependably and accurately
Figure No.3 Five service quality characteristics that please any customers. Discover desired qualities of service providers
Responsiveness
Assurance
empathy Tangibles
Reliability

INTERNATIONAL JOURNAL OF RESEARCH IN AERONAUTICAL AND MECHANICAL ENGINEERING
Vol.2 Issue.7,
July 2014.
Pgs: 58-68
Dashrath Kumar patidar, Praveen Singh Sisodiya, Prof. Praneeti Saxena 64
2.3 BACKGROUNDAND REVIEWOF SERVICE QUALITY Much of the initial work in developing a model to define and assess service quality has been conducted by Parasuraman Zeithaml and Berry (otherwise referred to as PZB). In conceptualizing the basic service quality model PZB identified ten key determinants of service quality as perceived by the company are the consumer reliability, responsiveness, competence, access, courtesy, communication, credibility, security, understanding/knowing the customer and tangibility [16]. It is noted that discrepancies existed between the firm's and the customer's perceptions of the service quality delivered. In investigating these discrepancies, PZB assert that service quality can be assessed by measuring the discrepancies or "gaps" between what the customer expects and what the consumer perceives he receives. Arguing that the magnitude, and direction of this gap, directly affects the service quality that the consumer perceives, PZB note that customers would have perceptions of high service quality to the extent that their expectations are lower than the perceived service performance [16]. PZB assert that their framework can be used for identifying differences in the quality of goods and services by distinguishing between the properties of a good or service. They note that Nelson defined "search properties" as properties that can be determined before purchasing (such as credibility and tangibles), and "experience properties" as properties that can be determined only after purchase or consumption. Further, Darby and Karni defined "credence properties," (such as competence and security) as properties or characteristics that consumers often find extremely difficult to evaluate after their purchase. Therefore, PZB concluded that consumers typically rely on experience properties when evaluating service quality [16]. Based on their review of the literature, PZB developed the SERVQUAL scale. The scale was designed to uncover broad areas of good or bad service quality and can be used to show service quality trends over time, especially when used with other service quality techniques. The SERVQUAL scale is based on a difference score between customer expectations of service and their perceptions after receiving the service. Initially PZB focused on the ten determinants of service quality.
3. MODEL OF SERVICE QUALITY GAPS There are seven major gaps in the service quality concept, which are shown in Figure 1. The model is an extension of Parasuraman et al. (1985). According to the following explanation (ASI Quality Systems, 1992; Curry, 1999; Luk and Layton, 2002), the three important gaps, which are more associated with the external customers, are Gap1, Gap5 and Gap6; since they have a direct relationship with customers. Gap1: Customers’ expectations versus management perceptions: as a result of the lack of a marketing research orientation, inadequate upward communication and too many layers of management. Gap2: Management perceptions versus service specifications: as a result of inadequate commitment to service quality, a perception of unfeasibility, inadequate task standardization and an absence of goal setting. Gap3: Service specifications versus service delivery: as a result of role ambiguity and conflict, poor employee-job fit and poor technology-job fit, inappropriate supervisory control systems, lack of perceived control and lack of teamwork.

INTERNATIONAL JOURNAL OF RESEARCH IN AERONAUTICAL AND MECHANICAL ENGINEERING
Vol.2 Issue.7,
July 2014.
Pgs: 58-68
Dashrath Kumar patidar, Praveen Singh Sisodiya, Prof. Praneeti Saxena 65
Gap4: Service delivery versus external communication: as a result of inadequate horizontal communications and propensity to over-promise. Gap5: The discrepancy between customer expectations and their perceptions of the service delivered: as a result of the influences exerted from the customer side and the shortfalls (gaps) on the part of the service provider. In this case, customer expectations are influenced by the extent of personal needs, word of mouth recommendation and past service experiences. Gap6: The discrepancy between customer expectations and employees’ perceptions: as a result of the differences in the understanding of customer expectations by front-line service providers. Gap7: The discrepancy between employee’s perceptions and management perceptions: as a result of the differences in the understanding of customer expectations between managers and service providers.
Figure No.4 Model of Service Quality Gaps
4. SERVQUAL METHODOLOGY Clearly, from a Best Value perspective the measurement of service quality in the service sector should take into account customer expectations of service as well as perceptions of service. However, as Robinson (1999) concludes: "It is apparent that there is little consensus of opinion and much disagreement about how to measure service quality". One service quality measurement model that has been extensively applied is the SERVQUAL model
INTERNATIONAL JOURNAL OF RESEARCH IN AERONAUTICAL AND MECHANICAL ENGINEERING
Vol.2 Issue.7,
July 2014.
Pgs: 58-68
Dashrath Kumar patidar, Praveen Singh Sisodiya, Prof. Praneeti Saxena 66
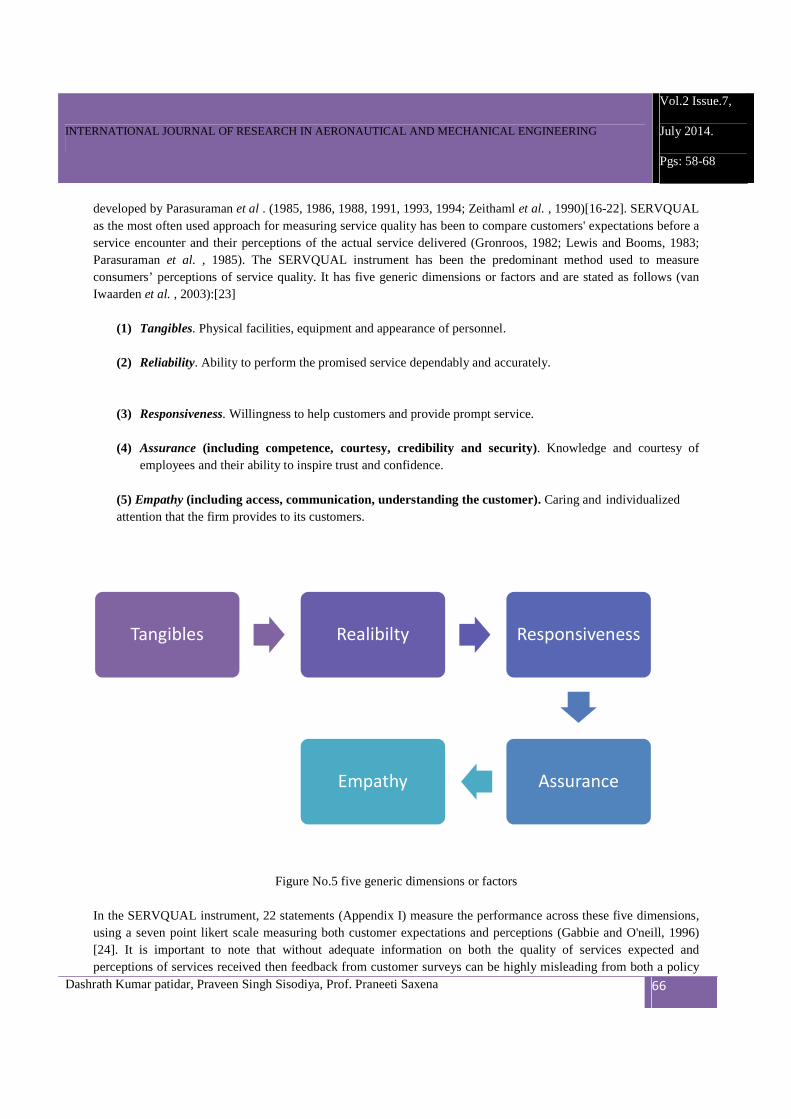
developed by Parasuraman et al . (1985, 1986, 1988, 1991, 1993, 1994; Zeithaml et al. , 1990)[16-22]. SERVQUAL as the most often used approach for measuring service quality has been to compare customers' expectations before a service encounter and their perceptions of the actual service delivered (Gronroos, 1982; Lewis and Booms, 1983; Parasuraman et al. , 1985). The SERVQUAL instrument has been the predominant method used to measure consumers’ perceptions of service quality. It has five generic dimensions or factors and are stated as follows (van Iwaarden et al. , 2003):[23]
(1) Tangibles. Physical facilities, equipment and appearance of personnel.
(2) Reliability. Ability to perform the promised service dependably and accurately.
(3) Responsiveness. Willingness to help customers and provide prompt service.
(4) Assurance (including competence, courtesy, credibility and security) . Knowledge and courtesy of employees and their ability to inspire trust and confidence.
(5) Empathy (including access, communication, understanding the customer). Caring and individualized attention that the firm provides to its customers.
Figure No.5 five generic dimensions or factors
In the SERVQUAL instrument, 22 statements (Appendix I) measure the performance across these five dimensions, using a seven point likert scale measuring both customer expectations and perceptions (Gabbie and O'neill, 1996) [24]. It is important to note that without adequate information on both the quality of services expected and perceptions of services received then feedback from customer surveys can be highly misleading from both a policy
Tangibles Realibilty Responsiveness
Assurance Empathy

INTERNATIONAL JOURNAL OF RESEARCH IN AERONAUTICAL AND MECHANICAL ENGINEERING
Vol.2 Issue.7,
July 2014.
Pgs: 58-68
Dashrath Kumar patidar, Praveen Singh Sisodiya, Prof. Praneeti Saxena 67
and an operational perspective. In the following, the application of SERVQUAL approach is more specified with an example in a catering company.
5. DISCUSSION The research on measuring service quality has focused primarily on how to meet or exceed the external customer’s expectations, and has viewed service quality as a measure of how the delivered service level matches consumer’s expectations. These perspectives can also be applied to the employees of a firm and in this case, other major gaps could be closed in the service quality gaps model.
6. CONCLUSION In this paper, service quality and its model of gaps were reviewed. SERVQUAL attitude as an analytical approach for evaluating the dissimilarity between customers' expectations and perceptions of quality was also studied. While this research provides some perspectives to the field of service quality, it is supposed that there are a number of belongings that should be done to corroborate the demonstrated methodologies as well as to enhance the use of SERVQUAL in design and improvement of quality services in tractor industries. Just as the SERVQUAL instrument is extensively used to weigh up external service quality, the instrument can also be customized to weigh up the quality of the internal service provided by departments and divisions within a company to employees in other departments and divisions. The results of the current study demonstrate that organizations can at least consider five dimensions of service quality to ascertain the level of services provided, and to determine which dimensions need improvement.
7. REFERENCES [1]. R. D. Grisso, D. L. Morgan, G. J. Shropshire, S. K. Rockwell “What Information Helps a Farmer Purchase a Tractor?”, ‘APPLIED ENGINEERING in AGRICULTURE’. [2]. Bedi Kanishka: Quality Management:Oxford University Press (2010). [3]. http://en.wikipedia.org/wiki/Eight_dimensions_of_quality [4]. Wisniewski M, Wisniewski H (2005). Measuring service quality in a hospital colposcopy clinic. Int. Journal Health Care Qual. 18(2/3): 217-229. [5]. Lewis and Mitchell, 1990; Dotchin and Oakland, 1994a; Asubonteng et al., 1996; Wisniewski and Donnelly, 1996). [6]. Parasuraman, A., Zeithaml, V.A. & Berry, L.L. (1985) A conceptual model of service quality and its implications for future research, Journal of Marketing, 49, pp. 41–50. [7]. Woodside, A.G., L.L. Frey, and R.T. Daly (1989). ‘Linking Service Quality, Customer Satisfaction, and Behavioral Intention’. Journal of Health Care Marketing. 9(4), p.5-17 [8]. Amitava Mitra , Quality Control and Improvement 2009. [9]. Parasuraman, A., Zeithaml, V.A., & Berry, L.L, (1985), “A conceptual model of service quality and its implications for future research.” Journal of Marketing, Vol. 49, fall. [10] Parasuraman, A., Zeithamal, V.A., and Berry, L.L., (1988), “SERVQUAL: A Multiple- Item Scale for Measuring Consumer Perceptions of Service quality.” Journal of retailing, volume 64, number 1, spring.

INTERNATIONAL JOURNAL OF RESEARCH IN AERONAUTICAL AND MECHANICAL ENGINEERING
Vol.2 Issue.7,
July 2014.
Pgs: 58-68
Dashrath Kumar patidar, Praveen Singh Sisodiya, Prof. Praneeti Saxena 68
[11] Johnston R (1995). The determinants of service quality satisfiers and dissatisfies. Int. J. Serv. Ind. Manage., 6(5): 53-71. [12] Grönroos, C. (2000), Service management and Marketing-A customer Relationship management approach. [13] Zeithaml, V. A., Berry, L. L. & Parasuraman, A. (1985). “The behavioral consequences of service quality”. Journal of Marketing, 60 (1), 31-46. [14] Oppewal, H. & Vriens, M. (2000), “Measuring perceived service quality using integrated conjoint experiments”, International Journal of Bank Marketing, Vol.18, No.4, PP. 154-69. [15] Bahia, K. and Nantel, J. (2000), ``Areliableand valid measurement scale for the perceived service quality of banks’’, International Journal of Bank Marketing, Vol.18 No.2, pp.84-91. [16] Parasuraman, A., Zeithaml, V.A., &Berry, L.L, (1985), “A conceptual model of service quality and its implications for future research.” Journal of Marketing, Vol. 49, fall. [17] Parasuraman, A., Zeithaml, V.A. and Berry, L.L. (1985), "A conceptual model of service quality and its implication", Journal of Marketing , Vol. 49, Fall, pp. 41-50. [18]Parasuraman, A., Zeithaml, V.A. and Berry, L.L. (1986), "SERVQUAL: a multiple-item scale for measuring customer perceptions of service quality", Report No. 86-108, Marketing Science Institute, Cambridge, MA. [19]Parasuraman, A., Zeithaml, V.A. and Berry, L.L. (1988), "SERVQUAL: a multi-item scale for measuring consumer perceptions of the service quality", Journal of Retailing , Vol. 64, No. 1, pp. 12- 40. [20]Parasuraman, A., Zeithaml, V.A. and Berry, L.L. (1991), "Refinement and reassessment of the SERVQUAL scale|", Journal of Retailing , Vol. 67, pp. 420-450. [21]Parasuraman, A., Zeithaml, V.A. and Berry, L.L. (1993), "Research note: more on improving service quality measurement", Journal of Retailing , Vol. 69, No. 1, pp. 140-147. [22]Parasuraman, A., Zeithaml, V.A. and Berry, L.L. (1994), "Reassessment of expectations as a comparison standard in measuring service quality: implications for future research", Journal of Marketing , Vol. 58, pp. 111-124. [23] Van Iwaarden, J., van der Wiele, T., Ball, L., and Millen, R. (2003), "Applying SERVQUAL to web sites: An exploratory study", International Journal of Quality & Reliability Management , Vol.20, No.8, pp. 919-935.. [24] Gabbie, O. and O'Neill, M.A. (1996) SERVQUAL and the northern Ireland hotel sector: A comparative analysis – Part 1, Managing Service Quality, Vol.6, No.6, pp. 25-32.