
Service quality in maritime transport Service quality in maritime transport: conceptual model and...
26
Service quality in maritime transport 493 Asia Pacific Journal of Marketing and Logistics Vol. 20 No. 4, 2008 pp. 493-518 # Emerald Group Publishing Limited 1355-5855 DOI 10.1108/13555850810909777 Received June 2007 Revised December 2007 Accepted December 2007 Service quality in maritime transport: conceptual model and empirical evidence Vinh V. Thai Department of Maritime and Logistics Management, Australian Maritime College, Launceston, Australia Abstract Purpose – The purpose of this paper is to extend knowledge on service quality and how it is defined and thus, managed, in the context of maritime transport by proposing and testing a new conceptual model of service quality. Design/methodology/approach – The study used a sample of 197 shipping companies, port operators and freight forwarders/logistics service providers, employing the triangulation of both mail survey and in-depth interview techniques. A total of 120 usable questionnaires were returned and 25 interviews conducted. Data were analysed using the SPSS 13.0 software and thematic analysis technique. Findings – It was found that service quality in maritime transport is a six-dimensional construct consisting of resources, outcomes, process, management, image, and social responsibility (ROPMIS), with each dimension measured by a number of explaining factors making up a total of 24 factors. Findings also revealed that factors involving the outcomes and process of service provision, as well as the management factors, which all focus on satisfying the customers, received high ranking. They also emphasised process and management-related factors which involve the centre of all quality systems: the human element. Research limitations/implications – As this is the first stage of a more comprehensive study, the model was tested only with service providers, and this is the major limitation. Future research direction is desired, e.g. conducting the study using the same instruments on customers and compare the gaps with this research. Originality/value – The major contribution of this study is to fully operationalise service quality as a six-dimensional construct in the context of maritime transport, and findings on the ranking of dimensions/factors involved in the model. Although this is the first model of service quality in maritime transport with specific quality factors, its generic dimensions could be generalised to other service sectors as well. The research also has great managerial implications as managers across maritime transport companies can use the tool to develop questionnaire for customer satisfaction survey, thus facilitating a universal benchmarking approach across the industry. Keywords Quality management, SERVQUAL, Freight forwarding, Customer services quality, Vietnam Paper type Research paper Introduction The quality of products and services is of strategic importance to not only a company’s business but also the national economy. While the strategic importance of quality is widely acknowledged, there has never been a universal approach to the definition of the concept of quality and its associated dimensions. Although there have been a number of well-known service quality models such as SERVQUAL which continues to inspire research on service quality, it is widely argued that the dimensions of service quality indicated in SERVQUAL are either too many or too few depending on the specific context of the research study. In addition, there is very little research done in maritime transport as a service sector on how service quality is defined and attributed. The current issue and full text archive of this journal is available at www.emeraldinsight.com/1355-5855.htm
-
Upload
independent -
Category
Documents
-
view
2 -
download
0
Transcript of Service quality in maritime transport Service quality in maritime transport: conceptual model and...

Service qualityin maritime
transport
493
Asia Pacific Journal of Marketingand Logistics
Vol. 20 No. 4, 2008pp. 493-518
# Emerald Group Publishing Limited1355-5855
DOI 10.1108/13555850810909777
Received June 2007Revised December 2007
Accepted December 2007
Service quality in maritimetransport: conceptual model and
empirical evidenceVinh V. Thai
Department of Maritime and Logistics Management, Australian MaritimeCollege, Launceston, Australia
Abstract
Purpose – The purpose of this paper is to extend knowledge on service quality and how it is definedand thus, managed, in the context of maritime transport by proposing and testing a new conceptualmodel of service quality.Design/methodology/approach – The study used a sample of 197 shipping companies, portoperators and freight forwarders/logistics service providers, employing the triangulation of both mailsurvey and in-depth interview techniques. A total of 120 usable questionnaires were returned and 25interviews conducted. Data were analysed using the SPSS 13.0 software and thematic analysistechnique.Findings – It was found that service quality in maritime transport is a six-dimensional constructconsisting of resources, outcomes, process, management, image, and social responsibility (ROPMIS),with each dimension measured by a number of explaining factors making up a total of 24 factors.Findings also revealed that factors involving the outcomes and process of service provision, as wellas the management factors, which all focus on satisfying the customers, received high ranking. Theyalso emphasised process and management-related factors which involve the centre of all qualitysystems: the human element.Research limitations/implications – As this is the first stage of a more comprehensive study, themodel was tested only with service providers, and this is the major limitation. Future researchdirection is desired, e.g. conducting the study using the same instruments on customers and comparethe gaps with this research.Originality/value – The major contribution of this study is to fully operationalise service quality asa six-dimensional construct in the context of maritime transport, and findings on the ranking ofdimensions/factors involved in the model. Although this is the first model of service quality inmaritime transport with specific quality factors, its generic dimensions could be generalised to otherservice sectors as well. The research also has great managerial implications as managers acrossmaritime transport companies can use the tool to develop questionnaire for customer satisfactionsurvey, thus facilitating a universal benchmarking approach across the industry.
Keywords Quality management, SERVQUAL, Freight forwarding, Customer services quality,Vietnam
Paper type Research paper
IntroductionThe quality of products and services is of strategic importance to not only a company’sbusiness but also the national economy. While the strategic importance of quality iswidely acknowledged, there has never been a universal approach to the definition ofthe concept of quality and its associated dimensions. Although there have been anumber of well-known service quality models such as SERVQUAL which continues toinspire research on service quality, it is widely argued that the dimensions of servicequality indicated in SERVQUAL are either too many or too few depending onthe specific context of the research study. In addition, there is very little research donein maritime transport as a service sector on how service quality is defined andattributed.
The current issue and full text archive of this journal is available atwww.emeraldinsight.com/1355-5855.htm
APJML20,4
494
In this paper, we aim to address these gaps in the literature and managementpractice by proposing and testing a new conceptual model of service qualitydimensions in maritime transport verified by an empirical study conducted in Vietnam.The paper is organised in four main sections. First, a literature review is providedfollowed by the proposed conceptual model of service quality in maritime transportwith dimensions and explaining factors. Methodologies are described next, followed byanalyses and discussions on study findings. Implications for academic andmanagement, as well as limitations of the study, are then devised. Finally, concludingcomments and future research directions are outlined.
Quality in the service industryService quality, according to Babakus and Boller (1992), is specifically seen as ‘‘anumbrella construct with distinct dimensions’’, although there is no real consensus as towhat these dimensions might be. Various scholars have suggested a number ofdimensions of quality service. Sasser et al. (1978) listed seven service attributes, namely(1) security; (2) consistency; (3) attitude; (4) completeness; (5) condition; (6) availabilityand (7) training. Gronroos (1978, 1982, 1984) suggested that service quality comprisesof three dimensions, namely the technical quality of the outcome of the serviceencounter, the functional quality of the process itself and the corporate image.Following this, Lehtinen and Lehtinen (1982) defined service quality as a three-dimensional construct consisting of interactive, physical and corporate qualitydimensions which are quite similar to Gronroos’s view. A number of detailedclassifications of service quality dimensions have also been suggested by otherresearchers, e.g. the work of Parasuraman, et al. (1985, 1988) with their gap (PZB)model and later developed into SERVQUAL. While Parasuraman et al. (1988) claim thattheir five service quality dimensions are generic, it has been illustrated that this is notthe case, and that the definition and number of service quality dimensions may varydepending on the context. Babakus and Boller (1992) concluded that service quality isprobably a unidimensional construct depending on the types of service under study,and different measures designed for different service industries may prove to be a moreviable and useful research strategy to pursue. This suggestion was also synchronisedby the work of Cronin and Taylor (1992), Buttle (1996), Genestre and Herbig (1996),Mels et al. (1997) and White and Galbraith (2000). While the SERVQUAL instrumenthas been accepted by many studies, there have been arguments that it only reflects theservice delivery process. Research along this line were conducted by Kang and James(2004), Liu (2005), Srikatanyoo and Gnoth (2005) and Fowdar (2005). Sureshchandaret al. (2002) also concluded that there are three new dimensions of quality beyond thetwo main factors of SERVQUAL.
Some other noteworthy studies were conducted by Haywood-Farmer (1988) withthree elements or three Ps of service quality, Gronroos (1988) with a list of six criteria ofgood perceived service quality, LeBlanc and Nguyen (1988) with five groups ofcharacteristics that explain perceived quality in financial institutions, Brown (1988)with three dimensions, Ovretveit (1993) which argued that service quality is not justcustomers’ perceptions but involved other perspectives such as internal managementof processes, or in other words, not only focusing on the ‘‘technical outcome’’ but alsothe ‘‘functional process’’. Johnston (1995) suggested 18 determinants of service quality,most of them are quality dimensions developed previously by Parasuraman et al. (1985,1988). Harte and Dale (1995) summarised six general attributes that are required bycustomers as quality dimensions developed from SERVQUAL. Brady and Cronin

Service qualityin maritime
transport
495
(2001) proposed three dimensions, comprising the interaction quality, physicalenvironment and outcome quality. Aldlaigan and Buttle (2002), meanwhile, developed anew scale consisting of four dimensions which are categorised in the technical andfunctional service quality proposed by Gronroos. Another approach in discussions iswhen the research is placed in the context of different socio-cultural and/or economicenvironments. Several authors (Malhotra et al., 1994; Buttle, 1996; Llosa et al., 1998)raised concerns about whether SERVQUAL adequately captures the service qualitydimensions in various socio-cultural and/or economic contexts. There have been somechallenges to the validity of SERVQUAL, such as the studies conducted by Imrie et al.(2000, 2002) and Lin et al. (2000).
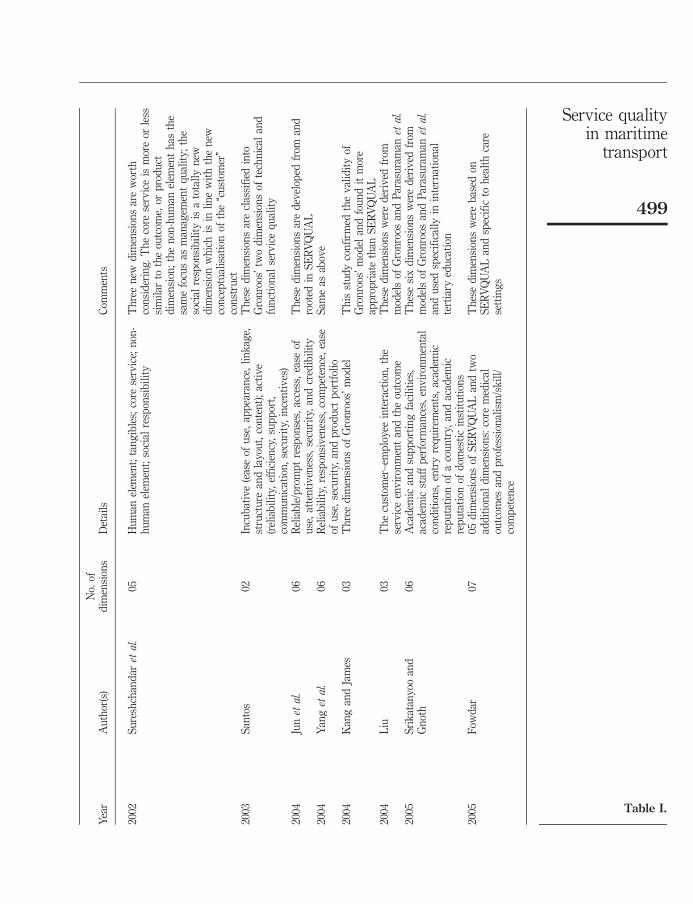
Table I summarises the review of selected literature on service quality dimensions.This table indicates that there is no universal and encompassing approach to servicequality dimensions which can be appropriate and applicable to all service industriesand across all socio-cultural and economic environments. While the conceptualisationand measurement instrument of SERVQUAL was a basis for further research invarious service industries, authors of this later research have also indicated that it isnot an ideal model, applicable for all industries and in all socio-cultural and economicenvironments. Indeed, various authors have found that the dimensions of servicequality indicated in SERVQUAL are either too many or too few for the specific contextof their research.
Another aspect of service quality dimensions apparent from the literature review isthat customer perception is no longer the only source of perceived service quality.Instead, management quality, or ensuring the quality of internal and externalmanagement processes of service production and delivery, is as important as satisfyingcustomers by meeting and/or exceeding their requirements/expectations. Quality ofservice is perceived by not only focusing on its external elements such as satisfyingtraditional customers but also by concentrating on internal factors withinorganisations. In addition, with the paradigm shift of the concept of traditionalcustomer to stakeholder nowadays, social responsibility is perceived as a criticaldimension which can enhance or damage the image or reputation of organisations andhence the perceived quality of their services.
While the summary of the literature review on service quality dimensions showswide diversity in the quantity of dimensions as well as their essence, review of thesevarious studies suggests that the dimensions of service quality can be generallyclassified into six groups, as follows:
(1) Resources-related quality dimension: relates to physical resources, financialresources, condition of facilities, equipment, location, infrastructures, etc.
(2) Outcome-related quality dimension: involves the product or core services beingreceived by the customers, for instance, service accomplishment such as the on-time delivery of a shipment, or the price of a service offered.
(3) Process-related quality dimension: basically relates to factors of interactionsbetween employees and customers, for example, how customers perceive thebehaviour of staff in dealing with customers’ requirements, staff’s knowledge ofcustomers’ wants and needs, as well as application of technology in betterserving the customers.
(4) Management-related quality dimension: involves the selection and deploymentsof resources in the most efficient way so as to ensure meeting/exceedingcustomers’ needs and expectations, knowledge, skills and professionalism of

APJML20,4
496
Table I.Summary of selectedliterature on servicequality dimensions
Yea
rA
uth
or(s
)N
o.of
dim
ensi
ons
Det
ails
Com
men
ts
1978
Sas
ser
etal.
07S
ecu
rity
,co
nsi
sten
cy,
atti
tud
e,co
mp
lete
nes
s,co
nd
itio
n,
avai
lab
ilit
y,tr
ain
ing
Bas
ical
ly,
thes
ed
imen
sion
sca
nb
ecl
assi
fied
into
the
foll
owin
gg
rou
ps:
qu
alit
yof
ph
ysi
cal
asse
ts,
reli
abil
ity
ofse
rvic
e,q
ual
ity
ofse
rvic
ed
eliv
ery
pro
cess
es19
78,
1982
,19
83,
1984
,19
88,
2001
Gro
nro
os03
Tec
hn
ical
qu
alit
yof
outc
ome,
fun
ctio
nal
qu
alit
yof
pro
cess
,co
rpor
ate
imag
eT
hes
ed
imen
sion
sco
ver
all
thos
ep
rop
osed
by
Sas
ser
etal.
and
also
pro
pos
edth
eco
rpor
ate
imag
eor
rep
uta
tion
asa
dim
ensi
on19
82L
ehti
nen
and
Leh
tin
en03
Inte
ract
ive
qu
alit
y,p
hy
sica
lq
ual
ity,
corp
orat
eq
ual
ity
Th
ese
thre
ed
imen
sion
sar
eq
uit
esi
mil
arto
thos
ep
rop
osed
by
Gro
nro
os19
85P
aras
ura
man
etal.
10R
elia
bil
ity,
resp
onsi
ven
ess,
com
pet
ence
,ac
cess
,co
urt
esy,
com
mu
nic
atio
n,
cred
ibil
ity,
secu
rity
,u
nd
erst
and
ing
/kn
owin
gcu
stom
er,
tan
gib
les
Th
isse
par
atio
nof
dim
ensi
ons
isv
ery
det
aile
d;
the
mai
nes
sen
ceof
the
dim
ensi
ons
isb
asic
ally
tow
ith
Sas
ser
etal.
1988
Par
asu
ram
anet
al.
05S
ER
VQ
UA
L:
tan
gib
les,
reli
abil
ity,
resp
onsi
ven
ess,
assu
ran
ce,
emp
ath
yS
ame
asab
ove
1988
Hay
woo
d-F
arm
eret
al.
03P
hy
sica
lfa
cili
ties
,p
roce
sses
and
pro
ced
ure
s;p
eop
le’s
beh
avio
ur
and
con
viv
iali
ty;
pro
fess
ion
alju
dg
emen
t
Th
ees
sen
ceof
thes
ed
imen
sion
sen
com
pas
ses
the
con
ten
tof
thos
ep
rop
osed
by
pre
vio
us
auth
ors
such
asS
asse
ret
al.;
Gro
nro
os;
Par
asu
ram
an,
Zei
tham
lan
dB
erry
.T
he
add
edel
emen
tis
the
pro
fess
ion
alis
mof
the
serv
ice
pro
vid
er19
88G
ron
roos
06P
rofe
ssio
nal
ism
and
skil
ls;
atti
tud
esan
db
ehav
iou
r;ac
cess
ibil
ity
and
flex
ibil
ity
;re
liab
ilit
yan
dtr
ust
wor
thin
ess;
reco
ver
y;
rep
uta
tion
and
cred
ibil
ity
Th
ead
ded
dim
ensi
on,
‘‘rec
over
y’’,
toso
me
exte
nt
can
be
con
sid
ered
asth
ead
dit
ion
alel
emen
tof
pro
fess
ion
alis
min
that
the
serv
ice
pro
vid
eris
pro
acti
ve
ind
eali
ng
wit
hcu
stom
erre
lati
onsh
ipm
anag
emen
t (con
tinued
)

Service qualityin maritime
transport
497
Table I.
Yea
rA
uth
or(s
)N
o.of
dim
ensi
ons
Det
ails
Com
men
ts
1988
LeB
lan
can
dN
gu
yen
05D
egre
eof
cust
omer
sati
sfac
tion
;in
tern
alor
gan
isat
ion
;p
hy
sica
len
vir
onm
ent
and
inst
rum
ents
sup
por
tin
gse
rvic
e-p
rod
uci
ng
syst
em;
corp
orat
eim
age;
per
son
nel
/cu
stom
erin
tera
ctio
n
Bas
ical
ly,
thes
ed
imen
sion
sar
ein
lin
ew
ith
pre
vio
us
iden
tifi
edd
eter
min
ants
1988
Bro
wn
03A
ccom
pli
shm
ent;
beh
avio
ur;
pro
du
cts
Th
ese
dim
ensi
ons
also
emp
has
ise
the
esse
nce
ofth
ose
inp
rev
iou
sst
ud
ies.
1992
Bab
aku
san
dB
olle
r01
Per
form
ance
Alt
hou
gh
this
sep
arat
ion
issi
mp
le,
itm
ayn
otre
flec
tth
etr
ue
scop
eof
serv
ice
qu
alit
yd
imen
sion
ssi
nce
the
stu
dy
was
con
du
cted
ina
ver
yu
niq
ue
case
wit
hex
trao
rdin
ary
char
acte
rist
ics
1992
Cro
nin
and
Tay
lor
01P
erfo
rman
ceS
ame
asab
ove
1993
Ov
retv
eit
03C
ust
omer
orcl
ien
tq
ual
ity
;p
rofe
ssio
nal
orte
chn
ical
qu
alit
y;
man
agem
ent
qu
alit
yIt
can
be
seen
that
the
dim
ensi
ons
pro
pos
edb
yO
vre
tvei
tw
ere
inh
erit
edfr
omp
rev
iou
sst
ud
ies.
His
new
dim
ensi
on,
man
agem
ent
qu
alit
y,su
gg
este
da
new
insi
gh
tas
itre
ferr
edto
the
inte
rnal
and
exte
rnal
man
agem
ent
asp
ect.
1995
Joh
nst
on18
Mos
tly
bas
edon
dim
ensi
ons
ofP
aras
ura
man
etal.
(198
5,19
88)
Th
ees
sen
ceof
thes
ed
imen
sion
sar
ein
lin
ew
ith
thos
ein
pre
vio
us
stu
die
sof
Par
asu
ram
anet
al.
1995
Har
tean
dD
ale
06T
imel
ines
s;em
pat
hy
;as
sura
nce
;fe
es;
tan
gib
les;
reli
abil
ity
Bas
ical
ly,
this
sep
arat
ion
ofd
imen
sion
sis
sim
ilar
toS
ER
VQ
UA
L;
the
tim
elin
ess
dim
ensi
onto
som
eex
ten
tca
nb
ein
clu
ded
inth
ere
liab
ilit
y.19
96B
utt
le06
SE
RV
QU
ALþ
01d
imen
sion
ind
icat
ing
the
outc
ome
Infa
ct,
this
dim
ensi
onin
dic
atin
gth
eou
tcom
eh
asb
een
men
tion
edp
rev
iou
sly
by
Gro
nro
osan
dot
her
s
(con
tinued
)

APJML20,4
498
Table I.
Yea
rA
uth
or(s
)N
o.of
dim
ensi
ons
Det
ails
Com
men
ts
1996
Gen
estr
ean
dH
erb
ig06
SE
RV
QU
AL
+01
dim
ensi
onof
pro
du
ctq
ual
ity
Infa
ct,
this
new
dim
ensi
onh
asal
sob
een
pre
vio
usl
yre
ferr
edto
by
Bro
wn
1997
Mel
set
al.
02E
xtr
insi
cq
ual
ity
;in
trin
sic
qu
alit
yB
asic
ally
,th
ese
two
dim
ensi
ons
are
sim
ilar
toth
ete
chn
ical
and
fun
ctio
nal
qu
alit
yd
evel
oped
by
Gro
nro
os20
00W
hit
ean
dG
alb
rait
h13
Rel
iab
ilit
y;
resp
onsi
ven
ess;
com
pet
ence
;co
mm
itm
ent;
acce
ss;
avai
lab
ilit
y;
com
mu
nic
atio
n;
un
der
stan
din
g;
flex
ibil
ity
;ta
ng
ible
s/fu
nct
ion
alit
y/t
ech
nol
ogy
;cr
edib
ilit
y/i
nte
gri
ty;
cou
rtes
y/f
rien
dli
nes
s;h
elp
fuln
ess/
care
Bas
ical
ly,
itca
nb
ep
erce
ived
that
thes
ed
imen
sion
s,th
oug
hm
ore
com
pre
hen
siv
eth
anS
ER
VQ
UA
L,
hav
eth
eir
esse
nce
root
edin
the
sim
ilar
gro
un
dto
thos
ein
pre
vio
us
stu
die
s
2000
Imri
eet
al.
07T
ang
ible
s;re
liab
ilit
y;
resp
onsi
ven
ess;
assu
ran
ce;
gen
eros
ity
;p
olit
enes
san
dco
urt
esy
;si
nce
rity
Alt
hou
gh
the
emp
ath
yd
imen
sion
inS
ER
VQ
UA
Lw
asb
road
lyel
abor
ated
into
thre
en
ewd
imen
sion
s,th
etr
ue
esse
nce
ofto
tal
dim
ensi
ons
are
the
sam
e.T
he
not
edm
ean
ing
ofth
isst
ud
yis
its
imp
lica
tion
inth
eA
sian
con
tex
t20
00L
inet
al.
07T
ang
ible
s;re
liab
ilit
y;
resp
onsi
ven
ess;
assu
ran
ce;
gen
eros
ity
;p
olit
enes
san
dco
urt
esy
;si
nce
rity
Sam
eas
abov
e
2002
Imri
eet
al.
07A
sab
ove.
Th
ela
tter
thre
ear
eg
rou
ped
into
the
so-c
alle
d‘‘i
nte
rper
son
alre
lati
ons’
’S
ame
asab
ove
2001
Bra
dy
and
Cro
nin
3d
imen
sion
sþ
3su
b-d
imen
sion
sO
utc
ome,
inte
ract
ion
,en
vir
onm
enta
lq
ual
ity
Th
ese
dim
ensi
ons
mat
chG
ron
roos
’m
odel
2002
Ald
laig
anan
dB
utt
le4
dim
ensi
ons
Ser
vic
esy
stem
qu
alit
y,b
ehav
iou
ral
serv
ice
qu
alit
y,se
rvic
etr
ansa
ctio
nal
accu
racy
,m
ach
ine
serv
ice
qu
alit
y
Th
ese
dim
ensi
ons
are
clas
sifi
edin
toG
ron
roos
’tw
od
imen
sion
sof
tech
nic
alan
dfu
nct
ion
alse
rvic
eq
ual
ity
(con
tinued
)
Service qualityin maritime
transport
499
Table I.
Yea
rA
uth
or(s
)N
o.of
dim
ensi
ons
Det
ails
Com
men
ts
2002
Su
resh
chan
dar
etal.
05H
um
anel
emen
t;ta
ng
ible
s;co
rese
rvic
e;n
on-
hu
man
elem
ent;
soci
alre
spon
sib
ilit
yT
hre
en
ewd
imen
sion
sar
ew
orth
con
sid
erin
g.
Th
eco
rese
rvic
eis
mor
eor
less
sim
ilar
toth
eou
tcom
e,or
pro
du
ctd
imen
sion
;th
en
on-h
um
anel
emen
th
asth
esa
me
focu
sas
man
agem
ent
qu
alit
y;
the
soci
alre
spon
sib
ilit
yis
ato
tall
yn
ewd
imen
sion
wh
ich
isin
lin
ew
ith
the
new
con
cep
tual
isat
ion
ofth
e‘‘c
ust
omer
’’co
nst
ruct
2003
San
tos
02In
cub
ativ
e(e
ase
ofu
se,
app
eara
nce
,li
nk
age,
stru
ctu
rean
dla
you
t,co
nte
nt)
;ac
tiv
e(r
elia
bil
ity,
effi
cien
cy,
sup
por
t,co
mm
un
icat
ion
,se
curi
ty,
ince
nti
ves
)
Th
ese
dim
ensi
ons
are
clas
sifi
edin
toG
ron
roos
’tw
od
imen
sion
sof
tech
nic
alan
dfu
nct
ion
alse
rvic
eq
ual
ity
2004
Jun
etal.
06R
elia
ble
/pro
mp
tre
spon
ses,
acce
ss,
ease
ofu
se,
atte
nti
ven
ess,
secu
rity
,an
dcr
edib
ilit
yT
hes
ed
imen
sion
sar
ed
evel
oped
from
and
root
edin
SE
RV
QU
AL
2004
Yan
get
al.
06R
elia
bil
ity,
resp
onsi
ven
ess,
com
pet
ence
,ea
seof
use
,se
curi
ty,
and
pro
du
ctp
ortf
olio
Sam
eas
abov
e
2004
Kan
gan
dJa
mes
03T
hre
ed
imen
sion
sof
Gro
nro
os’
mod
elT
his
stu
dy
con
firm
edth
ev
alid
ity
ofG
ron
roos
’m
odel
and
fou
nd
itm
ore
app
rop
riat
eth
anS
ER
VQ
UA
L20
04L
iu03
Th
ecu
stom
er–
emp
loye
ein
tera
ctio
n,
the
serv
ice
env
iron
men
tan
dth
eou
tcom
eT
hes
ed
imen
sion
sw
ere
der
ived
from
mod
els
ofG
ron
roos
and
Par
asu
ram
anet
al.
2005
Sri
kat
anyo
oan
dG
not
h06
Aca
dem
ican
dsu
pp
orti
ng
faci
liti
es,
acad
emic
staf
fp
erfo
rman
ces,
env
iron
men
tal
con
dit
ion
s,en
try
req
uir
emen
ts,
acad
emic
rep
uta
tion
ofa
cou
ntr
y,an
dac
adem
icre
pu
tati
onof
dom
esti
cin
stit
uti
ons
Th
ese
six
dim
ensi
ons
wer
ed
eriv
edfr
omm
odel
sof
Gro
nro
osan
dP
aras
ura
man
etal.
and
use
dsp
ecif
ical
lyin
inte
rnat
ion
alte
rtia
ryed
uca
tion
2005
Fow
dar
0705
dim
ensi
ons
ofS
ER
VQ
UA
Lan
dtw
oad
dit
ion
ald
imen
sion
s:co
rem
edic
alou
tcom
esan
dp
rofe
ssio
nal
ism
/sk
ill/
com
pet
ence
Th
ese
dim
ensi
ons
wer
eb
ased
onS
ER
VQ
UA
Lan
dsp
ecif
icto
hea
lth
care
sett
ing
s
APJML20,4
500
employees and their understanding and transforming customers’ needs andrequirements into what they really want. This also relates to the feedbacksystem from customers as new inputs for the new quality management cycle,as well as continuous improvement as suggested by various quality gurus.
(5) Image/reputation-related quality dimension: relates to the overall perception ofcustomers about the service organisation.
(6) Social responsibility-related quality dimension: involves the ethical perceptionand operations of an organisation to behave in a socially responsible manner.
These dimensions were derived using an interpretive approach that attempted to findcommon ground between the dimensions identified in the literature. This model ofservice quality dimensions, though conceptualised through review of the literature, istheoretical and indicative only at this stage. In order to be applicable to this research, itneeds to be tailored to the maritime transport industry which is discussed in thesection that follows.
Service quality in maritime transportIncreasingly over past decades, there has been recognition from transport operatorsthat improvement in transport service quality is critical in achieving a differentialadvantage over competition (Cotham et al., 1969). However, little literature directlyaddresses the dimensions or determinants of service quality in transport. Suchdimensions or determinants are reflected only through the service factors in theselection criteria of transport elements, such as carriers or modes. A search of therelated literature revealed that most of the literature addresses the issue indirectlythrough carrier or port selection decisions rather than directly through the attributes ofquality dimensions of maritime transport-related services. Nevertheless, through theanalysis and discussion of the selection variables based on groups of factors, one is ableto identify the service- and performance-related attributes that are considered to bewithin the scope of dimensions of service quality.
Pearson’s (1980) found the most important criteria are flexibility, first on the quay,speed of transit, reliability and regularity. The issue of carrier selection decisions inliner shipping was examined by Brooks (1985, 1990), in which the carrier selectioncriteria are frequency of sailings, transit time, directness of sailings, on-time pick-upand delivery, cost of service, cooperation between personnel, carrier flexibility, fastclaims response, tracing capability of the carrier, sales representative, carrier’sreputation for reliability, past loss and damage experience, informational nature ofadvertising and carrier appropriateness. Durvasula et al. (1999) revealed thatSERVQUAL may be better represented by a more parsimonious (i.e. three-dimensional)factor structure. Slack (1985) is probably the pioneer scholar who examined the criteriathat shippers use in their port selection decisions, which include size of port, portequipment, proximity of port, port charges, port security and congestion. Studied byMurphy et al. (1989, 1991, 1992) showed that equipment availability, shipmentinformation and loss and damage performance are the three most important carrierselection factors among freight forwarders, while for international ports selectionfactors are equipment availability, loss and damage performance, large shipmentcapabilities and convenient pick-up and delivery time. Tongzon (2002) found that portefficiency is the most important factor in port choice and performance. Lopez and Poole(1998), meanwhile, indicated three dimensions contributed to the quality of portservices, namely, efficiency, timeliness and security. Ugboma et al. (2004) found that all

Service qualityin maritime
transport
501
five SERVQUAL dimensions were valid. Meanwhile, Frankel (1993) found that thefollowing nine criteria indicate the major quality concerns with regards to linershipping services: reliability of service, time of service and maintenance of deliverytime, availability of promised or advertised capacity, cargo safety, security andmaintenance, cargo flow control and tracking, documentation and information flowseffectiveness (timeliness and accuracy), Cost control, billing and cost management,service status control and projection, intermodal management.
The notion of service quality in maritime transport nowadays has far exceeded thescope of selection criteria decisions on carriers or ports. In a range of literature onquality in shipping, or ‘‘quality shipping’’, quality has a broader definition than purelyproviding quality services, and contains many other elements. Quality shipping inpractice is closely related to safety and environmental protection issues, as emphasisedin Hawkins (2001), Bengtson (1992), MPA Singapore (2000). Botterill (1995) alsostressed the important contribution that quality management can make to shippingwhere safety management is 85 per cent of ship management and safety managementis 85 per cent of a quality management system. The critical importance of safety andenvironmental protection concerns also sheds light on a new and indispensabledimension of maritime transport services: corporate social responsibility. The shippingcommunity and society nowadays are very concerned with the safety andenvironmental protection awareness and responsible behaviour of service providers inmaritime transport. Undeniably, when an accident such as an oil spill occurs, it is notonly the company’s shareholders who suffer with loss of property, but also otherstakeholders, for instance fishery and tourism industries, who have to bear theconsequences of such an accident. It is no surprise then that in the shipping industry,corporate social responsibility is associated with the concept of quality, and qualityservices of maritime transport must incorporate this dimension. This viewpoint hasbeen increasingly acknowledged by professionals, academia, international governingbodies and stakeholders in the maritime transport industry, as reflected in the works ofRuiter (1999), Gratsos (1998) and Eliades (1992), and by some initiatives such as theGreen Award (Green Award, 2004) and the Ecoports port project (Ecoports, 2004). Itcan be seen from the above that service quality in maritime transport means not onlysafe, reliable, efficient transport services but also socially responsible behaviour andactivities regarding safety and environmental protection concerns.
The concept of service quality dimensions in maritime transport is summarised inTable II. It can be seen repeatedly from the table that key factors indicating quality inmaritime transport are tangibles (infrastructure, availability of equipment andfacilities), reliability of service performance (timeliness, accuracy, safety, security),responsiveness and empathy, and social responsibility.
The conceptual modelEarlier in this paper, the general conceptualisation of service quality dimensions wasproposed as the general framework for quality dimensions in the service industries.Review of the literature on maritime transport services has also showed that identifiedattributes of selection decisions are represented within the quality dimensions of thisconceptual model. From this analysis and synthesis, it is consequently suggested that,based on the interpretive review of selection variables in the literature, quality ofmaritime transport services is a construct comprising six dimensions with associatedexplaining factors and illustrated in Table III. The dimensions are:

APJML20,4
502
Table II.Summary of literatureon service qualitydimensions in maritime-related transport
Au
thor
s
Ser
vic
eq
ual
ity
dim
ensi
ons
and
typ
ical
attr
ibu
tes/
fact
ors
Res
ourc
esO
utc
omes
Pro
cess
Man
agem
ent
Imag
e/re
pu
tati
onS
ocia
lre
spon
sib
ilit
y
Pea
rson
(198
0)–
Sp
eed
oftr
ansi
t–
Rel
iab
ilit
y–
Reg
ula
rity
–F
lex
ibil
ity
–F
irst
onth
eq
uay
–B
rook
s(1
985,
1990
)–
Tra
cin
gca
pab
ilit
y–
Sal
esre
pre
sen
tati
ve
–S
aili
ng
sfr
equ
ency
–T
ran
sit
tim
e–
Dir
ectn
ess
ofsa
ilin
g–
On
–ti
me
pic
k–
up
and
del
iver
y–
Cos
tof
serv
ice
–C
oop
erat
ion
bet
wee
np
erso
nn
el–
Car
rier
flex
ibil
ity
–R
epu
tati
onfo
rre
liab
ilit
y–
Los
tan
dd
amag
eex
per
ien
ce–
Info
rmat
ion
aln
atu
reof
adv
erti
sin
g–
Car
rier
app
rop
riat
enes
sS
lack
(198
5)–
Siz
eof
por
t–
Por
teq
uip
men
t–
Pro
xim
ity
ofp
ort
–P
ort
secu
rity
–P
ort
char
ges
––
Con
ges
tion
––
Mu
rph
yet
al.
(198
9,19
91,
1992
)
–L
arg
ean
d/o
rod
dsi
zed
frei
gh
t–L
arg
ev
olu
me
ship
men
t–S
pec
ial
han
dlin
g–E
qu
ipm
ent
avai
lab
ilit
y–S
hip
men
tin
form
atio
n
–L
oss
and
dam
age
–P
ick
–u
pan
dd
eliv
ery
–H
and
lin
gch
arg
e
–C
laim
han
dli
ng
––
Fra
nk
el(1
993)
–A
vai
lab
ilit
yof
cap
acit
y–
Car
go
flow
con
trol
and
trac
kin
g
–Ser
vic
ere
liab
ility
–Ser
vic
eti
me
and
del
iver
yti
me
–Car
go
safe
ty,s
ecu
rity
and
mai
nte
nan
ce–T
imel
ines
san
dac
cura
cy–C
ost
con
trol
,bill
ing
and
man
agem
ent
––
Ser
vic
est
atu
sco
ntr
olan
dp
roje
ctio
n–
Inte
rmod
alm
anag
emen
t
–
(con
tinued
)

Service qualityin maritime
transport
503
Table II.
Au
thor
s
Ser
vic
eq
ual
ity
dim
ensi
ons
and
typ
ical
attr
ibu
tes/
fact
ors
Res
ourc
esO
utc
omes
Pro
cess
Man
agem
ent
Imag
e/re
pu
tati
onS
ocia
lre
spon
sib
ilit
y
Lop
ezan
dP
oole
(199
8)–
–T
imel
ines
s–
Sec
uri
ty–
–E
ffic
ien
cy–
Du
rvas
ula
etal.
(199
9)–
Tan
gib
les
–R
elia
bil
ity
–R
esp
onsi
ven
ess
–A
ssu
ran
ce–
Em
pat
hy
––
Ton
gzo
n(2
002)
–A
deq
uat
ein
fras
tru
ctu
res
–L
ocat
ion
–F
req
uen
cyof
ship
vis
its
–C
omp
etit
ive
por
tch
arg
es–
Qu
ick
resp
onse
top
ort
use
rs’
nee
ds
–P
ort
effi
cien
cy–
Por
t’sre
pu
tati
onfo
rca
rgo
dam
age
Gra
tsos
(199
8),
Ru
iter
(199
9),
Eli
ades
(199
2)
––
Saf
ety
–R
elia
bil
ity
––
Eff
icie
ncy
––
Res
pon
sib
ilit
yb
ehav
iou
ran
dac
tiv
itie
sre
gar
din
gsa
fety
and
env
iron
men
tco
nce
rns
Ug
bom
aet
al.
(200
4)–
Tan
gib
les
–R
elia
bil
ity
–R
esp
onsi
ven
ess
–E
mp
ath
y–
Ass
ura
nce
––

APJML20,4
504
. Resources-related dimension: Equipment and facilities availability, Equipmentand facilities condition, Financial stability, Shipment tracing capability, Physicalinfrastructure
. Outcomes-related dimension: Speed of service performance, reliability of serviceperformance (timeliness of shipment pick-up and delivery), providing service ina consistent manner, shipment safety and security (loss and damage), reliabilityof documentation (error-free processes), competitive price of service;
. Process-related dimension: Staff’s attitude and behaviour in meeting customers’requirements (for example: changing customers’ needs), Quick response tocustomers’ inquiries, Knowledge of customers’ needs and requirements,Application of IT and EDI in customer service;
. Management-related dimension: Application of IT and EDI in operations,Efficiency in operations and management, Knowledge and skills of managementand operators, Understanding customers’ needs and requirements, Feedback fromcustomers, Continuous improvement of customer-oriented operation processes;
. Image/reputation-related dimension: Company’s reputation for reliability in themarket; and
. Social responsibility-related dimension: Socially responsible behaviour andconcerns for human safety, Environmentally safe operations.
Dimensions Factors Codes
Resources 1. Equipment and facilities availability SQ12. Equipment and facilities condition SQ23. Financial stability SQ34. Shipment tracing capability SQ45. Physical infrastructures SQ5
Outcomes 6. Speed of service performance SQ67. Reliability of service performance (timeliness
of shipment pick-up and delivery) SQ78. Providing service in a consistent manner SQ89. Shipment safety and security (loss and damage) SQ9
10. Reliability of documentation (error-free processes) SQ1011. Competitive price of service SQ11
Process 12. Staff’s attitude and behaviour in meetingcustomers’ requirements (e.g. changing customers’ needs) SQ12
13. Quick response to customers’ inquiries and requests SQ1314. Knowledge of customers’ needs and requirements SQ1415. Application of IT and EDI in customer service SQ15
Management 16. Application of IT and EDI in operations SQ1617. Efficiency in operations and management SQ1718. Knowledge and skills of management and operators SQ1819. Understanding customers’ needs and requirements SQ1920. Feedback from customers SQ2021. Continuous improvement of customer-oriented
operation processes SQ21Image 22. Company’s reputation for reliability in the market SQ22Social responsibility 23. Socially responsible behaviour and concerns for
human safety SQ2324. Environmentally safe operations SQ24
Table III.Service qualitydimension groups andfactors in maritimetransport
Service qualityin maritime
transport
505
Research methodologyResearch question and hypothesisThis study aims to examine the research question of how service quality in maritimetransport is described and measured. Discussions from the earlier sections have comeup with a service quality model of six dimensions and 24 factors. The researchhypothesis is thus formulated as follows:
H1. Quality of maritime transport service is a construct of 24 identified factorsassociated with six groups of resources, outcomes, process, management,image and social responsibility.
Methods of data collectionTriangulation is utilised in this study. Triangulation is strongly suggested intransportation and logistics research literature as an effective and useful technique toachieve the width and depth of research issues, as demonstrated in the study byCunningham et al. (2000). The type of triangulation technique employed in this paper isthe methodological triangulation, in which the author uses and combines quantitativeand qualitative methods to obtain a comprehensive understanding and a wide anddeep picture of the study. The methods of data collection and interpretation used in thisstudy are the survey method (by using mail questionnaires) followed by confirmatoryin-depth interviews.
Sampling designThe sampling frame for this research is constructed from the directory of shippingcompanies, port operators and freight forwarders/NVOCCs in Vietnam listed in theVisaba Times – Vietnam Shipping and Logistics Review. A list of 197 maritimetransport service-providing organisations, including 66 shipping companies, 49 portoperators and 82 freight forwarders/NVOCCs, is used as the mailing list for thisresearch. By the cut-off date, 120 questionnaires for the survey were returned, of which43 were from shipping companies, 36 from port operators and 41 from freightforwarders. This represents a 61 per cent response rate.
For the in-depth interviews, it was decided that the same population and samplingframe should be used as for the survey. The process of selecting the samples forinterviews was conducted carefully. First, the samples for interviews should be chosenonly from within the respondents to these surveys. Second, since the researchpopulation consists of three categories of service providers, it is important that thesample chosen for qualitative research also reflect the representativeness of thesecategories. Geographical representativeness of the sample also needs to be assured. Asthe shipping companies, port operators and freight forwarders/NVOCCs are located allover the north, central and southern regions of Vietnam, the sample selected for in-depth interviews should also cover organisations in all these three regions. With theseconsiderations in mind, 25 in-depth interviews were conducted during the study period.
Design of research instrumentsBoth fixed-alternative and open-ended response questions were utilised in thequestionnaire, preceded by a cover letter using the letterhead of the author’s institution.There are two questions in the questionnaire. In the first question, respondents wereasked to rate the perceived importance of the 24 items measuring service quality inmaritime transport on a 5-point category scale, starting from 1 as ‘‘not at all important’’

APJML20,4
506
to five as ‘‘very important’’. These items were randomly placed in the questionnaire soas to avoid the order bias. The second question is open-ended, encouraging respondentsto supplement and rate any other attributes of service quality in their business sectorswhich were not listed in the first question. The questionnaire was originally written inEnglish but later translated into Vietnamese. To ensure that the translation of theinstrument in the target language is equivalent to the original language in which theinstrument was developed, the process of translation of survey instruments wasconducted through the consecutive stages of forward translation (English to Vietnamese),pre-testing (for both English and Vietnamese versions), modified translation (withfeedback from instrument pre-testing), backward translation (modified Vietnameseversion to English) and finalisation of Vietnamese version (based on comparison betweenbackward translated English version and the original one).
Since the in-depth interviews aimed at prospective interviewees holding managerialpositions, or ‘‘elites’’, formal questionnaire-based interviews are not appropriate;instead, interviewees are given a great deal of freedom in explaining their answers topre-determined topics. This means that the same topics, specifically in the form ofsome open-ended questions, were introduced in each interview but the sequence ofquestions asked changed over time from one interview to another, and the responses tothese questions were in different orders and presented in different ways in differentinterviews. Moreover, some additional questions beyond the preliminary ones in orderto follow-up and probe the interviewee’s answers were also asked depending on thespecific context in each interview.
Administering mail survey and conducting in-depth interviewsThe questionnaire was pre-tested with a group of 10 organisations selected based onthe author’s judgement. Once this was completed and all feedback was incorporated torevise the questionnaire, the Vietnamese version of the questionnaire was put inenvelopes, together with the cover letter and self-addressed envelopes for returning theanswers. A range of various tactics were employed to increase the response rate, suchas using the cover letter from the author’s institution, carefully phrasing the title of thequestionnaire, applying personalisation and anonymity rule, etc.
Prior to the interviews, a list of prospective interviewees in various organisationswas worked out, and each of these interviewees was contacted by telephone invitingtheir participation in the interviews. The list of prospective questions was alsoforwarded to those who agreed to participate in the interviews. The interviews wereconducted on a one-to-one basis between the author and the interviewee, and variedapproximately from 55 min to 1 h and 15 Min. A tape recorder was used to record thewhole interview with the prior consent of the interviewees.
Findings and discussionMeasurement scale reliability analysisIn this study, the statistical norm concerning the internal consistency adopted is above�2.0, and the accepted value level of reliability (Chronbach’s alpha value) is above 0.60for the scale. Table IV shows the item-total correlation analysis and Chronbach’s alphavalue of the scale measuring perceptions of 24 service quality factors. The overallalpha value for the questionnaire is 0.7883, which indicates that the survey instrumentis reliable.
Since the statistical norm concerning the internal consistency adopted in this studyis above �2.0, it is noted that there is a variable, SQ11 (competitive price of service),

Service qualityin maritime
transport
507
which shows a very low and even negative correlation with the sum of all othervariables (�0.1941). Correspondingly, the alpha value would increase from 0.7883 to0.8266 and become even more reliable if this variable were deleted from the scale. Thenegative value of the correlation in the case of this variable could be interpreted asthere could be a relative number of responses positioned on the negative side of thescale, e.g. expressing that price is not important as an attribute of quality service, orservice quality could be enhanced without implying higher price. This will be furtherelaborated in the later sections accordingly.
Perceptions of the proposed service quality factorsTable V shows the descriptive statistics data regarding perceptions of respondents inthe survey of 24 factors of service quality in maritime transport. A test of significanceusing Z test (Zikmund, 2003) was also conducted to test the hypothesis.
As can be seen from Table V, the null hypothesis for all factors is rejected (since zobservation values are all greater than z statistics values at 95 per cent confidencelevel), which means the alternative hypothesis is supported. This is also true at99 per cent confidence level (z statistics is 2.57). All 24 factors have their mean scoresabove the midpoint of the scale, thus indicating that all of them are perceived asattributes of service quality in maritime transport. In this respect, the lowest meanscore is 3.68 for the shipment tracing capability factor, but this is also very close to the‘‘important’’ perceptions. This finding is quite consistent with the literature as thisfactor is also not highly ranked as a selection criteria in various earlier studies, such as
Table IV.Reliability analysis of
scale measuring servicequality factors
Alpha¼ 0.7883Service qualityfactors
Scale meanif item deleted
Scale varianceif item deleted
Corrected item-total correlation
Alpha ifitem deleted
SQ11 97.1500 36.9017 �0.1941 0.8266SQ3 97.2583 33.6218 0.2334 0.7858SQ8 97.2333 32.6006 0.2696 0.7855SQ18 96.6250 33.7658 0.2568 0.7843SQ10 96.8667 33.5787 0.2652 0.7840SQ9 96.7750 33.5540 0.2898 0.7829SQ1 96.9167 33.2199 0.3023 0.7822SQ4 97.5333 33.1249 0.3031 0.7822SQ20 96.8333 32.9636 0.3359 0.7805SQ14 96.6083 33.2151 0.3416 0.7804SQ5 97.3417 33.2184 0.3510 0.7801SQ19 96.7000 32.9681 0.3610 0.7794SQ6 97.0500 33.2076 0.3881 0.7788SQ13 96.6500 32.7168 0.3922 0.7777SQ7 96.9833 33.0417 0.4122 0.7777SQ2 97.1000 32.5277 0.3916 0.7775SQ21 96.7000 32.6992 0.4052 0.7772SQ17 96.6250 32.6397 0.4375 0.7759SQ16 97.3417 32.5461 0.4526 0.7751SQ12 96.6083 32.4083 0.4488 0.7749SQ22 96.8417 32.2016 0.4433 0.7747SQ15 97.3750 32.1355 0.4831 0.7730SQ23 97.4000 31.0487 0.4666 0.7720SQ24 97.4667 30.8728 0.4864 0.7706

APJML20,4
508
in Brooks (1985, 1990). The finding about the consensus of the survey’s respondents isalso echoed by the in-depth interviews’ informants. Specifically, in all 25 interviews,informants confirmed that all factors classified in the proposed groups are attributes ofservice quality in their business sectors, and service quality can not be achievedwithout them. While not yet taking into consideration the perceived importance of eachfactor, the interview informants also acknowledged that these groups of factors havereciprocal relationships with each other. The interview informants argue that theseproposed service quality factors are the necessary conditions to make customers happyand satisfied. It is the coordination of all the factors that build up the service quality inmaritime transport. A ship operator summarises this as follows:
. . . customer satisfaction means customers are satisfied with your service quality, forexample, not simply carrying a container from point A to point B, but also knowing howsmoothly and timely the containers are transported, how the documentation like Bill ofLading is processed and issued, how correct is the invoice, and customers can know wheretheir containers are whenever they want to, etc. This is the whole process.
The above confirmation of the new model of service quality in maritime transport inthis study implies several noteworthy new findings as compared to earlier similarresearch. Firstly, it is safe to say that it is one of just a few studies conducted so far inthe field of service quality in maritime transport, and subsequently tested a newservice quality model for this sector. Secondly, it confirms that service quality inmaritime transport is not a unidimensional construct but encompasses a group ofinterrelated dimensions and associated factors. These factors, although being referred
Table V.Perceptions of theproposed 24 servicequality factors
Service quality factor Mean SD Rank Z statistics (95% confidence) Z observation
SQ14 4.61 0.52 1 1.96 33.67SQ12 4.61 0.55 2 1.96 31.77SQ18 4.59 0.51 3 1.96 34.17SQ17 4.59 0.53 4 1.96 33.11SQ13 4.57 0.56 5 1.96 30.59SQ19 4.52 0.55 6 1.96 30.22SQ21 4.52 0.55 7 1.96 30.22SQ9 4.44 0.52 8 1.96 30.65SQ20 4.38 0.58 9 1.96 26.02SQ22 4.38 0.59 10 1.96 25.32SQ10 4.35 0.54 11 1.96 27.15SQ1 4.30 0.57 12 1.96 24.81SQ7 4.23 0.48 13 1.96 28.12SQ6 4.17 0.47 14 1.96 27.00SQ2 4.12 0.60 15 1.96 20.50SQ11 4.07 0.99 16 1.96 11.86SQ8 3.98 0.77 17 1.96 14.05SQ3 3.96 0.59 18 1.96 17.93SQ5 3.88 0.51 19 1.96 18.74SQ16 3.88 0.53 19 1.96 18.17SQ15 3.84 0.57 21 1.96 16.32SQ23 3.82 0.76 22 1.96 11.84SQ24 3.75 0.76 23 1.96 10.83SQ4 3.68 0.59 24 1.96 12.61
Notes: relative ranking based on factors’ mean scores; 1¼ not at all important, 5¼ very important
Service qualityin maritime
transport
509
to sparsely from one study to another study in the literature as selection criteria as canbe seen in Table II, have never been formally researched as quality factors of maritimetransport service. This study, therefore, is meaningful in introducing a synthesised toolto measure service quality in maritime transport sector. Thirdly, this study alsoemphasises the two-aspect perception of service quality in maritime transport:management quality is as important as satisfying customers by meeting and/orexceeding their requirements/expectations. Indeed, while most similar studies in theliterature base on customers’ perception of factors such as firms’ tangibles, reliability ofservice outcomes, etc. as key indicators of service quality, it is apparent from this studythat management-related factors, such as efficiency of service performance, areimportant indicators of service quality in maritime transport and should also beincorporated in firms’ service quality profile. Last but not least, this researchintroduces and confirms a new service quality dimension, social responsibility, whichis seldom referred to in both generic service quality and transport service qualityliterature. It has been evidenced in this study that social responsibility-related qualityfactors such as responsible behaviour and activities regarding safety andenvironmental concern are critical, which can enhance or damage the image orreputation of firms, and hence, the perceived quality of their service. Together withothers, social responsibility-related quality factors form up a complete service qualityprofile for maritime transport organizations.
When it comes to the perceived ranking of each service quality factor, knowledge ofcustomers’ needs and requirements, and staff’s attitude and behaviour in meetingcustomers’ requirements are ranked as the foremost and second most important factorsof service quality in maritime transport. Another factor which also focuses on the aspectof customer satisfaction is ranked the fifth most important factor (quick response tocustomers’ inquiries and requests). Respondents also rank another factor related to thecustomer-focused management aspect, understanding customers’ needs andrequirements, as the sixth most important attribute of service quality. Another factor inthis respect, continuous improvement of customer-oriented operation processes,interestingly, is ranked the seventh most important service quality factor. It is seen that,among proposed service quality factors, survey respondents highly appreciate thosefactors involving the process of service provision as well as the management factorswhich all focus on satisfying the customers. Staff of the service provider should not onlyhave a good knowledge of customers’ needs and requirements, but they also have toquickly respond to customers’ enquiries and requests, with a good attitude andbehaviour so as to make customers happy in dealing with them. These factors establishthe transaction interface between the service providers and their customers. As well ashaving the knowledge of customers’ needs and requirements, staff of the service providershould also understand well these needs and requirements. Moreover, they need to havegood knowledge and specialised skills in their areas of expertise, and continuouslyimprove the customer-oriented operation processes so as to achieve efficiency inoperations and management, thus contributing to good outcomes of service performanceand a quality transaction process with the customers. These later factors are related tothe management aspect of the service provider.
From another perspective, all these process and management-related service qualityfactors involve the centre of all quality systems: the human element. In broad terms,people are another resource of the organisation beyond the physical resources such asequipment and facilities. In the service industry where the product is not tangible as itis in the manufacturing sector, the involvement of the human element, here the staff of
APJML20,4
510
the service provider and its customers, in the transactions with customers as well as inoperation and management processes, plays a critical role in providing a perceivedquality service in the eye of the customer. It is strongly argued by the informants thatthe involvement of the human factor in the management would greatly affect otherservice quality factors, especially the effective utilisation of physical resources such asfacilities and equipment as well as the transactions interface between the company’sstaff and their customers in providing good service outcomes. A port operatorelaborated this as follows:
In fact, the process related factors such as staff behaviour and attitude are partly affected bythe management in the port. If you have good management, your staff will have positiveattitude and behaviour. So in fact management plays a very critical role in contributing toservice quality.
Shipment safety and security is ranked as the eighth most important service qualityfactor. It is proved that the respondents perceive it as a compulsory responsibility ofthe service providers to ensure shipment safety and security (cargo loss and damage)as an aspect of the outcomes of service quality, especially in maritime transport. Thisperception is also affirmed by the interview informants. In this respect, the issue ofshipment or cargo safety and security is often considered as an indicator of serviceperformance reliability. A port operator commented as follows:
. . . no matter how efficient your equipment and facilities are utilised and quick the serviceperformance is, customers will not feel happy and satisfied if the reliability of your serviceperformance is not assured, e.g. affected by many other factors in your operation andmanagement system. If the security system in your port is not good, for example, there may becargo theft and therefore this incurs lots of time for checking, examination, etc. Your customers,in this case both ship and cargo owners, will not be happy since your service is not reliable.
It is seen that service quality factors involving the process and management of serviceprovision, or greatly related to the human element, are highly rated in the top half ofthe ranking table in terms of their importance. However, factors related to thecompany’s physical resources and the outcomes of service performance are alsoappreciated. The importance of these factors varies from reliability of documentationranked eleventh to physical infrastructure ranked nineteenth. Factors relating to theoutcomes of service performance, such as reliability of service performance, speed ofservice performance, competitive price of service, and providing service in a consistentmanner also receive high mean scores respectively. Other factors involving thecompany’s resources such as equipment and facilities availability, equipment andfacilities condition and financial stability are also ranked with relative importance.These resources and outcomes-related service quality factors are pre-requisites for aquality service as well as the results of service performance which make the customerssatisfied and happy.
Although competitive price of service is perceived as an important service qualityfactor, the scale reliability analysis discussed in the earlier section proved that thisfactor is not sufficiently reliable to be included in the scale. Analyses from thedescriptive and frequency tables and the interviews elaborate this. In fact, responsesconsidering this factor as being not important account for 9.17 per cent of the total,while the other 17.5 per cent perceive it as a neutral factor only. Standard deviation ofthis factor is also the largest among the factors (0.99), indicating that there is big gapamong responses when compared with the average. This percentage of 9.17 per cent isalso the largest among the responses favouring the perception of seeing some factors,

Service qualityin maritime
transport
511
including competitive price of service, as unimportant in attributing to service quality.It is clear that there was a relatively large partition between respondents who viewcompetitive price of service as a service quality factor and those who perceive it as aseparate issue from service quality matters. In fact, this mixture of perceptions by thesurvey respondents is also reflected through the interviews with the informants. In theinterviews, most informants acknowledged that price of service has long been adecisive factor for customers when they select a maritime transport service provider.One freight forwarder indicates that this is the most important service quality factor.Another freight forwarder argues that some companies can provide a not-too-badservice with a very competitive price, and thus are accepted by many customers. Thephilosophy in this respect is that good service is not always attained at a higher price,as argued by a freight forwarder below:
. . . even now when we mention the service of DHL, it is about three time more expensive thanthe others, although other companies may provide the same service, getting parcels to thedestination safely, sometimes quicker than DHL, but their scope of operation is not that largeas DHL and they have not yet built up their image and brand name like DHL. In return, theprice of their service is just one-third of the one of DHL. . . Such companies operate on thebasis of efficiency, light administrative mechanism, take advantages of all resources in orderto provide the most competitive services, and their service quality is not that bad, at theaverage level, hence lots of customers accept them.
Some other informants argue that price of service should be separated from servicequality, as they are two different issues. In this respect, they argue that the formercannot be used as an indicator for the latter, but rather as a factor comparative withservice quality. Clearly, it can be seen from the above discussion that competitive priceof service does not rank as reliable to be considered a service quality factor. The largediversification in responses to this factor in different extremes of the measurementscale, both in the survey and interviews, suggests that the factor should be eliminatedfrom the scale so as to increase the measurement scale’s reliability. It is thusappropriate and reasonable to drop this factor from the proposed service qualityfactors.
Among the least important service quality factors as perceived by the surveyrespondents are the two factors relating to social responsibility, namely, sociallyresponsible behaviour and concerns for human safety, and environmentally safeoperations. They are ranked the 22nd and 23rd most important service quality factors.This perception about the two factors relating to the service provider’s socialresponsibility is clearly reflected in the in-depth interviews, where a relatively largenumber of informants do not consider them necessary attributes of the service qualityprofile at the time being although acknowledging that they are quite important. Someother informants, however, argue that social responsibility factors are important aspart of service quality performance. There are two arguments in this respect. Firstly,they acknowledge that these factors are currently receiving less emphasis than otherservice quality factors, but suggest that service providers must not discount them sincethey contribute to business sustainability. Some informants even argue that thesefactors will become a customer requirement in the long run as the general socio-economic situation of the country improves, and customers would then consider themas a part of the outcomes of service performance. Other informants further point outthat concerns about social responsibility factors are both necessary to comply withregulations, and critical to enhance the company’s image in customers’ eyes. In turn, a
APJML20,4
512
better image would have positive impacts on customers’ perceptions about thecompany’s service quality. A typical statement of a freight forwarder illustrates this.
I think this dimension is now becoming one of the most important factors. If you want to dobusiness in a sustainable manner, create stable jobs, and prolong your business, you ought toconcern about social responsibility, e.g. safety and environmental protection.
Other recommended service quality factorsRegarding some newly proposed service quality factors arising from the interviews, twomain themes developed from the discussion. Firstly, some informants argue that theservice provider’s ability to provide a variety of services following customers’requirements, any time and anywhere, also contributes to service quality. This is truefrom the perspective of the customer-based quality definition approach, since whetherthe service provider can satisfy whatever the customers want, at any time, anywhere,would greatly contribute to customer satisfaction, without yet taking into considerationthe issue of how these services are provided. These are outcomes of service provision aswell, as the service provider would utilise and effectively manage its resources to providevarious services as, when and where customers want them. These factors can in fact begrouped into one new factor entitled diversification and availability of service provisionin terms of time and place. This factor can be included in the group of outcomes ofservice performance. Secondly, many informants emphasise the service provider’scapability of handling situations such as incidents or crises. It is argued that in normalsituations service providers may seem to be comparative with each other, and only thosewho have good situational handing capability would prove themselves with good servicequality. This also includes the service provider’s willingness to cooperate with customersto solve problems when there is an incident, since such an attitude and behaviour wouldenhance the service provider’s good image in the customers’ eyes. Other informantshighlight that service quality does not stop when the service is actually provided, butalso includes the post-sale stage where customers may need the service provider tohandle any incidents that may arise with empathy and professionalism. A port operator’sstatement illustrates this.
. . . we need to go with customers to the end of the service performance process. In this respectI mean we have to be professional and helpful with customers to solve any incidenthappening during this process. If we just deliver the container to customers at the port’s out-going gate and wash our hands, we are not actually completing our service performance. Iwant to emphasise that the capability of handling the crisis when something occurs is veryimportant in service quality as well, since customers may look at that as the managementcapability of the service provider.
What was suggested in the interviews regarding the service provider’s capability ofincident handing is valid as one aspect of the service provider’s professionalism andcapability profile. While this factor has been actually mentioned in the author’sproposed factor framework (entitled knowledge and specialised skills of managementand operators), it is without further explanation about the capability of incidenthandling. It is therefore appropriate to reword this factor as knowledge and specialisedskills of management and operators including incident handling capability in order tocapture the essence of the new factor proposed by respondents and informants.
The revised model of service quality in maritime transport is thus presented inTable VI.
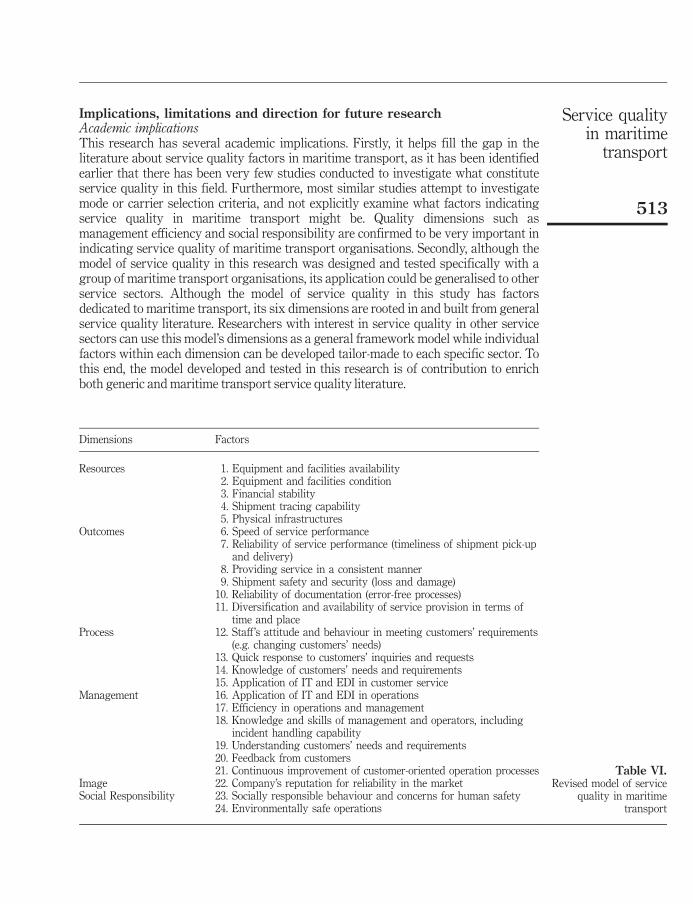
Service qualityin maritime
transport
513
Implications, limitations and direction for future researchAcademic implicationsThis research has several academic implications. Firstly, it helps fill the gap in theliterature about service quality factors in maritime transport, as it has been identifiedearlier that there has been very few studies conducted to investigate what constituteservice quality in this field. Furthermore, most similar studies attempt to investigatemode or carrier selection criteria, and not explicitly examine what factors indicatingservice quality in maritime transport might be. Quality dimensions such asmanagement efficiency and social responsibility are confirmed to be very important inindicating service quality of maritime transport organisations. Secondly, although themodel of service quality in this research was designed and tested specifically with agroup of maritime transport organisations, its application could be generalised to otherservice sectors. Although the model of service quality in this study has factorsdedicated to maritime transport, its six dimensions are rooted in and built from generalservice quality literature. Researchers with interest in service quality in other servicesectors can use this model’s dimensions as a general framework model while individualfactors within each dimension can be developed tailor-made to each specific sector. Tothis end, the model developed and tested in this research is of contribution to enrichboth generic and maritime transport service quality literature.
Table VI.Revised model of service
quality in maritimetransport
Dimensions Factors
Resources 1. Equipment and facilities availability2. Equipment and facilities condition3. Financial stability4. Shipment tracing capability5. Physical infrastructures
Outcomes 6. Speed of service performance7. Reliability of service performance (timeliness of shipment pick-up
and delivery)8. Providing service in a consistent manner9. Shipment safety and security (loss and damage)
10. Reliability of documentation (error-free processes)11. Diversification and availability of service provision in terms of
time and placeProcess 12. Staff’s attitude and behaviour in meeting customers’ requirements
(e.g. changing customers’ needs)13. Quick response to customers’ inquiries and requests14. Knowledge of customers’ needs and requirements15. Application of IT and EDI in customer service
Management 16. Application of IT and EDI in operations17. Efficiency in operations and management18. Knowledge and skills of management and operators, including
incident handling capability19. Understanding customers’ needs and requirements20. Feedback from customers21. Continuous improvement of customer-oriented operation processes
Image 22. Company’s reputation for reliability in the marketSocial Responsibility 23. Socially responsible behaviour and concerns for human safety
24. Environmentally safe operations

APJML20,4
514
Managerial implicationsThe managerial implications of this research are two-fold. Firstly, as it has never been auniversal approach to measuring service quality in maritime transport sector, thisresearch provides managers in maritime transport organisations a useful tool for thatpurpose. Managers can use the model designed and tested in this research to develop aresearch instrument, such as questionnaire, to survey their customers’ evaluation ofquality of service provided. On the one hand, this is of great meaning to maritimetransport service organisations, such as shipping and port companies, in gettingfeedback from their customers and thus facilitating their service improvement. On theother hand, the use of a universal research instrument to measure service quality bymaritime transport organisations would also greatly facilitate benchmarking acrossorganisations in the industry, as the same metrics is used. This, in turn, would enhancethe image of the industry as a whole. Secondly, the ranking of service quality factors inthis research, though is of reference only to managers as it has just been tested in asingle country, would provide insights to areas of service quality which should befocused upon. For example, care must be specially given to the process of serviceprovision where employees’ knowledge, professionalism, attitude and behaviour areimportant to enhance the firm’s service quality image. Service outcomes, such asreliability of service performance, safety and security, as well as social responsibilitybehaviour and activities also account for a critical part to indicate service quality inmaritime transport.
Limitations and direction for future researchThis research has a major limitation which needs to be acknowledged. As this is thefirst stage of a more comprehensive study, the service quality model developed in thisresearch was tested only with service providers – maritime transport organisations.Future research direction is desired, e.g. conducting the study using the sameinstruments on customers and compare the gaps with this research in order tostrengthen the validity and reliability of the dimensions and factors in the model.Nevertheless, this research lays the foundation for enhanced knowledge on servicequality in maritime transport by establishing service quality factors as initiallyperceived by service providers.
ConclusionThis paper reviews the concept of service quality and its dimensions in maritimetransport as a service industry, and specifically aims at devising and empiricallytesting a conceptual model of service quality in maritime transport. The literaturereview has shown that quality is not a universal concept, and that it incorporates manydimensions. Nevertheless, a synthesis from this review has led to a proposal of aservice quality model which consists of six dimensions: resources, outcomes, process,management, image and social responsibility (ROPMIS). This conceptual model ofservice quality is further explored in the context of maritime transport to elaborate thespecific service quality factors in this industry, consisting of six groups and 24 factors.Through analyses and discussions of empirical findings, it has been proved that theproposed model of six dimensions and 24 service quality factors are verified by bothsurvey respondents and interview informants, with one factor dropped from theoriginal scale while a new factor included and an existing factor modified. It isapparent from this research that quality factors related to the process of serviceprovision such as employees’ knowledge and behaviour in meeting customers’
Service qualityin maritime
transport
515
requirement, to management quality such as efficiency, and to service outcomes suchas reliability and safety/security profile are highly ranked. This indicates theimportance of human element in service quality systems and emphasises the need foremployee training and education as part of quality management and improvement. Inaddition, managers in maritime transport organisations can utilise the tool developedin this research to conduct survey of customer satisfaction of their service quality. Theuniversal use of such a tool across companies will also facilitate benchmarking andthus enhance image of the industry as a whole. While the service quality model in thisresearch provides some contribution to related literature and management practice,several future research directions must be pursued, such as conducting the study usingthe same instruments on customers and compare the gaps with this research, orconducting the study in another business context. These aim to enhance the validityand reliability of this research’s instruments and findings.
References
Aldlaigan, A.H. and Buttle, F.A. (2002), ‘‘SYSTRA-SQ: a new measure of bank service quality’’,International Journal of Service Industry, Vol. 13 No. 3-4, pp. 362-82.
Babakus, E. and Boller, G.W. (1992), ‘‘An empirical assessment of the SERVQUAL scale’’, Journalof Business Research, Vol. 24 No. 3, pp. 253-68.
Bengtson, S. (1992), ‘‘Safety and quality standards in shipping: the challenge of the 90s’’,Proceedings of Quality of Shipping in the Year 2000 International Conference, Cyprus.
Botterill, G. (1995), ‘‘Quality management in shipping’’, Quality World, Vol. 21 No. 12, pp. 856-60.
Brady, M.K. and Cronin, J.J. (2001), ‘‘Some new thoughts on conceptualizing perceived servicequality: a hierarchical approach’’, Journal of Marketing, Vol. 65 No. 3, pp. 34-50.
Brooks, M.R. (1985), ‘‘An alternative theoretical approach to the evaluation of liner shipping. PartII: choice criteria’’, Maritime Policy and Management, Vol. 12 No. 2, pp. 145-55.
Brooks, M.R. (1990), ‘‘Ocean carrier selection criteria in a new environment’’, Logistics andTransport Review, Vol. 26 No. 4, pp. 339-55.
Brown, M.B. (1988), ‘‘Defining quality in service businesses’’, Quality, Vol. 27 No. 1, pp. 56-8.
Buttle, F. (1996), ‘‘SERVQUAL: review, critique, research agenda’’, Journal of Marketing, Vol. 30No. 1, pp. 8-32.
Cotham, J.C., Cravens, D.W. and Hendon, W.M. (1969), ‘‘Measuring the quality of transportservices’’, Transport Journal, Vol. 9, pp. 27-32.
Cronin, J.J. and Taylor, S.A. (1992), ‘‘Measuring service quality: a reexamination and extension’’,Journal of Marketing, Vol. 56, No. 3 pp. 55-68.
Cunningham, L., Young, C. and Lee, M. (2000), ‘‘Methodological triangulation in measuring publictransportation service quality’’, Transportation Journal, Fall, pp. 35-47.
Durvasula, S., Lysonski, S. and Mehta, S.C. (1999), ‘‘Testing the SERVQUAL scale in the businesssector: The case of ocean freight shipping service’’, The Journal of Services Marketing,Vol. 13 No. 2, pp. 132-52.
Ecoports (2004), available at: www.ecoports.com/
Eliades, M.G. (1992), ‘‘The contribution of international open registries towards the developmentof a quality shipping industry – the challenge ahead’’, Proceedings of Quality of Shipping inthe Year 2000 International Conference, The Institute of Marine Engineers, Cyprus.
Fowdar, R. (2005), ‘‘Identifying health care quality attributes’’, Journal of Health and HumanServices Administration, Vol. 27 No. 3-4, pp. 428-44.

APJML20,4
516
Frankel, E.G. (1993), ‘‘Total quality management in liner shipping’’, Marine Policy, Vol. 17 No. 1,pp. 58-63.
Genestre, A. and Herbig, P. (1996), ‘‘Service expectations and perceptions revisited: addingproduct quality to SERVQUAL’’, Journal of Marketing Theory and Practice, Vol. 4 No. 4,pp. 72-82.
Gratsos, G.A. (1998), ‘‘Quality shipping: myth or reality?’’, in Haralambides, H.E. (Ed.), QualityShipping: Market Mechanism for Safer Shipping and Cleaner Oceans, Erasmus Publishing,Rotterdam.
Green Award (2004), available at: www.greenaward.org/home.htm
Gronroos, C. (1978), ‘‘A service oriented approach to marketing of service’’, European Journal ofMarketing, Vol. 12 No. 8, pp. 588-96.
Gronroos, C. (1982), ‘‘Strategic management and marketing in the service sector’’, Swedish Schoolof Economics and Business Administration, Helsinki.
Gronroos, C. (1983), Strategic Management and Marketing in the Service Sector, MarketingScience Institute, Cambridge.
Gronroos, C. (1984), Strategic Management and Marketing in the Service Sector, Chartwell-Bratt,Bromley.
Gronroos, C. (1988), ‘‘The six criteria of good perceived quality service’’, Review of Business, Vol. 9No. 3, pp. 10-13.
Gronroos, C. (2001), ‘‘The perceived service quality concept-A mistake?’’, Managing ServiceQuality, Vol. 11 No. 3, pp. 150-52.
Harte, H.G. and Dale, B.G. (1995), ‘‘Improving quality in professional service organisations: areview of the key issues’’, Managing Service Quality, Vol. 5 No. 3, pp. 34-44.
Hawkins, J. (2001), ‘‘Quality shipping in the Asia Pacific Region’’, International Journal ofMaritime Economics, Vol. 3 No. 1, pp. 79-101.
Haywood-Farmer, J. (1988), ‘‘A conceptual model of service quality’’, International Journal ofOperations and Production Management, Vol. 8 No. 6, pp. 19-29.
Imrie, B.C., Durden, G. and Cadogan, J.W. (2000), ‘‘Towards a conceptualisation of service qualityin the global market arena’’, Asia Pacific Research Institute, available at: http://apri.ac.nz/aimfinal.html
Imrie, B.C., Durden, G., Cadogan, J.W. and Mcnaughton, R. (2002), ‘‘The service quality constructon a global stage’’, Managing Service Quality, Vol. 12 No. 1, pp. 10-9.
Jun, M., Yang, Z. and Kim, D. (2004), ‘‘Customers’ perceptions of online retailing service qualityand their satisfaction’’, The International Journal of Quality and Reliability Management,Vol. 21 No. 8, pp. 817-37.
Johnston, R. (1995), ‘‘The determinants of service quality: satisfiers and dissatisfiers’’,International Journal of Service Industry, Vol. 6 No. 5, pp. 53-71.
Kang, G.-D. and James, J. (2004), ‘‘Service quality dimensions: an examination of Gronroos’sservice quality model’’, Managing Service Quality, Vol. 14 No. 4, pp. 266-80.
LeBlanc, G. and Nguyen, N. (1988), ‘‘Customers’ perceptions of service quality in financialinstitutions’’, International Journal of Bank Marketing, Vol. 6 No. 4, pp. 7-18.
Lehtinen, U. and Lehtinen, J.R. (1982), ‘‘Service quality: a study of quality dimensions’’, workingpaper, Service Management Institute, Helsinki.
Lin, C.Y., Durden, G.R., Imrie, B.C. and Cadogan, J.W. (2000), ‘‘Towards the reconceptualisation ofservice quality in an Asian context: a confirmatory study’’, Proceedings of ANZMAC2000: Visionary Marketing for the 21st Century: Facing the Challenge, http://130.195.95.71:8081/www/ANZMAC2000/Cdsite/papers//Lin1.pdf
Service qualityin maritime
transport
517
Liu, C.-M. (2004), ‘‘The multidimensional and hierarchical structure of perceived quality andcustomer satisfaction’’, International Journal of Management, Vol. 22 No. 3, pp. 426-37.
Liu, C.-M. (2005), ‘‘The multidimensional and hierarchical structure of perceived quality andcustomer satisfaction’’, International Journal of Management, Vol. 22 No. 3, pp. 426-37.
Llosa, S., Chandon, J. and Orsingher, C. (1998), ‘‘An empirical study of SERVQUAL’sdimensionality’’, Service Industries Journal, Vol. 18 No. 2, pp. 16-44.
Lopez, R.C. and Poole, N. (1998), ‘‘Quality assurance in the maritime port logistics chain: the caseof Valencia, Spain’’, Supply Chain Management, Vol. 3 No. 1, pp. 33-49.
Malhotra, N.K., Naresh, K., Ulgado, F.M., Agarwal, J. and Baalbaki, I.B. (1994), ‘‘Internationalservice marketing: a comparative evaluation’’, International Marketing Review, Vol. 11No. 2, pp. 5-15.
Maritime and Port Authority of Singapore (2000), Quality Shipping Seminar, 2000: A GlobalPerspective, 24-25 March.
Mels, G., Boshoff, C. and Nel, D. (1997), ‘‘The dimensions of service quality: the original Europeanperspective revisited’’, Service Industries Journal, Vol. 17 No. 1, pp. 173-89.
Murphy, P.R., Dalenberg, D.R. and Daley, J.M. (1989), ‘‘Assessing international port operations’’,International Journal of Physical Distribution and Materials Management, Vol. 19 No. 9,pp. 3-10.
Murphy, P.R., Dalenberg, D.R. and Daley, J.M. (1991), ‘‘Selecting links and nodes in internationaltransport’’, Transport Journal, Vol. 31 No. 2, pp. 33-40.
Murphy, P.R., Dalenberg, D.R. and Daley, J.M. (1992), ‘‘Port selection criteria: an application of atransport research framework’’, Logistics and Transport Review, Vol. 28 No. 3, pp. 237-55.
Ovretveit, J. (1993), Measuring Service Quality: Practical Guidelines, Technical communicationsPublications, Ayelsbury.
Parasuraman, A., Zeithaml, V.A. and Berry, L.L. (1985), ‘‘A conceptual model of service qualityand its implications for future research’’, Journal of Marketing, Vol. 49 No. 4, pp. 41-50.
Parasuraman, A., Zeithaml, V.A. and Berry, L.L. (1988), ‘‘SERVQUAL: a multiple item scale formeasuring consumer perceptions of service quality’’, Journal of Retailing, Vol. 64 No. 1,pp. 12-40.
Pearson, R. (1980), ‘‘Containerline performance and service quality’’, Marine Transport Centre,University of Liverpool, Liverpool.
Ruiter, W.D. (1999), ‘‘Towards quality shipping’’, Proceedings of the Shipping in the NewMillennium Conference, Brisbane, 17-19 March.
Santos, J. (2003), ‘‘E-service quality: a model of virtual service quality dimensions’’, Managingservice quality, Vol. 13 No. 3, pp. 233-47.
Sasser, W.E., Olsen, R.P. and Wyckoff, D.D. (1978), Management of Service Operations: Texts,Cases and Readings, Allyn and Bacon, Boston, MA.
Slack, B. (1985), ‘‘Containerisation, inter-port competition and port selection’’, Maritime Policyand Management, Vol. 12 No. 4, pp. 293-303.
Srikatanyoo, N. and Gnoth, J. (2005), ‘‘Quality dimensions in international tertiary education: a Thaiprospective students’ perspective’’, Quality Management Journal, Vol. 12 No. 1, pp. 30-41.
Sureshchandar, G.S., Rajendran, C. and Anantharaman, R.N. (2002), ‘‘Determinants of customer-perceived service quality: a confirmatory factor analysis approach’’, Journal of ServicesMarketing, Vol. 16 No. 1, pp. 9-32.
Tongzon, J. (2002), ‘‘Port choice determinants in a competitive environment’’, Proceedings of theannual IAME Conference, Panama.

APJML20,4
518
Ugboma, C., Ibe, C. and Ogwude, I.C. (2004), ‘‘Service quality measurements in ports of adeveloping economy: Nigerian ports survey’’, Managing Service Quality, Vol. 14 No. 6,pp. 487-97.
White, L. and Galbraith, M. (2000), ‘‘Customer determinants of perceived service quality in abusiness to business context: a study within the health services industry’’, available at:http://130.195.95.71:8081/www/ANZMAC2000/CDsite/papers/w/White1.PDF
Yang, Z., Jun, M. and Peterson, R.T. (2004), ‘‘Measuring customer perceived online service quality:scale development and managerial implication’’, International Journal of Operations andProduction Management, Vol. 24 No. 11/12, pp. 1149-69.
Further reading
Zikmund, W. (2003), Business Research Methods, 7th ed., Thomson Learning/South-WesternPublishers, Cincinatti, OH.
Corresponding authorVinh V. Thai can be contacted at: [email protected]
To purchase reprints of this article please e-mail: [email protected] visit our web site for further details: www.emeraldinsight.com/reprints