Review of Maritime Transport 2012
196
OF MARITIME OF MARITIME TRANSPOR TRANSPORT T 2012 UNITED NA UNITED NA TIONS CONFERENCE ON TRADE AND DEVELOPMENT TIONS CONFERENCE ON TRADE AND DEVELOPMENT
-
Upload
khangminh22 -
Category
Documents
-
view
9 -
download
0
Transcript of Review of Maritime Transport 2012
OF MARITIMEOF MARITIMETRANSPORTRANSPORTT
2012
U N I T E D N AU N I T E D N AT I O N S C O N F E R E N C E O N T R A D E A N D D E V E L O P M E N TT I O N S C O N F E R E N C E O N T R A D E A N D D E V E L O P M E N T
OF MARITIMETRANSPORT
2012
U N I T E D N AU N I T E D N AT I O N S C O N F E R E N C E O N T R A D E A N D D E V E L O P M E N TT I O N S C O N F E R E N C E O N T R A D E A N D D E V E L O P M E N T
New York and Geneva, 2012
REVIEW OF MARITIME TRANSPORT 2012ii
NOTE
The Review of Maritime Transport is a recurrent publication prepared by the UNCTAD secretariat since 1968 with the aim of fostering the transparency of maritime markets and analysing relevant developments. Any factual or editorial corrections that may prove
*
* *
reference to a United Nations document.
*
* *
The designations employed and the presentation of the material in this publication do not imply the expression of any opinion whatsoever on the part of the Secretariat of the United Nations concerning the legal status of any country, territory, city or area, or of its authorities, or concerning the delimitation of its frontiers or boundaries.
*
* *
following address: Palais des Nations, CH-1211 Geneva 10, Switzerland.
UNCTAD/RMT/2012
UNITED NATIONS PUBLICATION
Sales no. E.12.II.D.17
ISBN 978-92-1-112860-4
e-ISBN 978-92-1-055950-8
ISSN 0566-7682
iii
ACKNOWLEDGEMENTS
The Review of Maritime Transport 2012 was prepared by the Trade Logistics Branch of the Division on Technology and Logistics, UNCTAD, under the coordination of Jan Hoffmann with administrative support by Florence Hudry, the supervision of José María
Jan Hoffmann, Azhar Jaimurzina, Anila Premti, Vincent Valentine and Frida Youssef.
This publication was externally reviewed by the following persons:
In addition, the publication was internally reviewed in full by Vladislav Chouvalov.
ACKNOWLEDGEMENTS
REVIEW OF MARITIME TRANSPORT 2012iv
TABLE OF CONTENTS
Note ..................................................................................................................................................................................ii
Acknowledgements ...........................................................................................................................................................iii
Abbreviations .................................................................................................................................................................. viii
Explanatory notes..............................................................................................................................................................xi
Vessel groupings used in the Review of Maritime Transport ................................................................................................ xii
Foreword ........................................................................................................................................................................ xiii
Executive summary ......................................................................................................................................................... xiv
1. DEVELOPMENTS IN INTERNTIONAL SEABORNE TRADE ............................................1
A. World economic situation and prospects ..................................................................................................... 2
B. World seaborne trade.................................................................................................................................. 5
C. Selected emerging trends affecting international shipping ........................................................................... 22
2. STRUCTURE, OWNERSHIP AND REGISTRATION OF THE WORLD FLEET ....................33
........................................................................................................................ 34
................................................................................................. 40
C. Registration of ships ................................................................................................................................. 45
D. Shipbuilding, demolition and new orders .................................................................................................... 46
3. FREIGHT RATES AND MARITIME TRANSPORT COSTS .............................................57
A. Freight rates ............................................................................................................................................. 58
B. Freight markets and transport costs ........................................................................................................... 68
C. Policy options to reduce maritime transport costs ....................................................................................... 74
4. PORT DEVELOPMENTS ..........................................................................................79
A. Port throughput ........................................................................................................................................ 80
B. Recent port developments ......................................................................................................................... 85
C. Port development outlook .......................................................................................................................... 87
5. LEGAL ISSUES AND REGULATORY DEVELOPMENTS ................................................95
A. Important developments in transport law .................................................................................................... 96
B. Regulatory developments relating to the reduction of greenhouse gas emissions from international shipping and
other environmental issues ............................................................................................................................................ 96
C. Other legal and regulatory developments affecting transportation...........................................................................105
D. Status of conventions .............................................................................................................................. 110
E. Trade facilitation in international agreements ............................................................................................ 112
6. SUSTAINABLE FREIGHT TRANSPORT DEVELOPMENT AND FINANCE .....................125
A. Introduction ............................................................................................................................................ 126
B. Transport sector energy use and emissions .............................................................................................. 127
C. Recent developments in sustainable freight transport................................................................................ 129
........................................................ 135
E. Summarizing the points .......................................................................................................................... 139
vTABLE OF CONTENTS
Annexes
I. World seaborne trade by country group (Millions of tons) ........................................................................... 146
as at 1 January 2012 (Thousands of GT) ................................................................................................. 150
groups of economies and types of ship,
as at January 2012 (Thousands of dwt) ................................................................................................... 155
groups of economies and types of ship,
as at 1 January 2012 (Number of ships) .................................................................................................. 160
................................... 165
......................................................................................................................... 169
V. UNCTAD Liner Shipping Connectivity Index (ordered by rank at 2012) ........................................................ 173
LIST OF TABLES, FIGURES AND BOXES
Tables
1.1. World economic growth, 1991–2012 .......................................................................................................... 3
1.2 Growth in the volume of merchandise trade, by country groups and geographical region, 2008–2011 ............. 5
1.3. Development in international seaborne trade, selected years ......................................................................... 6
1.4. World seaborne trade in 2006–2011, by type of cargo, country group and region .......................................... 7
.................................................................12
........................................................................................ 13
1.6 Major producers and consumers of oil and natural gas, 2011...................................................................... 15
1.7. Major dry bulks and steel: main producers, users, exporters and importers, 2011......................................... 17
...................... 21
....................................................................................... 35
.................................................................................... 36
....................................... 37
.................................... 41
2.5. Countries/territories of ownership, by main vessel types.............................................................................. 42
2.6. The 20 leading service operators of container ships, 1 January 2012 .......................................................... 43
................................................. 44
(ranked by deadweight tonnage), as of 1 January 2012 .............................................................................. 44
2.8. Distribution of dwt capacity of vessel types, by country group of registration, 2012 ....................................... 46
2.9. Deliveries of newbuildings, major vessel types and countries where built...................................................... 49
2.10. Tonnage reported sold for demolition, major vessel types and country of demolition ...................................... 49
2.11. World tonnage on order, 2000–2011 ......................................................................................................... 52
........................................................................ 54
REVIEW OF MARITIME TRANSPORT 2012vi
2.13. Analysis of idle tonnage by main type of vessel, 2005–2011....................................................................... 54
3.1. Container ship time charter rates ............................................................................................................... 60
3.2. Daily time charter rates and tanker indices, 2011–2012............................................................................. 62
3.3. Tanker market summary: clean and dirty spot rates, 2011–2012 ................................................................ 63
..................................................................... 68
3.5. Baltic Exchange Dry Index, 2010–2012 ..................................................................................................... 70
.............................................................................................................. 72
3.7. Comparison of maritime transport segments .............................................................................................. 73
4.1. Container port throughput for 75 developing countries and economies in transition for years 2009,
2010 and 2011 (TEUs) ............................................................................................................................ 81
4.2. Top 20 container terminals and their throughput for 2009, 2010 and 2011 ................................................. 83
4.3. The relationship between vessel size and terminal type............................................................................... 91
........................ 104
MEPC.201(62)) which will enter into force on 1 January 2013 .................................................................. 104
6.1. Overview of nationally appropriate mitigation actions in freight transport (2011) ......................................... 133
Figures
1.1. The OECD Industrial Production Index and indices for world GDP, world merchandise trade
and world seaborne trade (1975–2012) ....................................................................................................... 2
1.2. International seaborne trade, by cargo type, selected years ........................................................................... 9
1.3 (a). World seaborne trade, by country group, 2011............................................................................................. 9
1.3 (b). Participation of developing economies in world seaborne trade, selected years ............................................. 10
1.3 (c). World seaborne trade, by region, 2011 ...................................................................................................... 10
................................................................................ 12
..................................................... 13
1.5 (a). Global container trade, 1996–2013 ........................................................................................................... 20
1.5 (b). Global container trade, 1985–2012 ........................................................................................................... 20
...................... 21
.................................................................................... 34
2.2. Trends in deliveries of container ships ........................................................................................................ 36
................................................................................ 39
...................... 45
.......................................... 47
............................................................... 48
2.7. Major open registries and the countries of ownership, 2012........................................................................ 48
viiTABLE OF CONTENTS
2.8. Tonnage reported sold for demolition in 2011, by age................................................................................. 50
2.9. World tonnage on order, 2000–2011 ......................................................................................................... 51
3.1. New ConTex 2007–2012 .......................................................................................................................... 59
3.2. Growth of demand and supply in container shipping, 2000–2012 ............................................................... 59
.......... 61
3.4. Growth in liquids demand and supply until 2030 ........................................................................................ 65
3.5. Baltic Exchange Dry Index, 2010–2012 ..................................................................................................... 66
3.6. Daily earnings of bulker vessels, 2010–2012............................................................................................. 66
............................ 69
3.8. Freight cost as percentage of value of imports ............................................................................................ 74
3.9. Strategies to reduce maritime freight rates ................................................................................................. 76
........ 84
................... 84
6.1. World oil consumption, 1973 and 2010 ................................................................................................... 127
6.2. World CO2 emissions from fuel combustion by sector, 2009 ...................................................................... 128
6.3. Comparison of CO2 emissions in freight transport by mode of transport...................................................... 129
6.4. Number of projects and investment in projects by subsector, 1990–2011 .................................................. 136
................................................................................................................... 137
Boxes
5.1. The current status of the ISO 28000 series of standards ........................................................................... 109
5.2. Contracting States to selected international conventions on maritime transport, as at 19 September 2012 ......111
5.3. Individual measures currently included in the draft negotiating text ............................................................ 114
.................................................................... 138
6.2. The United Nations Green Climate Fund ................................................................................................... 139
REVIEW OF MARITIME TRANSPORT 2012viii
ABBREVIATIONS AND EXPLANATORY NOTES
ADB Asian Development Bank
AEO Authorized Economic Operator
AGF United Nations Secretary-General’s High-level Advisory Group on Climate Change Financing
APEC
APMT APM Terminals (A. P. Moller-Maersk Group)
APU auxiliary power unit
BIMCO Baltic and International Maritime Council
BP British Petroleum
BRIC Brazil, Russian Federation, India and China
BRICS Brazil, Russian Federation, India, China and South Africa
BWM International Convention for the Control and Management of Ships’ Ballast Water and Sediments
CAI-Asia Clean Air Initiative for Asian Cities
CBDR common but differentiated responsibilities and respective capabilities
CBP United States Customs and Border Protection
CDM clean development mechanism
CEFIC European Chemical Industry Council
CLC–IOPC Fund Civil Liability Convention–International Oil Pollution Compensation Fund
CNTIC China National Technical Import and Export Corporation
CO2
carbon dioxide
CSI United States Container Security Initiative
cSt centistokes
C–TPAT United States Customs–Trade Partnership Against Terrorism
DHS United States Department of Homeland Security
DIS Danish International Ship Register
DNV Det Norske Veritas
dwt deadweight ton
ECA Emission Control Areas
ECSA European Community Shipowners’ Associations
EEDI
EEOI
EPC Electronic Port Clearance
ESC European Shippers’ Council
EU European Union
EURIST European Institute for Sustainable Transport
FAL IMO Facilitation Committee
FDI foreign direct investment
FEU
FMC United States Federal Maritime Commission
G12 MEPC 2012 Guidelines on Design and Construction to Facilitate Sediment Control on Ships
GAO
GCF United Nations Green Climate Fund
GDP gross domestic product
GeSI Global eSustainability Initiative
GHG reenhouse gas
GHG-WG3 third intersessional meeting of the Working Group on GHG Emissions from Ships
GISIS Global Integrated Shipping Information System
ix
GT gross tonnage
HAROPA French port entity of the ports of Le Havre, Rouen and Paris
HNS hazardous and noxious substances
IAPH International Association of Ports and Harbours
ICC International Chamber of Commerce
ICS International Chamber of Shipping
ICT information and communications technology
IDB Inter-American Development Bank
IEA International Energy Agency
IFC International Finance Corporation
IMDG International Maritime Dangerous Goods
IMF International Monetary Fund
IMO International Maritime Organization
IMSBC International Maritime Solid Bulk Cargoes
IPCC Intergovernmental Panel on Climate Change
ISF International Shipping Federation
ISL Institute of Shipping Economics and Logistics
ISO International Organization for Standardization
ISO/PAS
ISPS International Ship and Port Facilities Security Code
ISO/TS
ITF International Transport Forum
ITS intelligent transport systems
LDC least developed country
LEZ low emission zone
LLMC Convention on Limitation of Liability for Maritime Claims
LNG
LPG
LSCI UNCTAD Liner Shipping Connectivity Index
MARPOL International Convention for the Prevention of Pollution from Ships
MBM market-based measure
MBM-EG Expert Group on Feasibility Study and Impact Assessment of Possible Market-based
Measures
MEB
MEPC Marine Environment Protection Committee
MRA Mutual Recognition Agreement/Arrangement
MSC IMO Maritime Safety Committee
NAFTA North American Free Trade Agreement
NAMA nationally appropriate mitigation action
NGTF WTO Negotiating Group on Trade Facilitation
NII Non- Intrusive Inspection
NIS Norwegian International Ship Register
NOx nitrogen oxide
ABBREVIATIONS
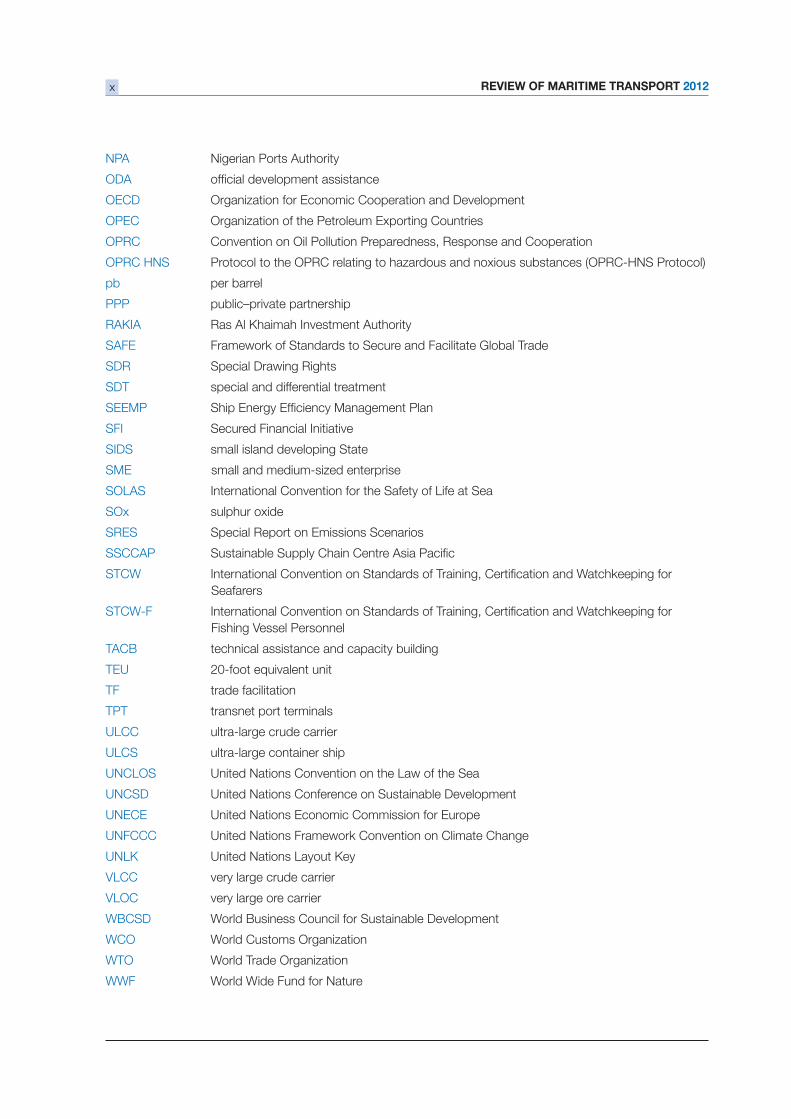
REVIEW OF MARITIME TRANSPORT 2012x
NPA Nigerian Ports Authority
ODA
OECD Organization for Economic Cooperation and Development
OPEC Organization of the Petroleum Exporting Countries
OPRC Convention on Oil Pollution Preparedness, Response and Cooperation
OPRC HNS Protocol to the OPRC relating to hazardous and noxious substances (OPRC-HNS Protocol)
pb per barrel
PPP public–private partnership
RAKIA Ras Al Khaimah Investment Authority
SAFE Framework of Standards to Secure and Facilitate Global Trade
SDR Special Drawing Rights
SDT special and differential treatment
SEEMP
SFI Secured Financial Initiative
SIDS small island developing State
SME small and medium-sized enterprise
SOLAS International Convention for the Safety of Life at Sea
SOx sulphur oxide
SRES Special Report on Emissions Scenarios
SSCCAP
STCW
Seafarers
STCW-F
Fishing Vessel Personnel
TACB technical assistance and capacity building
TEU
TF trade facilitation
TPT transnet port terminals
ULCC ultra-large crude carrier
ULCS ultra-large container ship
UNCLOS United Nations Convention on the Law of the Sea
UNCSD United Nations Conference on Sustainable Development
UNECE United Nations Economic Commission for Europe
UNFCCC United Nations Framework Convention on Climate Change
UNLK United Nations Layout Key
VLCC very large crude carrier
VLOC very large ore carrier
WBCSD World Business Council for Sustainable Development
WCO World Customs Organization
WTO World Trade Organization
WWF World Wide Fund for Nature
xi
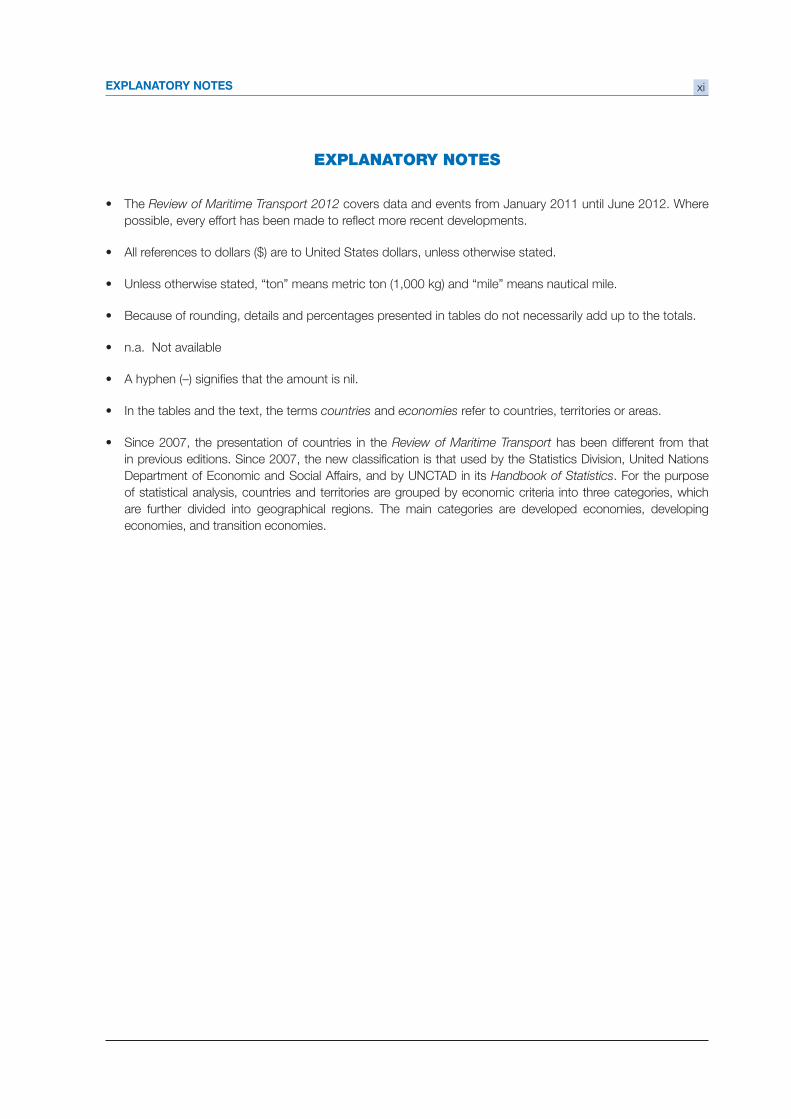
EXPLANATORY NOTES
The Review of Maritime Transport 2012 covers data and events from January 2011 until June 2012. Where
All references to dollars ($) are to United States dollars, unless otherwise stated.
Unless otherwise stated, “ton” means metric ton (1,000 kg) and “mile” means nautical mile.
Because of rounding, details and percentages presented in tables do not necessarily add up to the totals.
n.a. Not available
In the tables and the text, the terms countries and economies refer to countries, territories or areas.
Since 2007, the presentation of countries in the Review of Maritime Transport has been different from that
Department of Economic and Social Affairs, and by UNCTAD in its Handbook of Statistics. For the purpose
of statistical analysis, countries and territories are grouped by economic criteria into three categories, which
are further divided into geographical regions. The main categories are developed economies, developing
economies, and transition economies.
EXPLANATORY NOTES
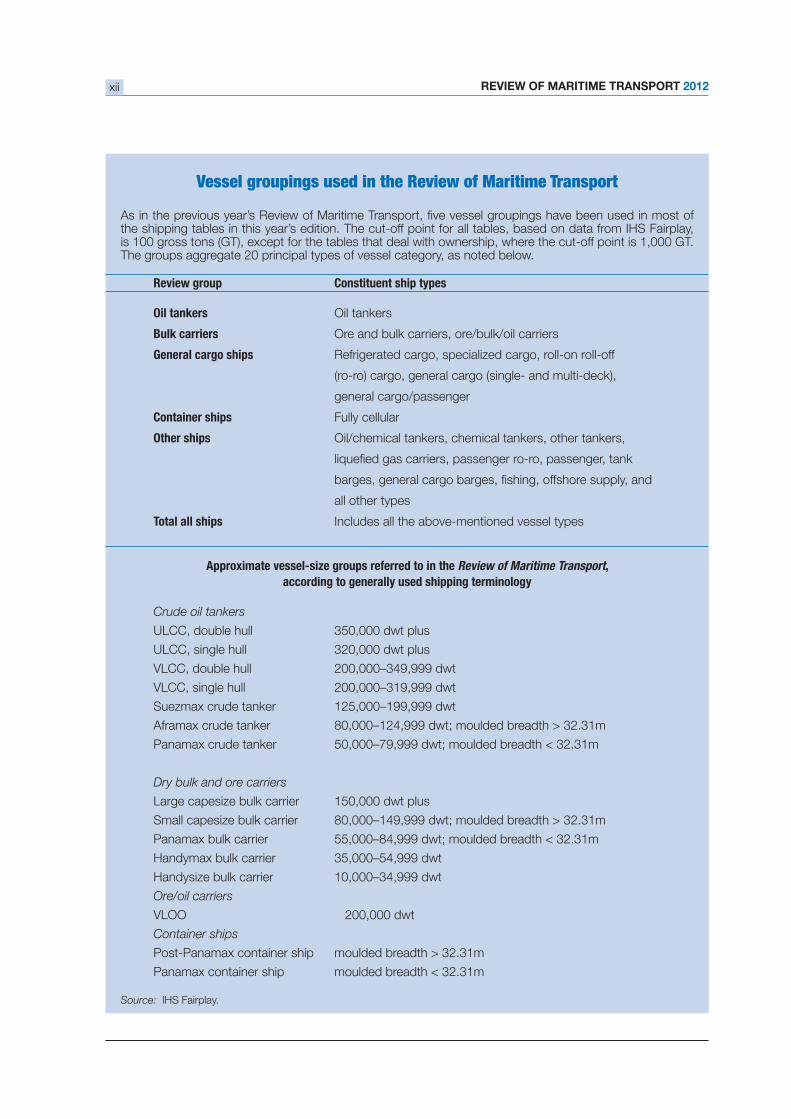
REVIEW OF MARITIME TRANSPORT 2012xii
Vessel groupings used in the Review of Maritime Transport
the shipping tables in this year’s edition. The cut-off point for all tables, based on data from IHS Fairplay,
Review group Constituent ship types
Oil tankers Oil tankers
Bulk carriers Ore and bulk carriers, ore/bulk/oil carriers
General cargo ships Refrigerated cargo, specialized cargo, roll-on roll-off
(ro-ro) cargo, general cargo (single- and multi-deck),
general cargo/passenger
Container ships Fully cellular
Other ships Oil/chemical tankers, chemical tankers, other tankers,
all other types
Total all ships Includes all the above-mentioned vessel types
Approximate vessel-size groups referred to in the Review of Maritime Transport,
according to generally used shipping terminology
Crude oil tankers
ULCC, double hull 350,000 dwt plus
ULCC, single hull 320,000 dwt plus
VLCC, double hull 200,000–349,999 dwt
VLCC, single hull 200,000–319,999 dwt
Suezmax crude tanker 125,000–199,999 dwt
Aframax crude tanker 80,000–124,999 dwt; moulded breadth > 32.31m
Panamax crude tanker 50,000–79,999 dwt; moulded breadth < 32.31m
Dry bulk and ore carriers
Large capesize bulk carrier 150,000 dwt plus
Small capesize bulk carrier 80,000–149,999 dwt; moulded breadth > 32.31m
Panamax bulk carrier 55,000–84,999 dwt; moulded breadth < 32.31m
Handymax bulk carrier 35,000–54,999 dwt
Handysize bulk carrier 10,000–34,999 dwt
Ore/oil carriers
VLOO 200,000 dwt
Container ships
Post-Panamax container ship moulded breadth > 32.31m
Panamax container ship moulded breadth < 32.31m
Source: IHS Fairplay.
xiii
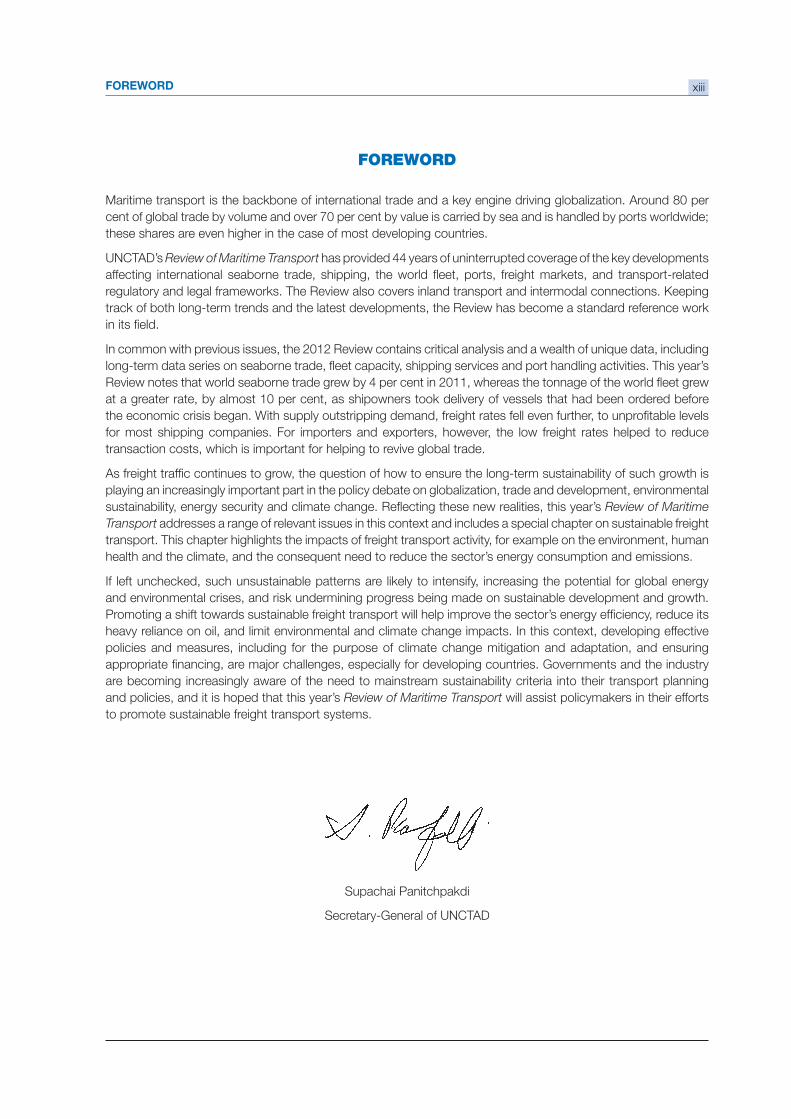
FOREWORD
Maritime transport is the backbone of international trade and a key engine driving globalization. Around 80 per
cent of global trade by volume and over 70 per cent by value is carried by sea and is handled by ports worldwide;
these shares are even higher in the case of most developing countries.
UNCTAD’s Review of Maritime Transport
regulatory and legal frameworks. The Review also covers inland transport and intermodal connections. Keeping
track of both long-term trends and the latest developments, the Review has become a standard reference work
at a greater rate, by almost 10 per cent, as shipowners took delivery of vessels that had been ordered before
for most shipping companies. For importers and exporters, however, the low freight rates helped to reduce
transaction costs, which is important for helping to revive global trade.
playing an increasingly important part in the policy debate on globalization, trade and development, environmental
Review of Maritime
Transport addresses a range of relevant issues in this context and includes a special chapter on sustainable freight
transport. This chapter highlights the impacts of freight transport activity, for example on the environment, human
If left unchecked, such unsustainable patterns are likely to intensify, increasing the potential for global energy
and environmental crises, and risk undermining progress being made on sustainable development and growth.
heavy reliance on oil, and limit environmental and climate change impacts. In this context, developing effective
policies and measures, including for the purpose of climate change mitigation and adaptation, and ensuring
are becoming increasingly aware of the need to mainstream sustainability criteria into their transport planning
and policies, and it is hoped that this year’s Review of Maritime Transport will assist policymakers in their efforts
to promote sustainable freight transport systems.
Supachai Panitchpakdi
Secretary-General of UNCTAD
FOREWORD
REVIEW OF MARITIME TRANSPORT 2012xiv
EXECUTIVE SUMMARY
In tandem with developments in the world economy
and global merchandise trade, international seaborne
shipments continued to grow in 2011, albeit at a
slower rate than in 2010. Fuelled by strong growth in
container and dry bulk trades, world seaborne trade
grew by 4 per cent in 2011, taking the total volume of
In addition to the sovereign debt crisis in Europe
a number of factors have weighed down on global
risks, political and social unrest in North Africa and
Western Asia, natural disasters in Japan and Thailand
which have disrupted regional and global supply
chains, rising oil prices and volatility, the impact of
the austerity measures introduced in many countries
and the fading of the stimulus effect of 2010, and
growing geopolitical tensions. Many of these factors
have remained relevant in 2012 and, depending on
how they evolve, may impact dramatically on the
global economic and trade outlook and international
seaborne trade.
four years
during 2011, reaching more than 1.5 billion deadweight
deliveries and a drastic downturn in new orders
following the economic crisis has led to a reduction
in the world order book by one third during the same
period. Still largely responding to orders placed prior
reluctant to cancel or postpone deliveries. China,
Japan and the Republic of Korea together built more
than 93 per cent of the tonnage delivered in 2011, thus
maintaining important employment in their shipyards.
The resulting oversupply of ships represents a serious
challenge for shipowners.
Developing countries continue to expand their
market share in different maritime sectors, including
shipbuilding, ownership, registration, operation,
scrapping and manning. Shipowners of one third
operators are from developing countries. Almost
cent of scrapping in 2011 took place in India, China,
Bangladesh and Pakistan.
for carriers
Freight rates in 2011 and at the beginning of 2012
Substantial freight-rate reductions were reported
cargo segments. Vessel oversupply continued to be
a driving factor behind reductions in freight rates. Ship
operators attempted to make savings through greater
economies of scale by investing in large capacity ships
in the tanker and dry bulk market segments.
Daily earnings of large Capesize vessels dropped
class for several months. While smaller vessels offer
vessels are constrained to navigate between the
world’s busiest trading centres that have seen both
a downturn in business and increased oversupply in
available tonnage.
The cost of transport expressed as a percentage of
the value of the goods imported continues to decrease
for developing countries in Asia and the Americas,
converging to that of developed nations.
Container port throughput increased
World container port throughput increased by an
This increase was less than the 14.5 per cent increase
of 2010 that sharply rebounded from the slump of
2009. Chinese mainland ports, utilized by many
manufacturers and a partial indicator of the global
demand for semi-manufactured and manufactured
goods, maintained their share of total world container
port throughput at 24.2 per cent.
xv
The UNCTAD Liner Shipping Connectivity Index (LSCI)
and its components showed a continuation in 2012 of
the trend towards larger ships deployed by a smaller
number of companies. Between 2011 and 2012, the
number of companies providing services per country
largest container ships increased by 11.5 per cent. Only
liner shipping connections; for the remaining country
Legal issues and regulatory
developments
Important issues include the recent adoption of
amendments to the 1996 Convention on Limitation
of Liability for Maritime Claims (1996 LLMC), as well
as a range of regulatory developments relating to
maritime and supply-chain security, maritime safety
and environmental issues. Among the regulatory
measures worth noting is a set of technical and
and reduce greenhouse gas (GHG) emissions from
international shipping that was adopted under the
auspices of the International Maritime Organization
(IMO) in July 2011 and is expected to enter into force
on 1 January 2013. To assist in the implementation
of these new mandatory measures, four sets of
guidelines were also adopted at IMO in March 2012.
Discussions on possible market-based measures for
the reduction of GHG emissions from international
shipping continued and remained controversial. In
respect of liability and compensation for ship-source
oil pollution, a new UNCTAD report provides an
overview of the international legal framework as well
as some guidance for national policymaking.
At the World Trade Organization (WTO), negotiations
continued on a future Trade Facilitation Agreement.
While negotiators advanced on the draft negotiating
text, it has been suggested that an agreement in trade
facilitation might be reached earlier than in other areas
of the Doha Development Round of negotiations.
Special focus: growing concerns
regarding sustainable freight transport
The importance of freight transport as a trade enabler,
an engine of growth and a driver of social development
is widely recognized. However, the associated
adverse impacts of freight transport activity on the
environment, human health and the climate are also
cause for concern.
Overall, transport consumes over 50 per cent of global
cent per year from 2008 to 2035 and to account for
fuel use. Energy demand of commercial transportation
— trucks, aeroplanes, ships and trains — will rise by
economic growth, particularly in developing countries.
At the same time, the transport sector accounts for
are related to freight transport. Nearly 25 per cent of
global energy-related carbon dioxide (CO2) emissions
are transport related and these are expected to
year) between 2005 and 2030.
If left unchecked, these unsustainable patterns are
likely to intensify and potentially result in global energy
and environmental crises, and undermine any progress
being made in world sustainable development and
growth. Sustainability imperatives in the freight
transport sector lead to the need to reduce the
sector’s energy consumption and emissions, including
GHGs and air pollutants. Governments and industry
have started to mainstream sustainability criteria into
their planning processes, policies, and programmes;
however, meeting effectively and in full the sector’s
EXECUTIVE SUMMARY

In tandem with the world economy and global merchandise trade, international seaborne shipments continued to grow in 2011, albeit at a slower rate than in 2010. Fuelled by
economies, a number of factors have weighed down on global growth. These include,
Africa and Western Asia, natural disasters in Japan and Thailand which have disrupted regional and global supply chains, rising oil prices and volatility, austerity measures, the fading of the stimulus effect of 2010, and geopolitical tensions in the Strait of Hormuz. Many of these factors remained relevant in 2012 and, depending on how they evolve, they could impact dramatically on the global economic and trade outlook.
This chapter covers developments from January 2011 to June 2012, and where possible up to October 2012. Section A reviews the overall performance of the global economy and world merchandise trade. Section B considers developments in world seaborne trade volumes and examines trends unfolding in the economic sectors and activities that generate demand for shipping services, including oil and gas, mining, agriculture and steel production. Section C highlights selected trends that are currently transforming the landscape of international shipping and seaborne trade, focusing mainly on climate
and the rising bunker fuel prices and operating costs.
DEVELOPMENTS IN INTERNATIONAL
SEABORNE TRADE
REVIEW OF MARITIME TRANSPORT 20122
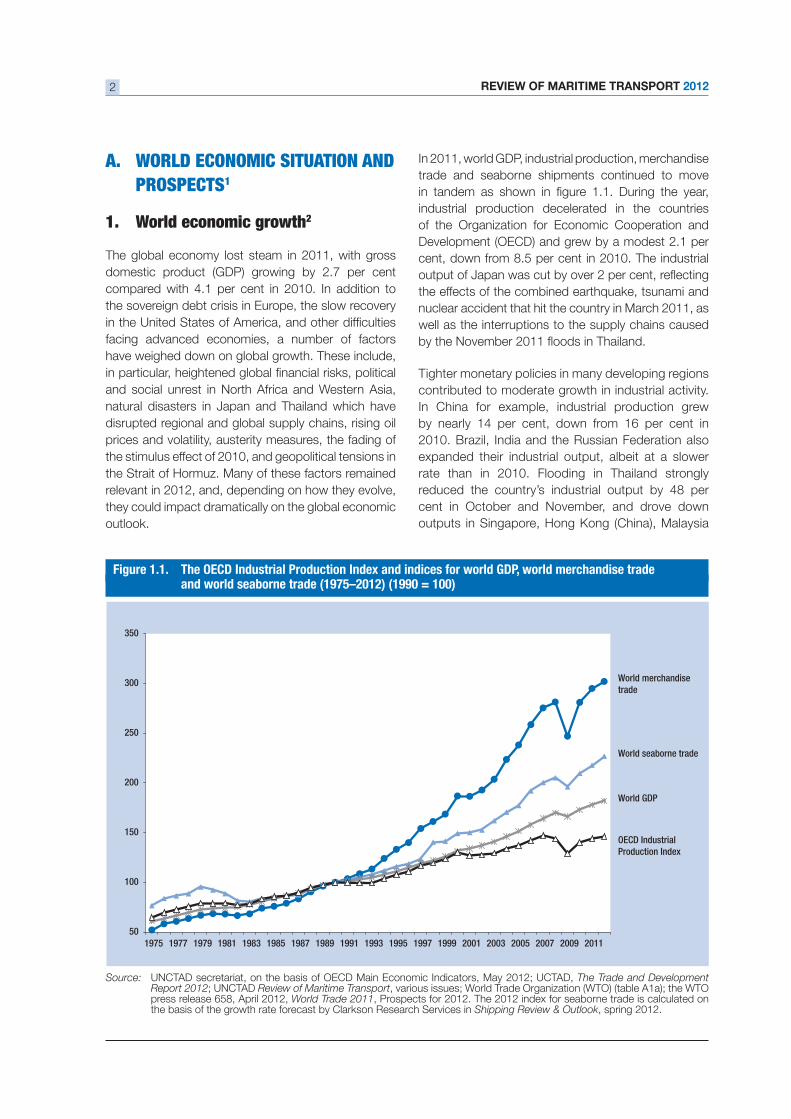
Source: UNCTAD secretariat, on the basis of OECD Main Economic Indicators, May 2012; UCTAD, The Trade and Development Report 2012; UNCTAD Review of Maritime Transportpress release 658, April 2012, World Trade 2011, Prospects for 2012. The 2012 index for seaborne trade is calculated on the basis of the growth rate forecast by Clarkson Research Services in Shipping Review & Outlook, spring 2012.
A. WORLD ECONOMIC SITUATION AND
PROSPECTS1
1. World economic growth2
The global economy lost steam in 2011, with gross
the sovereign debt crisis in Europe, the slow recovery
facing advanced economies, a number of factors
have weighed down on global growth. These include,
and social unrest in North Africa and Western Asia,
natural disasters in Japan and Thailand which have
disrupted regional and global supply chains, rising oil
prices and volatility, austerity measures, the fading of
the stimulus effect of 2010, and geopolitical tensions in
the Strait of Hormuz. Many of these factors remained
relevant in 2012, and, depending on how they evolve,
they could impact dramatically on the global economic
outlook.
In 2011, world GDP, industrial production, merchandise
trade and seaborne shipments continued to move
industrial production decelerated in the countries
of the Organization for Economic Cooperation and
nuclear accident that hit the country in March 2011, as
well as the interruptions to the supply chains caused
Tighter monetary policies in many developing regions
contributed to moderate growth in industrial activity.
In China for example, industrial production grew
2010. Brazil, India and the Russian Federation also
expanded their industrial output, albeit at a slower
rate than in 2010. Flooding in Thailand strongly
cent in October and November, and drove down
outputs in Singapore, Hong Kong (China), Malaysia
Figure 1.1. The OECD Industrial Production Index and indices for world GDP, world merchandise tradeand world seaborne trade (1975–2012) (1990 = 100)
World merchandise trade
World seaborne trade
World GDP
OECD Industrial Production Index
50
100
150
200
250
300
350
1975 1977 1979 1981 1983 1985 1987 1989 1991 1993 1995 1997 1999 2001 2003 2005 2007 2009 2011
CHAPTER 1: DEVELOPMENTS IN INTERNATIONAL SEABORNE TRADE 3
and Taiwan Province of China, due to the interrupted
supply chains.
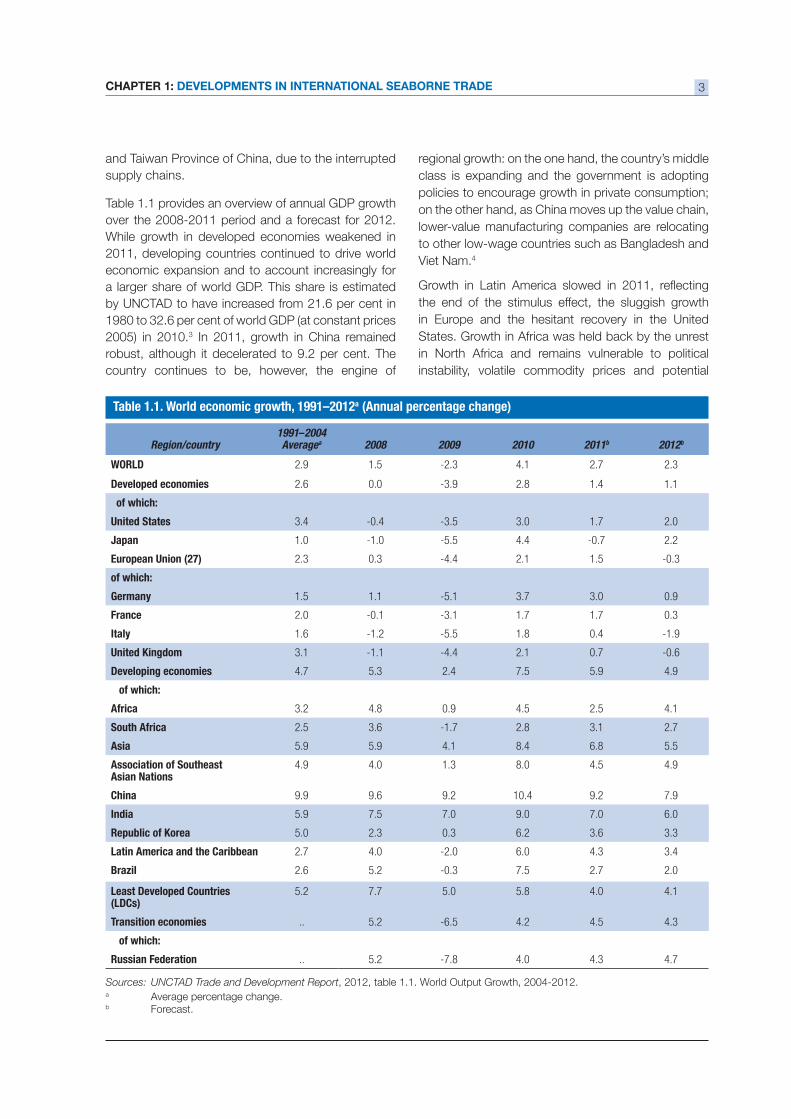
Table 1.1 provides an overview of annual GDP growth
over the 2008-2011 period and a forecast for 2012.
While growth in developed economies weakened in
2011, developing countries continued to drive world
economic expansion and to account increasingly for
a larger share of world GDP. This share is estimated
2005) in 2010.3 In 2011, growth in China remained
country continues to be, however, the engine of
regional growth: on the one hand, the country’s middle
class is expanding and the government is adopting
policies to encourage growth in private consumption;
on the other hand, as China moves up the value chain,
lower-value manufacturing companies are relocating
to other low-wage countries such as Bangladesh and
Viet Nam.4
the end of the stimulus effect, the sluggish growth
in Europe and the hesitant recovery in the United
States. Growth in Africa was held back by the unrest
in North Africa and remains vulnerable to political
instability, volatile commodity prices and potential
Table 1.1. World economic growth, 1991–2012a (Annual percentage change)
Sources: UNCTAD Trade and Development Reporta Average percentage change.b Forecast.
Region/country 1991–2004 Averagea 2008 2009 2010 2011b 2012b
WORLD 2.9 1.5 4.1 2.7 2.3
Developed economies 2.6 0.0 2.8 1.4 1.1
of which:
United States 3.4 3.0 1.7 2.0
Japan 1.0 4.4 2.2
European Union (27) 2.3 0.3 2.1 1.5
of which:
Germany 1.5 1.1 3.7 3.0 0.9
France 2.0 1.7 1.7 0.3
Italy 1.6 1.8 0.4
United Kingdom 3.1 2.1 0.7
Developing economies 4.7 5.3 2.4 7.5 5.9 4.9
of which:
Africa 3.2 4.8 0.9 4.5 2.5 4.1
South Africa 2.5 3.6 2.8 3.1 2.7
Asia 5.9 5.9 4.1 8.4 6.8 5.5
Association of SoutheastAsian Nations
4.9 4.0 1.3 8.0 4.5 4.9
China 9.9 9.6 9.2 10.4 9.2 7.9
India 5.9 7.5 7.0 9.0 7.0 6.0
Republic of Korea 5.0 2.3 0.3 6.2 3.6 3.3
Latin America and the Caribbean 2.7 4.0 6.0 4.3 3.4
Brazil 2.6 5.2 7.5 2.7 2.0
Least Developed Countries (LDCs)
5.2 7.7 5.0 5.8 4.0 4.1
Transition economies .. 5.2 4.2 4.5 4.3
of which:
Russian Federation .. 5.2 4.0 4.3 4.7
REVIEW OF MARITIME TRANSPORT 20124
droughts. Prospects for the region could, however,
improve given large new gas discoveries in Tanzania
and West Africa.5 As to the least developed countries
part a weaker global demand and a slowing Chinese
cent in 2011, with growth being sustained by higher
commodity prices, increased public infrastructure
spending and strong agricultural output.
World economic developments in 2011 highlighted
the continued strong interdependence among
economies and to some extent weakened the case for
a potential decoupling of growth between developed
2011, economic growth in most developing countries
and economies in transition started to decelerate,
suggesting that these countries are not immune to
the problems facing advanced economies and that
they remain vulnerable to contagion through various
channels, including trade, supply chains and the
Looking to the future, global economic growth is
risk cannot be excluded that it will be skewed to
the downside. A potential escalation of the debt
concern, despite ongoing efforts to contain the
crisis and avoid contagion, such as, for example,
increasing pledges to the International Monetary
Fund (IMF) to raise its resources to above $1 trillion.6
To put this into context, the IMF provided Greece
April 2012, respectively.7
Oil price developments constitute another concern as
persistent high and volatile oil prices could become a
drag on global demand. In 2011, oil prices increased
(pb) despite the release of strategic stocks from the
International Energy Agency (IEA) member countries.
The $32 increase in the average oil price during 2011
importing to oil-exporting countries.8 It is estimated by
IMF that a cut in oil supply from the Islamic Republic
of Iran, due to sanctions, could lead to an initial world
do not make up for the shortage.9 Under relatively
weak global economic conditions, an increase of
two years could, according to IMF, lower growth by 10
2. World merchandise trade
In tandem with the world economy, growth in world
merchandise trade by volume (that is, trade in real
in 2010. In addition to a weaker world economy,
trade in 2011 was particularly hampered by natural
shocks disrupting supply chains and production
processes in Japan and Thailand, civil unrest in North
Africa and oil supply disruption in Libya. Meanwhile,
supported by high commodity prices, the value of
to reach $18.2 trillion, a relative slowdown from the 11
Developed economies performed better than expected
shipments.12
The slowdown in demand and the overall weak
growth in advanced economies translated into weaker
imports in developed regions. In 2011, imports grew
cent recorded in 2010. Japan recorded the slowest
States (3.7).
Imports into developing countries expanded at the
commodity prices. Imports into Latin America
CHAPTER 1: DEVELOPMENTS IN INTERNATIONAL SEABORNE TRADE 5
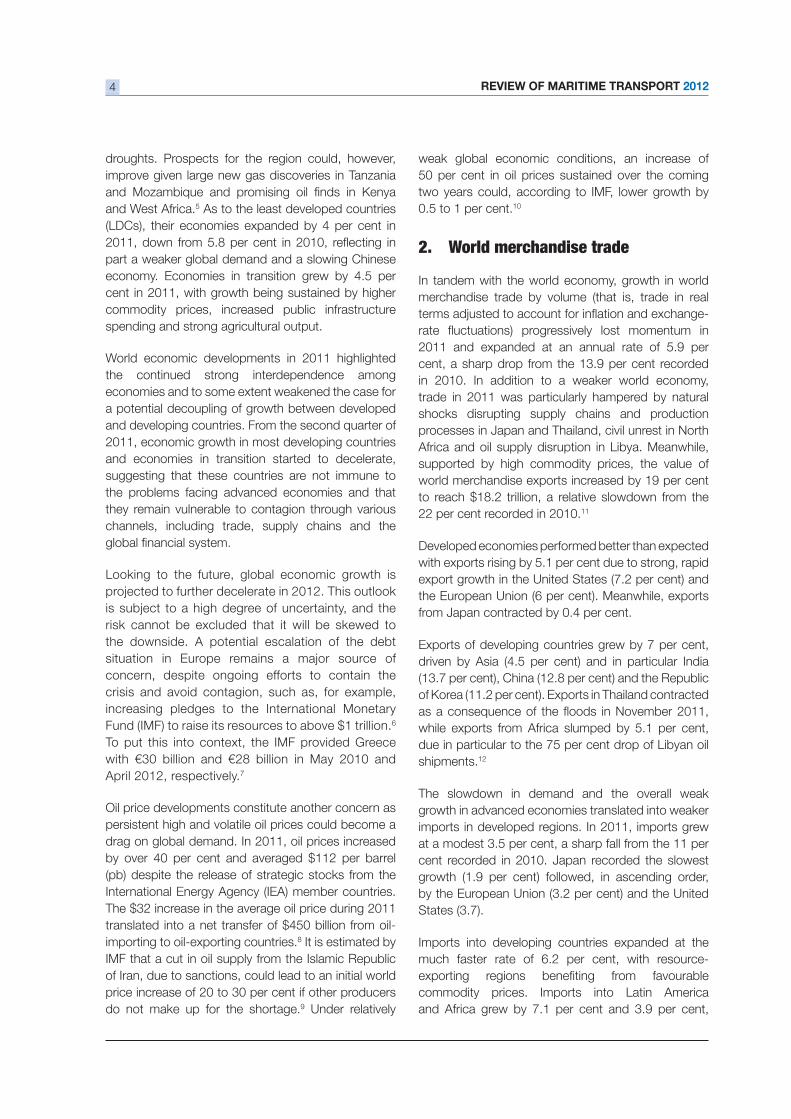
Table 1.2 Growth in the volume of merchandisea trade, by country groups and geographical region,2008–2011 (Annual percentage change)
Sources: UNCTAD secretariat calculations, based on UNCTAD Handbook of Statistics and Trade and Development Report, 2012.a
Exports Countries/regions
Imports
2008 2009 2010 2011 2008 2009 2010 2011
2.4 13.9 5.9 WORLD 2.5 14.1 5.0
2.5 13.2 5.1 Developed economies 11.0 3.5
of which:
2.3 27.5 Japan 10.1 1.9
5.5 15.3 7.2 United States 14.8 3.7
2.4 12.0 6.0 European Union (27) 0.8 10.0 3.2
3.2 15.4 7.0 Developing economies 6.6 19.2 6.2
of which:
8.7 Africa 10.6 7.1 3.9
10.3 3.4 Latin America and the Caribbean 8.5 23.3 7.1
1.6 18.8 4.5 Asia 8.0 21.9 6.1
of which:
1.8 18.8 4.5 ASEAN 8 21.9 6.1
10.6 29.0 12.8 China 2.3 30.8 10.6
16.8 5.9 13.7 India 29.7 13.8 5.3
8.8 2.6 15.3 11.2 Republic of Korea 0.7 17.4 6.7
11.5 6.0 Transition economies 15.5 15.5 17.0
respectively. In a separate development, a recent
decline in the normally large trade surpluses of Japan
and China is changing the trade landscape and
constitutes a welcome development, as it could imply 13
deceleration in trade growth with global merchandise
over the period 1990–2008.
Apart from current global economic uncertainties,
the outlook for merchandise trade is also clouded 14 A report by
the International Chamber of Commerce (ICC) and
in 2012.15
16
A surge in protectionist measures is another driver of
climate and the lack of progress on the adoption
of a multilateral trading system under the WTO
Doha Round negotiations. At the November 2011
meeting of the G20, participants underscored their
commitment to free trade and to the multilateral trade
system.17 However, since mid-October 2011, 124 new
restrictive measures have been recorded, affecting
18 Relevant measures
include trade remedy actions, tariff increases, import
licenses and customs controls.19
B. WORLD SEABORNE TRADE20
1. General trends in seaborne trade
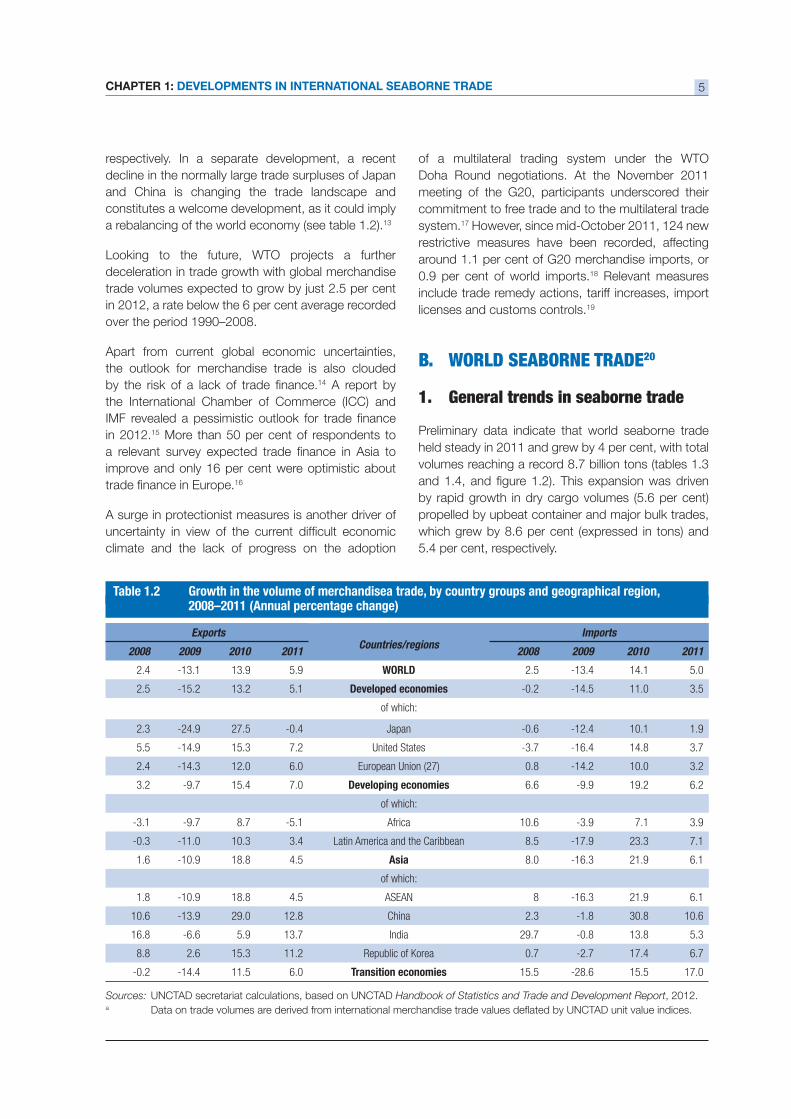
Preliminary data indicate that world seaborne trade
REVIEW OF MARITIME TRANSPORT 20126
non-mainlane trade as the United States and Europe
continued to struggle with sluggish growth and
uncertainty, while dry bulk volumes held strong with
continued import demand for raw materials in large
developing economies, notably China and India. Five
demand in China, a country accounting for about two
thirds of global iron ore trade volumes in 2011. Tanker
feature global seaborne trade in volume terms (tons), oil
trade continued to account for approximately one third
of the total in 2011. During the same year, dry cargo,
trade and general cargo held the remaining two thirds
for by other dry goods including general cargo.
A different picture emerges, however, when one
considers the contribution of these market segments
Year Oil and gas Main bulksa Other dry cargo Total
(all cargoes)
1970 1 440 448 717 2 605
1980 1 871 608 1 225 3 704
1990 1 755 988 1 265 4 008
2000 2 163 1 295 2 526 5 984
2005 2 422 1 709 2 978 7 109
2006 2 698 1 814 3 188 7 700
2007 2 747 1 953 3 334 8 034
2008 2 742 2 065 3 422 8 229
2009 2 642 2 085 3 131 7 858
2010 2 772 2 335 3 302 8 409
2011 2 796 2 477 3 475 8 748
Sources: Compiled by the UNCTAD secretariat on the basis of data supplied by reporting countries and as published on the relevant government and port industry website, and by specialist sources. The data for 2006 onwards have been revised and upated
Figures for 2011 are estimated based on preliminary data or on the last year for which data were available.a Iron ore, grain, coal, bauxite/alumina and phosphate. The data for 2006 onwards are based on various issues of the Dry Bulk
Trade Outlook, produced by Clarkson Research Services.
to the value of world seaborne trade. While recent
data, including for 2011, are not readily available,
existing estimates for 2007 may provide some insight
into the distribution of world seaborne trade by
value and allow for some comparisons to be made.
In 2007, it was not tanker cargo (oil and gas) that
accounted for the largest share of global trade, but
carried in containers. Tanker trade accounted for
respectively.21 More recent analysis of the 2008 and
2009 United Nations trade data shows an increase in
the strong import demand for these commodities from
emerging developing countries, in particular China.22
As developing countries contribute increasingly
larger shares and growth to both world GDP and
merchandise trade, their contribution to world
seaborne trade has also been increasing. In 2011, a
cent of this trade was delivered on their territories
world players both as exporters and importers, a
remarkable shift away from earlier patterns when they
served mainly as loading areas of high volume goods
(mainly of high volume raw materials and resources)
CHAPTER 1: DEVELOPMENTS IN INTERNATIONAL SEABORNE TRADE 7
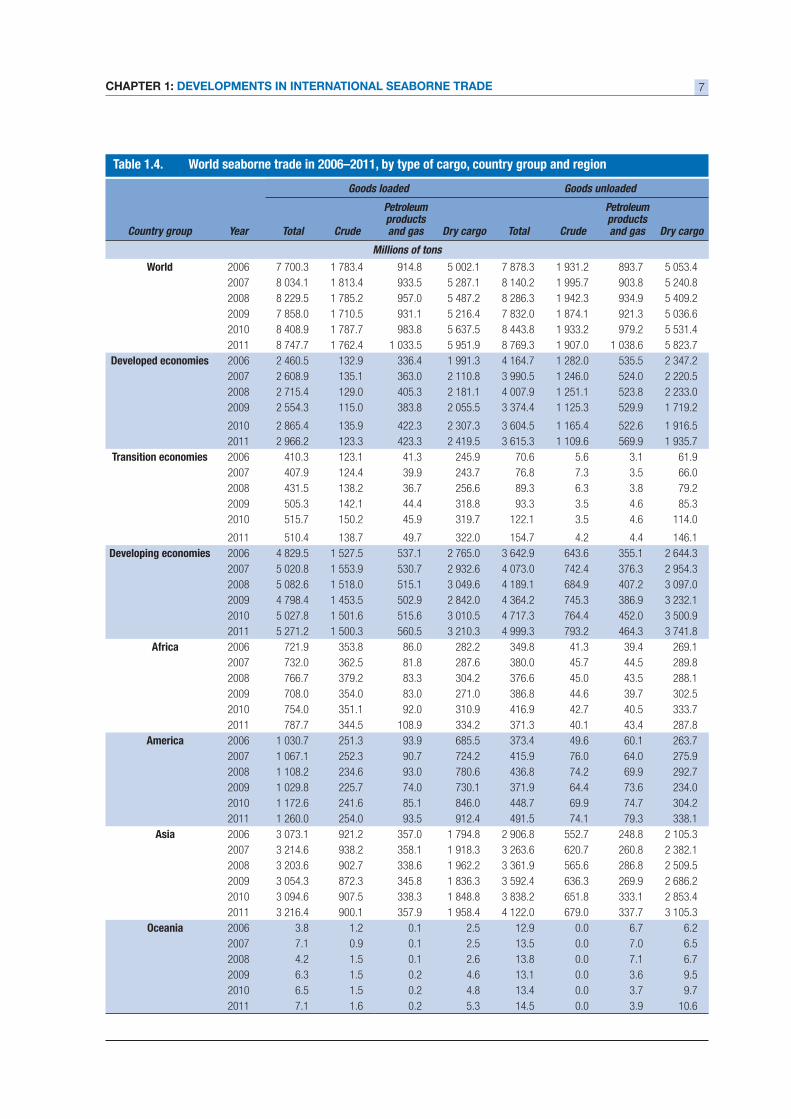
Table 1.4. World seaborne trade in 2006–2011, by type of cargo, country group and region
Country group Year
Goods loaded Goods unloaded
Total Crude
Petroleum products and gas Dry cargo Total Crude
Petroleum products and gas Dry cargo
Millions of tons
World 2006 7 700.3 1 783.4 914.8 5 002.1 7 878.3 1 931.2 893.7 5 053.4
2007 8 034.1 1 813.4 933.5 5 287.1 8 140.2 1 995.7 903.8 5 240.8
2008 8 229.5 1 785.2 957.0 5 487.2 8 286.3 1 942.3 934.9 5 409.2
2009 7 858.0 1 710.5 931.1 5 216.4 7 832.0 1 874.1 921.3 5 036.6
2010 8 408.9 1 787.7 983.8 5 637.5 8 443.8 1 933.2 979.2 5 531.4
2011 8 747.7 1 762.4 1 033.5 5 951.9 8 769.3 1 907.0 1 038.6 5 823.7
Developed economies 2006 2 460.5 132.9 336.4 1 991.3 4 164.7 1 282.0 535.5 2 347.2
2007 2 608.9 135.1 363.0 2 110.8 3 990.5 1 246.0 524.0 2 220.5
2008 2 715.4 129.0 405.3 2 181.1 4 007.9 1 251.1 523.8 2 233.0
2009 2 554.3 115.0 383.8 2 055.5 3 374.4 1 125.3 529.9 1 719.2
2010 2 865.4 135.9 422.3 2 307.3 3 604.5 1 165.4 522.6 1 916.5
2011 2 966.2 123.3 423.3 2 419.5 3 615.3 1 109.6 569.9 1 935.7
Transition economies 2006 410.3 123.1 41.3 245.9 70.6 5.6 3.1 61.9
2007 407.9 124.4 39.9 243.7 76.8 7.3 3.5 66.0
2008 431.5 138.2 36.7 256.6 89.3 6.3 3.8 79.2
2009 505.3 142.1 44.4 318.8 93.3 3.5 4.6 85.3
2010 515.7 150.2 45.9 319.7 122.1 3.5 4.6 114.0
2011 510.4 138.7 49.7 322.0 154.7 4.2 4.4 146.1
Developing economies 2006 4 829.5 1 527.5 537.1 2 765.0 3 642.9 643.6 355.1 2 644.3
2007 5 020.8 1 553.9 530.7 2 932.6 4 073.0 742.4 376.3 2 954.3
2008 5 082.6 1 518.0 515.1 3 049.6 4 189.1 684.9 407.2 3 097.0
2009 4 798.4 1 453.5 502.9 2 842.0 4 364.2 745.3 386.9 3 232.1
2010 5 027.8 1 501.6 515.6 3 010.5 4 717.3 764.4 452.0 3 500.9
2011 5 271.2 1 500.3 560.5 3 210.3 4 999.3 793.2 464.3 3 741.8
Africa 2006 721.9 353.8 86.0 282.2 349.8 41.3 39.4 269.1
2007 732.0 362.5 81.8 287.6 380.0 45.7 44.5 289.8
2008 766.7 379.2 83.3 304.2 376.6 45.0 43.5 288.1
2009 708.0 354.0 83.0 271.0 386.8 44.6 39.7 302.5
2010 754.0 351.1 92.0 310.9 416.9 42.7 40.5 333.7
2011 787.7 344.5 108.9 334.2 371.3 40.1 43.4 287.8
America 2006 1 030.7 251.3 93.9 685.5 373.4 49.6 60.1 263.7
2007 1 067.1 252.3 90.7 724.2 415.9 76.0 64.0 275.9
2008 1 108.2 234.6 93.0 780.6 436.8 74.2 69.9 292.7
2009 1 029.8 225.7 74.0 730.1 371.9 64.4 73.6 234.0
2010 1 172.6 241.6 85.1 846.0 448.7 69.9 74.7 304.2
2011 1 260.0 254.0 93.5 912.4 491.5 74.1 79.3 338.1
Asia 2006 3 073.1 921.2 357.0 1 794.8 2 906.8 552.7 248.8 2 105.3
2007 3 214.6 938.2 358.1 1 918.3 3 263.6 620.7 260.8 2 382.1
2008 3 203.6 902.7 338.6 1 962.2 3 361.9 565.6 286.8 2 509.5
2009 3 054.3 872.3 345.8 1 836.3 3 592.4 636.3 269.9 2 686.2
2010 3 094.6 907.5 338.3 1 848.8 3 838.2 651.8 333.1 2 853.4
2011 3 216.4 900.1 357.9 1 958.4 4 122.0 679.0 337.7 3 105.3
Oceania 2006 3.8 1.2 0.1 2.5 12.9 0.0 6.7 6.2
2007 7.1 0.9 0.1 2.5 13.5 0.0 7.0 6.5
2008 4.2 1.5 0.1 2.6 13.8 0.0 7.1 6.7
2009 6.3 1.5 0.2 4.6 13.1 0.0 3.6 9.5
2010 6.5 1.5 0.2 4.8 13.4 0.0 3.7 9.7
2011 7.1 1.6 0.2 5.3 14.5 0.0 3.9 10.6
REVIEW OF MARITIME TRANSPORT 20128
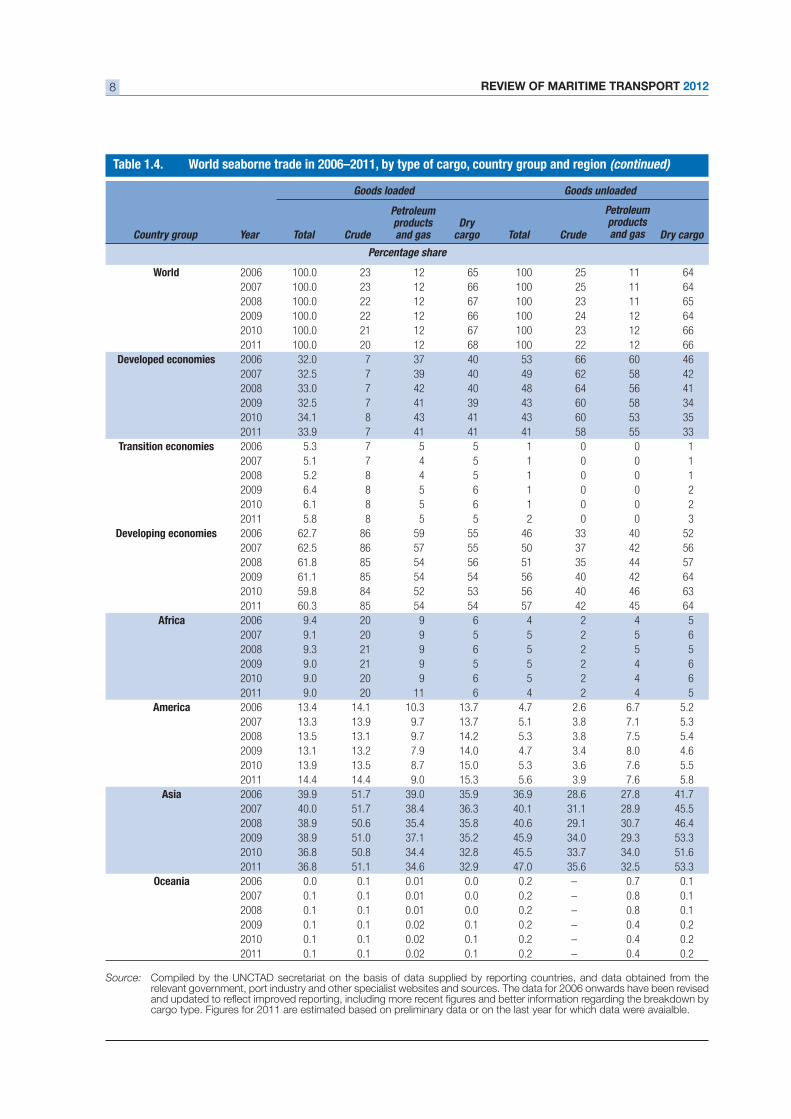
Source: Compiled by the UNCTAD secretariat on the basis of data supplied by reporting countries, and data obtained from the relevant government, port industry and other specialist websites and sources. The data for 2006 onwards have been revised
cargo type. Figures for 2011 are estimated based on preliminary data or on the last year for which data were avaialble.
Percentage share
World 2006 100.0 23 12 65 100 25 11 64
2007 100.0 23 12 66 100 25 11 64
2008 100.0 22 12 67 100 23 11 65
2009 100.0 22 12 66 100 24 12 64
2010 100.0 21 12 67 100 23 12 66
2011 100.0 20 12 68 100 22 12 66
Developed economies 2006 32.0 7 37 40 53 66 60 46
2007 32.5 7 39 40 49 62 58 42
2008 33.0 7 42 40 48 64 56 41
2009 32.5 7 41 39 43 60 58 34
2010 34.1 8 43 41 43 60 53 35
2011 33.9 7 41 41 41 58 55 33
Transition economies 2006 5.3 7 5 5 1 0 0 1
2007 5.1 7 4 5 1 0 0 1
2008 5.2 8 4 5 1 0 0 1
2009 6.4 8 5 6 1 0 0 2
2010 6.1 8 5 6 1 0 0 2
2011 5.8 8 5 5 2 0 0 3
Developing economies 2006 62.7 86 59 55 46 33 40 52
2007 62.5 86 57 55 50 37 42 56
2008 61.8 85 54 56 51 35 44 57
2009 61.1 85 54 54 56 40 42 64
2010 59.8 84 52 53 56 40 46 63
2011 60.3 85 54 54 57 42 45 64
Africa 2006 9.4 20 9 6 4 2 4 5
2007 9.1 20 9 5 5 2 5 6
2008 9.3 21 9 6 5 2 5 5
2009 9.0 21 9 5 5 2 4 6
2010 9.0 20 9 6 5 2 4 6
2011 9.0 20 11 6 4 2 4 5
America 2006 13.4 14.1 10.3 13.7 4.7 2.6 6.7 5.2
2007 13.3 13.9 9.7 13.7 5.1 3.8 7.1 5.3
2008 13.5 13.1 9.7 14.2 5.3 3.8 7.5 5.4
2009 13.1 13.2 7.9 14.0 4.7 3.4 8.0 4.6
2010 13.9 13.5 8.7 15.0 5.3 3.6 7.6 5.5
2011 14.4 14.4 9.0 15.3 5.6 3.9 7.6 5.8
Asia 2006 39.9 51.7 39.0 35.9 36.9 28.6 27.8 41.7
2007 40.0 51.7 38.4 36.3 40.1 31.1 28.9 45.5
2008 38.9 50.6 35.4 35.8 40.6 29.1 30.7 46.4
2009 38.9 51.0 37.1 35.2 45.9 34.0 29.3 53.3
2010 36.8 50.8 34.4 32.8 45.5 33.7 34.0 51.6
2011 36.8 51.1 34.6 32.9 47.0 35.6 32.5 53.3
Oceania 2006 0.0 0.1 0.01 0.0 0.2 – 0.7 0.1
2007 0.1 0.1 0.01 0.0 0.2 – 0.8 0.1
2008 0.1 0.1 0.01 0.0 0.2 – 0.8 0.1
2009 0.1 0.1 0.02 0.1 0.2 – 0.4 0.2
2010 0.1 0.1 0.02 0.1 0.2 – 0.4 0.2
2011 0.1 0.1 0.02 0.1 0.2 – 0.4 0.2
Table 1.4. World seaborne trade in 2006–2011, by type of cargo, country group and region (continued)
Country group Year
Goods loaded Goods unloaded
Total Crude
Petroleum products and gas
Dry cargo Total Crude
Petroleum products and gas Dry cargo
CHAPTER 1: DEVELOPMENTS IN INTERNATIONAL SEABORNE TRADE 9
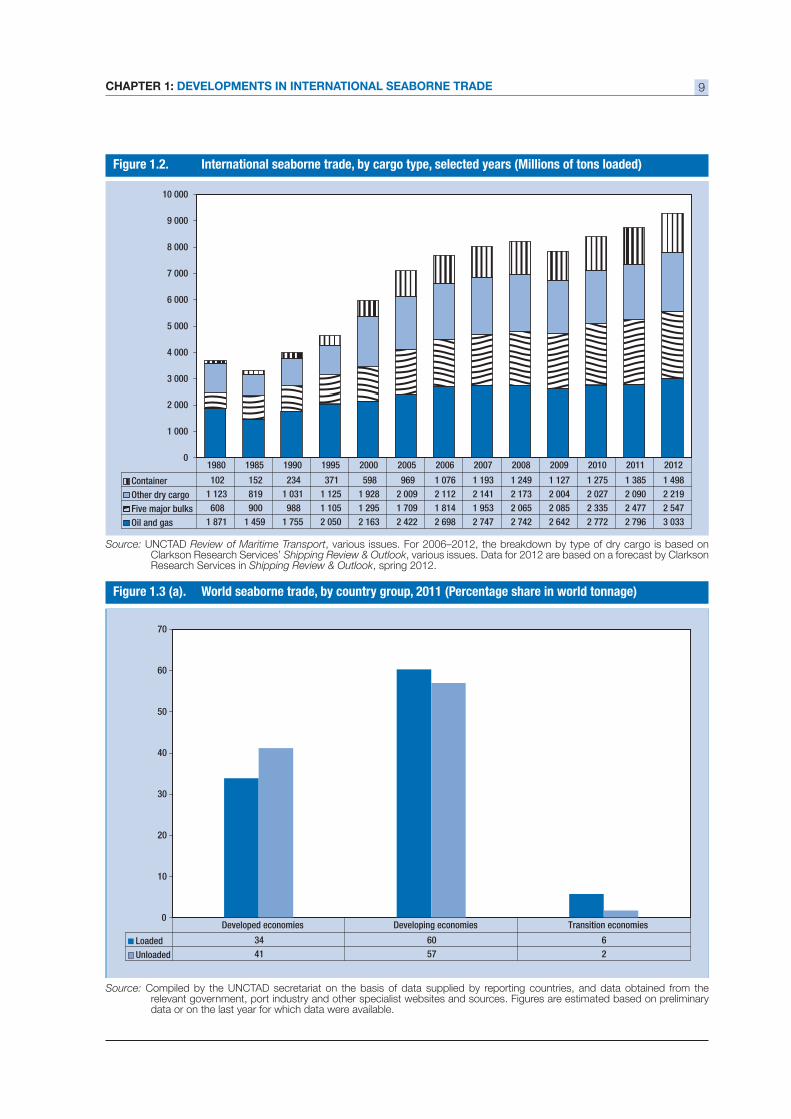
Source: UNCTAD Review of Maritime Transport, various issues. For 2006–2012, the breakdown by type of dry cargo is based on Clarkson Research Services’ Shipping Review & Outlook, various issues. Data for 2012 are based on a forecast by Clarkson Research Services in Shipping Review & Outlook, spring 2012.
0
1 000
2 000
3 000
4 000
5 000
6 000
7 000
8 000
9 000
10 000
Container 102 152 234 371 598 969 1 076 1 193 1 249 1 127 1 275 1 385 1 498
Other dry cargo 1 123 819 1 031 1 125 1 928 2 009 2 112 2 141 2 173 2 004 2 027 2 090 2 219
Five major bulks 608 900 988 1 105 1 295 1 709 1 814 1 953 2 065 2 085 2 335 2 477 2 547
Oil and gas 1 871 1 459 1 755 2 050 2 163 2 422 2 698 2 747 2 742 2 642 2 772 2 796 3 033
1980 1985 1990 1995 2000 2005 2006 2007 2008 2009 2010 2011 2012
0
10
20
30
40
50
60
70
Loaded 34 60 6
Unloaded 41 57 2
Developed economies Developing economies Transition economies
Source: Compiled by the UNCTAD secretariat on the basis of data supplied by reporting countries, and data obtained from the relevant government, port industry and other specialist websites and sources. Figures are estimated based on preliminary data or on the last year for which data were available.
REVIEW OF MARITIME TRANSPORT 201210
0
10
20
30
40
50
60
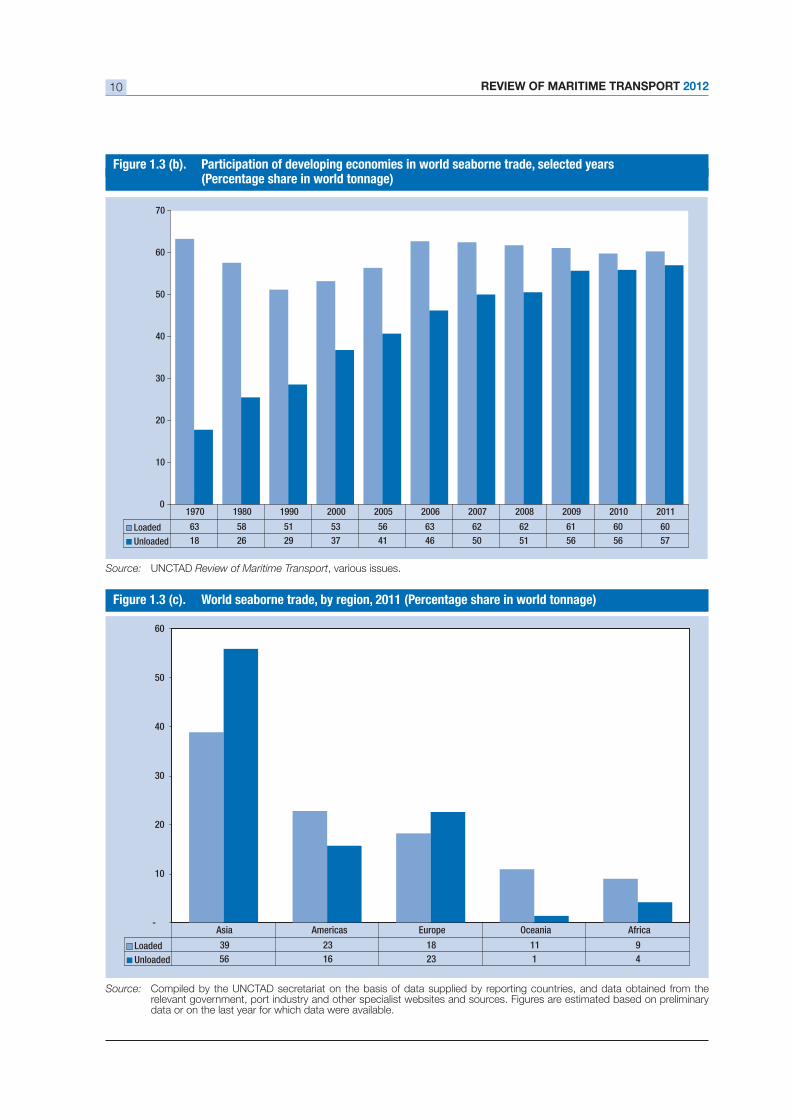
70
Loaded 63 58 51 53 56 63 62 62 61 60 60
Unloaded 18 26 29 37 41 46 50 51 56 56 57
1970 1980 1990 2000 2005 2006 2007 2008 2009 2010 2011
-
10
20
30
40
50
60
Loaded 39 23 18 11 9
Unloaded 56 16 23 1 4
Asia Americas Europe Oceania Africa
(Percentage share in world tonnage)
Source: UNCTAD Review of Maritime Transport, various issues.
Source: Compiled by the UNCTAD secretariat on the basis of data supplied by reporting countries, and data obtained from the relevant government, port industry and other specialist websites and sources. Figures are estimated based on preliminary data or on the last year for which data were available.

CHAPTER 1: DEVELOPMENTS IN INTERNATIONAL SEABORNE TRADE 11
countries, their share of imports outweighed exports,
Transition economies continued to account for the
remaining trade, their contribution to world seaborne
cent, respectively. Geographically, Asia maintained its
lead position and continued to fuel world seaborne
trade with its share of goods loaded amounting to
For 2012, Clarkson Research Services are forecasting
world seaborne trade. However, several downside
risks continue to stand in the way of a robust and
sustainable recovery in shipping, including the current
global economic uncertainty, security concerns and
tensions, as well as a potential rise in trade restrictions.
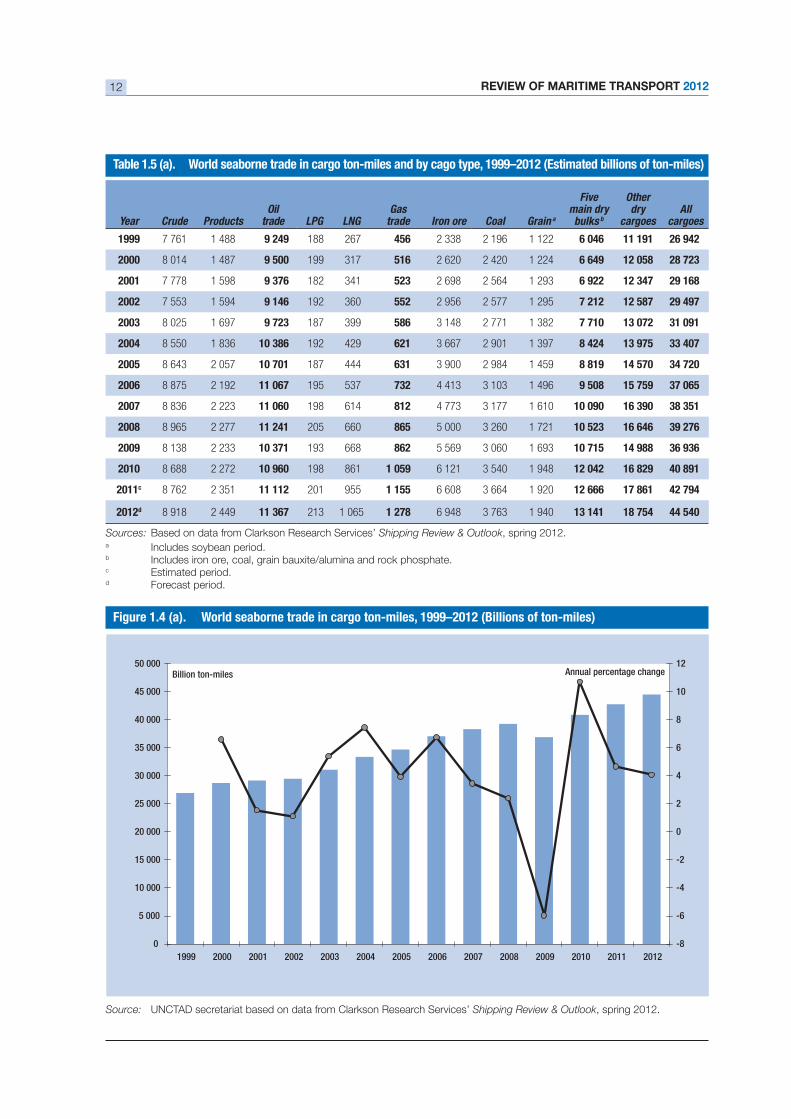
2. Seaborne trade in ton-miles23
The unit of ton-miles offers a measure of true demand for
shipping services and tonnage as it takes into account
distance, which determines ships’ availability. Between
1999 and 2011, ton-miles have increased for all cargoes,
import demand for industrial commodities necessary
for steel production has fuelled rapid growth in the iron
ore and coal trades. The growing appetite of China for
these commodities has heightened the need to diversify
sources of supply, and include more distant locations
such as Brazil, the United States and South Africa. While
the estimated average distance of global iron ore trade
increased from 5,451 miles in 1998 to 6,260 miles in
2011, iron ore ton-miles are expected to increase further
as new mines in the Arctic and West Africa start up.24
Steam and coking coal ton-miles varied both over
regions.25 In 2011, coal trade patterns shifted, with
drove coal prices up.26 Meanwhile, higher demand for
thermal coal in Europe and a rise in coal exports from
the United States have boosted the Atlantic trade.
however, with China in particular emerging as a net
importer, and with Indonesian exports predominantly
catering for this demand. In view of the relatively short
distances between China and Indonesia, compared
with the United States or South Africa, estimated
average distances fell from 4,998 miles in 1998 to
3,910 miles in 2011.27
and kerosene) and crude oil recorded the smallest ton-
oil trade has been evolving over the past decade.
Tanker trade patterns, including associated ton-mile
demand, are changing as a result of the strategies
seeking to diversify crude oil supply sources. In China,
between 2001 and 2011, the share of the country’s
ton-mile trade sourced from Western Asia has been
decreasing, while the proportion of its ton-miles
sourced from the Caribbean has increased.28 The
share of crude ton-miles from Western Asia fell from
cent in 2011, while the Caribbean share increased 29 The Western Asia
share of crude ton-miles to North America fell from
shares of the Caribbean and West Africa helped offset
this decline.30 In 2014, the crude ton-mile demand of
China is expected to surpass that of North America.31
distances rose in certain regions. Europe, for example,
replaced crude oil from Libya with longer-haul
substitutes from Western Asia, the Black Sea, and
Western Africa.32 Furthermore, tankers trading between
Western Asia and the Atlantic coast of the United States
are increasingly travelling greater distances to avoid
piracy off the coast of Somalia in the Indian Ocean.33
Oil products have also shown slower ton-mile growth
in Asia implies a lesser need for long-haul petroleum
products imports. However, with the closing of three
country’s ton-mile demand for crude oil imports will
likely be reduced. This means, in parallel, that its ton-
to rise with higher import volumes from Europe, India
REVIEW OF MARITIME TRANSPORT 201212
Sources: Based on data from Clarkson Research Services’ Shipping Review & Outlook, spring 2012.a Includes soybean period.b Includes iron ore, coal, grain bauxite/alumina and rock phosphate.c Estimated period.d Forecast period.
Year Crude ProductsOil
trade LPG LNGGas
trade Iron ore Coal Grain a
Fivemain dry bulks b
Otherdry
cargoesAll
cargoes
1999 7 761 1 488 9 249 188 267 456 2 338 2 196 1 122 6 046 11 191 26 942
2000 8 014 1 487 9 500 199 317 516 2 620 2 420 1 224 6 649 12 058
2001 7 778 1 598 182 341 2 698 2 564 1 293 6 922 29 168
2002 7 553 1 594 9 146 192 360 552 2 956 2 577 1 295 7 212 12 587 29 497
8 025 1 697 187 399 586 3 148 2 771 1 382 7 710
2004 8 550 1 836 192 429 621 3 667 2 901 1 397 8 424
2005 8 643 2 057 10 701 187 444 3 900 2 984 1 459 8 819 14 570
2006 8 875 2 192 11 067 195 537 4 413 3 103 1 496 9 508 15 759
2007 8 836 2 223 11 060 198 614 812 4 773 3 177 1 610 10 090
2008 8 965 2 277 11 241 205 660 865 5 000 3 260 1 721 16 646
2009 8 138 2 233 193 668 862 5 569 3 060 1 693 10 715 14 988
2010 8 688 2 272 10 960 198 861 1 059 6 121 3 540 1 948 12 042 16 829 40 891
2011c 8 762 2 351 11 112 201 955 1 155 6 608 3 664 1 920 12 666 17 861 42 794
2012d 8 918 2 449 213 1 065 1 278 6 948 3 763 1 940 18 754 44 540
0
5 000
10 000
15 000
20 000
25 000
30 000
35 000
40 000
45 000
50 000
1999 2000 2001 2002 2003 2004 2005 2006 2007 2008 2009 2010 2011 2012-8
-6
-4
-2
0
2
4
6
8
10
12Billion ton-miles Annual percentage change
Figure 1.4 (a). World seaborne trade in cargo ton-miles, 1999–2012 (Billions of ton-miles)
Source: UNCTAD secretariat based on data from Clarkson Research Services’ Shipping Review & Outlook, spring 2012.
CHAPTER 1: DEVELOPMENTS IN INTERNATIONAL SEABORNE TRADE 13
producing regions could help shift a larger share of the
(for example, gasoline, kerosene, and the like).
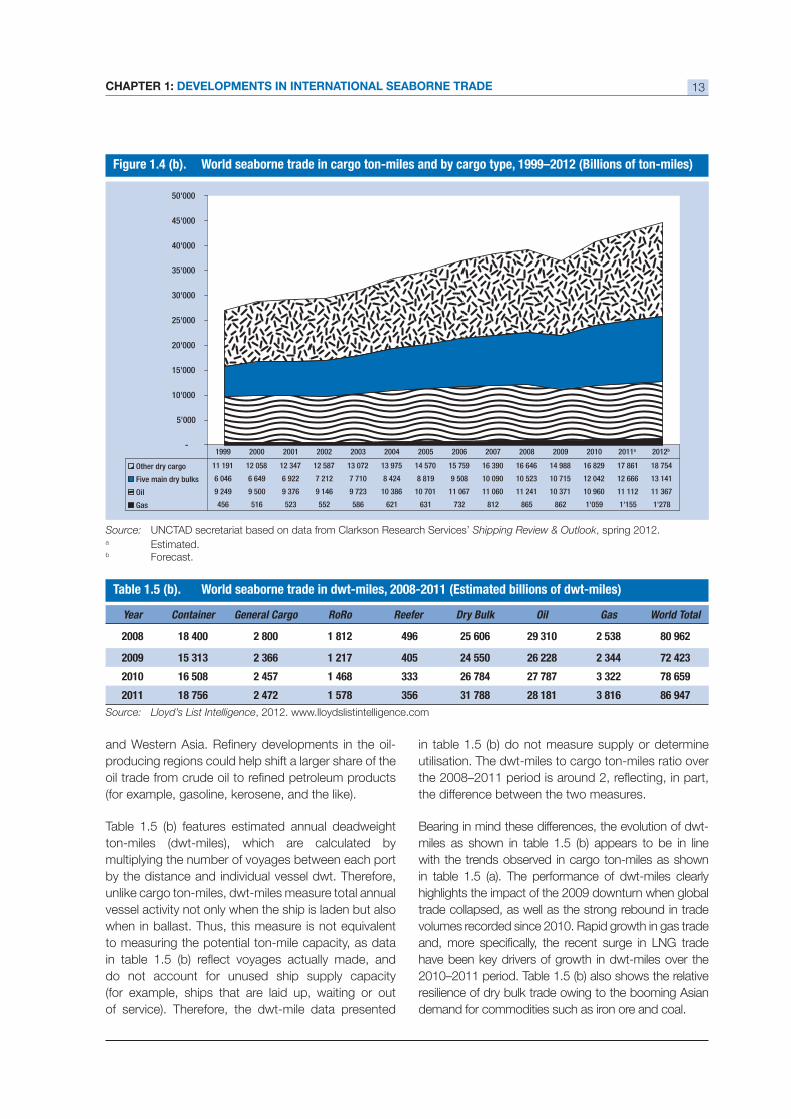
Table 1.5 (b) features estimated annual deadweight
ton-miles (dwt-miles), which are calculated by
multiplying the number of voyages between each port
by the distance and individual vessel dwt. Therefore,
unlike cargo ton-miles, dwt-miles measure total annual
vessel activity not only when the ship is laden but also
to measuring the potential ton-mile capacity, as data
do not account for unused ship supply capacity
(for example, ships that are laid up, waiting or out
of service). Therefore, the dwt-mile data presented
utilisation. The dwt-miles to cargo ton-miles ratio over
the difference between the two measures.
Bearing in mind these differences, the evolution of dwt-
with the trends observed in cargo ton-miles as shown
highlights the impact of the 2009 downturn when global
trade collapsed, as well as the strong rebound in trade
volumes recorded since 2010. Rapid growth in gas trade
have been key drivers of growth in dwt-miles over the
resilience of dry bulk trade owing to the booming Asian
demand for commodities such as iron ore and coal.
Source: Lloyd’s List Intelligence, 2012. www.lloydslistintelligence.com
Year Container General Cargo RoRo Reefer Dry Bulk Oil Gas World Total
2008 18 400 2 800 1 812 496 25 606 80 962
2009 1 217 405 24 550 26 228
2010 16 508 2 457 1 468 26 784 27 787 78 659
2011 18 756 2 472 1 578 28 181 86 947
-
5'000
10'000
15'000
20'000
25'000
30'000
35'000
40'000
45'000
50'000
Other dry cargo 11 191 12 058 12 347 12 587 13 072 13 975 14 570 15 759 16 390 16 646 14 988 16 829 17 861 18 754
Five main dry bulks 6 046 6 649 6 922 7 212 7 710 8 424 8 819 9 508 10 090 10 523 10 715 12 042 12 666 13 141
Oil 9 249 9 500 9 376 9 146 9 723 10 386 10 701 11 067 11 060 11 241 10 371 10 960 11 112 11 367
Gas 456 516 523 552 586 621 631 732 812 865 862 1'059 1'155 1'278
1999 2000 2001 2002 2003 2004 2005 2006 2007 2008 2009 2010 2011a 2012b
Figure 1.4 (b). World seaborne trade in cargo ton-miles and by cargo type, 1999–2012 (Billions of ton-miles)
Source: UNCTAD secretariat based on data from Clarkson Research Services’ Shipping Review & Outlook, spring 2012.a Estimated.b Forecast.
REVIEW OF MARITIME TRANSPORT 201214
3. Seaborne trade by cargo type
Tanker trade34
Crude oil production and consumption35
In 2011, world oil consumption grew marginally by
While consumption in the OECD countries declined
countries. Interestingly, after growing by an average
consumption growth in China slowed down in 2011,
Organization of the Petroleum Exporting Countries
(OPEC) leading the growth. Non-OPEC supply
the Russian Federation and Colombia was offset
by declines in Norway and the United Kingdom.
Recent developments in drilling activity point to future
oil supply increases. Drilling activity picked up in 2011
due in part to the allocation of new drilling permits in the
Gulf of Mexico. This follows the end, in October 2010,
of the moratorium established in this region after the
Deepwater Horizon incident. Activity also revived with
launched in 2011.
Crude oil shipments
Over the past decade, crude oil volumes increased at
a relatively slower pace than other market segments.
Between 2000 and 2011, crude oil shipments grew
the total volume of crude oil loaded globally amounted
largest loading area, followed, Africa, developing
areas were in ascending order, Japan, North America,
Europe and developing Asia.
Tanker trade patterns are changing as crude oil source
is being drawn up as new oil discoveries are made in
different regions and as new market suppliers emerge.
move by China to secure its energy supply through
foreign investments.36 In March 2009, China lent up
the Bolivarian Republic of Venezuela and Brazil,37 in
exchange for oil, while its investment in the mining sector
in sub-Saharan Africa accounted for about one third of
the country’s foreign direct investment (FDI).38 There are
now 50 countries in which Chinese oil companies have
more than 200 upstream investments.39 The extent to
remains unclear as the strategy being developed
by China also aims to ensure that, by 2015, half the
country’s crude imports are shipped on domestic ship
tonnage. Another trend reshaping the market is the
falling demand in the United States – the world’s largest
Current sanctions applying to the oil trade of the
market and raising uncertainties. The sanctions have a
direct impact on this country’s oil exports as well as on
the oil trade that passes through the Strait of Hormuz.
An escalation of these geopolitical tensions could
lead to a shutdown of the Strait, which in turn would
create oil shortages and raise oil prices to potentially
extreme levels, including the range of $200–$400.40
Although temporary waivers have been issued for a
number of countries, concerns remain with respect
to the likely severe impact of the sanctions, including
those enacted by the European Union. These latter
sanctions prohibit insurers in Europe – marine insurers
are to a large extent based in Europe and the United
States – from issuing or maintaining insurance to
tankers involved in servicing the oil trade of the Islamic
Republic of Iran. Pressure is particularly high for some
key crude importers, which could be forced to provide
sovereign guarantees to tankers.
In a separate development, tanker trade has also been
affected by rising operating costs resulting from the
higher oil and bunker fuel prices that prevailed in 2011.
Tanker operators had to reduce speed to optimize
fuel consumption and also absorb excess tonnage
capacity. Slow steaming has been implemented in
the tanker trade, with most voyages taking place
at an average of 13 knots (compared to 14 knots),
and at 10–11 knots when sailing in ballast (see also
CHAPTER 1: DEVELOPMENTS IN INTERNATIONAL SEABORNE TRADE 15
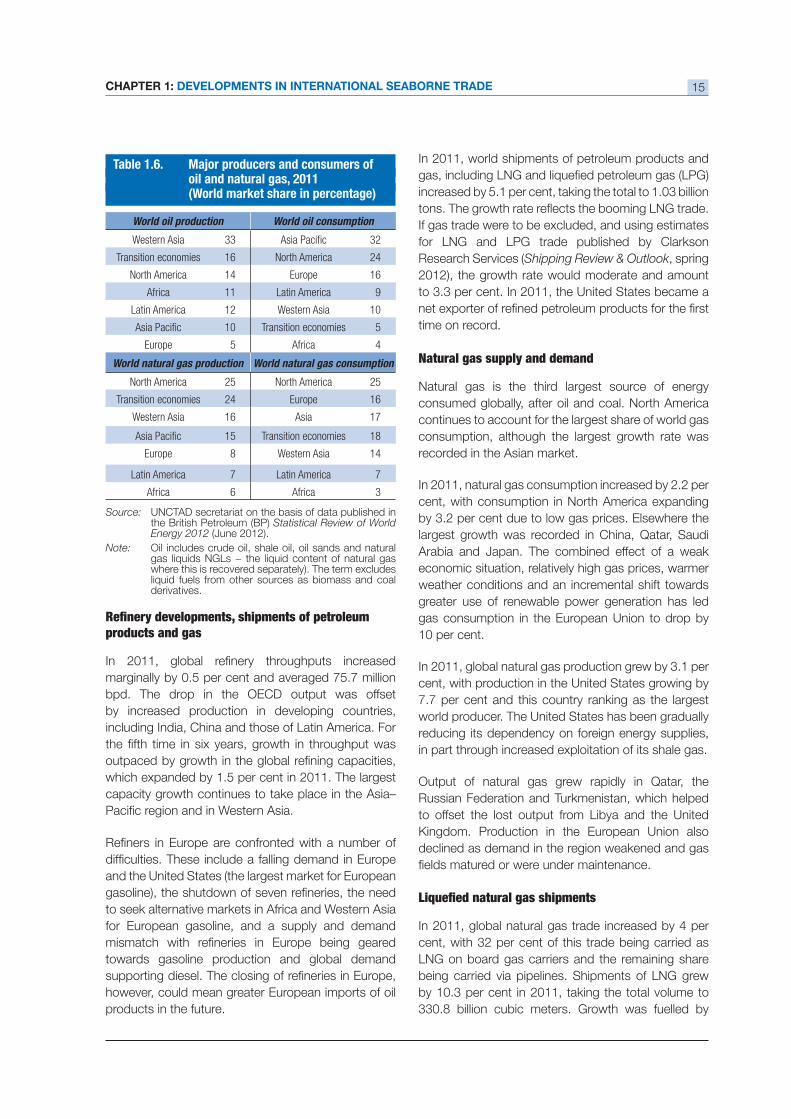
oil and natural gas, 2011(World market share in percentage)
Source: UNCTAD secretariat on the basis of data published in the British Petroleum (BP) Statistical Review of World Energy 2012
Note: Oil includes crude oil, shale oil, oil sands and natural
where this is recovered separately). The term excludes
derivatives.
World oil production World oil consumption
Western Asia 33 32
Transition economies 16 North America 24
North America 14 Europe 16
Africa 11 Latin America 9
Latin America 12 Western Asia 10
10 Transition economies 5
Europe 5 Africa 4
World natural gas production World natural gas consumption
North America 25 North America 25
Transition economies 24 Europe 16
Western Asia 16 Asia 17
15 Transition economies 18
Europe 8 Western Asia 14
Latin America 7 Latin America 7
Africa 6 Africa 3
products and gas
bpd. The drop in the OECD output was offset
by increased production in developing countries,
including India, China and those of Latin America. For
capacity growth continues to take place in the Asia–
and the United States (the largest market for European
to seek alternative markets in Africa and Western Asia
for European gasoline, and a supply and demand
towards gasoline production and global demand
however, could mean greater European imports of oil
products in the future.
In 2011, world shipments of petroleum products and
If gas trade were to be excluded, and using estimates
for LNG and LPG trade published by Clarkson
Research Services (Shipping Review & Outlook, spring
2012), the growth rate would moderate and amount
time on record.
Natural gas supply and demand
Natural gas is the third largest source of energy
consumed globally, after oil and coal. North America
continues to account for the largest share of world gas
consumption, although the largest growth rate was
recorded in the Asian market.
cent, with consumption in North America expanding
largest growth was recorded in China, Qatar, Saudi
Arabia and Japan. The combined effect of a weak
economic situation, relatively high gas prices, warmer
weather conditions and an incremental shift towards
greater use of renewable power generation has led
gas consumption in the European Union to drop by
cent, with production in the United States growing by
world producer. The United States has been gradually
reducing its dependency on foreign energy supplies,
in part through increased exploitation of its shale gas.
Output of natural gas grew rapidly in Qatar, the
Russian Federation and Turkmenistan, which helped
to offset the lost output from Libya and the United
Kingdom. Production in the European Union also
declined as demand in the region weakened and gas
LNG on board gas carriers and the remaining share
being carried via pipelines. Shipments of LNG grew
REVIEW OF MARITIME TRANSPORT 201216
increasing exports from Qatar and increasing imports
LNG imports, with Japan remaining the world largest
importer, followed by the Republic of Korea.
Over the past few years LNG has been one of the
fastest-growing cargoes owing to the increasing
interest in LNG as a greener alternative to other fossil
fuels. Interest in LNG heightened in 2011 as the fallout
from the disaster in Japan highlighted the risk of a great
reliance on nuclear power over the long term. New
and expanding LNG-receiving terminals (for example,
in the United Kingdom, the United States, China, the
United Arab Emirates, Chile, and Thailand) are being
started operations between 2010 and 2011, including
those in Qatar, Peru and Norway. Overall, the outlook
for LNG is positive and is supported by growing
demand from traditionally large LNG exporters such
as Indonesia and Malaysia.
Russian Federation will be driving global exports of
LNG and that these two countries will lead the fourth
wave of LNG exports.41
at the present time and is led by Qatar, the second
third wave is expected to occur around 2020 and be
driven by West Africa.42
Dry cargo trades: major and minor dry bulksand other dry cargo 43
In 2011, the momentum was maintained for dry
grain, bauxite/alumina and phosphate rock) and minor
bulks (agribulks, fertilizers, metals, minerals, steel and
in 2011.
Major dry bulks: iron ore, coal, grain, bauxite/alumina and phosphate rock
by iron ore volumes, which accounted for the largest
steel production, growing infrastructure development
needs of emerging developing countries, urbanization
and the evolution of the global manufacturing base.
World consumption and production of steel, a key
product supplier to many industries, continued to
expand in 2011 despite prevailing global economic
uncertainties and volatilities. In 2011, world steel
overall weakness of the world economy and the
slight slowdown in the economic expansion of China.
With most of Chinese steel demand being driven
by expenditure on investment and construction, the
2011, a slower pace than in 2010.
World steel production is estimated to have grown
tons. Steel production in China increased, albeit at
a slower pace, and still accounted for almost half of
the global output in 2011. Other emerging developing
economies such as India, Brazil, the Republic of Korea
and Turkey, which have featured among the top 10
steel producers for the past 40 years, also increased
Coal production, consumption and shipments
consumption, coal is the second most important
primary energy source and is used mainly in power
cent in 2011, with consumption outside the OECD
cent. Despite growth in Europe, overall consumption
falling demand in the United States and Japan.
most of the growth occurring in developing countries
and with China accounting for over two thirds of
this expansion. Since China has emerged as a
net importer of coal, coal prices have been rising,
as have new investments in exporting countries,
including Australia, Indonesia, the Russian Federation,
CHAPTER 1: DEVELOPMENTS IN INTERNATIONAL SEABORNE TRADE 17
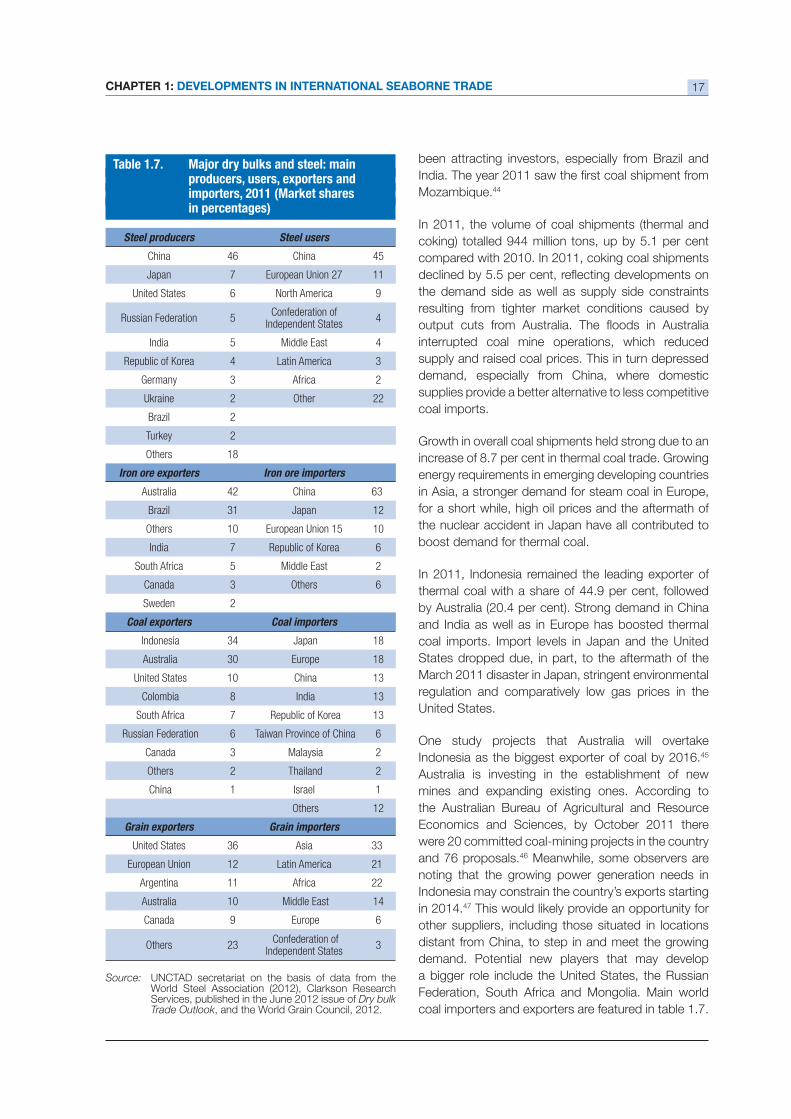
producers, users, exporters and
in percentages)
Steel producers Steel users
China 46 China 45
Japan 7 European Union 27 11
United States 6 North America 9
Russian Federation 5 Confederation of
Independent States 4
India 5 Middle East 4
Republic of Korea 4 Latin America 3
Germany 3 Africa 2
Ukraine 2 Other 22
Brazil 2
Turkey 2
Others 18
Iron ore exporters Iron ore importers
Australia 42 China 63
Brazil 31 Japan 12
Others 10 European Union 15 10
India 7 Republic of Korea 6
South Africa 5 Middle East 2
Canada 3 Others 6
Sweden 2
Coal exporters Coal importers
Indonesia 34 Japan 18
Australia 30 Europe 18
United States 10 China 13
Colombia 8 India 13
South Africa 7 Republic of Korea 13
Russian Federation 6 Taiwan Province of China 6
Canada 3 Malaysia 2
Others 2 Thailand 2
China 1 Israel 1
Others 12
Grain exporters Grain importers
United States 36 Asia 33
European Union 12 Latin America 21
Argentina 11 Africa 22
Australia 10 Middle East 14
Canada 9 Europe 6
Others 23 Confederation of
Independent States 3
Source: UNCTAD secretariat on the basis of data from the World Steel Association (2012), Clarkson Research Services, published in the June 2012 issue of Dry bulk Trade Outlook, and the World Grain Council, 2012.
been attracting investors, especially from Brazil and
44
In 2011, the volume of coal shipments (thermal and
compared with 2010. In 2011, coking coal shipments
the demand side as well as supply side constraints
resulting from tighter market conditions caused by
interrupted coal mine operations, which reduced
supply and raised coal prices. This in turn depressed
demand, especially from China, where domestic
supplies provide a better alternative to less competitive
coal imports.
Growth in overall coal shipments held strong due to an
in Asia, a stronger demand for steam coal in Europe,
for a short while, high oil prices and the aftermath of
the nuclear accident in Japan have all contributed to
boost demand for thermal coal.
In 2011, Indonesia remained the leading exporter of
and India as well as in Europe has boosted thermal
coal imports. Import levels in Japan and the United
States dropped due, in part, to the aftermath of the
March 2011 disaster in Japan, stringent environmental
regulation and comparatively low gas prices in the
United States.
Indonesia as the biggest exporter of coal by 2016.45
Australia is investing in the establishment of new
mines and expanding existing ones. According to
the Australian Bureau of Agricultural and Resource
Economics and Sciences, by October 2011 there
and 76 proposals.46 Meanwhile, some observers are
noting that the growing power generation needs in
Indonesia may constrain the country’s exports starting
in 2014.47 This would likely provide an opportunity for
other suppliers, including those situated in locations
distant from China, to step in and meet the growing
demand. Potential new players that may develop
a bigger role include the United States, the Russian
Federation, South Africa and Mongolia. Main world
REVIEW OF MARITIME TRANSPORT 201218
The outlook for coal trade remains promising, as
to developments in coal production and consumption
patterns in China, as the scale of the country’s large
domestic supply means that any small shift could turn
the country into a net exporter again.48 Additionally, the
country’s Five-Year Plan for the period 2011 to 2015,
which aims to reduce the energy and carbon intensity
of the economy, is likely to impact on coal trade.
Iron ore and steel production and consumption
remains highly concentrated with China being the
main driver.
iron ore exports were constrained by the introduction
of mining and export bans, as well as higher export
duties, all other exporters have recorded positive
export growth.
cent, while Asian developing countries recorded an
Import demand in China increased by a strong
in this particular trade. Most other Asian countries
increased their imports, but Japan and Indonesia
cent, respectively.
In 2011, concerns were raised regarding new port
restrictions introduced by Chinese authorities. These
would restrict access to the purpose-built very large
ore carriers (VLOCs) of 400,000 dwt, owned or ordered
by Vale to service booming iron ore demand from
China (see also chapters 2 and 4 for more detailed
information). For Brazil, in particular, the strategic
importance of its bilateral trade with China cannot be
overemphasized. Brazilian exports to China increased
49 Iron
cent. Brazil and China are increasingly investing in
bottlenecks that may hinder this trade.50
wider economy and the steel-making sector, and
more importantly, to the effect of new macroeconomic
policies being instigated by China, the outlook for iron
2012.
Grain shipments
Total grain production in the crop year 2010/2011 fell
World wheat consumption is expected to increase
for over two thirds of the total growth. However, with
maize supplies being more limited and prices being
higher, lower-grade wheat becomes a good alternative
for use as feedstock. Industrial use remains small but
is expected to grow as demand for wheat-based
ethanol increases.
total grain shipments. For the crop year 2011/12,
due to a strong demand, especially from developing
economies, and improved harvests. These factors
eased wheat prices. Wheat export increases were
such as the United States and the European Union
respectively, due in particular to better priced grain
from other regions, including from the Black Sea.
Meanwhile, shipments of coarse grains increased by
CHAPTER 1: DEVELOPMENTS IN INTERNATIONAL SEABORNE TRADE 19
Bauxite/alumina and phosphate rock
for the processing and extraction of alumina. The
world’s largest bauxite deposits are located in Guinea,
Australia, Brazil and Jamaica. In 2011, world production
resulted mainly from the increased production of bauxite
Brazil, China, Guinea, India, Jamaica, Suriname and the
Bolivarian Republic of Venezuela. Bauxite production in
forced production cuts at some mines. World trade in
2015, with most of the increases occurring in Africa,
in particular Morocco. Other new mines are planned
in Australia, Brazil, Namibia, and Saudi Arabia. World
5 years, with the largest increases being in Asia and
South America. Phosphate rock volumes increased by
half of the year. With no substitutes for phosphorus in
agriculture, increased demand for grain and improved
production levels have also contributed to the continued
growth. Growing demand for fertilizers and increased
production by new or expanding plants in producing
countries are expected to sustain growth in phosphate
rock trade.
Dry cargo: minor bulks
In line with developments in the world economy and
2011, growth in minor bulks trade decelerated to
tons achieved in 2007. Exports of metals and minerals
contraction recorded was in sugar volumes, which
cent in 2010. Looking to the future, trade in minor
world economy and the slowdown in steel production
activity, an important source of demand for a number
of minor bulks.
Containerized cargo
2010. According to Clarkson Research Services, total
container trade market during the year.
Global growth in 2011 was limited by the slowdown
recorded on the mainlane East–West trade. As shown
Growth was mainly generated by increased demand
for imports in developing regions, with container trade
volumes expanding strongly on the non-mainlane
East–West, North–South and intraregional lanes. Non-
North–South and intraregional trades expanded by 51 According
to data from Clarkson Research Services, in 2011, the
52
One current opinion maintains that greater
containerization could help generate additional cargo
for container shipping. It is argued that unconventional
commodities can be carried increasingly in containers.
These include, for example, larger volumes of
scrap steel and recycled paper from North America
and Europe to Asia, and general cargo and bulk
commodities that can be transported in smaller batches
and containerized (for example, segments of food
commodities and raw materials). Other commodities
include more refrigerated cargo, chemicals and even
Handysize loads of bulk commodities, such as iron
ore, which is reported to have already been shipped in
small parcels from Africa to China. For these ideas to
materialize, however, prevailing price and cost barriers
need to be removed and cost-effectiveness and vessel 53
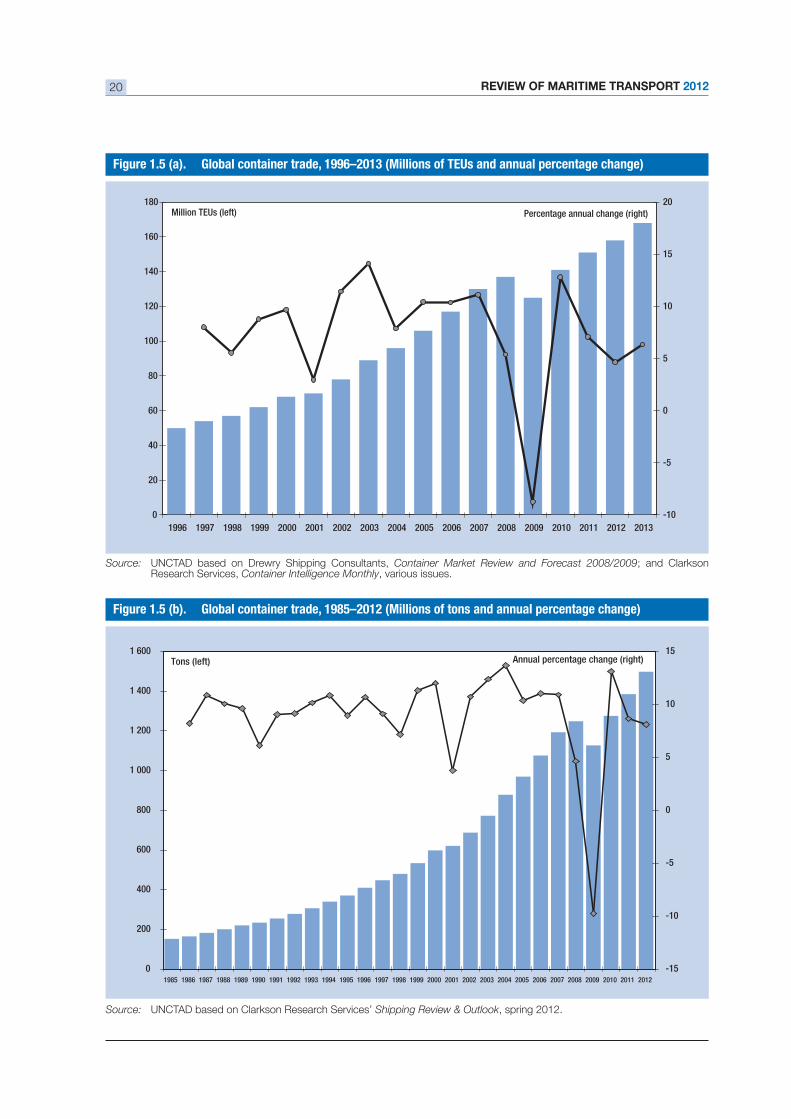
REVIEW OF MARITIME TRANSPORT 201220
0
20
40
60
80
100
120
140
160
180
1996 1997 1998 1999 2000 2001 2002 2003 2004 2005 2006 2007 2008 2009 2010 2011 2012 2013
Million TEUs (left)
-10
-5
0
5
10
15
20Percentage annual change (right)
0
200
400
600
800
1 000
1 200
1 400
1 600
1985 1986 1987 1988 1989 1990 1991 1992 1993 1994 1995 1996 1997 1998 1999 2000 2001 2002 2003 2004 2005 2006 2007 2008 2009 2010 2011 2012
Tons (left)
-15
-10
-5
0
5
10
15Annual percentage change (right)
Source: UNCTAD based on Drewry Shipping Consultants, Container Market Review and Forecast 2008/2009; and Clarkson Research Services, Container Intelligence Monthly, various issues.
Source: UNCTAD based on Clarkson Research Services’ Shipping Review & Outlook, spring 2012.
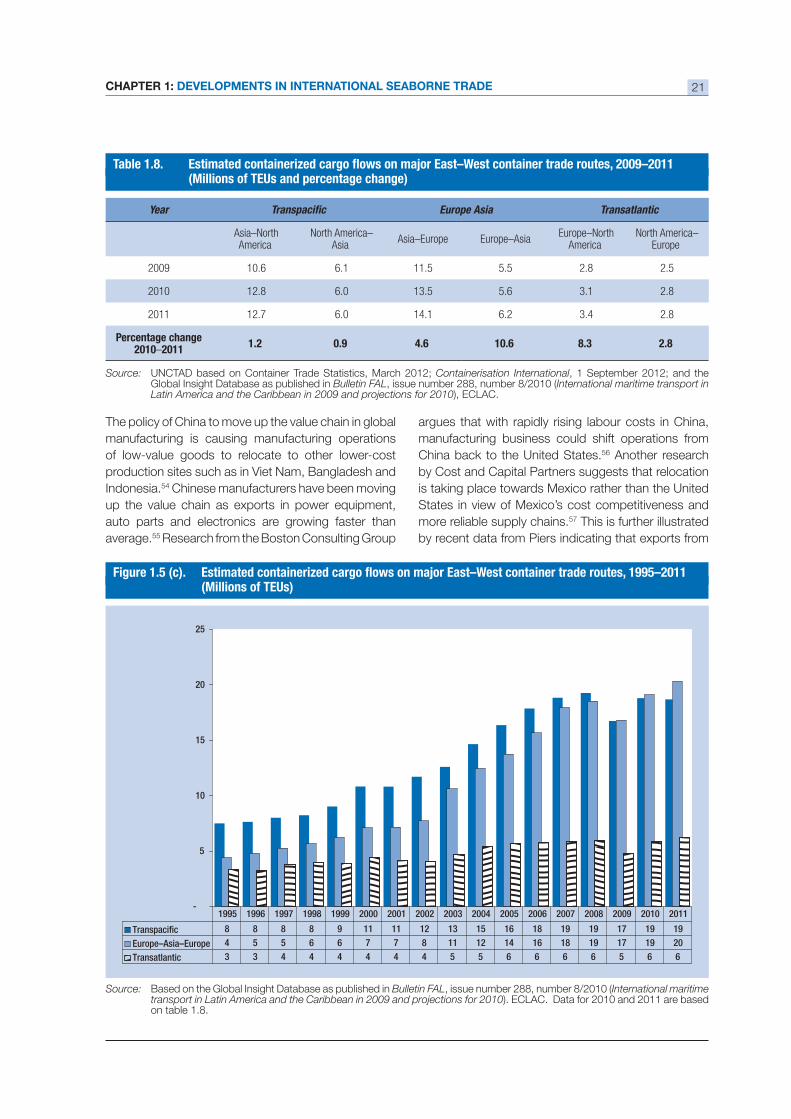
CHAPTER 1: DEVELOPMENTS IN INTERNATIONAL SEABORNE TRADE 21
The policy of China to move up the value chain in global
manufacturing is causing manufacturing operations
of low-value goods to relocate to other lower-cost
production sites such as in Viet Nam, Bangladesh and
Indonesia.54 Chinese manufacturers have been moving
auto parts and electronics are growing faster than
average.55 Research from the Boston Consulting Group
argues that with rapidly rising labour costs in China,
manufacturing business could shift operations from
China back to the United States.56 Another research
by Cost and Capital Partners suggests that relocation
is taking place towards Mexico rather than the United
States in view of Mexico’s cost competitiveness and
more reliable supply chains.57 This is further illustrated
by recent data from Piers indicating that exports from
-
5
10
15
20
25
Transpacific 8 8 8 8 9 11 11 12 13 15 16 18 19 19 17 19 19
Europe–Asia–Europe 4 5 5 6 6 7 7 8 11 12 14 16 18 19 17 19 20
Transatlantic 3 3 4 4 4 4 4 4 5 5 6 6 6 6 5 6 6
1995 1996 1997 1998 1999 2000 2001 2002 2003 2004 2005 2006 2007 2008 2009 2010 2011
Source: Based on the Global Insight Database as published in Bulletin FAL, issue number 288, number 8/2010 (International maritime transport in Latin America and the Caribbean in 2009 and projections for 2010). ECLAC. Data for 2010 and 2011 are based
Source: UNCTAD based on Container Trade Statistics, March 2012; Containerisation International, 1 September 2012; and the Global Insight Database as published in Bulletin FAL, issue number 288, number 8/2010 (International maritime transport in Latin America and the Caribbean in 2009 and projections for 2010), ECLAC.
Year Europe Asia Transatlantic
Asia–NorthAmerica
North America– Asia
Asia–Europe Europe–Asia Europe–North
America North America–
Europe
2009 10.6 6.1 11.5 5.5 2.8 2.5
2010 12.8 6.0 13.5 5.6 3.1 2.8
2011 12.7 6.0 14.1 6.2 3.4 2.8
Percentage change 2010–2011
1.2 0.9 4.6 10.6 2.8
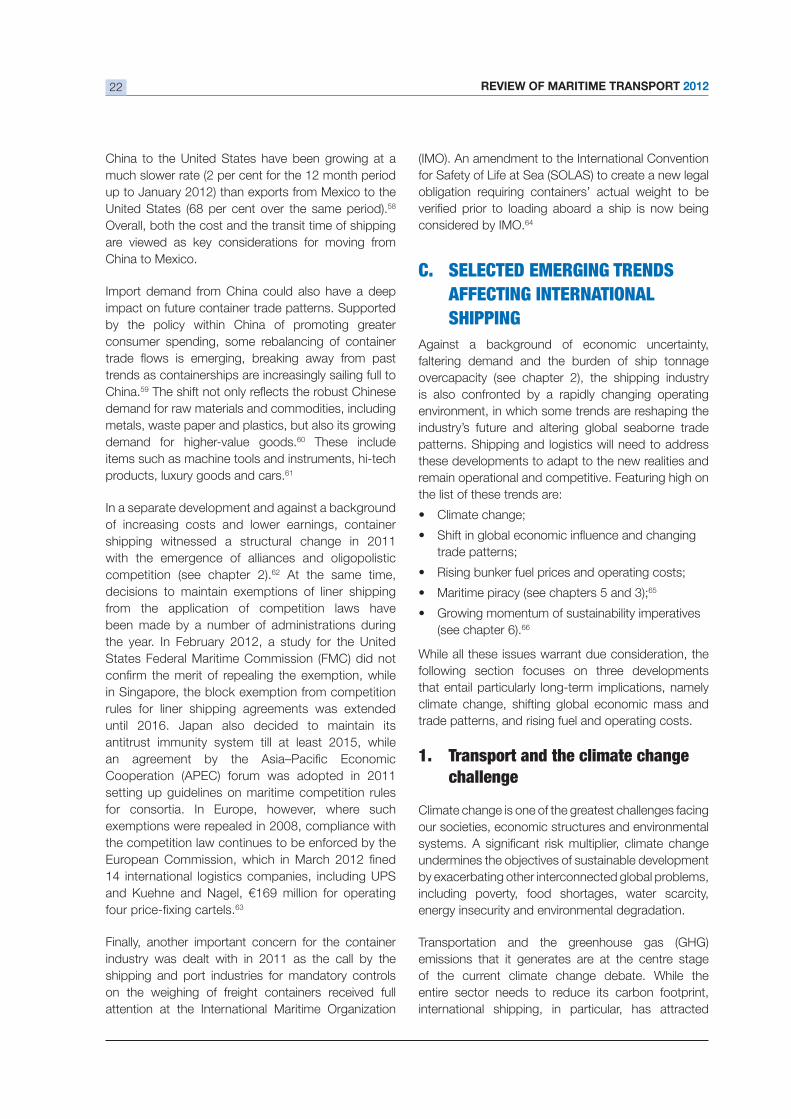
REVIEW OF MARITIME TRANSPORT 201222
China to the United States have been growing at a
up to January 2012) than exports from Mexico to the 58
Overall, both the cost and the transit time of shipping
are viewed as key considerations for moving from
China to Mexico.
Import demand from China could also have a deep
impact on future container trade patterns. Supported
by the policy within China of promoting greater
consumer spending, some rebalancing of container
trends as containerships are increasingly sailing full to
China.59
demand for raw materials and commodities, including
metals, waste paper and plastics, but also its growing
demand for higher-value goods.60 These include
items such as machine tools and instruments, hi-tech
products, luxury goods and cars.61
In a separate development and against a background
of increasing costs and lower earnings, container
shipping witnessed a structural change in 2011
with the emergence of alliances and oligopolistic
competition (see chapter 2).62 At the same time,
decisions to maintain exemptions of liner shipping
from the application of competition laws have
been made by a number of administrations during
the year. In February 2012, a study for the United
States Federal Maritime Commission (FMC) did not
in Singapore, the block exemption from competition
rules for liner shipping agreements was extended
until 2016. Japan also decided to maintain its
antitrust immunity system till at least 2015, while
Cooperation (APEC) forum was adopted in 2011
setting up guidelines on maritime competition rules
for consortia. In Europe, however, where such
exemptions were repealed in 2008, compliance with
the competition law continues to be enforced by the
14 international logistics companies, including UPS
63
Finally, another important concern for the container
industry was dealt with in 2011 as the call by the
shipping and port industries for mandatory controls
on the weighing of freight containers received full
attention at the International Maritime Organization
(IMO). An amendment to the International Convention
for Safety of Life at Sea (SOLAS) to create a new legal
considered by IMO.64
C. SELECTED EMERGING TRENDS
AFFECTING INTERNATIONAL
SHIPPING
Against a background of economic uncertainty,
faltering demand and the burden of ship tonnage
overcapacity (see chapter 2), the shipping industry
is also confronted by a rapidly changing operating
environment, in which some trends are reshaping the
industry’s future and altering global seaborne trade
patterns. Shipping and logistics will need to address
these developments to adapt to the new realities and
remain operational and competitive. Featuring high on
the list of these trends are:
Climate change;
trade patterns;
Rising bunker fuel prices and operating costs;
Maritime piracy (see chapters 5 and 3);65
Growing momentum of sustainability imperatives
(see chapter 6).66
While all these issues warrant due consideration, the
following section focuses on three developments
that entail particularly long-term implications, namely
climate change, shifting global economic mass and
trade patterns, and rising fuel and operating costs.
1. Transport and the climate changechallenge
Climate change is one of the greatest challenges facing
our societies, economic structures and environmental
by exacerbating other interconnected global problems,
including poverty, food shortages, water scarcity,
energy insecurity and environmental degradation.
Transportation and the greenhouse gas (GHG)
emissions that it generates are at the centre stage
of the current climate change debate. While the
entire sector needs to reduce its carbon footprint,
international shipping, in particular, has attracted
CHAPTER 1: DEVELOPMENTS IN INTERNATIONAL SEABORNE TRADE 23
and economic integration with supply chains acting
as transmission channels entail additional costs. A
localized impact on ports can have ripple effects
that extend beyond borders to affect industries,
stakeholders and economies in distant locations.
Although not necessarily driven by climate change,
supply chain disruptions resulting from damage
to ports caused by natural disasters in Japan and
Thailand in 2011 provide a poignant illustration.
The implications of any damage or disruption to
transport networks, including ports, can be particularly
challenging for the transport and trade of developing
countries such as small island developing States
(SIDS). The challenge for SIDS is of greater magnitude
given their high economic, geographic and climatic
vulnerabilities and their generally limited adaptive
capacity.69 In this context, building the capacities of
developing countries, including SIDS, with a view to
reducing their vulnerability and managing disaster
risks is crucial and should be pursued as a matter of
priority.70
Assessing with any certainty the costs for ports
and their hinterland connections associated with
no doubt, however, that these impacts can reach
extreme proportions in ports and port cities.71 A
study by OECD assessed the exposure of the world’s
estimated the total value of assets exposed across all
136 port cities examined to be $3 trillion.72 A more
recent study examining the same 136 port megacities
has found that, assuming a sea-level rise of 0.5 metres
by 2050, the value of exposed assets may be as high
as $28 trillion.73 These costs are rising in tandem
with ever increasing urbanization, population growth,
investment in port and transport infrastructure, and
wealth expansion around coastal areas.
Against this background, the case for designing and
implementing appropriate adaptation strategies to
address climate-change impacts on transport, and
long lifetime of transport infrastructure, adaptation 74
However, a review of the available literature reveals
that adaptation action in ports appears to be scarce.75
Over recent years, various studies have addressed
the impacts of climate change on transportation
infrastructure generally, for example in the case of
the United States,76 Canada, Australia and the United
Kingdom. Most of these studies, however, are not
attention because the GHG emissions generated
by this sector are not covered under the United
Nations Framework Convention on Climate Change
(UNFCCC). Another reason for this heightened interest
is the renewed opportunity provided by the current
climate negotiations under UNFCCC and IMO to
Some regulatory measures focusing on technical and
operational aspects of international shipping have
recently been adopted by IMO while other measures,
such as market-based instruments, are still being
considered (see chapters 5 and 6). Mitigation action
is also gathering momentum among the shipping
and port industries with a number of measures
being planned or having already been implemented
(see chapter 6). However, although mitigation action
effectively address climate change and its related
on a good understanding of risks and vulnerabilities is
fundamental to help minimize the effects of unmitigated
climate change on transport and trade. While
adaptation action in maritime transport is increasingly
recognized as important, it should be noted that it is
a newcomer to the climate change policy debate and
has so far attracted much less interest than mitigation.
Within the transport sector, the special case of
of world trade by volume being carried by sea,
chains and constitute engines of economic growth.
At the same time, these key infrastructural assets are
vulnerable to climate change impacts and associated
risks, given their location in coastal zones, low-lying
areas and deltas.
Risks for maritime transport include accelerated
coastal erosion, port and coastal road inundation or
increased dredging, restrictions on access to docks,
deterioration of conditions and problems with the
structural integrity of pavements and railway tracks
within port areas and related hinterland connections.67
In addition to these impacts on physical infrastructure,
climate change also affects shipping volumes and
costs, cargo loading and capacity, sailing and/
or loading schedules, storage and warehousing.68
These impacts are likely to impose costs that will be
correlated to the degree of exposure and vulnerability,
as well as constraints on the adaptive capacity.
Furthermore, greater global interconnectedness
REVIEW OF MARITIME TRANSPORT 201224
to transport or ports, a study produced by the World
Bank estimates that, for developing countries, the
cost of adapting to an increase in temperature by
approximately 2° C by 2050 would be, for the period
annually.82
transportation, based on the Intergovernmental
scenarios SRES B283 and SRES A2, indicate that by
2050 the total impact of climate change on international
A2).84 The costs for maritime transportation alone
(SRES A2).85 Another study has estimated the total
costs of climate change for international transportation
respectively,86 while for maritime transport, estimates
87
of the effects on frictions to international trade and
development are expected to outweigh the costs.88
One study which compared the cost of adaptation
with the cost of inaction at the European Union level
89
Some of these critical considerations have been
considered as part of the activities of UNCTAD aimed
at addressing the climate change challenge from the
maritime transport perspective.90 These include the
Transport and Trade Facilitation, which had as title
Maritime Transport and the Climate Change Challenge,
the 2010 Joint UNECE-UNCTAD Workshop on
Climate Change Impacts on International Transport
Networks, the 2011 UNCTAD Ad Hoc Expert Meeting
entitled Climate Change Impacts and Adaptation: A
Challenge for Global Ports, and the new book entitled
Maritime Transport and the Climate Change Challenge,
edited by UNCTAD and co-published by the United
Nations and Earthscan/Routledge in May 2012.91
Some of the key messages emerging from this work
include the wide recognition that adaptation action
ports.77 Within the existing literature available in the
public domain, the United States report, Impacts of
Climate Change and Variability on Transportation
Systems and Infrastructure: Gulf Coast Study,
Phase I, is of particular relevance for ports and their
hinterland connections.78 Other studies worth noting
include the report commissioned by the International
Finance Corporation (IFC), which focuses on the case
in Cartagena, Colombia. The aim of this study was
to help develop knowledge, tools and methods for
analysing climate-related risks and opportunities, and
is the study commissioned by the International
Association of Ports and Harbours (IAPH), Seaports
and Climate Change – An Analysis of Adaptation
Measures.79
While adaptation strategies in ports may vary
(for example, retreat/relocate, protect, and/or
the resilience of facilities and systems. This may be
achieved by, for example, changes in operations,
management practices, planning activities, design
integrating climate change considerations into
transport and port investment and planning decisions,
as well as into broader transport and port design
and development plans. A number of factors could,
nevertheless, potentially delay or pose challenges to
adaptation action. Firstly, as ports involve multiple
players in the decision-making process, it may be
and strategies.80 Secondly, factors such as a high
perception of uncertainty, limited information about
the cost-effectiveness of adaption options and about
the cost of inaction, the need for realistic predictions of
impacts and for science-based policy formulation that
and resource intensiveness and costs could all, either
individually or in combination, hamper adaptation
action in ports.
adaptation action. Existing studies on adaptation
costs provide only a wide range of estimates and
have many information gaps. Much more knowledge
and how they interact, and regarding information on
relevant adaptation options.81

CHAPTER 1: DEVELOPMENTS IN INTERNATIONAL SEABORNE TRADE 25
pursued without delay, and that adaptation planning
for those impacts that are already known should be a
priority. Furthermore, collaboration between scientists,
engineers, policy makers, governments and industry
more data, in particular data on local impacts and
vulnerabilities, and conducting cases studies and pilot
to continue and guidance as well as best practices
should be compiled and widely disseminated.
To sum up, climate change impacts on ports and
their hinterland connections and related adaptation
implications for trade and growth. While more work
is needed to help advance understanding of the
various issues at stake and better assess their full
implications, adaptation action in transport generally
and, especially, in ports, is an imperative and a sound
investment with high returns in the long term.
and changing trade patterns
Over the past few years developing countries have been
implications for the global economy, geopolitics and
international trade. The 2008/2009 crisis has deepened
economies to emerging developing countries. This trend
is creating a multipolar global economy92 (see previous
discussion on a global new design in the Review of
Maritime Transport 2011, section C).
economies and transition economies, led by China,
2011 and 2025, with Brazil, China, India, Indonesia, the
Republic of Korea and the Russian Federation expected 93
By comparison, GDP growth in advanced economies
cent) over the same period.94 The share of merging
developing economies in global real GDP is forecast
in 2025.95 In line with economic growth, the share of
has also increased over the past few decades, rising
in 2010. Much of this growth is being generated by
South–South and intraregional trade.96
Some observers argue that the winner of globalization
will be Asia, with rising intra-Asian trade becoming
the focus of the global economy. South–South
interregional trade is also expected to grow and gather
momentum.97 Supply chains, greater integration in the
world economy, growing regional concentration and a
shift of technology will all propel East Asian countries
(led by China) to become the largest trading bloc in
2015, surpassing the areas of the North American
Free Trade Agreement (NAFTA) and the Euro.98 Such a
development will have tangible implications for global
transport and trade patterns. One recent analysis
predicts that in 2015 China will be the top exporter
and importer and that by 2030 the world’s largest
trade corridor will not involve the United States or
Europe, but will instead extend from the advanced
to the emerging Asia of Thailand and Viet Nam.99
from advanced Asia will go to emerging Asia, thus
reinforcing the move eastwards and South–South
trade.100
freight transport is expected to expand. It has been
will be from two to four times above their 2010 levels,
expected to be between two and six times higher
than in 2010.101 This has implications for international
appropriate policies and strategies be elaborated to
effectively respond to the new realities. All shipping
market segments are likely to be affected through
legal and regulatory frameworks. For its part, the
transport and logistics industry is also making efforts
to ensure that it remains relevant and maintains a
competitive edge by being more responsive to the
needs of its customers. This is illustrated by the
increasing tendency within this industry to reach out
to its customer base to solicit its input and help map 102
To better understand the full impact of the changing
global transport and trade landscape, a number
addressed. Relevant considerations include how
shipping energy consumption patterns and carbon
emissions, production processes, decisions about
production plant location and infrastructure investment
will all be affected.
REVIEW OF MARITIME TRANSPORT 201226
3. Rising bunker fuel prices andoperating costs
Bunker fuel prices increased in tandem with global
oil prices, as shown by the price of 380 centistokes
reach $647 per ton in 2011. Higher fuel costs have a
disproportionate effect on transportation companies,
as fuel is a necessary cost input. Fuel costs are
earnings on the benchmark very large crude carrier
(VLCC) Western Asia to Far East voyage – taking an
average bunker price of $630 per ton for March 2011.
this in perspective, in 2008 the annual capital cost
103
In addition to fuel expenses, other cost items are also
increasing. Drewry estimates that ship-operating costs
the market segment. This has been due to increases
in commodity prices, which drove up lube, repair and
maintenance costs, as well as to additional insurance
cover against piracy.104 These developments have
has been, in addition, struggling with excess tonnage
capacity, slowing demand and falling freight rates. In
the tanker market, for example, the Republic of Korean
costs, low freight rates and the costs associated
with piracy attacks against its vessels.105 In the liner
industry, the overall loss in 2011 was estimated at over 106
In a context of increasingly higher costs and weak
is becoming important. Relevant cost-cutting
measures include speed management through slow
selection of the most economical routing options.
Among these strategies, slow steaming has evolved
into a key cost-cutting measure that reduces bunker
fuel consumption and helps absorb capacity. Today,
slow steaming is implemented across various market
segments and in particular container trade, which
relied heavily on this strategy during the 2008/2009
on a number of mainlane trades107 and has continued
to reduce sailing speed from 24–25 knots to 21 knots
(slow steaming), 18 knots (extra-slow steaming) and
15 knots (super-slow steaming).108 In the tanker
trade, slow steaming has been implemented with
most voyages occurring at an average of 13 knots
(compared to 14 knots), and 10–11 knots when
sailing in ballast (see also previous section on crude
oil shipments and chapter 2).109
Some argue that slow steaming has its limitations
and that it may not be advisable to implement it in all
cases. First, slow steaming may be better limited to a
few long-haul routes and not used for short-haul ones.
Second, there is a need to assess the implications of
Furthermore, increased transit time, especially for
the dominant leg, may not be acceptable for supply
chains, as shown by a study investigating the merits of
slow steaming.110 This study argued that other factors
need to be accounted for, including the auxiliary
bunker costs and the sensitivity of demand to transit
time. Figures for January 2010 indicated a limited
use of slow steaming on the Europe–South American
services operating slow steaming on those between
Europe and the Far East. The study concludes that a
differentiated strategy by shipping lines of sailing at a
different speed depending on the leg, or of using hubs
instead of direct services maybe recommended. Such
differentiated strategy would also take into account
the sensitivity of demand to transit time, such as, for
example, by distinguishing between frozen and dry
and fresh products.
While slow steaming is viewed by many as a short-term
of current developments in the energy sector, growing
demand, constrained and uncertain supply, as well
as ongoing geopolitical risks affecting oil producing
regions, oil prices and therefore bunker fuel costs will
not doubt continue to trend upward.111 Interestingly
however, the historical correlation between bunker
and crude prices seems to have changed slightly in
2011, as the rise in bunker prices exceeded that of
crude oil. A potential reason for this could be that the
large ship deliveries of recent years have increased
demand for marine fuels against a slower supply.112
CHAPTER 1: DEVELOPMENTS IN INTERNATIONAL SEABORNE TRADE 27
maximize the middle distillates output have reduced
marine fuels is the combination of increased demand
for petroleum products from Japan that followed the
disaster in March 2011 and the cuts in oil supply from
Libya during the course of the year.113
2030, with almost all the growth being generated in
developing regions.114
energy at affordable prices will be available to match
uncertain (see Review of Maritime Transport 2011,
for a detailed discussion of oil supply and demand
fundamentals). It is worth noting in this respect that
global replacement costs of existing fossil fuel and
nuclear power infrastructure are estimated at $15
115 Geopolitical risks
and tensions, including economic sanctions, civil
side. Some observers forecast that the price of crude
oil will reach extreme levels if current geopolitical risks
escalate and if strategic transit points for oil trade are
closed. According to Drewry Supply Chain Advisors,
the next three years on trade between South China
and Northern Europe.116
IMO International Convention for the Prevention of
Pollution from Ships (MARPOL) annex VI, governing
air pollution and Emission Control Areas (ECAs) in the
European Union and North America, for ships to use
between now and 2020 to burn a more expensive
but less polluting fuel, namely distillate grade fuel.
The price differential with residual fuel is currently
use technology such as cleaning systems for exhaust
gas (scrubbers), the effective widespread use of such
scrubbers remains uncertain. These developments
raise concerns about their potential economic impact
on shipping, especially at a time when fuel costs
account for more than two thirds of operational ship
expenditure. The price differential between low-
increase further with growing demand not being
matched by increased supply. Other concerns relate
to the potential for inducing an undesirable modal
shift. Recent studies supported by the European
Community Shipowners’ Associations (ECSA) have
sulphur fuel could result in a modal shift from water to
surface transport which could be detrimental for local
shipping and the environment. This concern is shared
with respect to trade in the Great Lakes of Canada
and the United States.
To sum up, rising energy prices and fuel costs remain
a great challenge for the shipping industry in view, in
particular, of rising demand, supply pressures and
increasing environmental regulation. Cost control
and fuel consumption management is essential
and may involve a range of strategies. These may
include speed management through slow steaming,
selection of the most economical routing options
and technology-based solutions. These strategies
will impact on the design of vessels and propulsion
systems, as well as on other technology-related
strategies and operational measures. While these may
apply differently, depending on the vessel and type of
operations, overall a combination of technology-based
to help address rising fuel and operational costs. As
optimize fuel consumption, in view in particular of the
more stringent environmental regulatory framework
and given the concerns over climate change, new
options and solutions are being increasingly developed
and tested.
The trends discussed above are all interconnected
and entail both challenges and opportunities for
the shipping industry. By altering costs, prices and
comparative advantages, these developments and
related impacts on shipping and seaborne trade can
greatly determine countries’ trade performance and
competitiveness. Improved understanding of these
issues and their impacts, both individually and in
all stakeholders, including policy makers, investors,
transport planners, operators and managers.
REVIEW OF MARITIME TRANSPORT 201228
ENDNOTES
1 This sections draws also from: World Bank (2011). Global Development Horizons 2011. Multipolarity: The New Global Economy; World Bank (2012). Global Economic Prospects: Uncertainties and vulnerabilities. Volume 4. January; Lanzeni ML (2012). Emerging Markets, Fad or New Reality? Deutsche Bank Research. April; United Nations
World Economic Situation and Prospects. No World Economic
Situation and Prospects. No 38. 20 December; United Nations Department of Economic and Social Affairs (2012). World Economic Situation and Prospects. No 43. 29 May.
2 For a more comprehensive overview of world economic developments, see UNCTAD Trade and Development Report, 2012. www.unctad.org.
3 UNCTADstat, Nominal and real GDP, total and per capita, annual, 1970–2010. http://unctadstat.unctad.org/TableViewer/tableView.aspx?ReportId=96.
4 Economist Intelligence Unit (EIU) (2012). Country Forecast. Global Outlook. June.
5 Ibid.
6 World Economic Situation and Prospects. No 43. 29 May.
7 Ibid.
8 United Nations Department of Economic and Social Affairs (2012). World Economic Situation and Prospects, Update as of mid-2012. United Nations. New York.
9 Ibid.
10 Ibid.
11 World Trade Organization (WTO) (2012). World trade 2011, prospects for 2012. PRESS/658, 12 April.
12 Ibid.
13 Economist Intelligence Unit (EIU) (2012). Country Forecast. Global Outlook. June.
14 International Monetary Fund (IMF) (2012). World Economic Outlook. Growth Resuming, Dangers Remain. World Economic and Financial Surveys (WEFS); Economist Intelligence Unit (EIU) (2012). Country Forecast. Global Outlook. June.
15 Ibid.
16 Ibid.
17 World Trade Organization (WTO) (2012). Report on G-20 Trade Measures (Mid-October 2011 to Mid-May 2012). Executive Summary.
18 Ibid.
19 Ibid.
20 Data and information in on seaborne trade draw from relevant UNCTAD statistics and reports as well as on various specialized sources, including: (1) British Petroleum (BP) (2012). Statistical Review of World Energy 2012. June; (2) International Energy Agency (IEA) (2011). World Energy Outlook 2011; (3) British Petroleum (BP) (2012). Energy Outlook 2030. January; (4) International Energy Agency (IEA). Oil Market Report. Various issues; (5) Organization of the Petroleum Exporting Countries (OPEC) (2012). Monthly Oil Market Report. June; (6) Organization of the Petroleum Exporting Countries (OPEC) (2011). World Oil Outlook; (7) Economist Intelligence Unit (EIU) (2012). World Commodity Forecasts: Industrial Raw Materials. May; (8) Economist Intelligence Unit (EIU) (2012). World Commodity Forecasts: Food, Feedstuffs and Beverages. May; (9) World Steel Association (2012). World Steel Short Range Outlook. April; (10) International Grains Council (IGC) (2012). Grain Market Report. April; (11) Clarkson Research Services (2012). Shipping Review & Outlook. Spring; (12) Clarkson Research Services (2011). Shipping Review & Outlook. Fall; (13) Clarkson Research Services. Container Intelligence Monthly. Various issues; (14) Clarkson Research Services. Dry Bulk Trade Outlook. Various issues; (15) Lloyd’s Shipping Economist (LSE). Various issues; (16) Drewry Shipping Consultants (2012). Container Forecasters – Quarterly Forecast of the Container Market. September; (17) Drewry Shipping Consultants. Drewry Shipping Insight. Monthly Analysis of the Shipping Markets. Various issues; (18) Institute of Shipping Economics and Logistics (ISL). Shipping Statistics and Market Review. Various issues; (19) Dynamar. DynaLiners. Various issues; (20) IHS Fairplay. Various press articles; (21) BIMCO Bulletins. Various issues; (22) ICS/ISF Annual Review 2012; (23) United States Geological Survey (2012). Mineral Commodity Summaries; (24) Organization for Economic Co-operation and Development (OECD)/International Transport Forum (ITF) (2012). Transport Outlook Seamless Transport for Greener Growth; (25) Deutsch Bank Research (2012). On the Record. Prof. Burkhard Lemper on global shipping markets, May 14; (26) Barry Rogliano Salles (BRS) (2012). Shipping and shipbuilding markets, Annual Review 2012; (27) Seatrade (2011). Issue 6. December; (28) Slater P (2012). No end in sight for the great shipping recession. Lloyds’ List. 3 May; (29) Leander T (2012). Global shipping earnings to contract 5%–10% in 2012. Lloyd’s List. 31 May; (30) Slater P (2012). CMA 2012: Bleak Outlook for Shipping. Lloyd’s List. 19 March.
CHAPTER 1: DEVELOPMENTS IN INTERNATIONAL SEABORNE TRADE 29
21 Lloyd’s List Maritime Intelligence Unit (LLMIU) as published on the website of the World Shipping Council’s (WSC) at www.worldshipping.org.
22 Estimated by Lloyds List Maritime Intelligence Unit (LLMIU), June 2012.
23 This sections draws mainly from Clarkson Research Services (2012). Shipping Review & Outlook. Spring; Clarkson Research Services (2011). Shipping Review & Outlook. Fall; Mantell C (2012). Variety is the Spice of Life: Regional Crude Sourcing. Clarkson Shipping Intelligence Network. 27 April.
24 Clarkson Research Services (2012). Is Trade Giving Enough Mileage? World Fleet Monitor-Flag, Class, Ownership, Investment, Recycling, Markets, Trade. Volume 3 No. 3. March.
25 Holden S(2012). Global Coal Flows: A Growing Imbalance? Clarkson Shipping Intelligence Network. 24 February.
26 Ibid.
27 Clarkson Research Services (2012). Is Trade Giving Enough Mileage? World Fleet Monitor-Flag, Class, Ownership, Investment, Recycling, Markets, Trade. Volume 3 No. 3. March.
28 Mantell C (2012). Variety is the Spice of Life: Regional Crude Sourcing. Clarkson Shipping Intelligence Network.
29 Ibid.
30 Ibid.
31 Marsoft (2012). Marsoft Tanker Market Report. January.
32 Ibid.
33 Ibid.
34 This section draws mainly from: United Nations Department of Economic and Social Affairs (2012) World Economic Situation and Prospects. United Nations Publications. New York; Economist Intelligence Unit (EIU) (2012). Country Forecast. Global Outlook, June; Economist Intelligence Unit (EIU) (2012). World Commodity Forecasts: Industrial Raw Materials; Shipping & Finance (2012). Australia to become the world’s largest gas exporter in 2030. March; Shipping & Finance (2012). How China will evolve until 2030. March; Shipping & Finance (2011). Asia to consume two-thirds of global LNG supplies by 2015. October; Shipping & Finance (2011). Is US going to cause another oil shock to the tanker market? November; Shipping & Finance (2012). LNG Shipping: From Bottom to the Top. March Clarkson Research Services (2012). Tanker Outlook. May; Clarkson Research Services (2012). Oil & Tanker Trades Outlook. Volume 17,
LNG Trade & Transport 2011. A comprehensive overview of the ships, the trades and the markets for LNG; Organization of Petroleum Exporting Countries (OPEC) (2011). World Oil Outlook 2011; Barry Rogliano Salles (BRS) (2012). Shipping and shipbuilding markets, Annual Review 2012; Mantell C (2012). Anxious Times: Fear and Supply in the Crude Market. Clarkson Shipping Intelligence NetworkC (2012). Disaster and Recovery: Japanese Oil Trade in 2011. Clarkson Shipping Intelligence NetworkBIMCO Bulletin (2011). Volume 106 #6; Mühlberger M (2012). Sub-Saharan Africa: the Continent of the 21st Century. Deutsche Bank. April; Chan, C. (2011). VLs shouldn’t rely on China for extra demand. Fairplay. 15 December; Brown H (2012). Norway and Russia to ride fourth wave of LNG exports. Lloyd’s List. 22 March; Brown H (2012).Venezuela-China deal boosts VLCC demand. Lloyd’s List. 24 May; Chan C (2011). Tanker operators assess changing trade patterns as new oil sources come on stream. Fairplay. 15 December; Brown H (2011). Exporters turned importers drive new LNG demand. Lloyd’s List. 16 September; Osle D (2012). Venezuela’s ties to China boost VLCC demand. Lloyd’s List. 26 March.
35 This section draws mainly from British Petroleum (BP) (2012). Statistical Review of World Energy 2012.
36 See for example, Brown H (2012).Venezuela-China deal boosts VLCC demand. Lloyd’s List. 24 May; Chan C (2011). Tanker operators assess changing trade patterns as new oil sources come on stream. Fairplay. 15 December; Osle D (2012). Venezuela’s ties to China boost VLCC demand. Lloyd’s List. 26 March.
37 Chan C (2011). VLs shouldn’t rely on China for extra demand. Fairplay. 15 December.
38 Mühlberger M (2012). Sub-Saharan Africa: the Continent of the 21st Century. Deutsche Bank. April.
39 Chan C (2011). VLs shouldn’t rely on China for extra demand. Fairplay. 15 December.
40 Shipping & Finance (2011). Is US going to cause another oil shock to the tanker market? November; Shipping& Finance (2012). LNG Shipping: From Bottom to the Top. March.
41 Brown H (2012). Norway and Russia to ride fourth wave of LNG exports. Lloyd’s List. 22 March;
42 Ibid.
43 U.S. Geological Survey (2012). Bauxite and Alumina Statistics and Information. Mineral Commodity Summaries; U.S. Geological Survey (2012). Phosphate Rock Statistics and Information. Mineral Commodity Summaries; Shipping & Finance (2011). Brazil’s trade with China 45% up causing port problems; Shipping & Finance (2012). China’s reliance on imported ores to ease. April; Clarkson Research Services (2012). Shipping Review & Outlook, Spring. Clarkson Research Services (2011). Shipping Review & Outlook, Fall; World Steel Association (2012). Global economic outlook and steel demand trends. April; Economist Intelligence Unit (EIU) (2012). Global World Commodity Forecasts: Food, Feedstuffs and Beverages. June; Economist Intelligence Unit (EIU) (2012). World Commodity Forecasts: Industrial Raw Materials. June; International Energy Agency (IEA) (2011). World Energy
REVIEW OF MARITIME TRANSPORT 201230
Outlook 2011. November. British Petroleum (BP) (2012). Statistical Review of World Energy 2012.June; Fairplay ). Metal Smelting: A Major Driver
Under Pressure. Clarkson Shipping Intelligence Network. 10 February; de Groot, B. (2012). Bolting the door on Valemaxes. Fairplay. April; Van den Berg, E. (2012). Seaborne coal trade will top 1 trillion tonnes by 2016. Lloyd’s List. 30 March.
44 Hutson T (2011). Coal boom seeks new port. Fairplay. 27 October.
45 Van den Berg E (2012). Seaborne coal trade will top 1trn tonnes by 2016. Lloyd’s List. 30 March.
46 Economist Intelligence Unit (EIU) (2012). World Commodity Forecasts: Industrial Raw Materials. June.
47 Fairplay (2011). Indonesia’s coal export dilemma. 17 November.
48 See for example, Fairplay (2012). China is key to world coal balance. 5 January.
49 Shipping & Finance (2012). China-Brazil bilateral trade soars. April.
50 Ibid.
51 Clarkson Research Services. Container Intelligence Monthly. October 2012.
52 Ibid.
53 Fairplay (2012). Containers may aid recovery. 23 Feb.
54 Van Marle G (2012). Box lines’ China trade could be swamped by a Mexican wave. Lloyd’s List. March.
55 Leander T (2012). China feels the pinch. Lloyd’s List. 22 May.
56 Van Marle G. Box lines’ China trade could be swamped by a Mexican wave. Lloyd’s List. March.
57 Ibid.
58 Ibid.
59 Porter J (2012). China’s hunger for imports reshapes east-west trade patterns. Lloyd’s List. 20 June.
60 Ibid.
61 Ibid.
62 Clayton R (2011). Outside the box. Fairplay. 22 December.
63 European Commission Press Release (2012). . IP/12/314. 23 March. http://europa.eu/rapid/pressReleasesAction.
do?reference=IP/12/314.
64 Ports & Harbors. Looking back at 2011 it seems we have seen more negatives than positives. January/February 2012.
65 See also UNCTAD Review of Maritime Transport 2011, Chapter 1, Section C.
66 Ibid.
67 UNCTAD (2011). Ad Hoc Expert Meeting on Climate Change Impacts and Adaptation: A Challenge for Global Ports. Information Note. 29 September. UNCTAD/DTL/TLB/2011/2.
68 Ibid.
69
UNCTAD available at www.unctad.org/ttl/legal. See in particular relevant documents and information relating to the Multi-year Expert Meeting on Transport and Trade Facilitation: Maritime Transport and the Climate Change Challenge, 2009; Joint UNECE–UNCTAD Workshop on Climate Change Impacts on International Transport Networks, 2010; Ad Hoc Expert Meeting on Climate Change Impacts and Adaptation: A Challenge for Global Ports, 2011; and, Maritime Transport and the Climate Change Challenge, a new book edited by UNCTAD and co-published by the United Nations and Earthscan/Routeledge in May 2012. The book offers information and analysis on the climate change challenge from the perspective of maritime transport and trade.
70 Vulnerability reduction is a core common element of adaptation and disaster risk management. See for example, the special report of the Intergovernmental Panel on Climate Change (2012) entitled and Disasters to Advance Climate Change Adaptation, Cambridge University Press, New York.
71
change and other drivers. Maritime Transport and the Climate Change Challenge. Earthscan/United Nations, London.
72 Nicholls R J et al (2008). Estimates. OECD Environment Working Papers, No. 1. OECD Publishing.
73 Lenton T, Footitt A and Dlugolecki A (2009). Major Tipping Points in the Earth’s Climate System and Consequences for the Insurance Sector.
74 Kopp A (2012). Transport costs, trade and climate change. Maritime Transport and the Climate Change Challenge. Earthscan/United Nations, London, 2012. See also, UNCTAD (2011). Ad Hoc Expert Meeting on Climate Change Impacts and Adaptation: A Challenge for Global Ports. Information Note. 29 September. UNCTAD/DTL/TLB/2011/2.
CHAPTER 1: DEVELOPMENTS IN INTERNATIONAL SEABORNE TRADE 31
75 Velegrakis AF (2011). transport infrastructure and networks. DRAFT Report for consideration and discussion by the Expert Group on Climate Change Impacts and Adaptation for International Transport Networks at its second session (8 November 2011). Informal document No. 2. 4 November.
76 See for example, the 2008 Special Report 290 of the Transportation Research Board, National Academy of Sciences, Washington, DC, entitled “The Potential Impacts of Climate Change on U.S. Transportation”. See in particular, Appendix C containing a commissioned paper on Climate Vulnerability and Change with Implications for U.S. Transportation, December 2006.
77 Ibid.
78 U.S. Climate Change Science Program and Subcommittee on global Change Research (2008). Impacts of Climate Change and Variability on Transportation Systems and Infrastructure: Gulf Coast Study, Phase I. [Savonis MJ, Burkett VR and Potter JR (eds.)]Department of Transportation, Washington, DC.
79 Seaports and Climate Change - An Analysis of Adaptation Measures. (2010). Study commissioned by the International Association of Ports and Harbors (IAPH)-Port Planning and Development Committee. Unpublished Draft, November 2010.
80 Asam S (2010). Climate change Adaptation for Transportation Infrastructure. ICF International. March 2. North Carolina Workshop on Climate Change Adaptation.
81 Fankhauser S (2009). The Cost of Adaptation
82 World Bank (2010). The Economics of Adaptation to Climate Change (EACC) Synthesis Report.
83 The IPCC published a new set of scenarios in 2000 for use in the Third Assessment Report (Special Report on Emissions Scenarios - SRES). A2 storyline and scenario family: a very heterogeneous world with continuously increasing global population and regionally oriented economic growth that is more fragmented and slower than in other storylines. B2 storyline and scenario family: a world in which the emphasis is on local solutions to economic, social, and environmental sustainability, with continuously increasing population (lower than A2) and intermediate economic development.
84 United Nations Economic Commission for Latin America and the Caribbean (2011). An Assessment of the Economic Impact of Climate Change on the Transportation Sector in Barbados. LC/CAR/L.309. 22 October.
85 Ibid.
86 United Nations Economic Commission for Latin America and the Caribbean (2011). An Assessment of the Economic Impact of Climate Change on the Transportation Sector in Montserrat.
87 Ibid.
88 Kopp A (2012). Transport costs, trade and climate change. Maritime Transport and the Climate Change Challenge. Earthscan/United Nations. London.
89 Richards JA and Nicholls RJ (2009). Impacts of climate change in coastal systems in Europe. PESETA-Coastal Systems study. European Commission Joint Research Centre Institute for Prospective Technological Studies.
90
www.unctad.org/ttl/legal. See also relevant documents and outcome of the International Conference on Adaptation of Transport Networks to Climate Change organized by the UNECE and held on 25-26 June 2012 in Greece (http://
91
potential implications of climate change for this key sector of global trade. It includes contributions from experts from academia, international organizations - such as the IMO, the UNFCCC secretariat, OECD, IEA and the World Bank - as well as the shipping and port industries. For further information see www.unctad.org/ttl/legal.
92 World Bank (2011). Global Development Horizons 2011-Multipolarity: The New Global Economy.
93 Ibid.
94 Ibid.
95 Ibid.
96 Ibid.
97 Shipping & Finance (2012). International trade to accelerate from 2014. March.
98 Shipping & Finance (2011) Analysis on the changing patterns of global trade. August 2011.
99 McMahon, L. (2012). Shipping may seem downbeat and dreadful but better times lie ahead. Lloyd’s List.31 May.
100 Ibid.
101 Organization for Co-operation and Economic Development (OECD)/International Transport Forum (ITF) (2012). Transport Outlook Seamless Transport for Greener Growth. .
102 See for example, Deutsche Post AG. Delivering Tomorrow, Customer Needs in 2020 and Beyond A Global Delphi Study. June 2009.
REVIEW OF MARITIME TRANSPORT 201232
103 Shipping & Finance (2011). Bunker costs up 5 times in a decade. August.
104 Containerisation International. October.
105 Taib A (2011). Rising Bunkers Put Shipping Companies on Edge. Bunker World.
106 Porter J (2012). Box lines’ 2011 losses balloon to $6bn. Lloyd’s List. April.
107 Lloyd’s List. March.
108 Lloyd’s List. April.
109 Barry Rogliano Salles (BRS) (2012). Shipping and shipbuilding markets. Annual Review 2012.
110 Cheaitou A and Cariou P (2011). application to Northern Europe-South America Trade. IAME Conference 2011, 25–28 October.
111 Deutsche Post AG (2009). Delivering Tomorrow Customer Needs in 2010 and Beyond. A Global Delphi Study. June.
112 Clarkson Research Services (2011). Shipping Review & Outlook. Spring.
113 BIMCO Bulletin 2011. Volume 106 # 6.
114 British Petroleum (2012). Energy Outlook 2030. January.
115 United Nations Department of Economic and Social Affairs (2011). The Great Green Technological Transformation Overview. World Economic and Social Survey 2011.
116 IFW News (2011). Asia-Europe bunker rates still on the rise. 24 March.
This chapter presents the supply-side of the shipping industry. It covers the vessel
reviews deliveries, demolitions and tonnage on order.
continued deliveries and a drastic downturn in new orders following the economic crisis has led to a reduction in the world order book by one third during the same period. The
are reluctant to cancel or postpone deliveries. China, Japan and the Republic of Korea
important employment in their shipyards. The resulting oversupply of ships represents a serious challenge for shipowners. Importers and exporters, on the other hand, potentially
Developing countries continue to expand their market share in different maritime sectors, including shipbuilding, ownership, registration, operation, scrapping and manning. One
STRUCTURE, OWNERSHIP AND REGISTRATION
OF THE WORLD FLEET
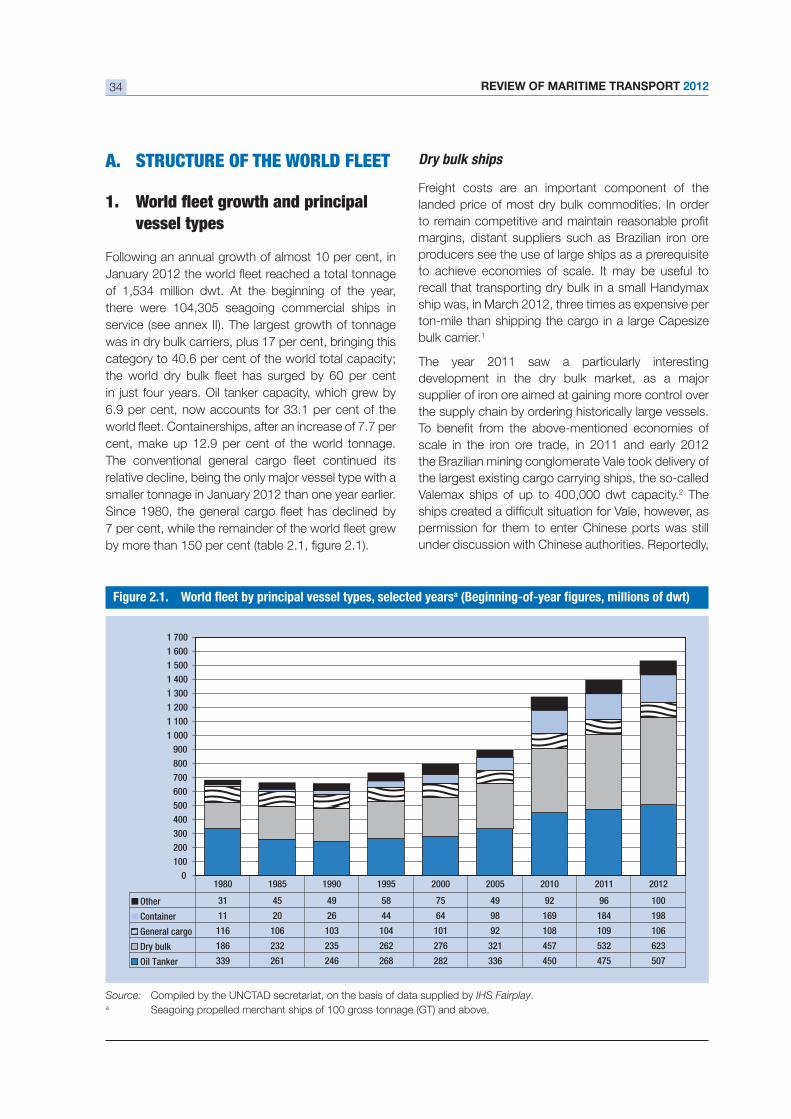
REVIEW OF MARITIME TRANSPORT 201234
A. STRUCTURE OF THE WORLD FLEET
vessel types
At the beginning of the year,
there were 104,305 seagoing commercial ships in
service (see annex II). The largest growth of tonnage
smaller tonnage in January 2012 than one year earlier.
Dry bulk ships
Freight costs are an important component of the
landed price of most dry bulk commodities. In order
margins, distant suppliers such as Brazilian iron ore
to achieve economies of scale. It may be useful to
recall that transporting dry bulk in a small Handymax
ship was, in March 2012, three times as expensive per
ton-mile than shipping the cargo in a large Capesize
bulk carrier.1
The year 2011 saw a particularly interesting
supplier of iron ore aimed at gaining more control over
the supply chain by ordering historically large vessels.
scale in the iron ore trade, in 2011 and early 2012
the Brazilian mining conglomerate Vale took delivery of
the largest existing cargo carrying ships, the so-called
Valemax ships of up to 400,000 dwt capacity.2 The
permission for them to enter Chinese ports was still
under discussion with Chinese authorities. Reportedly,
0 100 200 300 400 500 600 700 800 900
1 0001 1001 2001 3001 4001 5001 6001 700
Other 31 45 49 58 75 49 92 96 100
Container 11 20 26 44 64 98 169 184 198
General cargo 116 106 103 104 101 92 108 109 106
Dry bulk 186 232 235 262 276 321 457 532 623
Oil Tanker 339 261 246 268 282 336 450 475 507
1980 1985 1990 1995 2000 2005 2010 2011 2012
a
Source: Compiled by the UNCTAD secretariat, on the basis of data supplied by IHS Fairplay.a Seagoing propelled merchant ships of 100 gross tonnage (GT) and above.
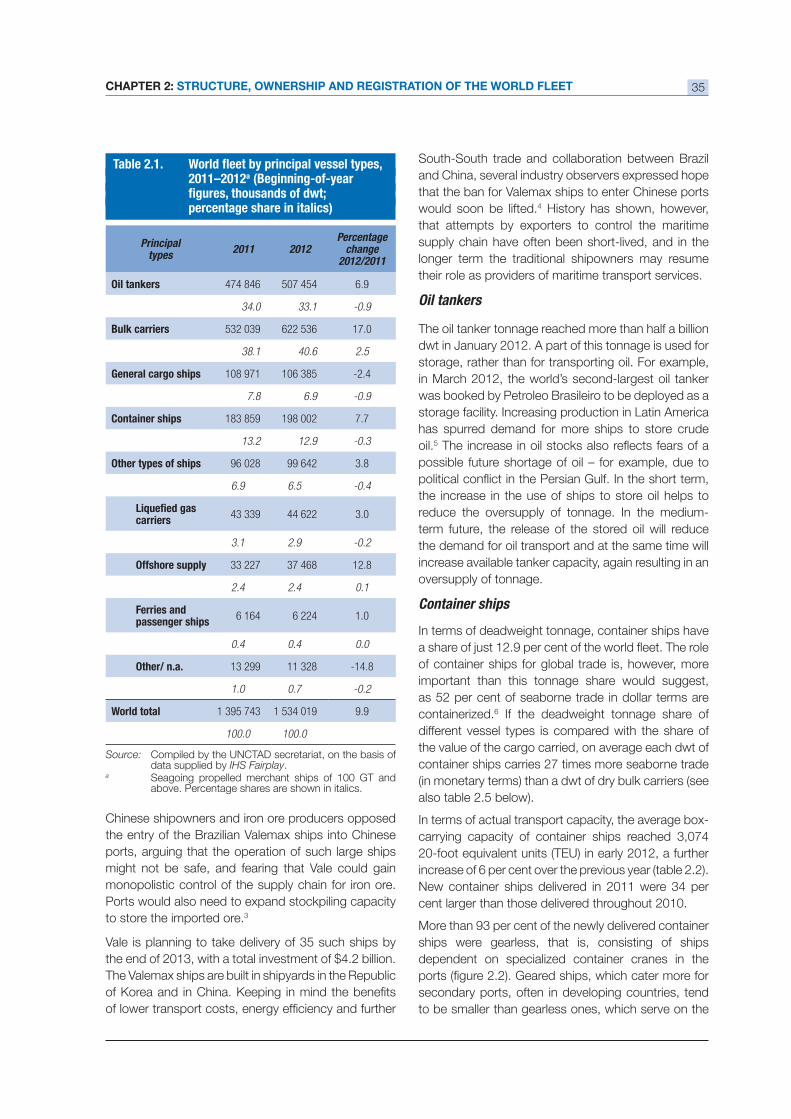
CHAPTER 2: STRUCTURE, OWNERSHIP AND REGISTRATION OF THE WORLD FLEET 35
Chinese shipowners and iron ore producers opposed
the entry of the Brazilian Valemax ships into Chinese
ports, arguing that the operation of such large ships
might not be safe, and fearing that Vale could gain
monopolistic control of the supply chain for iron ore.
Ports would also need to expand stockpiling capacity
to store the imported ore.3
Vale is planning to take delivery of 35 such ships by
The Valemax ships are built in shipyards in the Republic
South-South trade and collaboration between Brazil
and China, several industry observers expressed hope
that the ban for Valemax ships to enter Chinese ports
would soon be lifted.4 History has shown, however,
that attempts by exporters to control the maritime
supply chain have often been short-lived, and in the
longer term the traditional shipowners may resume
their role as providers of maritime transport services.
Oil tankers
dwt in January 2012. A part of this tonnage is used for
storage, rather than for transporting oil. For example,
in March 2012, the world’s second-largest oil tanker
was booked by Petroleo Brasileiro to be deployed as a
storage facility. Increasing production in Latin America
has spurred demand for more ships to store crude
oil.5
possible future shortage of oil – for example, due to
the increase in the use of ships to store oil helps to
reduce the oversupply of tonnage. In the medium-
term future, the release of the stored oil will reduce
the demand for oil transport and at the same time will
increase available tanker capacity, again resulting in an
oversupply of tonnage.
Container ships
In terms of deadweight tonnage, container ships have
of container ships for global trade is, however, more
important than this tonnage share would suggest,
containerized.6 If the deadweight tonnage share of
different vessel types is compared with the share of
the value of the cargo carried, on average each dwt of
container ships carries 27 times more seaborne trade
(in monetary terms) than a dwt of dry bulk carriers (see
In terms of actual transport capacity, the average box-
carrying capacity of container ships reached 3,074
cent larger than those delivered throughout 2010.
ships were gearless, that is, consisting of ships
dependent on specialized container cranes in the
secondary ports, often in developing countries, tend
to be smaller than gearless ones, which serve on the
2011–2012a (Beginning-of-year
percentage share in italics)
Source: Compiled by the UNCTAD secretariat, on the basis of data supplied by IHS Fairplay.
a Seagoing propelled merchant ships of 100 GT and above. Percentage shares are shown in italics.
Principaltypes
2011 2012Percentage
change 2012/2011
Oil tankers 474 846 507 454 6.9
34.0 33.1 -0.9
Bulk carriers 532 039 622 536 17.0
38.1 40.6 2.5
General cargo ships 108 971 106 385
7.8 6.9 -0.9
Container ships 183 859 198 002 7.7
13.2 12.9 -0.3
Other types of ships 96 028 99 642 3.8
6.9 6.5 -0.4
carriers 43 339 44 622 3.0
3.1 2.9 -0.2
Offshore supply 33 227 37 468 12.8
2.4 2.4 0.1
Ferries andpassenger ships
6 164 6 224 1.0
0.4 0.4 0.0
Other/ n.a. 13 299 11 328
1.0 0.7 -0.2
World total 1 395 743 1 534 019 9.9
100.0 100.0
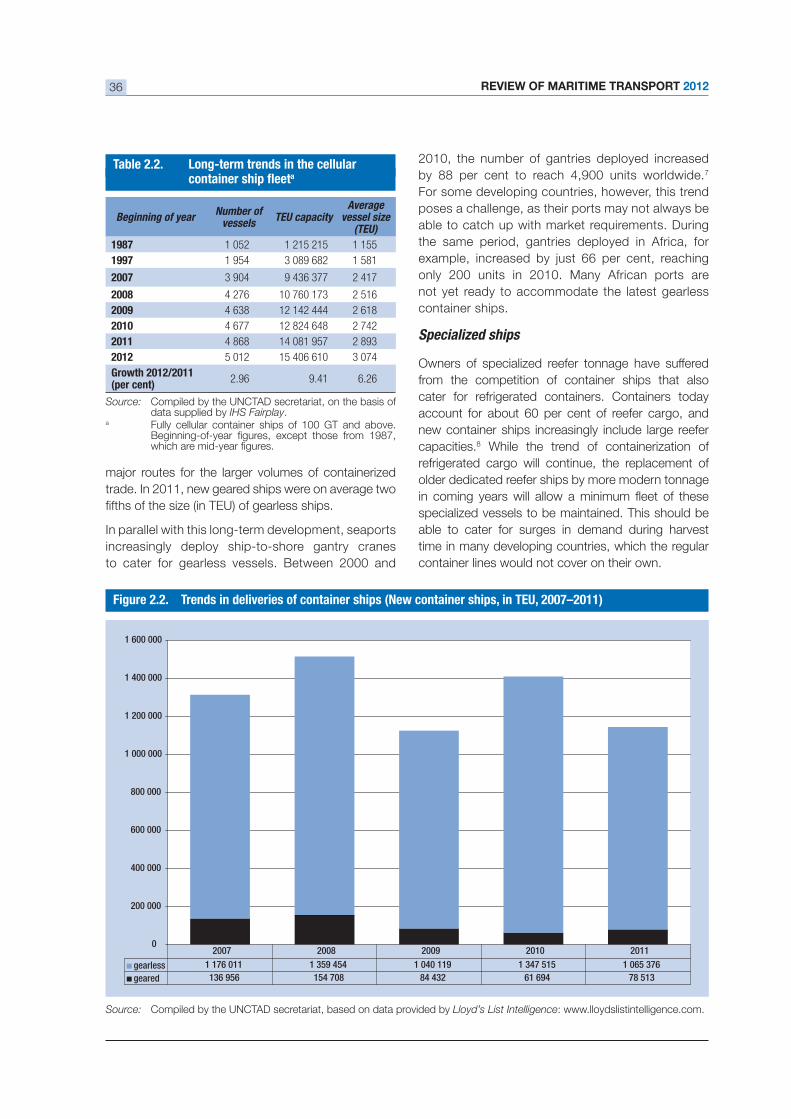
REVIEW OF MARITIME TRANSPORT 201236
trade. In 2011, new geared ships were on average two
In parallel with this long-term development, seaports
increasingly deploy ship-to-shore gantry cranes
to cater for gearless vessels. Between 2000 and
Table 2.2. Long-term trends in the cellulara
Source: Compiled by the UNCTAD secretariat, on the basis of data supplied by IHS Fairplay.
a Fully cellular container ships of 100 GT and above.
Beginning of yearNumber of
vesselsTEU capacity
Average vessel size
(TEU)
1987 1 052 1 215 215 1 155
1997 1 954 3 089 682 1 581
2007 3 904 9 436 377 2 417
2008 4 276 10 760 173 2 516
2009 4 638 12 142 444 2 618
2010 4 677 12 824 648 2 742
2011 4 868 14 081 957 2 893
2012 5 012 15 406 610 3 074
Growth 2012/2011(per cent)
2.96 9.41 6.26
0
200 000
400 000
600 000
800 000
1 000 000
1 200 000
1 400 000
1 600 000
gearless 1 176 011 1 359 454 1 040 119 1 347 515 1 065 376geared 136 956 154 708 84 432 61 694 78 513
2007 2008 2009 2010 2011
Figure 2.2. Trends in deliveries of container ships (New container ships, in TEU, 2007–2011)
Source: Compiled by the UNCTAD secretariat, based on data provided by Lloyd’s List Intelligence: www.lloydslistintelligence.com.
2010, the number of gantries deployed increased7
For some developing countries, however, this trend
poses a challenge, as their ports may not always be
the same period, gantries deployed in Africa, for
only 200 units in 2010. Many African ports are
not yet ready to accommodate the latest gearless
container ships.
Specialized ships
Owners of specialized reefer tonnage have suffered
from the competition of container ships that also
cater for refrigerated containers. Containers today
new container ships increasingly include large reefer
capacities.8 While the trend of containerization of
refrigerated cargo will continue, the replacement of
older dedicated reefer ships by more modern tonnage
specialized vessels to be maintained. This should be
able to cater for surges in demand during harvest
time in many developing countries, which the regular
container lines would not cover on their own.
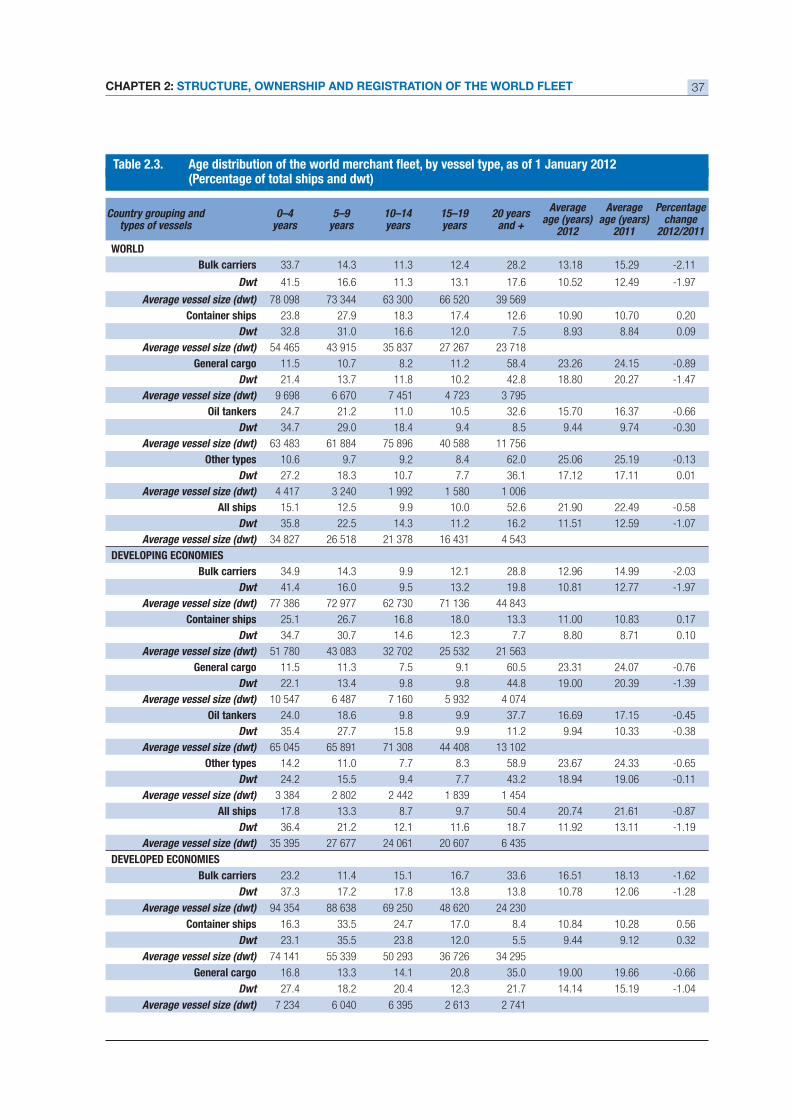
CHAPTER 2: STRUCTURE, OWNERSHIP AND REGISTRATION OF THE WORLD FLEET 37
(Percentage of total ships and dwt)
Country grouping and types of vessels
0–4 years
5–9 years
10–14 years
15–19 years
20 years and +
Average age (years)
2012
Average age (years)
2011
Percentagechange
2012/2011
WORLD
Bulk carriers 33.7 14.3 11.3 12.4 28.2 13.18 15.29
Dwt 41.5 16.6 11.3 13.1 17.6 10.52 12.49
Average vessel size (dwt) 78 098 73 344 63 300 66 520 39 569
Container ships 23.8 27.9 18.3 17.4 12.6 10.90 10.70 0.20
Dwt 32.8 31.0 16.6 12.0 7.5 8.93 8.84 0.09
Average vessel size (dwt) 54 465 43 915 35 837 27 267 23 718
General cargo 11.5 10.7 8.2 11.2 58.4 23.26 24.15
Dwt 21.4 13.7 11.8 10.2 42.8 18.80 20.27
Average vessel size (dwt) 9 698 6 670 7 451 4 723 3 795
Oil tankers 24.7 21.2 11.0 10.5 32.6 15.70 16.37
Dwt 34.7 29.0 18.4 9.4 8.5 9.44 9.74
Average vessel size (dwt) 63 483 61 884 75 896 40 588 11 756
Other types 10.6 9.7 9.2 8.4 62.0 25.06 25.19
Dwt 27.2 18.3 10.7 7.7 36.1 17.12 17.11 0.01
Average vessel size (dwt) 4 417 3 240 1 992 1 580 1 006
All ships 15.1 12.5 9.9 10.0 52.6 21.90 22.49
Dwt 35.8 22.5 14.3 11.2 16.2 11.51 12.59
Average vessel size (dwt) 34 827 26 518 21 378 16 431 4 543
Bulk carriers 34.9 14.3 9.9 12.1 28.8 12.96 14.99
Dwt 41.4 16.0 9.5 13.2 19.8 10.81 12.77
Average vessel size (dwt) 77 386 72 977 62 730 71 136 44 843
Container ships 25.1 26.7 16.8 18.0 13.3 11.00 10.83 0.17
Dwt 34.7 30.7 14.6 12.3 7.7 8.80 8.71 0.10
Average vessel size (dwt) 51 780 43 083 32 702 25 532 21 563
General cargo 11.5 11.3 7.5 9.1 60.5 23.31 24.07
Dwt 22.1 13.4 9.8 9.8 44.8 19.00 20.39
Average vessel size (dwt) 10 547 6 487 7 160 5 932 4 074
Oil tankers 24.0 18.6 9.8 9.9 37.7 16.69 17.15
Dwt 35.4 27.7 15.8 9.9 11.2 9.94 10.33
Average vessel size (dwt) 65 045 65 891 71 308 44 408 13 102
Other types 14.2 11.0 7.7 8.3 58.9 23.67 24.33
Dwt 24.2 15.5 9.4 7.7 43.2 18.94 19.06
Average vessel size (dwt) 3 384 2 802 2 442 1 839 1 454
All ships 17.8 13.3 8.7 9.7 50.4 20.74 21.61
Dwt 36.4 21.2 12.1 11.6 18.7 11.92 13.11
Average vessel size (dwt) 35 395 27 677 24 061 20 607 6 435
Bulk carriers 23.2 11.4 15.1 16.7 33.6 16.51 18.13
Dwt 37.3 17.2 17.8 13.8 13.8 10.78 12.06
Average vessel size (dwt) 94 354 88 638 69 250 48 620 24 230
Container ships 16.3 33.5 24.7 17.0 8.4 10.84 10.28 0.56
Dwt 23.1 35.5 23.8 12.0 5.5 9.44 9.12 0.32
Average vessel size (dwt) 74 141 55 339 50 293 36 726 34 295
General cargo 16.8 13.3 14.1 20.8 35.0 19.00 19.66
Dwt 27.4 18.2 20.4 12.3 21.7 14.14 15.19
Average vessel size (dwt) 7 234 6 040 6 395 2 613 2 741
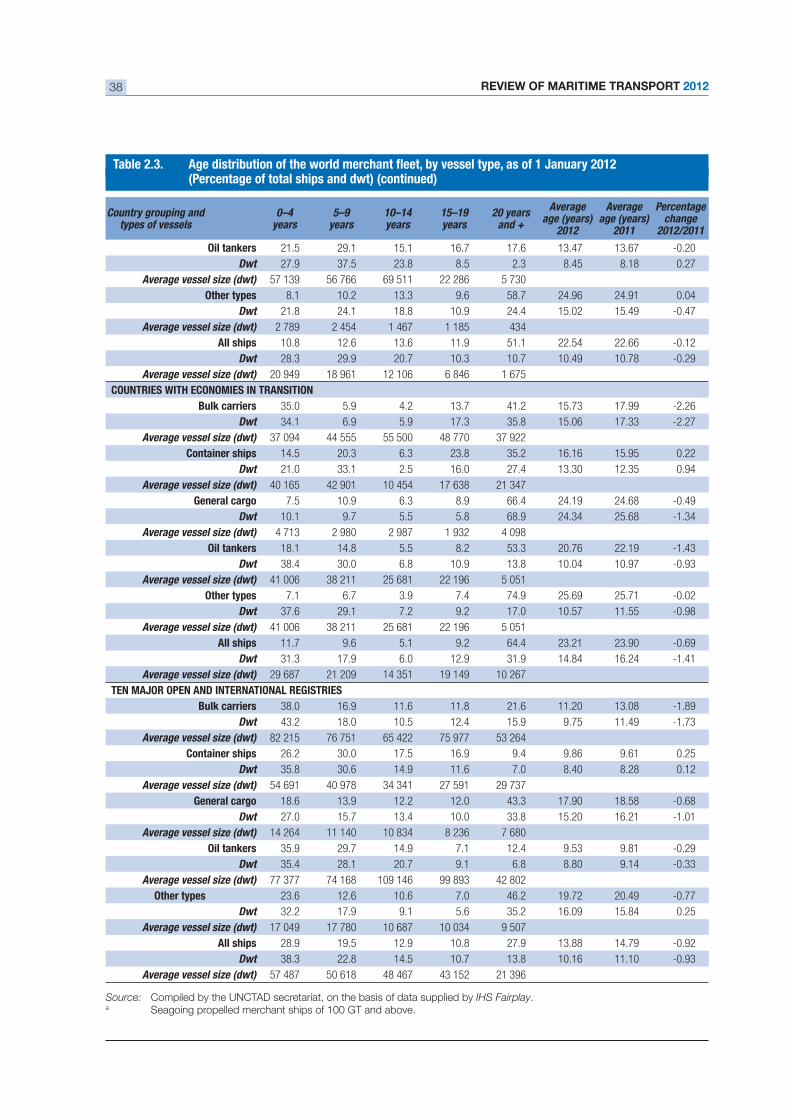
REVIEW OF MARITIME TRANSPORT 201238
Country grouping and types of vessels
0–4 years
5–9 years
10–14 years
15–19 years
20 years and +
Average age (years)
2012
Average age (years)
2011
Percentagechange
2012/2011
Oil tankers 21.5 29.1 15.1 16.7 17.6 13.47 13.67
Dwt 27.9 37.5 23.8 8.5 2.3 8.45 8.18 0.27
Average vessel size (dwt) 57 139 56 766 69 511 22 286 5 730
Other types 8.1 10.2 13.3 9.6 58.7 24.96 24.91 0.04
Dwt 21.8 24.1 18.8 10.9 24.4 15.02 15.49
Average vessel size (dwt) 2 789 2 454 1 467 1 185 434
All ships 10.8 12.6 13.6 11.9 51.1 22.54 22.66
Dwt 28.3 29.9 20.7 10.3 10.7 10.49 10.78
Average vessel size (dwt) 20 949 18 961 12 106 6 846 1 675
Bulk carriers 35.0 5.9 4.2 13.7 41.2 15.73 17.99
Dwt 34.1 6.9 5.9 17.3 35.8 15.06 17.33
Average vessel size (dwt) 37 094 44 555 55 500 48 770 37 922
Container ships 14.5 20.3 6.3 23.8 35.2 16.16 15.95 0.22
Dwt 21.0 33.1 2.5 16.0 27.4 13.30 12.35 0.94
Average vessel size (dwt) 40 165 42 901 10 454 17 638 21 347
General cargo 7.5 10.9 6.3 8.9 66.4 24.19 24.68
Dwt 10.1 9.7 5.5 5.8 68.9 24.34 25.68
Average vessel size (dwt) 4 713 2 980 2 987 1 932 4 098
Oil tankers 18.1 14.8 5.5 8.2 53.3 20.76 22.19
Dwt 38.4 30.0 6.8 10.9 13.8 10.04 10.97
Average vessel size (dwt) 41 006 38 211 25 681 22 196 5 051
Other types 7.1 6.7 3.9 7.4 74.9 25.69 25.71
Dwt 37.6 29.1 7.2 9.2 17.0 10.57 11.55
Average vessel size (dwt) 41 006 38 211 25 681 22 196 5 051
All ships 11.7 9.6 5.1 9.2 64.4 23.21 23.90
Dwt 31.3 17.9 6.0 12.9 31.9 14.84 16.24
Average vessel size (dwt) 29 687 21 209 14 351 19 149 10 267
Bulk carriers 38.0 16.9 11.6 11.8 21.6 11.20 13.08
Dwt 43.2 18.0 10.5 12.4 15.9 9.75 11.49
Average vessel size (dwt) 82 215 76 751 65 422 75 977 53 264
Container ships 26.2 30.0 17.5 16.9 9.4 9.86 9.61 0.25
Dwt 35.8 30.6 14.9 11.6 7.0 8.40 8.28 0.12
Average vessel size (dwt) 54 691 40 978 34 341 27 591 29 737
General cargo 18.6 13.9 12.2 12.0 43.3 17.90 18.58
Dwt 27.0 15.7 13.4 10.0 33.8 15.20 16.21
Average vessel size (dwt) 14 264 11 140 10 834 8 236 7 680
Oil tankers 35.9 29.7 14.9 7.1 12.4 9.53 9.81
Dwt 35.4 28.1 20.7 9.1 6.8 8.80 9.14
Average vessel size (dwt) 77 377 74 168 109 146 99 893 42 802
Other types 23.6 12.6 10.6 7.0 46.2 19.72 20.49
Dwt 32.2 17.9 9.1 5.6 35.2 16.09 15.84 0.25
Average vessel size (dwt) 17 049 17 780 10 687 10 034 9 507
All ships 28.9 19.5 12.9 10.8 27.9 13.88 14.79
Dwt 38.3 22.8 14.5 10.7 13.8 10.16 11.10
Average vessel size (dwt) 57 487 50 618 48 467 43 152 21 396
(Percentage of total ships and dwt) (continued)
Source: Compiled by the UNCTAD secretariat, on the basis of data supplied by IHS Fairplay.a Seagoing propelled merchant ships of 100 GT and above.
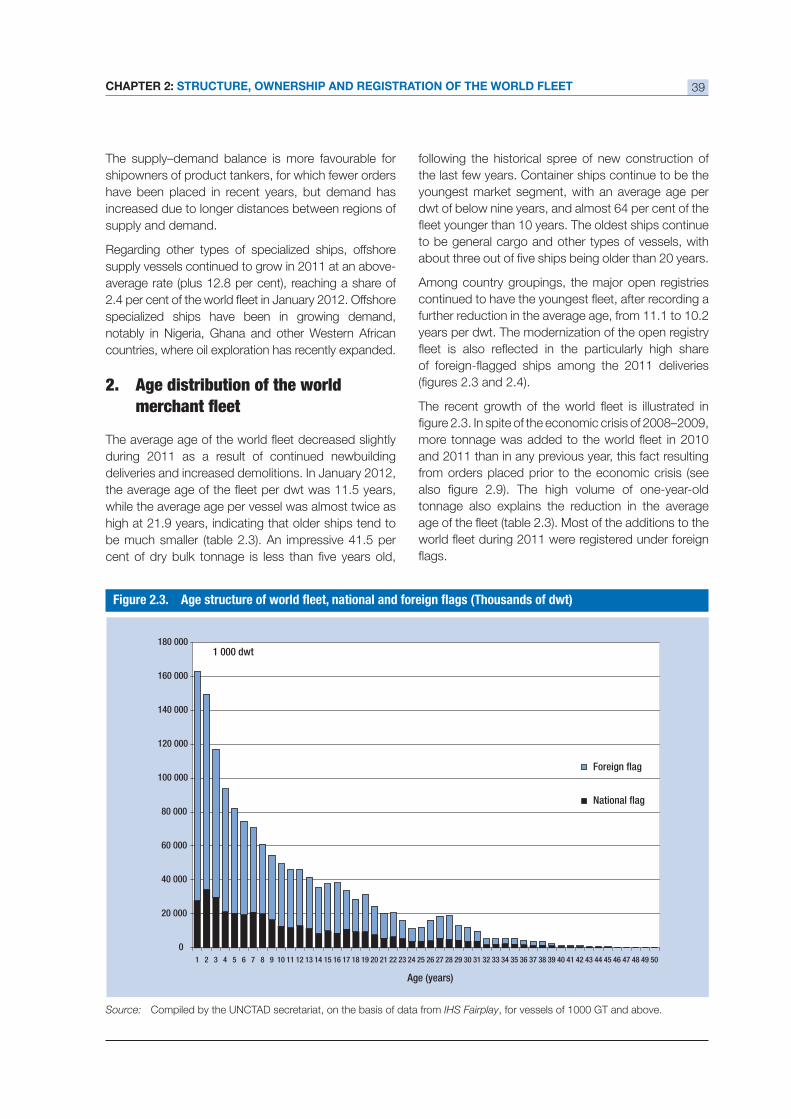
CHAPTER 2: STRUCTURE, OWNERSHIP AND REGISTRATION OF THE WORLD FLEET 39
The supply–demand balance is more favourable for
shipowners of product tankers, for which fewer orders
have been placed in recent years, but demand has
increased due to longer distances between regions of
supply and demand.
Regarding other types of specialized ships, offshore
supply vessels continued to grow in 2011 at an above-
specialized ships have been in growing demand,
notably in Nigeria, Ghana and other Western African
countries, where oil exploration has recently expanded.
2. Age distribution of the world
during 2011 as a result of continued newbuilding
deliveries and increased demolitions. In January 2012,
while the average age per vessel was almost twice as
high at 21.9 years, indicating that older ships tend to
following the historical spree of new construction of
the last few years. Container ships continue to be the
youngest market segment, with an average age per
to be general cargo and other types of vessels, with
further reduction in the average age, from 11.1 to 10.2
years per dwt. The modernization of the open registry
and 2011 than in any previous year, this fact resulting
from orders placed prior to the economic crisis (see
tonnage also explains the reduction in the average
0
20 000
40 000
60 000
80 000
100 000
120 000
140 000
160 000
180 000
1 2 3 4 5 6 7 8 9 10 11 12 13 14 15 16 17 18 19 20 21 22 23 24 25 26 27 28 29 30 31 32 33 34 35 36 37 38 39 40 41 42 43 44 45 46 47 48 49 50
Age (years)
1 000 dwt
Foreign flag
National flag
Source: Compiled by the UNCTAD secretariat, on the basis of data from IHS Fairplay, for vessels of 1000 GT and above.
REVIEW OF MARITIME TRANSPORT 201240
3. Domestic shipping
Apart from international seaborne trade, domestic
shipping is an important additional source of
aim at supporting coastal maritime transport because
moved by road. Demand for intra-country (cabotage)
shipping has helped to absorb some of the new
tonnage that entered into service in 2011. For example,
China are deployed exclusively in Chinese cabotage.9
Cabotage shipping is not governed by most of the
international maritime regulations, such as the phasing
out of single-hull tankers. Nigerian shipowners, for
example, mostly deploy single-hull tankers for the
coastal transport of oil.10 Vessels deployed in cabotage
services are also often older than the internationally
11
than the world average, which is mostly due to its
deployment in coastal shipping.12
In many countries, cabotage is reserved for nationally
providers. In order to further promote coastal shipping
services, some countries are considering opening
certain cabotage services to non-national operators.
For the case of India, for example, it has been argued
that a relaxation of the cabotage restrictions would help
promote trans-shipment in Indian ports.13 In Nigeria, the
issuance of waivers for foreign providers of cabotage
services has in practice become the rule rather than an
exception.14 Other countries have chosen to maintain a
more restrictive policy, with a view to promoting national
shipbuilding and the employment of national seafarers.
Indonesia, for example, is reportedly considering
prohibiting the import of older ships for cabotage
services, hoping that this will increase the demand for
shipbuilding in Indonesian yards.15
B. OWNERSHIP AND OPERATION OF
THE WORLD FLEET
1. Ship-owning countries
Among the top 35 ship-owning economies, there
are 17 in Asia, 14 in Europe and 4 in the Americas
China. Owners from Bermuda, Brazil and the Isle of
Man specialize mostly in large ships, notably tankers
and dry bulk carriers. Owners from Indonesia, the
Russian Federation and Viet Nam have a large number
of smaller ships, including vessels deployed in coastal
and inter-island services.
and their share in different market segments (in dwt
percentage share), as well as an estimation of their share
in the transport of global seaborne trade (in $ percentage
share). Containerized cargo accounts for an estimated
countries with a high share of containerized tonnage will
thus also have a high share in global seaborne trade
that is transported by their nationally owned ships.
As the largest owner of ship containerized tonnage,
becomes the country whose ships also account for
seaborne trade carried. The second largest shipowner
the ship-owning countries effectively operate or control
the shipping operations. In particular, the German-
to liner shipping operators based in other countries,
such as Maersk (Denmark), MSC (Switzerland) or
CSAV (Chile). Neither would there necessarily exist a
relationship between a country’s own foreign trade and
exporting countries are more likely to own the oil tankers
used for their own national exports, while the exporters
of containerized cargo are much less likely to own the
container ships used for their own foreign trade.16
2. Container shipping operators
The top 20 carriers
The largest container ship operators in January
2012 continue to be Maersk Line (Denmark), MSC
(Switzerland) and CMA CGM (France). Together, these
the continued process of industry concentration of
the last few years. Compared with January 2011,
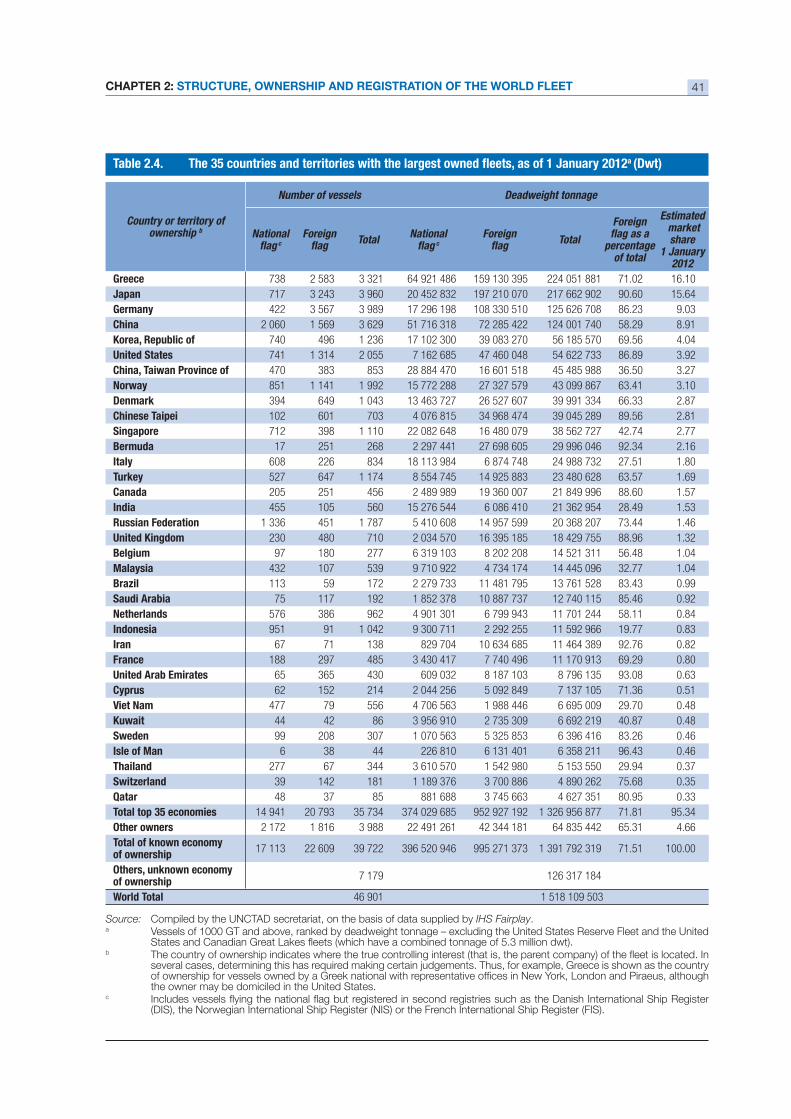
CHAPTER 2: STRUCTURE, OWNERSHIP AND REGISTRATION OF THE WORLD FLEET 41
Country or territory ofownership b
Number of vessels Deadweight tonnage
National c
Foreign Total
National c
Foreign Total
Foreign
percentageof total
Estimated market share
1 January 2012
Greece 738 2 583 3 321 64 921 486 159 130 395 224 051 881 71.02 16.10
Japan 717 3 243 3 960 20 452 832 197 210 070 217 662 902 90.60 15.64
Germany 422 3 567 3 989 17 296 198 108 330 510 125 626 708 86.23 9.03
China 2 060 1 569 3 629 51 716 318 72 285 422 124 001 740 58.29 8.91
Korea, Republic of 740 496 1 236 17 102 300 39 083 270 56 185 570 69.56 4.04
United States 741 1 314 2 055 7 162 685 47 460 048 54 622 733 86.89 3.92
China, Taiwan Province of 470 383 853 28 884 470 16 601 518 45 485 988 36.50 3.27
Norway 851 1 141 1 992 15 772 288 27 327 579 43 099 867 63.41 3.10
Denmark 394 649 1 043 13 463 727 26 527 607 39 991 334 66.33 2.87
Chinese Taipei 102 601 703 4 076 815 34 968 474 39 045 289 89.56 2.81
Singapore 712 398 1 110 22 082 648 16 480 079 38 562 727 42.74 2.77
Bermuda 17 251 268 2 297 441 27 698 605 29 996 046 92.34 2.16
Italy 608 226 834 18 113 984 6 874 748 24 988 732 27.51 1.80
Turkey 527 647 1 174 8 554 745 14 925 883 23 480 628 63.57 1.69
Canada 205 251 456 2 489 989 19 360 007 21 849 996 88.60 1.57
India 455 105 560 15 276 544 6 086 410 21 362 954 28.49 1.53
Russian Federation 1 336 451 1 787 5 410 608 14 957 599 20 368 207 73.44 1.46
United Kingdom 230 480 710 2 034 570 16 395 185 18 429 755 88.96 1.32
Belgium 97 180 277 6 319 103 8 202 208 14 521 311 56.48 1.04
432 107 539 9 710 922 4 734 174 14 445 096 32.77 1.04
Brazil 113 59 172 2 279 733 11 481 795 13 761 528 83.43 0.99
Saudi Arabia 75 117 192 1 852 378 10 887 737 12 740 115 85.46 0.92
Netherlands 576 386 962 4 901 301 6 799 943 11 701 244 58.11 0.84
Indonesia 951 91 1 042 9 300 711 2 292 255 11 592 966 19.77 0.83
Iran 67 71 138 829 704 10 634 685 11 464 389 92.76 0.82
France 188 297 485 3 430 417 7 740 496 11 170 913 69.29 0.80
United Arab Emirates 65 365 430 609 032 8 187 103 8 796 135 93.08 0.63
Cyprus 62 152 214 2 044 256 5 092 849 7 137 105 71.36 0.51
Viet Nam 477 79 556 4 706 563 1 988 446 6 695 009 29.70 0.48
Kuwait 44 42 86 3 956 910 2 735 309 6 692 219 40.87 0.48
Sweden 99 208 307 1 070 563 5 325 853 6 396 416 83.26 0.46
6 38 44 226 810 6 131 401 6 358 211 96.43 0.46
Thailand 277 67 344 3 610 570 1 542 980 5 153 550 29.94 0.37
Switzerland 39 142 181 1 189 376 3 700 886 4 890 262 75.68 0.35
Qatar 48 37 85 881 688 3 745 663 4 627 351 80.95 0.33
14 941 20 793 35 734 374 029 685 952 927 192 1 326 956 877 71.81 95.34
Other owners 2 172 1 816 3 988 22 491 261 42 344 181 64 835 442 65.31 4.66
Total of known economyof ownership
17 113 22 609 39 722 396 520 946 995 271 373 1 391 792 319 71.51 100.00
Others, unknown economyof ownership
7 179 126 317 184
World Total 46 901 1 518 109 503
a (Dwt)
Source: Compiled by the UNCTAD secretariat, on the basis of data supplied by IHS Fairplay.a Vessels of 1000 GT and above, ranked by deadweight tonnage – excluding the United States Reserve Fleet and the United
b
the owner may be domiciled in the United States.c
(DIS), the Norwegian International Ship Register (NIS) or the French International Ship Register (FIS).
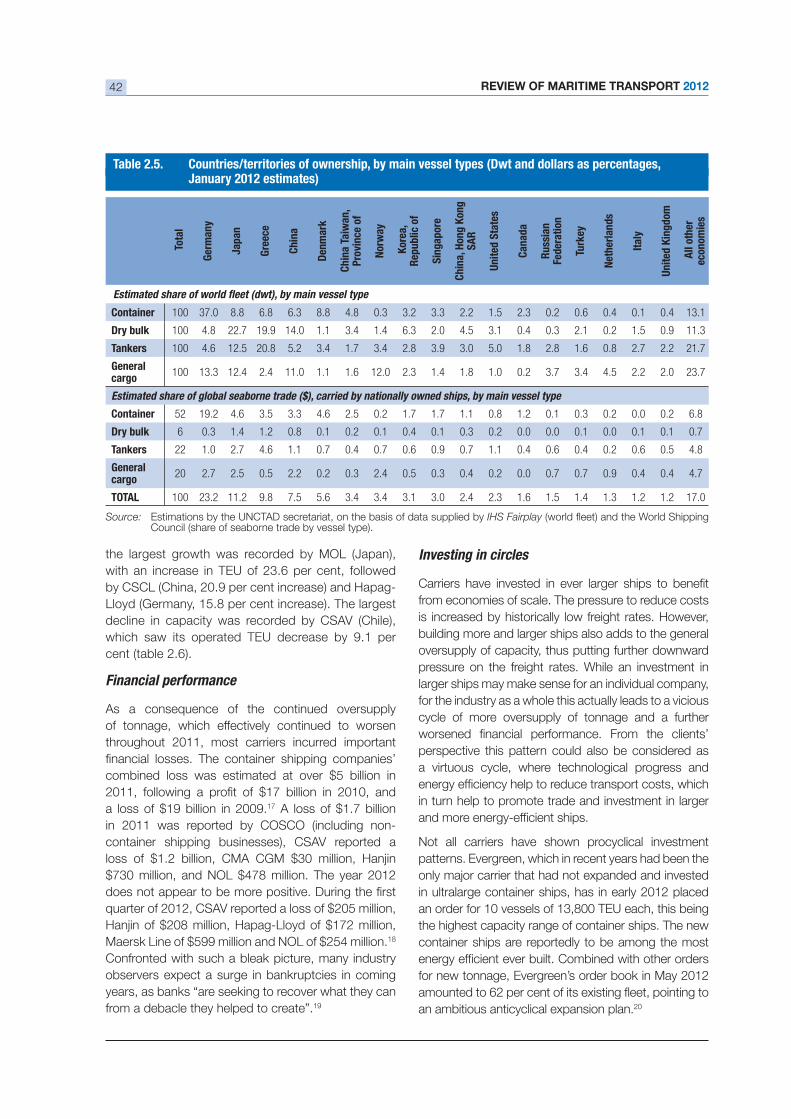
REVIEW OF MARITIME TRANSPORT 201242
the largest growth was recorded by MOL (Japan),
decline in capacity was recorded by CSAV (Chile),
Financial performance
of tonnage, which effectively continued to worsen
throughout 2011, most carriers incurred important
17
in 2011 was reported by COSCO (including non-
container shipping businesses), CSAV reported a
18
Confronted with such a bleak picture, many industry
observers expect a surge in bankruptcies in coming
years, as banks “are seeking to recover what they can
from a debacle they helped to create”.19
Tot
al
Ger
man
y
Japa
n
Gre
ece
Chi
na
Den
mar
k
Chi
na T
aiw
an,
Pro
vinc
e of
Nor
way
Kor
ea,
Rep
ublic
of
Sin
gapo
re
Chi
na, H
ong
Kon
g S
AR
Uni
ted
Sta
tes
Can
ada
Rus
sian
Fede
rati
on
Turk
ey
Net
herl
ands
Ital
y
Uni
ted
Kin
gdom
All
othe
r ec
onom
ies
Container 100 37.0 8.8 6.8 6.3 8.8 4.8 0.3 3.2 3.3 2.2 1.5 2.3 0.2 0.6 0.4 0.1 0.4 13.1
Dry bulk 100 4.8 22.7 19.9 14.0 1.1 3.4 1.4 6.3 2.0 4.5 3.1 0.4 0.3 2.1 0.2 1.5 0.9 11.3
Tankers 100 4.6 12.5 20.8 5.2 3.4 1.7 3.4 2.8 3.9 3.0 5.0 1.8 2.8 1.6 0.8 2.7 2.2 21.7
General cargo
100 13.3 12.4 2.4 11.0 1.1 1.6 12.0 2.3 1.4 1.8 1.0 0.2 3.7 3.4 4.5 2.2 2.0 23.7
Container 52 19.2 4.6 3.5 3.3 4.6 2.5 0.2 1.7 1.7 1.1 0.8 1.2 0.1 0.3 0.2 0.0 0.2 6.8
Dry bulk 6 0.3 1.4 1.2 0.8 0.1 0.2 0.1 0.4 0.1 0.3 0.2 0.0 0.0 0.1 0.0 0.1 0.1 0.7
Tankers 22 1.0 2.7 4.6 1.1 0.7 0.4 0.7 0.6 0.9 0.7 1.1 0.4 0.6 0.4 0.2 0.6 0.5 4.8
General cargo
20 2.7 2.5 0.5 2.2 0.2 0.3 2.4 0.5 0.3 0.4 0.2 0.0 0.7 0.7 0.9 0.4 0.4 4.7
TOTAL 100 23.2 11.2 9.8 7.5 5.6 3.4 3.4 3.1 3.0 2.4 2.3 1.6 1.5 1.4 1.3 1.2 1.2 17.0
Table 2.5. Countries/territories of ownership, by main vessel types (Dwt and dollars as percentages,January 2012 estimates)
Source: Estimations by the UNCTAD secretariat, on the basis of data supplied by IHS FairplayCouncil (share of seaborne trade by vessel type).
Investing in circles
from economies of scale. The pressure to reduce costs
is increased by historically low freight rates. However,
building more and larger ships also adds to the general
oversupply of capacity, thus putting further downward
pressure on the freight rates. While an investment in
larger ships may make sense for an individual company,
for the industry as a whole this actually leads to a vicious
cycle of more oversupply of tonnage and a further
perspective this pattern could also be considered as
a virtuous cycle, where technological progress and
in turn help to promote trade and investment in larger
Not all carriers have shown procyclical investment
patterns. Evergreen, which in recent years had been the
in ultralarge container ships, has in early 2012 placed
an order for 10 vessels of 13,800 TEU each, this being
the highest capacity range of container ships. The new
container ships are reportedly to be among the most
for new tonnage, Evergreen’s order book in May 2012
an ambitious anticyclical expansion plan.20
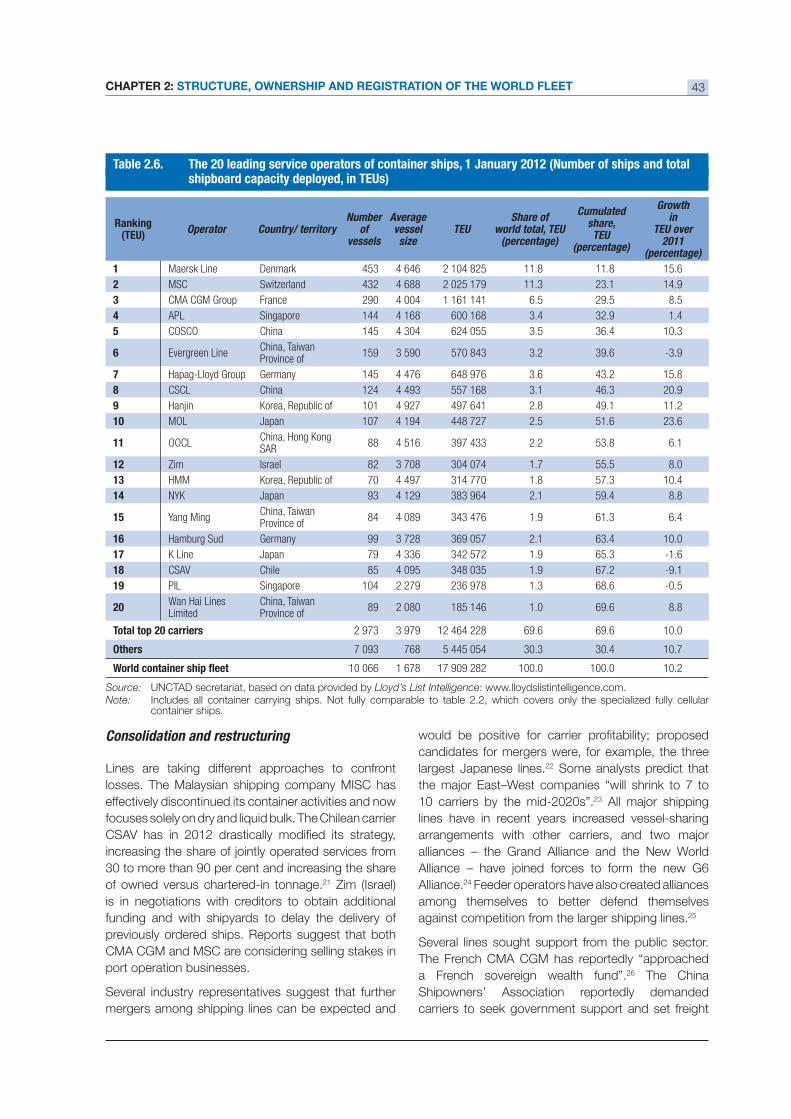
CHAPTER 2: STRUCTURE, OWNERSHIP AND REGISTRATION OF THE WORLD FLEET 43
candidates for mergers were, for example, the three
largest Japanese lines.22 Some analysts predict that
10 carriers by the mid-2020s”.23
lines have in recent years increased vessel-sharing
alliances – the Grand Alliance and the New World
Alliance.24 Feeder operators have also created alliances
among themselves to better defend themselves
against competition from the larger shipping lines.25
Several lines sought support from the public sector.
The French CMA CGM has reportedly “approached
a French sovereign wealth fund”.26 The China
Shipowners’ Association reportedly demanded
carriers to seek government support and set freight
Source: UNCTAD secretariat, based on data provided by Lloyd’s List Intelligence: www.lloydslistintelligence.com. Note:
container ships.
Ranking(TEU)
Operator Country/ territoryNumber
ofvessels
Averagevesselsize
TEUShare of
(percentage)
Cumulated
TEU(percentage)
Growthin
TEU over2011
(percentage)
1 Maersk Line Denmark 453 4 646 2 104 825 11.8 11.8 15.6
2 MSC Switzerland 432 4 688 2 025 179 11.3 23.1 14.9
CMA CGM Group France 290 4 004 1 161 141 6.5 29.5 8.5
4 APL Singapore 144 4 168 600 168 3.4 32.9 1.4
5 COSCO China 145 4 304 624 055 3.5 36.4 10.3
6 Evergreen LineChina, Taiwan Province of
159 3 590 570 843 3.2 39.6
7 Germany 145 4 476 648 976 3.6 43.2 15.8
8 CSCL China 124 4 493 557 168 3.1 46.3 20.9
9 Hanjin Korea, Republic of 101 4 927 497 641 2.8 49.1 11.2
10 MOL Japan 107 4 194 448 727 2.5 51.6 23.6
11 OOCLChina, Hong Kong SAR
88 4 516 397 433 2.2 53.8 6.1
12 Zim Israel 82 3 708 304 074 1.7 55.5 8.0
HMM Korea, Republic of 70 4 497 314 770 1.8 57.3 10.4
14 NYK Japan 93 4 129 383 964 2.1 59.4 8.8
15 Yang MingChina, Taiwan Province of
84 4 089 343 476 1.9 61.3 6.4
16 Hamburg Sud Germany 99 3 728 369 057 2.1 63.4 10.0
17 K Line Japan 79 4 336 342 572 1.9 65.3
18 CSAV Chile 85 4 095 348 035 1.9 67.2
19 PIL Singapore 104 2 279 236 978 1.3 68.6
20Wan Hai Lines Limited
China, Taiwan Province of
89 2 080 185 146 1.0 69.6 8.8
Total top 20 carriers 2 973 3 979 12 464 228 69.6 69.6 10.0
Others 7 093 768 5 445 054 30.3 30.4 10.7
10 066 1 678 17 909 282 100.0 100.0 10.2
Table 2.6. The 20 leading service operators of container ships, 1 January 2012 (Number of ships and totalshipboard capacity deployed, in TEUs)
Consolidation and restructuring
Lines are taking different approaches to confront
losses. The Malaysian shipping company MISC has
effectively discontinued its container activities and now
of owned versus chartered-in tonnage.21 Zim (Israel)
is in negotiations with creditors to obtain additional
funding and with shipyards to delay the delivery of
previously ordered ships. Reports suggest that both
CMA CGM and MSC are considering selling stakes in
port operation businesses.
Several industry representatives suggest that further
mergers among shipping lines can be expected and
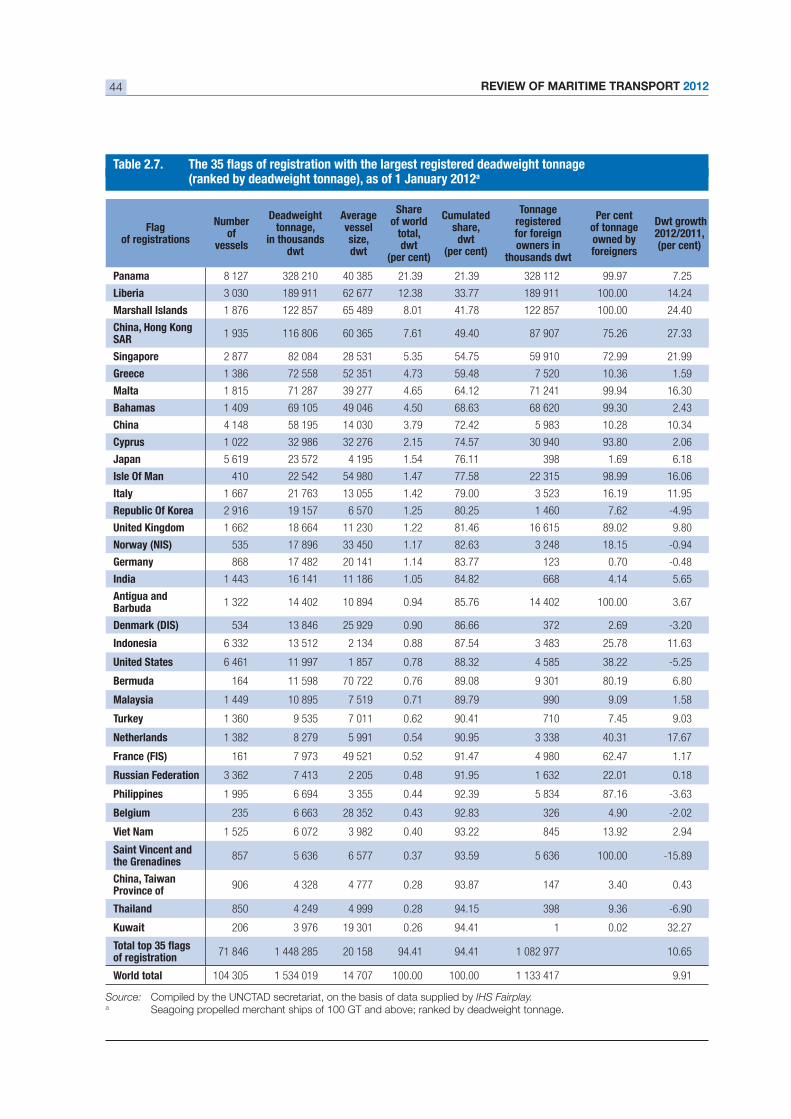
REVIEW OF MARITIME TRANSPORT 201244
Source: Compiled by the UNCTAD secretariat, on the basis of data supplied by IHS Fairplay.a Seagoing propelled merchant ships of 100 GT and above; ranked by deadweight tonnage.
Flagof registrations
Numberof
vessels
Deadweight tonnage,
in thousandsdwt
Average vessel size,dwt
Share of world
total,dwt
(per cent)
Cumulated share,dwt
(per cent)
Tonnage registeredfor foreign owners in
thousands dwt
Per centof tonnage owned by foreigners
Dwt growth 2012/2011,(per cent)
Panama 8 127 328 210 40 385 21.39 21.39 328 112 99.97 7.25
Liberia 3 030 189 911 62 677 12.38 33.77 189 911 100.00 14.24
1 876 122 857 65 489 8.01 41.78 122 857 100.00 24.40
China, Hong Kong SAR
1 935 116 806 60 365 7.61 49.40 87 907 75.26 27.33
Singapore 2 877 82 084 28 531 5.35 54.75 59 910 72.99 21.99
Greece 1 386 72 558 52 351 4.73 59.48 7 520 10.36 1.59
1 815 71 287 39 277 4.65 64.12 71 241 99.94 16.30
Bahamas 1 409 69 105 49 046 4.50 68.63 68 620 99.30 2.43
China 4 148 58 195 14 030 3.79 72.42 5 983 10.28 10.34
Cyprus 1 022 32 986 32 276 2.15 74.57 30 940 93.80 2.06
Japan 5 619 23 572 4 195 1.54 76.11 398 1.69 6.18
410 22 542 54 980 1.47 77.58 22 315 98.99 16.06
Italy 1 667 21 763 13 055 1.42 79.00 3 523 16.19 11.95
Republic Of Korea 2 916 19 157 6 570 1.25 80.25 1 460 7.62
United Kingdom 1 662 18 664 11 230 1.22 81.46 16 615 89.02 9.80
Norway (NIS) 535 17 896 33 450 1.17 82.63 3 248 18.15
Germany 868 17 482 20 141 1.14 83.77 123 0.70
India 1 443 16 141 11 186 1.05 84.82 668 4.14 5.65
Antigua and Barbuda
1 322 14 402 10 894 0.94 85.76 14 402 100.00 3.67
Denmark (DIS) 534 13 846 25 929 0.90 86.66 372 2.69
Indonesia 6 332 13 512 2 134 0.88 87.54 3 483 25.78 11.63
United States 6 461 11 997 1 857 0.78 88.32 4 585 38.22
Bermuda 164 11 598 70 722 0.76 89.08 9 301 80.19 6.80
1 449 10 895 7 519 0.71 89.79 990 9.09 1.58
Turkey 1 360 9 535 7 011 0.62 90.41 710 7.45 9.03
Netherlands 1 382 8 279 5 991 0.54 90.95 3 338 40.31 17.67
France (FIS) 161 7 973 49 521 0.52 91.47 4 980 62.47 1.17
Russian Federation 3 362 7 413 2 205 0.48 91.95 1 632 22.01 0.18
Philippines 1 995 6 694 3 355 0.44 92.39 5 834 87.16
Belgium 235 6 663 28 352 0.43 92.83 326 4.90
Viet Nam 1 525 6 072 3 982 0.40 93.22 845 13.92 2.94
Saint Vincent and the Grenadines
857 5 636 6 577 0.37 93.59 5 636 100.00
China, Taiwan Province of
906 4 328 4 777 0.28 93.87 147 3.40 0.43
Thailand 850 4 249 4 999 0.28 94.15 398 9.36
Kuwait 206 3 976 19 301 0.26 94.41 1 0.02 32.27
of registration 71 846 1 448 285 20 158 94.41 94.41 1 082 977 10.65
World total 104 305 1 534 019 14 707 100.00 100.00 1 133 417 9.91
(ranked by deadweight tonnage), as of 1 January 2012a
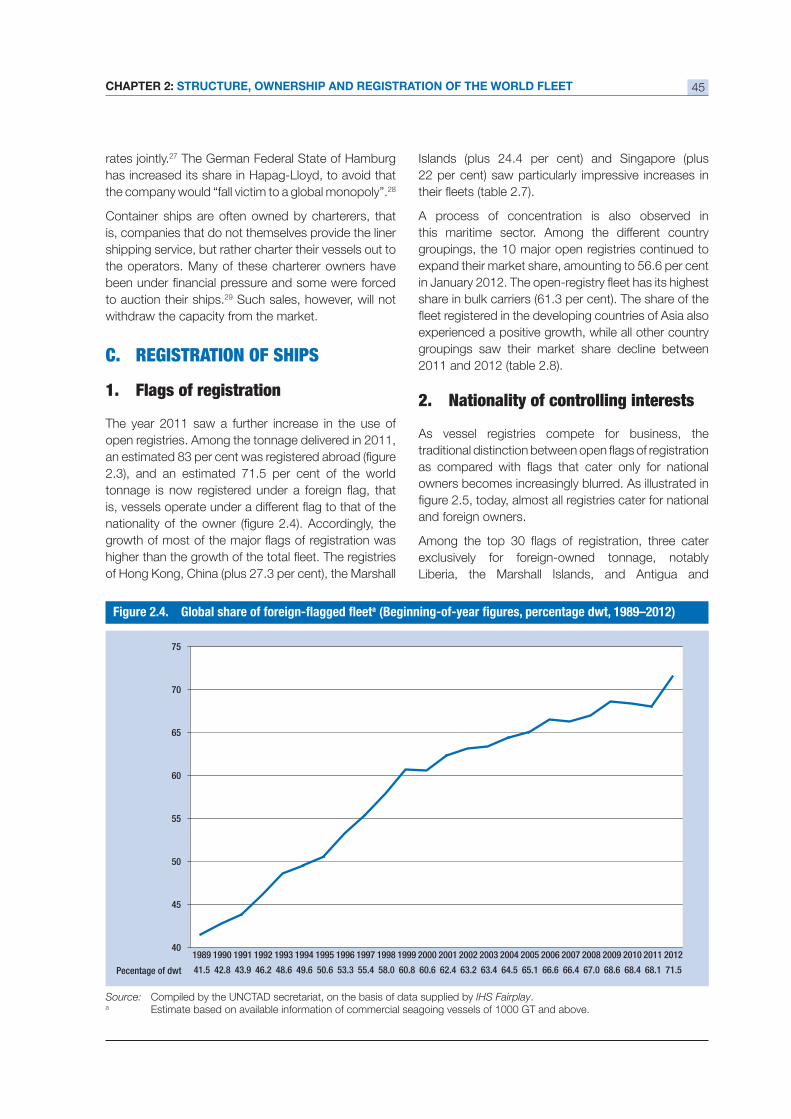
CHAPTER 2: STRUCTURE, OWNERSHIP AND REGISTRATION OF THE WORLD FLEET 45
27 The German Federal State of Hamburg
has increased its share in Hapag-Lloyd, to avoid that
the company would “fall victim to a global monopoly”.28
Container ships are often owned by charterers, that
is, companies that do not themselves provide the liner
shipping service, but rather charter their vessels out to
the operators. Many of these charterer owners have
to auction their ships.29 Such sales, however, will not
withdraw the capacity from the market.
C. REGISTRATION OF SHIPS
1. Flags of registration
The year 2011 saw a further increase in the use of
open registries. Among the tonnage delivered in 2011,
A process of concentration is also observed in
this maritime sector. Among the different country
experienced a positive growth, while all other country
groupings saw their market share decline between
2. Nationality of controlling interests
As vessel registries compete for business, the
owners becomes increasingly blurred. As illustrated in
and foreign owners.
exclusively for foreign-owned tonnage, notably
Liberia, the Marshall Islands, and Antigua and
40
45
50
55
60
65
70
75
Pecentage of dwt 41.5 42.8 43.9 46.2 48.6 49.6 50.6 53.3 55.4 58.0 60.8 60.6 62.4 63.2 63.4 64.5 65.1 66.6 66.4 67.0 68.6 68.4 68.1 71.5
1989 1990 1991 1992 1993 1994 1995 1996 1997 1998 1999 2000 2001 2002 2003 2004 2005 2006 2007 2008 2009 2010 2011 2012
a
Source: Compiled by the UNCTAD secretariat, on the basis of data supplied by IHS Fairplay.a
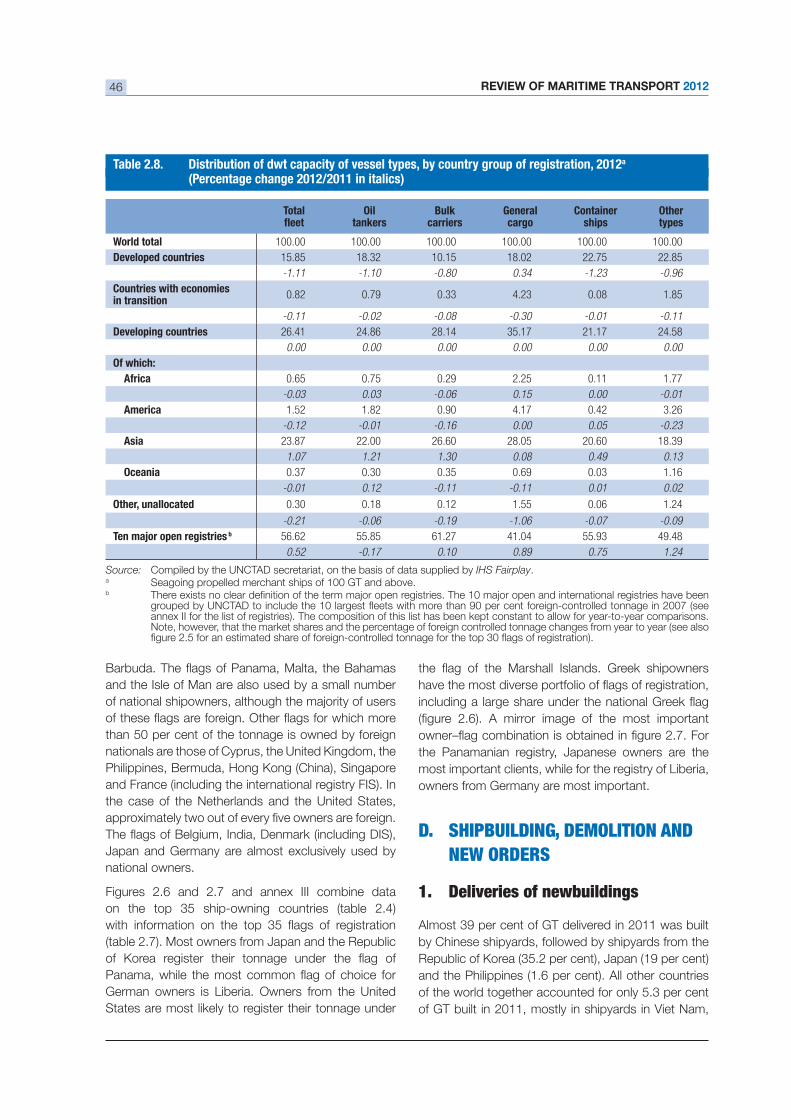
REVIEW OF MARITIME TRANSPORT 201246
Source: Compiled by the UNCTAD secretariat, on the basis of data supplied by IHS Fairplay.a Seagoing propelled merchant ships of 100 GT and above. b
annex II for the list of registries). The composition of this list has been kept constant to allow for year-to-year comparisons. Note, however, that the market shares and the percentage of foreign controlled tonnage changes from year to year (see also
Total Oil tankers
Bulkcarriers
Generalcargo
Containerships
Other types
World total 100.00 100.00 100.00 100.00 100.00 100.00
Developed countries 15.85 18.32 10.15 18.02 22.75 22.85
-1.11 -1.10 -0.80 0.34 -1.23 -0.96
Countries with economiesin transition
0.82 0.79 0.33 4.23 0.08 1.85
-0.11 -0.02 -0.08 -0.30 -0.01 -0.11
Developing countries 26.41 24.86 28.14 35.17 21.17 24.58
0.00 0.00 0.00 0.00 0.00 0.00
Of which:
Africa 0.65 0.75 0.29 2.25 0.11 1.77
-0.03 0.03 -0.06 0.15 0.00 -0.01
America 1.52 1.82 0.90 4.17 0.42 3.26
-0.12 -0.01 -0.16 0.00 0.05 -0.23
Asia 23.87 22.00 26.60 28.05 20.60 18.39
1.07 1.21 1.30 0.08 0.49 0.13
Oceania 0.37 0.30 0.35 0.69 0.03 1.16
-0.01 0.12 -0.11 -0.11 0.01 0.02
Other, unallocated 0.30 0.18 0.12 1.55 0.06 1.24
-0.21 -0.06 -0.19 -1.06 -0.07 -0.09b 56.62 55.85 61.27 41.04 55.93 49.48
0.52 -0.17 0.10 0.89 0.75 1.24
Table 2.8. Distribution of dwt capacity of vessel types, by country group of registration, 2012a
(Percentage change 2012/2011 in italics)
and the Isle of Man are also used by a small number
nationals are those of Cyprus, the United Kingdom, the
Philippines, Bermuda, Hong Kong (China), Singapore
and France (including the international registry FIS). In
the case of the Netherlands and the United States,
Japan and Germany are almost exclusively used by
national owners.
Figures 2.6 and 2.7 and annex III combine data
German owners is Liberia. Owners from the United
States are most likely to register their tonnage under
the Panamanian registry, Japanese owners are the
most important clients, while for the registry of Liberia,
owners from Germany are most important.
D. SHIPBUILDING, DEMOLITION AND
NEW ORDERS
1. Deliveries of newbuildings
by Chinese shipyards, followed by shipyards from the
of GT built in 2011, mostly in shipyards in Viet Nam,
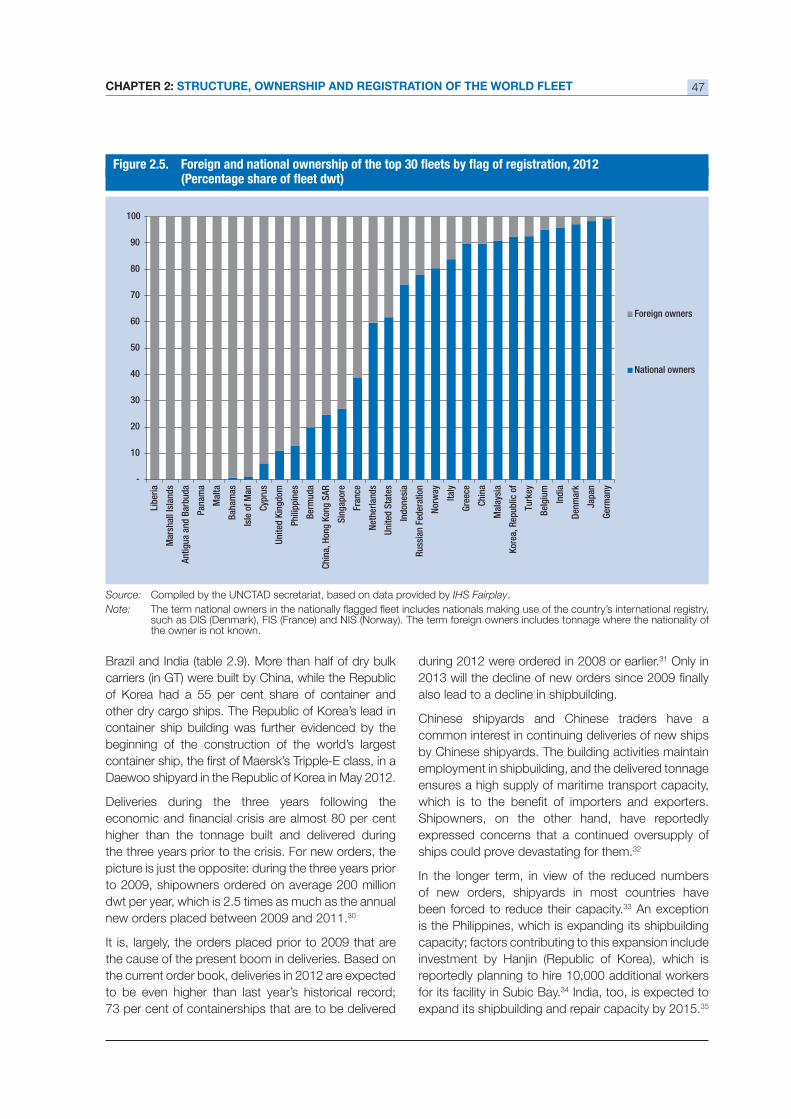
CHAPTER 2: STRUCTURE, OWNERSHIP AND REGISTRATION OF THE WORLD FLEET 47
-
10
20
30
40
50
60
70
80
90
100
Libe
ria
Mar
shal
l Isl
ands
Antig
ua a
nd B
arbu
da
Pana
ma
Mal
ta
Baha
mas
Isle
of M
an
Cypr
us
Unite
d Ki
ngdo
m
Phili
ppin
es
Berm
uda
Chin
a, H
ong
Kong
SAR
Sing
apor
e
Fran
ce
Neth
erla
nds
Unite
d St
ates
Indo
nesi
a
Russ
ian
Fede
ratio
n
Norw
ay
Italy
Gree
ce
Chin
a
Mal
aysi
a
Kore
a, R
epub
lic o
f
Turk
ey
Belg
ium
Indi
a
Denm
ark
Japa
n
Germ
any
Foreign owners
National owners
Source: Compiled by the UNCTAD secretariat, based on data provided by IHS Fairplay.
Note: such as DIS (Denmark), FIS (France) and NIS (Norway). The term foreign owners includes tonnage where the nationality of the owner is not known.
carriers (in GT) were built by China, while the Republic
other dry cargo ships. The Republic of Korea’s lead in
container ship building was further evidenced by the
beginning of the construction of the world’s largest
Daewoo shipyard in the Republic of Korea in May 2012.
Deliveries during the three years following the
higher than the tonnage built and delivered during
the three years prior to the crisis. For new orders, the
dwt per year, which is 2.5 times as much as the annual
new orders placed between 2009 and 2011.30
It is, largely, the orders placed prior to 2009 that are
the cause of the present boom in deliveries. Based on
the current order book, deliveries in 2012 are expected
to be even higher than last year’s historical record;
during 2012 were ordered in 2008 or earlier.31 Only in
also lead to a decline in shipbuilding.
Chinese shipyards and Chinese traders have a
common interest in continuing deliveries of new ships
by Chinese shipyards. The building activities maintain
employment in shipbuilding, and the delivered tonnage
ensures a high supply of maritime transport capacity,
Shipowners, on the other hand, have reportedly
expressed concerns that a continued oversupply of
ships could prove devastating for them.32
In the longer term, in view of the reduced numbers
of new orders, shipyards in most countries have
been forced to reduce their capacity.33 An exception
is the Philippines, which is expanding its shipbuilding
capacity; factors contributing to this expansion include
reportedly planning to hire 10,000 additional workers
for its facility in Subic Bay.34 India, too, is expected to
expand its shipbuilding and repair capacity by 2015.35
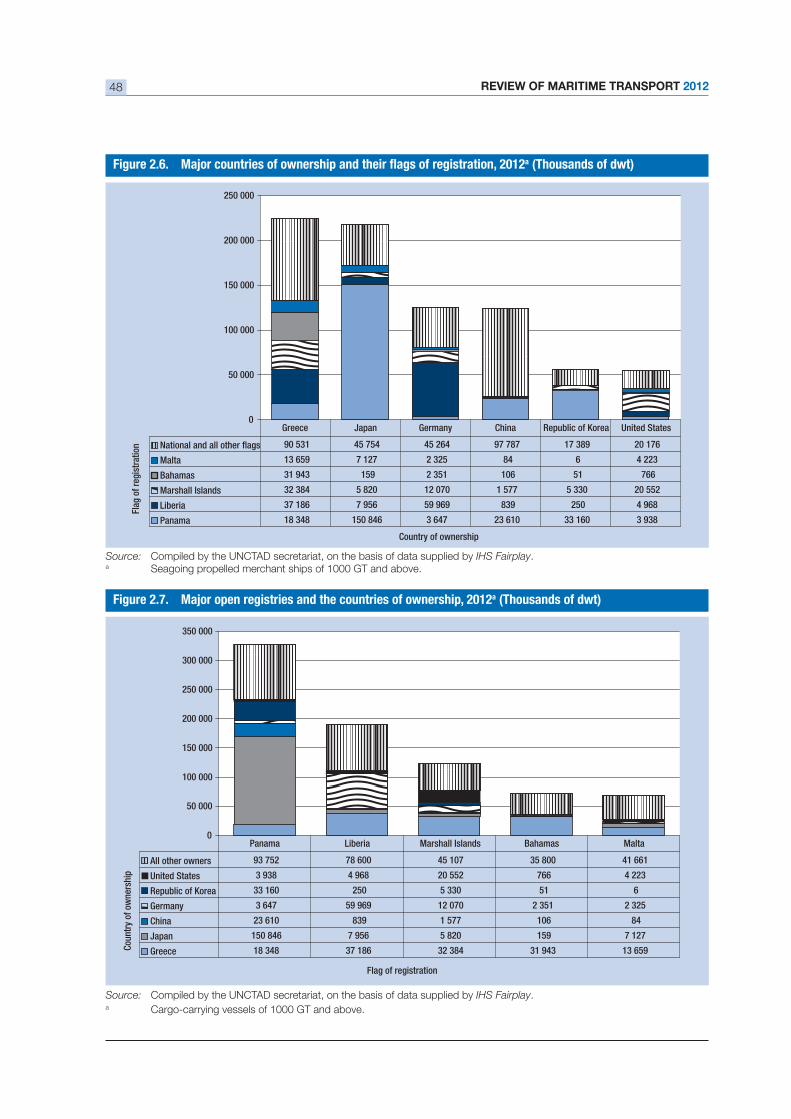
REVIEW OF MARITIME TRANSPORT 201248
0
50 000
100 000
150 000
200 000
250 000
Country of ownership
Flag
of r
egis
trat
ion National and all other flags 90 531 45 754 45 264 97 787 17 389 20 176
Malta 13 659 7 127 2 325 84 6 4 223
Bahamas 31 943 159 2 351 106 51 766
Marshall Islands 32 384 5 820 12 070 1 577 5 330 20 552
Liberia 37 186 7 956 59 969 839 250 4 968
Panama 18 348 150 846 3 647 23 610 33 160 3 938
Greece Japan Germany China Republic of Korea United States
0
50 000
100 000
150 000
200 000
250 000
300 000
350 000
Flag of registration
Coun
try
of o
wne
rshi
p
All other owners 93 752 78 600 45 107 35 800 41 661
United States 3 938 4 968 20 552 766 4 223
Republic of Korea 33 160 250 5 330 51 6
Germany 3 647 59 969 12 070 2 351 2 325
China 23 610 839 1 577 106 84
Japan 150 846 7 956 5 820 159 7 127
Greece 18 348 37 186 32 384 31 943 13 659
Panama Liberia Marshall Islands Bahamas Malta
a (Thousands of dwt)
a (Thousands of dwt)
Source: Compiled by the UNCTAD secretariat, on the basis of data supplied by IHS Fairplay.a Seagoing propelled merchant ships of 1000 GT and above.
Source: Compiled by the UNCTAD secretariat, on the basis of data supplied by IHS Fairplay.a Cargo-carrying vessels of 1000 GT and above.
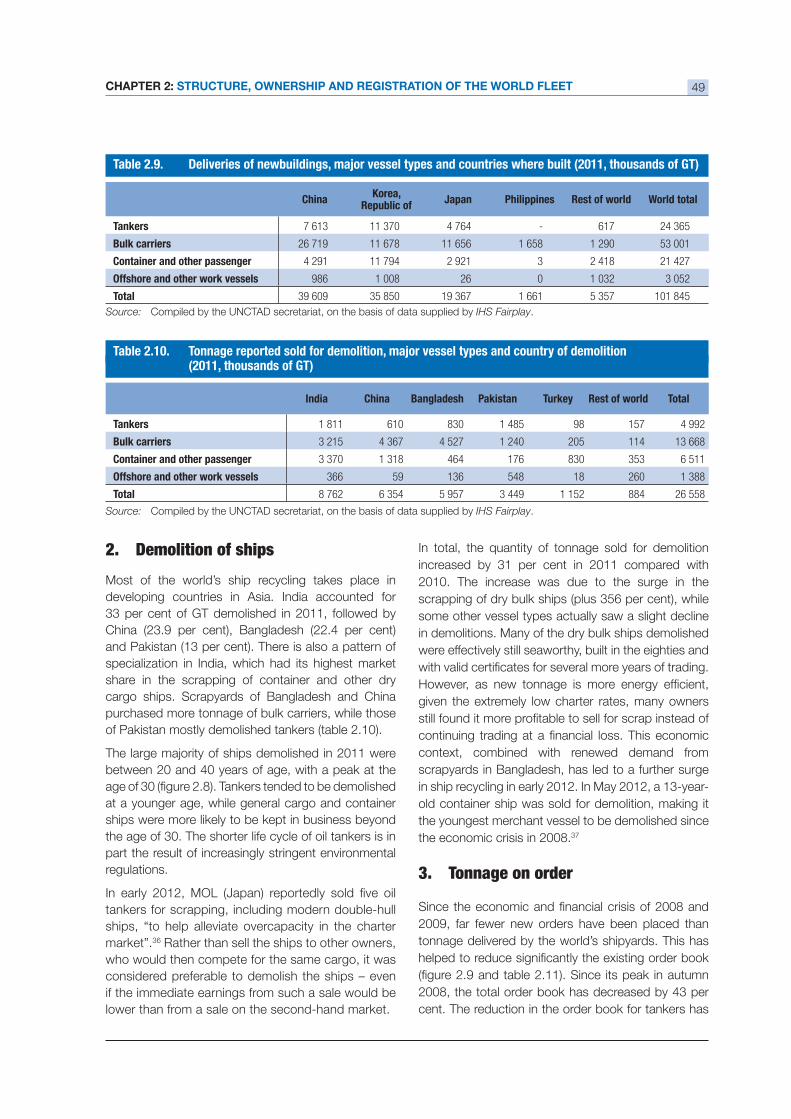
CHAPTER 2: STRUCTURE, OWNERSHIP AND REGISTRATION OF THE WORLD FLEET 49
Source: Compiled by the UNCTAD secretariat, on the basis of data supplied by IHS Fairplay.
Source: Compiled by the UNCTAD secretariat, on the basis of data supplied by IHS Fairplay.
ChinaKorea,
Republic ofJapan Philippines Rest of world World total
Tankers 7 613 11 370 4 764 617 24 365
Bulk carriers 26 719 11 678 11 656 1 658 1 290 53 001
Container and other passenger 4 291 11 794 2 921 3 2 418 21 427
Offshore and other work vessels 986 1 008 26 0 1 032 3 052
Total 39 609 35 850 19 367 1 661 5 357 101 845
India China Bangladesh Pakistan Turkey Rest of world Total
Tankers 1 811 610 830 1 485 98 157 4 992
Bulk carriers 3 215 4 367 4 527 1 240 205 114 13 668
Container and other passenger 3 370 1 318 464 176 830 353 6 511
Offshore and other work vessels 366 59 136 548 18 260 1 388
Total 8 762 6 354 5 957 3 449 1 152 884 26 558
(2011, thousands of GT)
2. Demolition of ships
Most of the world’s ship recycling takes place in
developing countries in Asia. India accounted for
specialization in India, which had its highest market
share in the scrapping of container and other dry
cargo ships. Scrapyards of Bangladesh and China
purchased more tonnage of bulk carriers, while those
between 20 and 40 years of age, with a peak at the
at a younger age, while general cargo and container
ships were more likely to be kept in business beyond
the age of 30. The shorter life cycle of oil tankers is in
part the result of increasingly stringent environmental
regulations.
tankers for scrapping, including modern double-hull
ships, “to help alleviate overcapacity in the charter
market”.36 Rather than sell the ships to other owners,
who would then compete for the same cargo, it was
considered preferable to demolish the ships – even
if the immediate earnings from such a sale would be
lower than from a sale on the second-hand market.
2010. The increase was due to the surge in the
some other vessel types actually saw a slight decline
in demolitions. Many of the dry bulk ships demolished
were effectively still seaworthy, built in the eighties and
given the extremely low charter rates, many owners
context, combined with renewed demand from
scrapyards in Bangladesh, has led to a further surge
in ship recycling in early 2012. In May 2012, a 13-year-
old container ship was sold for demolition, making it
the youngest merchant vessel to be demolished since
the economic crisis in 2008.37
3. Tonnage on order
2009, far fewer new orders have been placed than
tonnage delivered by the world’s shipyards. This has
cent. The reduction in the order book for tankers has
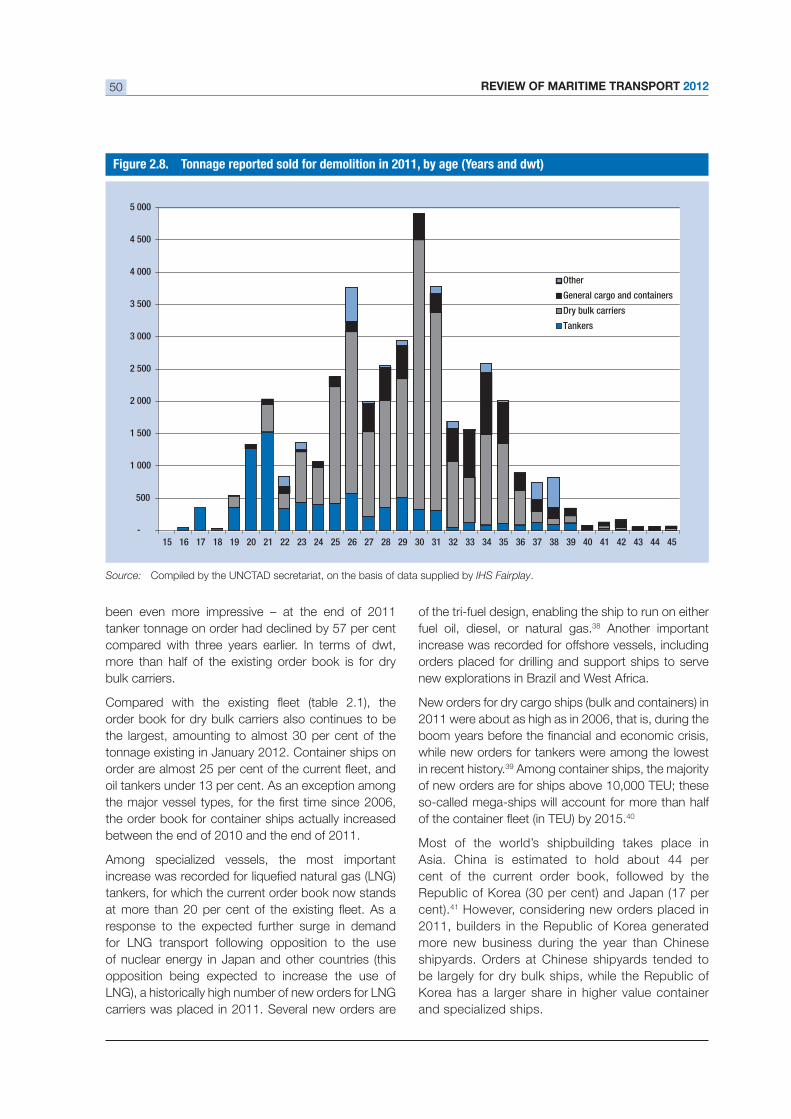
REVIEW OF MARITIME TRANSPORT 201250
-
500
1 000
1 500
2 000
2 500
3 000
3 500
4 000
4 500
5 000
15 16 17 18 19 20 21 22 23 24 25 26 27 28 29 30 31 32 33 34 35 36 37 38 39 40 41 42 43 44 45
Other
General cargo and containers
Dry bulk carriers
Tankers
Figure 2.8. Tonnage reported sold for demolition in 2011, by age (Years and dwt)
Source: Compiled by the UNCTAD secretariat, on the basis of data supplied by IHS Fairplay.
been even more impressive – at the end of 2011
compared with three years earlier. In terms of dwt,
more than half of the existing order book is for dry
bulk carriers.
order book for dry bulk carriers also continues to be
tonnage existing in January 2012. Container ships on
the order book for container ships actually increased
between the end of 2010 and the end of 2011.
Among specialized vessels, the most important
tankers, for which the current order book now stands
response to the expected further surge in demand
for LNG transport following opposition to the use
of nuclear energy in Japan and other countries (this
opposition being expected to increase the use of
LNG), a historically high number of new orders for LNG
carriers was placed in 2011. Several new orders are
of the tri-fuel design, enabling the ship to run on either
fuel oil, diesel, or natural gas.38 Another important
increase was recorded for offshore vessels, including
orders placed for drilling and support ships to serve
new explorations in Brazil and West Africa.
New orders for dry cargo ships (bulk and containers) in
2011 were about as high as in 2006, that is, during the
while new orders for tankers were among the lowest
in recent history.39
of new orders are for ships above 10,000 TEU; these
so-called mega-ships will account for more than half 40
Most of the world’s shipbuilding takes place in
cent of the current order book, followed by the
cent).41 However, considering new orders placed in
2011, builders in the Republic of Korea generated
more new business during the year than Chinese
shipyards. Orders at Chinese shipyards tended to
be largely for dry bulk ships, while the Republic of
Korea has a larger share in higher value container
and specialized ships.
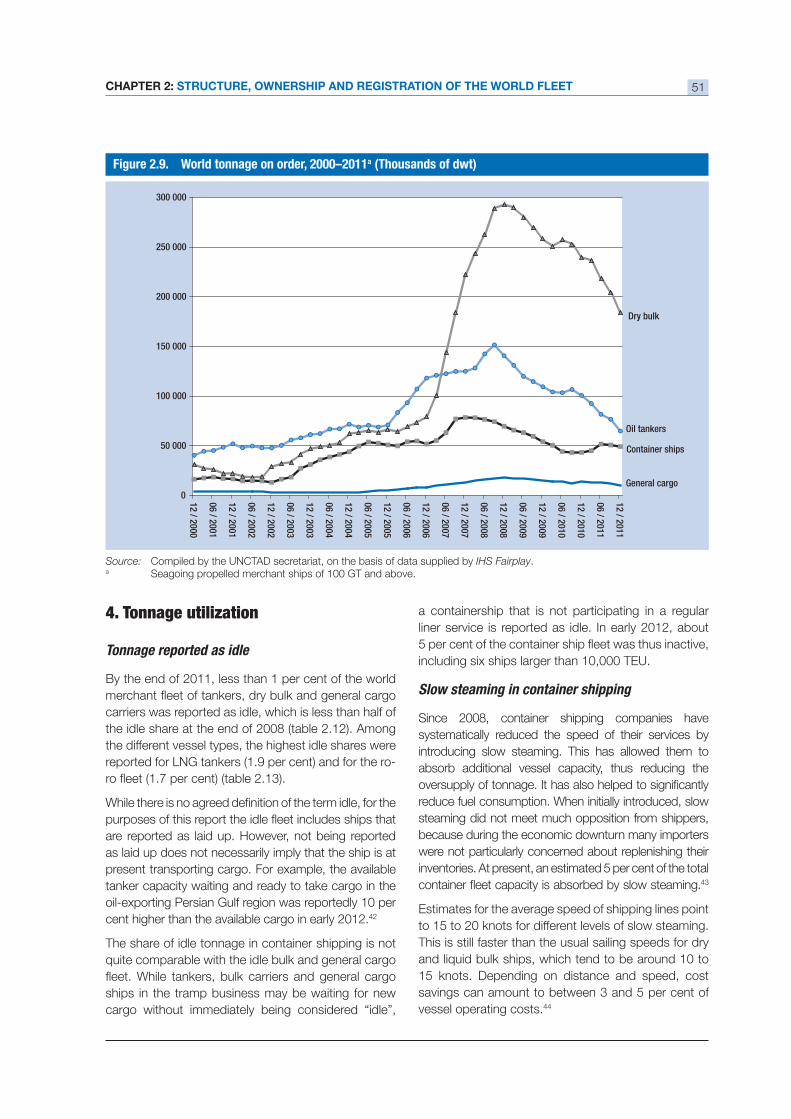
CHAPTER 2: STRUCTURE, OWNERSHIP AND REGISTRATION OF THE WORLD FLEET 51
Oil tankers
Dry bulk
General cargo
Container ships
0
50 000
100 000
150 000
200 000
250 000
300 000
12 / 2000
06 / 2001
12 / 2001
06 / 2002
12 / 2002
06 / 2003
12 / 2003
06 / 2004
12 / 2004
06 / 2005
12 / 2005
06 / 2006
12 / 2006
06 / 2007
12 / 2007
06 / 2008
12 / 2008
06 / 2009
12 / 2009
06 / 2010
12 / 2010
06 / 2011
12 / 2011Figure 2.9. World tonnage on order, 2000–2011a (Thousands of dwt)
Source: Compiled by the UNCTAD secretariat, on the basis of data supplied by IHS Fairplay.a Seagoing propelled merchant ships of 100 GT and above.
4. Tonnage utilization
Tonnage reported as idle
carriers was reported as idle, which is less than half of
the different vessel types, the highest idle shares were
are reported as laid up. However, not being reported
as laid up does not necessarily imply that the ship is at
present transporting cargo. For example, the available
tanker capacity waiting and ready to take cargo in the
cent higher than the available cargo in early 2012.42
The share of idle tonnage in container shipping is not
ships in the tramp business may be waiting for new
cargo without immediately being considered “idle”,
a containership that is not participating in a regular
liner service is reported as idle. In early 2012, about
including six ships larger than 10,000 TEU.
Slow steaming in container shipping
Since 2008, container shipping companies have
systematically reduced the speed of their services by
introducing slow steaming. This has allowed them to
absorb additional vessel capacity, thus reducing the
reduce fuel consumption. When initially introduced, slow
steaming did not meet much opposition from shippers,
because during the economic downturn many importers
were not particularly concerned about replenishing their
43
Estimates for the average speed of shipping lines point
to 15 to 20 knots for different levels of slow steaming.
This is still faster than the usual sailing speeds for dry
15 knots. Depending on distance and speed, cost
vessel operating costs.44
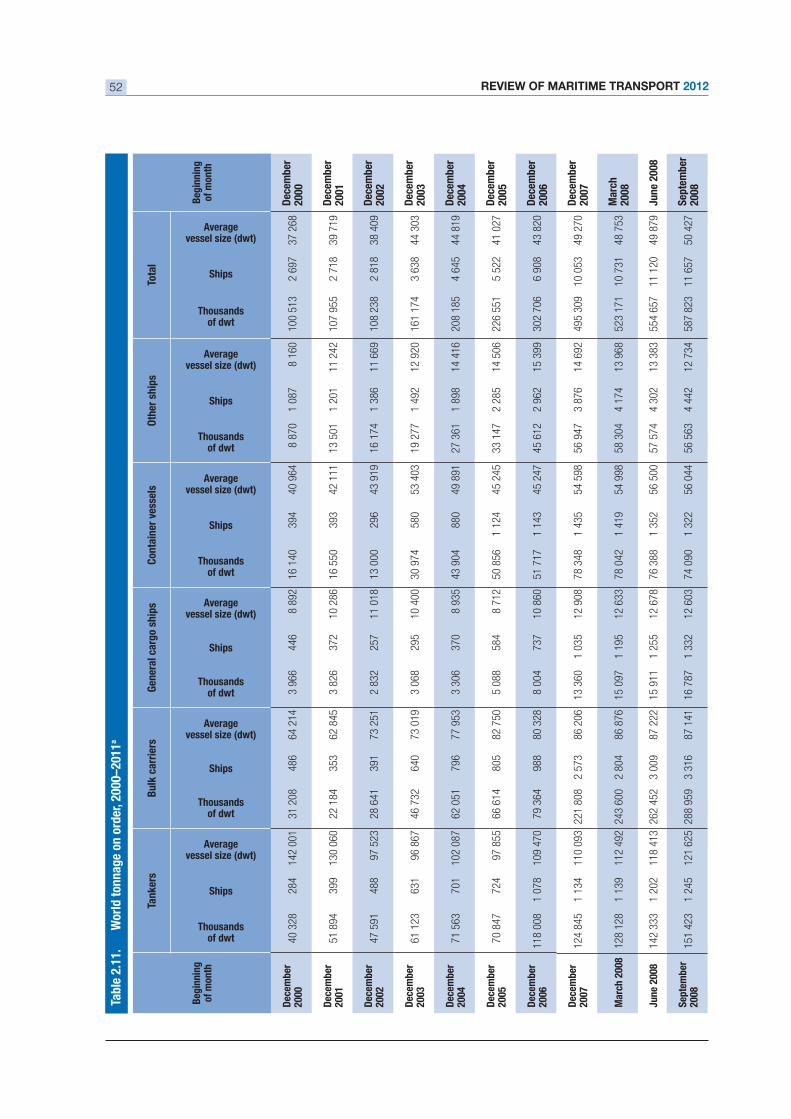
REVIEW OF MARITIME TRANSPORT 201252
Beg
inni
ngof
mon
th
Tank
ers
Bul
k ca
rrie
rsG
ener
al c
argo
shi
psC
onta
iner
ves
sels
Oth
er s
hips
Tota
l
Beg
inni
ngof
mon
th
Thousands of dwt
Ships
Averagevessel size (dwt)
Thousands of dwt
Ships
Averagevessel size (dwt)
Thousands of dwt
Ships
Averagevessel size (dwt)
Thousands of dwt
Ships
Averagevessel size (dwt)
Thousands of dwt
Ships
Averagevessel size (dwt)
Thousands of dwt
Ships
Averagevessel size (dwt)
Dec
embe
r 20
00 4
0 32
8 2
84 1
42 0
01 3
1 20
8 4
86 6
4 21
4 3
966
446
8 8
92 1
6 14
0 3
94 4
0 96
4 8
870
1 0
87 8
160
100
513
2 6
97 3
7 26
8D
ecem
ber
2000
Dec
embe
r 20
01 5
1 89
4 3
99 1
30 0
60 2
2 18
4 3
53 6
2 84
5 3
826
372
10
286
16
550
393
42
111
13
501
1 2
01 1
1 24
2 1
07 9
55 2
718
39
719
Dec
embe
r 20
01
Dec
embe
r 20
02 4
7 59
1 4
88 9
7 52
3 2
8 64
1 3
91 7
3 25
1 2
832
257
11
018
13
000
296
43
919
16
174
1 3
86 1
1 66
9 1
08 2
38 2
818
38
409
Dec
embe
r 20
02
Dec
embe
r 6
1 12
3 6
31 9
6 86
7 4
6 73
2 6
40 7
3 01
9 3
068
295
10
400
30
974
580
53
403
19
277
1 4
92 1
2 92
0 1
61 1
74 3
638
44
303
Dec
embe
r
Dec
embe
r 20
04 7
1 56
3 7
01 1
02 0
87 6
2 05
1 7
96 7
7 95
3 3
306
370
8 9
35 4
3 90
4 8
80 4
9 89
1 2
7 36
1 1
898
14
416
208
185
4 6
45 4
4 81
9D
ecem
ber
2004
Dec
embe
r 20
05 7
0 84
7 7
24 9
7 85
5 6
6 61
4 8
05 8
2 75
0 5
088
584
8 7
12 5
0 85
6 1
124
45
245
33
147
2 2
85 1
4 50
6 2
26 5
51 5
522
41
027
Dec
embe
r 20
05
Dec
embe
r 20
06 1
18 0
08 1
078
109
470
79
364
988
80
328
8 0
04 7
37 1
0 86
0 5
1 71
7 1
143
45
247
45
612
2 9
62 1
5 39
9 3
02 7
06 6
908
43
820
Dec
embe
r 20
06
Dec
embe
r 20
07 1
24 8
45 1
134
110
093
221
808
2 5
73 8
6 20
6 1
3 36
0 1
035
12
908
78
348
1 4
35 5
4 59
8 5
6 94
7 3
876
14
692
495
309
10
053
49
270
Dec
embe
r 20
07
128
128
1 1
39 1
12 4
92 2
43 6
00 2
804
86
876
15
097
1 1
95 1
2 63
3 7
8 04
2 1
419
54
998
58
304
4 1
74 1
3 96
8 5
23 1
71 1
0 73
1 4
8 75
320
08
June
200
8 1
42 3
33 1
202
118
413
262
452
3 0
09 8
7 22
2 1
5 91
1 1
255
12
678
76
388
1 3
52 5
6 50
0 5
7 57
4 4
302
13
383
554
657
11
120
49
879
June
200
8
Sep
tem
ber
2008
151
423
1 2
45 1
21 6
25 2
88 9
59 3
316
87
141
16
787
1 3
32 1
2 60
3 7
4 09
0 1
322
56
044
56
563
4 4
42 1
2 73
4 5
87 8
23 1
1 65
7 5
0 42
7S
epte
mbe
r 20
08
Tabl
e 2.
11.
Wor
ld t
onna
ge o
n or
der,
2000
–201
1a
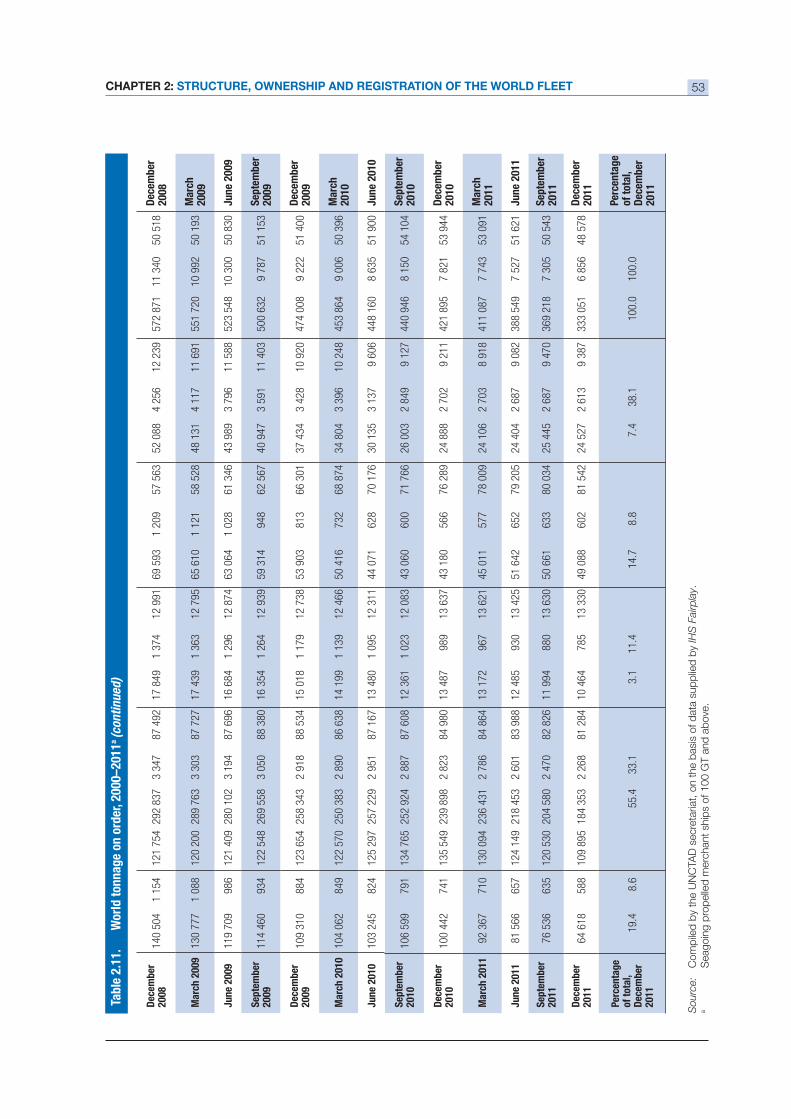
CHAPTER 2: STRUCTURE, OWNERSHIP AND REGISTRATION OF THE WORLD FLEET 53
Tabl
e 2.
11.
Wor
ld t
onna
ge o
n or
der,
2000
–201
1a (c
onti
nued
)
Dec
embe
r 20
08 1
40 5
04 1
154
121
754
292
837
3 3
47 8
7 49
2 1
7 84
9 1
374
12
991
69
593
1 2
09 5
7 56
3 5
2 08
8 4
256
12
239
572
871
11
340
50
518
Dec
embe
r 20
08
130
777
1 0
88 1
20 2
00 2
89 7
63 3
303
87
727
17
439
1 3
63 1
2 79
5 6
5 61
0 1
121
58
528
48
131
4 1
17 1
1 69
1 5
51 7
20 1
0 99
2 5
0 19
320
09
June
200
9 1
19 7
09 9
86 1
21 4
09 2
80 1
02 3
194
87
696
16
684
1 2
96 1
2 87
4 6
3 06
4 1
028
61
346
43
989
3 7
96 1
1 58
8 5
23 5
48 1
0 30
0 5
0 83
0Ju
ne 2
009
Sep
tem
ber
2009
114
460
934
122
548
269
558
3 0
50 8
8 38
0 1
6 35
4 1
264
12
939
59
314
948
62
567
40
947
3 5
91 1
1 40
3 5
00 6
32 9
787
51
153
Sep
tem
ber
2009
Dec
embe
r 20
09 1
09 3
10 8
84 1
23 6
54 2
58 3
43 2
918
88
534
15
018
1 1
79 1
2 73
8 5
3 90
3 8
13 6
6 30
1 3
7 43
4 3
428
10
920
474
008
9 2
22 5
1 40
0D
ecem
ber
2009
104
062
849
122
570
250
383
2 8
90 8
6 63
8 1
4 19
9 1
139
12
466
50
416
732
68
874
34
804
3 3
96 1
0 24
8 4
53 8
64 9
006
50
396
2010
June
201
0 1
03 2
45 8
24 1
25 2
97 2
57 2
29 2
951
87
167
13
480
1 0
95 1
2 31
1 4
4 07
1 6
28 7
0 17
6 3
0 13
5 3
137
9 6
06 4
48 1
60 8
635
51
900
June
201
0
Sep
tem
ber
2010
106
599
791
134
765
252
924
2 8
87 8
7 60
8 1
2 36
1 1
023
12
083
43
060
600
71
766
26
003
2 8
49 9
127
440
946
8 1
50 5
4 10
4S
epte
mbe
r 20
10
Dec
embe
r 20
10 1
00 4
42 7
41 1
35 5
49 2
39 8
98 2
823
84
980
13
487
989
13
637
43
180
566
76
289
24
888
2 7
02 9
211
421
895
7 8
21 5
3 94
4D
ecem
ber
2010
92
367
710
130
094
236
431
2 7
86 8
4 86
4 1
3 17
2 9
67 1
3 62
1 4
5 01
1 5
77 7
8 00
9 2
4 10
6 2
703
8 9
18 4
11 0
87 7
743
53
091
2011
June
201
1 8
1 56
6 6
57 1
24 1
49 2
18 4
53 2
601
83
988
12
485
930
13
425
51
642
652
79
205
24
404
2 6
87 9
082
388
549
7 5
27 5
1 62
1Ju
ne 2
011
Sep
tem
ber
2011
76
536
635
120
530
204
580
2 4
70 8
2 82
6 1
1 99
4 8
80 1
3 63
0 5
0 66
1 6
33 8
0 03
4 2
5 44
5 2
687
9 4
70 3
69 2
18 7
305
50
543
Sep
tem
ber
2011
Dec
embe
r 20
11 6
4 61
8 5
88 1
09 8
95 1
84 3
53 2
268
81
284
10
464
785
13
330
49
088
602
81
542
24
527
2 6
13 9
387
333
051
6 8
56 4
8 57
8D
ecem
ber
2011
Perc
enta
geof
tot
al,
Dec
embe
r 20
11
19.4
8.6
55.4
33.1
3.1
11.4
14.7
8.8
7.4
38.1
100.
010
0.0
Perc
enta
ge
of t
otal
, D
ecem
ber
2011
Sourc
e:
Com
pile
d b
y th
e U
NC
TAD
secre
taria
t, o
n t
he b
asi
s of d
ata
sup
plie
d b
y IH
S F
airp
lay.
aS
eag
oin
g p
rop
elle
d m
erc
hant
ship
s of 100 G
T a
nd
ab
ove
.
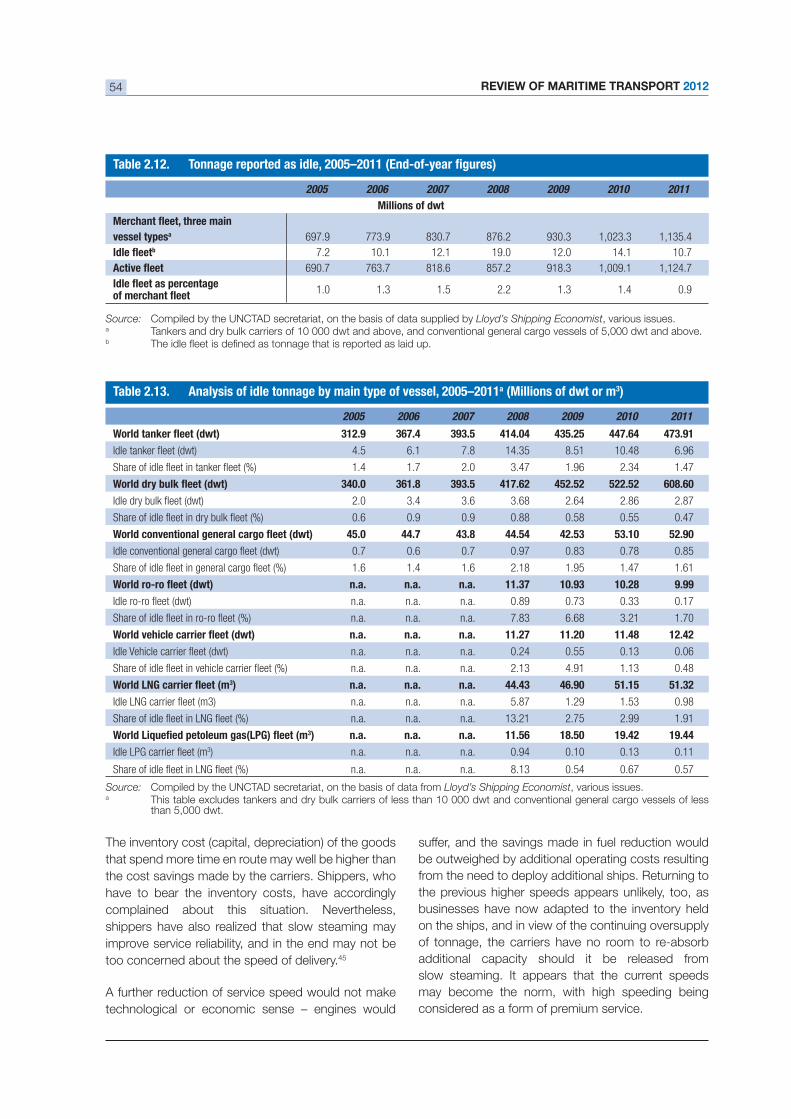
REVIEW OF MARITIME TRANSPORT 201254
Source: Compiled by the UNCTAD secretariat, on the basis of data supplied by Lloyd’s Shipping Economist, various issues.a Tankers and dry bulk carriers of 10 000 dwt and above, and conventional general cargo vessels of 5,000 dwt and above.b
Source: Compiled by the UNCTAD secretariat, on the basis of data from Lloyd’s Shipping Economist, various issues.a This table excludes tankers and dry bulk carriers of less than 10 000 dwt and conventional general cargo vessels of less
2005 2006 2007 2008 2009 2010 2011
vessel typesa 697.9 773.9 830.7 876.2 930.3 1,023.3 1,135.4 b 7.2 10.1 12.1 19.0 12.0 14.1 10.7
690.7 763.7 818.6 857.2 918.3 1,009.1 1,124.7
1.0 1.3 1.5 2.2 1.3 1.4 0.9
2005 2006 2007 2008 2009 2010 2011
414.04 447.64
4.5 6.1 7.8 14.35 8.51 10.48 6.96
1.4 1.7 2.0 3.47 1.96 2.34 1.47
417.62 452.52 522.52 608.60
2.0 3.4 3.6 3.68 2.64 2.86 2.87
0.6 0.9 0.9 0.88 0.58 0.55 0.47
45.0 44.7 44.54 52.90
0.7 0.6 0.7 0.97 0.83 0.78 0.85
1.6 1.4 1.6 2.18 1.95 1.47 1.61
n.a. n.a. n.a. 10.28 9.99
n.a. n.a. n.a. 0.89 0.73 0.33 0.17
n.a. n.a. n.a. 7.83 6.68 3.21 1.70
n.a. n.a. n.a. 11.27 11.20 11.48 12.42
n.a. n.a. n.a. 0.24 0.55 0.13 0.06
n.a. n.a. n.a. 2.13 4.91 1.13 0.48
) n.a. n.a. n.a. 46.90 51.15
n.a. n.a. n.a. 5.87 1.29 1.53 0.98
n.a. n.a. n.a. 13.21 2.75 2.99 1.91
) n.a. n.a. n.a. 11.56 18.50 19.42 19.44 3) n.a. n.a. n.a. 0.94 0.10 0.13 0.11
n.a. n.a. n.a. 8.13 0.54 0.67 0.57
a )
The inventory cost (capital, depreciation) of the goods
that spend more time en route may well be higher than
the cost savings made by the carriers. Shippers, who
have to bear the inventory costs, have accordingly
complained about this situation. Nevertheless,
shippers have also realized that slow steaming may
improve service reliability, and in the end may not be
too concerned about the speed of delivery.45
A further reduction of service speed would not make
technological or economic sense – engines would
suffer, and the savings made in fuel reduction would
be outweighed by additional operating costs resulting
from the need to deploy additional ships. Returning to
the previous higher speeds appears unlikely, too, as
businesses have now adapted to the inventory held
on the ships, and in view of the continuing oversupply
of tonnage, the carriers have no room to re-absorb
additional capacity should it be released from
slow steaming. It appears that the current speeds
may become the norm, with high speeding being
considered as a form of premium service.
CHAPTER 2: STRUCTURE, OWNERSHIP AND REGISTRATION OF THE WORLD FLEET 55
ENDNOTES
1 Clarkson (2012). Dry Bulk Trade Outlook. London, May 2012.
2 www.vale.com.
3 IHS Fairplay (2012). Bolting the door on Valemaxes. London, 9 February.
4 Lloyd’s List (2012). Vale in talks over access to China. London, 17 May.
5 Bloomberg (2012). Petrobras Books World’s Second-Biggest Oil Tanker. www.bloomberg.com. 9 March.
6 World Shipping Council website (2012). www.worldshipping.org. Accessed on 28 May 2012.
7 Drewry Shipping Consultants (2011). Global Container Terminal Operators, Annual Review and Forecast 2011. London, August.
8 Containerisation International (2012). Reefers on the slide. London, April.
9 Lloyd’s List (2012). China’s coastal trades absorb newbuilding surplus. London, 15 May, and: Lloyd’s List (2012). China hints at intervention for ailing industry. London, 21 March.
10 IHS Fairplay (2011). New dawn for African shipping. London, 15 September.
11 United States Department of Transportation Maritime Administration (2011). U.S. Water Transportation Statistical
12 Clarksons Shipping Intelligence Network (2011). Elderly Chinese Bulkers – Not A Clear Solution. www.clarksons.net. 19 December.
13 (2012). Not enough feeders, say steamer agents. http://expressbuzz.com. 3 April.
14 All Africa (2012). Nigeria: NIMASA poised to implement cabotage. http://allafrica.com/stories/201203300693.html. 30 March.
15 The Jakarta Post
16 1UNCTAD (2008). Review of Maritime Transport. Geneva.
17 Bloomberg (2012). No slower steaming as container lines run like clippers. www.bloomberg.com. 26 January.
18 Specialized press reporting, including Dynamar, Journal of Commerce, IHS Fairplay and Lloyd’s List, various issues.
19 Lloyd’s List (2012). No end in sight for the great shipping recession. London, 3 May.
20 Lloyd’s List (2012). Timing is everything. Whether Evergreen will in the end own or charter the ships is not yet decided. London, 26 April.
21 Lloyd’s List (2012). CSAV sees glimmers of improvement. London, 23 April.
22 IHS Fairplay (2011).Box lines poised to consolidate. London, 1 December.
23 Journal of Commerce
24 IHS Fairplay (2011). Outside the box. London, 22 December.
25 Lloyd’s List (2012). Shortsea and feeder trades will consolidate. London, 1 February.
26 Lloyd’s List (2012). No more smoke and mirrors. London, 10 May.
27 Lloyd’s List (2012). CSA urges China shipowners to seek government aid. London, 2 April.
28 Lloyd’s List (2012). State of Hamburg defends decision to buy more Hapag-Lloyd shares. London, 23 February.
29 Lloyd’s List
30 BRS (2012). World Shipping and Shipbuilding Markets Annual Review, 2012. Paris.
31 Clarkson Container Intelligence Monthly (2012). A little patience can go a long way. London, May.
32 Lloyd’s List (2012). Shipyard survival is zero-sum game. London, 20 March.
33 Helenic Shipping News: “Shipyards looking to trim capacity as demand slows down”, www.hellenicshippingnews.com, 7 May 2012; Reuters: “China’s shipyards founder as building boom ends”, www.reuters.com, 2 May 2012.
34
35 Associated Chambers of Commerce and Industry of India: “Shipbuilding & ship repair industry to reach Rs 9,200 crore by 2015”, www.assocham.org, 16 April 2012.
36 Lloyd’s List: “United action”, London, 30 January 2012; see also Hellenic Shipping News: “Demolition activity maintains pace as owners seek to easy oversupply issues”, www.hellenicshippingnews.com, 18 February 2012.
37 Lloyd’s List: “Downturn claims youngest vessel sold for scrap”, London, 22 May 2012.
38 IHS Fairplay Daily News: “Ten places LNG bet”, London, 10 April 2012.
39 BRS: “Shipping and Shipbuilding Markets Annual Review 2012”, Paris, 2012.
REVIEW OF MARITIME TRANSPORT 201256
40 Shipping Finance: “Containership industry consolidation to start again by 2015”, Athens, March 2012.
41 BRS: “Shipping and Shipbuilding Markets Annual Review 2012”, Paris, 2012.
42 Bloomberg: “Crude oil-tanker glut stays at four-week high, survey shows”, www.bloomberg.com, 14 February 2012.
interim ship states before they acknowledge that a ship is, in fact, laid up”; see Lloyd’s List: “Are ships idle or simply resting”, London, 21 March 2012.
43 IHS Fairplay Daily News: “More box ship idling seen”, London, 1 February 2012.
44 DC Velocity: “Slow steam ahead”, www.dcvelocity.com, 5 March 2012.
45 Bloomberg: “No slower steaming as container lines run like clippers”, www.bloomberg.com, 26 January 2012; Clarkson Container Intelligence Monthly: “A little patience can go a long way”, London, May 2012.
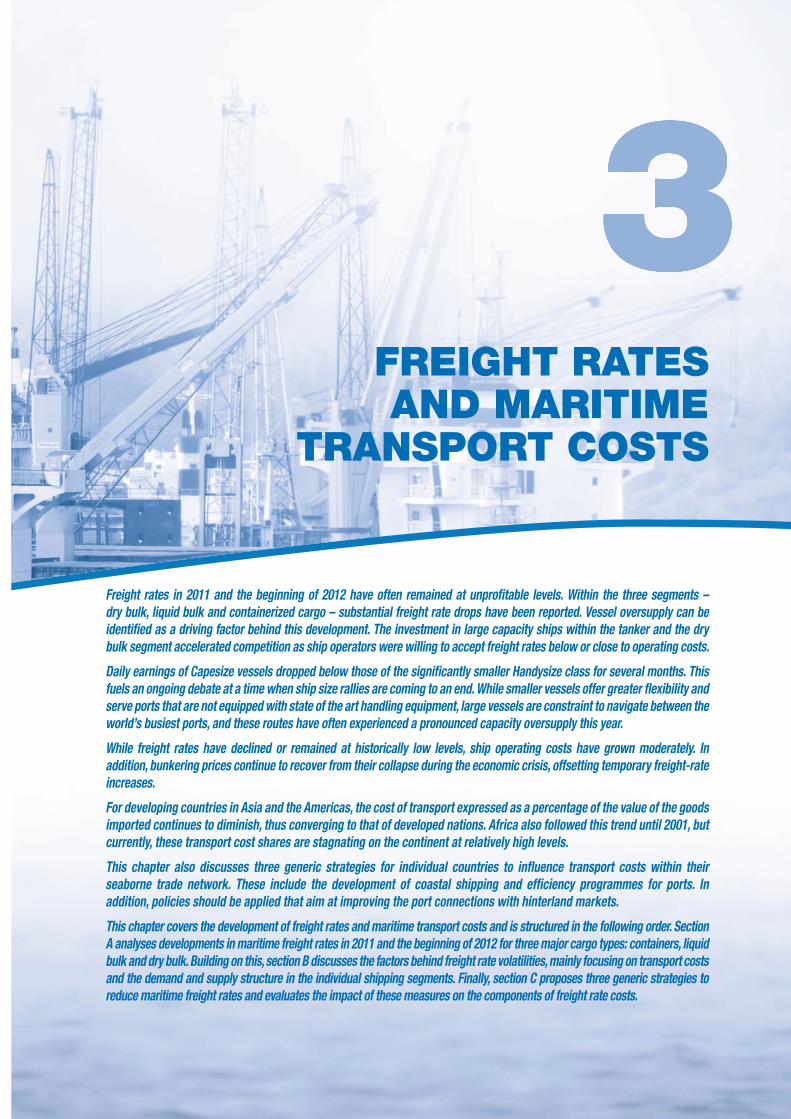
FREIGHT RATES AND MARITIME
TRANSPORT COSTS
REVIEW OF MARITIME TRANSPORT 201258
A. FREIGHT RATES
This section presents an analysis of maritime freight
rate developments for containers, dry bulk and
industry trends and gives a selective outlook on future
developments of freight markets.
1. Container freight rates
Having experienced one of the steepest freight
rate cuts in history in 2008, the recovery remains
sluggish in 2011. Current freight rates are still far from
reaching pre-crisis levels, having experienced another
downturn in the second half of 2011 after a temporary
resurgence. Time charter rates for container ships
have declined from May to December 2011 for most
a condensed container freight rate indicator covering
a wide range of ship sizes, which experienced a dip of
1
An overstretched container cargo market on the
supply side precipitated the low freight rate levels in
2011. While the demand is currently still recovering
crisis, the growth rates of the global container carrier
due in part to shipowners not being able to withdraw
from their buying contracts. In addition, ship operators
suffer from substantial bunkering price increases that
As a result, the industry has experienced aggressive
pricing policies of boxship operators competing for
market shares.2 Many box carriers are still operating
trade routes and/or raise prices for shippers. An
increases of between $200 and $400 on routes
linking Asia to Northern Europe and Western Africa.
Companies such as CMA CGM, CKYH and OOCL
cut their capacity on the transatlantic lanes.3 These
measures did not, however, lead to a substantial
freight rate increase in the overall container shipping
market in 2011. It is estimated that the total loss to the 4
High-volume routes, in particular, are experiencing an
increasing competition. Operators place their largest
ships in these networks and aim at offering more regular
services. As a result, shipping lines build alliances to
share costs, bundle capacity and streamline their
operations. Examples of this industry trend include the
partnership of MSC and CMA CGM, or the merging
of Asia–Europe services between the Grand Alliance
(Hapag-Lloyd, NYK and OOCL) and the New World
Alliance (HMM, APL and MOL).5 Individual shipping
to remain competitive on the world’s busiest shipping
lanes. Furthermore, with a growth rate predicted at
large-scale capacity is continuing to enter this market
segment.6
Container ship operators entering the reeferbusiness
The decline in freight rates in the container shipping
business increasingly puts competitive pressures
on specialized reefers. Refrigerated cargo is used
some of the idle capacity in the business. This trend
contains an increasing share of vessels with large
reefer capacity (see also chapter 2).7
Industry-leader reefers such as Star Reefers have
described 2011, as for 2010, as one of the poorest
years in the industry’s history, companies being hit
hard by the low freight rates and increased competition
from container ship operators.8 The spot market
rates for larger reefer ships reached an average of 43
cents per cubic feet per 30 days in 2011, following
42 cents in 2010.9 The near collapse of banana
exports from Ecuador and Central America since April
2011 brought additional stress to reefer freight rates.
Although a strong growth in demand for the transport
of perishable goods is being predicted, the shipping
industry will most likely also experience an ongoing
cargo shift from specialized reefers to container
ships. International container lines are constantly
introducing new regular services for the transportation
centres with the largest consumer markets, such as
Europe and North America. According to Drewry, in
will be transported by container ships, these providing
capacity.10
orderbook for specialized
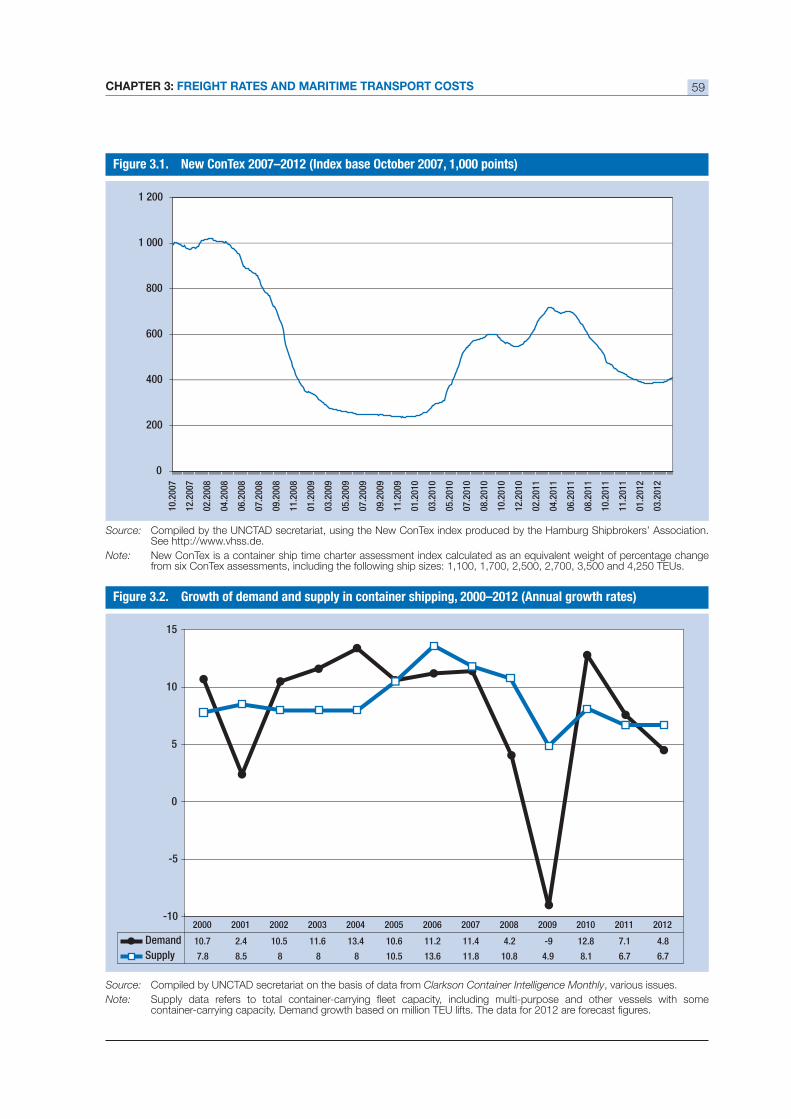
CHAPTER 3: FREIGHT RATES AND MARITIME TRANSPORT COSTS 59
Source: Compiled by the UNCTAD secretariat, using the New ConTex index produced by the Hamburg Shipbrokers’ Association. See http://www.vhss.de.
Note: from six ConTex assessments, including the following ship sizes: 1,100, 1,700, 2,500, 2,700, 3,500 and 4,250 TEUs.
Source: Compiled by UNCTAD secretariat on the basis of data from Clarkson Container Intelligence Monthly, various issues.
Note:
0
200
400
600
800
1 000
1 200
10.2
007
12.2
007
02.2
008
04.2
008
06.2
008
07.2
008
09.2
008
11.2
008
01.2
009
03.2
009
05.2
009
07.2
009
09.2
009
11.2
009
01.2
010
03.2
010
05.2
010
07.2
010
08.2
010
10.2
010
12.2
010
02.2
011
04.2
011
06.2
011
08.2
011
10.2
011
11.2
011
01.2
012
03.2
012
-10
-5
0
5
10
15
Demand 10.7 2.4 10.5 11.6 13.4 10.6 11.2 11.4 4.2 -9 12.8 7.1 4.8
Supply 7.8 8.5 8 8 8 10.5 13.6 11.8 10.8 4.9 8.1 6.7 6.7
2000 2001 2002 2003 2004 2005 2006 2007 2008 2009 2010 2011 2012
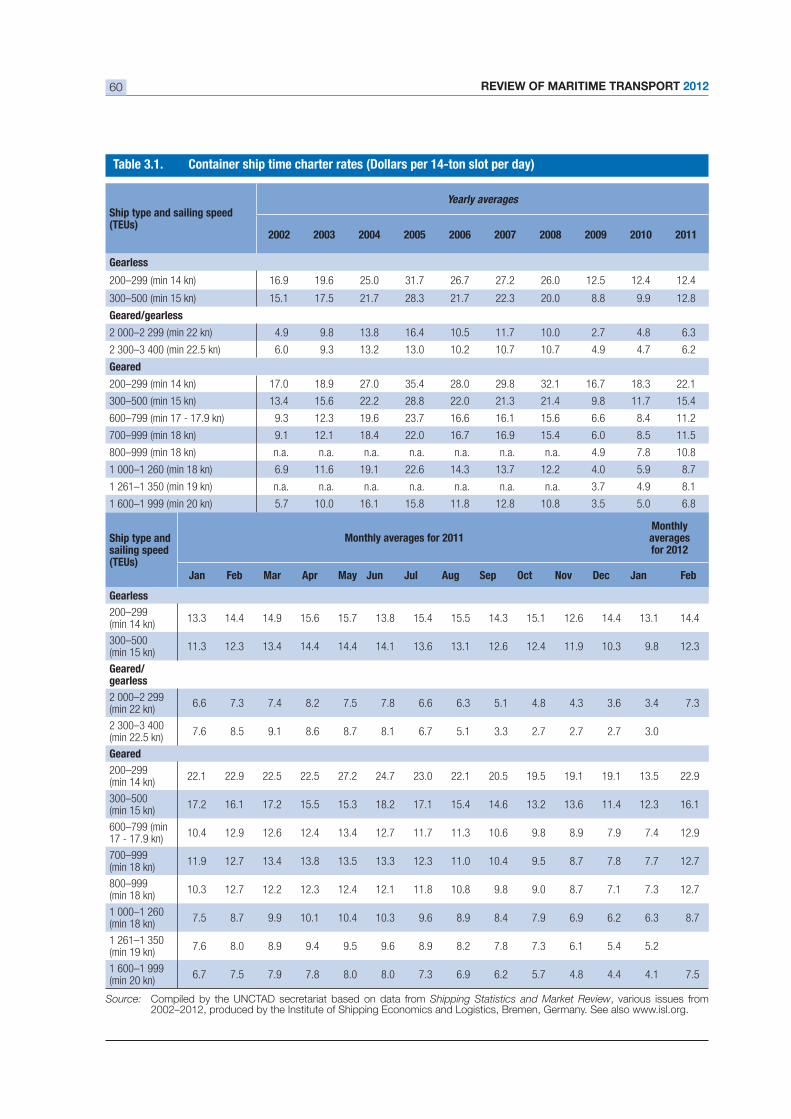
REVIEW OF MARITIME TRANSPORT 201260
Ship type and sailing speed(TEUs)
Yearly averages
2002 2004 2005 2006 2007 2008 2009 2010 2011
Gearless
200–299 (min 14 kn) 16.9 19.6 25.0 31.7 26.7 27.2 26.0 12.5 12.4 12.4
300–500 (min 15 kn) 15.1 17.5 21.7 28.3 21.7 22.3 20.0 8.8 9.9 12.8
Geared/gearless
2 000–2 299 (min 22 kn) 4.9 9.8 13.8 16.4 10.5 11.7 10.0 2.7 4.8 6.3
2 300–3 400 (min 22.5 kn) 6.0 9.3 13.2 13.0 10.2 10.7 10.7 4.9 4.7 6.2
Geared
200–299 (min 14 kn) 17.0 18.9 27.0 35.4 28.0 29.8 32.1 16.7 18.3 22.1
300–500 (min 15 kn) 13.4 15.6 22.2 28.8 22.0 21.3 21.4 9.8 11.7 15.4
9.3 12.3 19.6 23.7 16.6 16.1 15.6 6.6 8.4 11.2
700–999 (min 18 kn) 9.1 12.1 18.4 22.0 16.7 16.9 15.4 6.0 8.5 11.5
800–999 (min 18 kn) n.a. n.a. n.a. n.a. n.a. n.a. n.a. 4.9 7.8 10.8
1 000–1 260 (min 18 kn) 6.9 11.6 19.1 22.6 14.3 13.7 12.2 4.0 5.9 8.7
1 261–1 350 (min 19 kn) n.a. n.a. n.a. n.a. n.a. n.a. n.a. 3.7 4.9 8.1
1 600–1 999 (min 20 kn) 5.7 10.0 16.1 15.8 11.8 12.8 10.8 3.5 5.0 6.8
Ship type and sailing speed(TEUs)
averagesfor 2012
Jan Feb Apr Jun Jul Aug Sep Oct Nov Dec Jan Feb
Gearless
200–299(min 14 kn)
13.3 14.4 14.9 15.6 15.7 13.8 15.4 15.5 14.3 15.1 12.6 14.4 13.1 14.4
300–500(min 15 kn)
11.3 12.3 13.4 14.4 14.4 14.1 13.6 13.1 12.6 12.4 11.9 10.3 9.8 12.3
Geared/gearless
2 000–2 299 (min 22 kn)
6.6 7.3 7.4 8.2 7.5 7.8 6.6 6.3 5.1 4.8 4.3 3.6 3.4 7.3
2 300–3 400 (min 22.5 kn)
7.6 8.5 9.1 8.6 8.7 8.1 6.7 5.1 3.3 2.7 2.7 2.7 3.0
Geared
200–299(min 14 kn)
22.1 22.9 22.5 22.5 27.2 24.7 23.0 22.1 20.5 19.5 19.1 19.1 13.5 22.9
300–500(min 15 kn)
17.2 16.1 17.2 15.5 15.3 18.2 17.1 15.4 14.6 13.2 13.6 11.4 12.3 16.1
600–799 (min 10.4 12.9 12.6 12.4 13.4 12.7 11.7 11.3 10.6 9.8 8.9 7.9 7.4 12.9
700–999(min 18 kn)
11.9 12.7 13.4 13.8 13.5 13.3 12.3 11.0 10.4 9.5 8.7 7.8 7.7 12.7
800–999(min 18 kn)
10.3 12.7 12.2 12.3 12.4 12.1 11.8 10.8 9.8 9.0 8.7 7.1 7.3 12.7
1 000–1 260 (min 18 kn)
7.5 8.7 9.9 10.1 10.4 10.3 9.6 8.9 8.4 7.9 6.9 6.2 6.3 8.7
1 261–1 350 (min 19 kn)
7.6 8.0 8.9 9.4 9.5 9.6 8.9 8.2 7.8 7.3 6.1 5.4 5.2
1 600–1 999 (min 20 kn)
6.7 7.5 7.9 7.8 8.0 8.0 7.3 6.9 6.2 5.7 4.8 4.4 4.1 7.5
Source: Compiled by the UNCTAD secretariat based on data from Shipping Statistics and Market Review, various issues from 2002–2012, produced by the Institute of Shipping Economics and Logistics, Bremen, Germany. See also www.isl.org.
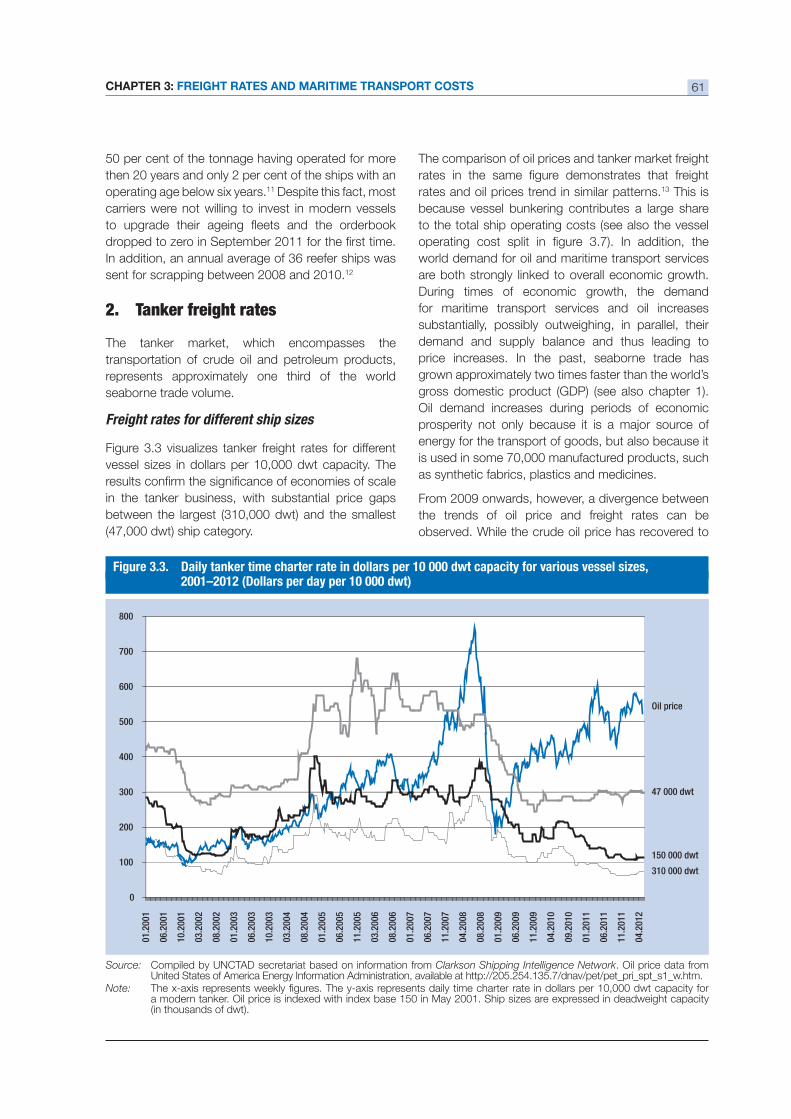
CHAPTER 3: FREIGHT RATES AND MARITIME TRANSPORT COSTS 61
operating age below six years.11 Despite this fact, most
carriers were not willing to invest in modern vessels
In addition, an annual average of 36 reefer ships was
sent for scrapping between 2008 and 2010.12
2. Tanker freight rates
The tanker market, which encompasses the
transportation of crude oil and petroleum products,
represents approximately one third of the world
seaborne trade volume.
Freight rates for different ship sizes
in the tanker business, with substantial price gaps
The comparison of oil prices and tanker market freight
rates and oil prices trend in similar patterns.13 This is
because vessel bunkering contributes a large share
to the total ship operating costs (see also the vessel
world demand for oil and maritime transport services
are both strongly linked to overall economic growth.
During times of economic growth, the demand
for maritime transport services and oil increases
substantially, possibly outweighing, in parallel, their
demand and supply balance and thus leading to
price increases. In the past, seaborne trade has
grown approximately two times faster than the world’s
gross domestic product (GDP) (see also chapter 1).
Oil demand increases during periods of economic
energy for the transport of goods, but also because it
is used in some 70,000 manufactured products, such
as synthetic fabrics, plastics and medicines.
From 2009 onwards, however, a divergence between
the trends of oil price and freight rates can be
observed. While the crude oil price has recovered to
Source: Compiled by UNCTAD secretariat based on information from Clarkson Shipping Intelligence Network. Oil price data from United States of America Energy Information Administration, available at http://205.254.135.7/dnav/pet/pet_pri_spt_s1_w.htm.
Note: a modern tanker. Oil price is indexed with index base 150 in May 2001. Ship sizes are expressed in deadweight capacity
Oil price
47 000 dwt
0
100
200
300
400
500
600
700
800
01.2
001
06.2
001
10.2
001
03.2
002
08.2
002
01.2
003
06.2
003
10.2
003
03.2
004
08.2
004
01.2
005
06.2
005
11.2
005
03.2
006
08.2
006
01.2
007
06.2
007
11.2
007
04.2
008
08.2
008
01.2
009
06.2
009
11.2
009
04.2
010
09.2
010
01.2
011
06.2
011
11.2
011
04.2
012
310 000 dwt
150 000 dwt
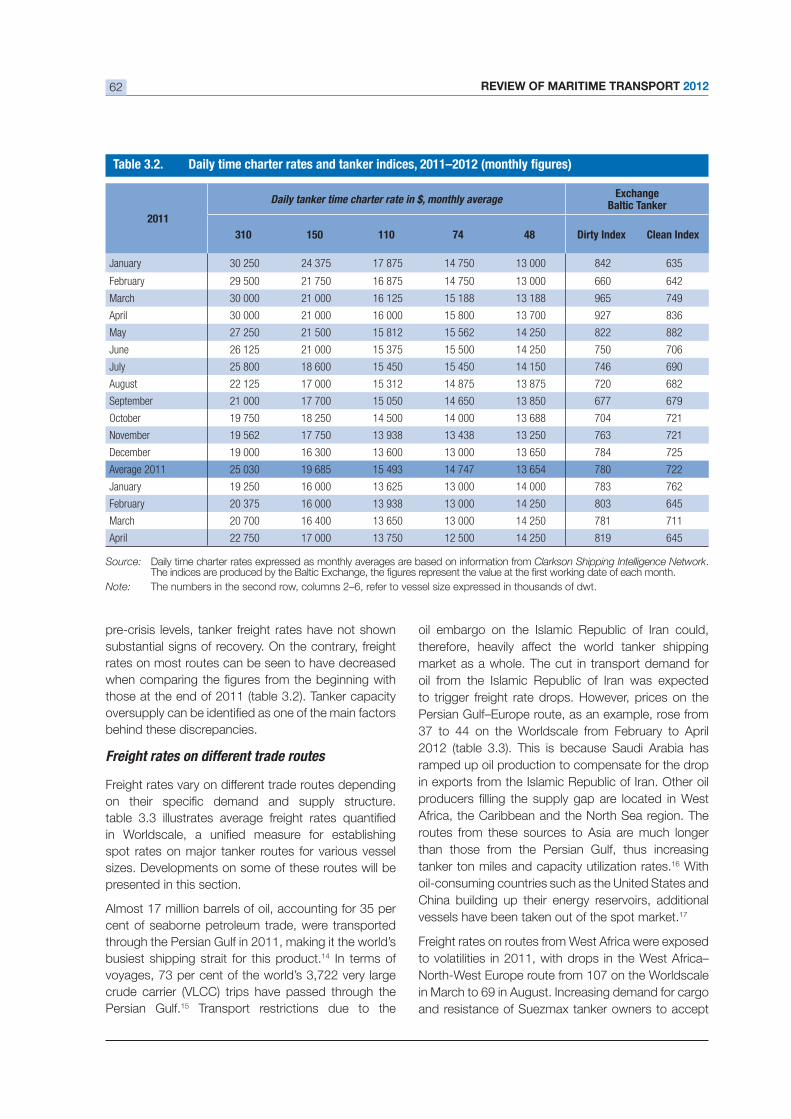
REVIEW OF MARITIME TRANSPORT 201262
pre-crisis levels, tanker freight rates have not shown
substantial signs of recovery. On the contrary, freight
rates on most routes can be seen to have decreased
behind these discrepancies.
Freight rates on different trade routes
Freight rates vary on different trade routes depending
sizes. Developments on some of these routes will be
presented in this section.
cent of seaborne petroleum trade, were transported
through the Persian Gulf in 2011, making it the world’s
busiest shipping strait for this product.14 In terms of
crude carrier (VLCC) trips have passed through the
Persian Gulf.15 Transport restrictions due to the
oil embargo on the Islamic Republic of Iran could,
therefore, heavily affect the world tanker shipping
market as a whole. The cut in transport demand for
oil from the Islamic Republic of Iran was expected
to trigger freight rate drops. However, prices on the
Persian Gulf–Europe route, as an example, rose from
37 to 44 on the Worldscale from February to April
ramped up oil production to compensate for the drop
in exports from the Islamic Republic of Iran. Other oil
Africa, the Caribbean and the North Sea region. The
routes from these sources to Asia are much longer
than those from the Persian Gulf, thus increasing
tanker ton miles and capacity utilization rates.16 With
oil-consuming countries such as the United States and
China building up their energy reservoirs, additional
vessels have been taken out of the spot market.17
Freight rates on routes from West Africa were exposed
to volatilities in 2011, with drops in the West Africa–
North-West Europe route from 107 on the Worldscale
in March to 69 in August. Increasing demand for cargo
and resistance of Suezmax tanker owners to accept
2011
ExchangeBaltic Tanker
150 110 74 48 Dirty Index Clean Index
January 30 250 24 375 17 875 14 750 13 000 842 635
February 29 500 21 750 16 875 14 750 13 000 660 642
March 30 000 21 000 16 125 15 188 13 188 965 749
April 30 000 21 000 16 000 15 800 13 700 927 836
May 27 250 21 500 15 812 15 562 14 250 822 882
June 26 125 21 000 15 375 15 500 14 250 750 706
July 25 800 18 600 15 450 15 450 14 150 746 690
August 22 125 17 000 15 312 14 875 13 875 720 682
September 21 000 17 700 15 050 14 650 13 850 677 679
October 19 750 18 250 14 500 14 000 13 688 704 721
November 19 562 17 750 13 938 13 438 13 250 763 721
December 19 000 16 300 13 600 13 000 13 650 784 725
Average 2011 25 030 19 685 15 493 14 747 13 654 780 722
January 19 250 16 000 13 625 13 000 14 000 783 762
February 20 375 16 000 13 938 13 000 14 250 803 645
March 20 700 16 400 13 650 13 000 14 250 781 711
April 22 750 17 000 13 750 12 500 14 250 819 645
Source: Daily time charter rates expressed as monthly averages are based on information from Clarkson Shipping Intelligence Network.
Note:
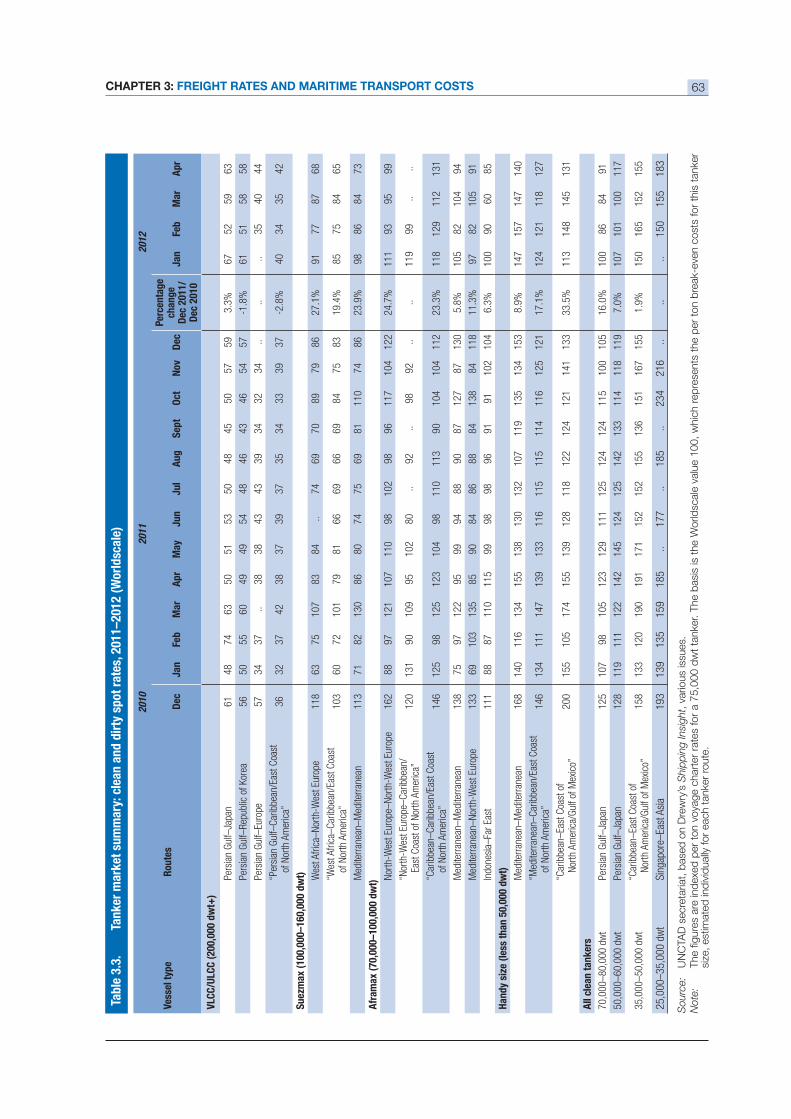
CHAPTER 3: FREIGHT RATES AND MARITIME TRANSPORT COSTS 63
Vess
el t
ype
Rou
tes
2010
2011
2012
Dec
Jan
Feb
Apr
Jun
Jul
Aug
Sep
tO
ctN
ovD
ec
Perc
enta
ge
chan
geD
ec 2
011/
Dec
201
0
Jan
Feb
Apr
Pers
ian
Gul
f–Ja
pan
6148
7463
5051
5350
48
4550
5759
6752
5963
Pers
ian
Gul
f–Re
publ
ic o
f Kor
ea56
5055
6049
4954
48
4643
4654
5761
5158
58
Pers
ian
Gul
f–Eu
rope
5734
37..
3838
4343
39
3432
34..
....
3540
44
“Per
sian
Gul
f–C
arib
bean
/Eas
t Coa
st
of N
orth
Am
eric
a”36
3237
4238
3739
37
3534
3339
3740
3435
42
118
6375
107
8384
..74
69
7089
7986
9177
8768
“Wes
t Afr
ica–
Car
ibbe
an/E
ast C
oast
of
Nor
th A
mer
ica”
103
6072
101
7981
6669
66
6984
7583
8575
8465
Med
iterr
anea
n–M
edite
rran
ean
113
7182
130
8680
7475
69
8111
074
8698
8684
73
162
8897
121
107
110
9810
2 98
9611
710
412
211
193
9599
Ea
st C
oast
of N
orth
Am
eric
a”12
013
190
109
9510
280
..92
..98
92..
..11
999
....
“Car
ibbe
an–
Car
ibbe
an/E
ast C
oast
of
Nor
th A
mer
ica”
146
125
9812
512
310
498
110
113
9010
410
411
211
812
911
213
1
Med
iterr
anea
n–M
edite
rran
ean
138
7597
122
9599
9488
90
8712
787
130
105
8210
494
133
6910
313
585
9084
86
8884
138
8411
897
8210
591
Indo
nesi
a–Fa
r Ea
st11
188
8711
011
599
9898
96
9191
102
104
100
9060
85
Med
iterr
anea
n–M
edite
rran
ean
168
140
116
134
155
138
130
132
107
119
135
134
153
147
157
147
140
“Med
iterr
anea
n–C
arib
bean
/Eas
t Coa
st
of N
orth
Am
eric
a”14
613
411
114
713
913
311
611
5 11
511
411
612
512
112
412
111
812
7
“Car
ibbe
an–
East
Coa
st o
f
Nor
th A
mer
ica/
Gul
f of M
exic
o”20
015
510
517
415
513
912
811
8 12
212
412
114
113
311
314
814
513
1
All
clea
n ta
nker
s
Pers
ian
Gul
f–Ja
pan
125
107
9810
512
312
911
112
5 12
412
411
510
010
510
086
8491
Pers
ian
Gul
f–Ja
pan
128
119
111
122
142
145
124
125
142
133
114
118
119
107
101
100
117
“Car
ibbe
an–
East
Coa
st o
f
Nor
th A
mer
ica/
Gul
f of M
exic
o”15
813
312
019
019
117
115
215
2 15
513
615
116
715
515
016
515
215
5
Sing
apor
e–Ea
st A
sia
193
139
135
159
185
..17
7..
185
..23
421
6..
....
150
155
183
Sourc
e:
UN
CTA
D s
ecre
taria
t, b
ase
d o
n D
rew
ry’s
Ship
pin
g In
sight,
vario
us
issu
es.
Note
:
size
, est
imate
d in
div
idually
for
each t
anke
r ro
ute
.
REVIEW OF MARITIME TRANSPORT 201264
lower freight rates pushed price levels up again to 89
on the Worldscale in October.18 While piracy along
the Gulf of Guinea was almost non-existent about 10
years ago, it has become an issue of growing concern,
leading to insurance premium increases for vessels
operating in the region.19 Expenses for rerouting to
avoid high-risk piracy areas and investment in security
piracy. Ships also navigate at higher speeds to avoid
18 knots or higher.20 The direct costs of piracy for the
maritime industry were estimated to have reached a 21
The International Maritime Organization (IMO) reported
46 piracy incidents in 7 countries in 2010 along the
Gulf of Guinea. This number expanded to 64 incidents
in 9 countries in 2011.22
Freight rates on export routes from the Mediterranean
dropped in mid-2011 compared with the previous
year. Price increases during 2011 were mostly
caused by exceptional events and do not imply a
long-term change in the market. The freight-level
unrest and military operations in Libya that pushed
buyers to ship their cargo out of the country. Due
to the war, oil-extraction volumes dropped in Libya
barrels per day. This dragged the freight rates
recovery.23 The rally in freight rates in October was
triggered by congestions on the Bosporus Strait,
which is one of the maritime choke points for oil
shipments. These were caused by bad weather
conditions, which increased tanker freight prices
across the Mediterranean and on routes out of West
bottleneck on Suezmax tankers every day.24
Saint Croix, one of the United States Virgin Islands,
caused short-term freight rate drops on the route
linking the Caribbean to the United States Atlantic
Coast. The closure has been caused by the economic
emerging markets.25 The facility will now be used as a
market will have to be imported from more distant
sources to compensate for the capacity loss. This can
positively affect product tanker freight rates on long-
Asia. The added ton-miles may also increase freight
rates within the product tanker market as a whole.26
Tanker market outlook
Tankers connect oil producing countries with energy
consumers. A change in the geographical structure of oil
within the global tanker route network. British
ongoing oil-demand shift from the Organization for
Economic Cooperation and Development (OECD)
to the oil consumption growth until 2030. The BP
analysis foresees that productions from the Middle
East, and South and Central America together will add
production side, the Middle East will supply more than
delivered by countries from North and South America,
An ongoing volume expansion on the routes linking
the traditional production centres around the Persian
if these predictions materialize. At the other end,
we will observe a sluggish capacity development
on tanker routes to most developed economies.
British Petroleum have predicted a balanced growth
of oil supply and demand in Africa – accordingly the
continent’s role as a world energy supplier will not
Developments in tanker freight rates will also depend
heavily on the willingness of oil producing and buying
example, has announced that it aims to ship more of
its seaborne oil imports with a domestically owned
from 11 vessels in 2006 to 38 in 2011. Competitive
pressures have driven existing tanker operators out of
the business. European shipowners have halved their
East–China lane from 2006 to 2011, losing capacity
to their Chinese competitors.27 If industry policies of
emerging economies increasingly focus on expanding
their market shares in oil transportation, this will add
more capacity to the current oversupply and keep
freight rates at low levels. McQuilling predicts that
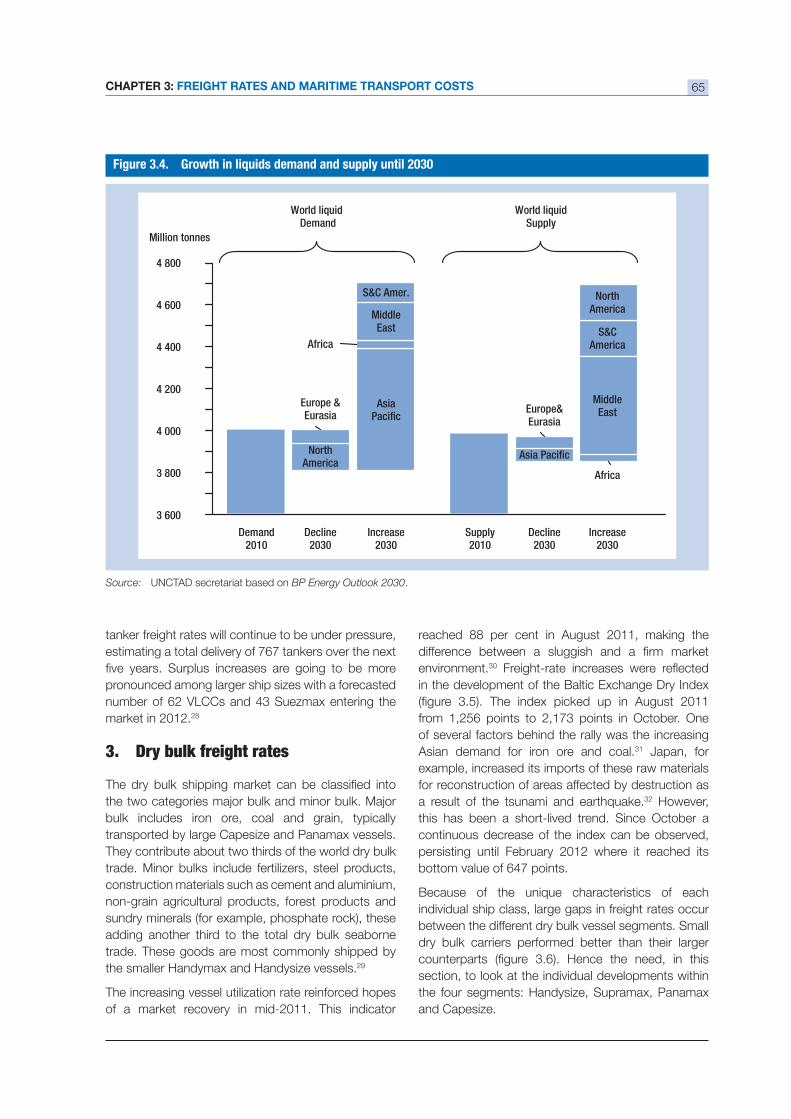
CHAPTER 3: FREIGHT RATES AND MARITIME TRANSPORT COSTS 65
tanker freight rates will continue to be under pressure,
estimating a total delivery of 767 tankers over the next
pronounced among larger ship sizes with a forecasted
number of 62 VLCCs and 43 Suezmax entering the
market in 2012.28
3. Dry bulk freight rates
bulk includes iron ore, coal and grain, typically
transported by large Capesize and Panamax vessels.
They contribute about two thirds of the world dry bulk
trade. Minor bulks include fertilizers, steel products,
construction materials such as cement and aluminium,
non-grain agricultural products, forest products and
sundry minerals (for example, phosphate rock), these
adding another third to the total dry bulk seaborne
trade. These goods are most commonly shipped by
the smaller Handymax and Handysize vessels.29
The increasing vessel utilization rate reinforced hopes
of a market recovery in mid-2011. This indicator
environment.30
in the development of the Baltic Exchange Dry Index
from 1,256 points to 2,173 points in October. One
of several factors behind the rally was the increasing
Asian demand for iron ore and coal.31 Japan, for
example, increased its imports of these raw materials
for reconstruction of areas affected by destruction as 32 However,
this has been a short-lived trend. Since October a
continuous decrease of the index can be observed,
persisting until February 2012 where it reached its
bottom value of 647 points.
individual ship class, large gaps in freight rates occur
between the different dry bulk vessel segments. Small
dry bulk carriers performed better than their larger
section, to look at the individual developments within
the four segments: Handysize, Supramax, Panamax
and Capesize.
Source: UNCTAD secretariat based on BP Energy Outlook 2030.
3 600
3 800
4 000
4 200
4 400
4 600
4 800
NorthAmerica
AsiaPacific
Demand2010
Decline2030
Increase2030
Supply2010
World liquidDemand
World liquidSupply
Million tonnes
MiddleEast
S&C Amer.
Asia Pacific
Decline2030
Increase2030
Europe &Eurasia
Africa
Europe&Eurasia
Africa
S&CAmerica
MiddleEast
NorthAmerica
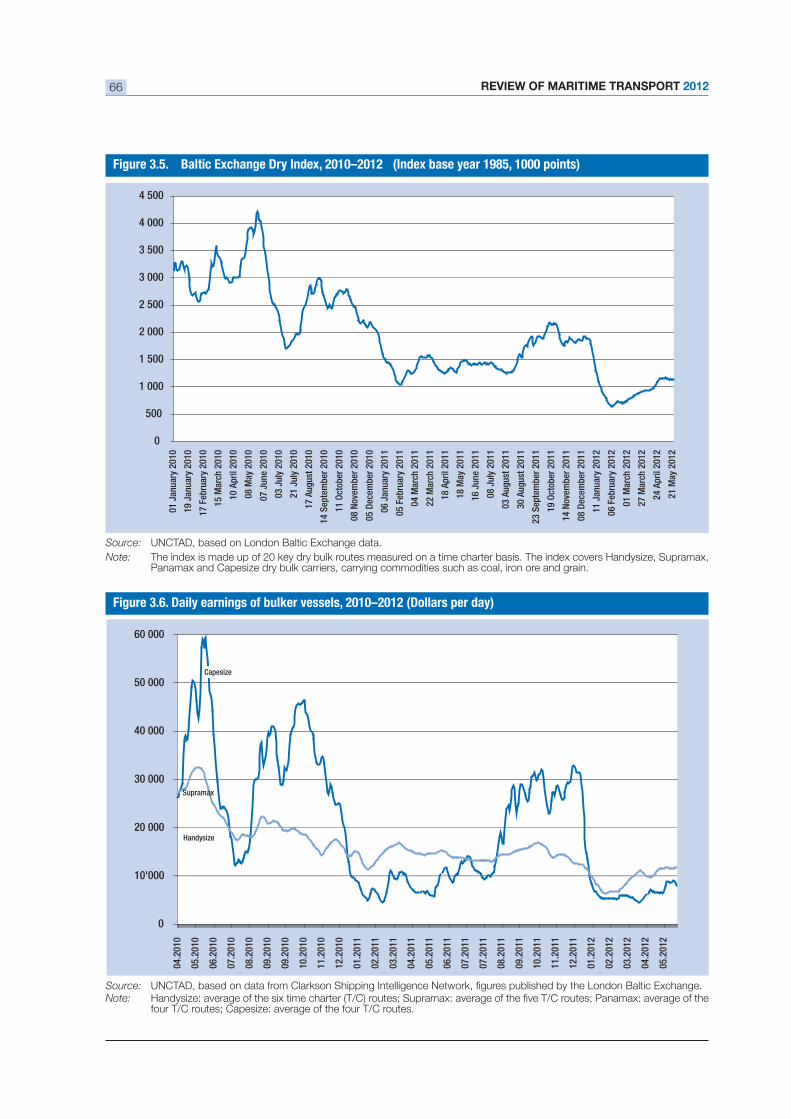
REVIEW OF MARITIME TRANSPORT 201266
Source: UNCTAD, based on London Baltic Exchange data.
Note: The index is made up of 20 key dry bulk routes measured on a time charter basis. The index covers Handysize, Supramax, Panamax and Capesize dry bulk carriers, carrying commodities such as coal, iron ore and grain.
Source: Note:
four T/C routes; Capesize: average of the four T/C routes.
0
500
1 000
1 500
2 000
2 500
3 000
3 500
4 000
4 500
01Ja
nuar
y20
10
19Ja
nuar
y20
10
17Fe
brua
ry20
10
15M
arch
2010
10Ap
ril20
10
08M
ay20
10
07Ju
ne20
10
03Ju
ly20
10
21Ju
ly20
10
17Au
gust
201
0
14Se
ptem
ber2
010
11Oc
tobe
r201
0
08No
vem
ber2
010
05De
cem
ber2
010
06Ja
nuar
y20
11
05Fe
brua
ry20
11
04M
arch
2011
22M
arch
2011
18Ap
ril20
11
18M
ay20
11
16Ju
ne20
11
08Ju
ly20
11
03Au
gust
201
1
30Au
gust
201
1
23Se
ptem
ber2
011
19Oc
tobe
r201
1
14No
vem
ber2
011
08De
cem
ber2
011
11Ja
nuar
y20
12
06Fe
brua
ry20
12
01M
arch
2012
27M
arch
2012
24Ap
ril20
12
21M
ay20
12
0
10'000
20 000
30 000
40 000
50 000
60 000
04.2
010
05.2
010
06.2
010
07.2
010
08.2
010
09.2
010
09.2
010
10.2
010
11.2
010
12.2
010
01.2
011
02.2
011
03.2
011
04.2
011
05.2
011
06.2
011
07.2
011
07.2
011
08.2
011
09.2
011
10.2
011
11.2
011
12.2
011
01.2
012
02.2
012
03.2
012
04.2
012
05.2
012
Supramax
Handysize
Capesize
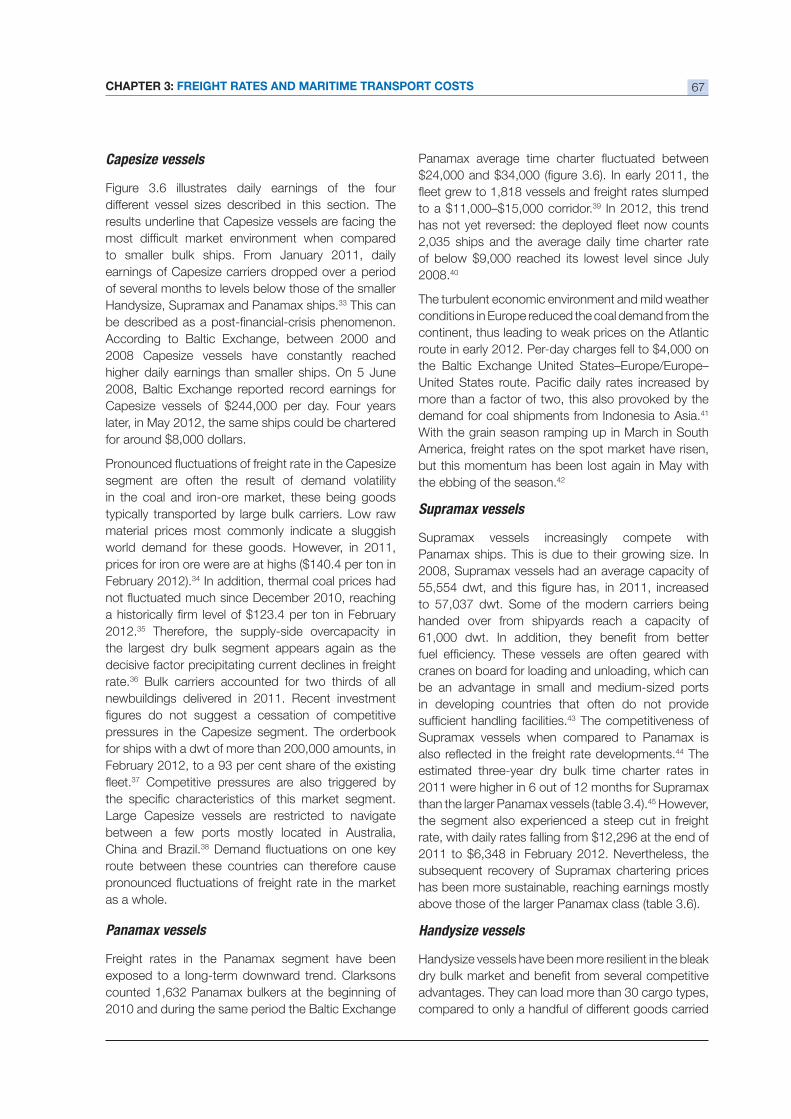
CHAPTER 3: FREIGHT RATES AND MARITIME TRANSPORT COSTS 67
Capesize vessels
different vessel sizes described in this section. The
results underline that Capesize vessels are facing the
to smaller bulk ships. From January 2011, daily
earnings of Capesize carriers dropped over a period
of several months to levels below those of the smaller
Handysize, Supramax and Panamax ships.33 This can
According to Baltic Exchange, between 2000 and
2008 Capesize vessels have constantly reached
higher daily earnings than smaller ships. On 5 June
2008, Baltic Exchange reported record earnings for
Capesize vessels of $244,000 per day. Four years
later, in May 2012, the same ships could be chartered
for around $8,000 dollars.
segment are often the result of demand volatility
in the coal and iron-ore market, these being goods
typically transported by large bulk carriers. Low raw
material prices most commonly indicate a sluggish
world demand for these goods. However, in 2011,
prices for iron ore were are at highs ($140.4 per ton in
February 2012).34 In addition, thermal coal prices had
2012.35 Therefore, the supply-side overcapacity in
the largest dry bulk segment appears again as the
decisive factor precipitating current declines in freight
rate.36 Bulk carriers accounted for two thirds of all
newbuildings delivered in 2011. Recent investment
pressures in the Capesize segment. The orderbook
37 Competitive pressures are also triggered by
Large Capesize vessels are restricted to navigate
between a few ports mostly located in Australia,
China and Brazil.38
route between these countries can therefore cause
as a whole.
Panamax vessels
Freight rates in the Panamax segment have been
exposed to a long-term downward trend. Clarksons
counted 1,632 Panamax bulkers at the beginning of
2010 and during the same period the Baltic Exchange
to a $11,000–$15,000 corridor.39 In 2012, this trend
2,035 ships and the average daily time charter rate
of below $9,000 reached its lowest level since July
2008.40
The turbulent economic environment and mild weather
conditions in Europe reduced the coal demand from the
continent, thus leading to weak prices on the Atlantic
route in early 2012. Per-day charges fell to $4,000 on
the Baltic Exchange United States–Europe/Europe–
more than a factor of two, this also provoked by the
demand for coal shipments from Indonesia to Asia.41
With the grain season ramping up in March in South
America, freight rates on the spot market have risen,
but this momentum has been lost again in May with
the ebbing of the season.42
Supramax vessels
Supramax vessels increasingly compete with
Panamax ships. This is due to their growing size. In
2008, Supramax vessels had an average capacity of
handed over from shipyards reach a capacity of
cranes on board for loading and unloading, which can
be an advantage in small and medium-sized ports
in developing countries that often do not provide 43 The competitiveness of
Supramax vessels when compared to Panamax is 44 The
estimated three-year dry bulk time charter rates in
2011 were higher in 6 out of 12 months for Supramax 45 However,
the segment also experienced a steep cut in freight
rate, with daily rates falling from $12,296 at the end of
2011 to $6,348 in February 2012. Nevertheless, the
has been more sustainable, reaching earnings mostly
Handysize vessels have been more resilient in the bleak
advantages. They can load more than 30 cargo types,
compared to only a handful of different goods carried
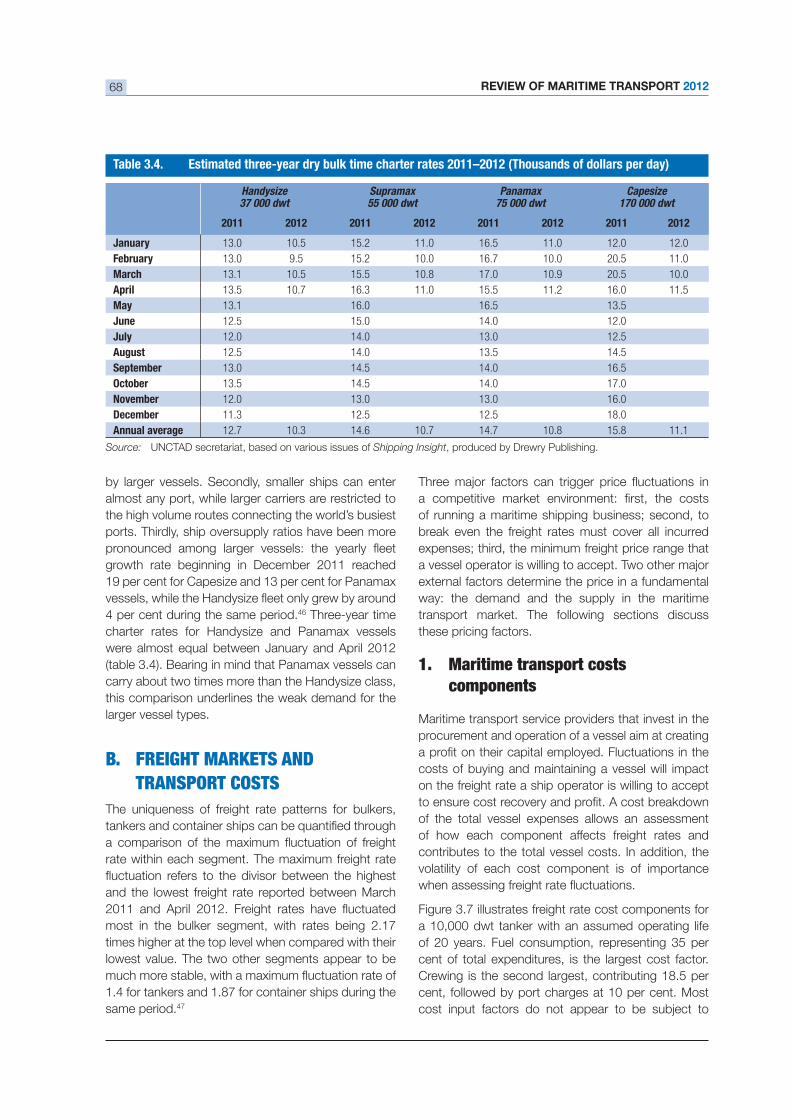
REVIEW OF MARITIME TRANSPORT 201268
by larger vessels. Secondly, smaller ships can enter
almost any port, while larger carriers are restricted to
the high volume routes connecting the world’s busiest
ports. Thirdly, ship oversupply ratios have been more
growth rate beginning in December 2011 reached
46 Three-year time
charter rates for Handysize and Panamax vessels
carry about two times more than the Handysize class,
this comparison underlines the weak demand for the
larger vessel types.
B. FREIGHT MARKETS AND
TRANSPORT COSTS
rate within each segment. The maximum freight rate
and the lowest freight rate reported between March
most in the bulker segment, with rates being 2.17
times higher at the top level when compared with their
lowest value. The two other segments appear to be
1.4 for tankers and 1.87 for container ships during the
same period.47
of running a maritime shipping business; second, to
break even the freight rates must cover all incurred
expenses; third, the minimum freight price range that
external factors determine the price in a fundamental
way: the demand and the supply in the maritime
transport market. The following sections discuss
these pricing factors.
1. Maritime transport costscomponents
Maritime transport service providers that invest in the
procurement and operation of a vessel aim at creating
costs of buying and maintaining a vessel will impact
on the freight rate a ship operator is willing to accept
of the total vessel expenses allows an assessment
of how each component affects freight rates and
contributes to the total vessel costs. In addition, the
volatility of each cost component is of importance
cent of total expenditures, is the largest cost factor.
Source: UNCTAD secretariat, based on various issues of Shipping Insight, produced by Drewry Publishing.
Supramax Panamax Capesize
2011 2012 2011 2012 2011 2012 2011 2012
January 13.0 10.5 15.2 11.0 16.5 11.0 12.0 12.0
February 13.0 9.5 15.2 10.0 16.7 10.0 20.5 11.0
13.1 10.5 15.5 10.8 17.0 10.9 20.5 10.0
April 13.5 10.7 16.3 11.0 15.5 11.2 16.0 11.5
13.1 16.0 16.5 13.5
June 12.5 15.0 14.0 12.0
July 12.0 14.0 13.0 12.5
August 12.5 14.0 13.5 14.5
September 13.0 14.5 14.0 16.5
October 13.5 14.5 14.0 17.0
November 12.0 13.0 13.0 16.0
December 11.3 12.5 12.5 18.0
Annual average 12.7 10.3 14.6 10.7 14.7 10.8 15.8 11.1
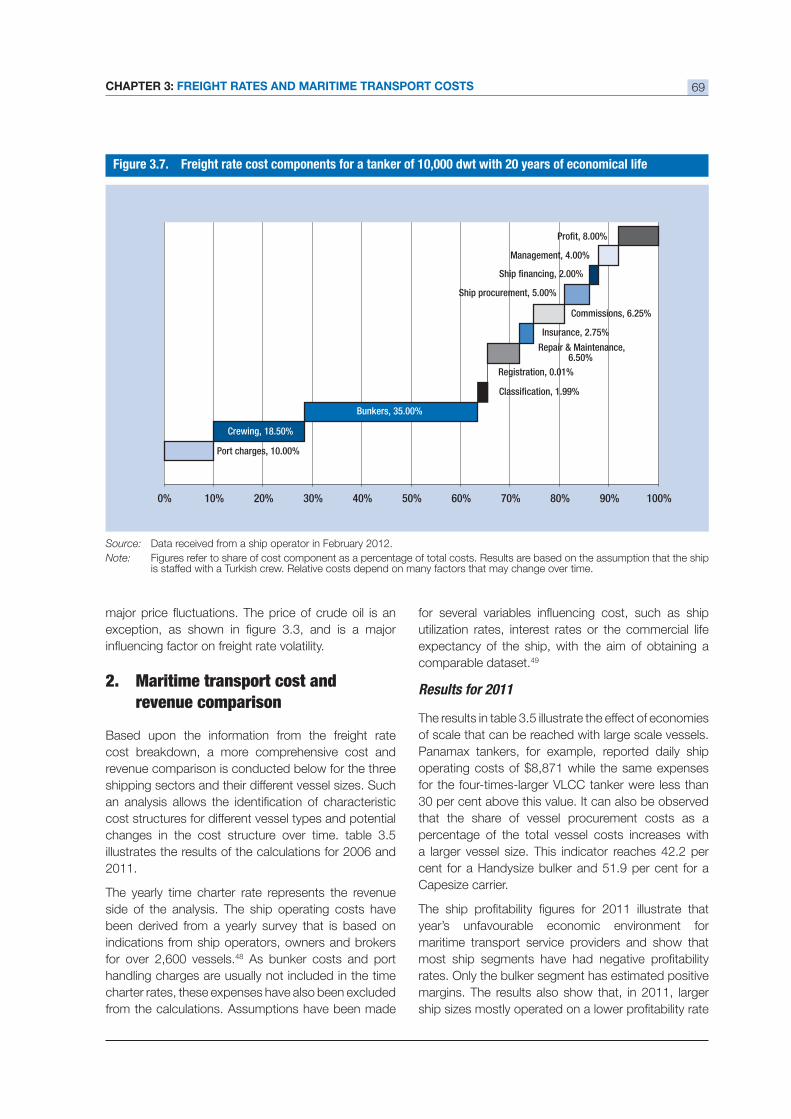
CHAPTER 3: FREIGHT RATES AND MARITIME TRANSPORT COSTS 69
2. Maritime transport cost andrevenue comparison
Based upon the information from the freight rate
cost breakdown, a more comprehensive cost and
revenue comparison is conducted below for the three
shipping sectors and their different vessel sizes. Such
cost structures for different vessel types and potential
illustrates the results of the calculations for 2006 and
2011.
The yearly time charter rate represents the revenue
side of the analysis. The ship operating costs have
been derived from a yearly survey that is based on
indications from ship operators, owners and brokers
for over 2,600 vessels.48 As bunker costs and port
handling charges are usually not included in the time
charter rates, these expenses have also been excluded
from the calculations. Assumptions have been made
utilization rates, interest rates or the commercial life
expectancy of the ship, with the aim of obtaining a
comparable dataset.49
Results for 2011
of scale that can be reached with large scale vessels.
Panamax tankers, for example, reported daily ship
operating costs of $8,871 while the same expenses
for the four-times-larger VLCC tanker were less than
that the share of vessel procurement costs as a
percentage of the total vessel costs increases with
Capesize carrier.
year’s unfavourable economic environment for
maritime transport service providers and show that
rates. Only the bulker segment has estimated positive
margins. The results also show that, in 2011, larger
Source: Data received from a ship operator in February 2012.
Note: Figures refer to share of cost component as a percentage of total costs. Results are based on the assumption that the ship is staffed with a Turkish crew. Relative costs depend on many factors that may change over time.
Port charges, 10.00%
Crewing, 18.50%
Bunkers, 35.00%
Classification, 1.99%
Registration, 0.01%
Repair & Maintenance,6.50%
Insurance, 2.75%
Commissions, 6.25%
Ship procurement, 5.00%
Ship financing, 2.00%
Management, 4.00%
Profit, 8.00%
0% 10% 20% 30% 40% 50% 60% 70% 80% 90% 100%
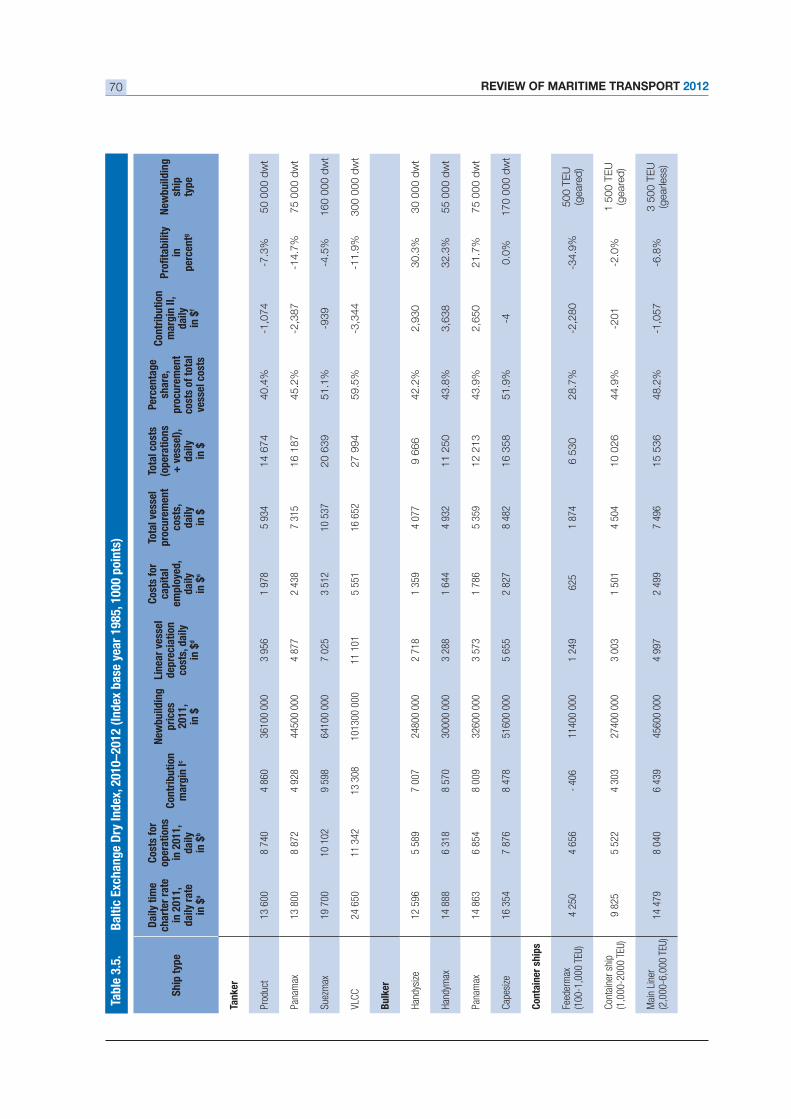
REVIEW OF MARITIME TRANSPORT 201270
Shi
p ty
pe
Dai
ly t
ime
char
ter
rate
in 2
011,
da
ily r
ate
in $
a
Cos
ts f
or
oper
atio
nsin
201
1,da
ilyin
$b
Con
trib
utio
n m
argi
n Ic
New
build
ing
pric
es20
11,
in $
Line
ar v
esse
l de
prec
iati
on
cost
s, d
aily
in
$d
Cos
ts f
orca
pita
lem
ploy
ed,
daily
in $
e
Tota
l ves
sel
proc
urem
ent
cost
s,da
ilyin
$
Tota
l cos
ts
(ope
rati
ons
daily
in $
Perc
enta
ge
shar
e,pr
ocur
emen
t co
sts
of t
otal
ve
ssel
cos
ts
Con
trib
utio
n m
argi
n II
, da
ilyin
$f
inpe
rcen
tg
New
build
ing
ship
type
Tank
er
Prod
uct
13 6
008
740
4 86
036
100
000
3 95
61
978
5 93
414 6
74
40.4
%-1
,074
-7.3
%
Pana
max
13
800
8 87
24
928
4450
0 00
04
877
2 43
87
315
16 1
87
45.2
%-2
,387
-14.7
%
Suez
max
19 7
0010
102
9 59
864
100
000
7 02
53
512
10 5
3720 6
39
51.1
%-9
39
-4.5
%
VLC
C24
650
11 3
4213
308
1013
00 0
0011
101
5 55
116
652
27 9
94
59.5
%-3
,344
-11.9
%
Bul
ker
Han
dysi
ze12
596
5 58
97
007
2480
0 00
02
718
1 35
94
077
9 6
66
42.2
%2,9
30
30.3
%
Han
dym
ax14
888
6 31
88
570
3000
0 00
03
288
1 64
44
932
11 2
50
43.8
%3,6
38
32.3
%
Pana
max
14 8
636
854
8 00
932
600
000
3 57
31
786
5 35
912 2
13
43.9
%2,6
50
21.7
%
Cap
esiz
e16
354
7 87
68
478
5160
0 00
05
655
2 82
78
482
16 3
58
51.9
%-4
0.0
%
Con
tain
er s
hips
Feed
erm
ax4
250
4 65
611
400
000
1 24
9 6
251
874
6 5
30
28.7
%-2
,280
-34.9
%500 T
EU
(geare
d)
Con
tain
er s
hip
9 82
55
522
4 30
327
400
000
3 00
31
501
4 50
410 0
26
44.9
%-2
01
-2.0
%1 5
00 T
EU
(g
eare
d)
Mai
n Li
ner
14 4
798
040
6 43
945
600
000
4 99
72
499
7 49
615 5
36
48.2
%-1
,057
-6.8
%3 5
00 T
EU
(gearle
ss)
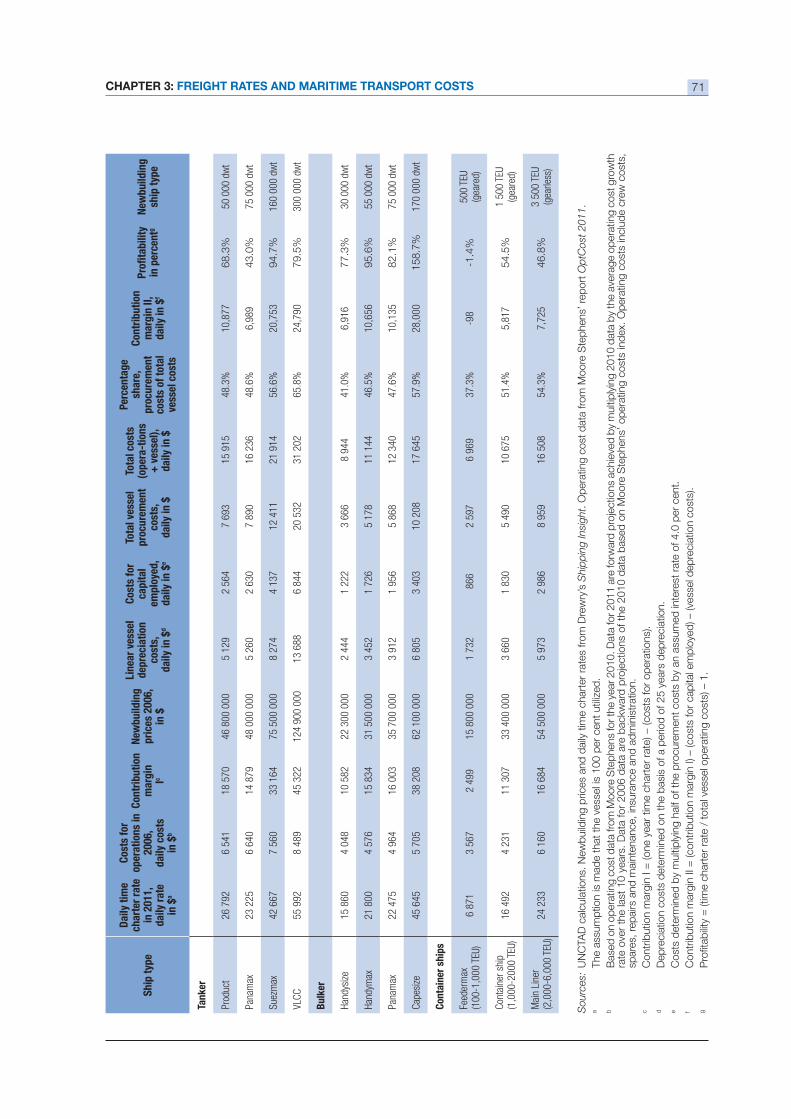
CHAPTER 3: FREIGHT RATES AND MARITIME TRANSPORT COSTS 71
Shi
p ty
pe
Dai
ly t
ime
char
ter
rate
in
201
1,
daily
rat
e in
$a
Cos
ts f
or
oper
atio
ns in
20
06,
daily
cos
ts
in $
b
Con
trib
utio
n m
argi
nIc
New
build
ing
pric
es 2
006,
in
$
Line
ar v
esse
l de
prec
iati
on
cost
s,da
ily in
$d
Cos
ts f
orca
pita
lem
ploy
ed,
daily
in $
e
Tota
l ves
sel
proc
urem
ent
cost
s,da
ily in
$
Tota
l cos
ts
(ope
ra-t
ions
daily
in $
Perc
enta
gesh
are,
pr
ocur
emen
t co
sts
of t
otal
ve
ssel
cos
ts
Con
trib
utio
n m
argi
n II
, da
ily in
$f
in p
erce
ntg
New
build
ing
ship
typ
e
Tank
er
Prod
uct
26 7
926
541
18 5
7046
800
000
5 1
29 2
564
7 6
93 1
5 91
510
,877
68.3
%
Pana
max
23
225
6 64
014
879
48 0
00 0
00 5
260
2 6
30 7
890
16
236
6,98
943.0
%
Suez
max
42 6
677
560
33 1
6475
500
000
8 2
74 4
137
12
411
21
914
20,7
5394.7
%
VLC
C55
992
8 48
945
322
124
900
000
13
688
6 8
44 2
0 53
2 3
1 20
224
,790
79.5
%
Bul
ker
Han
dysi
ze15
860
4 04
810
582
22 3
00 0
00 2
444
1 2
22 3
666
8 9
446,
916
77.3
%
Han
dym
ax21
800
4 57
615
834
31 5
00 0
00 3
452
1 7
26 5
178
11
144
10,6
5695.6
%
Pana
max
22 4
754
964
16 0
0335
700
000
3 9
12 1
956
5 8
68 1
2 34
010
,135
82.1
%
Cap
esiz
e45
645
5 70
538
208
62 1
00 0
00 6
805
3 4
03 1
0 20
8 1
7 64
528
,000
158.7
%
Con
tain
er s
hips
Feed
erm
ax6
871
3 56
72
499
15 8
00 0
00 1
732
866
2 5
97 6
969
-1.4
%50
0 TE
U(g
eare
d)
Con
tain
er s
hip
16 4
924
231
11 3
0733
400
000
3 6
60 1
830
5 4
90 1
0 67
55,
817
54.5
%1
500
TEU
(gea
red)
Mai
n Li
ner
24 2
336
160
16 6
8454
500
000
5 9
73 2
986
8 9
59 1
6 50
87,
725
46.8
%3
500
TEU
(gea
rless
)
Sourc
es:
UN
CTA
D c
alc
ula
tions.
New
build
ing p
rices
and
daily
tim
e c
hart
er
rate
s from
Dre
wry
’s S
hip
pin
g In
sight.
Op
era
ting c
ost
data
fro
m M
oore
Ste
phens’
rep
ort
Op
tCost
2011
.a b
spare
s, r
ep
airs
and
main
tenance, in
sura
nce a
nd
ad
min
istr
atio
n.
c dD
ep
recia
tion c
ost
s d
ete
rmin
ed
on t
he b
asi
s of a p
erio
d o
f 25 y
ears
dep
recia
tion.
e fC
ontr
ibutio
n m
arg
in II
= (contr
ibutio
n m
arg
in I)
– (cost
s fo
r cap
ital e
mp
loye
d) –
(vess
el d
ep
recia
tion c
ost
s).
g
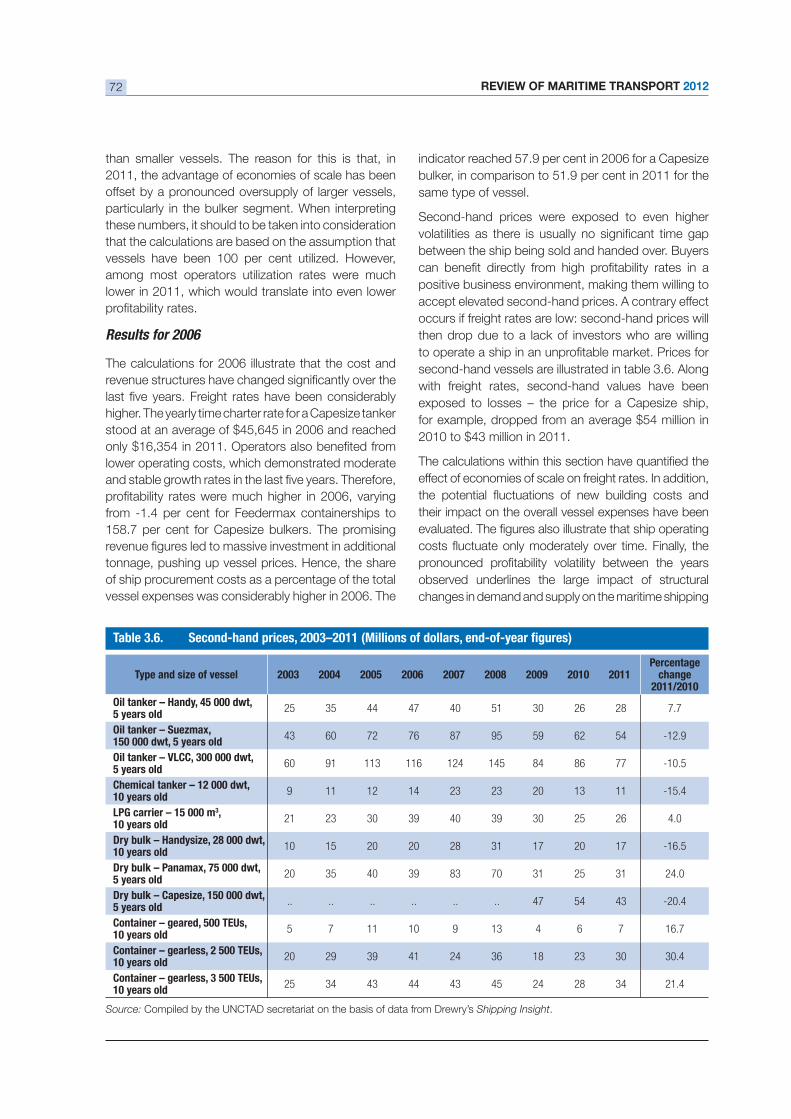
REVIEW OF MARITIME TRANSPORT 201272
than smaller vessels. The reason for this is that, in
2011, the advantage of economies of scale has been
offset by a pronounced oversupply of larger vessels,
particularly in the bulker segment. When interpreting
these numbers, it should to be taken into consideration
that the calculations are based on the assumption that
among most operators utilization rates were much
lower in 2011, which would translate into even lower
Results for 2006
The calculations for 2006 illustrate that the cost and
higher. The yearly time charter rate for a Capesize tanker
stood at an average of $45,645 in 2006 and reached
lower operating costs, which demonstrated moderate
tonnage, pushing up vessel prices. Hence, the share
of ship procurement costs as a percentage of the total
vessel expenses was considerably higher in 2006. The
same type of vessel.
Second-hand prices were exposed to even higher
between the ship being sold and handed over. Buyers
positive business environment, making them willing to
accept elevated second-hand prices. A contrary effect
occurs if freight rates are low: second-hand prices will
then drop due to a lack of investors who are willing
with freight rates, second-hand values have been
exposed to losses – the price for a Capesize ship,
effect of economies of scale on freight rates. In addition,
their impact on the overall vessel expenses have been
observed underlines the large impact of structural
changes in demand and supply on the maritime shipping
Type and size of vessel 2004 2005 2006 2007 2008 2009 2010 2011Percentage
change2011/2010
5 years old 25 35 44 47 40 51 30 26 28 7.7
Oil tanker – Suezmax, 43 60 72 76 87 95 59 62 54
5 years old 60 91 113 116 124 145 84 86 77
10 years old 9 11 12 14 23 23 20 13 11
LPG carrier – 15 000 m ,10 years old
21 23 30 39 40 39 30 25 26 4.0
10 years old 10 15 20 20 28 31 17 20 17
5 years old 20 35 40 39 83 70 31 25 31 24.0
5 years old .. .. .. .. .. .. 47 54 43
Container – geared, 500 TEUs,10 years old
5 7 11 10 9 13 4 6 7 16.7
Container – gearless, 2 500 TEUs, 10 years old
20 29 39 41 24 36 18 23 30 30.4
10 years old 25 34 43 44 43 45 24 28 34 21.4
Source: Compiled by the UNCTAD secretariat on the basis of data from Drewry’s Shipping Insight.
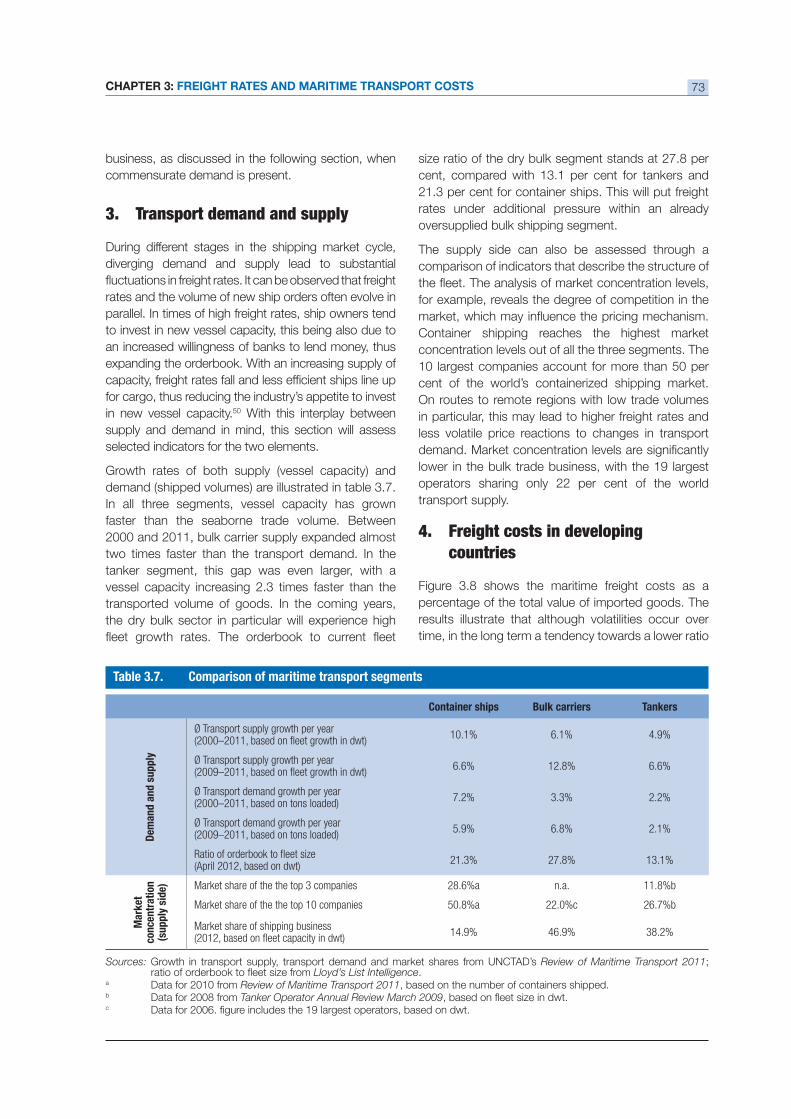
CHAPTER 3: FREIGHT RATES AND MARITIME TRANSPORT COSTS 73
business, as discussed in the following section, when
commensurate demand is present.
3. Transport demand and supply
During different stages in the shipping market cycle,
diverging demand and supply lead to substantial
rates and the volume of new ship orders often evolve in
parallel. In times of high freight rates, ship owners tend
to invest in new vessel capacity, this being also due to
an increased willingness of banks to lend money, thus
expanding the orderbook. With an increasing supply of
for cargo, thus reducing the industry’s appetite to invest
in new vessel capacity.50 With this interplay between
supply and demand in mind, this section will assess
selected indicators for the two elements.
Growth rates of both supply (vessel capacity) and
In all three segments, vessel capacity has grown
faster than the seaborne trade volume. Between
2000 and 2011, bulk carrier supply expanded almost
two times faster than the transport demand. In the
tanker segment, this gap was even larger, with a
vessel capacity increasing 2.3 times faster than the
transported volume of goods. In the coming years,
the dry bulk sector in particular will experience high
rates under additional pressure within an already
oversupplied bulk shipping segment.
The supply side can also be assessed through a
comparison of indicators that describe the structure of
for example, reveals the degree of competition in the
Container shipping reaches the highest market
concentration levels out of all the three segments. The
cent of the world’s containerized shipping market.
On routes to remote regions with low trade volumes
in particular, this may lead to higher freight rates and
less volatile price reactions to changes in transport
lower in the bulk trade business, with the 19 largest
transport supply.
4. Freight costs in developingcountries
percentage of the total value of imported goods. The
results illustrate that although volatilities occur over
time, in the long term a tendency towards a lower ratio
Container ships Bulk carriers Tankers
Dem
and
and
supp
ly
Ø Transport supply growth per year
Ø Transport supply growth per year
Ø Transport demand growth per year(2000–2011, based on tons loaded)
Ø Transport demand growth per year(2009–2011, based on tons loaded)
conc
entr
atio
n (s
uppl
y si
de) Market share of the the top 3 companies n.a.
Market share of the the top 10 companies
Market share of shipping business
Sources: Growth in transport supply, transport demand and market shares from UNCTAD’s Review of Maritime Transport 2011;Lloyd’s List Intelligence.
a Data for 2010 from Review of Maritime Transport 2011, based on the number of containers shipped. b Data for 2008 from Tanker Operator Annual Review March 2009c
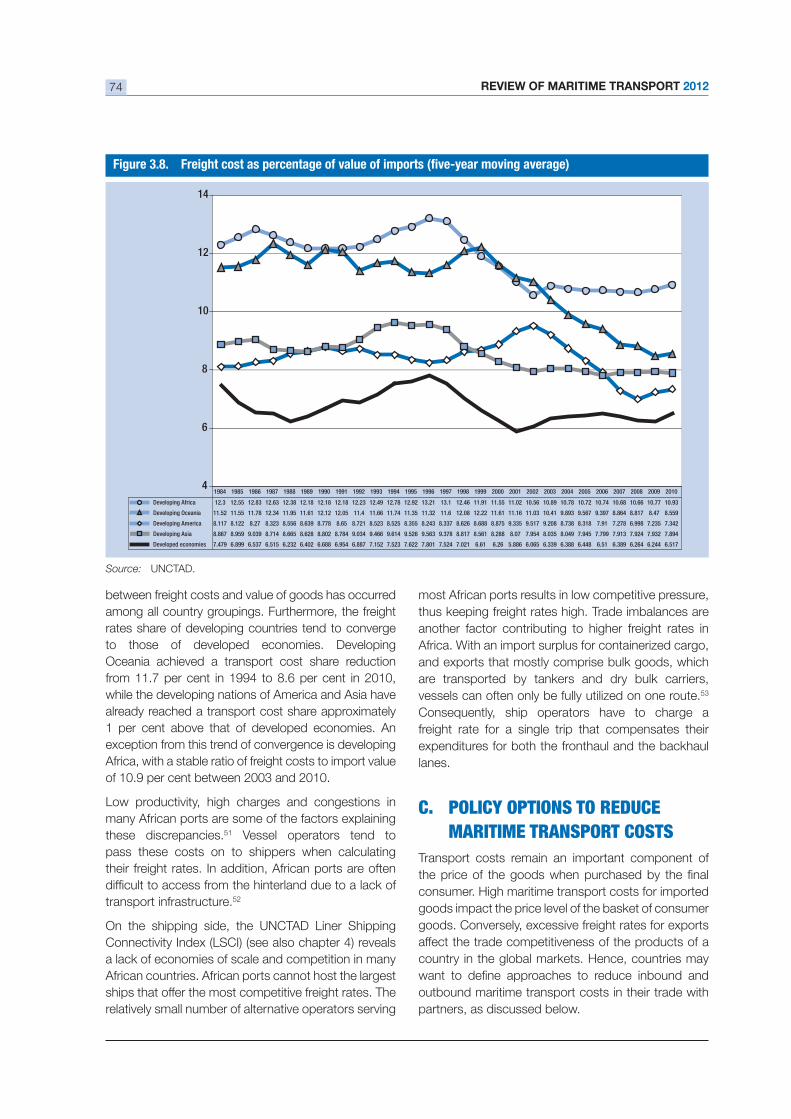
REVIEW OF MARITIME TRANSPORT 201274
between freight costs and value of goods has occurred
among all country groupings. Furthermore, the freight
rates share of developing countries tend to converge
to those of developed economies. Developing
Oceania achieved a transport cost share reduction
while the developing nations of America and Asia have
already reached a transport cost share approximately
exception from this trend of convergence is developing
Africa, with a stable ratio of freight costs to import value
Low productivity, high charges and congestions in
many African ports are some of the factors explaining
these discrepancies.51 Vessel operators tend to
pass these costs on to shippers when calculating
their freight rates. In addition, African ports are often
transport infrastructure.52
On the shipping side, the UNCTAD Liner Shipping
Connectivity Index (LSCI) (see also chapter 4) reveals
a lack of economies of scale and competition in many
African countries. African ports cannot host the largest
ships that offer the most competitive freight rates. The
relatively small number of alternative operators serving
most African ports results in low competitive pressure,
thus keeping freight rates high. Trade imbalances are
another factor contributing to higher freight rates in
Africa. With an import surplus for containerized cargo,
and exports that mostly comprise bulk goods, which
are transported by tankers and dry bulk carriers,
vessels can often only be fully utilized on one route.53
freight rate for a single trip that compensates their
expenditures for both the fronthaul and the backhaul
lanes.
C. POLICY OPTIONS TO REDUCE
MARITIME TRANSPORT COSTS
Transport costs remain an important component of
consumer. High maritime transport costs for imported
goods impact the price level of the basket of consumer
goods. Conversely, excessive freight rates for exports
affect the trade competitiveness of the products of a
country in the global markets. Hence, countries may
outbound maritime transport costs in their trade with
partners, as discussed below.
Source: UNCTAD.
4
6
8
10
12
14
Developing Africa 12.3 12.55 12.83 12.63 12.38 12.18 12.18 12.18 12.23 12.49 12.78 12.92 13.21 13.1 12.46 11.91 11.55 11.02 10.56 10.89 10.78 10.72 10.74 10.68 10.66 10.77 10.93
Developing Oceania 11.52 11.55 11.78 12.34 11.95 11.61 12.12 12.05 11.4 11.66 11.74 11.35 11.32 11.6 12.08 12.22 11.61 11.16 11.03 10.41 9.893 9.567 9.397 8.864 8.817 8.47 8.559
Developing America 8.117 8.122 8.27 8.323 8.556 8.639 8.778 8.65 8.721 8.523 8.525 8.355 8.243 8.337 8.626 8.688 8.875 9.335 9.517 9.208 8.738 8.318 7.91 7.278 6.998 7.235 7.342
Developing Asia 8.867 8.959 9.039 8.714 8.665 8.628 8.802 8.784 9.034 9.466 9.614 9.526 9.563 9.378 8.817 8.561 8.288 8.07 7.954 8.035 8.049 7.945 7.799 7.913 7.924 7.932 7.894
Developed economies 7.479 6.899 6.537 6.515 6.232 6.402 6.688 6.954 6.887 7.152 7.523 7.622 7.801 7.524 7.021 6.61 6.26 5.886 6.065 6.339 6.388 6.448 6.51 6.389 6.264 6.244 6.517
1984 1985 1986 1987 1988 1989 1990 1991 1992 1993 1994 1995 1996 1997 1998 1999 2000 2001 2002 2003 2004 2005 2006 2007 2008 2009 2010
CHAPTER 3: FREIGHT RATES AND MARITIME TRANSPORT COSTS 75
The freight rate cost analysis, conducted for the case of
elements of freight rates and can assist when identifying
policy measures aimed at reducing individual cost
drivers. The policy options available to a single country
that could produce a substantial reduction of freight
rates are, nonetheless, limited. Vessel operators can
choose worldwide between many alternative suppliers
when procuring the goods and services they need for
their vessel operations, thus levelling comparative cost
advantages of individual destinations. In most large
ports, for instance, cheap fuelling services are offered
and, even if these services are not provided, a ship
can choose to use bunkering services at an alternative
destination. If one country alone were able to offer
level of other nations, these competitive advantages
or from that country. Hosting competitive insurance
service providers, for example, will not assist a country
to reduce its maritime transport costs. These cost
freight rates for all routes a vessel operator serves
within his shipping network.
When evaluating the elements comprising freight
countries can choose from, and by which maritime
effect on ship operating costs and freight rates.
Option 1 – developing coastal shipping
Individual countries can exercise only a limited
operates as an open market with very little regulation
other than relevant international rules on carrier
liability, security and safety. An exception to this is
these services through the design of ship registration
infrastructural investments such as the development
of a feeder port network.
In a market where cabotage is restricted to domestic
carriers only, ship operators have no choice but
to comply with the country’s regulatory set up. An
therefore directly affect operating costs. The potential
the United States Department of Transportation. It
estimates, for example, that the costs for United
54
Opening cabotage to international shipping lines is
another policy option. The entrance of new market
players may reduce freight rates for shippers and
lead to better and more diverse services. However,
most countries often give cabotage rights exclusively
to domestic carriers with the aim of protecting and
promoting the national shipping industry.
Another measure to support cabotage is the expansion
of a country’s feeder port network. This will facilitate
access of traders to coastal shipping and encourage
them to shift from land to maritime transport. The
increased volumes may lead to higher utilization rates
and lower freight rates.
Option 2 – developing port competitiveness
Countries with sea access can apply a wide range
of policies that aim at increasing the operational
This includes decisions on the legal and institutional
framework, the selection of an ownership model or the
allocation of funds for infrastructure investments. The
reforms should target all entities having a relevant role
in the port, such as the landlord, regulator, operator,
marketer and cargo handler, thus reducing port
charges related to each function.
The negotiation of a balanced concession agreement
between the terminal operator and the responsible
regulatory institution is a critical element when shaping
a performance-orientated port business environment.
This should include appropriate incentives that promote
a continuous improvement of operations, competitive
price setting mechanisms and a comprehensive
performance monitoring system. However, considering
the total freight rate, the lever of these measures appears
Option 3 – developing port hinterland connections
directly the improvement of maritime transport chain
elements. In contrast, the third option addresses other
modes of transport that indirectly affect freight rates of
ships through their role within the multimodal transport
chain.
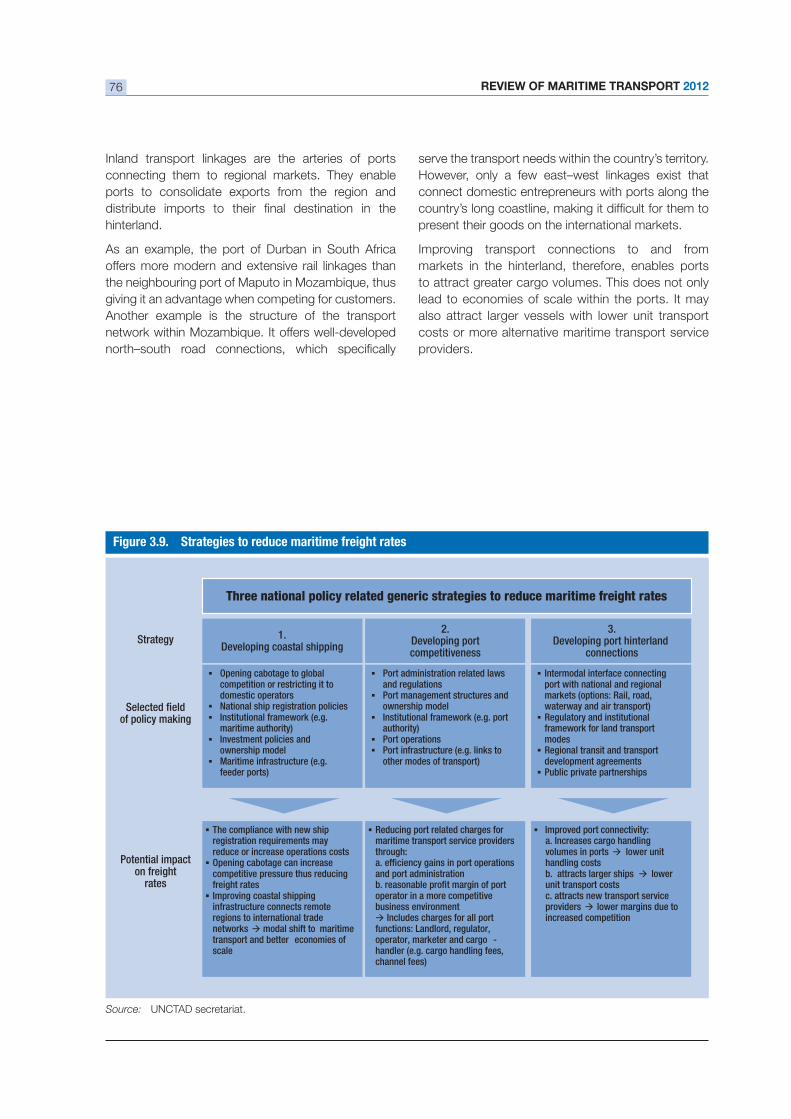
REVIEW OF MARITIME TRANSPORT 201276
Inland transport linkages are the arteries of ports
connecting them to regional markets. They enable
ports to consolidate exports from the region and
hinterland.
As an example, the port of Durban in South Africa
offers more modern and extensive rail linkages than
giving it an advantage when competing for customers.
Another example is the structure of the transport
serve the transport needs within the country’s territory.
However, only a few east–west linkages exist that
connect domestic entrepreneurs with ports along the
present their goods on the international markets.
Improving transport connections to and from
markets in the hinterland, therefore, enables ports
to attract greater cargo volumes. This does not only
lead to economies of scale within the ports. It may
also attract larger vessels with lower unit transport
costs or more alternative maritime transport service
providers.
Source: UNCTAD secretariat.
Three national policy related generic strategies to reduce maritime freight rates
2.Developing portcompetitiveness
Port administration related laws and regulationsPort management structures andownership modelInstitutional framework (e.g. portauthority)Port operationsPort infrastructure (e.g. links toother modes of transport)
Reducing port related charges formaritime transport service providers through:a. efficiency gains in port operations and port administrationb. reasonable profit margin of portoperator in a more competitivebusiness environment
Includes charges for all portfunctions: Landlord, regulator,operator, marketer and cargo -handler (e.g. cargo handling fees,channel fees)
1.Developing coastal shipping
Opening cabotage to globalcompetition or restricting it todomestic operatorsNational ship registration policiesInstitutional framework (e.g.maritime authority)Investment policies andownership modelMaritime infrastructure (e.g.feeder ports)
The compliance with new shipregistration requirements mayreduce or increase operations costsOpening cabotage can increasecompetitive pressure thus reducingfreight ratesImproving coastal shippinginfrastructure connects remoteregions to international tradenetworks modal shift to maritimetransport and better economies ofscale
Selected fieldof policy making
Strategy
Potential impacton freight
rates
3.Developing port hinterland
connections
Intermodal interface connectingport with national and regionalmarkets (options: Rail, road,waterway and air transport)Regulatory and institutionalframework for land transportmodesRegional transit and transportdevelopment agreements Public private partnerships
a. Increases cargo handlingvolumes in ports lower unithandling costsb. attracts larger ships lowerunit transport costsc. attracts new transport serviceproviders lower margins due toincreased competition
Improved port connectivity:
CHAPTER 3: FREIGHT RATES AND MARITIME TRANSPORT COSTS 77
ENDNOTES
1 The purpose of the coverage of more vessel sizes within the New ConTex index is to give a more comprehensive
2
php?id=108, accessed 20.02.2012.
3 Lloyd’s List (2011). Rate hikes and capacity reductions fail to lift box freight prices. http://www.lloydslist.com/ll/sector/containers/article385705.ece, accessed 17.02.2012.
4 Journal of Commercecom/container-lines/new-world-grand-alliances-merge, accessed 21.02.2012.
5 Journal of Commercecom/container-lines/new-world-grand-alliances-merge, accessed 21.02.2012. See also International Freight News(2011). MSC/CMA CGM alliance will shake up Asia-Europe trade. http://www.ifw-net.com/freightpubs/ifw/article.htm?artid=20017924842&src=rss, accessed 21.02.2012.
6
php?id=108, accessed 20.02.2012.
7 Lloyd’s Listarticle173229.ece, accessed 20.02.2012.
8 Journal of Commercestar-reefers-swings-124-million-loss-2011, accessed 20.02.2012.
9 Shipping Herald (2012). Star Reefers posts USD 124m net loss. http://www.shippingherald.com/Admin/ArticleDetail/ArticleDetailsFinanceEconomy/tabid/104/ArticleID/2947/Star-Reefers-posts-USD-124m-net-loss.aspx, accessed 06.04.2012.
10 Drewry (2011). Charter rates thaw amid shifting reefer market. http://www.bairdmaritime.com/index.php?option=com_content&view=article&id=11116:charter-rates-thaw-amid-shifting-reefer-market&catid=66:container&Itemid=57, accessed 20.02.2012.
11 Lloyd’s Listarticle173229.ece, accessed 20.02.2011.
12 Drewry (2011). Charter rates thaw amid shifting reefer market. http://www.bairdmaritime.com/index.php?option=com_content&view=article&id=11116:charter-rates-thaw-amid-shifting-reefer-market&catid=66:container&Itemid=57, accessed 20.02.2011.
13 For additional information on the development of the oil price and freight rates refer to UNCTAD (2010). Oil Prices and Maritime Freight Rates: An Empirical Investigation. Geneva.
14 Lloyd’s Listarticle390597.ece, accessed 03.02.2012.
15 Lloyd’s List (2011). Tanker Owners’ Exposure to the Strait of Hormuz. http://www.lloydslist.com/ll/incoming/article388221.ece/BINARY/090112_Liz_page2.pdf, accessed 03.02.2012.
16 Steelguru (2012). Iran oil sanctions revive tanker rates around the globe. http://www.steelguru.com/middle_east_news/Iran_oil_sanctions_revive_tanker_rates_around_the_globe/254183.html, accessed 23.05.2012.
17 Tankeroperator (2012). VLCC spike to end. http://www.tankeroperator.com/news/todisplaynews.asp?NewsID=3446, accessed 23.05.2012.
18 Lloyd’s List (2011). Suezmax owners resist falling West Africa rates. http://www.lloydslist.com/ll/sector/tankers/article381146.ece, accessed 29.02.2012.
19 United Nations (2012). Piracy threatens West Africa oil expansion. http://www.google.com/hostednews/afp/
accessed 29.02.2012.
20 One Earth Future Foundation (2011). The Economic Cost of Somali Piracy. http://oceansbeyondpiracy.org/sites/
21 One Earth Future Foundation (2010). The Economic Cost of Maritime Piracy. http://oneearthfuture.org/images/
22
apps/news/story.asp?NewsID=41390&Cr=gulf+of+guinea, accessed 29.02.2012.
REVIEW OF MARITIME TRANSPORT 201278
23 GCaptain (2011). Stability to help boost Mediterranean tanker market. http://gcaptain.com/stability-libya-boost-mediterranean/?30212#, accessed 03.01.2012.
24 Hellenic Shipping News (2011). Tanker Market: Modest demand growth and continued oversupply sets the scene. http://www.hellenicshippingnews.com/News.aspx?ElementId=fc2b1429-a5fa-4526-af80-4d11456bd89c, accessed 03.01.2012.
25 Market Watch
26 Lloyd’s Listtankers/article391040.ece, accessed 23.05.2012.
27 Lloyd’s Listcom/ll/sector/tankers/article375538.ece, accessed 28.02.2012.
28 Hellenic Shipping News (2011). Tanker oversupply to hurt larger ships the most says analyst. http://www.hellenicshippingnews.com/News.aspx?ElementId=f5a1616d-b41c-4d97-9619-aab73c890c75, accessed 27.02.2012.
29 Clarkson Research Services Limited (2012). Dry Bulk Trade Outlook from February 2012, p. 2.
30 Lorentzen & Stemoco (2011). Weekly 33.2011. http://www.lorstem.com/Global/Weekly%20reports/Report%2033-2011.pdf, accessed 14.03.2012.
31 Lloyd’s List (2011). Largest overnight capesize rate drop in two months. http://www.lloydslist.com/ll/sector/dry-cargo/article387492.ece?service=print, accessed 14.03.2012.
32 Lorentzen & Stemoco (2011). Weekly 33.2011. http://www.lorstem.com/Global/Weekly%20reports/Report%2033-2011.pdf, accessed 14.03.2011.
33 Fish Info & Servicesupload/FISUpdateFeb11.pdf, accessed 03.04.2012.
34 (2012). Iron ore Monthly price. http://www.indexmundi.com/commodities/?commodity=iron-ore&months=60, accessed 04.04.2012.
35 (2012). Coal, Australian thermal coal monthly price. http://www.indexmundi.com/commodities/?commodity=coal-australian&months=60, accessed 04.04.2012.
36 Fish Info & Servicesupload/FISUpdateFeb11.pdf, accessed 03.04.2012.
37 Clarkson (2012). Dry Bulk Trade Outlook. 18(2). February 2012.
38 Lloyd’s List (2012). Size of Capesize ships set to explode. http://www.lloydslist.com/ll/sector/dry-cargo/article393401.ece, accessed 03.04.2012.
39 Lloyd’s List (2012). Panamax period charters stall. http://www.lloydslist.com/ll/sector/dry-cargo/article391339.ece, accessed 15.03.2012.
40 Clarkson (2010–2012). Dry Bulk Trade Outlook. Various issues.
41 Lloyd’s Listsector/dry-cargo/article392634.ece, accessed 15.03.2012.
42 IHS Fairplay (2012). Panamax rates keep sliding. http://www.fairplay.co.uk/login.aspx?reason=denied_empty&script_name=/secure/display.aspx&path_info=/secure/display.aspx&articlename=dn0020120516000001, accessed 30.05.2012.
43 GLG Research (2007). Supramax market better protected than larger cousins. https://www.hightable.com/maritime-and-shipping/insight/supramax-market-better-protected-than-larger-cousins-12957, accessed 05.04.2012.
44 Lloyd’s List (2011). Bigger Supramaxes steal market share. http://www.lloydslist.com/ll/sector/dry-cargo/article359304.ece, accessed 05.04.2012.
45 Drewry (2012). Shipping Insight. Various issues.
46 Clarkson (2011). Dry Bulk Trade Outlook. December 2011.
47 Figures based on the analysis of the New ConTex index for containerships, the Baltic Exchange Dry Bulk Index for bulkers
48 Data from study conducted by Moore Stephens in 2011 based on data from over 2,600 vessels. http://www.moorestephens.gr/images/OpCost_Seminar.pdf, accessed 09.05.2012.
49
50 Stopford M (2006). Maritime Economics. Routledge. Oxford. p. 43.
51 World Bank (2012). Why Does Cargo Spend Weeks in Sub-Saharan African Ports? Washington DC.
52 World Bank (2007). Port and Maritime Transport Challenges in West and Central Africa. Washington DC.
53 World Bank (2007). Port and Maritime Transport Challenges in West and Central Africa. Washington DC.
54 United States Department of Transportation (2011). Comparison of U.S. and Foreign-Flag Operating Costs. http://www.marad.dot.gov/documents/Comparison_of_US_and_Foreign_Flag_Operating_Costs.pdf, accessed 24.04.2012.
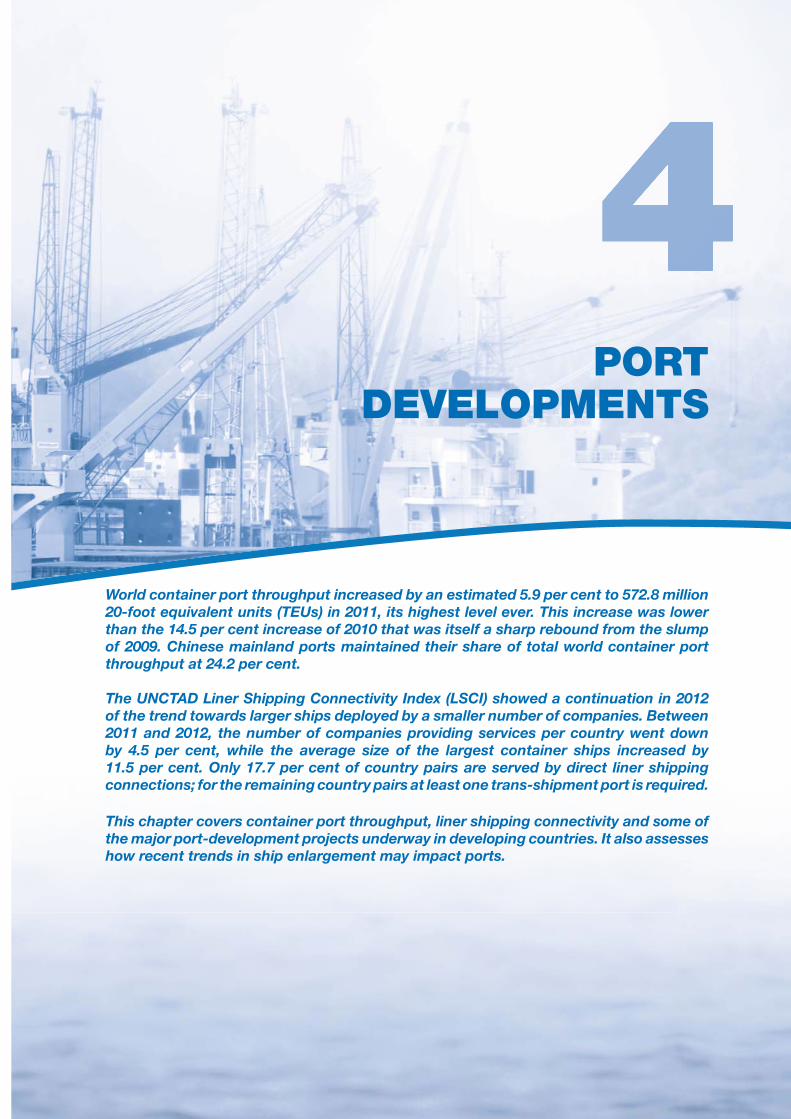
of 2009. Chinese mainland ports maintained their share of total world container port
of the trend towards larger ships deployed by a smaller number of companies. Between 2011 and 2012, the number of companies providing services per country went down
connections; for the remaining country pairs at least one trans-shipment port is required.
This chapter covers container port throughput, liner shipping connectivity and some of
how recent trends in ship enlargement may impact ports.
PORT DEVELOPMENTS
REVIEW OF MARITIME TRANSPORT 201280
A. PORT THROUGHPUT
Port throughput is usually measured in tons and by
cargo is usually measured in tons or sometimes, in the
case of oil, in barrels. Within the dry cargo sector there
is bulk (coal, grain, iron ore, and the like) and break bulk
(for example, general cargo, timber and containers).
The dry cargo sector represents around two-thirds of
bulks (coal, grain, iron ore, phosphates and bauxite/
cargo. These other dry cargoes (for example, timber,
outsized cargo) are carried in general cargo vessels
The potential for container trade to continue increasing
its share of the dry cargo sector is therefore a real
possibility. The goods that are shipped in containers
represent a variety of products ranging from scrap
waste, raw materials and semi-manufactured goods
container is popular because it is practical, versatile,
such as ease of movement between modes and
reductions in cargo handling time and costs. The
share of container cargo within a country’s break-
bulk trade could also serve as a barometer of how
well a country is integrated into the international trade
to developments in container shipping and container
ports.
1. Container ports
Container-port throughput is measured in terms of
TEUs. It is one of the few units which enable port activity
in transition with an annual national throughput of
over 100,000 TEUs are listed. (Annex IV shows port
container throughput for developing economies grew
This growth is a turnaround in the sharp decline of
the previous year that was largely a direct response
to businesses reducing their inventories in light of
uncertainties surrounding the global economic crisis.
The growth rate for container throughput in developing
signifying a return to previous year-on-year growth
levels. Developing economies’ share of world
throughput continues to remain virtually unchanged at
economies and economies in transition listed in
throughput in 2010, signalling that there have not been
any sustained affects on container ports as a result of
the global economic crisis. Of the top 10 developing
countries and countries in transition, nine are located
in Asia. Sixteen of the top 20 countries are also in
Asia, while two are in Central and South America and
two in Africa. The dominance of Asia in container port
producing exports. The 10 countries registering the
share of container throughput continues to be China,
with eight of its ports amongst the top 20. Chinese
ports, excluding Hong Kong (China), experienced
a reduced growth for Chinese port throughput to
ports, with the exception of Hong Kong (China) and
Taiwan, Province of China, accounted for around
reduction of Chinese ports’ share in world container
throughput also corresponds to a reduction in Chinese
imports of some raw materials, such as iron ore and
thermal coal.1 In order to boost imports and achieve
a more balanced trade with trading partners, China
announced in 2012 a series of reductions on import
taxes for certain goods.2 This move could translate
into increased manufacture of goods for export,
if these are not consumed domestically, and thus
help increase container throughput (a more detailed
account of international trade demand and supply is
for the period 2009–2011. The top 20 container ports
container port throughput in 2011. Combined, these
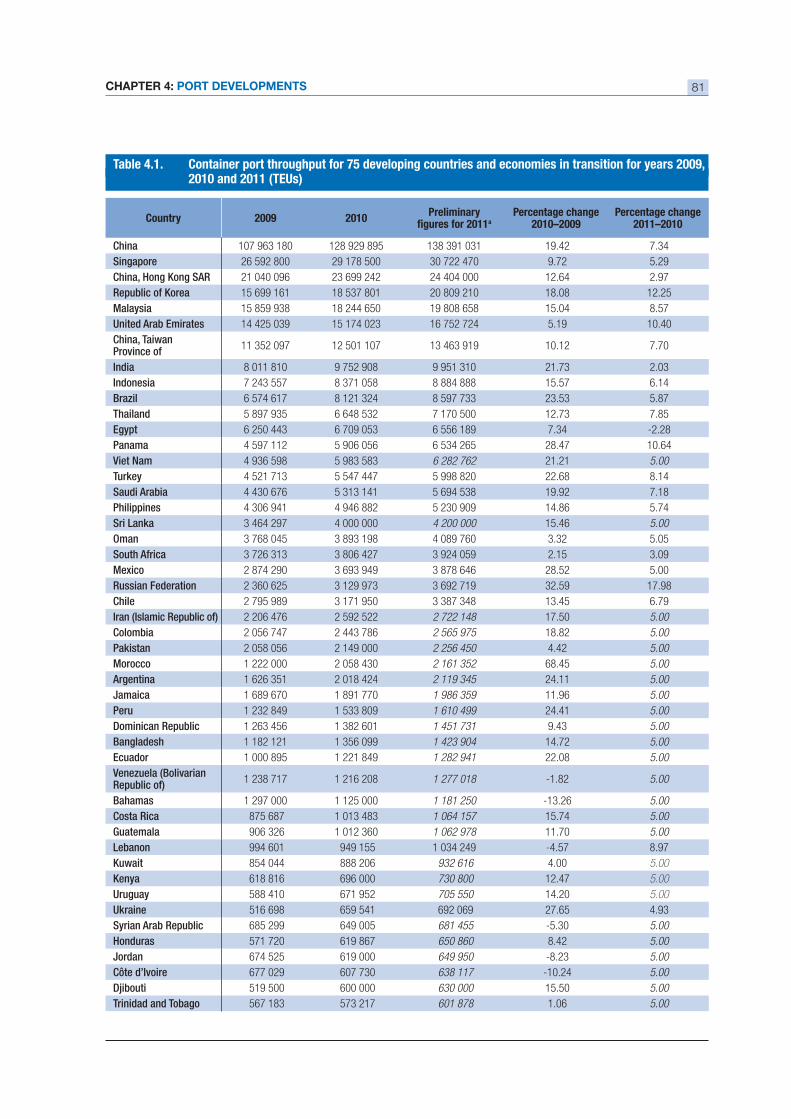
CHAPTER 4: PORT DEVELOPMENTS 81
Table 4.1. Container port throughput for 75 developing countries and economies in transition for years 2009,2010 and 2011 (TEUs)
Country 2009 2010Preliminary
aPercentage change
2010–2009Percentage change
2011–2010
China 107 963 180 128 929 895 138 391 031 19.42 7.34
Singapore 26 592 800 29 178 500 30 722 470 9.72 5.29
China, Hong Kong SAR 21 040 096 23 699 242 24 404 000 12.64 2.97
Republic of Korea 15 699 161 18 537 801 20 809 210 18.08 12.25
Malaysia 15 859 938 18 244 650 19 808 658 15.04 8.57
United Arab Emirates 14 425 039 15 174 023 16 752 724 5.19 10.40
China, TaiwanProvince of
11 352 097 12 501 107 13 463 919 10.12 7.70
India 8 011 810 9 752 908 9 951 310 21.73 2.03
Indonesia 7 243 557 8 371 058 8 884 888 15.57 6.14
Brazil 6 574 617 8 121 324 8 597 733 23.53 5.87
Thailand 5 897 935 6 648 532 7 170 500 12.73 7.85
Egypt 6 250 443 6 709 053 6 556 189 7.34
Panama 4 597 112 5 906 056 6 534 265 28.47 10.64
Viet Nam 4 936 598 5 983 583 6 282 762 21.21 5.00
Turkey 4 521 713 5 547 447 5 998 820 22.68 8.14
Saudi Arabia 4 430 676 5 313 141 5 694 538 19.92 7.18
Philippines 4 306 941 4 946 882 5 230 909 14.86 5.74
Sri Lanka 3 464 297 4 000 000 4 200 000 15.46 5.00
Oman 3 768 045 3 893 198 4 089 760 3.32 5.05
South Africa 3 726 313 3 806 427 3 924 059 2.15 3.09
Mexico 2 874 290 3 693 949 3 878 646 28.52 5.00
Russian Federation 2 360 625 3 129 973 3 692 719 32.59 17.98
Chile 2 795 989 3 171 950 3 387 348 13.45 6.79
Iran (Islamic Republic of) 2 206 476 2 592 522 2 722 148 17.50 5.00
Colombia 2 056 747 2 443 786 2 565 975 18.82 5.00
Pakistan 2 058 056 2 149 000 2 256 450 4.42 5.00
Morocco 1 222 000 2 058 430 2 161 352 68.45 5.00
Argentina 1 626 351 2 018 424 2 119 345 24.11 5.00
Jamaica 1 689 670 1 891 770 1 986 359 11.96 5.00
Peru 1 232 849 1 533 809 1 610 499 24.41 5.00
Dominican Republic 1 263 456 1 382 601 1 451 731 9.43 5.00
Bangladesh 1 182 121 1 356 099 1 423 904 14.72 5.00
Ecuador 1 000 895 1 221 849 1 282 941 22.08 5.00
Venezuela (Bolivarian Republic of)
1 238 717 1 216 208 1 277 018 5.00
Bahamas 1 297 000 1 125 000 1 181 250 5.00
Costa Rica 875 687 1 013 483 1 064 157 15.74 5.00
Guatemala 906 326 1 012 360 1 062 978 11.70 5.00
Lebanon 994 601 949 155 1 034 249 8.97
Kuwait 854 044 888 206 932 616 4.00 5.00
Kenya 618 816 696 000 730 800 12.47 5.00
Uruguay 588 410 671 952 705 550 14.20 5.00
Ukraine 516 698 659 541 692 069 27.65 4.93
Syrian Arab Republic 685 299 649 005 681 455 5.00
Honduras 571 720 619 867 650 860 8.42 5.00
Jordan 674 525 619 000 649 950 5.00
Côte d’Ivoire 677 029 607 730 638 117 5.00
Djibouti 519 500 600 000 630 000 15.50 5.00
Trinidad and Tobago 567 183 573 217 601 878 1.06 5.00
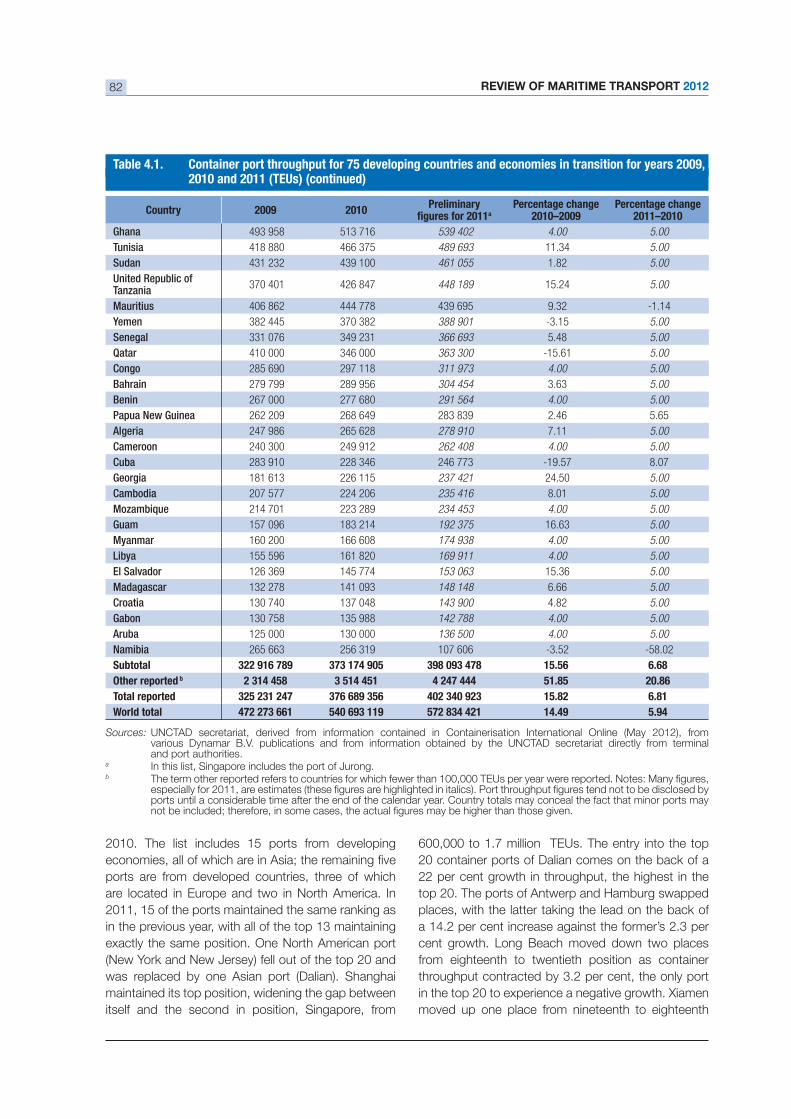
REVIEW OF MARITIME TRANSPORT 201282
2010. The list includes 15 ports from developing
ports are from developed countries, three of which
are located in Europe and two in North America. In
in the previous year, with all of the top 13 maintaining
exactly the same position. One North American port
(New York and New Jersey) fell out of the top 20 and
was replaced by one Asian port (Dalian). Shanghai
maintained its top position, widening the gap between
itself and the second in position, Singapore, from
Country 2009 2010Preliminary
aPercentage change
2010–2009Percentage change
2011–2010
Ghana 493 958 513 716 539 402 4.00 5.00
Tunisia 418 880 466 375 489 693 11.34 5.00
Sudan 431 232 439 100 461 055 1.82 5.00
United Republic of Tanzania
370 401 426 847 448 189 15.24 5.00
Mauritius 406 862 444 778 439 695 9.32
Yemen 382 445 370 382 388 901 5.00
Senegal 331 076 349 231 366 693 5.48 5.00
Qatar 410 000 346 000 363 300 5.00
Congo 285 690 297 118 311 973 4.00 5.00
Bahrain 279 799 289 956 304 454 3.63 5.00
Benin 267 000 277 680 291 564 4.00 5.00
Papua New Guinea 262 209 268 649 283 839 2.46 5.65
Algeria 247 986 265 628 278 910 7.11 5.00
Cameroon 240 300 249 912 262 408 4.00 5.00
Cuba 283 910 228 346 246 773 8.07
Georgia 181 613 226 115 237 421 24.50 5.00
Cambodia 207 577 224 206 235 416 8.01 5.00
Mozambique 214 701 223 289 234 453 4.00 5.00
Guam 157 096 183 214 192 375 16.63 5.00
Myanmar 160 200 166 608 174 938 4.00 5.00
Libya 155 596 161 820 169 911 4.00 5.00
El Salvador 126 369 145 774 153 063 15.36 5.00
Madagascar 132 278 141 093 148 148 6.66 5.00
Croatia 130 740 137 048 143 900 4.82 5.00
Gabon 130 758 135 988 142 788 4.00 5.00
Aruba 125 000 130 000 136 500 4.00 5.00
Namibia 265 663 256 319 107 606
Subtotal 15.56 6.68
Other reported b 4 247 444 51.85 20.86
Total reported 15.82 6.81
World total 14.49 5.94
Sources: UNCTAD secretariat, derived from information contained in Containerisation International Online (May 2012), fromvarious Dynamar B.V. publications and from information obtained by the UNCTAD secretariat directly from terminaland port authorities.
a In this list, Singapore includes the port of Jurong.b
ports until a considerable time after the end of the calendar year. Country totals may conceal the fact that minor ports may
Table 4.1. Container port throughput for 75 developing countries and economies in transition for years 2009,2010 and 2011 (TEUs) (continued)
20 container ports of Dalian comes on the back of a
top 20. The ports of Antwerp and Hamburg swapped
places, with the latter taking the lead on the back of
cent growth. Long Beach moved down two places
from eighteenth to twentieth position as container
in the top 20 to experience a negative growth. Xiamen
moved up one place from nineteenth to eighteenth
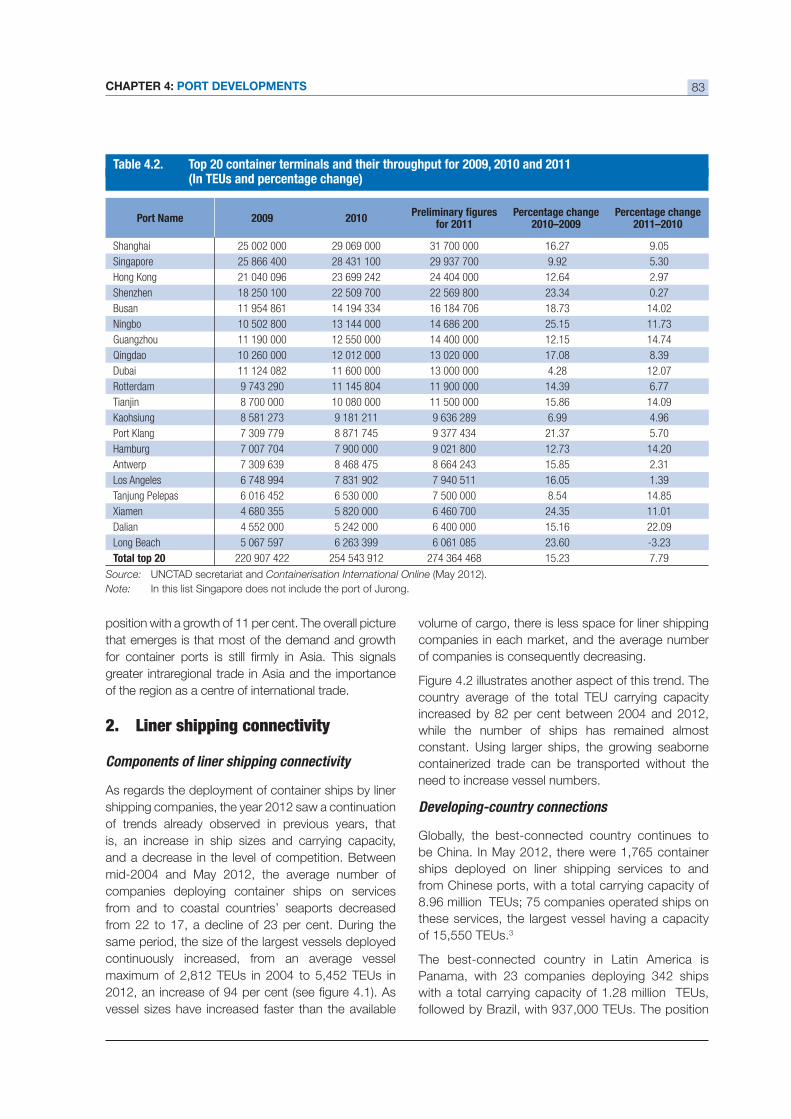
CHAPTER 4: PORT DEVELOPMENTS 83
that emerges is that most of the demand and growth
greater intraregional trade in Asia and the importance
of the region as a centre of international trade.
2. Liner shipping connectivity
Components of liner shipping connectivity
As regards the deployment of container ships by liner
shipping companies, the year 2012 saw a continuation
of trends already observed in previous years, that
is, an increase in ship sizes and carrying capacity,
and a decrease in the level of competition. Between
mid-2004 and May 2012, the average number of
companies deploying container ships on services
from and to coastal countries’ seaports decreased
same period, the size of the largest vessels deployed
continuously increased, from an average vessel
maximum of 2,812 TEUs in 2004 to 5,452 TEUs in
vessel sizes have increased faster than the available
Source: UNCTAD secretariat and Containerisation International Online (May 2012).
Note: In this list Singapore does not include the port of Jurong.
Table 4.2. Top 20 container terminals and their throughput for 2009, 2010 and 2011(In TEUs and percentage change)
Port Name 2009 2010for 2011
Percentage change 2010–2009
Percentage change 2011–2010
Shanghai 25 002 000 29 069 000 31 700 000 16.27 9.05
Singapore 25 866 400 28 431 100 29 937 700 9.92 5.30
Hong Kong 21 040 096 23 699 242 24 404 000 12.64 2.97
Shenzhen 18 250 100 22 509 700 22 569 800 23.34 0.27
Busan 11 954 861 14 194 334 16 184 706 18.73 14.02
Ningbo 10 502 800 13 144 000 14 686 200 25.15 11.73
Guangzhou 11 190 000 12 550 000 14 400 000 12.15 14.74
Qingdao 10 260 000 12 012 000 13 020 000 17.08 8.39
Dubai 11 124 082 11 600 000 13 000 000 4.28 12.07
Rotterdam 9 743 290 11 145 804 11 900 000 14.39 6.77
Tianjin 8 700 000 10 080 000 11 500 000 15.86 14.09
Kaohsiung 8 581 273 9 181 211 9 636 289 6.99 4.96
Port Klang 7 309 779 8 871 745 9 377 434 21.37 5.70
Hamburg 7 007 704 7 900 000 9 021 800 12.73 14.20
Antwerp 7 309 639 8 468 475 8 664 243 15.85 2.31
Los Angeles 6 748 994 7 831 902 7 940 511 16.05 1.39
Tanjung Pelepas 6 016 452 6 530 000 7 500 000 8.54 14.85
Xiamen 4 680 355 5 820 000 6 460 700 24.35 11.01
Dalian 4 552 000 5 242 000 6 400 000 15.16 22.09
Long Beach 5 067 597 6 263 399 6 061 085 23.60
Total top 20 220 907 422 254 543 912 274 364 468 15.23 7.79
volume of cargo, there is less space for liner shipping
companies in each market, and the average number
country average of the total TEU carrying capacity
while the number of ships has remained almost
constant. Using larger ships, the growing seaborne
containerized trade can be transported without the
need to increase vessel numbers.
Globally, the best-connected country continues to
be China. In May 2012, there were 1,765 container
ships deployed on liner shipping services to and
from Chinese ports, with a total carrying capacity of
these services, the largest vessel having a capacity
of 15,550 TEUs.3
The best-connected country in Latin America is
Panama, with 23 companies deploying 342 ships
followed by Brazil, with 937,000 TEUs. The position
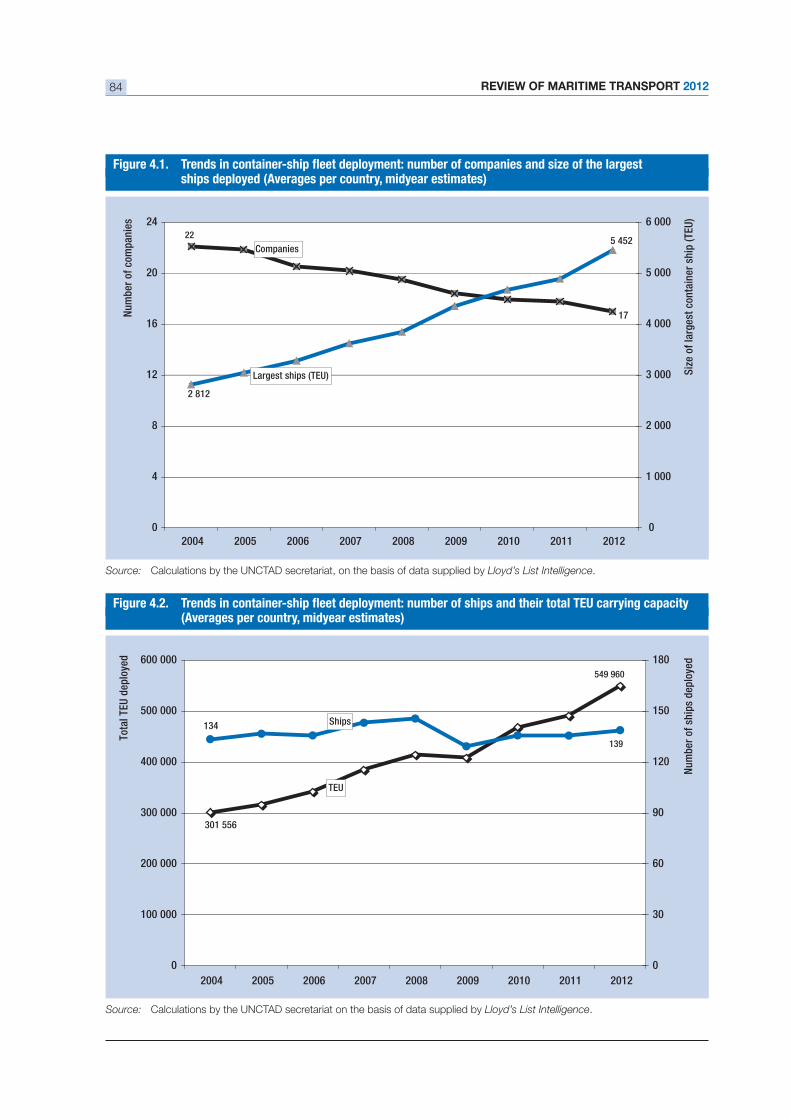
REVIEW OF MARITIME TRANSPORT 201284
ships deployed (Averages per country, midyear estimates)
(Averages per country, midyear estimates)
Source: Calculations by the UNCTAD secretariat, on the basis of data supplied by Lloyd’s List Intelligence.
Source: Calculations by the UNCTAD secretariat on the basis of data supplied by Lloyd’s List Intelligence.
22
17
Companies
Largest ships (TEU)
2 812
5 452
0
4
8
12
16
20
24
2004 2005 2006 2007 2008 2009 2010 2011 2012
Num
bero
fcom
pani
es
0
1 000
2 000
3 000
4 000
5 000
6 000
Size
ofla
rges
tcon
tain
ersh
ip(T
EU)
TEU
549 960
301 556
Ships
139
134
0
100 000
200 000
300 000
400 000
500 000
600 000
2004 2005 2006 2007 2008 2009 2010 2011 2012
Tota
lTEU
depl
oyed
0
30
60
90
120
150
180
Num
bero
fshi
psde
ploy
ed
CHAPTER 4: PORT DEVELOPMENTS 85
of Panama as a hub in Latin America is made evident
by the large number of ships deployed on routes from
Panama to China (147 container ships), to the United
States (182 ships) and to Colombia (127 ships).
In Africa, the geographical positions of Egypt,
Morocco and South Africa at the nodes of the
global liner shipping networks contribute to
these countries’ highest connectivity for this
continent. There are more companies that provide
services between South Africa and Singapore (15
companies), China (14) and Malaysia (13) than for
intra-African connections. For example, there are
only eight companies that connect South Africa with
Benin and Nigeria.
In South Asia, ports in Sri Lanka cater for larger
container ships than ports in India, and the total TEU
TEUs) is higher than the TEU deployed from and to
Malaysia are the best-connected countries in South-
capacity deployed, respectively.
Comparing different regions, the densest network of
liner shipping services is within Asia. There are 794
container ships deployed on regular services between
China and the Republic of Korea, 718 between China
and Singapore, and 600 between China and Malaysia.
China and the United States, and 111 ships between
the United States and Germany.
Characteristics of the global network
An analysis of the structure of the global liner shipping
pairs are served by direct liner shipping connections.4
For the remaining country pairs, at least one trans-
Interestingly, at least in theory (potentially competing
shipping companies and ports would need to
connected with only one trans-shipment (for example,
of country pairs is a second trans-shipment needed;
for example, to move a container from Cambodia to
Namibia is possible via Singapore and South Africa.
cent of country pairs; an example of the latter would
be containerized trade between Tuvalu and the
Democratic Republic of the Congo via New Zealand,
Belgium and the Republic of the Congo. While it is
transaction between these two countries, thanks to
the global liner shipping network and trans-shipment
ports, it would be possible.
B. RECENT PORT DEVELOPMENTS
Port developments continue throughout the world
at an uneven pace spurred on by national needs to
import and export and a chance to seize a share of
growing world seaborne trade through trans-shipment
opportunities. The following sections are a brief
overview of some of these developments organized
alphabetically. The list is not exhaustive and the
ports mentioned are merely meant to give regional
perspective as well as illustrate the variety and type
of developments. Other developments mentioned in
previous issues of the Review of Maritime Transport
continue at their pace. Virtually every port or
government has a development plan or is presently
engaged in infrastructure improvements.
In Cameroon, work continues on the development
of the Kribi port complex. The port will enable
subregional integration through the Kribi–Bangui (the
Central African Republic)–Kasangani (the Democratic
Republic of the Congo) transport and development
corridor.5 The port, which is being built as the main
export point for oil pumped from Chad via pipeline,
will also handle containerised cargo and cargo for
Cameroon’s mining sector, such as bauxite, iron,
nickel and cobalt.
In China, port developments continue at a seemingly
relentless pace. The port of Xiamen is planning to
its facilities over the next few years. This is in
container terminal – Xiamen Ocean Gate Container
Terminal – in 2011.6 For Ningbo-Zhoushan port,
plans were announced to build two iron-ore berths
of 300,000–400,000 deadweight ton (dwt) capacity,
7
This suggests that the recent declines in the import of
iron ore by Chinese ports is not envisaged to persist into
the long term.
In Costa Rica, the Government approved a 33-year
concession agreement with APM Terminals (APMT)
to construct and operate the Caribbean port at Moin.
Located 10 hours sailing time from the Panama Canal,
REVIEW OF MARITIME TRANSPORT 201286
the construction is set to be completed by the end of
will have an along-side depth of 16 metres and be able
to serve the current maximum container vessels.8 It will
be able to attract new clients by accommodating some
In France, the ports of Le Havre, Rouen and Paris,
to form a new entity named HAROPA. The new entity
aims to win back some of the trade lost in 2011 due
to strikes by port workers in response to nation-wide
port reforms. This concept enables synergies in pricing
and marketing and if successful could be a concept
which may be adopted by other ports in other regions.
In Georgia, transfer of the operations of the Black Sea
port of Poti from Ras Al Khaimah Investment Authority
(RAKIA), a sovereign wealth fund of the United Arab
Emirates, to APMT resulted in the retrenchment of
in 2008, but the company had failed to stimulate local
trade through the port.9 This example illustrates the
In Germany, the port of Wilhelmshaven partially opened
for business in 2012. The port has experienced various
challenges including, on the operational side, the
provision of tug services and, on the infrastructure side,
port, which has a depth of 18 metres, is able to serve
the world’s largest container ships, such as Maersk’s
Triple E-class vessels. To attract new business the
cent rebate on its standard tariff of €0.32 per ton on
all ships until December 2013, after which the rebate
This means that, for example, Maersk’s E-class vessel
the 170,794 gross tonnage (GT) M/V Emma Maersk
of €46,400.10 Such pricing strategies could also be
offered by other ports in order to stimulate demand.
Borsi and Kutchhigarh, which are to be undertaken
using public–private partnership (PPP). Plans to
develop ports at Dholera and Khambhat have been
aims to build a dam over the Gulf of Khambhat to
establish a huge fresh-water reservoir. These port
developments serve to illustrate that the Government
of India is committed to undertaking improvements to
its transport infrastructure. However, the task is huge
construction commenced, while only 25 have seen
completion.11
In Indonesia, Perlindo II, the state-owned port
operator and port authority, was given permission by
the Government to start the construction of Kalibaru
port. Phase one of the new port construction will see
online in early 2014, followed by further construction
of two more terminals, bringing the total capacity 12 This development is
important for a country which is seeing an average
cent per year since 2008 and a growing per capita
income of $3,000.13
In the Democratic People’s Republic of Korea, plans
were announced to develop the port of Rason in the
north-east of the country. Details of the plans are
vague but refer to refurbishing three piers, developing
an airport, a power station and the construction a
34-mile cross-border railroad linking the port to the
Chinese north-eastern city of Tumen.14 The agreement
investment is coming from China.15 The area around
Rason will be a Special Economic Zone. Elsewhere in
the country, similar plans are afoot to develop Wihwa
Islands located in the north-west and across the Yalu
River from the Chinese city of Dandong. Increasing
trade between the Democratic People’s Republic
of Korea and its neighbours allows for greater
opportunities and backward linkages into the national
economy, which may help raise the country’s GDP
and living standards.
In Liberia, negotiations with a Dutch dredging
company are near completion that will enable better
utilization of a previous concession agreement signed
between the Government and APMT to develop the
port of Monrovia. In 2010, APMT signed a 25-year
concession agreement to operate the port and invest
wharf and improve the port infrastructure.16 This will
help improve market access for both importers and
exports and may lead to lower transport costs.
In Morocco, the newly operational container port
Tanger Med II is continuing to expand its container
capacity with third and fourth terminals, scheduled
to be operational in 2015/16. The new terminals
CHAPTER 4: PORT DEVELOPMENTS 87
per annum. In 2012, Renault opened a new vehicle
assembly plant near the port that is expected to
port, which experienced a labour strike in 2011 over
stevedore pay and conditions that then contributed
to a reduction in cargo volumes at the port during
the later part of 2011 and into 2012. A year-on-year
17
In Nigeria, the Nigerian Ports Authority (NPA)
announced plans to develop two new deepwater
ports at Lekki, in Lagos State, and Ibaka, near the city
of Uyo in Akwa Ibom. The Ibaka port development 18
The work includes the construction and operation of
an oil and gas facility on a 20-year concession basis.19
In South Africa, Transnet Port Terminals (TPT)
over seven years on capital expenditure to encourage
areas marked for investment include container
ore bulk facilities at Saldanha, and the creation of
additional manganese capacity by relocating cargo
from Port Elizabeth to a newly created two-berth
re-engineered to create additional capacity for bulk
products.20
upon completion will include four container berths, a
bulk berth. The port has been partially open since the
TEUs.21 Together, these developments help to mark
the ascendance of South Africa as one of the world’s
emerging economies, as described in various press
articles under the acronym BRICS (Brazil, Russian
Federation, India, China and South Africa).
In Ukraine, the Government gave approval for a new
port to be built at Lake Donuzlav in the Crimea. The
location is in an area free of ice all year round, has a
natural depth of 25 metres and is directly accessible
to the Black Sea. The new facilities will focus upon
providing ferry, general cargo and container services.
reached between the Ukraine Government and China
National Technical Import and Export Corporation
(CNTIC).22 The port will facilitate direct access for
trade between Ukraine and Asia.
In the United Kingdom, the Olympic Games and the
associated preparation have increased congestion
along the River Thames. Two barges normally used for
transporting non-containerized cargo on the Thames
were deployed from Tilbury to Northumberland wharf
– a few kilometres from the Olympic village – to carry
the service could be extended further west along
the Thames to Fulham, Battersea or Wandsworth.23
comeback, for example between the cities of Liverpool
and Manchester.24 Together, these developments may
mark the start of a shift to a more sustainable freight
transport.
In the United States, the port of Long Beach is set
terminals to handle containers and provide rail access,
a new container terminal.25 The port of New York/
New Jersey revealed plans to develop a terminal of
The new terminal is expected to open in 2014 at a
an advantage over close neighbours and competitors
located west of the height-restricted Bayonne Bridge.26
These developments coincide with the enlargement
of the Panama Canal and provide the opportunity to
envisaged to create.
C. PORT DEVELOPMENT OUTLOOK
Port development is closely related to the actual,
historical or anticipated volumes of trade that pass
through the port, that is, the derived demand of the
when congestion at existing ports becomes a problem
for one or more parties. Many traditional ports built
close to rivers or natural harbours have become
REVIEW OF MARITIME TRANSPORT 201288
constrained over time as cities have grown around
groups (workers, residents, user groups, business
owners, and the like) vie to advocate their concerns
and express their needs. These landside users’
issues are in stark contrast with those of the seaside
users. Landside users are constrained by the
local or national governments and special-interest
groups, whereas the seaside users are often able to
make changes which may affect local communities
these areas concerns the port’s maritime customers,
the shipowners. Ships are mobile and generally do
not operate where they were constructed. Local
communities centred around their creation points
tend to see their advantages (for example, direct and
indirect local employment) and not their operational
disadvantages (pollution through emissions of gases,
noise and light, among others). Ship construction
is a large employer with strong roots in the local
community and usually closely associated with other
industrial plants, such as smelting. Ports, on the other
hand, have lost a lot of their employee-based relations
with the local community through retrenchment of
labour brought about by mechanisation, streamlined
business practices and a concentration on trans-
communities are very sensitive to change, because
ports rarely move and their facilities usually last for
several decades.
from economies of scale by building ships that are
longer, wider and deeper than previous vessels. To
service these customers, ports need to undertake
a number of upgrades to their infrastructure
like), superstructure (for example, cranes, storage
(dredging, human resources, software, and the
like). Port authorities or governments need to
make informed choices about where to invest,
the potential return on investment and the cost of
each opportunity. Adaptation measures to possible
negative impacts of climatic changes, such as sea-
level rise and extreme weather events also need to
be considered. Infrastructure investments need to
competiveness in international markets.
The impact of increased ship size upon ports can be
substantial. For example, the ports of Rotterdam and
Shanghai have, over time, become constrained by the
cities which have grown around them. The only route
for expansion is to build further into the sea as this
to accommodate larger ships. Both Rotterdam’s
new Maasvlakte container terminal and Shanghai’s
Yangshan container terminals are located at the most
extreme outreaches of the ports with the greatest
of container vessels. In addition, some ports (for
example, gateway and transit ports)27 need hinterland
connections to facilitate the movement of cargo.
Container terminals
at the expense of the share of general break bulk
cargo carried via other means, but also through
increased global trade. Many ports have adapted
to this changing pattern of trade by undertaking
infrastructure development programmes to increase
their market share of containerized cargo. Increased
port throughput volumes may increase the port’s
revenue collected through port dues or cargo
handling fees. Local government may also see
an increase in tax collection through higher trade
volumes. However, increased cargo volumes driven
by increased competition (between ports, exporters
and importers, transport operators, and the like),
could greatly improve the chances of return cargoes
becoming available. This could lead to improved
connectivity and lower transport costs per unit, to the
trade are well documented and include higher levels
of peace, security, health and living standards.28 While
this outcome may seem far removed from ship size,
improvements which help lower transport costs could
spill over into other areas.
the 6,400 TEU M/V Regina Maersk, back in 1996,
there has been a trend for ever larger ships. The M/V
Regina Maersk
than its predecessors, but today is dwarfed by the
latest class of container ships. In 2006, the M/V
Emma Maersk was launched with a reported capacity
CHAPTER 4: PORT DEVELOPMENTS 89
been launched, with around one and a half times that
number set to be delivered over the next few years.29
In 2011, the shipping line Maersk ordered 20 vessels
as super-post-Panamax, ultra-large container ships
(ULCSs) or Malaccamax vessels (the maximum size of
vessels that are able to transit the Straight of Malacca,
a main route for cargo moving between the Far East
and Western Asia, Africa and Europe).
access channels, alongside berth depths of 18
be able to accommodate the latest ULCS vessels,
their existence has an implication for all ports. Only
a few of the world’s biggest ports on the East–West
trade routes will be served by ULCSs. Displaced ships
will, however, operate elsewhere and bring changes to
vessels (for example, M/V Regina Maersk), which are
too young to be scrapped, are still operating on the
main East–West route.30 With a draft of 14.5 metres
ports (excluding those located in South Africa, Egypt,
Mauritius and Morocco). However, ports located
vessels greater than 4,000 TEUs, this indicating that
displaced East–West vessels are seizing opportunities
in South–South trading. This implies that ports in these
countries also need to undertake, in their turn, more
costly infrastructure works and provide each vessel
The implications of ULCSs of 22,000 TEUs for ports are
that larger shore-side gantry cranes, with an outreach
will be needed. The distance between the front and
back legs of the cranes may also need to be increased
from 30 to 35 metres.31 This can be problematic as
constraints. Some of the challenges with larger cranes
include stiffness, weight, corner loads, wind loads,
increased power and operational issues including
visibility, handling speeds and performance.32 Another
less common implication for ports concerns that of
local residents, who may complain about unsightly
cranes interrupting their view.33
The cost of purchasing new container gantry
cranes capable of servicing ULCSs is around
could theoretically employ 10 to 12 such cranes.
These cranes are sometimes called Jumbo 23s,
because their outreach stretches to 23 containers
23 containers wide, the ports of Jebel Ali in Dubai
and Felixstowe in the United Kingdom have container
gantry cranes with an outreach of 24 containers, and
the new port of Wilhelmshaven in Germany reportedly
has cranes with an outreach of 25.34 Adapting existing
cranes could, however, prove a solution to some
cost of new material. In addition, long waiting lists and
a limited number of manufacturers often means that
that of procuring a new one.35 With two of the market
leaders in the manufacture of container gantry cranes
located in China, and customers located worldwide,
the transportation of these cranes via ship can take
capable of handling 22 or more rows of containers
terminal operators have a shareholding.36 As of 2011,
the order book for container gantry cranes with an
outreach of greater than 22 container rows totalled 17,
two destined for the Caribbean and Central America,
four for North America, four for South-East Asia and
seven for the Far East. However, the most popular
size of cranes on order is for those with an outreach
of 18–20 rows. This may imply that smaller ports
are upgrading their facilities as the cascading effect
of larger ships entering the market pushes smaller
vessels to call at other ports.
Container gantry cranes with an outreach of 22 rows
terminal operators in the Caribbean, Central America,
South Asia and Southern Europe. In Northern Europe
cent. This shows that many governments have met
through public–private partnerships. According to
Drewry Shipping Consultants, of the 1,011 container
gantry cranes of between 20 and 22 rows in operation,
three are located in South Asia, 48 in the whole of
Africa, 99 in South-East Asia and 542 in the Far East.
against other destinations, where containerized cargo
relates primarily to import trade.
The world’s largest crane manufacture is the Chinese
REVIEW OF MARITIME TRANSPORT 201290
of the market share and is continually updating its
designs.37 However, as good as each crane design may
be, there are limitations to how many can be deployed
per vessel and increasingly wider vessels do not
necessarily permit more cranes to be deployed unless
an indented berth concept is adopted.38 However,
modern technology enables different concepts to be
tried and tested. For example, the container terminal
operator APMT is working on its own crane concept.
This company’s FastNet container terminal concept
allows gantry cranes to work more closely together,
deployed per vessel. The FastNet crane concept
present container gantry cranes are too wide to allow
this. With ULCSs capable of holding 24 FEUs from
fore to aft and 23 containers across their beams,
employing more container gantry cranes is imperative
One area often overlooked when considering port
development is insurance. According to one survey
accidents were caused by human error.39 Maintenance
a factor in increased claims.40 In an analysis of its
cost of asset-related claims was directly related to
container gantry cranes. The main causes of damage
to container gantry cranes cited were:
Wind damage – with ports being built further out
to sea to cater for larger ships, there are fewer
Hoist, spreaders and ropes – better preventative
maintenance is needed;
Structural integrity issues – again better
maintenance or design could help;
Operational issues – boom-to-ship collisions,
spreaders, ship-cell guides and ropes all caused
41
Dry bulk terminals
In the dry bulk sector ships are also increasing in size.
world seaborne trade by volume but, because these
cent by value. The dry bulk sector is dominated by the
grain, iron ore, bauxite/alumina and phosphates). Two
of the biggest mining companies are the Australian
BHP Billiton and the Brazilian Vale, which compete on
many fronts including shipments of iron ore to China,
the world’s single biggest importer. In 2011, China
Because of the greater distance from Brazil to China
compared with that of Australia to China, more of the
costs. The vessels plying a trade between Brazil and
including loading and unloading time, whereas on the
Australia to China route the same vessel can perform
an average of 12 voyages. Australian iron ore can thus
command a higher price, grading excluded.
Termed Valemax vessels, they are the world’s largest
dry bulk ships. The Valemax vessels are an attempt
disadvantage over its closest competitor, BHP Billiton,
for its largest customer market, China. In terms of
of BHP Billiton, and enough to theoretically keep 70
Valemax vessels in full employment. Presently, it is
reported that Vale have 35 Valemax vessels on order
The Valemax vessels have, however, caused some
controversy, generated especially by Chinese owners
of smaller dry bulk vessels concerned about a lack
the Chinese Government announced that dry bulk
at Chinese ports.42 This decision was apparently
superseded by another decision from the Chinese
Government that stated that approval would be given
to the port of Ningbo-Zhoushan to build two berths of
vessels.
Vale, in an attempt to overcome Chinese port
restrictions, is undertaking an innovative solution using
to China. In 2012, Vale took delivery of the world’s
largest trans-shipment vessel, the M/V Ore Fabrica
. The vessel will serve as a platform
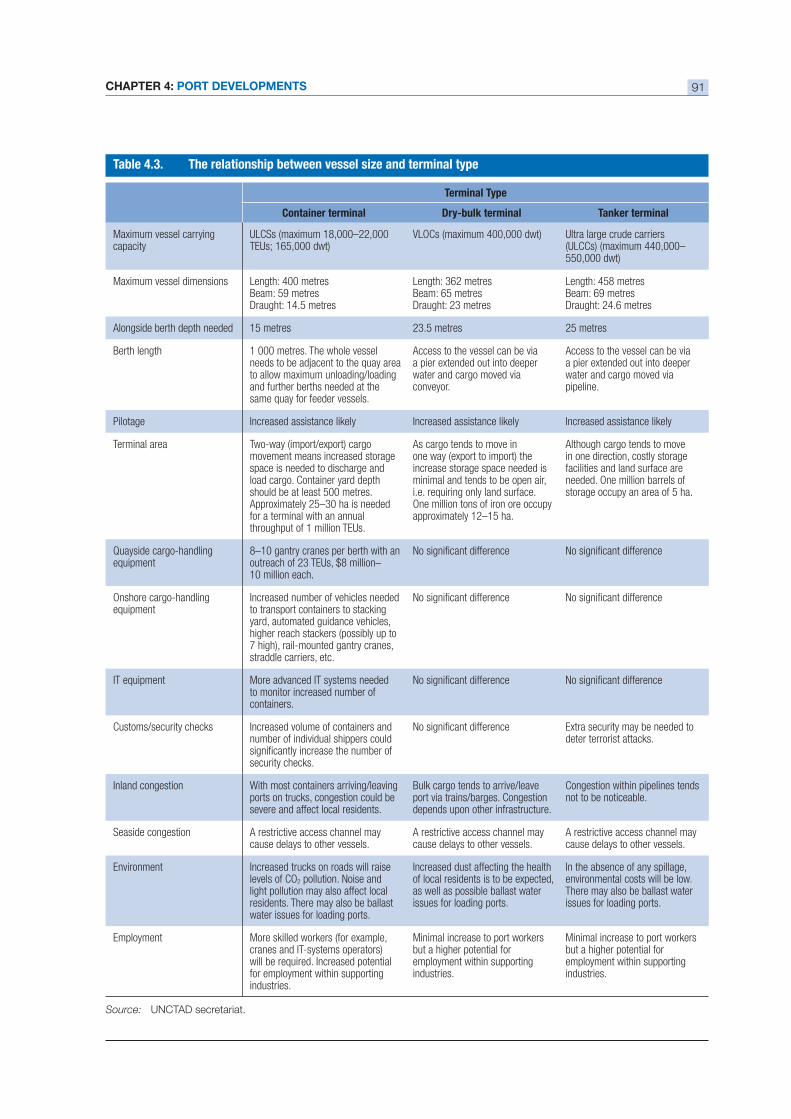
CHAPTER 4: PORT DEVELOPMENTS 91
Source: UNCTAD secretariat.
Terminal Type
Container terminal Dry-bulk terminal Tanker terminal
Maximum vessel carryingcapacity
ULCSs (maximum 18,000–22,000 Ultra large crude carriers (ULCCs) (maximum 440,000–
Maximum vessel dimensions Length: 400 metresBeam: 59 metresDraught: 14.5 metres
Length: 362 metresBeam: 65 metresDraught: 23 metres
Length: 458 metresBeam: 69 metresDraught: 24.6 metres
Alongside berth depth needed 15 metres 23.5 metres 25 metres
Berth length 1 000 metres. The whole vessel needs to be adjacent to the quay area to allow maximum unloading/loading and further berths needed at the same quay for feeder vessels.
Access to the vessel can be via a pier extended out into deeper water and cargo moved via conveyor.
Access to the vessel can be via a pier extended out into deeper water and cargo moved via pipeline.
Pilotage Increased assistance likely Increased assistance likely Increased assistance likely
Terminal areamovement means increased storage space is needed to discharge and load cargo. Container yard depth should be at least 500 metres. Approximately 25–30 ha is needed for a terminal with an annual
As cargo tends to move in one way (export to import) the increase storage space needed is minimal and tends to be open air, i.e. requiring only land surface.
approximately 12–15 ha.
Although cargo tends to move in one direction, costly storage facilities and land surface are
storage occupy an area of 5 ha.
equipment8–10 gantry cranes per berth with an
equipmentIncreased number of vehicles needed to transport containers to stacking yard, automated guidance vehicles, higher reach stackers (possibly up to
straddle carriers, etc.
IT equipment More advanced IT systems needed to monitor increased number of containers.
Customs/security checks Increased volume of containers and number of individual shippers could
security checks.
Extra security may be needed to deter terrorist attacks.
Inland congestion With most containers arriving/leaving ports on trucks, congestion could be severe and affect local residents.
Bulk cargo tends to arrive/leave port via trains/barges. Congestion depends upon other infrastructure.
Congestion within pipelines tends not to be noticeable.
Seaside congestion A restrictive access channel may cause delays to other vessels.
A restrictive access channel may cause delays to other vessels.
A restrictive access channel may cause delays to other vessels.
Environment Increased trucks on roads will raise levels of CO2 pollution. Noise and light pollution may also affect local residents. There may also be ballast water issues for loading ports.
Increased dust affecting the health of local residents is to be expected, as well as possible ballast water issues for loading ports.
In the absence of any spillage, environmental costs will be low. There may also be ballast water issues for loading ports.
Employment More skilled workers (for example,
will be required. Increased potential for employment within supporting industries.
Minimal increase to port workers but a higher potential for employment within supporting industries.
Minimal increase to port workers but a higher potential for employment within supporting industries.
REVIEW OF MARITIME TRANSPORT 201292
to transfer iron ore from Vale’s VLOCs to smaller ships
for transport to Asian markets, including China.43 The
locations where these VLOCs will be based include
the Philippines, the Republic of Korea and possibly
Malaysia.44
large unloaders, bucket-wheel stackers and reclaimers
for its break bulk trans-shipment centre at Teluk Rubiah.45
trans-shipment centres, large iron ore shipments can
be transported from Latin America to Asia at optimum
economies of scale and cost savings passed on, allowing
Vale to obtain the sought-after market share.
Trans-shipment in dry bulk differs from container trans-
shipment, the former being performed at sea and the
latter on land. This is possible because, unlike containers,
dry bulk cargo is homogenous and can be split and
cargos sometimes with multiple owners. Furthermore,
the trend of larger vessel sizes in the dry bulk sector
does not affect ports in the same way as the increased
sizes of container ships, as indicated by the comparison
alongside berths, but with dry bulk and tanker vessels,
extending the reach of conveyor belts or pipelines and
power is not technically as challenging.
Tanker terminals
appearing in the 1970s. The tanker sector represents
around one third of international seaborne trade by
generally concerned with the transportation of crude
oil and petroleum products which are mainly used to
manufacture other goods. The growth potential of this
sector is enormous due to the increases in demand
for carbon energy as a result of the growing middle
classes in developing countries.
Ports have dealt with the challenges of receiving
VLCCs by extending piers with pipelines further out
to sea. The port infrastructure needed to service these
vessels relates primarily to storage tanks within the
port area. However, most oil importing countries would
closer to the consumer, depending on the geographic
characteristics of the country, rather than to rely upon
countries. Thus, the role of ports in tanker storage
per se.
storage centres to act as trans-shipment hubs could
be a competitor to ports which traditionally make their
revenue from cargo handling. Floating storage centres
already exist in the tanker sector, but their use is
largest vessel ever built was the tanker M/V Seawise
Giant that, along with many other ULCCs, ended her
Gulf.46 Some vessels may be used by oil traders as
temporary storage but these vessels do not trans-ship
there is an upward movement in the price of oil.
Conclusions
simply moved to elsewhere in the logistics chain. The
a problem area, together with the landside entrance/
exit point where trains or trucks enter or leave the port.
Unloading vessels tends to be more time consuming
than loading (in container shipping) as boxes often
originate from one country specializing in manufacture
(for example, China) but are unloaded at many places
to those underneath. While computer software can
make the process easier, space is still needed to perform
the movement and thus the areas where work can be
performed are reduced. One of the key challenges
facing ports working with container shipping is the
as highlighted in the LSCI. With larger ships calling at
into a port must match the rate at which it leaves for the
port not to occupy large tracks of land or for congestion
not to occur. As with most businesses, port operators
with time constraints and perhaps unfamiliarity of heavy
into a slip in safety standards. With larger vessels and
the ability of the port to earn enough revenue to make
CHAPTER 4: PORT DEVELOPMENTS 93
ENDNOTES
1 http://www.ft.com/cms/s/0/a1f5ddda-a26b-11e1-a605-00144feabdc0.html#axzz1zC3LoF6K, accessed 29 June 2012.
2 http://www.china.org.cn/business/2012-03/31/content_25029628.htm, accessed 29 June 2012.
3 Data provided by Lloyds List Intelligence, May 2012.
4 Calculations undertaken by UNCTAD on the basis of data provided by Lloyds List Intelligence, May 2012. The data cover a total of 159 coastal countries.
5 http://www.worldfolio.co.uk/region/africa/cameroon/paul-biya, accessed 7 May 2012.
6 WorldCargo News (2011). Xiamen investing for the future. November, p. 33.
7 http://www.metalbulletin.com/Article/3038980/Chinas-transport-ministry-approves-Ningbo-Zhoushan-Port-upgrade.html, accessed 1 June 2012.
8 WorldCargo News (2012). Green light for Moin terminal. March, p. 6.
9 WorldCargo News (2012). APMT cuts Poti staff. February, p. 8.
10 http://www.lloydslist.com/ll/sector/ports-and-logistics/article390593.ece, accessed 9 May 2012.
11 http://www.maritimeprofessional.com/Blogs/PFI-sees-India-taking-big-strides-in-port-deve-(4)/March-2012/PFI-sees-India-taking-big-strides-in-port-developm.aspx, accessed 29 June 2012.
12 WorldCargo News (2012). Perlindo to build new Jakarta terminal. February, p. 4.
13 , accessed 29 June 2012.
14 , accessed 1 June 2012.
15 http://larouchepac.com/node/21600, accessed 1 June 2012; and http://theworldnet.info/en/2012/04/north-korea-, accessed 1 June 2012.
16 http://www.pmawca-agpaoc.org/news.php/13/liberian-npa-in-talks-with-van-oord.html, accessed 29 May 2012.
17 Containerisation International (2012). Tanger Med well down year-on-year. 11 May.
18 , accessed 7 May 2012.
19 http://www.pmawca-agpaoc.org/news.php/14/nigeria-ports-authority-to-develop-lagos-bull-nose-area.html,accessed 29 May 2012.
20 http://www.pmaesa.org/information/news/news.htm?nid=55, accessed 29 May 2012.
21 http://www.pmaesa.org/information/news/news.htm?nid=54, accessed 29 May 2012.
22 WorldCargo News (2012). Chinese aid for new port in Crimea. February, p. 4.
23 http://www.ci-online.co.uk/default.asp?URL=news/showNews.asp?News_ID=32908, accessed 29 May 2012.
24 Containerisation International (2012). Manchester Ship Canal service improved. 22 June.
25 WorldCargo News (2012). Long Beach builds for the future. February, p. 31.
26 http://www.fairplay.co.uk/secure/display.aspx?path_info=/secure/display.aspx&articlename=dn0020120510000005, accessed 10 May 2012.
27 A gateway port relates to the import and export of cargo (usually national) into or from the hinterland, whereas transit ports refer to the same cargo destined or originating from or to other nearby countries. Trans-shipment cargo, however, stays within the port and thus does not need hinterland connections.
28 For example, see: Intriligator, MD (2003). Net Assessment. Milken Institute. January No. 33; Lee, J-W and Ju HP (2008). Does Trade Integration Contribute to Peace? ADB Working Paper Series on Regional Economic Integration No. 24. Asian Development Bank. December.
29 Seatrade (2011). The ‘Valemax’ Saga, No. 4, September, p. 5.
30 The M/V Regina Maersk was renamed the M/V Maersk Kure in 2007, when she was sold and charted back by Maersk Line. The ship still operates along the East–West trade route linking China and Europe.
31
2012.
32 http://www.worldcargonews.com/htm/n20120414.255863.htm, accessed 29 May 2012.
33 http://www.worldcargonews.com/secure/assets/nf20060905.596033_44fd399113039.pdf, accessed 30 May 2012.
34 http://www.porttechnology.org/blogs/wilhelmshaven_orders, accessed 30 May 2012; http://www.portstrategy.com/
35
2012.
REVIEW OF MARITIME TRANSPORT 201294
36 Drewry (2011). Global Container Terminal Operators.
37
38 Ceres Paragon indented berth terminal in Amsterdam allows the unloading of a container ship from both sides of the vessel, unlike traditional berths that utilize one side only.
39 The world’s largest insurer of ports is the TT Club, with a membership of around 400 ports and terminals.
40 http://www.portstrategy.com/features101/legal-and-insurance/drama-or-day-to-day, accessed 30 May 2012.
41
42 The world’s largest dry bulk carrier, M/V Berge Stahl, at 364,767 dwt, had previously called at Chinese ports, indicating that the physical size of the ship was not necessarily the main issue in the Chinese Government’s decision.
43 http://www.chamber-of-shipping.com/index.php?option=com_content&task=blogsection&id=1&Itemid=59&limitstart=9, accessed 7 May 2012.
44 http://www.lloydslist.com/ll/sector/ports-and-logistics/article399410.ece, accessed 30 May 2012.
45 http://www.lloydslist.com/ll/sector/ports-and-logistics/article400912.ece, accessed 19 June 2012.
46 The world’s largest ULCC, the M/V Seawise Giant, built in 1979, which underwent several name changes and an enlargement process to reach 564,763 dwt, 4,240,865 barrels or 674,243,676 litres, was scrapped in 2010. The present
Its dimensions are: length 380 metres, breadth 68 metres, draught 24.5 metres.
This chapter provides information on legal issues and recent regulatory developments
conventions. Important issues include the recent adoption of amendments to the 1996
of regulatory developments relating to maritime and supply-chain security, maritime safety and environmental issues.
Among the regulatory measures worth noting is a set of technical and operational
from international shipping that was adopted under the auspices of the International
January 2013. To assist in the implementation of these new mandatory measures, four sets of guidelines were also adopted at IMO in March 2012. Discussions on possible
continued and remained controversial. In respect of liability and compensation for ship-
legal framework as well as some guidance for national policymaking.
it has been suggested that an agreement in TF might be reached earlier than in other areas of the Doha Development Round of negotiations.
LEGAL ISSUES AND REGULATORY
DEVELOPMENTS
REVIEW OF MARITIME TRANSPORT 201296
A. IMPORTANT DEVELOPMENTS IN
TRANSPORT LAW
Adoption of amendments to the 1996 Convention on Limitation of Liability for Maritime Claims
National legislation or international legal instruments may
give shipowners and others linked with the operation of
a ship the right to limit their liability in respect of certain
claims, whatever the basis of liability may be. Under
these so-called global limitation regimes, limits of liability
are calculated using either the ship’s value or a value
calculated on the basis of the size of the ship and in
particular on the basis of the ship’s tonnage.1 The most
important global limitation regimes are the Convention
on Limitation of Liability for Maritime Claims, 1976 (1976
LLMC),2 and the 1976 LLMC as amended by its 1996
Protocol3 (hereafter 1996 LLMC).
limits of liability for two types of claims against shipowners
(and certain other persons),4 namely, claims for loss of life
5 In each case, the shipowner is entitled
to limitation of liability except in certain cases of wilful
misconduct.6 While the approach to limitation is the same
under both regimes, there are important differences. In
particular, the actual amounts to which the limitation is
limited are higher under the 1996 LLMC.
An important development, of interest to parties engaged
in international trade, was the adoption at IMO, in April
2012, of amendments increasing the compensation
limits set by the 1996 LLMC.7 In light of experience
arising from incidents involving bunker fuel spills. The new
cent over previous limits, are expected to enter into force
2015, 36 months from the date of adoption, under the
tacit acceptance procedure.8 In outline, the amendments
may be summarized as follows: with respect to claims for
on ships with a tonnage not
9
For larger ships, the following additional amounts apply
when calculating the limit of liability:
(up from 800 SDR);
(up from 600 SDR);
(up from 400 SDR).10
The limit of liability for property claims for ships not
11 For larger ships, the following additional
amounts apply when calculating the limit of liability:
For each ton from 2,001 to 30,000 tons, 604 SDR
(up from 400 SDR);
(up from 300 SDR);
For each ton in excess of 70,000 tons, 302 SDR
(up from 200 SDR).12
With the adoption of increased limits of liability, the
protection of maritime claimants has been strengthened.
However, it should be noted that the amendments affect
limitation of liability only under the 1996 LLMC.13 While
many States have adopted the 1996 LLMC, some
continue to adhere to the unamended 1976 LLMC, or the
earlier International Convention Relating to the Limitation
of the Liability of Owners of Seagoing Ships, 1957.14 Few
of Liability of Owners of Seagoing Vessels, 1924. While
each of the relevant Conventions deals with the issue
of limitation of liability for maritime claims, there are
substantive differences. Limitation of liability amounts vary
favourable to claimants, under the 1996 LLMC.15 In view
of the most recent amendments, policy makers in States
that are not yet Contracting States to the 1996 LLMC
may wish to consider afresh the merits of accession.
B. REGULATORY DEVELOPMENTS
RELATING TO THE REDUCTION OF
GREENHOUSE GAS EMISSIONS FROM
INTERNATIONAL SHIPPING AND
OTHER ENVIRONMENTAL ISSUES
1. Reduction of greenhouse gasemissions from internationalshipping
For several years, efforts aimed at establishing a
regulatory regime to control and reduce emissions of
CHAPTER 5: LEGAL ISSUES AND REGULATORY DEVELOPMENTS 97
GHGs from ships have been dominating substantive
discussions at the Marine Environment Protection
Committee (MEPC) of IMO.16 Relevant discussions
focus on technical and operational measures, which,
according to an IMO study published in 2009,17 have
from international shipping,18 but also on the more
controversial issue of potential market-based
measures (MBMs).19
An overview of relevant recent developments at IMO
is provided in the following sections. Attention should
also be drawn to an UNCTAD-edited volume Maritime
Transport and the Climate Change Challenge,
published in May 2012, which provides detailed
insight into a range of the potential implications of
climate change for this key sector of global trade.20
(a) Adoption of new regulations on energy
their implementation
A key development under the auspices of IMO
regulatory measures for GHG emissions control. A set
of technical and operational measures21 to increase
from international shipping were adopted during the
sixty-second session of the MEPC, which was held
from 11 to 15 July 2011. The package of measures
– adopted by roll-call vote rather than by consensus –
was added by way of amendment to the International
Convention for the Prevention of Pollution from Ships,
Annex VI22 Regulations on the Prevention of Air
Pollution from Ships, as a new chapter (chapter 4)
The amendments are expected to enter into force on
1 January 2013.23
Four sets of guidelines24 intended to support
the uniform implementation of these mandatory
sixty-third session of MEPC, which was held from 27
February to 2 March 2012. At the same session, the
discussion continued on proposed MBMs that would
complement the technical and operational measures
already adopted.
Index (EEDI) mandatory for new ships and the
mandatory for all ships.25 The EEDI establishes
2
emissions per capacity mile) for new ships, depending
2009. The EEDI is a performance-based mechanism,
attained, the industry is free to use the most cost-
the relevant Regulations. The current EEDI will cover
gas tankers, bulk carriers, general cargo, refrigerated
cargo and container ships, as well as combination 26
Under the Regulations, it will also become mandatory
for ships to carry a SEEMP after 1 January 2013.
The SEEMP is intended to be a practical tool to help
shipowners manage their environmental performance
over time. It establishes a mechanism for operators to
monitoring tool.27
issued by the respective Governments.28
As of 1 January 2013, the new Regulations shall
apply to all ships of 400 tons and above. However,
to the Regulations, this waiver may not be applied to
ships above 400 tons:
“1. for which the building contract is placed on
or after 1 January 2017; 2. in the absence of a
building contract, the keel of which is laid or which
is at a similar stage of construction on or after 1
July 2017; 3. the delivery of which is on or after
of a new or existing ship, … on or after 1 January
2017.”29
calculated for:
“1. each new ship; 2. each new ship which has
conversion that is so extensive that the ship
REVIEW OF MARITIME TRANSPORT 201298
is regarded by the Administration as a newly
constructed ship ….”
In addition:
and shall indicate the estimated performance
that contains the information necessary for the
calculation of the attained EEDI and that shows
the process of calculation.”30
The calculation shall be done taking into account
guidelines developed by IMO.
Guidelines for implementation of energy
Four sets of guidelines intended to assist in the
implementation of the mandatory Regulations on
adopted by MEPC during its sixty-third session from
27 February to 2 March 2012.31 They are:
2012 Guidelines on the Method of Calculation of
for New Ships;
2012 Guidelines for the Development of a Ship
;
;
Guidelines for Calculation of Reference Lines
(EEDI).32
Administrations were invited to take these Guidelines
into account when developing and enacting national
laws which give force to and implement provisions
set forth in the respective Regulations of MARPOL
Annex VI, as amended, as well as to bring SEEMP to
the attention of masters, seafarers, shipowners, ship
operators and any other interested groups.
The 2012 Guidelines address some of the concerns
that had been raised regarding the safety of the EEDI,
both in debates among States at IMO discussions33
and within the shipping industry.34 The key concern
in this respect had been that while the EEDI formula
value can easily be met by using vessels with smaller,
lower-power engines, these are potentially dangerous
since they do not have enough reserve power available
for emergency conditions, such as extreme weather
or special manoeuvring in ports when necessary.
The 2012 Guidelines on the method of calculation of
the attained EEDI for new ships contain a provision
which allows vessels to be built with whatever engine
power the owner thinks necessary, as long as it is
limited to provide a suitable shaft power to give the
be deactivated or overridden so that more power can
be used.35
An updated work plan36 was also agreed upon, for the
frameworks for those ships not covered by the current
EEDI regulations. According to the work plan, these
Draft MEPC resolution on promotion of technical cooperation and transfer of technology relating
Another new Regulation in chapter 4 of MARPOL
Annex VI is that concerning “Promotion of technical
cooperation and transfer of technology relating to the
Regulation, administrations, in cooperation with IMO
and provide as appropriate – directly or through IMO
– support to States, especially developing States, that
and policies, “to promote the development and
transfer of technology and exchange of information to
developing States, in respect of the implementation
MARPOL Annex VI ].”37
Linked to the implementation of this Regulation,
resolution on the “Promotion of technical co-operation
and transfer of technology relating to the improvement 38 was discussed during
the sixty-third session of MEPC. A group of member
States submitted an informal paper during the session,
providing comments and proposing additional
amendments to the draft resolution, on:
“a methodology for assessing implementation,
capacity-building support for developing countries
by developed countries, taking into account
the principles of common but differentiated
responsibilities and respective capabilities
CHAPTER 5: LEGAL ISSUES AND REGULATORY DEVELOPMENTS 99
under the UNFCCC [United Nations Framework
Convention on Climate Change] and its Kyoto
Protocol.”39
resolution, but could not reach consensus on some
of the proposals. Work on the draft resolution will
continue during the sixty-fourth session of the MEPC,
to be held from 1 to 5 October 2012.
Three other categories of issues relating to GHGs were
considered during the sixty-third session of MEPC,
namely the application of EEDI to existing ships,
uncertainty in emission data, and a performance
standard for fuel consumption measurement.
Following concerns expressed by industry and
supported by a large number of parties, the
as a regulatory tool for new ships only; as a design
would be inappropriate.40 The MEPC took note of
concerns that the reduction effects of the EEDI and
SEEMP may have been overestimated, and noted that
of emissions from international shipping.41 The
Committee agreed that further work should take place
“to provide the Committee with reliable and up-to-date
the secretariat to investigate possibilities and report
to future sessions.”42 The Committee also agreed that
development of an IMO performance standard for fuel
consumption measurement for ships could be a useful
tool and should be considered further.
(b) Market-based measures, and related matters
While a set of technical and operational measures
been adopted, discussions on possible MBMs for
the reduction of GHG emissions from international
shipping continue, and remain highly controversial.43
As reported in the Review of Maritime Transport
2011, an extensive debate on how to progress in the
development of an MBM had been held during the 44 The MBM proposals
under review ranged from those envisaging a
contribution or levy on all CO2 emissions from all ships,
or only for those generated by ships not meeting the
design (EEDI) and operation (EEOI).45
the third Intersessional Meeting of the Working Group
on GHG Emissions from Ships (GHG-WG3), which was
dedicated to further work on MBMs, was held from
28 March to 1 April 2011.46 Due to time constraints,
MEPC had been unable to address the issue of
MBMs during its sixty-second session, held from 11
to 15 July 2011, and agreed to defer consideration of
relevant submissions to its sixty-third session.
During its sixty-third session, MEPC continued
its discussion of proposed MBMs, which would
complement the technical and operational measures
already adopted. It was agreed that the focus should
be on a more comprehensive impact assessment
MBM from international shipping under IMO. The
discussions on MBMs covered a number of different
The sixty-third session of MEPC adopted the report of
GHG-WG3, Reduction of GHG Emissions from Ships,47
and, in this respect, noted that the third Intersessional
Meeting had completed, as far as possible, the terms of
reference given to it by the Committee and had placed
the MBM proposals into two groups: (1) focus on in-
sector and, (2) in-sector and out-of-sector, based on
the emission reduction mechanism used by the MBM
proposals.48 Inter alia, MEPC further noted:
That there were two opinions as to whether a
compelling “need and purpose of an MBM” for
international shipping under IMO had been clearly
demonstrated, and agreed to return to the issue in
due course;
The debate on the “relation to relevant conventions
and rules”, and agreed to consider the issue further,
partly based on a submission by one delegation;
The debate on “strengths and weaknesses” and
listed strengths and weaknesses49 and that other
delegations which were not proponents of MBMs
MBM proposals;50
That the Intersessional Meeting acknowledged the
Group on Feasibility Study and Impact Assessment
of Possible Market-based Measures (MBM-EG),51
a need for further study of both the “direct and
indirect impacts on developing countries” due to
the introduction and non-introduction of an MBM
for international shipping under IMO;
REVIEW OF MARITIME TRANSPORT 2012100
That two documents submitted by delegations,52
or relevant parts thereof, should be considered
further at its current session.
The debate continued on the issue of further impact
assessment of proposed MBMs for international
maritime transport. Two documents prepared by the
Chairperson were considered as part of this debate. 53 set out proposals on how an
impact assessment may be undertaken to determine
the possible effects of introduction of an MBM for
international shipping, including the method and
criteria for the assessment. The second document54
contained proposed draft terms of reference for
a steering committee for the impact assessment
of MBM proposals, to be established in order to
supervise the impact assessment and to assist and
provide advice to the IMO secretariat. The MEPC
also noted that the feasibility study called for by the
work plan for further consideration of MBMs had been
successfully completed by the MBM-EG, which had
concluded that all MBM proposals under review could
be implemented, notwithstanding the challenges
associated with the introduction of new measures.55
To illustrate the controversial nature of issues related
to the introduction of MBMs, especially from the
perspective of some developing countries, two
submissions by national delegations are particularly
pertinent, as detailed below.
of an MBM impact study on the country’s shipping
sector and trade.56 According to the study, the
adoption of an MBM would lead to adverse impacts
on Indian consumers. Moreover, it could have “a
deleterious impact on the environment as consumers
Indian coal.”57 Based on the results of the study,
India reiterated its concerns about the economic
implications of MBMs on consumers in developing
countries, whose contribution to GHG emissions per
capita, were minimal.
Another document submitted by China58 highlighted
the need to carry out further impact assessment on
developing countries, and proposed a list of revised
criteria to be taken into account for the assessment.
Nine criteria were proposed, namely:
(i) The “environmental effectiveness” of the
proposed MBMs, particularly in limiting GHG
emissions from international shipping;
(ii) The “cost-effectiveness” of the proposed
MBMs and the direct and indirect socio-
economic impacts on trade, consumers and
industries in developing countries, particularly
in least developed countries (LDCs) and small
island developing states (SIDSs);
(iii) The “potential of the proposed MBMs to
provide incentives to technological reform and
innovation”;
(iv) The “economic, technical and operational
feasibility” of implementing the proposed
MBMs;
technical burden” for the shipbuilding industry
and the maritime sector in developing countries
of implementing and enforcing the proposed
technology transfer and capacity-building”;
(vi) The “consistency of the proposed MBMs with
other relevant conventions”, such as UNFCCC,
Kyoto Protocol and World Trade Organization
(WTO) rules, “especially the principle of
[common but differentiated responsibilities and
respective capabilities] CBDR, as well as its
compatibility with customary international law,
as depicted in the [United Nations Convention
on the Law of the Sea] UNCLOS”;
(vii) When there is a potential to raise funds, the
countries”;
(viii) The “potential additional administrative
burden”, and the legal aspects for national
administrations relating to the implemention
and enforcement of the proposed MBMs;
(ix) The “compatibility of the proposed MBMs
with the existing enforcement and control
provisions” under the IMO legal framework.
It was agreed by consensus that there was a need
for a continued impact assessment and that its focus
should be on possible impacts on consumers and
industries in developing countries. Despite the efforts
made to develop the draft terms of reference for further
impact assessment of proposed MBMs, including
the methodology and criteria for the assessment,
a number of issues were still pending. One issue
concerned whether the methodology for the impact
assessment should be carried out by an expert group
or by commissioned research institutes. Another issue
CHAPTER 5: LEGAL ISSUES AND REGULATORY DEVELOPMENTS 101
concerned the scope of impact assessment. It was
agreed to consider the terms of reference further at
the next session of MEPC.
As part of the discussions on consideration and
possible consolidation of MBM proposals, various
submissions by delegations were considered.59 It was
to the impact assessment were those set out in the
report of the GHG-WG3.60 Regarding consolidation of
proposals, it was noted, inter alia, that:
“A number of delegations felt it desirable to carry
out the analysis with a reduced number of MBM
proposals, but also recognized that, in so doing,
vital information could be lost which could be used
advanced in its development; the resultant MBM
could be a combination of elements of different
MBMs or some compromise solution rather than
any of the proposals in their initial form”;61
“Some delegations opposed further consideration
of MBM, stating that IMO should focus on technical
and operational measures”;62
A large number of delegations were not ready to
select a possible MBM proposal at this time; the
presence or absence of draft legal text associated
with proposals “[was] not directly linked to the
maturity of the proposals and should not be used
as the benchmark for selection.”63
No proposal was eliminated at the session. All
in time for the sixty-fourth session of the Committee,
where they were expected to be considered further in
order to determine whether they could be analysed
against all criteria.
revenues was also considered, including its relation
to the wider efforts of the international community
countries.64 Once again, as is illustrated by the summary
of the discussions in the report of the meeting, the issue
is one where consensus has not yet been achieved.
The Committee noted, inter alia, that:
“Divergent views were expressed on the use of
revenues and the relation between an IMO MBM
advocating disbursement of revenues as a way to
accommodate (reconcile) both CBDR and the IMO
principles,65 while others opposed this, if applied
universally to all ships, and advocated an approach
that would ensure no net incidence on developing
countries”;66
“A large number of delegations expressed the
view that the greater part of any MBM revenues
countries”;67
“A number of delegations expressed the view that
an MBM for international shipping under IMO should
the context of the Green Climate Fund where funding
should be provided by developed countries”; 68
“A number of delegations stated that the Rebate
Mechanism (RM)69 – which aims to reconcile
different principles of shipping and climate change
conventions – “[was] an innovative and constructive
proposal that addresses the CBDR principle and
should be analysed and considered further.”70
The Committee also noted:
(i) The ongoing work under UNFCCC on climate
(ii) The Report of the Secretary-General’s High-level
Advisory Group on Climate Change Financing
(AGF);71
(iii) The G20 report by the World Bank and the
International Monetary Fund on mobilizing
funding sources for the Green Climate Fund,72
It is also pertinent that the international shipping
industry – which, in respect of potential MBMs, has
indicated a preference for a fuel levy rather than an
emissions trading scheme – has expressed the view
that potential revenues should, inter alia, be used for
the purposes of adapting ports in developing countries
to the impacts of climate change.73
Regarding the relation of an MBM to WTO rules, it was
recalled that a large number of delegations at GHG-
WG3 had concluded that no incompatibility existed
between a potential MBM for international shipping
under IMO and the WTO rules. However, the view
was also expressed that a WTO presentation on this
matter at GHG-WG374 had to be viewed with caution,
as it expressed the position of the WTO secretariat,
and some delegations continued to remain concerned
about inconsistency issues between an MBM and the
WTO rules.75 The MEPC agreed to continue the debate
at its sixty-fourth session, and further submissions
and contributions were invited.
REVIEW OF MARITIME TRANSPORT 2012102
(c) Matters concerning the United NationsFramework Convention on Climate Change
With respect to matters concerning UNFCCC, it
was noted that the United Nations Climate Change
Conference held in Durban from 28 November to 11
December 2011 resulted in the adoption of a number of
decisions and conclusions,76 including those relevant
to the control of GHG emissions from international
transport,77 to IMO as the custodian of the London
Convention and the London Protocol,78 and to the
next annual Climate Change Conference, planned
to take place from 26 November to 7 December
2012 in Doha, Qatar.79
IMO secretariat “to continue its well-established
cooperation with the UNFCCC secretariat, to attend
relevant UNFCCC meetings, including the meetings
sources for the Green Climate Fund, and to bring the
outcome of IMO’s work to the attention of appropriate
UNFCCC bodies and meetings.”80
2. Ship-source pollution andprotection of the environment
(a) Developments at the United Nations Conference on Trade and Development
Based on its mandate in the Accra Accord81 and in the
outcome documents adopted at the conclusion of the
thirteenth session of the United Nations Conference
on Trade and Development (UNCTAD XIII), held from
21 to 26 April 2012 in Doha, Qatar, UNCTAD, as
published an analytical report with a focus on ship-
source oil pollution. The report, entitled Liability and
Compensation for Ship-Source Oil Pollution: An
Overview of the International Legal Framework for Oil
Pollution Damage from Tankers,82 has been prepared
to assist policy makers, particularly in developing
countries, in their understanding of the complex
international legal framework and in assessing the
merits of accession to the relevant international legal
instruments.
By way of background, it should be noted that
approximately half the global crude oil production is
carried by sea. Much of this navigation is taking place
in relative proximity to the coasts of many countries,
in some cases transiting through constrained areas or
chokepoints, such as narrow straits or canals. At the
same time, the steady increase in the size and carrying
capacity of ships transporting cargo of any type means
carried across the oceans and along coastal zones.
While the number and extent of large oil pollution
incidents has decreased over time, exposure to ship-
economic threat for coastal States, in particular for
developing countries and SIDS with economies heavily
The international legal framework concerning oil
pollution from tankers is very robust and provides
incidents. Relevant legal instruments, collectively
known as the Civil Liability Convention–International
Oil Pollution Compensation Fund (CLC–IOPC Fund)
regime,83
widely adopted at the international level. However,
a considerable number of coastal States, including
developing countries that are potentially exposed
to ship-source oil pollution incidents, are not yet
Contracting Parties to the latest legal instruments
affecting their coasts or other areas under their marine
zones). It is against this background that the report has
been prepared, to assist policy makers, particularly in
developing countries, in their understanding of the
relevant legal instruments and in assessing the merits
of accession.
The report highlights central features of the international
legal framework and provides an analytical overview of
key provisions of the most recent of the international
legal instruments in force. It also offers considerations
for national policymaking, focusing, inter alia, on:
the relevant international legal instruments;
adherence;
Levels of protection available to victims of tanker
oil pollution depending on which of the different
legal instruments have been adopted.
In conclusion, the report suggests that accession to
relevant legal instruments could offer considerable
may be vulnerable to oil pollution from tankers.
While the report focuses on the international liability and
compensation framework for oil pollution from tankers,
it also highlights some of the key features of two
CHAPTER 5: LEGAL ISSUES AND REGULATORY DEVELOPMENTS 103
important related international Conventions that cover
other types of ship-source oil pollution. These are:
The 2001 Bunker Oil Pollution Convention,84
providing for liability and compensation in the
event of bunker oil spills from ships other than oil
tankers (for example, container vessels, reefers,
chemical tankers, general cargo ships, cruise
ships and ferries);
The 1996 Hazardous and Noxious Substances (HNS)
Convention85 and its 2010 amending Protocol86 (2010
HNS Convention), which provides for compensation
relating to incidents arising in connection with the
carriage of a broad range of hazardous and noxious
substances, including non-persistent oil.
(b) Developments at the InternationalMaritime Organization
During its sixty-third session, MEPC also adopted
amendments to MARPOL relating to regional
arrangements for port reception facilities, and adopted
guidelines related to the implementation of the revised
MARPOL Annex V (Garbage), and the Hong Kong
International Convention for the Safe and Environmentally
Sound Recycling of Ships, 2009 (Hong Kong
Convention).87 The Committee also granted basic and
systems that make use of active substances.
Air pollution from ships: establishment of new emission control areas (ECAs)
While CO2 is the main GHG emitted by ships, other
relevant substances include sulphur oxides (SOx) and
air pollution from ships and are covered by MARPOL
Annex VI,88 which had been amended in 2008 to
introduce more stringent emission controls.89 With
effect from 1 January 2012, Annex VI establishes
reduced SOx thresholds for marine bunker fuels, with
in 2018).90 Annex VI also contains provisions allowing
for special SOx emission control areas (ECAs) to be
established where even more stringent controls on
sulphur emissions apply. Since 1 July 2010, these ECAs
any other technological method to limit SOx emissions.
Sea areas, were established in Europe, and took effect in
2006 and 2007 respectively. The third area established
was the North American ECA, taking effect on 1 August
2012. In addition, in July 2011, a fourth ECA, the United
States Caribbean Sea ECA, was established, covering
(United States) and the United States Virgin Islands,
and will take effect on 1 January 2014.91
Progressive reductions in NOx emissions from ship
engines have also been agreed. For ships that operate
in ECAs, the strictest controls are applicable to ships
constructed on or after 1 January 2016.
It should be noted that the shipping industry, while
supportive of the 2008 amendments, has expressed
concerns about some aspects of the implementation
availability of compliant low sulphur fuel to meet the
new demand.92
garbage management
marine life as oil or chemicals. At its sixty-second
session in July 2011, MEPC adopted amendments to
MARPOL Annex V93, and these are expected to enter
into force on 1 January 2013. The revised Annex V
prohibits the discharge of all garbage into the sea,
except as provided otherwise. An overview of the
revised MARPOL Annex V discharge provisions is
At its sixty-third session, MEPC also adopted:
Amendments to MARPOL Annexes I, II, IV, V and
VI,94 which are aimed at enabling SIDS to comply
reception facilities for ship waste through regional
arrangements. These amendments are expected
to enter into force on 1 August 2013;95
A resolution96 calling for the development, without
to meet the discharge standards for passenger
ships operating in the Baltic Sea (designated a
Special Area under MARPOL Annex IV Regulations
for the Prevention of Pollution by Sewage from
Ships);97
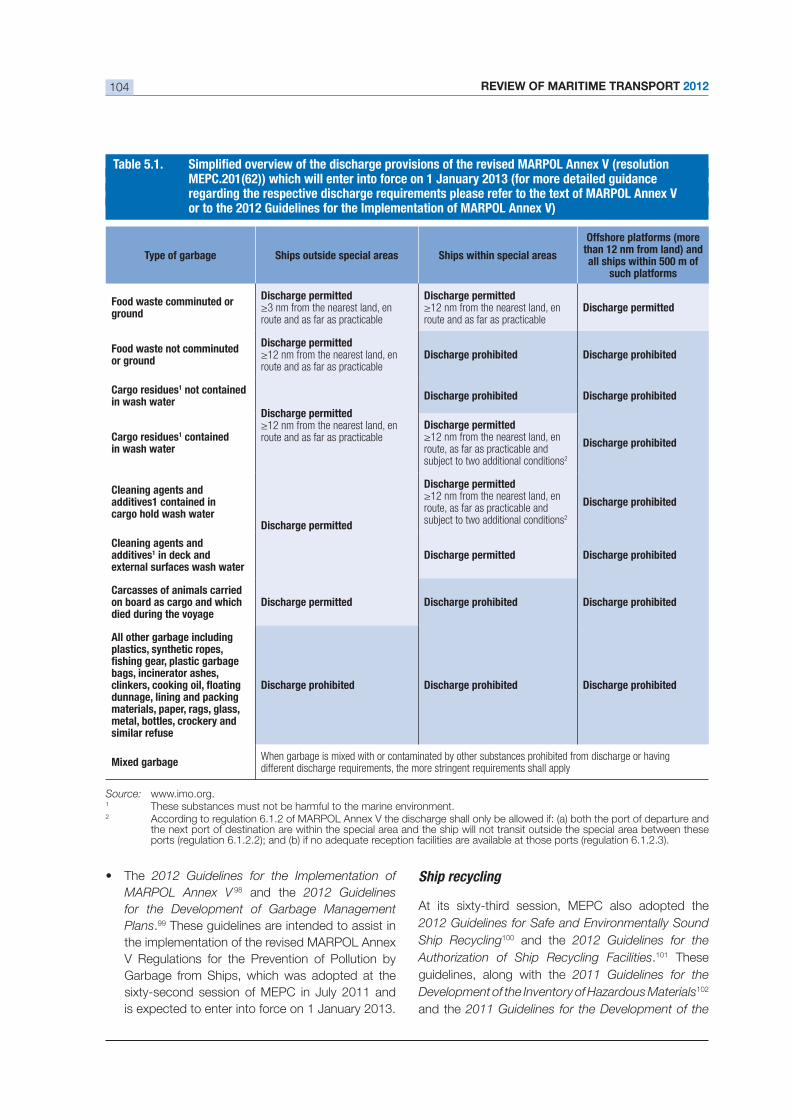
REVIEW OF MARITIME TRANSPORT 2012104
The 2012 Guidelines for the Implementation of 98 and the 2012 Guidelines
for the Development of Garbage Management
Plans.99 These guidelines are intended to assist in
the implementation of the revised MARPOL Annex
V Regulations for the Prevention of Pollution by
Garbage from Ships, which was adopted at the
sixty-second session of MEPC in July 2011 and
is expected to enter into force on 1 January 2013.
Ship recycling
At its sixty-third session, MEPC also adopted the
2012 Guidelines for Safe and Environmentally Sound
Ship Recycling100 and the 2012 Guidelines for the
Authorization of Ship Recycling Facilities.101 These
guidelines, along with the 2011 Guidelines for the
Development of the Inventory of Hazardous Materials102
and the 2011 Guidelines for the Development of the
Source: www.imo.org.1 These substances must not be harmful to the marine environment.2 According to regulation 6.1.2 of MARPOL Annex V the discharge shall only be allowed if: (a) both the port of departure and
the next port of destination are within the special area and the ship will not transit outside the special area between these
Type of garbage Ships outside special areas Ships within special areas
Offshore platforms (more than 12 nm from land) and all ships within 500 m of
such platforms
Food waste comminuted or ground
Discharge permitted
route and as far as practicable
Discharge permitted
route and as far as practicable Discharge permitted
Food waste not comminuted or ground
Discharge permitted
route and as far as practicableDischarge prohibited Discharge prohibited
Cargo residues1 not contained in wash water
Discharge permitted
route and as far as practicable
Discharge prohibited Discharge prohibited
Cargo residues1 containedin wash water
Discharge permitted
route, as far as practicable and subject to two additional conditions2
Discharge prohibited
Cleaning agents and additives1 contained incargo hold wash water
Discharge permitted
Discharge permitted
route, as far as practicable and subject to two additional conditions2
Discharge prohibited
Cleaning agents andadditives1 in deck andexternal surfaces wash water
Discharge permitted Discharge prohibited
Carcasses of animals carried on board as cargo and which died during the voyage
Discharge permitted Discharge prohibited Discharge prohibited
All other garbage including plastics, synthetic ropes,
bags, incinerator ashes,
dunnage, lining and packing materials, paper, rags, glass, metal, bottles, crockery and similar refuse
Discharge prohibited Discharge prohibited Discharge prohibited
When garbage is mixed with or contaminated by other substances prohibited from discharge or having different discharge requirements, the more stringent requirements shall apply
CHAPTER 5: LEGAL ISSUES AND REGULATORY DEVELOPMENTS 105
Ship Recycling Plan103 that were adopted during the
sixty-second session of the MEPC, are intended to
assist ship-recycling facilities and shipping companies
to commence introducing voluntary improvements
Convention,104 which had been adopted in May 2009.
Ballast water management
After considering the reports of the 18th, 19th and 20th
Aspects of Marine Environment Protection (GESAMP),
the Committee granted basic approval to three,105 and 106 ballast water management
systems that make use of active substances.
Even though ballast water is essential to ensure safe
operating conditions and stability for vessels at sea, it
often carries with it a multitude of marine species that
may survive to establish a reproductive population
in the host environment, becoming invasive, out-
competing native species and multiplying into pest
proportions. In February 2004, under the auspices
of IMO, the International Convention for the Control
and Management of Ships’ Ballast Water and
Sediments (BWM) was adopted to prevent, minimize
and ultimately eliminate the risks to the environment,
human health, property and resources arising from the
ballast water from one region to another.107
With regard to the availability of ballast water
management systems, MEPC at its sixty-third session
noted that there were already 21 type-approved
systems available. While some delegations108
expressed concerns regarding the implementation
of the BWM Convention due to lack of approved
technologies, limited shipyard capacity, time
availability and costs involved, other delegations109
treatment technologies and shipyard capacity, and
encouraged shipowners to start installing ballast
water management systems on their ships in order
to avoid possible bottlenecks at a later stage. It was
noted that despite some differences in views there
was consensus regarding the need for additional
information on the pace of implementation, and the
availability of technologies and shipyard facilities
and member States were invited to provide updated
information regarding the status in their respective
countries, according to an agreed template.110
The MEPC also adopted a number of amendments
to BMW-related guidelines, including the 2012
Guidelines on Design and Construction to Facilitate
Sediment Control on Ships (G12).111 These are one
of the 14 sets of guidelines developed to assist in
the implementation of the BWM Convention – G12
updates the previous version adopted in 2006. The
MEPC also urged those countries that had not already
done so to ratify the BWM Convention, at their earliest
possible opportunity, so that it could enter into force.112
Dangerous chemicals and oil spill response
In an effort to develop further measures to prevent
pollution from ships, the International Convention
on Oil Pollution Preparedness, Response and
Cooperation (OPRC) was adopted in 1990. The OPRC
dealing with pollution incidents, either nationally or in
cooperation with other countries. A Protocol to the
OPRC relating to hazardous and noxious substances
(OPRC-HNS Protocol) was adopted in 2000. To assist
States in implementing the Convention, the OPRC-
HNS Technical Group of MEPC was set up. At its
sixty-third session, MEPC approved the following
guidance manuals, which were developed by the
OPRC-HNS Technical Group:
IMO/IPIECA Guidance on Sensitivity Mapping for
Oil Spill Response;
Guideline for Oil Spill Response in Fast Currents;
Operational Guide on the Use of Sorbents;
Oil Spill Waste Management Decision Support
Tool.
annexes 62/8, 62/8/1, 62/8/2 and 62/8/3, respectively.
C. OTHER LEGAL AND REGULATORY
DEVELOPMENTS AFFECTING
TRANSPORTATION
maritime security and safety, which may be of particular
interest to parties engaged in international trade and
transport. These include developments relating to
maritime and supply chain security, as well as the
entry into force of the International Convention on
for Fishing Vessel Personnel, 1995. Issues related
to piracy will, for reasons of space, not be covered.
However, a separate document on issues related to
piracy is in preparation by the secretariat.
REVIEW OF MARITIME TRANSPORT 2012106
1. Maritime and supply-chain security
There have been a number of developments in
relation to existing maritime and supply-chain security
standards that had been adopted under the auspices
of various international organizations such as the World
Customs Organization (WCO), IMO and the International
Organization for Standardization (ISO), as well as at the
European Union (EU) level and in the United States, both
important trade partners for many developing countries.
(a) World Customs Organization–SAFE Framework of Standards
As noted in previous editions of the Review of Maritime
Transport, in 2005, WCO had adopted the Framework
of Standards to Secure and Facilitate Global Trade
(the SAFE Framework),113
developing a global supply-chain framework. The
SAFE Framework provides a set of standards and
principles that must be adopted as a minimum
threshold by national customs administrations. These
standards are contained within two pillars – pillar 1:
customs-to-customs network arrangements, and
pillar 2: customs–business partnerships.114 The SAFE
Framework has fast gained widespread international
acceptance and as of 1 March 2011, 164 out of
177 WCO members had expressed their intention to
implement it.115
An important feature of the SAFE Framework is the
concept of Authorized Economic Operators (AEOs),116
which are essentially parties that have been accredited
by national customs administrations as compliant with
respect of physical security of premises, hidden camera
policies. In return, AEOs are typically rewarded by way
goods and fewer physical inspections.
In recent years, a number of agreements on
mutual recognition of AEO programmes have been
concluded, mainly on a bilateral level.117 However,
there still appears to be a lack of consensus on what
mutual recognition means in practice. According to the
SAFE Framework, for a system of mutual recognition
to work it is essential that:
There is an agreed set of common standards that
both customs and AEOs;
Standards are applied in a uniform manner so that
in the authorization of another;
designated authority by an authorizing customs
administration, that there is an agreed-upon
mechanism and standards for that authority;
Legislation to enable the implementation of a
mutual recognition system is in place.118
In June 2010, WCO issued its SAFE Package,
bringing together all WCO instruments and
guidelines that support its implementation.119 A
number of updates have recently been made to this
package. This includes the 2011 version of the SAFE
Framework, providing a separate annex for data
elements for security purposes and incorporating
the remaining 10 + 2 data elements into those that
were listed in the previous version of 2007, with the
aim of improving WCO members’ risk assessment
capabilities in this area. The 2011 version of the
terms scanning and screening to clarify their use in
day-to-day customs work. Other updates include
2011 versions of the Compendium of Authorized
Economic Operator (AEO) Programmes
relevant data as of June 2011, and of the WCO
Guidelines for the Procurement and Deployment of
Scanning/NII Equipment.
In addition, a new set of Guidelines for Developing
a Mutual Recognition Arrangement/Agreement was
added to the SAFE Package. As noted above, mutual
recognition is a broad concept embodied within
the WCO SAFE Framework, and its interpretation
might still be unclear. Therefore, the issuance of the
new Guidelines aims to assist States and industry
in this respect. According to the Guidelines, mutual
recognition is a concept “whereby an action or decision
taken or an authorization that has been properly
granted by one customs administration is recognized
and accepted by another customs administration” –
based on a formalized document generally termed
Mutual Recognition Agreement (MRA) or Mutual
of mutual recognition, the Guidelines note: “one
customs administration recognizes the validation
administration issued under the other programme and
agrees to provide substantial, comparable and, where
recognized AEOs. This recognition is generally
CHAPTER 5: LEGAL ISSUES AND REGULATORY DEVELOPMENTS 107
premised on the existence (or creation) of both
relevant legislation (where applicable) and operational
compatibility of both or more programmes.”120
The issue of mutual recognition is also addressed in a
WCO research paper,121
in line with the general WCO approach, as follows:
“Mutual recognition of AEOs is perceived as
an arrangement or agreement between two or
more customs administrations (or governments)
that recognize each other’s audits, controls and
that AEOs authorized by the partner country are
recognized as being as secure and reliable as
AEOs authorized by their own administration and
risk score and reduced controls when importing
into the customs territory.”
The research paper also suggests, however, that
some advocate a more expansive interpretation.
Some assert that an AEO accredited by one mutual
recognition agreement party should have exactly the
same status and be recognized as an AEO by the
other party or parties to that agreement, and thus
need not apply in the country of the other party. It is
or necessary, considering that international trade is
dominated by SMEs with a limited geographic range
of trade compared to multinationals.122
In recent years, a number of MRAs have been
adopted by customs administrations, usually on a
bilateral basis. However, it is hoped that these will, in
due course, form the basis for multilateral agreements
was concluded between the United States and New
Zealand in June 2007. As of 30 June 2012, 19 bilateral
MRAs have been concluded and a further 10 are being
negotiated between the following: China-EU, China-
Japan, Japan-Malaysia, China-Republic of Korea,
Hong Kong (China)-Republic of Korea, India-Republic
of Korea, Israel-Republic of Korea, New Zealand-
Singapore, Norway-Switzerland and Singapore-
United States. Many countries already having customs
compliance programmes123 are also in the process of
adopting legislative measures and taking other steps
necessary to establish their own AEO programmes.
As of 30 June 2012, 23 AEO programmes have been
established in 49 countries124 and eight more countries
plan to establish them in the near future.125
(b) Developments at the European Union level and in the United States
At the regional level, EU and the United States have
continued to develop measures to improve maritime
and supply-chain security. Given the particular
importance for many developing countries of trade
with EU and the United States, it is pertinent to
mention certain developments in this context.
As regards EU, previous editions of the Review of
Maritime Transport have provided information on the
security amendment to the Customs Code (Regulation
648/2005 and its implementing provisions), which
through customs controls for all goods brought into
or out of the customs territory of EU. The Review of
Maritime Transport 2011126 provided an analysis of
Customs Code, and related developments.
Part of these changes involved the introduction of
provisions regarding AEOs, a status that reliable traders
such as the recommendation for self-assessment of
economic operators to be submitted together with their 127 and the issuance of a
128 to guarantee a
uniform approach throughout all EU member States, are
also worth mentioning.
The EU is in the process of negotiating MRAs with 129
such as the United States.130 In this respect, it is
worth noting that EU and the United States signed a
decision on mutual recognition of their “secure traders”
programmes, namely the EU AEO and the United
States Customs–Trade Partnership Against Terrorism
(C-TPAT)131 programmes, on 4 May 2012.132 The
decision represents a formal agreement on mutual
recognition of safe traders, allowing these companies to
procedures and greater predictability in their
transatlantic activities. Importantly, mutual recognition
is also expected to improve security on imports and
exports by enabling customs authorities to focus their
started to be implemented from 1 July 2012.133
As noted in previous editions of the Review of Maritime
Transport
United States law in 2007134 to provide, by July 2012,
REVIEW OF MARITIME TRANSPORT 2012108
cargo containers before being loaded at a foreign
port. In October 2009, the United States Department
of Homeland Security (DHS) had acknowledged that
unlikely to be met, and that the target date would
be postponed until July 2014.135 Relevant concerns
relating to the feasibility of implementing the legislation
appear, however, to remain,136 as is illustrated by the
conclusions of a recent United States Government
.137 On 2 May 2012,
Secretary to the US Congress, thus giving effect to
cent scanning of United States-bound maritime
2014.138
nor a cost-effective way to secure the supply chain
logistical challenges of such a measure would cost an 139
(c) International Maritime Organization
(i) Measures to enhance maritime security
Both the Maritime Safety Committee (MSC) and
the Facilitation Committee (FAL) of IMO consider
measures to enhance maritime security as part of their
agenda. In this respect, certain developments at the
most recent sessions of these Committees over the
past year, relating to the effective implementation of
the International Convention for the Safety of Life at
Sea (SOLAS) chapter XI-2 and the International Ship
and Port Facilities Security (ISPS) Code, to voluntary
self-assessment for port facilities and ship security, as
well as to the search for solutions to stowaway cases,
are relevant to the present Review.
At its ninetieth session, held from 16–25 May
2012, MSC recalled that it had previously urged
SOLAS Contracting Governments and international
organizations to bring to its attention, at the earliest
opportunity, the results of the experience gained
from the use of the relevant maritime security
guidance140 for consideration of action to be taken.
One country informed the Committee that it had, in
early 2012, conducted and completed a voluntary
self-assessment of its port facilities and ship security
using the guidance provided in the above circulars,
which had demonstrated to it the value of these self-
assessment tools.141
A number of maritime security-related measures were
considered during the thirty-seventh session of FAL,
held from 5–9 September 2011. During the session
the Committee adopted resolution FAL.11(37),
Revised Guidelines on the Prevention of Access by
Stowaways and the Allocation of Responsibilities
to Seek the Successful Resolution of Stowaway
Cases.142 Finding a solution to stowaway cases can
be challenging because of differences between the
national legislation of, potentially, several involved
States: the State of embarkation, the State of
of apparent, claimed or actual nationality/citizenship
or right of residence of the stowaway, and States
of transit during repatriation. The revised Guidelines
outline comprehensive strategies to improve access
control and prevent intending stowaways from gaining
access to ships. They also provide guidance for
public authorities, port authorities, shipowners and
masters, to enable them to cooperate to the fullest
extent possible in order to resolve stowaway cases
expeditiously and ensure that an early return or
repatriation of the stowaway will take place.
The Committee also endorsed the inclusion, in the
Global Integrated Shipping Information System (GISIS),
of a module on stowaways, and urged member States
to make as much use as possible of the GISIS reporting
facilities. In 2008, 494 reports of stowaway cases were
received by IMO, 314 in 2009, 253 in 2010 and 47 in
2011 (up to August 2011). The reported cases involved
2,052 stowaways in 2008, 1,070 in 2009, 721 in 2010
low number of reporting sources meant that meaningful 143 Associating the
increasing problem of stowaways with a lack of proper
implementation of physical security measures and
access controls on board ships and within port facilities,
member States’ obligations to implement fully the
provisions of SOLAS chapter XI-2 and the ISPS Code
States to assess, on a continuous basis, all threats to
accordingly, and to ensure that ships implement fully
the security procedures appropriate to the security level
as detailed in the ship security plan.144
(ii) Measures to improve security andfacilitation of international tradeand transport
A number of developments aimed at improving security
and facilitation of international trade and transport are
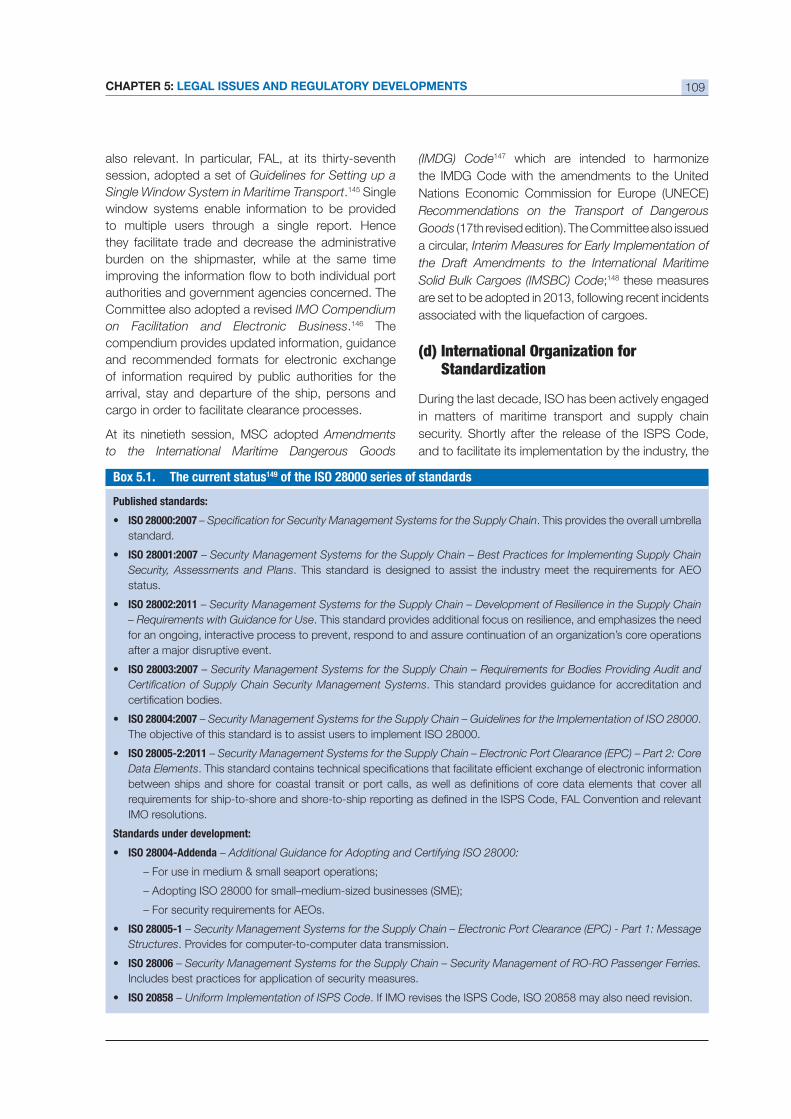
CHAPTER 5: LEGAL ISSUES AND REGULATORY DEVELOPMENTS 109
also relevant. In particular, FAL, at its thirty-seventh
session, adopted a set of Guidelines for Setting up a
Single Window System in Maritime Transport.145 Single
window systems enable information to be provided
to multiple users through a single report. Hence
they facilitate trade and decrease the administrative
burden on the shipmaster, while at the same time
authorities and government agencies concerned. The
Committee also adopted a revised IMO Compendium
on Facilitation and Electronic Business.146 The
compendium provides updated information, guidance
and recommended formats for electronic exchange
arrival, stay and departure of the ship, persons and
cargo in order to facilitate clearance processes.
At its ninetieth session, MSC adopted Amendments
to the International Maritime Dangerous Goods
(IMDG) Code147 which are intended to harmonize
the IMDG Code with the amendments to the United
Nations Economic Commission for Europe (UNECE)
Recommendations on the Transport of Dangerous
Goods (17th revised edition). The Committee also issued
a circular, Interim Measures for Early Implementation of
the Draft Amendments to the International Maritime
Solid Bulk Cargoes (IMSBC) Code;148 these measures
are set to be adopted in 2013, following recent incidents
(d) International Organization forStandardization
During the last decade, ISO has been actively engaged
in matters of maritime transport and supply chain
security. Shortly after the release of the ISPS Code,
and to facilitate its implementation by the industry, the
Box 5.1. The current status149 of the ISO 28000 series of standards
Published standards:
ISO 28000:2007 – . This provides the overall umbrella
standard.
ISO 28001:2007 – Security Management Systems for the Supply Chain – Best Practices for Implementing Supply Chain
Security, Assessments and Plans
status.
ISO 28002:2011 – Security Management Systems for the Supply Chain – Development of Resilience in the Supply Chain
– Requirements with Guidance for Use. This standard provides additional focus on resilience, and emphasizes the need
for an ongoing, interactive process to prevent, respond to and assure continuation of an organization’s core operations
– Security Management Systems for the Supply Chain – Requirements for Bodies Providing Audit and
. This standard provides guidance for accreditation and
ISO 28004:2007 – Security Management Systems for the Supply Chain – Guidelines for the Implementation of ISO 28000.
ISO 28005-2:2011 – Security Management Systems for the Supply Chain – Electronic Port Clearance (EPC) – Part 2: Core
Data Elements
IMO resolutions.
Standards under development:
ISO 28004-Addenda – Additional Guidance for Adopting and Certifying ISO 28000:
– For use in medium & small seaport operations;
– Adopting ISO 28000 for small–medium-sized businesses (SME);
ISO 28005-1 – Security Management Systems for the Supply Chain – Electronic Port Clearance (EPC) - Part 1: Message
Structures. Provides for computer-to-computer data transmission.
ISO 28006 – Security Management Systems for the Supply Chain – Security Management of RO-RO Passenger Ferries.
Includes best practices for application of security measures.
ISO 20858 – Uniform Implementation of ISPS Code. If IMO revises the ISPS Code, ISO 20858 may also need revision.
REVIEW OF MARITIME TRANSPORT 2012110
ISO Technical Committee ISO/TC 8 published ISO
20858:2007, Ships and Marine Technology – Maritime
Port Facility Security Assessments and Security Plan
Development.
Another important contribution is the ongoing
development of the ISO 28000 series of standards,
Security Management Systems for the Supply Chain,
which are designed to help the industry successfully plan
These standards promote a holistic, risk-based approach
to managing risks associated with any disruptive incident
in the supply chain, before, during and after the event.
The core standard, ISO 28000:2007,
for Security Management Systems for the Supply
Chain, serves as an umbrella management system
that enhances all aspects of security: risk assessment,
emergency preparedness, business continuity,
sustainability, recovery, resilience and/or disaster
management, whether relating to terrorism, piracy,
cargo theft, fraud, and many other security disruptions.
The standard also serves as a basis for AEO and
such standards may tailor an approach compatible
with their existing operating systems.
2. Maritime safety: entry into force of the International Convention on
and Watchkeeping for FishingVessel Personnel, 1995 (STCW-F)
A Convention containing special rules on standards
applicable
July 1995.150 The STCW-F Convention, consisting
of 15 articles and an annex containing technical
24 metres in length and above. Seventeen years after
September 2011.151 The entry into force of the STCW-F
Convention coincided with a diplomatic conference,
held from 9 to 11 October 2012, in South Africa for
the purpose of adopting an international agreement
on the implementation of the 1993 Protocol152 relating
to the 1977 Torremolinos International Convention for
the Safety of Fishing Vessels.
an important part of the mandate of IMO. However, the
above, that is, the 1977 Convention and its 1993
Protocol, have not come into force due to a variety of
technical and legal obstacles and unfortunately many
vessels every year. With the entry into force of the
STCW-F Convention on 29 September 2012, and the
renewed efforts to reach agreement at the diplomatic
conference held from 9 to 11 October 2012, it is
expected and hoped that the Torremolinos Protocol
possible.153
D. STATUS OF CONVENTIONS
of maritime transport have been prepared or were
each of these Conventions, as at 19 September
2012.
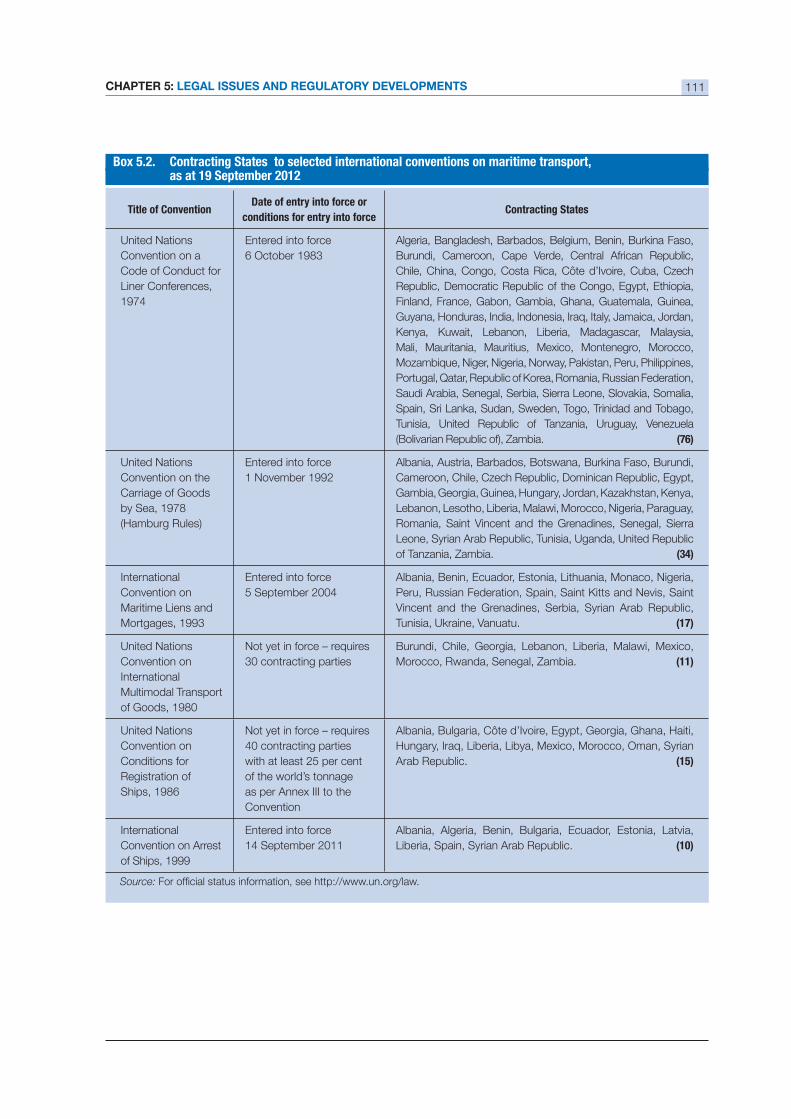
CHAPTER 5: LEGAL ISSUES AND REGULATORY DEVELOPMENTS 111
Box 5.2. Contracting States to selected international conventions on maritime transport,as at 19 September 2012
Title of ConventionDate of entry into force or
conditions for entry into forceContracting States
United Nations
Convention on a
Code of Conduct for
Liner Conferences,
1974
Entered into force Algeria, Bangladesh, Barbados, Belgium, Benin, Burkina Faso,
Burundi, Cameroon, Cape Verde, Central African Republic,
Chile, China, Congo, Costa Rica, Côte d’Ivoire, Cuba, Czech
Republic, Democratic Republic of the Congo, Egypt, Ethiopia,
Finland, France, Gabon, Gambia, Ghana, Guatemala, Guinea,
Kenya, Kuwait, Lebanon, Liberia, Madagascar, Malaysia,
Mali, Mauritania, Mauritius, Mexico, Montenegro, Morocco,
Portugal, Qatar, Republic of Korea, Romania, Russian Federation,
Saudi Arabia, Senegal, Serbia, Sierra Leone, Slovakia, Somalia,
Spain, Sri Lanka, Sudan, Sweden, Togo, Trinidad and Tobago,
Tunisia, United Republic of Tanzania, Uruguay, Venezuela
(Bolivarian Republic of), Zambia. (76)
United Nations
Convention on the
Carriage of Goods
by Sea, 1978
(Hamburg Rules)
Entered into force Albania, Austria, Barbados, Botswana, Burkina Faso, Burundi,
Cameroon, Chile, Czech Republic, Dominican Republic, Egypt,
Gambia, Georgia, Guinea, Hungary, Jordan, Kazakhstan, Kenya,
Lebanon, Lesotho, Liberia, Malawi, Morocco, Nigeria, Paraguay,
Romania, Saint Vincent and the Grenadines, Senegal, Sierra
Leone, Syrian Arab Republic, Tunisia, Uganda, United Republic
of Tanzania, Zambia.
International
Convention on
Maritime Liens and
Mortgages, 1993
Entered into force Albania, Benin, Ecuador, Estonia, Lithuania, Monaco, Nigeria,
Peru, Russian Federation, Spain, Saint Kitts and Nevis, Saint
Vincent and the Grenadines, Serbia, Syrian Arab Republic,
Tunisia, Ukraine, Vanuatu. (17)
United Nations
Convention on
International
Multimodal Transport
of Goods, 1980
Burundi, Chile, Georgia, Lebanon, Liberia, Malawi, Mexico,
Morocco, Rwanda, Senegal, Zambia. (11)
United Nations
Convention on
Conditions for
Registration of
Ships, 1986
40 contracting parties
of the world’s tonnage
as per Annex III to the
Convention
Albania, Bulgaria, Côte d’Ivoire, Egypt, Georgia, Ghana, Haiti,
Arab Republic. (15)
International
Convention on Arrest
of Ships, 1999
Entered into force Albania, Algeria, Benin, Bulgaria, Ecuador, Estonia, Latvia,
Liberia, Spain, Syrian Arab Republic. (10)
Source:
REVIEW OF MARITIME TRANSPORT 2012112
E. TRADE FACILITATION IN
INTERNATIONAL AGREEMENTS
1. Towards multilateral rules on trade facilitation at the World TradeOrganization: the early or onlyharvest of the Doha Round?
negotiations on trade facilitation (TF) may be close to
delivering what could be the early – if not the only –
harvest of the Doha Round. Indeed, while the Round
itself is now largely considered to be failing,154 TF
is increasingly seen as a rare success story of the
negotiations. At the same time, the WTO Negotiating
the draft consolidated negotiating text on the individual
TF measures. What is also lacking at this stage of
the negotiations is an agreement on the degree of
commitment of the developed members to delivering
technical assistance and capacity building (TACB) to
developing and least developed countries in exchange
for their commitments to implement TF.
The fate of the future WTO agreement, therefore,
hinges on two elements: delinking TF from the
itself and, in particular, its provisions on special and
differential treatment (SDT).
2. Delinking trade facilitation fromthe WTO Doha Round
In the climate of uneasiness and scepticism
surrounding the Doha Round and its unsuccessful last
ministerial meeting in December 2011, some WTO
members, representatives of the business community
where they singled out TF as one of the very few areas
where an agreement was within the reach.155
The support expressed by G20 Ministers in Mexico,
April 2012, for breaking up the Doha Round into its
component parts, with an emphasis on TF, fuelled
the appeals for the delinking of TF from the rest of
the Doha issues. The idea is widely discussed and
supported by such countries or groups of countries
as Australia, Canada, Chile, the United States, and the
European Union and their business communities. In
June 2012, the World Bank and Regional Development
Bank Presidents issued a personal press article,
published later in the press around the world and
in developing countries. In the article they urged, in
particular, the countries to conclude the TF Agreement
and reiterated the commitment for capacity-building
needs of developing countries so that they may be
able to fully implement the Agreement.156
The proponents of de-linking TF from the Doha
and the least developed countries.157 They also
consider that the current negotiating text on TF is
close to receiving the overall consensus. In his
speech at the UNCTAD Multi-year Expert Meeting on
Transport and Trade Facilitation in December 2011,
the Ambassador and Permanent Representative
of Sweden to the WTO voiced strong support for
the WTO TF Agreement in 2012, presenting the
Agreement as a “win–win”, especially in the light of
much-needed boost to world economy and the best
way to address the key legitimate concern of poorer
sustained support for their TF reforms, through the
mechanism of SDT.158
The opponents of the idea of de-linking TF from the
such as Argentina, Brazil, China, India and South
Africa. They stress the importance of the rest of the
free market access and a services waiver for LDCs)
for the developing countries. For them an agreement
on TF could not and should not be separated from
the rest of the negotiations and, therefore, should
Doha Round. They also reiterate that implementing
TF commitments would be much more onerous for
developing countries, as opposed to the industrialized
countries, who have already implemented most of
the TF measures under consideration.159 In their
eyes, agreeing on other Doha issues that would be of
balance in favour of signing up to legal obligations in
the TF area.
The idea of TF as an early harvest, which has emerged
CHAPTER 5: LEGAL ISSUES AND REGULATORY DEVELOPMENTS 113
feature of the trade talks, media reports and speeches
agreeing on TF would sway the opposition, leading
to the signature of the agreement in the near future.
But, while the debates on delinking TF from the Doha
Round are intensifying and gaining prominence, some
itself.
3. Finalizing the TF provisions,including the commitments on the special and differential treatment
The draft consolidated negotiating text, currently
in its 12th revision, released on 8 May 2012 (TN/
TF/W/165/12), contains a total of 26 articles160 with
substantial provision (draft article 14 on the National
Committee on Trade Facilitation) contains no such
brackets.
The provisions of the current draft consolidated
negotiating text can be divided into three sets:161
(a) Provisions on the individual TF measures;
(b) Institutional arrangements;
(c) Provisions on the special and differential treatment.
(a) Provisions on individual measures – codifying the best practices in trade facilitation
The individual TF measures currently included in the
draft consolidated negotiating text constitute what
can generally be seen as a set of the TF best practices
Many of these measures are present in such classical
TF instruments as the Revised International Convention
Procedures (Revised Kyoto Convention) of the World
Customs Organizations, the 1982 Convention on the
Harmonization of Frontier Controls of Goods, and the
United Nations trade facilitation recommendations.162 In
addition, the draft article 10 paragraph 4 – in its more
binding version – aims to establish the obligation to
use relevant international standards or parts thereof for
their importation, exportation or transit formalities and
procedures. This potentially includes in the scope of the
agreement international TF standards, so far used on
a voluntary basis, such as the United Nations Layout
Key (UNLK)163, the United Nations Trade Data Element
Directory and the WCO Data Model. Furthermore, as
documented by UNCTAD in the Review of Maritime
Transport 2011 and in a special technical note on
Trade Facilitation in Regional Trade Agreements, the TF
measures being negotiated by WTO are increasingly
part of the regional and bilateral trade agreements,
reinforcing their status as generally recognized and
promoted measures of trade facilitation.164
The draft negotiating text, therefore, constitutes
already at this stage a framework of reference on TF
best practices and is already used as a basis for the
national and/or regional TF strategies, bilateral and
regional trade cooperation, as well as in TF technical
organizations.165 At the same time, almost all
of the exact language and, thus, of the scope and
negotiations, as reported by some countries, is to
identify the elements of the substantial disagreement
so that a political decision can be taken, and to make
a decision on the desired degree of precision in the
legal wording.166
(b) Institutional arrangements –coordinating at the World TradeOrganization and the national levels
The draft consolidated negotiating text also addresses
the issue of creating and maintaining institutional
arrangements at both WTO and national levels.
The draft article 13 establishes a WTO TF Committee,
to it by agreement or by the members, such as receiving
certain obligations (publication, Internet publication,
implementation categories and schedules), overseeing
the implementation of SDT, identifying relevant
international standards on export, import and transit
procedures and, possibly, carrying out dispute
settlement during a transitional period. The mandate
of the Committee is potentially vast, as, according to
the current draft, it can address “any matters related to
the operation of this Agreement or the furtherance of its
with other international organizations dealing with TF to
avoid duplication of efforts.
At the national level, the draft negotiating text of article
14 of the Agreement contains a future obligation
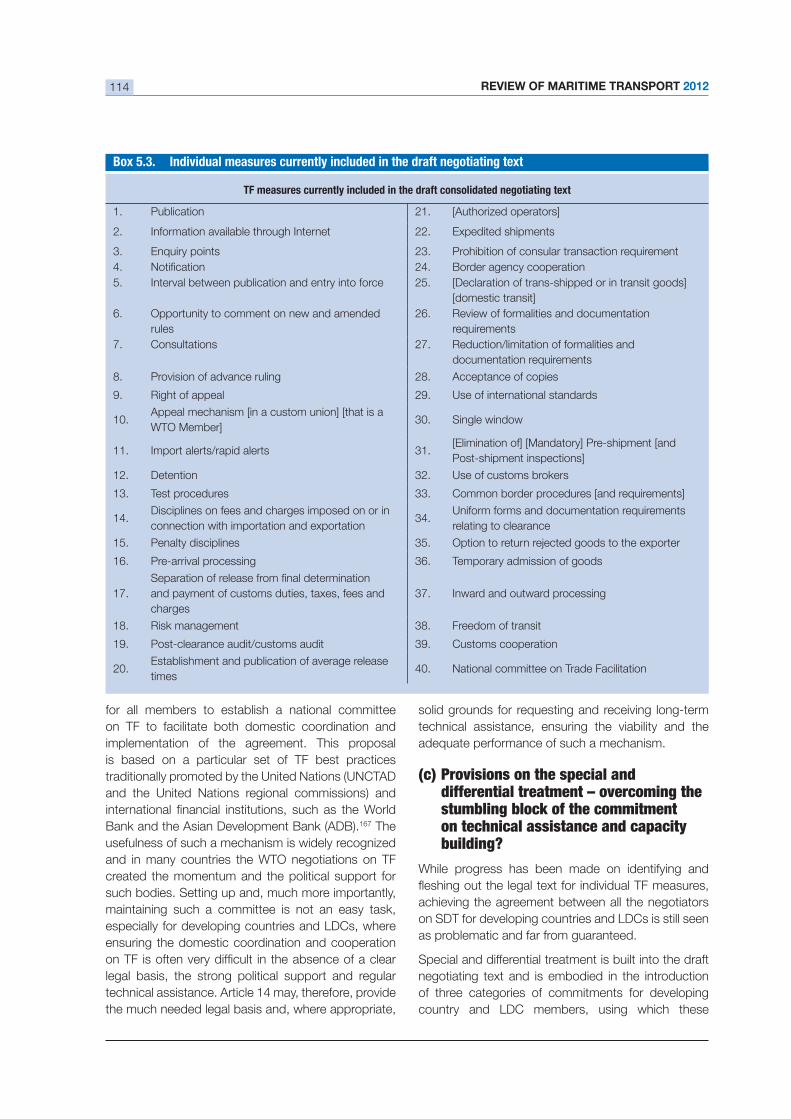
REVIEW OF MARITIME TRANSPORT 2012114
for all members to establish a national committee
on TF to facilitate both domestic coordination and
implementation of the agreement. This proposal
is based on a particular set of TF best practices
traditionally promoted by the United Nations (UNCTAD
and the United Nations regional commissions) and
Bank and the Asian Development Bank (ADB).167 The
usefulness of such a mechanism is widely recognized
and in many countries the WTO negotiations on TF
created the momentum and the political support for
such bodies. Setting up and, much more importantly,
maintaining such a committee is not an easy task,
especially for developing countries and LDCs, where
ensuring the domestic coordination and cooperation
legal basis, the strong political support and regular
technical assistance. Article 14 may, therefore, provide
the much needed legal basis and, where appropriate,
technical assistance, ensuring the viability and the
(c) Provisions on the special anddifferential treatment – overcoming the stumbling block of the commitment on technical assistance and capacity building?
While progress has been made on identifying and
achieving the agreement between all the negotiators
on SDT for developing countries and LDCs is still seen
as problematic and far from guaranteed.
Special and differential treatment is built into the draft
negotiating text and is embodied in the introduction
of three categories of commitments for developing
country and LDC members, using which these
TF measures currently included in the draft consolidated negotiating text
1. Publication 21. [Authorized operators]
2. Information available through Internet 22. Expedited shipments
3. 23.
4. 24. Border agency cooperation
5. Interval between publication and entry into force 25. [Declaration of trans-shipped or in transit goods]
[domestic transit]
6. Opportunity to comment on new and amended
rules
26. Review of formalities and documentation
7. Consultations 27. Reduction/limitation of formalities and
8. Provision of advance ruling 28. Acceptance of copies
9. Right of appeal 29. Use of international standards
10.Appeal mechanism [in a custom union] [that is a
WTO Member]30. Single window
11. Import alerts/rapid alerts 31.[Elimination of] [Mandatory] Pre-shipment [and
Post-shipment inspections]
12. Detention 32. Use of customs brokers
13. Test procedures 33.
14.Disciplines on fees and charges imposed on or in
connection with importation and exportation34.
relating to clearance
15. Penalty disciplines 35.
16. Pre-arrival processing 36. Temporary admission of goods
17. and payment of customs duties, taxes, fees and
charges
37. Inward and outward processing
18. Risk management 38. Freedom of transit
19. Post-clearance audit/customs audit 39. Customs cooperation
20.Establishment and publication of average release
times40. National committee on Trade Facilitation
CHAPTER 5: LEGAL ISSUES AND REGULATORY DEVELOPMENTS 115
countries can delay the implementation of some
measures and/or make it conditional upon receiving
the appropriate TACB.168 Special and differential
treatment is also expressed in other elements, such
as the proposed “grace period” for the application of
the WTO dispute settlement mechanism (the period of
time for which has yet to be agreed on).
Setting aside the technicalities of making this
differentiated speed of the implementation of the
the stumbling block in the eyes of many negotiators
and analysts is the reticent attitude of the developed
members vis-à-vis the inclusion of a clear legal
commitment to provide TACB to developing countries
and LDCs and to report on the assistance provided
individually or through international aid agencies.
to technical assistance delivery, and introducing the
mandatory reporting obligations on the TACB provided
is unprecedented in the WTO.169 Furthermore,
the developed countries explain their reservations
by pointing out the fact that the global TF-related
assistance is booming and, therefore, the needed
TACB is already available to the countries in need 170 In the
course of the negotiations, some developed country
WTO members submitted several comprehensive
in the area of TF, or with TF illustrating this point.171
The overall share of TACB assigned to TF has, in fact,
same time, the UNCTAD calculations, based on data
provided by OECD, also show a difference between
the middle-income developing countries and the
LDCs. The share of technical assistances assigned
to TF is much lower in LDCs than in middle-income
developing countries.172 This element, coupled with
the reasonable expectations that the costs of TF
implementation will be the highest in LDCs, lends
grounds to the concern of the developing countries
regarding a legally binding promise of TACB. Linking
TF commitments to a technical assistance was already
incorporated in some bilateral trade agreements more
than a decade ago, as illustrated by the 2001 Canada–
Costa Rica Free Trade Agreement, and references to
technical assistance are increasingly included in the
new bilateral and regional trade agreements.173
4. Conclusion: Window of opportunity for the World Trade Organization trade facilitation agreement?
momentum to deliver, perhaps, multilateral legally
binding rules and the institutional setting for their
implementation. While the speed of the negotiations
may appear relatively moderate, it is important to
bear in mind that drafting technical agreements on
several years even at the regional level. Already at
this stage, the WTO negotiations on TF have an
impact on the current regional and bilateral trade
agreements, on the TF-related TACB and national TF
strategies.174
opportunity in WTO. What, in the end, will dictate
the ultimate fate of the agreement is the negotiators’
willingness and ability to meet each other halfway
important chapter of the international regulatory and
legal framework of TF.
REVIEW OF MARITIME TRANSPORT 2012116
ENDNOTES
1 For further detail on relevant international regimes, see Reynolds, BWB and Tsimplis MN (2012) Shipowners’ Limitation of Liability
2 1976 LLMC entered into force on 1 December 1986. As at 30 June 2012 it had 53 States Parties representing
3 The 1996 Protocol to the Convention on Limitation of Liability for Maritime Claims, 1976. It entered into force on 13
4 For further detail on persons entitled to invoke limitation and on the types of vessel in respect of which limitation is available, see Reynolds, BWB and Tsimplis, MN (2012), fn 1 above, chapters 3 and 4. See also fn 13, below.
5
limitation and Art. 3 provides for a subset of claims that is excluded from limitation of liability (e.g. claims covered by specialized international liability regimes). For detailed commentary, see Reynolds, BWB and Tsimplis, MN (2012), fn 1 above, chapter 5.
6 See Art. 4 of the 1976 LLMC and 1996 LLMC: “A person liable shall not be entitled to limit his liability if it is proved that the loss resulted from his personal act or omission, committed with the intent to cause such loss, or recklessly and with knowledge that such loss would probably result”.
7 The IMO Legal Committee (LEG) during its ninety-ninth session held from 16 to 20 April 2012, adopted amendments to increase the limits of liability in the 1996 Protocol. See Resolution LEG.5(99), Report of the Legal Committee on the work of its ninety-ninth session, LEG 99/14, Annex 2.
8
9 9 Article 3(a)(i).
10 Article 3(a)(ii).
11 Article 3(b)(i).
12 Article 3(b)(ii). The daily conversion rates for Special Drawing Rights (SDRs) can be found on the International Monetary Fund (IMF) website, www.imf.org.
13 The 1996 LLMC applies in respect of proceedings before the courts of a Contracting State (see Art. 15); however, a
residence in a State Party, or does not have his principal place of business in a State Party or (b) any ship in relation to
14 The 1957 Limitation of Liability Convention entered into force in 1968, and still has 14 States Parties.
15 The scope of application of the 1976 LLMC is identical to that of the 1996 LLMC (see fn 13 above). The 1924 Limitation of Liability Convention and the 1957 Limitation of Liability Convention also apply in principle to proceedings before the courts of a Contracting State. However, under each of the Conventions a State may choose not to apply the limits to certain categories of person or ship that lack a nexus to the Contracting State.
16
MEPC held from 27 September to 1 October 2010 was provided in chapter 5 of the Review of Maritime Transport 2011.
17 See the Second IMO GHG Study 2009, available at http://www.imo.org/blast/blastDataHelper.asp?data_ . The study suggests that if implemented, relevant measures could increase
18 For an overview of the discussions on the different types of measures, see the Review of Maritime Transport 2010, p.118-119 and 2011, p.114-116.
19 In respect of market-based measures, see particularly the Review of Maritime Transport 2011, p.114 and 117-119.
20 The book, a UN co-publication with Earthscan/Routledge, includes contributions from experts from academia, international organizations - such as the IMO, the UNFCCC secretariat, OECD, IEA and the World Bank - as well as
international shipping and potential approaches to mitigation; the state of play in terms of the relevant regulatory and institutional framework; potential climate change impacts and approaches to adaptation in maritime transport; and
the UNCTAD website at www.unctad.org/ttl/legal.
21 For the text of the new Regulations, see the Second Session, MEPC 62/24/Add.1, Resolution MEPC.203(62), Annex 19.
22
(MARPOL 73/78), Annex VI (MARPOL Annex VI), sets limits on sulphur oxide and nitrogen oxide emissions from ship
CHAPTER 5: LEGAL ISSUES AND REGULATORY DEVELOPMENTS 117
exhausts and prohibits deliberate emissions of ozone depleting substances. It also contains provisions allowing for special SOx Emission Control Areas (SECAS) to be established with more stringent controls on sulphur emissions. MARPOL Annex VI entered into force on 19 May 2005 and as of 30 June 2012 had 70 States Parties representing
23
were represented in the sixty-second session of the MEPC, by a roll-call vote, rather than by consensus. The results of the vote were: 49 parties of MARPOL Annex VI in favour, 5 against and 2 abstained. The Regulations are expected to enter into force for the States Parties to MARPOL Annex VI as of 1 January 2013.
24 For the text of the Guidelines see the session, MEPC 63/23 and MEPC 63/23 Add.1, Resolutions MEPC.212-215(63), Annex 8-11.
25 For a brief description of these measures, see Review of Maritime Transport 2011, p.114-116.
26 The current regulations cover ships with conventional diesel propulsion. Other ship types such as Ro/Ros, passenger
27 Objectives of IMO’s http://www.imo.org/OurWork/Environment/PollutionPrevention/AirPollution/Documents/
GHG%20Flyer%20WEB.pdf.
28 See Regulations 5-10 and Appendix VIII.
29 See Regulation 19.
30 See Regulation 20.
31 The guidelines were prepared by the SMeasures for Ships (EE-WG 2). EE-WG 2 also considered guidelines for determining minimum propulsion power and speed to enable safe manoeuvring in adverse weather conditions, and other important issues, such as EEDI
for further development at future sessions. For more information see the report of the intersessional meeting, MEPC/63/4/11.
32 See the , MEPC 63/23 and MEPC 63/23 Add.1, Resolutions MEPC.212-215(63), Annex 8-11.
33 For most recent IMO discussions, see MEPC 63/23, p.23-26.
34 For discussions in the context of BIMCO for instance, see It has taken three years of often debate at the International , Lloyd’s List, 23 March 2012.
35 See , MEPC 63/23, Annex 8.
36 MEPC 63/23 Add.1, Annex 12.
37 See Regulation 23.
38 For the text of the draft resolution see document MEPC 63/5/4.
39 See MEPC 63/23, p.32.
40 MEPC 63/23 at para. 5.54. Proponents of MBM proposals which rely on design benchmarks/parameters were invited to “clarify in their proposals the relation between such design benchmarks/parameters and the EEDI set out in the new chapter 4 to MARPOL Annex VI”.
41 The concerns had been expressed in respect of an IMO commissioned study by Lloyd’s Register (LR) in partnership with
2
scenarios. Moreover, it was argued, the study was optimistic in its estimate of the cost of complying with the EEDI
42 MEPC 63/23 at para. 5.58. Member States were encouraged to submit documents to MEPC 64.
43 It should be noted that a range of concerns on matters of principle and policy concerning reduction of GHG emissions and in respect of potential MBMs have been expressed by a number of developing countries’ delegations, including in particular the delegations of Brazil, China and India. For further details, see also the statements by several delegations, set out in Annexes 14-17 to the , MEPC 63/23 Add.1.
44 See the Review of Maritime Transport 2011, p.114 and 117-119.
45 For a summary of the MBM proposals submitted at the MEPC, see Review of Maritime Transport 2010, p.119-122.
46 For a summary of the discussions, see the Review of Maritime Transport 2011, p.117-119.
REVIEW OF MARITIME TRANSPORT 2012118
47 Document MEPC 62/5/1.
48 MEPC 62/5/1, Annex 3.
49 Ibid., Annex 4.
50 Ibid., Annex 5.
51 Study of the EG), MEPC 61/INF.2. For a brief summary see Review of Maritime Transport 2010, p.122-123.
52 GHG-WG 3/3/4 (Cyprus, Denmark, Marshall Islands and Nigeria) and GHG-WG 3/3 (Greece).
53 MEPC 63/5/2 (Note by the Chairman).
54 MEPC 63/WP.12 (Note by the Chairman).
55 Comments on the impact assessment and highlighting the need for further impact studies on developing countries,
study on India’s shipping sector and trade, and MEPC 63/5/11 (China).
56 Document MEPC 63/5/8 (India). The study assessed the potential impact of MBMs on freight rates and export/import prices of three essential commodities (capesize iron ore exports from India to China, imports of coal to India from Australia and imports of crude oil to India from Saudi Arabia).
57 It is to be noted that coal accounts for nearly 65% of India’s CO2 emissions. This will defeat the basic purpose of “Reduction of GHG emissions”.
58 Document MEPC 63/5/11 (China).
59 See MEPC 63/23, p.34-44. The following documents were considered under this topic: MEPC 63/5/1 (Bahamas) and relevant parts of MEPC 62/5/13; MEPC 63/5/3 (Japan and WSC); MEPC 63/5/9 (Germany); MEPC 63/5/10 (Russian Federation); MEPC 62/5/7 (Greece); GHG-WG 3/3 (Greece); MEPC 62/5/8 (United States); MEPC 62/5/33 (Cyprus, Denmark, the Marshall Islands, Liberia, Nigeria, the Republic of Korea and IPTA); and GHG-WG 3/3/4 (Cyprus,
discussions on earlier proposals under consideration see Review of Maritime Transport 2010 and 2011.
60 Annex 3 of MEPC 62/5/1, see fn 47, above, and accompanying text.
61 MEPC 63/23 at para. 5.25.
62 Ibid.
63 Ibid.
64 The MEPC had the following documents for consideration on this issue: MEPC 62/5/15 (Germany), MEPC 63/5/7 (France), MEPC 62/5/34 (France), MEPC 63/5/6 (WWF), and MEPC 62/5/14 (WWF).
65 The UNFCCC regime is based on the principle of “Common but Differentiated Responsibilities and Respective Capabilities” (CBDR) of States, whereas policies and measures adopted under the auspices of IMO are guided by its
66 MEPC 63/23 at para. 5.34.
67 Ibid.
68 Ibid.
69 The “Rebate Mechanism” refers to a MBM proposal submitted by the International Union for the Conservation of Nature (IUCN), with further details submitted by the WWF; see MEPC 60/4/55, MEPC 61/5/33, MEPC 62/5/14, and
In: Asariotis R and Benamara H. (2012) Maritime Transport and the Climate Change Challenge. London: Earthscan (Routledge/Taylor & Francis), chapter 7.
70 MEPC 63/23 at para. 5.34.
71 Report of the Secretary-General’s High-level Advisory Group on Climate Change Financing, 5 November 2010, http://www.un.org/wcm/webdav/site/climatechange/shared/Documents/AGF_reports/AGF_Final_Report.
pdf. See also MEPC 62/INF.2 (secretariat).
72 See Mobilizing Climate Finance. 6 October 2011, available at G20_Climate_Finance_report.pdf. The report’s Annex 2, entitled “Market-based Instruments for International Aviation and Shipping as a Source of Climate Finance” is available at http://www.imf.org/external/np/g20/pdf/110411a.pdf.
MEPC 63/5/7, submitted by France.
73 See the remarks of a speaker from the International Chamber of Shipping (ICS) at an UNCTAD Ad-Hoc Expert Meeting
presentations at the meeting and a document presenting main outcomes and summary of discussions (UNCTAD/DTL/TLB/2011/3) are available on the UNCTAD website at www.unctad.org/ttl/legal. The ICS comments were widely reported in the press, see e.g. http://www.worldbunkering.com/news/industry-news/0730-ics-sells-levy-idea-at-unctad.html. For further information on the position of the ICS in respect of GHG emissions control, see www.marisec.org.
CHAPTER 5: LEGAL ISSUES AND REGULATORY DEVELOPMENTS 119
74 See document GHG-WG 3/WP.6.
75 On this matter, see also document MEPC 62/5/27 (India), On possible incompatibility between WTO Rules and a Market-Based Measure for international shipping. The delegation of India reiterated its concerns in a statement at the sixty-third session of the MEPC, see MEPC 63/23/Add.1, Annex 17.
76 These decisions and conclusions are summarised in MEPC 63/23 at paras 5.43-5.48. For further information on the outcome of the Durban Conference, see MEPC 63/5/5 (Note by the secretariat).
77 See the conclusion by SBSTA 35, which can be found in MEPC 63/5/5 at paras 23 to 26, as well as the continued consideration of issues related to addressing emissions from international aviation and maritime transport under AWG-LCA, which can be found in MEPC 63/5/5 at paras 18 to 21, and alternative sources.
78 See the decision referred to in MEPC 63/5/5 at para 8.5 to include carbon dioxide capture and storage in geological formations as a Clean Development Mechanism activity.
79 The Conference will be preceded by a two-week session in Bonn, Germany, and it is expected that additional intersessional meetings of the three ad hoc working groups will be held, as well as workshops related to further work on the Green Climate Fund, in accordance with the decision reproduced in MEPC 63/5/5 at para 8.4. See also MEPC 63/23, paras 5.35-5.44.
80 See MEPC 63/23, para. 5.47.
81
“to help developing countries make informed policy choices to address the environmental challenges in relation to transport strategy and to help identify associated capacity-building needs and appropriate regulatory responses” (Accra Accord, para. 168).
82 Document UNCTAD/DTL/TLB/2011/4, available at www.unctad.org/ttl/legal.
83 These include the International Convention on Civil Liability for Oil Pollution Damage, 1969; International Convention on Civil Liability for Oil Pollution Damage 1992; International Convention on the Establishment of an International Fund for Compensation for Oil Pollution Damage, 1971 (no longer in force); International Convention on the Establishment of an International Fund for Compensation for Oil Pollution Damage 1992; and the Protocol of 2003 to the International Convention on the Establishment of an International Fund for Compensation for Oil Pollution Damage, 1992.
84 International Convention on Civil Liability for Bunker Oil Pollution Damage 2001. The Convention entered into force on
85 International Convention on Liability and Compensation for Damage in Connection with the Carriage of Hazardous and . The Convention has not yet entered into force.
86 2010 Protocol to the International Convention on Liability and Compensation for Damage in Connection with the . The Protocol has not yet entered into force. See also
Review of Maritime Transport 2010 p.124-125.
87 The Convention has not yet entered into force. For more information on the Hong Kong Convention, see Review of Maritime Transport 2010 p.123.
88
x
and NOx emissions and particulate matter.
89 See Review of Maritime Transport 2008 p.119.
90 In case of a negative conclusion of the review the new global cap should be applied from 1 January 2025.
91 See MEPC 62/24, Resolution MEPC.202(62), Annex 14.
92 See ICS http://www.marisec.org/2012_Text.htm#low sulphur fuel.
93 See resolution MEPC.201(62).
94 See resolutions MEPC.216(63) and MEPC.217(63), MEPC 63/23, Annex 20 and 21.
95 Resolution MEPC.221(63), MEPC 63/23, Annex 26.
96 Resolution MEPC.218(63), MEPC 63/23, Annex 22.
97 This resolution follows the adoption by MEPC 62 of amendments to MARPOL Annex IV designating the Baltic Sea as a “Special Area” under this Annex. Those amendments are expected to enter into force on 1 January 2013.
98 Resolution MEPC.219(63), MEPC 63/23, Annex 24.
99 Resolution MEPC.220(63), MEPC 63/23, Annex 25.
100 Resolution MEPC.210(63), MEPC 63/23, Annex 4.
101 MEPC.211(63), MEPC 63/23, Annex 5.
102 Resolution MEPC.197(62), MEPC 62/24, Annex 3.
103 Resolution MEPC.196(62), MEPC 62/24, Annex 2.
REVIEW OF MARITIME TRANSPORT 2012120
104 The Hong Kong Convention was open for accession since 1 September 2010, and it is not yet into force. It will enter
have become Parties to it.
105 These were “Smart Ballast” Ballast Water Management System proposed by the Republic of Korea in document MEPC 62/2/8; DMU OH Ballast Water Management System proposed by China in document MEPC 63/2; and EcoGuardianTM Ballast Water Management System proposed by the Republic of Korea in document MEPC 63/2/4.
106 1These were: SiCURE™ Ballast Water Management System proposed by Germany in document MEPC 62/2/10; ERMA FIRST Ballast Water Management System proposed by Greece in document MEPC 63/2/1; MICROFADETM
TM Ballast Water Management System proposed by the Republic of Korea in document MEPC 63/2/3; and Neo-PurimarTM Ballast Water Management System proposed by the Republic of Korea in document MEPC 63/2/6.
107 See The 2004 Ballast Water Management Convention with international acceptance growing, the Convention may soon enter into force, UNCTAD, Transport Newsletter No.50, Second Quarter 2011, p.8.
108 The delegations of Brazil; Liberia; Malaysia; Malta; Panama; Singapore; Hong Kong, China and ICS.
109 The delegations of Germany, Ireland, Italy, Norway, the Republic of Korea and Spain.
110 See the , MEPC 63/23, p.12.
111 See Resolution MEPC.209(63), MEPC 63/23, Annex 3.
112 The BWM Convention has been open for accession by any State since 31 May 2005, and as of 30 June 2012, it had
the Convention will enter into force twelve months after the date on which not fewer than 30 States, the combined
have become Parties to it.
113
.
114 Pillar 1 is based on the model of the Container Security Initiative (CSI) introduced in the U.S. in 2002. Pillar 2 is based on the model of the Customs-Trade Partnership against Terrorism (C-TPAT) programme introduced in the U.S. in 2001. For more information on these as well as for an analysis of the main features of the customs supply chain security, namely advance cargo information, risk management, cargo scanning and Authorized Economic Operators (AEOs), see “WCO research paper No.18, The Customs Supply Chain Security Paradigm and 9/11: Ten Years On and Beyond”, September 2011, available at www.wcoomd.org. For a summary of the various U.S. security programmes adopted after Septemeber 11 see UNCTAD report Container Security: Major initiatives and related international developmentsUNCTAD/SDTE/TLB/2004/1, available at http://r0.unctad.org/ttl/ttl-docs-legal-reports+docs.htm.
115 For the list of WCO members who have expressed their intention to implement the SAFE Framework, see http://www..
116 The SAFE Framework AEO concept has its origins in the revised Kyoto Convention which contains standards on “authorized persons”, and national programmes.
117 See text to fn. 122 below.
118 WCO Safe Framework of Standards, June 2011, p.49.
119 See also Review of Maritime Transport 2011, p.121-122. The Package included the SAFE Framework of Standards, Customs Guidelines on Integrated Supply Chain Management, AEO Implementation Guidance, AEO Compendium, Model AEO Appeal Procedures, , Guidelines for the Purchase and Deployment of Scanning/Imaging Equipment, SAFE Data Element Maintenance Mechanism, Trade Recovery Guidelines, and FAQ for Small and Medium Enterprises. The SAFE package is available at: www.wcoomd.org/home_pfoverviewboxes_safepackage.htm.
120 See Guidelines for developing a mutual recognition arrangement/agreement, 2011, p.2.
121 See WCO research paper No.18, The Customs Supply Chain Security Paradigm and 9/11: Ten Years On and Beyondresearch/18_CSCSP_911.pdf.
122 Ibid.
123
124 Due to the fact that 27 EU countries have one common uniform AEO programme.
125 According to information provided by the WCO secretariat. For more information see Compendium of AEO Programmes, 2012 Edition, available at www.wcoomd.org/home_research_researchseries.htm.
126 See p.122-123.
127
European Commission’s Directorate General for Taxation and Customs Union, as of 8 February 2012, a total of
CHAPTER 5: LEGAL ISSUES AND REGULATORY DEVELOPMENTS 121
128 http://ec.europa.eu/taxation_customs/resources/documents/customs/policy_issues/customs_security/aeo_self_assessment_en.pdf . Explanatory notes are also available at http://ec.europa.eu/taxation_customs/resources/documents/customs/policy_issues/customs_security/aeo_self_assessment_explanatory_en.pdf.
129 MRAs have already been concluded with Switzerland, Norway and Japan. A similar agreement is also being explored with China.
130
131 Membership in the C-TPAT has reached 10,221 companies as of January 12, 2012. CBP currently has signed MRAs with the European Union, New Zealand, Canada, Jordan, Japan and the Republic of Korea and is continuing to work towards similar recognition with Singapore, Taiwan and other countries.
132 Preparatory work on mutual recognition was completed in November 2011, when they came to an agreement to
of the European Union, L 144/44, 5 June 2012, p.44-47, at http://eur-lex.europa.eu.
133 See Customs: EU and USA agree to recognize each other’s “trusted traders”, EU Press Release IP/12/449, 4 May 2012.
134 Implementing Recommendations of the 9/11 Commission Act of 2007. Public Law 110-53, 3 August 2007. For an analysis of the respective provisions, see UNCTAD’s Transport Newsletter www.unctad.org/ttl.
135 See Review of Maritime Transport 2010, p.128.
136 See also “Balancing maritime security and trade facilitation: Protecting our ports, increasing commerce and securing the supply chain”, Joint Statement by DHS before the House Committee on Homeland Security Subcommittee on Border and Maritime Security, 7 February 2012, available at: http://homeland.house.gov/sites/homeland.house.gov/
.
137 Container Security Programs Have Matured, but Uncertainty Persists over the Future of 100 Percent Scanning, Statement of Stephen L. Caldwell, Director Homeland Security and Justice, 7 February 2012, GAO-12-422T, available at: www.gao.gov/products/GAO-12-422T. The report states that “uncertainty persists over how the Department
of Energy announced the formation of the Secure Freight Initiative (SFI) pilot program in December 2006. However,
and CBP has since reduced the scope of the SFI program from six ports to one. In October 2009, GAO recommended
it, or if it is not feasible, present acceptable alternatives”.
138 In order for a two-year extension to take effect, the Secretary of the Department for Homeland Security (DHS) was
the Implementing Recommendations of the 9/11 Commission Act of 2007 (9/11 Act) which amends the SAFE Port Act.
139 www.brymar-consulting.com/wp content/uploads/security/Scanning_deferral_120502.pdf.
140 MSC.1/Circ.1192 on Guidance on voluntary self-assessment by SOLAS Contracting Governments and by port facilities; MSC.1/Circ.1193 on Guidance on voluntary self-assessment by Administrations and for ship security; and MSC.1/Circ.1194 on Effective implementation of SOLAS chapter XI-2 and the ISPS Code.
141 See document MSC 90/4/1 (Australia).
142 Resolution FAL.11(37), Report of the Facilitation Committee on its thirty-seventh session, FAL 37/17 Annex 1.
143 See FAL 37/17, p.18. Reports on stowaway incidents were received by the IMO from nine Member States; one Associate Member and one NGO in 2008; from eight Member States, one Associate Member and one NGO in 2009,
144 Ibid., p.21.
145 FAL.5/Circ.36.
146 FAL.5/Circ.35.
REVIEW OF MARITIME TRANSPORT 2012122
147 For more information on these amendments adopted during the ninetieth session of the MSC see the report of the MSC on its ninetieth session, document MSC 90/28, Annex 4.
148 MSC.1/Circ.1441.
149 For more information see www.iso.org. See also FAL 37/8/3, ISO 28000 Series Standards Update, submitted by the International Organization for Standardization (ISO)International Standards at the ISO is as follows: Draft International Standards adopted by the technical committees (TCs) are circulated to the member bodies for voting. Approval by at least 75% of the member bodies casting a vote
than 50% of the members of the parent committee casting a vote, while an ISO/TS is accepted for publication if it is approved by 2/3 of the members of the TC casting a vote. An ISO/PAS or ISO/TS is reviewed after three years in
either be transformed into an International Standard or be withdrawn.
150 For further information see http://www.imo.org/about/conventions/listofconventions/pages/international-convention-.
151 According to Article 12 of the Convention, it will enter into force 12 months after the date on which not fewer than 15
152 The 1993 Protocol had been adopted to amend the original Torremolinos Convention of 1977.
153 For information on another related convention of a more general nature, the International Convention on Standards of Review
of Maritime Transport 2011, p.126-128.
154 Policy Brief, Global Governance Programme, Issue 2011/1, June 2011; Bridges Weekly Trade News Digest, Volume 15, Number 15, 27 April 2011.
155 See reports on the recent informal ministerial trade talks in Paris on 22 May 2012, as reported by 24 May 2012 issue of Washington Trade Daily and the Wall Street Journal on 23 May 2012; Joint Statement of 13 December 2011 of ANTAD
(US) and P. Lamy (WTO) on March 19 2012, as reported by Reuters (US Edition) on 19 March 2012.
156 “A Down Payment on Development: Conclude a WTO Trade Facilitation Deal”, 27 June 2012, Ahmad Mohamed Ali Al-Madani, President of the Islamic Development Bank, Donald Kaberuka, President of the African Development Bank, Haruhiko Kuroda, President of the Asian Development Bank, Thomas Mirow, President of the European Bank for Reconstruction and Development, Luis Alberto Moreno, President of the InterAmerican Development Bank and Robert B. Zoellick, President of the World Bank Group.
157
Competitiveness.
158 “The Case for a WTO agreement – now”, Mr. Joakim Reiter, Ambassador and Permanent Representative of Sweden to the WTO, 8 December 2011, UNCTAD Multi-year Expert Meeting on Transport and Trade Facilitation.
159
(APEC), as reported by Bridges Weekly Trade News Digest, Volume 16 · Number 22, 6 June 2012.
160 Section I contains 16 articles and section II on STD, while not divided in articles, contains 11 distinct provisions.
161 The text also deals with the cross-cutting matters which include relationship to other WTO agreements, dispute settlement,
162 See, for instance, Recommendation No. 18 on Facilitation Measures Related to International Trade Procedures of the United Nations Centre for Trade Facilitation and Electronic Business (UN/CEFACT).
163 In some trade and transport agreements, however, such as the abovementioned Harmonization Convention, however, the Contracting Parties commit to align their documents on UNLK.
164 UNCTAD, Transport and Trade Facilitation, Series No.3, “Trade Facilitation in Regional Trade Agreements”, UNCTAD/DTL/TLB/2011/1.
165
text of WTO as a reference for assessing the state of TF in the participating countries. For more information, see http://unctad.org/en/Pages/DTL/Trade-Logistics-Branch.aspx.
166 Switzerland, Note on TF negotiations, August 2011.
167 See UNCTAD, Technical Notes on Trade Facilitation Measures UNCTAD/DTL/TLB/2010/1, and UNCTAD, Trade Facilitation Handbook (Part I): National Facilitation Bodies: Lessons from Experience, UNCTAD/SDTE/TLB/2005/1 (currently under revision).
CHAPTER 5: LEGAL ISSUES AND REGULATORY DEVELOPMENTS 123
168 The proposed categories are as follows:Category A: Provisions that a developing country member or a least developed country member has designated for implementation upon entry into force of the agreement.Category B: Provisions that a developing country member or a least developed country member has designated for implementation on a date after a transitional period of time following the entry into force of the agreement.Category C: Provisions that a developing country member or a least developed country member has designated for
169
of existing WTO agreements, UNCTAD/DTL/TLB/2010/2, p.45.
170 “The Case for a WTO agreement – now”, supra, p.5.
171 For the most recent example, see the communication from the European Union, TN/TF/W/149/Rev.3 of 12 May 2012.
172 Challenges and policy options for transport and trade facilitation, Note by UNCTAD secretariat, 28 September 2011, TD/B/C.I/MEM.1/11, pp. 65-68.
173 A detailed analysis of the TF related provisions in bilateral and regional agreements is available in the abovementioned note by UNCTAD on “Trade Facilitation in Regional Trade Agreements”.
174 For a recent example, see the presentation by Argentina at the last UNCTAD Multi-year Expert Meeting on Transport and Trade Facilitation on 7-9 December 2011.

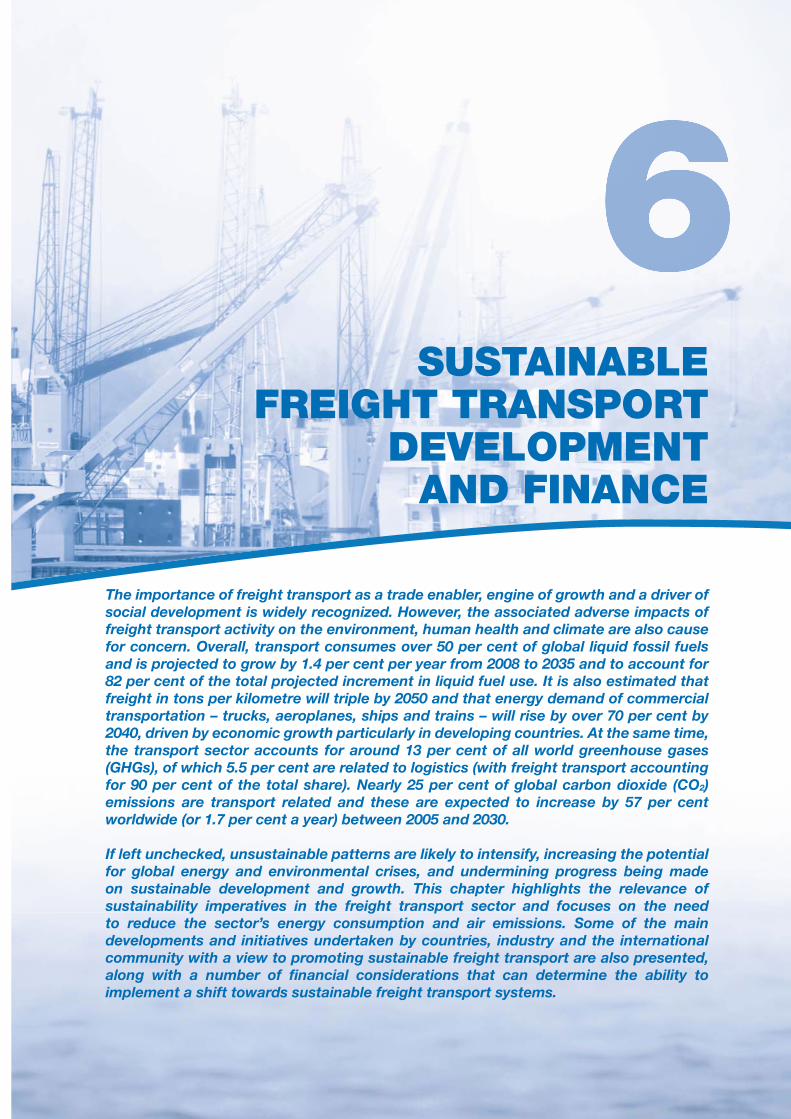
The importance of freight transport as a trade enabler, engine of growth and a driver of social development is widely recognized. However, the associated adverse impacts of freight transport activity on the environment, human health and climate are also cause for concern. Overall, transport consumes over 50 per cent of global liquid fossil fuels
freight in tons per kilometre will triple by 2050 and that energy demand of commercial transportation – trucks, aeroplanes, ships and trains – will rise by over 70 per cent by 2040, driven by economic growth particularly in developing countries. At the same time, the transport sector accounts for around 13 per cent of all world greenhouse gases
2
If left unchecked, unsustainable patterns are likely to intensify, increasing the potential for global energy and environmental crises, and undermining progress being made on sustainable development and growth. This chapter highlights the relevance of sustainability imperatives in the freight transport sector and focuses on the need to reduce the sector’s energy consumption and air emissions. Some of the main developments and initiatives undertaken by countries, industry and the international community with a view to promoting sustainable freight transport are also presented,
implement a shift towards sustainable freight transport systems.
SUSTAINABLE FREIGHT TRANSPORT
DEVELOPMENT AND FINANCE
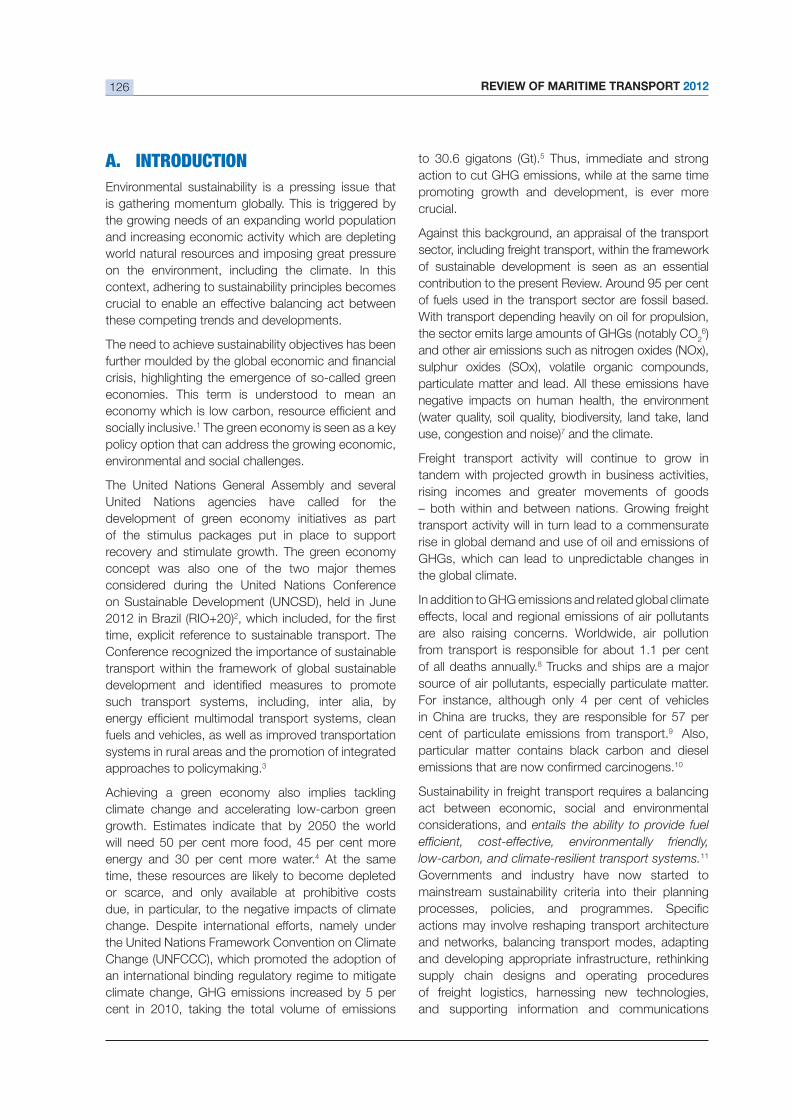
REVIEW OF MARITIME TRANSPORT 2012126
A. INTRODUCTION
Environmental sustainability is a pressing issue that
is gathering momentum globally. This is triggered by
the growing needs of an expanding world population
and increasing economic activity which are depleting
world natural resources and imposing great pressure
on the environment, including the climate. In this
context, adhering to sustainability principles becomes
crucial to enable an effective balancing act between
these competing trends and developments.
crisis, highlighting the emergence of so-called green
economies. This term is understood to mean an
socially inclusive.1 The green economy is seen as a key
policy option that can address the growing economic,
environmental and social challenges.
The United Nations General Assembly and several
United Nations agencies have called for the
development of green economy initiatives as part
of the stimulus packages put in place to support
recovery and stimulate growth. The green economy
considered during the United Nations Conference
on Sustainable Development (UNCSD), held in June
2012 in Brazil (RIO+20)2
time, explicit reference to sustainable transport. The
Conference recognized the importance of sustainable
transport within the framework of global sustainable
such transport systems, including, inter alia, by
fuels and vehicles, as well as improved transportation
systems in rural areas and the promotion of integrated
approaches to policymaking.3
Achieving a green economy also implies tackling
climate change and accelerating low-carbon green
growth. Estimates indicate that by 2050 the world
4 At the same
time, these resources are likely to become depleted
or scarce, and only available at prohibitive costs
due, in particular, to the negative impacts of climate
change. Despite international efforts, namely under
the United Nations Framework Convention on Climate
Change (UNFCCC), which promoted the adoption of
an international binding regulatory regime to mitigate
cent in 2010, taking the total volume of emissions
to 30.6 gigatons (Gt).5 Thus, immediate and strong
action to cut GHG emissions, while at the same time
promoting growth and development, is ever more
crucial.
Against this background, an appraisal of the transport
sector, including freight transport, within the framework
of sustainable development is seen as an essential
of fuels used in the transport sector are fossil based.
With transport depending heavily on oil for propulsion,
the sector emits large amounts of GHGs (notably CO26)
and other air emissions such as nitrogen oxides (NOx),
sulphur oxides (SOx), volatile organic compounds,
particulate matter and lead. All these emissions have
negative impacts on human health, the environment
use, congestion and noise)7 and the climate.
Freight transport activity will continue to grow in
rising incomes and greater movements of goods
– both within and between nations. Growing freight
transport activity will in turn lead to a commensurate
rise in global demand and use of oil and emissions of
GHGs, which can lead to unpredictable changes in
the global climate.
In addition to GHG emissions and related global climate
effects, local and regional emissions of air pollutants
are also raising concerns. Worldwide, air pollution
of all deaths annually.8
source of air pollutants, especially particulate matter.
cent of particulate emissions from transport.9 Also,
particular matter contains black carbon and diesel 10
act between economic, social and environmental
considerations, and entails the ability to provide fuel
low-carbon, and climate-resilient transport systems.11
Governments and industry have now started to
mainstream sustainability criteria into their planning
actions may involve reshaping transport architecture
and networks, balancing transport modes, adapting
and developing appropriate infrastructure, rethinking
supply chain designs and operating procedures
of freight logistics, harnessing new technologies,
and supporting information and communications
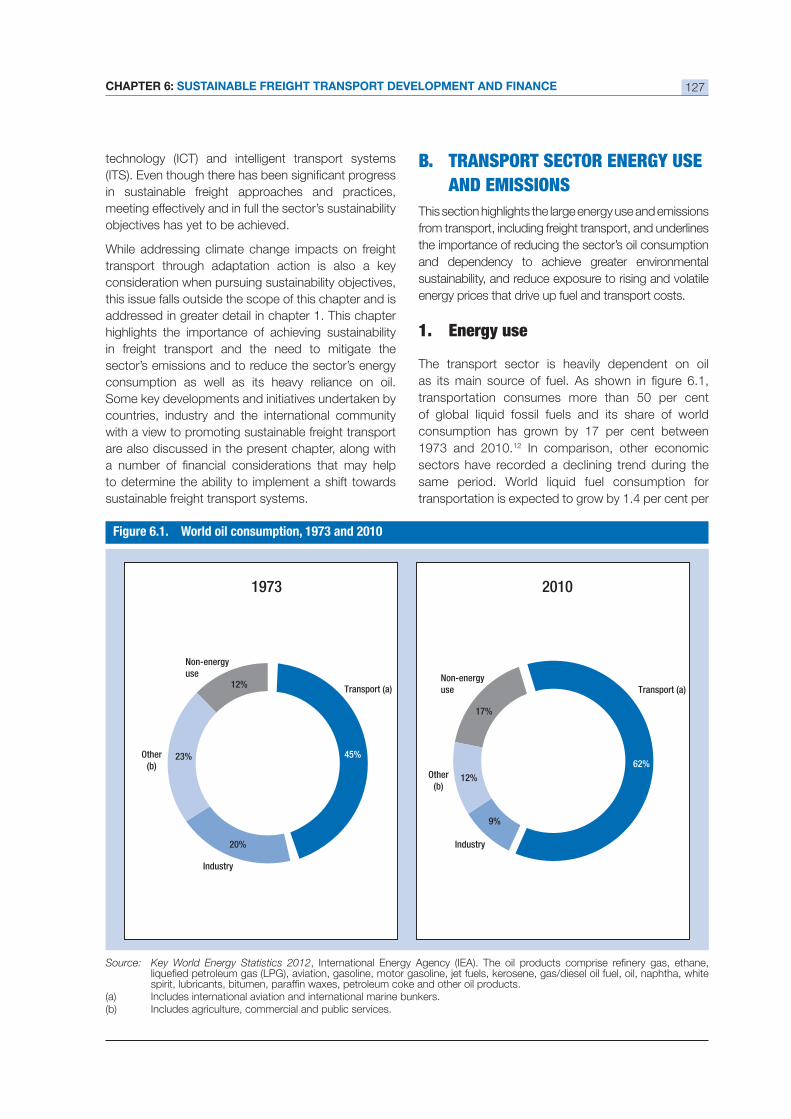
CHAPTER 6: SUSTAINABLE FREIGHT TRANSPORT DEVELOPMENT AND FINANCE 127
technology (ICT) and intelligent transport systems
in sustainable freight approaches and practices,
meeting effectively and in full the sector’s sustainability
While addressing climate change impacts on freight
transport through adaptation action is also a key
this issue falls outside the scope of this chapter and is
addressed in greater detail in chapter 1. This chapter
highlights the importance of achieving sustainability
in freight transport and the need to mitigate the
sector’s emissions and to reduce the sector’s energy
consumption as well as its heavy reliance on oil.
Some key developments and initiatives undertaken by
countries, industry and the international community
with a view to promoting sustainable freight transport
are also discussed in the present chapter, along with
to determine the ability to implement a shift towards
sustainable freight transport systems.
B. TRANSPORT SECTOR ENERGY USE
AND EMISSIONS
This section highlights the large energy use and emissions
from transport, including freight transport, and underlines
the importance of reducing the sector’s oil consumption
and dependency to achieve greater environmental
sustainability, and reduce exposure to rising and volatile
energy prices that drive up fuel and transport costs.
1. Energy use
The transport sector is heavily dependent on oil
1973 and 2010.12 In comparison, other economic
sectors have recorded a declining trend during the
Source: Key World Energy Statistics 2012
(a) Includes international aviation and international marine bunkers.(b) Includes agriculture, commercial and public services.
1973
Transport (a)
Industry
Other(b)
Non-energyuse
2010
Transport (a)
Industry
Other(b)
Non-energyuse
62%
9%
12%
17%
45%
20%
23%
12%
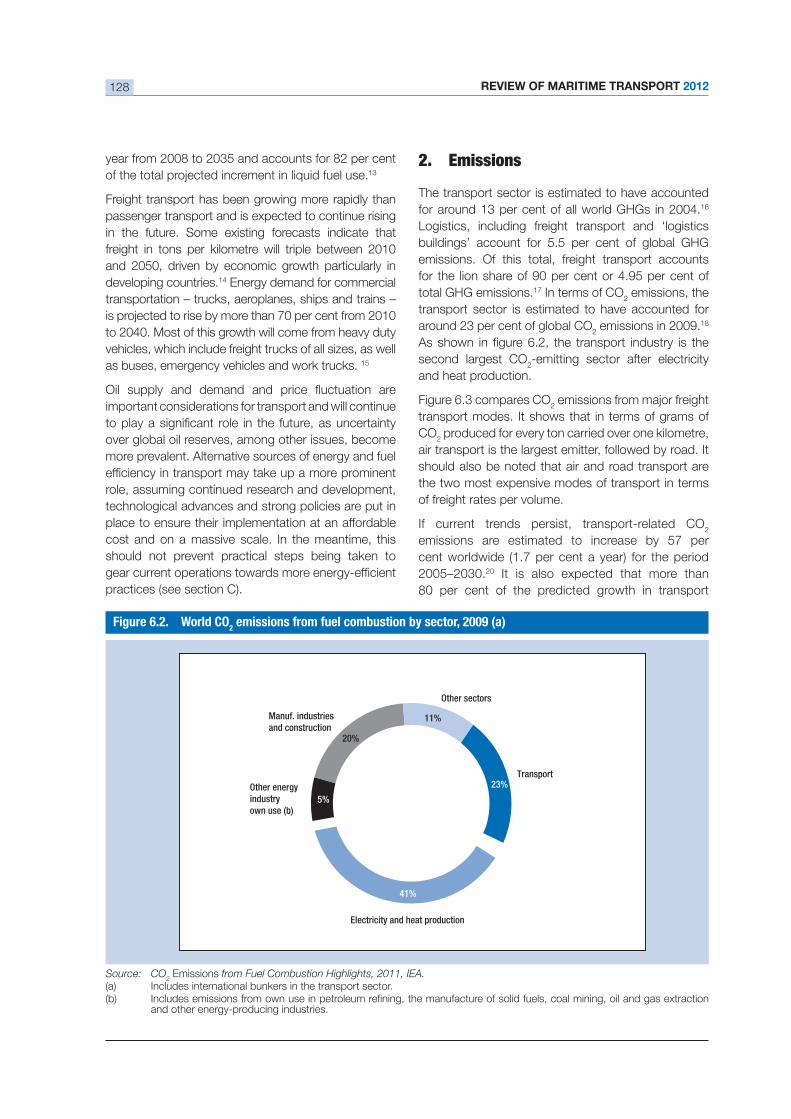
REVIEW OF MARITIME TRANSPORT 2012128
13
Freight transport has been growing more rapidly than
passenger transport and is expected to continue rising
in the future. Some existing forecasts indicate that
freight in tons per kilometre will triple between 2010
and 2050, driven by economic growth particularly in
developing countries.14 Energy demand for commercial
transportation – trucks, aeroplanes, ships and trains –
to 2040. Most of this growth will come from heavy duty
vehicles, which include freight trucks of all sizes, as well
as buses, emergency vehicles and work trucks. 15
important considerations for transport and will continue
over global oil reserves, among other issues, become
more prevalent. Alternative sources of energy and fuel
role, assuming continued research and development,
technological advances and strong policies are put in
place to ensure their implementation at an affordable
cost and on a massive scale. In the meantime, this
should not prevent practical steps being taken to
practices (see section C).
2. Emissions
The transport sector is estimated to have accounted 16
Logistics, including freight transport and ‘logistics
emissions. Of this total, freight transport accounts
total GHG emissions.17 In terms of CO2 emissions, the
transport sector is estimated to have accounted for
2 emissions in 2009.18
second largest CO2-emitting sector after electricity
and heat production.
Figure 6.3 compares CO2
transport modes. It shows that in terms of grams of
CO2 produced for every ton carried over one kilometre,
air transport is the largest emitter, followed by road. It
should also be noted that air and road transport are
the two most expensive modes of transport in terms
of freight rates per volume.
If current trends persist, transport-related CO2
2005–2030.20 It is also expected that more than
Figure 6.2. World CO2 emissions from fuel combustion by sector, 2009 (a)
Source: CO2
Emissions from Fuel Combustion Highlights, 2011, IEA.(a) Includes international bunkers in the transport sector.(b)
and other energy-producing industries.
Transport
Electricity and heat production
Other energyindustryown use (b)
Manuf. industriesand construction
Other sectors
23%
41%
5%
11%
20%
CHAPTER 6: SUSTAINABLE FREIGHT TRANSPORT DEVELOPMENT AND FINANCE 129
emissions would be in developing countries (with
China and India alone accounting for more than 21) and with most
of the emissions being generated by land transport.
Air pollution is also expected to be more intensive in
vehicles, in particular the ageing trucks.
The challenge now is for all countries to promote
sustainable transport policies, strategies, planning
and investment decisions that balance the
This is particularly crucial for developing countries
that have the opportunity to consider from inception
a sustainable development path. Missing this
opportunity may lead to increased costs in the
future, as Governments and industries would
eventually face additional expenses to adapt to new
circumstances and adopt new transport systems,
including new technologies and operating practices.
shocks, including those caused by climate change
impacts, can be burdensome, capital intensive
and costly. Thus, timely action at an early stage is
and low carbon systems will promote false savings.
It is estimated that every United States dollar spent
in new supply, with the savings being even greater in
developing countries.22
C. RECENT DEVELOPMENTS IN
SUSTAINABLE FREIGHT
TRANSPORT
Addressing sustainability in the freight transport sector
all private and public stakeholders in the system must
be considered and integrated, inclusive of all modes
and activities. Institutional, technical and operational
overcome the various cross-cutting sustainability
challenges characteristic of the sector. Some of
the salient measures can generally be associated
with three main areas for action – also described
as the avoid–shift–improve approach23 – which
would encounter cross-cutting issues that can be
summarized as follows:
2 emissions in freight transport by mode of transport(Grams carbon per ton freight carried per kilometre)
Source: Intergovernmental Panel on Climate Change (IPCC)19
Air
Maritime
Rail
Road
0.1 1 10 100 1000
g C per ton-km (logarithmic scale)
Bulk Carrier High-Speed Container
High-Speed Container
Large Trailer Small Truck
Low-SpeedNon-Fossil Fuel
REVIEW OF MARITIME TRANSPORT 2012130
wasteful and unnecessary or empty trips, and
duplication of roads, thus optimizing freight
transport planning/volume/operations and
reducing congestion, and the like.
Shift to sustainable transport modes and systems:
shift to cleaner transport modes (railways and
waterways when applicable), to alternative fuels
and to appropriate vehicle size, loads and routes,
and the like.
Improve the sustainability of freight transport,
logistics, vessels and vehicles: improve
infrastructure design and construction; improve
transport operations (for example, by better
capacities) and freight logistical systems (for
example, creating smart logistics network
concepts), leveraging technologies capable of
and improving drivers’ behaviour (for example,
through training and capacity building).
This section focuses on some of the measures and
initiatives undertaken by the sector (maritime and
inland) to promote a shift towards sustainable freight
transport. These initiatives are expected to produce
environmentally friendly transport modes and systems,
thereby reducing the sector carbon footprint.
1. The maritime sector
As the debate on climate change has been gaining
momentum globally, the maritime and shipping sector
has been facing pressure to respond to the challenges
of increasing GHG emissions (CO2, SOx, NOx, etc.)
and air pollution (especially particulate matter) and
possible mitigation and adaptation measures are
being considered, both at the regulatory and industry
levels.
and climate-friendly mode of transport, especially in
terms of emissions per ton of freight per kilometre,
shipping and its environmental footprint is increasingly
coming under public scrutiny.
According to the International Maritime Organization
(IMO), shipping was estimated to have accounted
International shipping was estimated to be responsible
2 in 2007. In
the absence of global policies to control emissions from
international shipping, ship emissions may increase
the emissions in 2007) due to the expected continued
growth in international seaborne trade.24
There does, however, appear to be a consensus
within the International community, including the
International Maritime Organization (IMO), that some
measures affecting the technology of ships and
reduce GHG emission intensity rates (CO2/ton-mile)
the international shipping industry is of the view that
cent of CO2 emissions per ton freight per kilometre
by 2020.25
At the regulatory level, the international shipping
industry is adhering increasingly to environmental
sustainability principles and is recognizing its important
role in maintaining the current international momentum
on sustainability and climate change action in maritime
transport. In 2011, the IMO (the body entrusted by
UNFCCC to develop and enact global regulations
to control GHG emissions from ships engaged in
that addresses carbon emissions from international
(SEEMP) (see chapter 5 for a more detailed discussion
of the new rules). Market-based measures, such as
emissions trading or a global levy to help cut further
emissions from international shipping are also being
considered by IMO, but a number of outstanding issues
are holding back a rapid adoption of an international
agreement. These include the need to reconcile the
principle of common but differentiated responsibilities
and respective capabilities (CBDR) under the UNFCCC
with the principle of uniform and global application of
IMO instruments, as well as the need to determine the
level of contribution by shipping into the Green Climate
Fund (GCF) (established in December 2011 at the
United Nations Climate Change Conference in Durban
enable mitigation and adaptation action in developing
countries. While the United Nations Secretary-General’s
High-level Advisory Group on Climate Change Financing
(AGF), established in 2010, suggested that some
CHAPTER 6: SUSTAINABLE FREIGHT TRANSPORT DEVELOPMENT AND FINANCE 131
shipping, the World Bank suggests that instead some 26 The shipping
industry is concerned that its potential contribution into
the Fund will be disproportionate to its responsibility for
global CO2 emissions, and that it will be doubly charged
through the UNFCCC as well as via a potential market-
based instrument under the IMO.27
At the industry level, the shipping industry is taking
important actions, including technological, operational
or engineering-based measures to improve the
and emissions. Relevant initiatives include building
fuel-saving and environment-friendly ships, promoting
the switch to cleaner fuels and increasingly adopting
Shipbuilding Group launched, in May 2012, a new
generation of fuel-saving and environment-friendly
bulk carriers which aim at the segmented markets
for 60,000, 80,000 and 120,000 deadweight ton
(dwt) bulk carriers (CROWN 63, CROWN MHI 82
and CROWN 121 Ultimate, respectively). At a service
speed of 14.3 knots, the fuel consumption of CROWN
63 Ultramax bulk carriers is reduced to 25.8 tons
carriers currently operating.
For the ports and terminals, various opportunities
have also emerged for improving environmental
sustainability. Examples vary from enhanced port
infrastructure design, switching to greener modes
of transport for hinterland access (e.g. rail, inland
programmes and using renewable energy (such
as biofuels, solar energy and wind turbines) to
cater for port operations in general, including cargo
management systems (both for servicing vessels and
for cargo handling inside the terminals). In this context,
cent reduction of CO2 emissions per terminal and to a
sector.28 The so-called cold ironing – whereby ships,
while in the port, use onshore electricity as energy
source instead of running their engines – constitutes
another strategy able to reduce emissions in ports and
even in some cases completely eliminating, harmful
air emissions from diesel engines. Furthermore, ports
and terminal operators see a competitive advantage to
be gained in integrating technology to their business
processes and in using cleaner land-based cargo-
and eco-friendly rubber-tyred gantry cranes.
Other port-based measures aiming to achieve greater
containers and cargo. By doing so, a reduction
of CO2 emissions can be generated, as illustrated
by the Rotterdam Shortsea Terminal which noted
a CO2
29
Another more comprehensive approach consists of
incorporating systemic logistics solutions aimed at
reducing time and cost into the design and planning
of ports and terminals, as shown by the port-centric
logistics or cargo hub operating structure.30 Recent
studies31 have shown that the port-centric model
does address the key supply chain challenges of
time, cost and carbon emissions. However, in some
countries land availability and affordability may be a
The development of port-centric models have been
widely accepted in Europe, where there is a growing
new sea or inland water transport terminals.32 For
example, DP World’s London Gateway is developing
a large port-centric logistics park connected to a new
more reliable and greener way to transport goods to
their destination compared with existing supply chain
miles every year will be saved since goods will no
longer need to be transported from deep-sea ports
to inland distribution centres.33 Another scheme to
improve sustainability is to investigate how logistics
chains can be developed in ways that mitigate empty
called optimization. Enhanced logistics and supply
chain management can improve freight loads and
for deliveries. Other innovative approaches used by
ports to reduce emissions include the so-called low
emissions zones
that seek to restrict or prevent access to polluting
vehicles within and around port areas. Low emissions
zones exist in Singapore, Hong Kong (China), Seattle
and Antwerp and coast lines such as the West Coast
of the United States and the East Coast of China
(planned). Together, all these measures can help
reduce the carbon footprint and control air pollution
in the maritime transport sector while, at the same,
REVIEW OF MARITIME TRANSPORT 2012132
2. Inland freight transport andlogistics
As previously mentioned, the large scale of transport
energy consumption and CO2 emissions is due mainly
to land modes, in particular haulage by road. This is
in developing countries. The travel activity of surface
freight transport– including rail, medium-duty truck and
heavy truck (in ton-kilometres) worldwide is expected
from 2000 to 2050.34 In India, this growth will likely be
35 Therefore, achieving growth and
future, without taking into consideration improving fuel
Past experiences, namely from the developed
countries, have demonstrated that given the
long-lived nature of the transport assets and
huge investment implications of the sector, land
transport is one of the toughest sectors to switch
from or within which to reduce emissions once
the systems have been established. For instance,
switching to more environmentally friendly modes,
such as rail and inland waterways, offers a well-
long-term planning and appropriate corrective and
supportive measures at policy, as well as business
and operational levels.
Moreover, there are several challenges, including a
and institutional arrangements, as well as the limited
availability and high cost of technologies that are
preventing wide adoption of sustainable strategies.
Yet, there are considerable opportunities to improve
sustainability in land freight transport and logistics
through a “comprehensive and integrated approach”.
transport costs, speed and reliability of services,
and the like), a number of integrated options have
the potential to promote sustainability in land freight
transport. This entails, inter-alia, optimizing the
performance of multimodal logistics chains, improving
the competitiveness of environmentally friendly modes
of transport, leveraging technologies capable of
reducing emissions, as well as creating integrated
transport networks and environmentally -friendly
dedicated freight corridors.
An example of an integrated transport planning
approach is the European Commission White Paper
targets such as:
(a) Optimizing the performance of multimodal logistics
chains;
and environmentally friendly freight corridors;
carbon fuels in aviation;
emissions.
2 emissions and a
comparable reduction in oil dependency.36
Another example is provided by the Government of
Indonesia, which has introduced comprehensive
policies that aim at promoting sustainable freight
transport systems and reducing the transport
burden on roads, the predominant mode of transport
kilometres). These policies include a shift towards
greener modes of transport such as rail and short
sea shipping (where ferries can carry out roll-on, roll-
off operations) and develop rail-based logistics in
land transport related emissions is crucial, given
the recent growth in freight movement in Indonesia
2 emissions from
national emissions).37
An integrated transport planning strategy aimed
systems would usually encompass the development
of intermodal transport and integrated freight transport
of appropriate infrastructure and services, facilitating
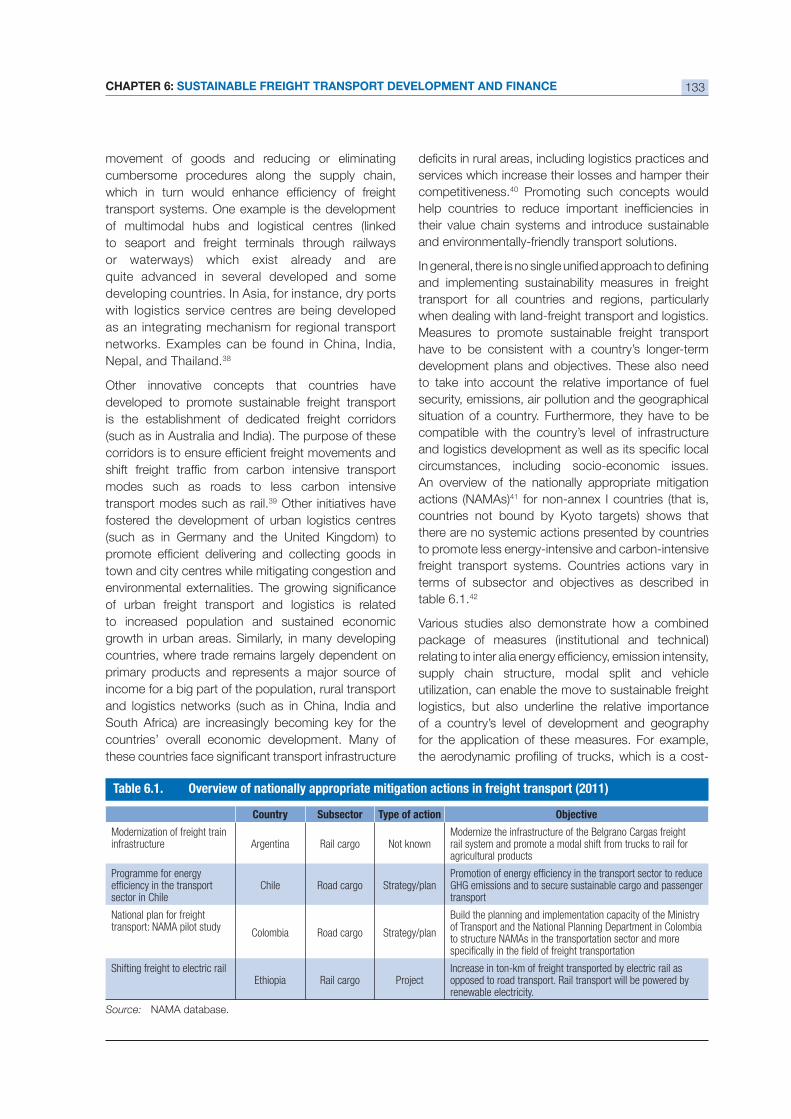
CHAPTER 6: SUSTAINABLE FREIGHT TRANSPORT DEVELOPMENT AND FINANCE 133
movement of goods and reducing or eliminating
cumbersome procedures along the supply chain,
transport systems. One example is the development
of multimodal hubs and logistical centres (linked
to seaport and freight terminals through railways
or waterways) which exist already and are
developing countries. In Asia, for instance, dry ports
with logistics service centres are being developed
as an integrating mechanism for regional transport
networks. Examples can be found in China, India,
Nepal, and Thailand.38
Other innovative concepts that countries have
developed to promote sustainable freight transport
is the establishment of dedicated freight corridors
(such as in Australia and India). The purpose of these
modes such as roads to less carbon intensive
transport modes such as rail.39 Other initiatives have
fostered the development of urban logistics centres
(such as in Germany and the United Kingdom) to
town and city centres while mitigating congestion and
of urban freight transport and logistics is related
to increased population and sustained economic
growth in urban areas. Similarly, in many developing
countries, where trade remains largely dependent on
income for a big part of the population, rural transport
and logistics networks (such as in China, India and
South Africa) are increasingly becoming key for the
countries’ overall economic development. Many of
services which increase their losses and hamper their
competitiveness.40 Promoting such concepts would
their value chain systems and introduce sustainable
and environmentally-friendly transport solutions.
and implementing sustainability measures in freight
transport for all countries and regions, particularly
when dealing with land-freight transport and logistics.
Measures to promote sustainable freight transport
have to be consistent with a country’s longer-term
to take into account the relative importance of fuel
security, emissions, air pollution and the geographical
situation of a country. Furthermore, they have to be
compatible with the country’s level of infrastructure
circumstances, including socio-economic issues.
An overview of the nationally appropriate mitigation
actions (NAMAs)41 for non-annex I countries (that is,
countries not bound by Kyoto targets) shows that
there are no systemic actions presented by countries
to promote less energy-intensive and carbon-intensive
freight transport systems. Countries actions vary in
42
Various studies also demonstrate how a combined
package of measures (institutional and technical)
supply chain structure, modal split and vehicle
utilization, can enable the move to sustainable freight
logistics, but also underline the relative importance
of a country’s level of development and geography
for the application of these measures. For example,
Country Subsector Type of action
Modernization of freight train infrastructure Argentina Rail cargo Not known
Modernize the infrastructure of the Belgrano Cargas freight rail system and promote a modal shift from trucks to rail for agricultural products
Programme for energy
sector in ChileChile Road cargo Strategy/plan GHG emissions and to secure sustainable cargo and passenger
transport
National plan for freight transport: NAMA pilot study
Colombia Road cargo Strategy/plan
Build the planning and implementation capacity of the Ministry of Transport and the National Planning Department in Colombia to structure NAMAs in the transportation sector and more
Shifting freight to electric railEthiopia Rail cargo Project opposed to road transport. Rail transport will be powered by
renewable electricity.
Table 6.1. Overview of nationally appropriate mitigation actions in freight transport (2011)
Source: NAMA database.
REVIEW OF MARITIME TRANSPORT 2012134
effective measure of cutting fuel consumption and
emissions in developed countries possessing good
road infrastructure and high speed operations, may
speeds are much lower.43
The role of industry
At the industry level, a large number of sustainable
freight transport initiatives have been introduced,
kilometres and ton-kilometres, using simple options
driving, and more advanced use of technologies
such as hybrid diesel–electric engine trucks), shifting
to cleaner modes of transport, as well as using
logistics operations can be improved in a number
of ways using ICT, including for instance the use
of software able to improve the design of transport
networks and allow the running of centralized
distribution networks and management systems.
Implementing such solutions will enable the reduction
of freight congestion, waiting times in delivery places,
travelling empty or partially loaded), storage needed
for inventory, and so lead to a greener and more
reduction in transport emissions globally and could
achieve a decline in total global emissions of 1.52 Gt
CO2 by 2020.44
Some of the successful private-sector led sustainable
freight transport initiatives are provided below:
The German chemical company, BASF, has set a
new policy to use inland waterways to transport
policy of using trains wherever possible;
The German food company, Kraft Jacobs Suchard,
uses trains to carry raw coffee beans from Bremen
to its factories in Berlin. The coffee bean trains,
which have replaced local delivery trips by road,
used for road transport;
In the Netherlands, EVO, the employers’
organization for logistics and transport, organizes
courses and training programmes to teach drivers
to drive more economically. Drivers who follow
these courses can achieve fuel consumption 45
economy by 2015 and reduce CO2 emissions by
to deliver goods to the retailer’s 4,000 stores.
Aside from tyre and aerodynamics technologies,
auxiliary power units (APUs) were installed in 2006
on all trucks that made overnight trips, reducing
CO2 emissions by an estimated 100,000 tons and
46
FedEx has launched “EarthSmart” Initiative
which encompasses various sustainability efforts,
including adding more sustainable delivery
vehicles, optimizing delivery routes in order to
minimize driving time, and maximizing cargo
from 5.4% in 2006 to 15.1% in 2010;
In China, the Henan Anyang Modern Logistics
Information Development, a company established
in 2006 as an online logistics information platform
that provides freight information exchange
services and other value-added services, has
helped trucking companies in Anyang city (Henan
Province) to reduce the empty mile percentage
The total freight empty mileage saving in Anyang
Chinese yuan (CNY)) during the same period. The
platform has since expanded to the entire province,
with more than 50,000 deals made per month and
48
The European Chemical Industry Council (CEFIC)
introduced in 2011 a study – Guidelines for
Measuring and Managing CO2 Emissions from
Freight Transport Operations – to assist chemical
companies understanding how they can assess
and improve their transport-related operations and
reduce emissions;49
The Green Freight Asia Network, involving global
freight logistics companies, manufacturers, freight
carriers and industry associations was established
in 2011 to support green freight initiatives and
programmes in Asia;50
freight in Europe and Asia has been reached
CHAPTER 6: SUSTAINABLE FREIGHT TRANSPORT DEVELOPMENT AND FINANCE 135
between the Clean Air Initiative for Asian Cities
(CAI-Asia), the Secretariat for Green Freight Europe
(European Shippers’ Council - ESC and EVO
Dutch Shippers’ Council), and the Sustainable
under the auspice of the Rio+20 conference.
The programme, which will be fully operational in
Europe and Asia, aims to help countries reduce
minimize CO2 emissions that contribute to climate
change, without hindering economic development.
sustainable freight approaches and practices in recent
years, sustainable freight transport is still in its infancy
and most stakeholders are still in the learning phase. To
ensure the delivery of successful initiatives, combined
efforts emanating from both the public and private
sectors, including comprehensive approaches that
would ensure interdisciplinary and inter-institutional
collaborations in areas such as research, data analysis
and technology, must be strengthened. Strategic
thinking and development related to sustainable freight
freight logistics movement in support of global trade
and development.51
D. ENABLING SUSTAINABLE FREIGHT
TRANSPORT: FINANCE-RELATED
CONSIDERATIONS
various sources – public and private, national and
development assistance (ODA) has been also available
52
Shifting towards sustainable freight transport will
more resources and capacities than are available. A
fundamental element in this respect will be the promotion
of a collaborative approach between public and private
investment partners to meet the increased investment
This section will provide a brief overview of some of the
current and future development of sustainable freight
transport. It is by no means comprehensive, but does
highlight some of the main considerations that arise in
freight transport.
for infrastructure construction and maintenance.
public budgets on transport.53 For many developing
faces a number of challenges. These include:
(a) Competition with other high-priority areas for
public funds such as health care, education and
debt service;
(b) Tightly constrained national budgets and limited
ability of Governments to borrow either at home or
abroad;
environmentally harmful subsidies, most notably
on fossil fuels.54
Nevertheless, the public sector remains a key player.
The role of Government can vary from that of an
investment provider to a co-sharer of risks and facilitator
of transport infrastructure and services development.
The Government has a key role to play in providing
incentives and market signals to trigger the shift to
sustainable freight transport systems. These can take
various forms, such as: the phasing out of fuel subsidies
as deemed appropriate and supporting greener
freight modes; the application of appropriate pricing
mechanisms (such as road pricing taking into account
actual externalities); the support of investment (through
guarantee/funding) appropriate for the development
and operation of sustainable freight transport systems.
Other incentives may involve the development of
infrastructure development of sustainable freight
transport. As an example, the United Kingdom
Department for Transport has developed two freight
grant funds to promote a shift of freight movement
from road to rail or inland water. The two schemes
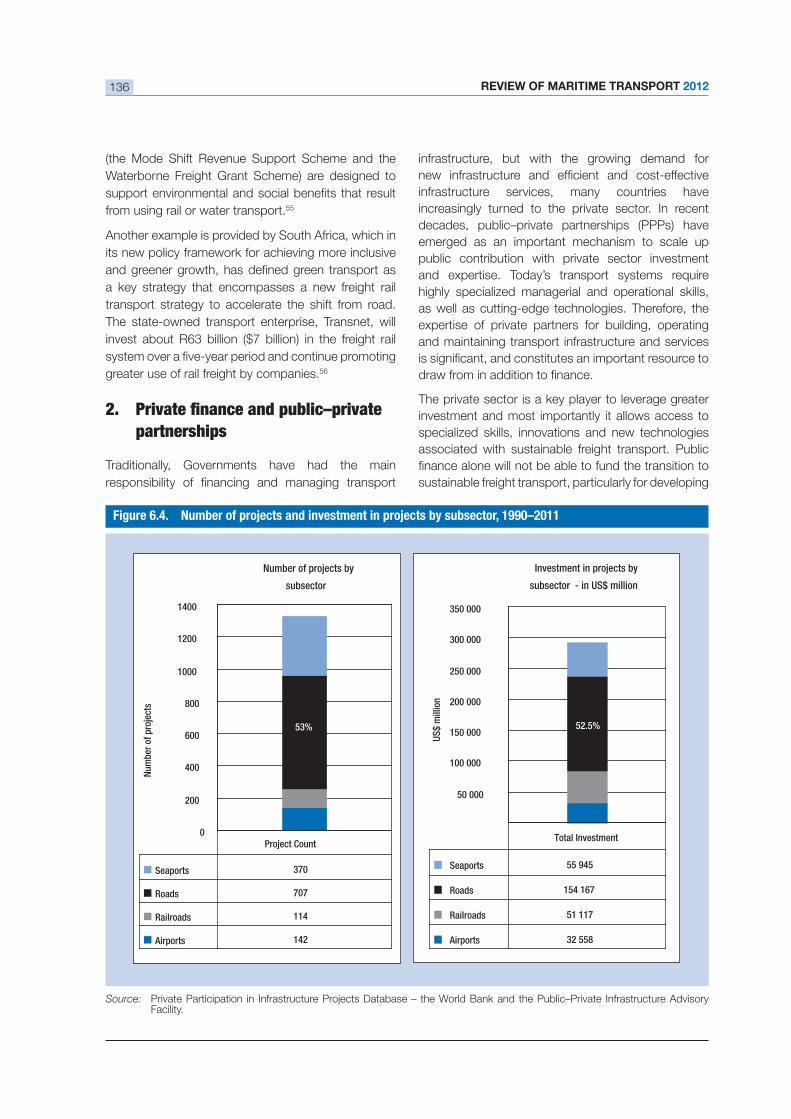
REVIEW OF MARITIME TRANSPORT 2012136
(the Mode Shift Revenue Support Scheme and the
Waterborne Freight Grant Scheme) are designed to
from using rail or water transport.55
Another example is provided by South Africa, which in
its new policy framework for achieving more inclusive
a key strategy that encompasses a new freight rail
transport strategy to accelerate the shift from road.
The state-owned transport enterprise, Transnet, will
greater use of rail freight by companies.56
partnerships
Traditionally, Governments have had the main
infrastructure, but with the growing demand for
infrastructure services, many countries have
increasingly turned to the private sector. In recent
decades, public–private partnerships (PPPs) have
emerged as an important mechanism to scale up
public contribution with private sector investment
highly specialized managerial and operational skills,
as well as cutting-edge technologies. Therefore, the
expertise of private partners for building, operating
and maintaining transport infrastructure and services
The private sector is a key player to leverage greater
investment and most importantly it allows access to
specialized skills, innovations and new technologies
associated with sustainable freight transport. Public
sustainable freight transport, particularly for developing
53%53%
0
200
400
600
800
1000
1200
1400
Num
ber o
f pro
ject
s
Seaports 370
Roads 707
Railroads 114
Airports 142
Project Count
52.5%52.5%
50 000
100 000
150 000
200 000
250 000
300 000
350 000
US$
mill
ion
55 945
154 167
51 117
32 558
Total Investment
Number of projects by
subsector
Investment in projects by
subsector - in US$ million
Seaports
Roads
Railroads
Airports
Source: Facility.
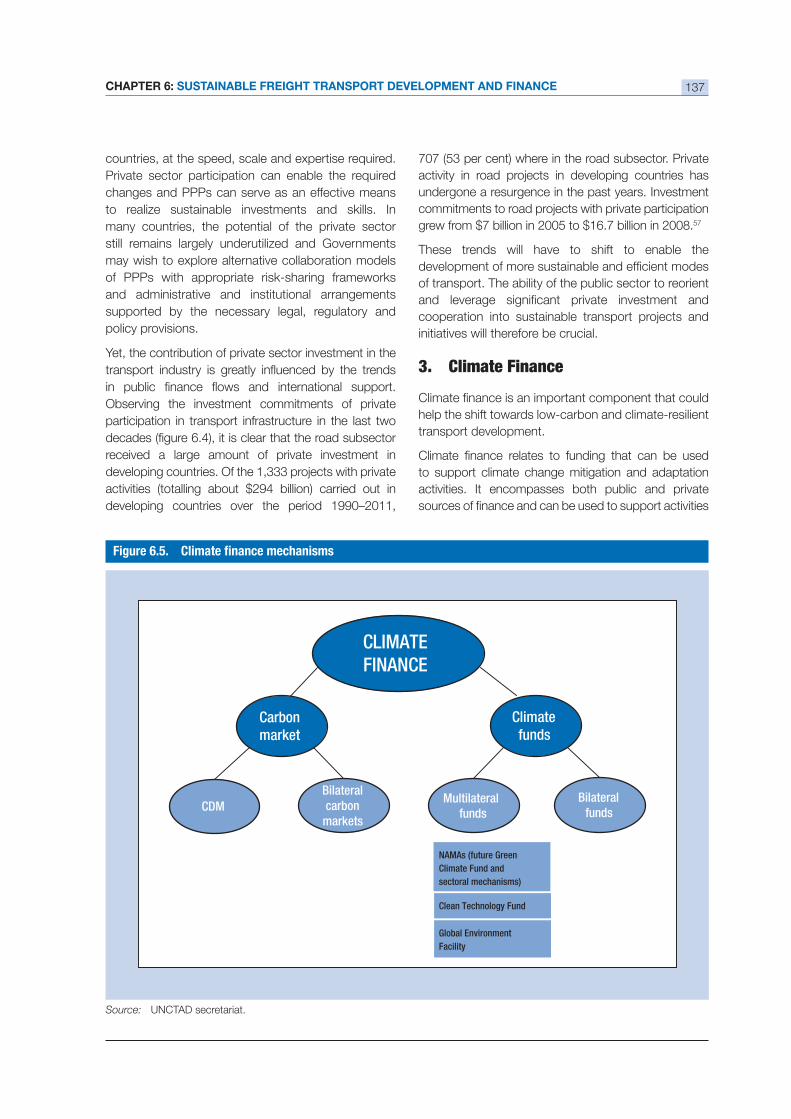
CHAPTER 6: SUSTAINABLE FREIGHT TRANSPORT DEVELOPMENT AND FINANCE 137
changes and PPPs can serve as an effective means
to realize sustainable investments and skills. In
many countries, the potential of the private sector
still remains largely underutilized and Governments
may wish to explore alternative collaboration models
of PPPs with appropriate risk-sharing frameworks
and administrative and institutional arrangements
supported by the necessary legal, regulatory and
policy provisions.
Yet, the contribution of private sector investment in the
Observing the investment commitments of private
participation in transport infrastructure in the last two
received a large amount of private investment in
developing countries over the period 1990–2011,
undergone a resurgence in the past years. Investment
57
These trends will have to shift to enable the
of transport. The ability of the public sector to reorient
initiatives will therefore be crucial.
3. Climate Finance
help the shift towards low-carbon and climate-resilient
transport development.
to support climate change mitigation and adaptation
activities. It encompasses both public and private
CLIMATEFINANCE
Carbonmarket
Climate funds
CDMBilateral carbon
markets
Multilateral funds
Bilateral funds
NAMAs (future GreenClimate Fund and sectoral mechanisms)
Clean Technology Fund
Global EnvironmentFacility
Source: UNCTAD secretariat.
REVIEW OF MARITIME TRANSPORT 2012138
in all sectors of the economy in both developed and
can be used to help achieve the shift and scale-
up of funding for sustainable low-carbon freight
transport that directly contributes to the enactment of
sustainable development on a larger scale. Yet, climate
and environmental concerns are not usually given all
the necessary attention when evaluating transport
There are, however, several sources and mechanisms
grouped into two categories: the carbon market and
climate funds.
Carbon markets
Carbon markets are mechanisms that provide an
incentive to reduce GHG emissions by creating a market
for emissions allowances and credits. The carbon market
the clean development mechanism – CDM (regulatory/
compliance market) and voluntary markets.58 The CDM
development in developing countries, and also generate
real and additional emission savings.
were related to transport as of January 2012 (11 of
which had been registered).59
expected to reduce 5.5 megatons CO2
reductions of the current CDM pipeline.60 The
barriers which currently prevent the application
the size, scope and complexity of the sector itself.
The narrow approach to measuring the mitigation
potential of policy actions (and the associated
incremental costs), together with the lack of data to
of mitigation actions, limits the transport sector’s
within the context of the ongoing negotiations on
is becoming increasingly concentrated on tools that
can be applied to the transport sector, something
that the existing instruments such as CDM have not
succeeded in covering (see box 6.1).
Climate funds for sustainable freighttransportation
be used to address the adaptation and mitigation of
the climate change impacts activities. Recently, there
has been a proliferation of climate fund initiatives
(multilateral and bilateral), which seek to mitigate
climate risks and help the most vulnerable adapt to
to transport, several of the existing climate funds
can be used for the mitigation of GHG emissions or
to reduce the negative effect of impacts activities in
the transport sector. These include, for example, the
Global Environment Facilities, the Clean Technology
Fund, the Global Climate Change Alliance, the Inter-
American Development Bank (IDB) Sustainable
Environmental Climate Change Initiative, the ADB
Climate Change Fund, and the ADB Clean Energy
Fund. Many of the funds include a sunset clause that
stipulates the necessary steps that will be taken to
architecture takes effect (see box 6.2). It is, however,
far from clear what the future funding landscape will
look like in the post-2012 regime.
be an important tool to support activities targeted to
Within a post-2012 framework, mitigation actions in transport in developing countries are likely to fall under the umbrella of
Source: United Nations Environment Programme, http://www.unep.org/greeneconomy/Portals/88/documents/ger/GER_10_Transport.pdf.
CHAPTER 6: SUSTAINABLE FREIGHT TRANSPORT DEVELOPMENT AND FINANCE 139
Box 6.2. The United Nations Green Climate Fund
The establishment of the GCF was decided at the sixteenth session of the Conference of the Parties (COP) to the UNFCCC,
action in developing countries.
The GCF is expected to start operating by 2014 and is intended to provide $100 billion each year by 2020 to help the
mitigation and adaptation activities of the world’s poorest countries. Private sector funds can also contribute to programmes.
countries to limit or reduce their GHG emissions and to adapt to the impacts of climate change. Application of the Fund will
take into account the needs of those developing countries particularly vulnerable to the adverse effects of climate change.
a country-driven approach and promote and strengthen engagement at the country level through effective involvement of
decided by the board.
The GCF will be a legally independent institution with its own separate secretariat and the World Bank as its interim trustee,
but functioning under the guidance of and accountable to the COP. Arrangements between the COP and the GCF are to
be concluded at COP 18 (in Doha, December 2012) to ensure that it is accountable to and functions under the guidance
of the COP.
contributing countries will be necessary to show broad political support for the GCF and secure its viability.
Source: GCF; for more information please refer to http://gcfund.net/home.html.
reducing GHG emissions. The range of eligible activities
is broad and encompasses supporting programmes,
However, given the unpredictable size of climate
funding to support large infrastructure, even by way
combination of sources and when the availability of
be used as a leveraging device that can help promote
sustainable freight transport in several ways, including
by awareness raising and capacity building, supporting
national assessment and policy reforms, implementing
pilot measures, identifying and implementing pilot
E. SUMMARIZING THE POINTS
Some key elements appear as outstanding in the
preceding discussions regarding the development
be summarized as follows:
fossil fuels and is responsible for an important part
of global GHG emissions and air pollution at local
and regional level. To achieve global sustainability
and attain the global goal of reducing emissions,
urgent actions are needed. These actions must
transform the way in which freight transport
rapid increase in all emissions from the transport
sector. This is particularly relevant for developing
countries, where freight transport activities will
grow substantially and transport systems are
being developed. Sustainable freight transport
has the potential to increase energy economy
non-renewable sources, costs and environmental
degradation.
(b) Promoting sustainable freight transport systems
and environmental considerations, and entails
environmentally friendly, low-carbon, and climate-
resilient transport systems. Developing sustainable
freight transport systems, based on the avoid–
shift–improve approach will help addressing in a
systemic fashion different transport and logistics
concerns and issues stemming from current and
future anticipated economic demands, and climate
change and environmental challenges. Reconciling
growth imperatives with climate protection and
environmental sustainability can be challenging for
REVIEW OF MARITIME TRANSPORT 2012140
transport costs, speed and reliability of services,
and the like) a number of options have the potential
to reduce GHG emissions from transport, while
at the same time tackling other environmental
concerns such as soil, water and air pollution, noise
and infrastructure degradation. Relevant options
include, for example, including reshaping transport
architecture and networks, rethinking supply chain
designs and logistics, balancing transport modes,
using cleaner technologies and ICT, switching to
low-carbon fuel sources, and the like.
(c) Developing sustainable freight transport systems,
based on an avoid–shift–improve approach can
help developing countries to leapfrog towards
a sustainable development path. By investing
in sustainable freight transport systems today,
developing countries will be better prepared to
reap future economic, social and environment
increased costs in the future, as Governments
and industries would eventually face additional
expenses to adapt to new circumstances and
adopt new transport systems, including new
technologies and operating practices.
(d) Although global freight transport has over recent
years made important progress regarding
compliance with sustainability imperatives,
including the efforts made to reduce negative
work is needed and should include comprehensive
and integrated approaches that will ensure
interdisciplinary and inter-institutional collaboration
at all levels (local, national, regional and global)
as well as a greater involvement of industry. In
this respect, coordinated and combined efforts
by both public and private sectors in key areas
(such as research and analysis, data collection,
policy and regulatory frameworks, technology
development) must be reinforced to achieve
of transport decarbonization, energy conservation,
of global trade and development, and the like.
to addressing the challenges associated with the
development and the implementation of sustainable
freight transport. While it will be important to draw
from existing experiences and best practices, each
country and region will have to formulate its own
approach that will take into account its local-regional
circumstances, conditions and opportunities, and
that will be consistent with its longer-term strategic
investments in transport infrastructure, services
provider, a co-sharer of risk or guarantor, or as
facilitator) and the private sectors (through PPPs)
devices that can help promote sustainable freight
transport in several ways, including by awareness
raising and capacity building, supporting national
assessment and policy reforms, implementing
pilot measures, identifying and implementing
different sources can be designed to complement
each other to drive the change towards sustainable
freight transport. Therefore, there is a clear need to
sources as well as to reorient and structure the
sources in accordance with the sustainability
criteria.
CHAPTER 6: SUSTAINABLE FREIGHT TRANSPORT DEVELOPMENT AND FINANCE 141
ENDNOTES
1
2
commitments and explore emerging challenges. The conference resulted in the agreed outcome “the future we want”, http://www.uncsd2012.org/thefuturewewant.html.
3
sustainable transport (paragraphs 132 and 133) and seventeen sustainable transport Voluntary Commitments were presented by various public and private stakeholders in Rio, http://www.uncsd2012.org/index.php?page=view&type=12&menu=153&nr=371&theme=17).
4 Associated Press (2011). United Nations says 2011 disasters were costliest ever. March 6 2011, http://www.newsday.com/news/world/un-says-2011-disasters-were-costliest-ever-1.3590598.
5 International Energy Agency (IEA) (2011). Climate change emissions. Prospect of limiting the global increase in temperature to 2ºC is getting bleaker. 30 May 2011.
6 CO2 is a gas derived from the combustion of fossil energies, which represents the bulk of anthropic GHG emissions
(about 55%). http://www.ifpenergiesnouvelles.com/.
7 The Geography of Transport Systems, chapter 8: Transport, Energy and Environment, The Environmental Impacts of Transportation, Dr. Jean-Paul Rodrigue and Dr. Claude Comtois.
8 Air pollution from Ground Transportation: An Assessment of Causes, Strategies and Tactics, and Proposed Actions for the International Community, by Roger Gorham. The Global Initiative on Transport Emissions: A Partnership of the United Nations and the World Bank Division for Sustainable Development Department of Economic and Social Affairs United Nations, 2002. http://www.un.org/esa/gite/csd/gorham.pdf.
9 http://www.who.int/en/ and http://press.iarc.fr/pr213_E.pdf.
10 Low Carbon Actions in Chinese Trucking Industry, Mr. Tan Xiaping, Ministry of Transport, Green Freight China Seminar, May 2011, http://cleanairinitiative.org/portal/node/7313.
11 The broader scope of sustainability in freight includes safety and security, water pollution, HIV/Aids, and the like.
12 Key World Energy Statistics, 2012, IEA.
13 International Energy Outlook 2011, The United States Energy Information Administration, http://www.eia.gov/forecasts/ieo/highlights.cfm.
14 http://www.delivering-tomorrow.com/mapping-a-decarbonization-path-for-logistics/.
15 (2012), p.19, http://www.exxonmobil.com/Corporate/energy_outlook_view.aspx.
16 According to the Fourth Assessment Report of the Intergovernmental Panel on Climate Change (IPCC) - 2007.Cambridge University Press, Cambridge, United Kingdom and New York, NY, USA.
17 Logistics & Supply Chain Industry Agenda Council Final Report 2010–2011, Decarbonizing Global Logistics:The Challenges Ahead, World Economic Forum. p. 10, http://www3.weforum.org/docs/WEF_GAC_LogisticsSupplyChain_Report_2010-11.pdf.
18 According to the IEA CO2 Emissions from Fuel Combustion - 2011 edition.
19 http://www.ipcc.ch/ipccreports/sres/aviation/126.htm#img86.
20 Partnership on Sustainable Low Carbon Transport 2010 Policy Options for consideration by the Commission on Sustainable Development 18th Session, 3-14 May, 2010, http://www.un.org/esa/dsd/resources/res_pdfs/csd-18/csd18_2010_bp12.pdf .
21 http://www.unep.org/geo/pdfs/geo5/RS_ .
22 World Development Report 2010: Development and Climate Change. World Bank. Washington DC: 2010.
23 The “avoid, shift and improve” approach to climate change mitigation, as introduced in Dalkmann and Brannigan (2007) and endorsed in the Common Policy Framework on Transport and Climate Change (Leather et al, 2009) aims to reduce GHG emissions and energy consumption and promote sustainable transport, also presented in Rethinking Transport and Climate Change, by James Leather and the Clean Air Initiative for Asian Cities Centre, ADB, December 2009.
24 International Maritime Organization second GHG study 2009, http://www.imo.org/blast/blastDataHelper.asp?data_id.
25 http://www.shippingandco2.org/CO2%20Flyer.pdf.
26 International Chamber of Shipping (ICS), Annual Review 2012. 2012.
27 Ibid. See also Simon Bennett, ICS, presentation at UNCTAD Ad Hoc Expert Meeting 2011.
REVIEW OF MARITIME TRANSPORT 2012142
28 Geerlings H and van Duin R (2010). A new method for assessing CO2-emissions from container terminals: a promising
approach applied in Rotterdam. J. Cleaner Production, 11 November 2010.
29 Ibid. The same study emphasizes that one of the most effective measures for CO2 reduction is undoubtedly the
adaptation of the terminal layout as in the example of the Rotterdam Shortsea Terminal. This makes it possible to reduce the CO
2 emissions of the current terminals by nearly 70 per cent.
30
services at a port.
31 Such as the research paper where goods are imported by suppliers to UK retailers? conducted by the University of Southampton (summary
), and the research
by the Logistics Research Centre, Heriot-Watt University , by Prof. Alan McKinnon, Dr. Dong-Wook Song, and Mr. Rob Woolford, http://www.fta.co.uk/export/sites/fta/_galleries/downloads/international_supply_chain/decarbonising_
, including article: http://www.portstrategy.com/features101/port-operations/port-services/portcentric-logistics/portcentric-steps-up.
32 , World Economic Forum.
33
supply chain savings for global businesses through reduced transport costs created by having warehousing at the port of entry, closer to key United Kingdom consumer markets: http://www.4-traders.com/DP-WORLD-LLC-6500032/news/DP-World-LLC-Europe-s-Largest-Port-Centric-Logistics-Park-Appoints-Property-Agents-14298108/.
34 World Business Council for Sustainable Development (WBCSD) (2004). Mobility 2030: Meeting the Challenges to Sustainability http://www.wbcsd.org/web/publications/mobility/mobility-full.pdf.
35 Ibid.
36 http://ec.europa.eu/transport/strategies/doc/2011_white_paper/white-paper-illustrated-brochure_en.pdf.
37 “Sustainable Freight Transport Policy in Indonesia”, by Bambang Susantonneo Ph.D., Vice Minister for Transportation Republic of Indonesia, at the UNCTAD XIII side event: Paving the Way for Sustainable Freight Transport, Doha, 25 April 2012, http://unctadxiii.org/en/Presentation/uxiii2012sdSFT_SUSANTONNEO.pdf.
38 Introduction to the Development of Dry Ports in Asia, United Nations Economic and Social Commission for Asia and http://www.unescap.org/ttdw/common/Meetings/TIS/EGM-DryPorts-Bangkok/TD_
EGM_3.pdf), and Emerging issues in transport: Sustainable transport development, UNESCAP Ministerial Conference on Transport, Second session Bangkok, 12-16 March 2012, (http://www.unescap.org/ttdw/MCT2011/MCT/MCT2-7E.pdf).
39 For example, the “carbon footprint analysis” conducted by Dedicated Freight Corridor Corporation for the Eastern corridor in India shows that moving goods by rail would be much more environment friendly despite the higher load it would have to handle. The corridor is expected to generate 2.25 times less carbon emissions when compared to a scenario where the freight is transported through existing roads network.
40 “Unlocking Economic Values”, Mr. Arvind Mayaram, IAS Additional Secretary Financial Advisor, India, UNCTAD Multi-year Expert Meeting on Transport and Trade Facilitation, Geneva, December 2011, http://archive.unctad.org/sections/wcmu/docs/cimem1_4th_26_en.pdf.
41 Nationally appropriate mitigation action (NAMA) refers to a set of policies and actions that countries undertake as part of a commitment to reduce greenhouse gas emissions. The term recognizes that countries may take different
to reduce emissions. The policy framework around NAMAs is still being developed but NAMAs are set to become a building block for a future climate agreement.
42 NAMA Database, http://namadatabase.org/index.php/Transport.
43 Examples of relevant studies mainly relate to those conducted by Professor Alan McKinnon, Kühne Logistics University in Hamburg, including: Mapping a Decarbonization Path for Logistics 2012; Green logistics: the carbon agenda, Vol. 6, Issue 3 No 1, logfourm, 2010; The role of Government in promoting green logistics 2010; The present and future
http://www.the-klu.org/alan-mckinnon-publications/.
44 Smart 2020: Enabling the low carbon economy in the information age, a report by The Climate Group on behalf of the Global eSustainability Initiative (GeSI), 2008, .
45 The above three examples originate from the presentation on “Best European Practice in Freight & Logistics”, by Dr. Jürgen Perschon, Executive Director, European Institute for Sustainable Transport (EURIST), Germany, at the Green Logistics Conference Singapore, 31 August 312011 (http://eurist.info/app/download/5782132958/GreenLogisticsSin.pdf) . More examples can be found at http://www.eia-ngo.com/wp-content/uploads/2010/01/Best-Practice_Bestlog.pdf.
CHAPTER 6: SUSTAINABLE FREIGHT TRANSPORT DEVELOPMENT AND FINANCE 143
46 APUs avoid the need for idling of a truck‘s base engine and consist of a small diesel engine that provides power for an HVAC system and electrical outlets that service the sleeper cab. Example from “Best practices in green freight for an environmentally sustainable road freight sector in Asia”, documents/BGP-EST5A_Green_Freight_Best_Practices_CAI-Asia-PunteGotaPeng.pdf.
47 .
48 Ibid.
49 European Chemical Industry Council (CEFIC).
measuring%20and%20managing%20CO2%20emissions%20from%20transport%20operations%20Final%2030.03.2011.pdf2012 on Measuring and Managing CO2 Emissions of European Chemical Transport, Documents/Media%20Center/News/McKinnon-Report-Final-230610.pdf.
50 http://cleanairinitiative and http://www.greenfreightandlogistics.org/assets/Uploads/asianconnections.pdf.
51 http://www.uncsd2012.org/index.php?page=view&type=1006&menu=153&nr=517.
52
by K Sakamoto, H Dalkmann and D Palmer, 2010, http://www.itdp.org/documents/A_Paradigm_Shift_toward_Sustainable_Transport.pdf.
53 International Monetary Fund (2010). Government Finance Statistics. http://www.imf.org/external/pubs/ft/gfs/manual/gfs.htm, from http://www.itdp.org/documents/A_Paradigm_Shift_toward_Sustainable_Transport.pdf.
54 http://www.itdp.org/documents/A_Paradigm_Shift_toward_Sustainable_Transport.pdf.
55 Mode Shift Revenue Support (MSRS) assists companies with the operating costs associated with running rail freight transport instead of road (where rail is more expensive than road). It is designed to facilitate and support modal shift,
scheme assists companies with the operating costs, for up to three years, associated with running water freight transport instead of road (where water is more expensive than road). http://www.dft.gov.uk/topics/freight/grants.
56 http://www.moneyweb.co.za/mw/view/mw/en/page295023?oid=557289&sn=2009+Detail.
57 http://ppi.worldbank.org/features/October2009/didyouknowOctober2009.aspx.
58 The United Nations Kyoto protocol established binding GHG emission reduction targets for 37 industrialized countries
implemented in developing countries (which have no GHG limitation commitments under the Kyoto Protocol). JI
countries to help meet their domestic emission reduction targets.
59
60 From UNEP Risoe CDM/JI Pipeline Analysis and Database, .

......................................... 146
............................................. 150
............................................... 155
............................................... 160
1 January 2012 ............................................................................................................... 165
.............................................................................................. 169
............................................................................................... 173
STATISTICAL ANNEX
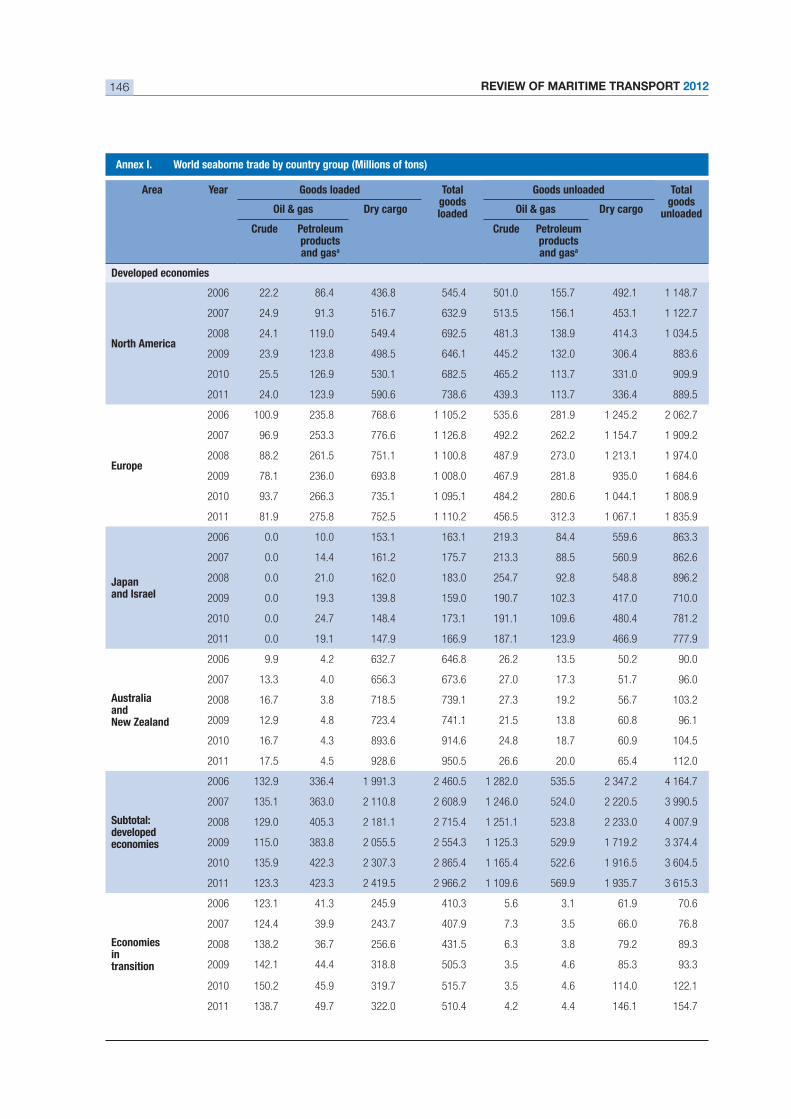
REVIEW OF MARITIME TRANSPORT 2012146
Area Year Goods loaded Total goods loaded
Goods unloaded Total goods
unloadedOil & gas Dry cargo Oil & gas Dry cargo
Crude Petroleum products and gasa
Crude Petroleum products and gasa
Developed economies
North America
2006 22.2 86.4 436.8 545.4 501.0 155.7 492.1 1 148.7
2007 24.9 91.3 516.7 632.9 513.5 156.1 453.1 1 122.7
2008 24.1 119.0 549.4 692.5 481.3 138.9 414.3 1 034.5
2009 23.9 123.8 498.5 646.1 445.2 132.0 306.4 883.6
2010 25.5 126.9 530.1 682.5 465.2 113.7 331.0 909.9
2011 24.0 123.9 590.6 738.6 439.3 113.7 336.4 889.5
Europe
2006 100.9 235.8 768.6 1 105.2 535.6 281.9 1 245.2 2 062.7
2007 96.9 253.3 776.6 1 126.8 492.2 262.2 1 154.7 1 909.2
2008 88.2 261.5 751.1 1 100.8 487.9 273.0 1 213.1 1 974.0
2009 78.1 236.0 693.8 1 008.0 467.9 281.8 935.0 1 684.6
2010 93.7 266.3 735.1 1 095.1 484.2 280.6 1 044.1 1 808.9
2011 81.9 275.8 752.5 1 110.2 456.5 312.3 1 067.1 1 835.9
Japanand Israel
2006 0.0 10.0 153.1 163.1 219.3 84.4 559.6 863.3
2007 0.0 14.4 161.2 175.7 213.3 88.5 560.9 862.6
2008 0.0 21.0 162.0 183.0 254.7 92.8 548.8 896.2
2009 0.0 19.3 139.8 159.0 190.7 102.3 417.0 710.0
2010 0.0 24.7 148.4 173.1 191.1 109.6 480.4 781.2
2011 0.0 19.1 147.9 166.9 187.1 123.9 466.9 777.9
AustraliaandNew Zealand
2006 9.9 4.2 632.7 646.8 26.2 13.5 50.2 90.0
2007 13.3 4.0 656.3 673.6 27.0 17.3 51.7 96.0
2008 16.7 3.8 718.5 739.1 27.3 19.2 56.7 103.2
2009 12.9 4.8 723.4 741.1 21.5 13.8 60.8 96.1
2010 16.7 4.3 893.6 914.6 24.8 18.7 60.9 104.5
2011 17.5 4.5 928.6 950.5 26.6 20.0 65.4 112.0
Subtotal:developedeconomies
2006 132.9 336.4 1 991.3 2 460.5 1 282.0 535.5 2 347.2 4 164.7
2007 135.1 363.0 2 110.8 2 608.9 1 246.0 524.0 2 220.5 3 990.5
2008 129.0 405.3 2 181.1 2 715.4 1 251.1 523.8 2 233.0 4 007.9
2009 115.0 383.8 2 055.5 2 554.3 1 125.3 529.9 1 719.2 3 374.4
2010 135.9 422.3 2 307.3 2 865.4 1 165.4 522.6 1 916.5 3 604.5
2011 123.3 423.3 2 419.5 2 966.2 1 109.6 569.9 1 935.7 3 615.3
Economiesintransition
2006 123.1 41.3 245.9 410.3 5.6 3.1 61.9 70.6
2007 124.4 39.9 243.7 407.9 7.3 3.5 66.0 76.8
2008 138.2 36.7 256.6 431.5 6.3 3.8 79.2 89.3
2009 142.1 44.4 318.8 505.3 3.5 4.6 85.3 93.3
2010 150.2 45.9 319.7 515.7 3.5 4.6 114.0 122.1
2011 138.7 49.7 322.0 510.4 4.2 4.4 146.1 154.7
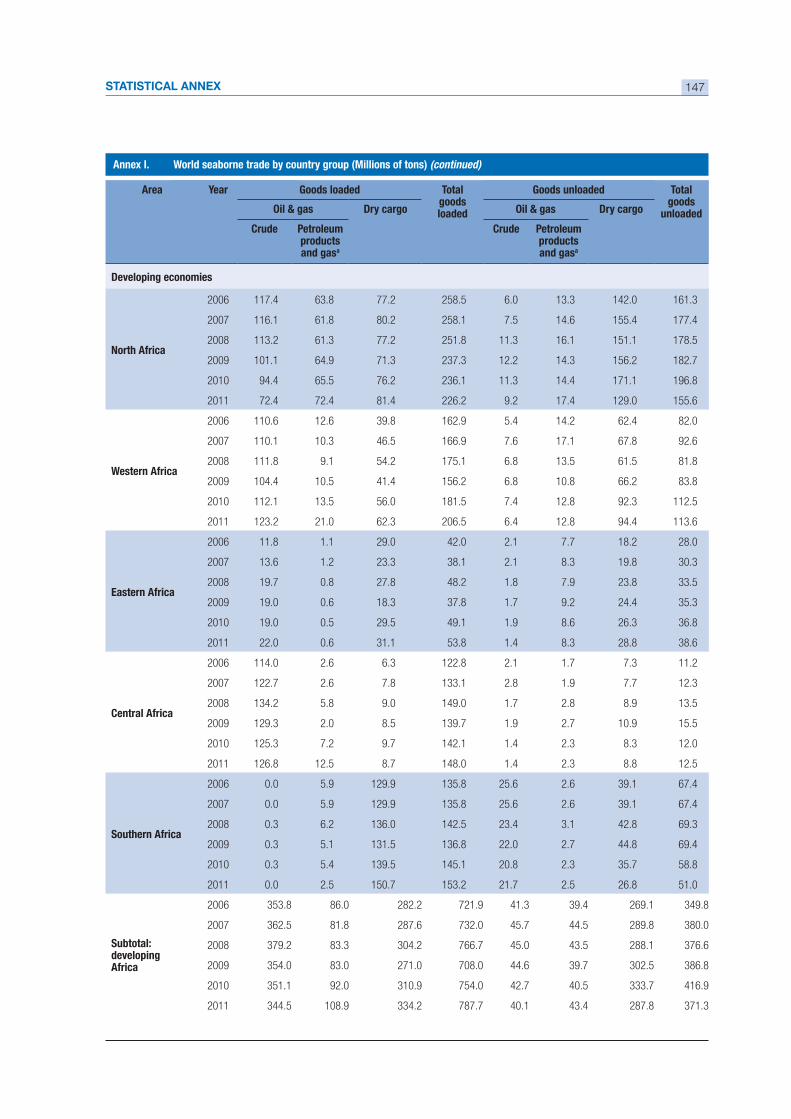
STATISTICAL ANNEX 147
(continued)
Area Year Goods loaded Total goods loaded
Goods unloaded Total goods
unloadedOil & gas Dry cargo Oil & gas Dry cargo
Crude Petroleum products and gasa
Crude Petroleum products and gasa
Developing economies
North Africa
2006 117.4 63.8 77.2 258.5 6.0 13.3 142.0 161.3
2007 116.1 61.8 80.2 258.1 7.5 14.6 155.4 177.4
2008 113.2 61.3 77.2 251.8 11.3 16.1 151.1 178.5
2009 101.1 64.9 71.3 237.3 12.2 14.3 156.2 182.7
2010 94.4 65.5 76.2 236.1 11.3 14.4 171.1 196.8
2011 72.4 72.4 81.4 226.2 9.2 17.4 129.0 155.6
Western Africa
2006 110.6 12.6 39.8 162.9 5.4 14.2 62.4 82.0
2007 110.1 10.3 46.5 166.9 7.6 17.1 67.8 92.6
2008 111.8 9.1 54.2 175.1 6.8 13.5 61.5 81.8
2009 104.4 10.5 41.4 156.2 6.8 10.8 66.2 83.8
2010 112.1 13.5 56.0 181.5 7.4 12.8 92.3 112.5
2011 123.2 21.0 62.3 206.5 6.4 12.8 94.4 113.6
Eastern Africa
2006 11.8 1.1 29.0 42.0 2.1 7.7 18.2 28.0
2007 13.6 1.2 23.3 38.1 2.1 8.3 19.8 30.3
2008 19.7 0.8 27.8 48.2 1.8 7.9 23.8 33.5
2009 19.0 0.6 18.3 37.8 1.7 9.2 24.4 35.3
2010 19.0 0.5 29.5 49.1 1.9 8.6 26.3 36.8
2011 22.0 0.6 31.1 53.8 1.4 8.3 28.8 38.6
Central Africa
2006 114.0 2.6 6.3 122.8 2.1 1.7 7.3 11.2
2007 122.7 2.6 7.8 133.1 2.8 1.9 7.7 12.3
2008 134.2 5.8 9.0 149.0 1.7 2.8 8.9 13.5
2009 129.3 2.0 8.5 139.7 1.9 2.7 10.9 15.5
2010 125.3 7.2 9.7 142.1 1.4 2.3 8.3 12.0
2011 126.8 12.5 8.7 148.0 1.4 2.3 8.8 12.5
Southern Africa
2006 0.0 5.9 129.9 135.8 25.6 2.6 39.1 67.4
2007 0.0 5.9 129.9 135.8 25.6 2.6 39.1 67.4
2008 0.3 6.2 136.0 142.5 23.4 3.1 42.8 69.3
2009 0.3 5.1 131.5 136.8 22.0 2.7 44.8 69.4
2010 0.3 5.4 139.5 145.1 20.8 2.3 35.7 58.8
2011 0.0 2.5 150.7 153.2 21.7 2.5 26.8 51.0
Subtotal:developingAfrica
2006 353.8 86.0 282.2 721.9 41.3 39.4 269.1 349.8
2007 362.5 81.8 287.6 732.0 45.7 44.5 289.8 380.0
2008 379.2 83.3 304.2 766.7 45.0 43.5 288.1 376.6
2009 354.0 83.0 271.0 708.0 44.6 39.7 302.5 386.8
2010 351.1 92.0 310.9 754.0 42.7 40.5 333.7 416.9
2011 344.5 108.9 334.2 787.7 40.1 43.4 287.8 371.3
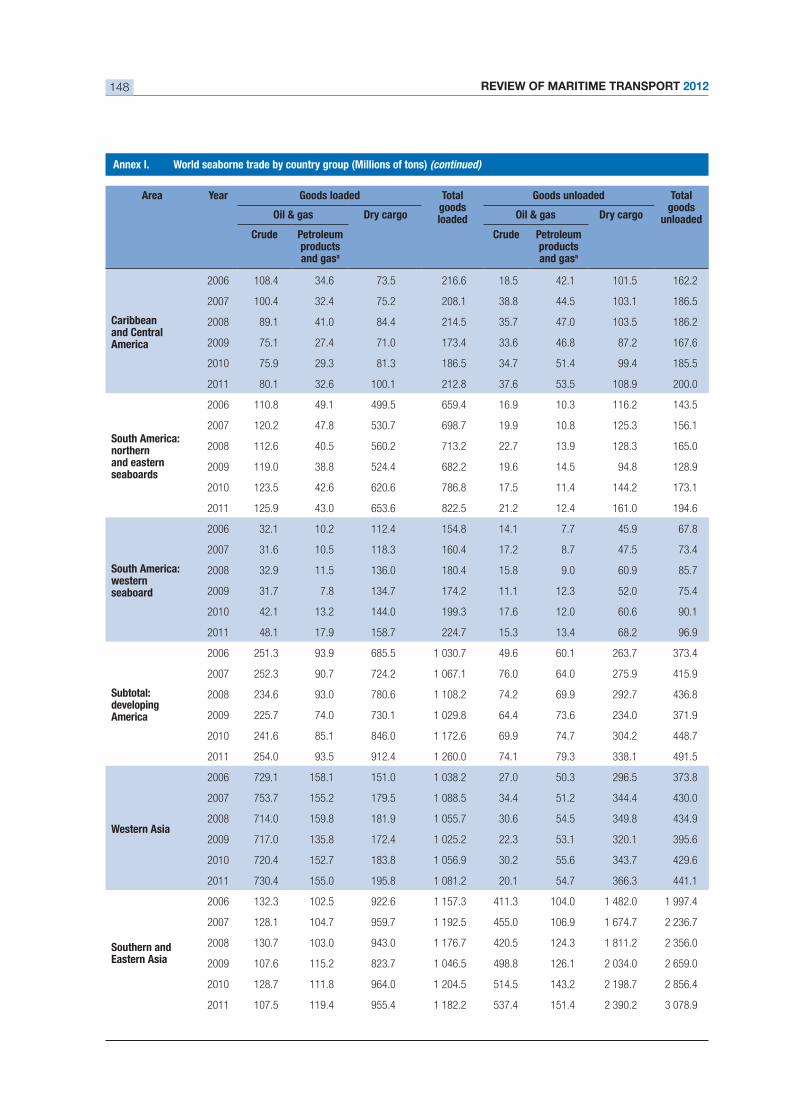
REVIEW OF MARITIME TRANSPORT 2012148
Area Year Goods loaded Total goods loaded
Goods unloaded Total goods
unloadedOil & gas Dry cargo Oil & gas Dry cargo
Crude Petroleum products and gasa
Crude Petroleum products and gasa
Caribbeanand Central America
2006 108.4 34.6 73.5 216.6 18.5 42.1 101.5 162.2
2007 100.4 32.4 75.2 208.1 38.8 44.5 103.1 186.5
2008 89.1 41.0 84.4 214.5 35.7 47.0 103.5 186.2
2009 75.1 27.4 71.0 173.4 33.6 46.8 87.2 167.6
2010 75.9 29.3 81.3 186.5 34.7 51.4 99.4 185.5
2011 80.1 32.6 100.1 212.8 37.6 53.5 108.9 200.0
South America: northernand eastern seaboards
2006 110.8 49.1 499.5 659.4 16.9 10.3 116.2 143.5
2007 120.2 47.8 530.7 698.7 19.9 10.8 125.3 156.1
2008 112.6 40.5 560.2 713.2 22.7 13.9 128.3 165.0
2009 119.0 38.8 524.4 682.2 19.6 14.5 94.8 128.9
2010 123.5 42.6 620.6 786.8 17.5 11.4 144.2 173.1
2011 125.9 43.0 653.6 822.5 21.2 12.4 161.0 194.6
South America: westernseaboard
2006 32.1 10.2 112.4 154.8 14.1 7.7 45.9 67.8
2007 31.6 10.5 118.3 160.4 17.2 8.7 47.5 73.4
2008 32.9 11.5 136.0 180.4 15.8 9.0 60.9 85.7
2009 31.7 7.8 134.7 174.2 11.1 12.3 52.0 75.4
2010 42.1 13.2 144.0 199.3 17.6 12.0 60.6 90.1
2011 48.1 17.9 158.7 224.7 15.3 13.4 68.2 96.9
Subtotal:developingAmerica
2006 251.3 93.9 685.5 1 030.7 49.6 60.1 263.7 373.4
2007 252.3 90.7 724.2 1 067.1 76.0 64.0 275.9 415.9
2008 234.6 93.0 780.6 1 108.2 74.2 69.9 292.7 436.8
2009 225.7 74.0 730.1 1 029.8 64.4 73.6 234.0 371.9
2010 241.6 85.1 846.0 1 172.6 69.9 74.7 304.2 448.7
2011 254.0 93.5 912.4 1 260.0 74.1 79.3 338.1 491.5
Western Asia
2006 729.1 158.1 151.0 1 038.2 27.0 50.3 296.5 373.8
2007 753.7 155.2 179.5 1 088.5 34.4 51.2 344.4 430.0
2008 714.0 159.8 181.9 1 055.7 30.6 54.5 349.8 434.9
2009 717.0 135.8 172.4 1 025.2 22.3 53.1 320.1 395.6
2010 720.4 152.7 183.8 1 056.9 30.2 55.6 343.7 429.6
2011 730.4 155.0 195.8 1 081.2 20.1 54.7 366.3 441.1
Southern and Eastern Asia
2006 132.3 102.5 922.6 1 157.3 411.3 104.0 1 482.0 1 997.4
2007 128.1 104.7 959.7 1 192.5 455.0 106.9 1 674.7 2 236.7
2008 130.7 103.0 943.0 1 176.7 420.5 124.3 1 811.2 2 356.0
2009 107.6 115.2 823.7 1 046.5 498.8 126.1 2 034.0 2 659.0
2010 128.7 111.8 964.0 1 204.5 514.5 143.2 2 198.7 2 856.4
2011 107.5 119.4 955.4 1 182.2 537.4 151.4 2 390.2 3 078.9
(continued)
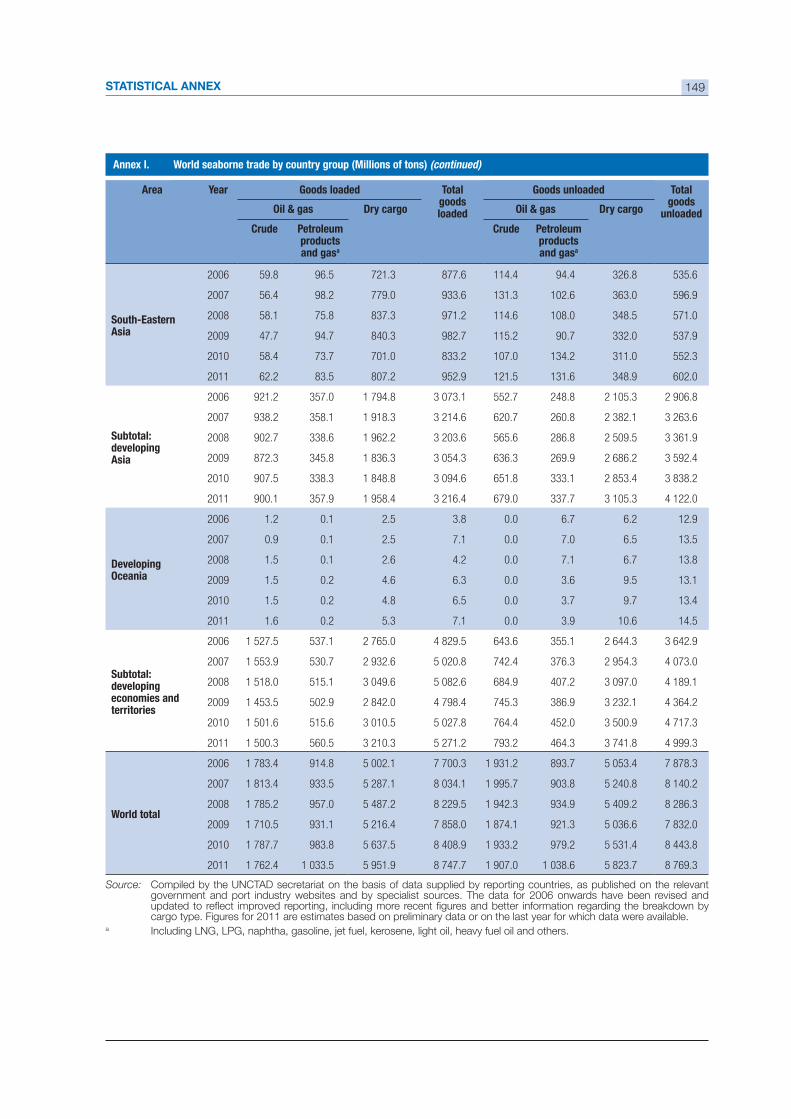
STATISTICAL ANNEX 149
Area Year Goods loaded Total goods loaded
Goods unloaded Total goods
unloadedOil & gas Dry cargo Oil & gas Dry cargo
Crude Petroleum products and gasa
Crude Petroleum products and gasa
South-EasternAsia
2006 59.8 96.5 721.3 877.6 114.4 94.4 326.8 535.6
2007 56.4 98.2 779.0 933.6 131.3 102.6 363.0 596.9
2008 58.1 75.8 837.3 971.2 114.6 108.0 348.5 571.0
2009 47.7 94.7 840.3 982.7 115.2 90.7 332.0 537.9
2010 58.4 73.7 701.0 833.2 107.0 134.2 311.0 552.3
2011 62.2 83.5 807.2 952.9 121.5 131.6 348.9 602.0
Subtotal:developingAsia
2006 921.2 357.0 1 794.8 3 073.1 552.7 248.8 2 105.3 2 906.8
2007 938.2 358.1 1 918.3 3 214.6 620.7 260.8 2 382.1 3 263.6
2008 902.7 338.6 1 962.2 3 203.6 565.6 286.8 2 509.5 3 361.9
2009 872.3 345.8 1 836.3 3 054.3 636.3 269.9 2 686.2 3 592.4
2010 907.5 338.3 1 848.8 3 094.6 651.8 333.1 2 853.4 3 838.2
2011 900.1 357.9 1 958.4 3 216.4 679.0 337.7 3 105.3 4 122.0
Developing Oceania
2006 1.2 0.1 2.5 3.8 0.0 6.7 6.2 12.9
2007 0.9 0.1 2.5 7.1 0.0 7.0 6.5 13.5
2008 1.5 0.1 2.6 4.2 0.0 7.1 6.7 13.8
2009 1.5 0.2 4.6 6.3 0.0 3.6 9.5 13.1
2010 1.5 0.2 4.8 6.5 0.0 3.7 9.7 13.4
2011 1.6 0.2 5.3 7.1 0.0 3.9 10.6 14.5
Subtotal: developing economies and territories
2006 1 527.5 537.1 2 765.0 4 829.5 643.6 355.1 2 644.3 3 642.9
2007 1 553.9 530.7 2 932.6 5 020.8 742.4 376.3 2 954.3 4 073.0
2008 1 518.0 515.1 3 049.6 5 082.6 684.9 407.2 3 097.0 4 189.1
2009 1 453.5 502.9 2 842.0 4 798.4 745.3 386.9 3 232.1 4 364.2
2010 1 501.6 515.6 3 010.5 5 027.8 764.4 452.0 3 500.9 4 717.3
2011 1 500.3 560.5 3 210.3 5 271.2 793.2 464.3 3 741.8 4 999.3
World total
2006 1 783.4 914.8 5 002.1 7 700.3 1 931.2 893.7 5 053.4 7 878.3
2007 1 813.4 933.5 5 287.1 8 034.1 1 995.7 903.8 5 240.8 8 140.2
2008 1 785.2 957.0 5 487.2 8 229.5 1 942.3 934.9 5 409.2 8 286.3
2009 1 710.5 931.1 5 216.4 7 858.0 1 874.1 921.3 5 036.6 7 832.0
2010 1 787.7 983.8 5 637.5 8 408.9 1 933.2 979.2 5 531.4 8 443.8
2011 1 762.4 1 033.5 5 951.9 8 747.7 1 907.0 1 038.6 5 823.7 8 769.3
(continued)
Source: Compiled by the UNCTAD secretariat on the basis of data supplied by reporting countries, as published on the relevantgovernment and port industry websites and by specialist sources. The data for 2006 onwards have been revised and
cargo type. Figures for 2011 are estimates based on preliminary data or on the last year for which data were available.a
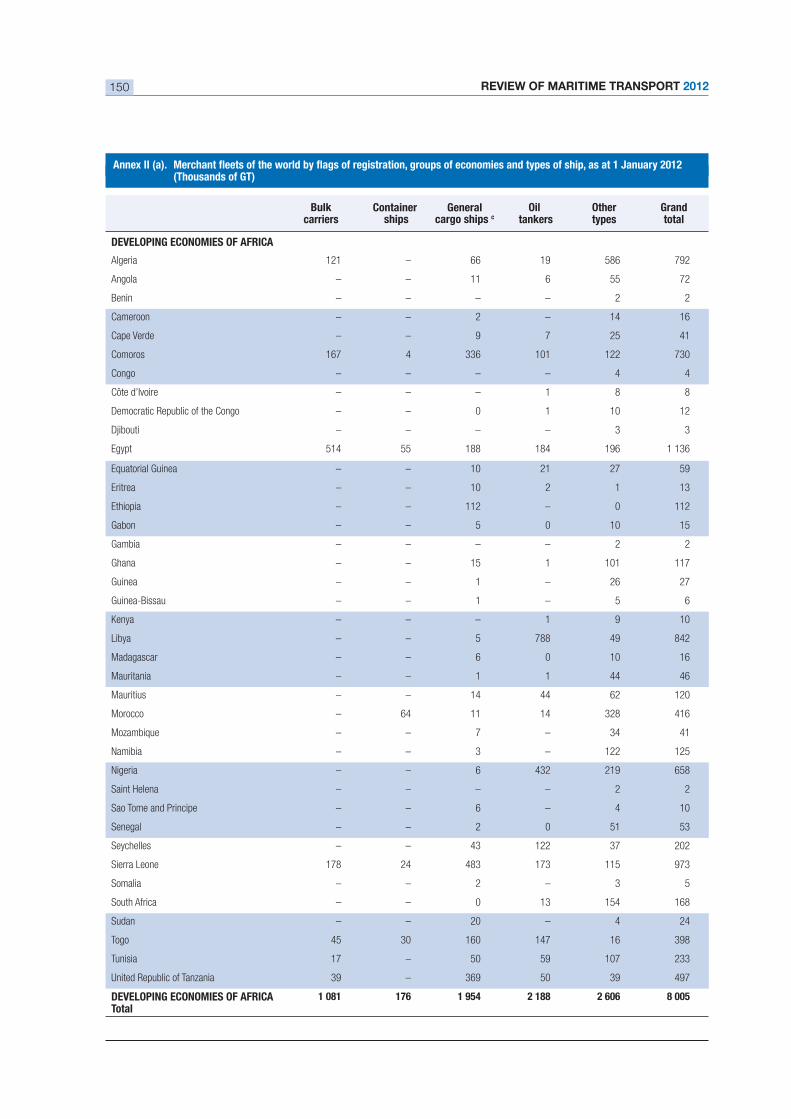
REVIEW OF MARITIME TRANSPORT 2012150
Bulk carriers
Container ships
General cargo ships c
Oil tankers
Othertypes
Grandtotal
Algeria 121 – 66 19 586 792
Angola – – 11 6 55 72
Benin – – – – 2 2
Cameroon – – 2 – 14 16
Cape Verde – – 9 7 25 41
Comoros 167 4 336 101 122 730
Congo – – – – 4 4
Côte d’Ivoire – – – 1 8 8
Democratic Republic of the Congo – – 0 1 10 12
Djibouti – – – – 3 3
Egypt 514 55 188 184 196 1 136
Equatorial Guinea – – 10 21 27 59
Eritrea – – 10 2 1 13
Ethiopia – – 112 – 0 112
Gabon – – 5 0 10 15
Gambia – – – – 2 2
Ghana – – 15 1 101 117
Guinea – – 1 – 26 27
– – 1 – 5 6
Kenya – – – 1 9 10
Libya – – 5 788 49 842
Madagascar – – 6 0 10 16
Mauritania – – 1 1 44 46
Mauritius – – 14 44 62 120
Morocco – 64 11 14 328 416
Mozambique – – 7 – 34 41
Namibia – – 3 – 122 125
Nigeria – – 6 432 219 658
Saint Helena – – – – 2 2
Sao Tome and Principe – – 6 – 4 10
Senegal – – 2 0 51 53
Seychelles – – 43 122 37 202
Sierra Leone 178 24 483 173 115 973
Somalia – – 2 – 3 5
South Africa – – 0 13 154 168
Sudan – – 20 – 4 24
Togo 45 30 160 147 16 398
Tunisia 17 – 50 59 107 233
United Republic of Tanzania 39 – 369 50 39 497
Total 1 081 176 1 954 2 188 2 606 8 005
(Thousands of GT)
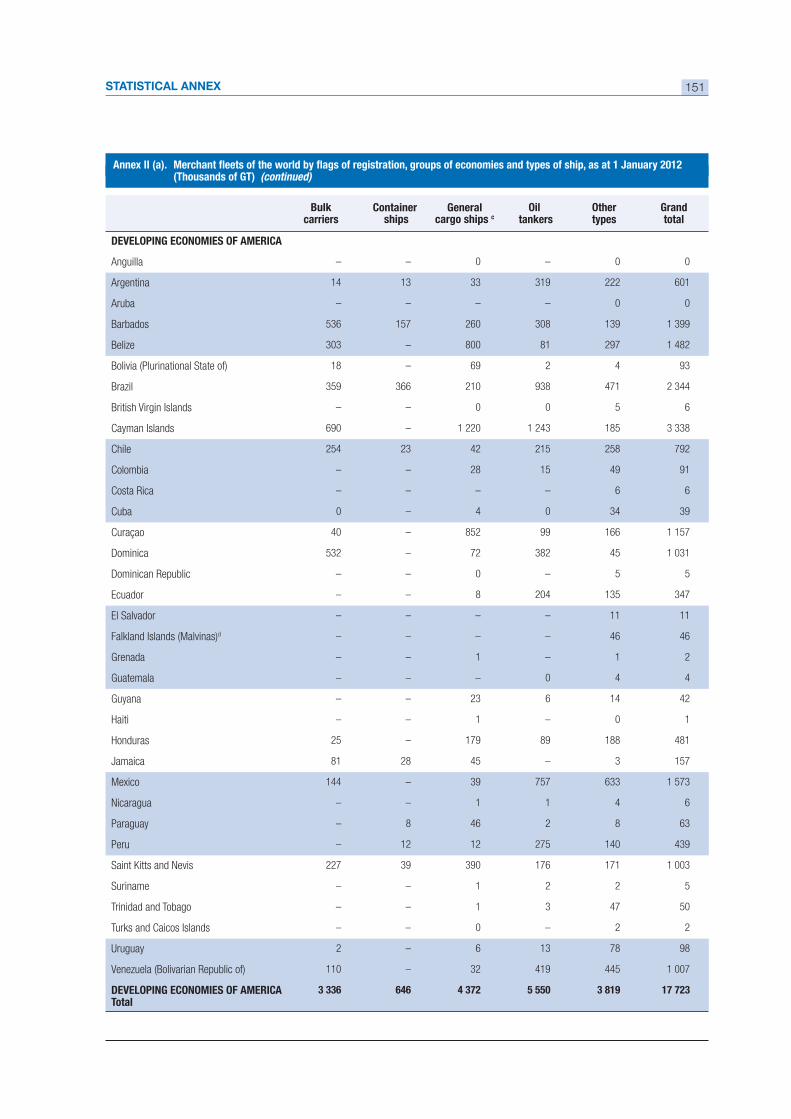
STATISTICAL ANNEX 151
(Thousands of GT) (continued)
Bulk carriers
Container ships
General cargo ships c
Oil tankers
Othertypes
Grandtotal
Anguilla – – 0 – 0 0
Argentina 14 13 33 319 222 601
Aruba – – – – 0 0
Barbados 536 157 260 308 139 1 399
Belize 303 – 800 81 297 1 482
Bolivia (Plurinational State of) 18 – 69 2 4 93
Brazil 359 366 210 938 471 2 344
British Virgin Islands – – 0 0 5 6
Cayman Islands 690 – 1 220 1 243 185 3 338
Chile 254 23 42 215 258 792
Colombia – – 28 15 49 91
Costa Rica – – – – 6 6
Cuba 0 – 4 0 34 39
Curaçao 40 – 852 99 166 1 157
Dominica 532 – 72 382 45 1 031
Dominican Republic – – 0 – 5 5
Ecuador – – 8 204 135 347
El Salvador – – – – 11 11
Falkland Islands (Malvinas)d – – – – 46 46
Grenada – – 1 – 1 2
Guatemala – – – 0 4 4
Guyana – – 23 6 14 42
Haiti – – 1 – 0 1
Honduras 25 – 179 89 188 481
Jamaica 81 28 45 – 3 157
Mexico 144 – 39 757 633 1 573
Nicaragua – – 1 1 4 6
Paraguay – 8 46 2 8 63
Peru – 12 12 275 140 439
Saint Kitts and Nevis 227 39 390 176 171 1 003
Suriname – – 1 2 2 5
Trinidad and Tobago – – 1 3 47 50
Turks and Caicos Islands – – 0 – 2 2
Uruguay 2 – 6 13 78 98
Venezuela (Bolivarian Republic of) 110 – 32 419 445 1 007
Total 646 5 550
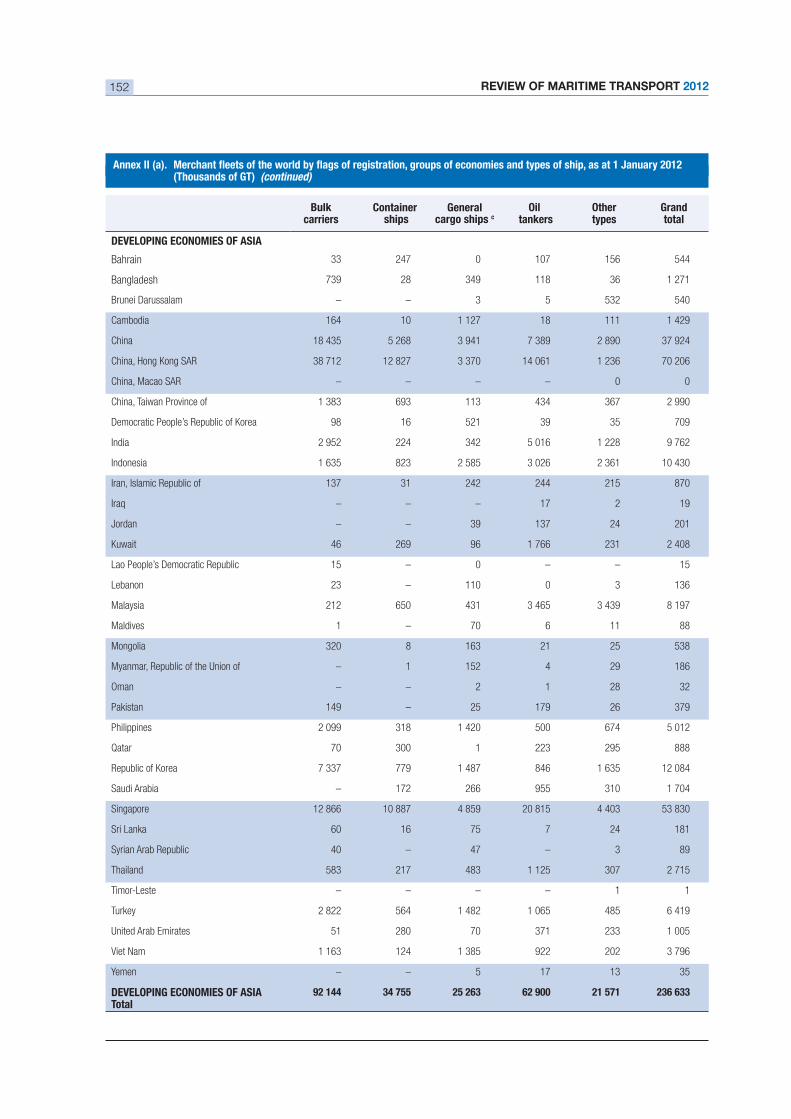
REVIEW OF MARITIME TRANSPORT 2012152
Bulk carriers
Container ships
General cargo ships c
Oil tankers
Othertypes
Grandtotal
Bahrain 33 247 0 107 156 544
Bangladesh 739 28 349 118 36 1 271
Brunei Darussalam – – 3 5 532 540
Cambodia 164 10 1 127 18 111 1 429
China 18 435 5 268 3 941 7 389 2 890 37 924
China, Hong Kong SAR 38 712 12 827 3 370 14 061 1 236 70 206
China, Macao SAR – – – – 0 0
China, Taiwan Province of 1 383 693 113 434 367 2 990
Democratic People’s Republic of Korea 98 16 521 39 35 709
India 2 952 224 342 5 016 1 228 9 762
Indonesia 1 635 823 2 585 3 026 2 361 10 430
Iran, Islamic Republic of 137 31 242 244 215 870
Iraq – – – 17 2 19
Jordan – – 39 137 24 201
Kuwait 46 269 96 1 766 231 2 408
Lao People’s Democratic Republic 15 – 0 – – 15
Lebanon 23 – 110 0 3 136
Malaysia 212 650 431 3 465 3 439 8 197
Maldives 1 – 70 6 11 88
Mongolia 320 8 163 21 25 538
Myanmar, Republic of the Union of – 1 152 4 29 186
Oman – – 2 1 28 32
Pakistan 149 – 25 179 26 379
Philippines 2 099 318 1 420 500 674 5 012
Qatar 70 300 1 223 295 888
Republic of Korea 7 337 779 1 487 846 1 635 12 084
Saudi Arabia – 172 266 955 310 1 704
Singapore 12 866 10 887 4 859 20 815 4 403 53 830
Sri Lanka 60 16 75 7 24 181
Syrian Arab Republic 40 – 47 – 3 89
Thailand 583 217 483 1 125 307 2 715
– – – – 1 1
Turkey 2 822 564 1 482 1 065 485 6 419
United Arab Emirates 51 280 70 371 233 1 005
Viet Nam 1 163 124 1 385 922 202 3 796
Yemen – – 5 17 13 35
Total 92 144 62 900 21 571
(Thousands of GT) (continued)
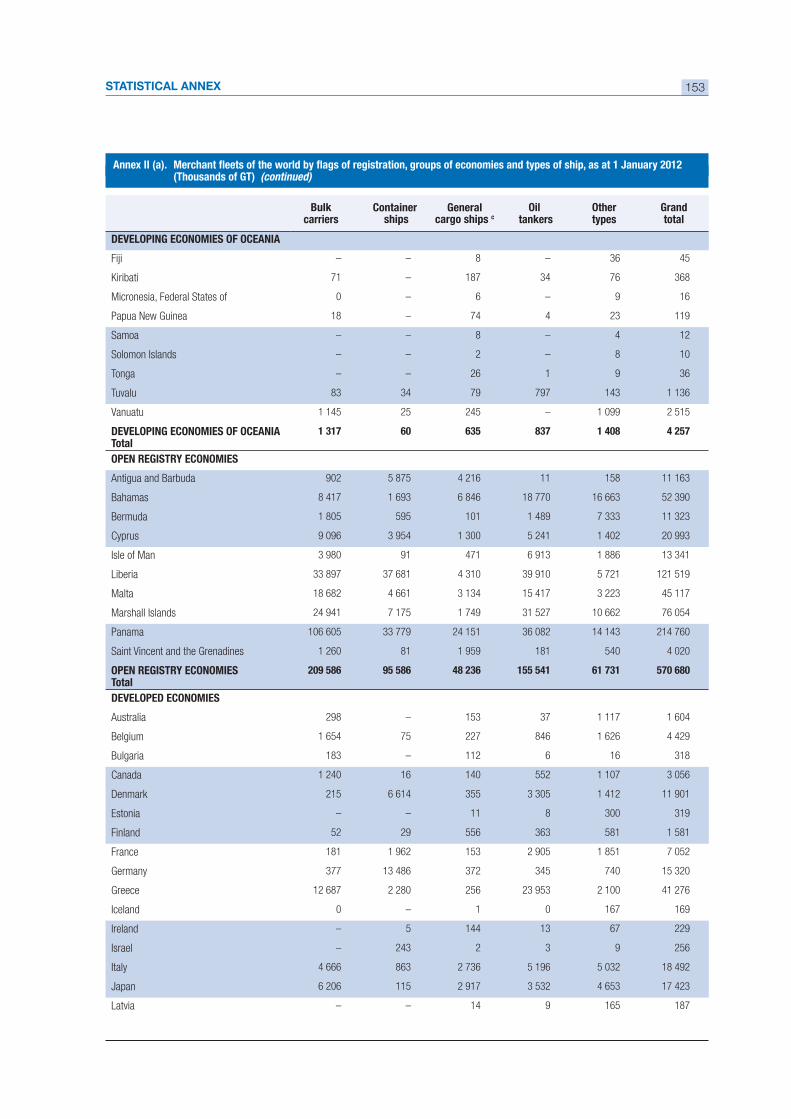
STATISTICAL ANNEX 153
Bulk carriers
Container ships
General cargo ships c
Oil tankers
Othertypes
Grandtotal
Fiji – – 8 – 36 45
Kiribati 71 – 187 34 76 368
Micronesia, Federal States of 0 – 6 – 9 16
Papua New Guinea 18 – 74 4 23 119
Samoa – – 8 – 4 12
Solomon Islands – – 2 – 8 10
Tonga – – 26 1 9 36
Tuvalu 83 34 79 797 143 1 136
Vanuatu 1 145 25 245 – 1 099 2 515
Total 60 1 408 4 257
Antigua and Barbuda 902 5 875 4 216 11 158 11 163
Bahamas 8 417 1 693 6 846 18 770 16 663 52 390
Bermuda 1 805 595 101 1 489 7 333 11 323
Cyprus 9 096 3 954 1 300 5 241 1 402 20 993
Isle of Man 3 980 91 471 6 913 1 886 13 341
Liberia 33 897 37 681 4 310 39 910 5 721 121 519
Malta 18 682 4 661 3 134 15 417 3 223 45 117
Marshall Islands 24 941 7 175 1 749 31 527 10 662 76 054
Panama 106 605 33 779 24 151 36 082 14 143 214 760
Saint Vincent and the Grenadines 1 260 81 1 959 181 540 4 020
Total 209 586 95 586 155 541 570 680
Australia 298 – 153 37 1 117 1 604
Belgium 1 654 75 227 846 1 626 4 429
Bulgaria 183 – 112 6 16 318
Canada 1 240 16 140 552 1 107 3 056
Denmark 215 6 614 355 3 305 1 412 11 901
Estonia – – 11 8 300 319
Finland 52 29 556 363 581 1 581
France 181 1 962 153 2 905 1 851 7 052
Germany 377 13 486 372 345 740 15 320
Greece 12 687 2 280 256 23 953 2 100 41 276
Iceland 0 – 1 0 167 169
Ireland – 5 144 13 67 229
Israel – 243 2 3 9 256
Italy 4 666 863 2 736 5 196 5 032 18 492
Japan 6 206 115 2 917 3 532 4 653 17 423
Latvia – – 14 9 165 187
(Thousands of GT) (continued)
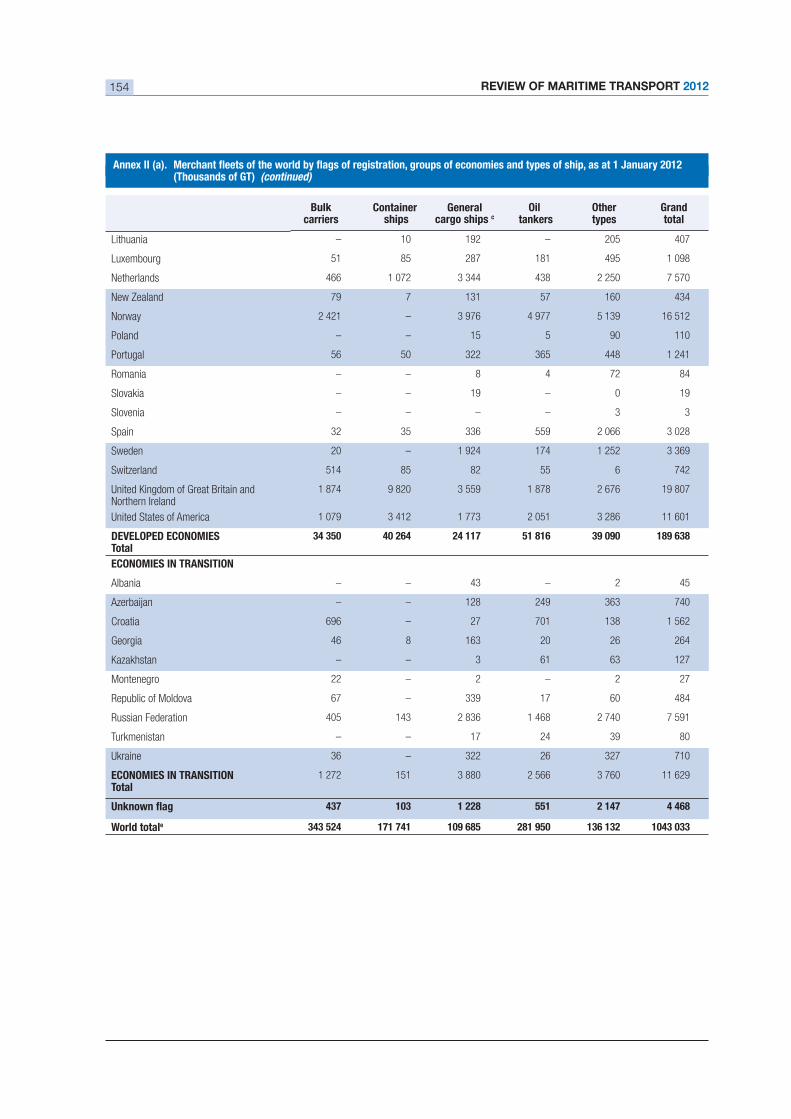
REVIEW OF MARITIME TRANSPORT 2012154
Bulk carriers
Container ships
General cargo ships c
Oil tankers
Othertypes
Grandtotal
Lithuania – 10 192 – 205 407
Luxembourg 51 85 287 181 495 1 098
Netherlands 466 1 072 3 344 438 2 250 7 570
New Zealand 79 7 131 57 160 434
Norway 2 421 – 3 976 4 977 5 139 16 512
Poland – – 15 5 90 110
Portugal 56 50 322 365 448 1 241
Romania – – 8 4 72 84
Slovakia – – 19 – 0 19
Slovenia – – – – 3 3
Spain 32 35 336 559 2 066 3 028
Sweden 20 – 1 924 174 1 252 3 369
Switzerland 514 85 82 55 6 742
United Kingdom of Great Britain and Northern Ireland
1 874 9 820 3 559 1 878 2 676 19 807
United States of America 1 079 3 412 1 773 2 051 3 286 11 601
Total 40 264 24 117 51 816
Albania – – 43 – 2 45
Azerbaijan – – 128 249 363 740
Croatia 696 – 27 701 138 1 562
Georgia 46 8 163 20 26 264
Kazakhstan – – 3 61 63 127
Montenegro 22 – 2 – 2 27
Republic of Moldova 67 – 339 17 60 484
Russian Federation 405 143 2 836 1 468 2 740 7 591
Turkmenistan – – 17 24 39 80
Ukraine 36 – 322 26 327 710
Total 1 272 151 3 880 2 566 3 760 11 629
1 228 551 2 147 4 468
World totale 171 741 109 685 281 950
(Thousands of GT) (continued)
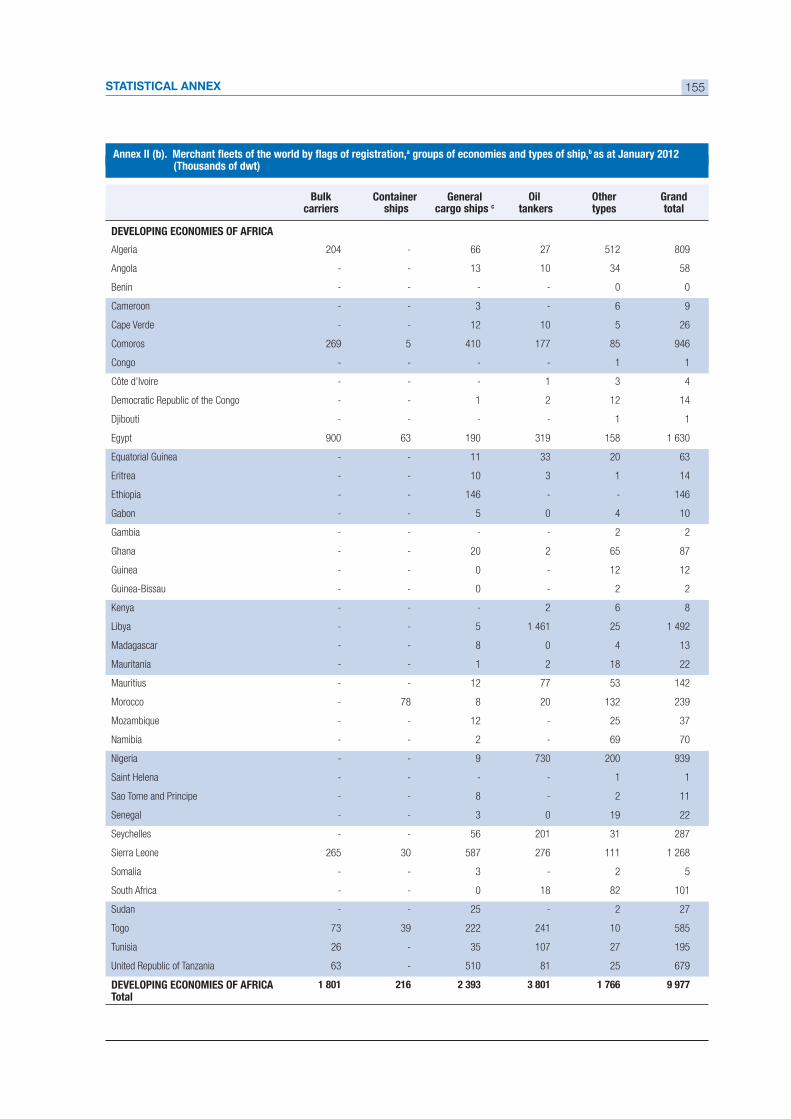
STATISTICAL ANNEX 155
Bulk carriers
Container ships
General cargo ships c
Oil tankers
Othertypes
Grandtotal
Algeria 204 66 27 512 809
Angola 13 10 34 58
Benin 0 0
Cameroon 3 6 9
Cape Verde 12 10 5 26
Comoros 269 5 410 177 85 946
Congo 1 1
Côte d’Ivoire 1 3 4
Democratic Republic of the Congo 1 2 12 14
Djibouti 1 1
Egypt 900 63 190 319 158 1 630
Equatorial Guinea 11 33 20 63
Eritrea 10 3 1 14
Ethiopia 146 146
Gabon 5 0 4 10
Gambia 2 2
Ghana 20 2 65 87
Guinea 0 12 12
0 2 2
Kenya 2 6 8
Libya 5 1 461 25 1 492
Madagascar 8 0 4 13
Mauritania 1 2 18 22
Mauritius 12 77 53 142
Morocco 78 8 20 132 239
Mozambique 12 25 37
Namibia 2 69 70
Nigeria 9 730 200 939
Saint Helena 1 1
Sao Tome and Principe 8 2 11
Senegal 3 0 19 22
Seychelles 56 201 31 287
Sierra Leone 265 30 587 276 111 1 268
Somalia 3 2 5
South Africa 0 18 82 101
Sudan 25 2 27
Togo 73 39 222 241 10 585
Tunisia 26 35 107 27 195
United Republic of Tanzania 63 510 81 25 679
Total 1 801 216 1 766 9 977
a groups of economies and types of ship,b as at January 2012(Thousands of dwt)
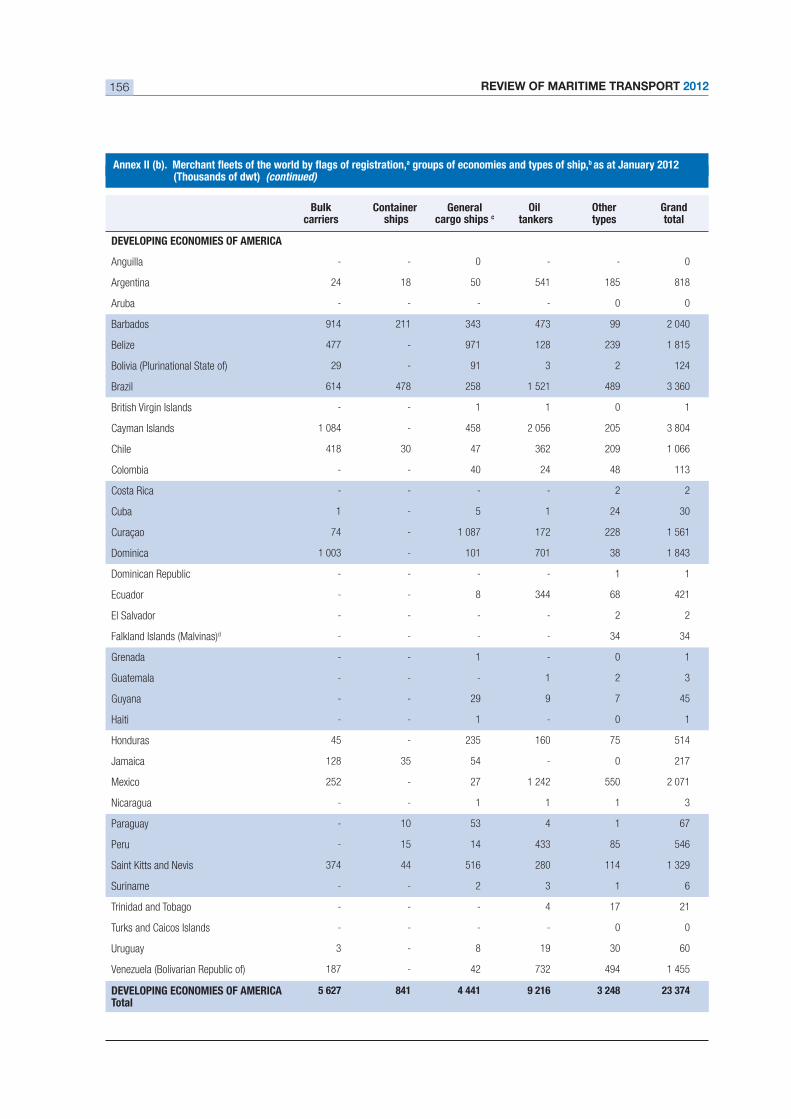
REVIEW OF MARITIME TRANSPORT 2012156
Bulk carriers
Container ships
General cargo ships c
Oil tankers
Othertypes
Grandtotal
Anguilla 0 0
Argentina 24 18 50 541 185 818
Aruba 0 0
Barbados 914 211 343 473 99 2 040
Belize 477 971 128 239 1 815
Bolivia (Plurinational State of) 29 91 3 2 124
Brazil 614 478 258 1 521 489 3 360
British Virgin Islands 1 1 0 1
Cayman Islands 1 084 458 2 056 205 3 804
Chile 418 30 47 362 209 1 066
Colombia 40 24 48 113
Costa Rica 2 2
Cuba 1 5 1 24 30
Curaçao 74 1 087 172 228 1 561
Dominica 1 003 101 701 38 1 843
Dominican Republic 1 1
Ecuador 8 344 68 421
El Salvador 2 2
Falkland Islands (Malvinas)d 34 34
Grenada 1 0 1
Guatemala 1 2 3
Guyana 29 9 7 45
Haiti 1 0 1
Honduras 45 235 160 75 514
Jamaica 128 35 54 0 217
Mexico 252 27 1 242 550 2 071
Nicaragua 1 1 1 3
Paraguay 10 53 4 1 67
Peru 15 14 433 85 546
Saint Kitts and Nevis 374 44 516 280 114 1 329
Suriname 2 3 1 6
Trinidad and Tobago 4 17 21
Turks and Caicos Islands 0 0
Uruguay 3 8 19 30 60
Venezuela (Bolivarian Republic of) 187 42 732 494 1 455
Total 5 627 841 4 441 9 216
a groups of economies and types of ship,b as at January 2012(Thousands of dwt) (continued)
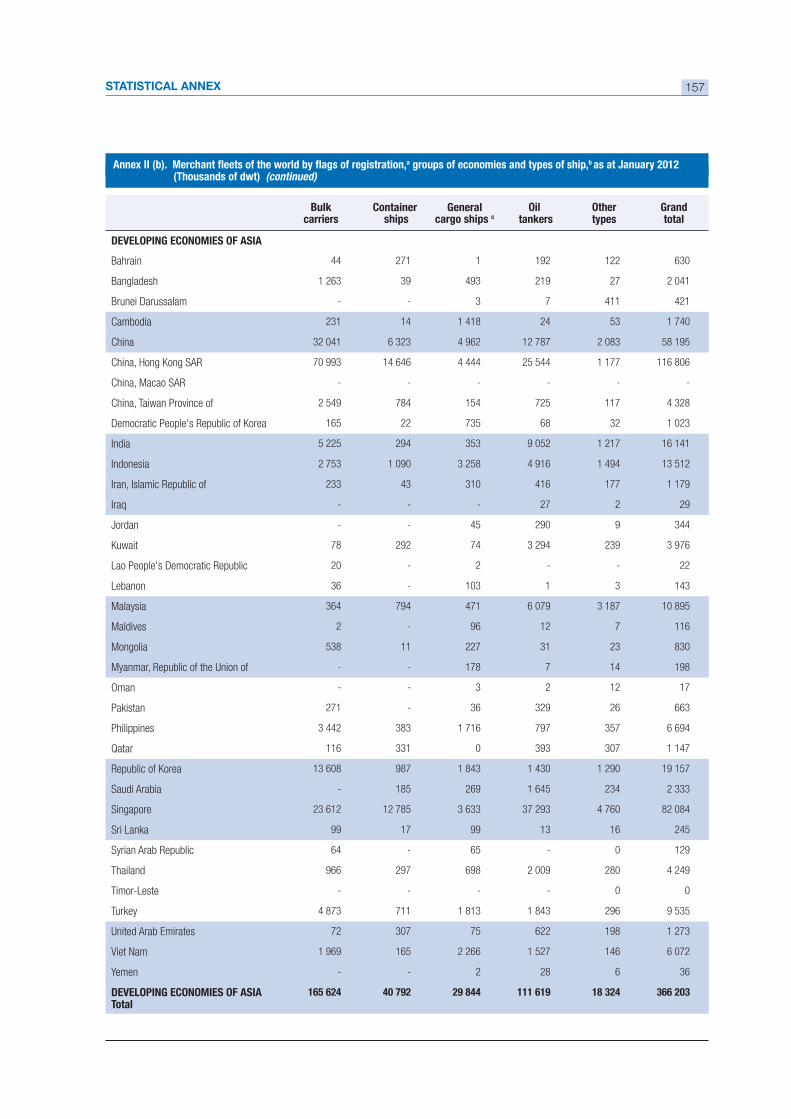
STATISTICAL ANNEX 157
Bulk carriers
Container ships
General cargo ships c
Oil tankers
Othertypes
Grandtotal
Bahrain 44 271 1 192 122 630
Bangladesh 1 263 39 493 219 27 2 041
Brunei Darussalam 3 7 411 421
Cambodia 231 14 1 418 24 53 1 740
China 32 041 6 323 4 962 12 787 2 083 58 195
China, Hong Kong SAR 70 993 14 646 4 444 25 544 1 177 116 806
China, Macao SAR
China, Taiwan Province of 2 549 784 154 725 117 4 328
Democratic People's Republic of Korea 165 22 735 68 32 1 023
India 5 225 294 353 9 052 1 217 16 141
Indonesia 2 753 1 090 3 258 4 916 1 494 13 512
Iran, Islamic Republic of 233 43 310 416 177 1 179
Iraq 27 2 29
Jordan 45 290 9 344
Kuwait 78 292 74 3 294 239 3 976
Lao People's Democratic Republic 20 2 22
Lebanon 36 103 1 3 143
Malaysia 364 794 471 6 079 3 187 10 895
Maldives 2 96 12 7 116
Mongolia 538 11 227 31 23 830
Myanmar, Republic of the Union of 178 7 14 198
Oman 3 2 12 17
Pakistan 271 36 329 26 663
Philippines 3 442 383 1 716 797 357 6 694
Qatar 116 331 0 393 307 1 147
Republic of Korea 13 608 987 1 843 1 430 1 290 19 157
Saudi Arabia 185 269 1 645 234 2 333
Singapore 23 612 12 785 3 633 37 293 4 760 82 084
Sri Lanka 99 17 99 13 16 245
Syrian Arab Republic 64 65 0 129
Thailand 966 297 698 2 009 280 4 249
0 0
Turkey 4 873 711 1 813 1 843 296 9 535
United Arab Emirates 72 307 75 622 198 1 273
Viet Nam 1 969 165 2 266 1 527 146 6 072
Yemen 2 28 6 36
Total 165 624 40 792 29 844 111 619
a groups of economies and types of ship,b as at January 2012(Thousands of dwt) (continued)
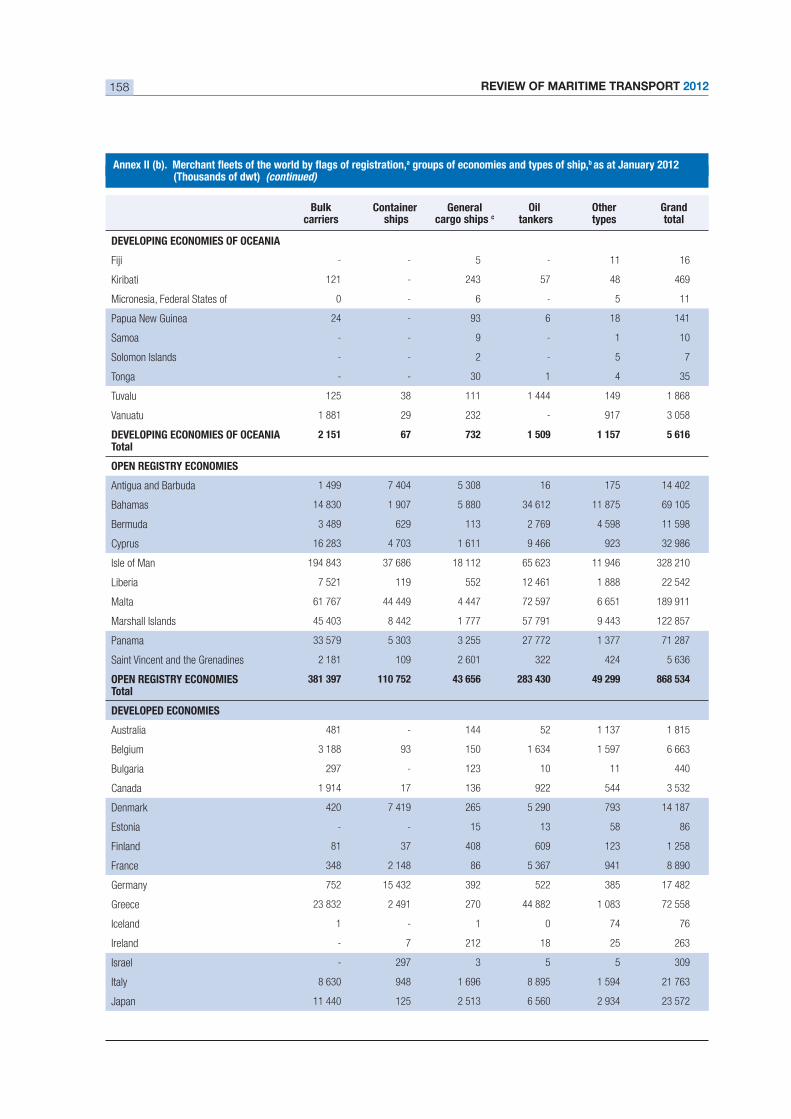
REVIEW OF MARITIME TRANSPORT 2012158
Bulk carriers
Container ships
General cargo ships c
Oil tankers
Othertypes
Grandtotal
Fiji 5 11 16
Kiribati 121 243 57 48 469
Micronesia, Federal States of 0 6 5 11
Papua New Guinea 24 93 6 18 141
Samoa 9 1 10
Solomon Islands 2 5 7
Tonga 30 1 4 35
Tuvalu 125 38 111 1 444 149 1 868
Vanuatu 1 881 29 232 917 3 058
Total 2 151 67 1 509 1 157 5 616
Antigua and Barbuda 1 499 7 404 5 308 16 175 14 402
Bahamas 14 830 1 907 5 880 34 612 11 875 69 105
Bermuda 3 489 629 113 2 769 4 598 11 598
Cyprus 16 283 4 703 1 611 9 466 923 32 986
Isle of Man 194 843 37 686 18 112 65 623 11 946 328 210
Liberia 7 521 119 552 12 461 1 888 22 542
Malta 61 767 44 449 4 447 72 597 6 651 189 911
Marshall Islands 45 403 8 442 1 777 57 791 9 443 122 857
Panama 33 579 5 303 3 255 27 772 1 377 71 287
Saint Vincent and the Grenadines 2 181 109 2 601 322 424 5 636
Total 110 752 49 299
Australia 481 144 52 1 137 1 815
Belgium 3 188 93 150 1 634 1 597 6 663
Bulgaria 297 123 10 11 440
Canada 1 914 17 136 922 544 3 532
Denmark 420 7 419 265 5 290 793 14 187
Estonia 15 13 58 86
Finland 81 37 408 609 123 1 258
France 348 2 148 86 5 367 941 8 890
Germany 752 15 432 392 522 385 17 482
Greece 23 832 2 491 270 44 882 1 083 72 558
Iceland 1 1 0 74 76
Ireland 7 212 18 25 263
Israel 297 3 5 5 309
Italy 8 630 948 1 696 8 895 1 594 21 763
Japan 11 440 125 2 513 6 560 2 934 23 572
a groups of economies and types of ship,b as at January 2012(Thousands of dwt) (continued)
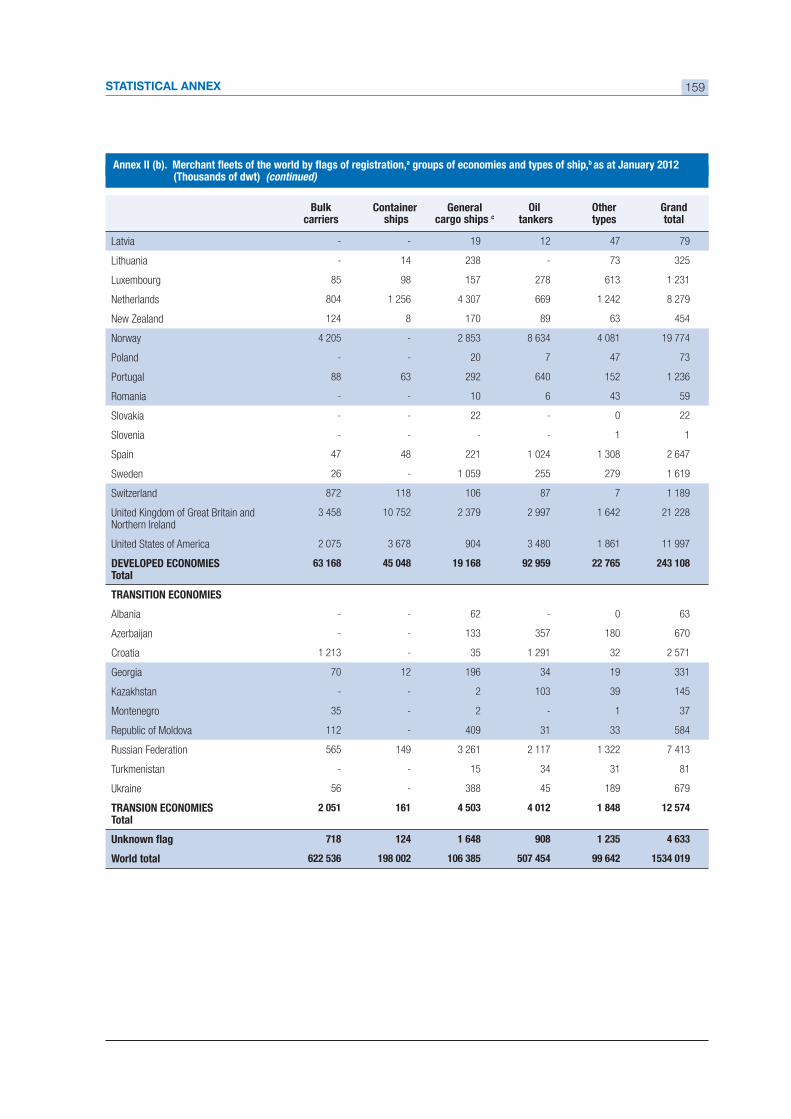
STATISTICAL ANNEX 159
a groups of economies and types of ship,b as at January 2012(Thousands of dwt) (continued)
Bulk carriers
Container ships
General cargo ships c
Oil tankers
Othertypes
Grandtotal
Latvia 19 12 47 79
Lithuania 14 238 73 325
Luxembourg 85 98 157 278 613 1 231
Netherlands 804 1 256 4 307 669 1 242 8 279
New Zealand 124 8 170 89 63 454
Norway 4 205 2 853 8 634 4 081 19 774
Poland 20 7 47 73
Portugal 88 63 292 640 152 1 236
Romania 10 6 43 59
Slovakia 22 0 22
Slovenia 1 1
Spain 47 48 221 1 024 1 308 2 647
Sweden 26 1 059 255 279 1 619
Switzerland 872 118 106 87 7 1 189
United Kingdom of Great Britain and Northern Ireland
3 458 10 752 2 379 2 997 1 642 21 228
United States of America 2 075 3 678 904 3 480 1 861 11 997
Total 45 048 19 168 92 959 22 765
Albania 62 0 63
Azerbaijan 133 357 180 670
Croatia 1 213 35 1 291 32 2 571
Georgia 70 12 196 34 19 331
Kazakhstan 2 103 39 145
Montenegro 35 2 1 37
Republic of Moldova 112 409 31 33 584
Russian Federation 565 149 3 261 2 117 1 322 7 413
Turkmenistan 15 34 31 81
Ukraine 56 388 45 189 679
Total 2 051 161 4 012 1 848 12 574
718 124 1 648 908
World total 198 002 507 454 99 642
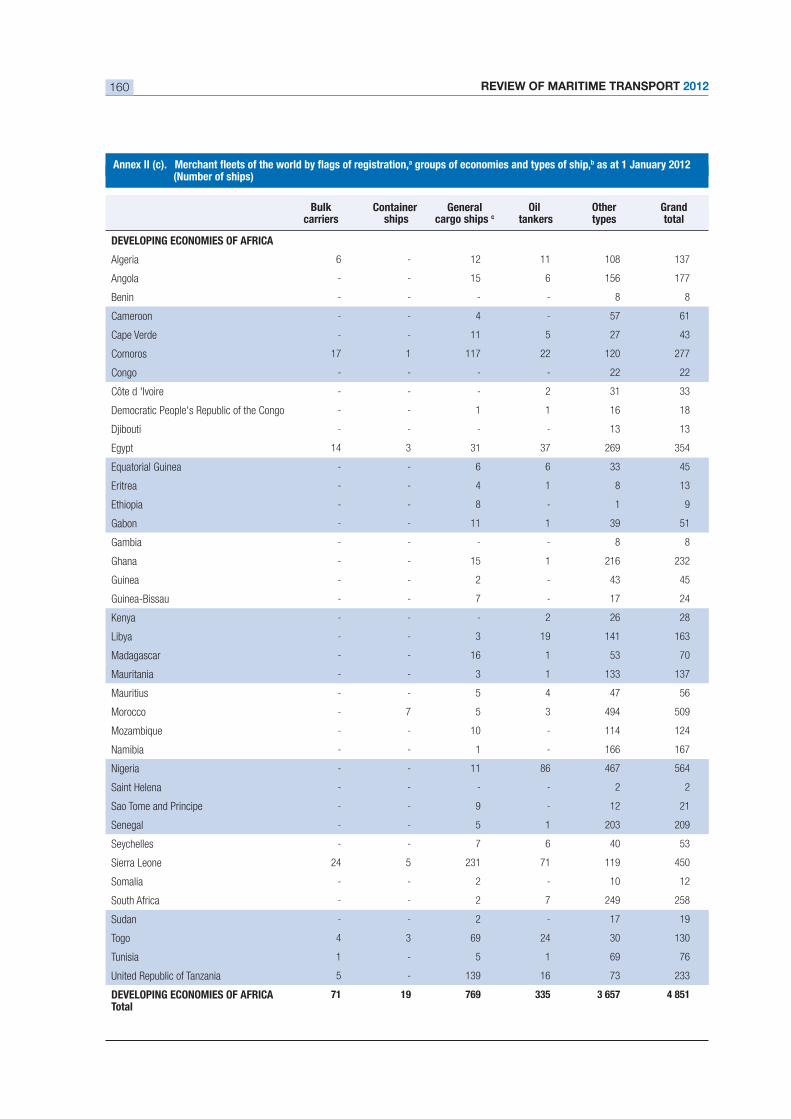
REVIEW OF MARITIME TRANSPORT 2012160
a groups of economies and types of ship,b as at 1 January 2012(Number of ships)
Bulk carriers
Container ships
General cargo ships c
Oil tankers
Othertypes
Grandtotal
Algeria 6 12 11 108 137
Angola 15 6 156 177
Benin 8 8
Cameroon 4 57 61
Cape Verde 11 5 27 43
Comoros 17 1 117 22 120 277
Congo 22 22
Côte d 'Ivoire 2 31 33
Democratic People's Republic of the Congo 1 1 16 18
Djibouti 13 13
Egypt 14 3 31 37 269 354
Equatorial Guinea 6 6 33 45
Eritrea 4 1 8 13
Ethiopia 8 1 9
Gabon 11 1 39 51
Gambia 8 8
Ghana 15 1 216 232
Guinea 2 43 45
7 17 24
Kenya 2 26 28
Libya 3 19 141 163
Madagascar 16 1 53 70
Mauritania 3 1 133 137
Mauritius 5 4 47 56
Morocco 7 5 3 494 509
Mozambique 10 114 124
Namibia 1 166 167
Nigeria 11 86 467 564
Saint Helena 2 2
Sao Tome and Principe 9 12 21
Senegal 5 1 203 209
Seychelles 7 6 40 53
Sierra Leone 24 5 231 71 119 450
Somalia 2 10 12
South Africa 2 7 249 258
Sudan 2 17 19
Togo 4 3 69 24 30 130
Tunisia 1 5 1 69 76
United Republic of Tanzania 5 139 16 73 233
Total 71 19 769 4 851
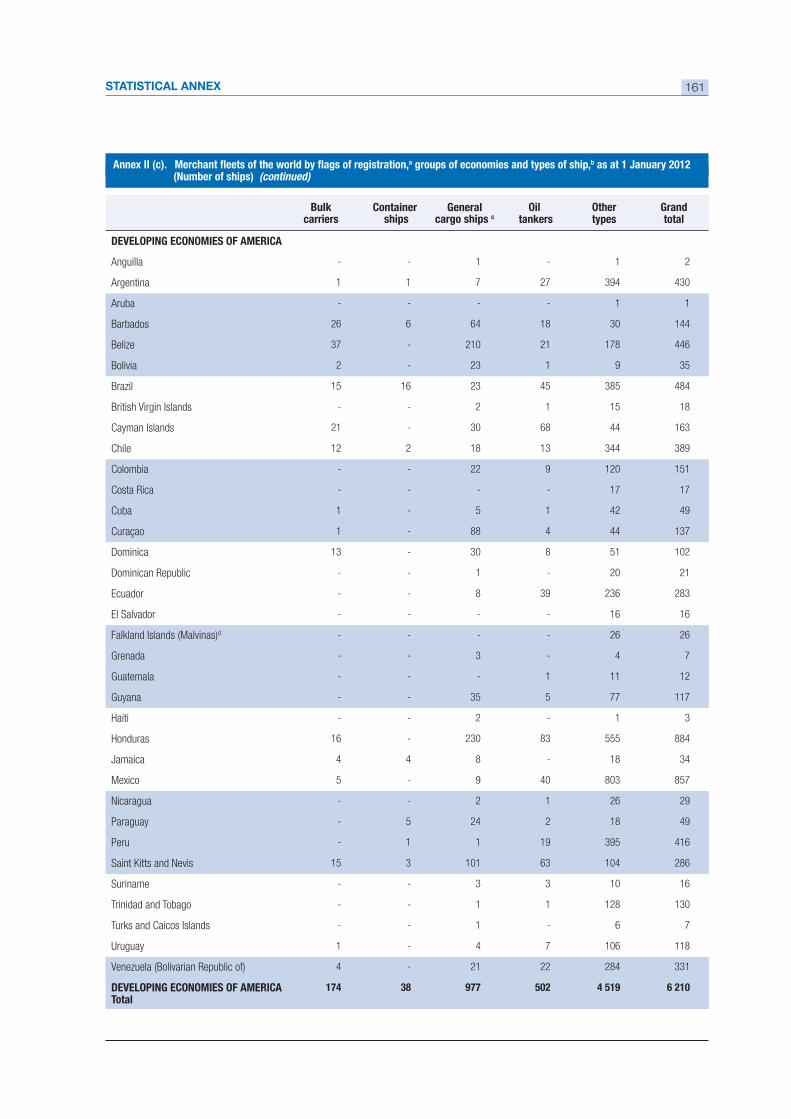
STATISTICAL ANNEX 161
a groups of economies and types of ship,b as at 1 January 2012(Number of ships) (continued)
Bulk carriers
Container ships
General cargo ships c
Oil tankers
Othertypes
Grandtotal
Anguilla 1 1 2
Argentina 1 1 7 27 394 430
Aruba 1 1
Barbados 26 6 64 18 30 144
Belize 37 210 21 178 446
Bolivia 2 23 1 9 35
Brazil 15 16 23 45 385 484
British Virgin Islands 2 1 15 18
Cayman Islands 21 30 68 44 163
Chile 12 2 18 13 344 389
Colombia 22 9 120 151
Costa Rica 17 17
Cuba 1 5 1 42 49
Curaçao 1 88 4 44 137
Dominica 13 30 8 51 102
Dominican Republic 1 20 21
Ecuador 8 39 236 283
El Salvador 16 16
Falkland Islands (Malvinas)d 26 26
Grenada 3 4 7
Guatemala 1 11 12
Guyana 35 5 77 117
Haiti 2 1 3
Honduras 16 230 83 555 884
Jamaica 4 4 8 18 34
Mexico 5 9 40 803 857
Nicaragua 2 1 26 29
Paraguay 5 24 2 18 49
Peru 1 1 19 395 416
Saint Kitts and Nevis 15 3 101 63 104 286
Suriname 3 3 10 16
Trinidad and Tobago 1 1 128 130
Turks and Caicos Islands 1 6 7
Uruguay 1 4 7 106 118
Venezuela (Bolivarian Republic of) 4 21 22 284 331
Total 174 977 502 4 519 6 210
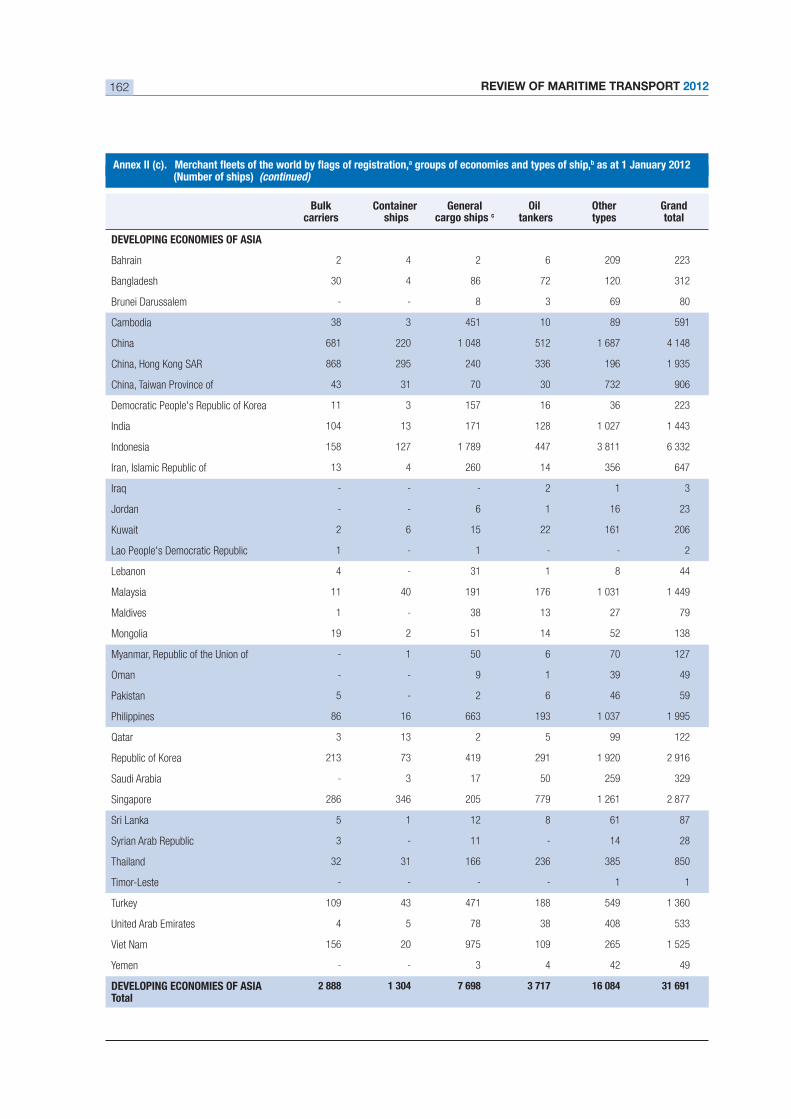
REVIEW OF MARITIME TRANSPORT 2012162
Bulk carriers
Container ships
General cargo ships c
Oil tankers
Othertypes
Grandtotal
Bahrain 2 4 2 6 209 223
Bangladesh 30 4 86 72 120 312
Brunei Darussalem 8 3 69 80
Cambodia 38 3 451 10 89 591
China 681 220 1 048 512 1 687 4 148
China, Hong Kong SAR 868 295 240 336 196 1 935
China, Taiwan Province of 43 31 70 30 732 906
Democratic People's Republic of Korea 11 3 157 16 36 223
India 104 13 171 128 1 027 1 443
Indonesia 158 127 1 789 447 3 811 6 332
Iran, Islamic Republic of 13 4 260 14 356 647
Iraq 2 1 3
Jordan 6 1 16 23
Kuwait 2 6 15 22 161 206
Lao People's Democratic Republic 1 1 2
Lebanon 4 31 1 8 44
Malaysia 11 40 191 176 1 031 1 449
Maldives 1 38 13 27 79
Mongolia 19 2 51 14 52 138
Myanmar, Republic of the Union of 1 50 6 70 127
Oman 9 1 39 49
Pakistan 5 2 6 46 59
Philippines 86 16 663 193 1 037 1 995
Qatar 3 13 2 5 99 122
Republic of Korea 213 73 419 291 1 920 2 916
Saudi Arabia 3 17 50 259 329
Singapore 286 346 205 779 1 261 2 877
Sri Lanka 5 1 12 8 61 87
Syrian Arab Republic 3 11 14 28
Thailand 32 31 166 236 385 850
1 1
Turkey 109 43 471 188 549 1 360
United Arab Emirates 4 5 78 38 408 533
Viet Nam 156 20 975 109 265 1 525
Yemen 3 4 42 49
Total 2 888 7 698 16 084
a groups of economies and types of ship,b as at 1 January 2012(Number of ships) (continued)
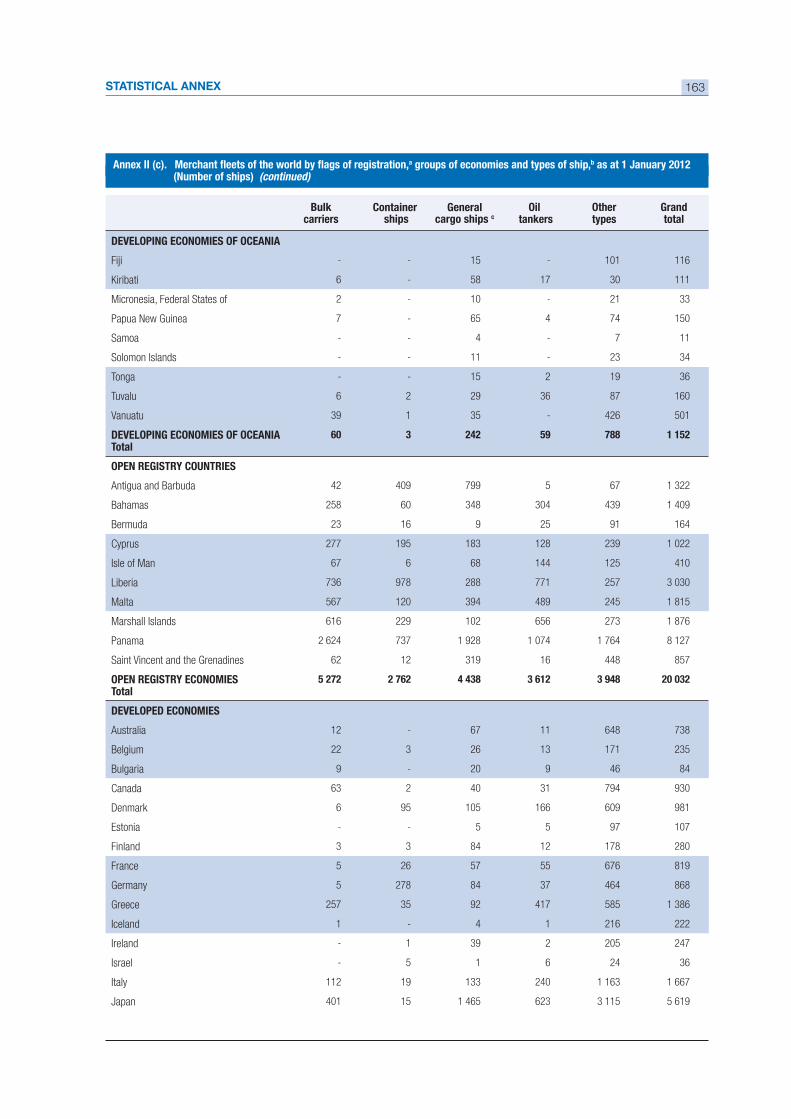
STATISTICAL ANNEX 163
Bulk carriers
Container ships
General cargo ships c
Oil tankers
Othertypes
Grandtotal
Fiji 15 101 116
Kiribati 6 58 17 30 111
Micronesia, Federal States of 2 10 21 33
Papua New Guinea 7 65 4 74 150
Samoa 4 7 11
Solomon Islands 11 23 34
Tonga 15 2 19 36
Tuvalu 6 2 29 36 87 160
Vanuatu 39 1 35 426 501
Total 60 242 59 788 1 152
OPEN REGISTRY COUNTRIES
Antigua and Barbuda 42 409 799 5 67 1 322
Bahamas 258 60 348 304 439 1 409
Bermuda 23 16 9 25 91 164
Cyprus 277 195 183 128 239 1 022
Isle of Man 67 6 68 144 125 410
Liberia 736 978 288 771 257 3 030
Malta 567 120 394 489 245 1 815
Marshall Islands 616 229 102 656 273 1 876
Panama 2 624 737 1 928 1 074 1 764 8 127
Saint Vincent and the Grenadines 62 12 319 16 448 857
Total 5 272 2 762
Australia 12 67 11 648 738
Belgium 22 3 26 13 171 235
Bulgaria 9 20 9 46 84
Canada 63 2 40 31 794 930
Denmark 6 95 105 166 609 981
Estonia 5 5 97 107
Finland 3 3 84 12 178 280
France 5 26 57 55 676 819
Germany 5 278 84 37 464 868
Greece 257 35 92 417 585 1 386
Iceland 1 4 1 216 222
Ireland 1 39 2 205 247
Israel 5 1 6 24 36
Italy 112 19 133 240 1 163 1 667
Japan 401 15 1 465 623 3 115 5 619
a groups of economies and types of ship,b as at 1 January 2012(Number of ships) (continued)
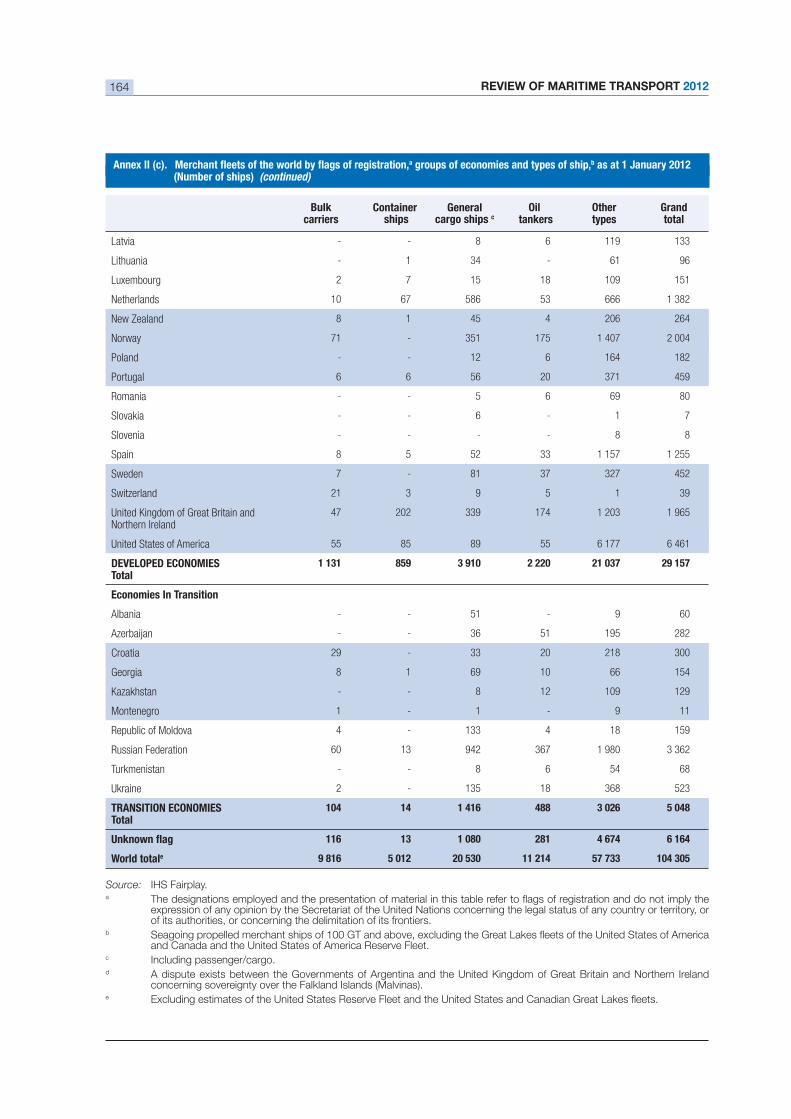
REVIEW OF MARITIME TRANSPORT 2012164
Bulk carriers
Container ships
General cargo ships c
Oil tankers
Othertypes
Grandtotal
Latvia 8 6 119 133
Lithuania 1 34 61 96
Luxembourg 2 7 15 18 109 151
Netherlands 10 67 586 53 666 1 382
New Zealand 8 1 45 4 206 264
Norway 71 351 175 1 407 2 004
Poland 12 6 164 182
Portugal 6 6 56 20 371 459
Romania 5 6 69 80
Slovakia 6 1 7
Slovenia 8 8
Spain 8 5 52 33 1 157 1 255
Sweden 7 81 37 327 452
Switzerland 21 3 9 5 1 39
United Kingdom of Great Britain and Northern Ireland
47 202 339 174 1 203 1 965
United States of America 55 85 89 55 6 177 6 461
Total 859 2 220 29 157
Economies In Transition
Albania 51 9 60
Azerbaijan 36 51 195 282
Croatia 29 33 20 218 300
Georgia 8 1 69 10 66 154
Kazakhstan 8 12 109 129
Montenegro 1 1 9 11
Republic of Moldova 4 133 4 18 159
Russian Federation 60 13 942 367 1 980 3 362
Turkmenistan 8 6 54 68
Ukraine 2 135 18 368 523
Total 104 14 1 416 488 5 048
116 1 080 281 4 674 6 164
World totale 9 816 5 012 11 214
Source: IHS Fairplay.a
of its authorities, or concerning the delimitation of its frontiers.b
and Canada and the United States of America Reserve Fleet.c Including passenger/cargo.d
e
a groups of economies and types of ship,b as at 1 January 2012(Number of ships) (continued)
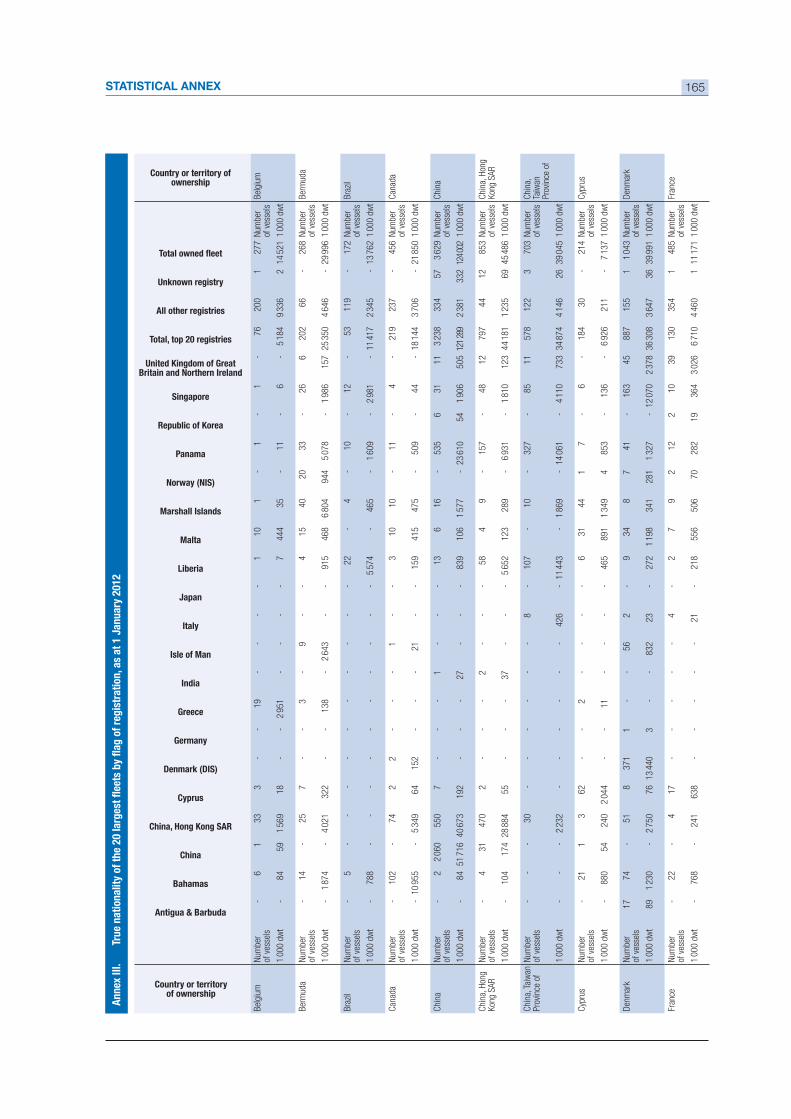
STATISTICAL ANNEX 165
Country or territory of ownership
Antigua & Barbuda
Bahamas
China
China, Hong Kong SAR
Cyprus
Denmark (DIS)
Germany
Greece
India
Italy
Japan
Liberia
Norway (NIS)
Panama
Republic of Korea
Singapore
United Kingdom of Great Britain and Northern Ireland
Total, top 20 registries
All other registries
Unknown registry
Country or territory of ownership
Bel
gium
Num
ber
of v
esse
ls6
1 33
3
19
1 10
1
1 1
76
200
1 27
7 N
umbe
r of
ves
sels
Bel
gium
1 00
0 dw
t84
59
1
569
18
2 95
1 7
444
35
11
6 5
184
9 33
6 2
14 5
21 1
000
dw
t
Berm
uda
Num
ber
of v
esse
ls14
25
7
3 9
4 15
40
20
33
26
6
202
66
268
Num
ber
of v
esse
lsBe
rmud
a
1 00
0 dw
t1
874
4 02
1 32
2 13
8 2
643
915
468
6 80
4 94
4 5
078
1 98
6 15
7 25
350
4
646
29 9
96 1
000
dw
t
Braz
ilN
umbe
r of
ves
sels
5 22
4
10
12
53
119
172
Num
ber
of v
esse
lsBr
azil
1 00
0 dw
t78
8 5
574
465
1 60
9 2
981
11 4
17
2 34
5 13
762
1 0
00 d
wt
Can
ada
Num
ber
of v
esse
ls10
2 74
2
2 1
3 10
10
11
4
219
237
456
Num
ber
of v
esse
lsC
anad
a
1 00
0 dw
t10
955
5
349
64
152
21
159
415
475
509
44
18 1
44
3 70
6 21
850
1 0
00 d
wt
Chi
naN
umbe
r of
ves
sels
2 2
060
550
7 1
13
6 16
53
5 6
31
11
3 23
8 33
4 57
3
629
Num
ber
of v
esse
lsC
hina
1 00
0 dw
t84
51
716
40
673
19
2 27
83
9 10
6 1
577
23 6
10
54
1 90
6 50
5 12
1 28
9 2
381
332
124
002
1 00
0 dw
t
Chi
na, H
ong
Kong
SAR
Num
ber
of v
esse
ls4
31
470
2 2
58
4 9
157
48
12
797
44
12
853
Num
ber
of v
esse
lsC
hina
, Hon
g Ko
ng S
AR
1 00
0 dw
t10
4 17
4 28
884
55
37
5
652
123
289
6 93
1 1
810
123
44 1
81
1 23
5 69
45
486
1 0
00 d
wt
Chi
na, T
aiw
an
Prov
ince
of
Num
ber
of v
esse
ls30
8
107
10
327
85
11
578
122
3 70
3 N
umbe
r of
ves
sels
Chi
na,
Taiw
an
Prov
ince
of
1 00
0 dw
t2
232
426
11 4
43
1 86
9 14
061
4
110
733
34 8
74
4 14
6 26
39
045
1 0
00 d
wt
Cyp
rus
Num
ber
of v
esse
ls21
1
3 62
2
6 31
44
1
7 6
184
30
214
Num
ber
of v
esse
lsC
ypru
s
1 00
0 dw
t88
0 54
24
0 2
044
11
465
891
1 34
9 4
853
136
6 92
6 21
1 7
137
1 00
0 dw
t
Den
mar
kN
umbe
r of
ves
sels
17
74
51
8 37
1 1
56
2 9
34
8 7
41
163
45
887
155
1 1
043
Num
ber
of v
esse
lsD
enm
ark
1 00
0 dw
t89
1
230
2 75
0 76
13
440
3
832
23
272
1 19
8 34
1 28
1 1
327
12 0
70
2 37
8 36
308
3
647
36
39 9
91 1
000
dw
t
Fran
ceN
umbe
r of
ves
sels
22
4 17
4
2 7
9 2
12
2 10
39
13
0 35
4 1
485
Num
ber
of v
esse
lsFr
ance
1 00
0 dw
t76
8 24
1 63
8 21
21
8 55
6 50
6 70
28
2 19
36
4 3
026
6 71
0 4
460
1 11
171
1 0
00 d
wt
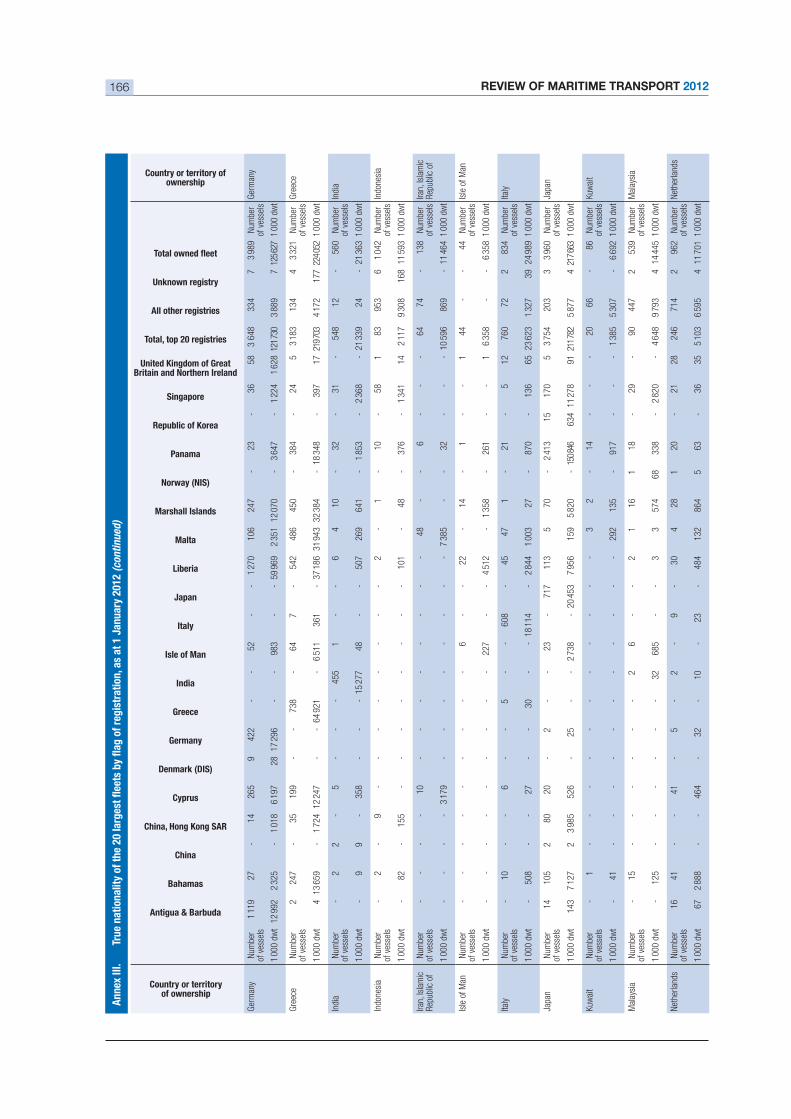
REVIEW OF MARITIME TRANSPORT 2012166
(con
tinu
ed)
Country or territory of ownership
Antigua & Barbuda
Bahamas
China
China, Hong Kong SAR
Cyprus
Denmark (DIS)
Germany
Greece
India
Italy
Japan
Liberia
Norway (NIS)
Panama
Republic of Korea
Singapore
United Kingdom of Great Britain and Northern Ireland
Total, top 20 registries
All other registries
Unknown registry
Country or territory of ownership
Ger
man
yN
umbe
r of
ves
sels
1 11
9 27
14
26
5 9
422
52
1 27
0 10
6 24
7 23
36
58
3
648
334
7 3
989
Num
ber
of v
esse
lsG
erm
any
1 00
0 dw
t12
992
2
325
1 01
8 6
197
28
17 2
96
983
59 9
69
2 35
1 12
070
3
647
1 22
4 1
628
121
730
3 88
9 7
125
627
1 00
0 dw
t
Gre
ece
Num
ber
of v
esse
ls2
247
35
199
738
64
7 54
2 48
6 45
0 38
4 24
5
3 18
3 13
4 4
3 32
1 N
umbe
r of
ves
sels
Gre
ece
1 00
0 dw
t4
13 6
59
1 72
4 12
247
64
921
6
511
361
37 1
86
31 9
43
32 3
84
18 3
48
397
17 2
19 7
03
4 17
2 17
7 22
4 05
2 1
000
dwt
Indi
aN
umbe
r of
ves
sels
2 2
5 45
5 1
6 4
10
32
31
548
12
560
Num
ber
of v
esse
lsIn
dia
1 00
0 dw
t9
9 35
8 15
277
48
50
7 26
9 64
1 1
853
2 36
8 21
339
24
21
363
1 0
00 d
wt
Indo
nesi
aN
umbe
r of
ves
sels
2 9
2 1
10
58
1 83
95
3 6
1 04
2 N
umbe
r of
ves
sels
Indo
nesi
a
1 00
0 dw
t82
15
5 10
1 48
37
6 1
341
14
2 11
7 9
308
168
11 5
93 1
000
dw
t
Iran,
Isla
mic
Re
publ
ic o
fN
umbe
r of
ves
sels
10
48
6 64
74
13
8 N
umbe
r of
ves
sels
Iran,
Isla
mic
Re
publ
ic o
f
1 00
0 dw
t3
179
7 38
5 32
10
596
86
9 11
464
1 0
00 d
wt
Isle
of M
anN
umbe
r of
ves
sels
6 22
14
1
1 44
44
N
umbe
r of
ves
sels
Isle
of M
an
1 00
0 dw
t22
7 4
512
1 35
8 26
1 1
6 35
8 6
358
1 00
0 dw
t
Italy
Num
ber
of v
esse
ls10
6
5 60
8 45
47
1
21
5 12
76
0 72
2
834
Num
ber
of v
esse
lsIta
ly
1 00
0 dw
t50
8 27
30
18
114
2
844
1 00
3 27
87
0 13
6 65
23
623
1
327
39
24 9
89 1
000
dw
t
Japa
nN
umbe
r of
ves
sels
14
105
2 80
20
2
23
717
113
5 70
2
413
15
170
5 3
754
203
3 3
960
Num
ber
of v
esse
lsJa
pan
1 00
0 dw
t14
3 7
127
2 3
985
526
25
2 73
8 20
453
7
956
159
5 82
0 15
0 84
6 63
4 11
278
91
211
782
5
877
4 21
7 66
3 1
000
dwt
Kuw
ait
Num
ber
of v
esse
ls1
3 2
14
20
66
86
Num
ber
of v
esse
lsKu
wai
t
1 00
0 dw
t41
29
2 13
5 91
7 1
385
5 30
7 6
692
1 00
0 dw
t
Mal
aysi
aN
umbe
r of
ves
sels
15
2 6
2 1
16
1 18
29
90
44
7 2
539
Num
ber
of v
esse
lsM
alay
sia
1 00
0 dw
t12
5 32
68
5 3
3 57
4 68
33
8 2
820
4 64
8 9
793
4 14
445
1 0
00 d
wt
Net
herla
nds
Num
ber
of v
esse
ls16
41
41
5
2 9
30
4 28
1
20
21
28
246
714
2 96
2 N
umbe
r of
ves
sels
Net
herla
nds
1 00
0 dw
t67
2
888
464
32
10
23
484
132
864
5 63
36
35
5
103
6 59
5 4
11 7
01 1
000
dw
t
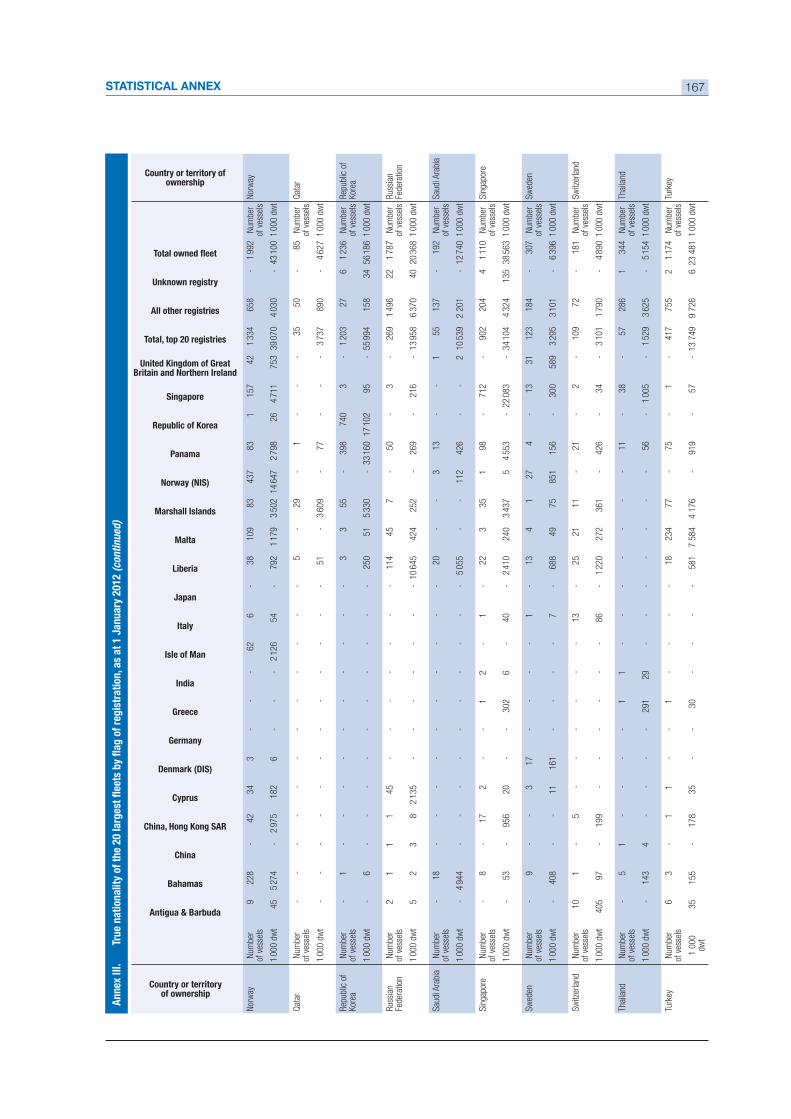
STATISTICAL ANNEX 167
(con
tinu
ed)
Country or territory of ownership
Antigua & Barbuda
Bahamas
China
China, Hong Kong SAR
Cyprus
Denmark (DIS)
Germany
Greece
India
Italy
Japan
Liberia
Norway (NIS)
Panama
Republic of Korea
Singapore
United Kingdom of Great Britain and Northern Ireland
Total, top 20 registries
All other registries
Unknown registry
Country or territory of ownership
Nor
way
Num
ber
of v
esse
ls9
228
42
34
3 62
6
38
109
83
437
83
1 15
7 42
1
334
658
1 99
2 N
umbe
r of
ves
sels
Nor
way
1 00
0 dw
t45
5
274
2 97
5 18
2 6
2 12
6 54
79
2 1
179
3 50
2 14
647
2
798
26
4 71
1 75
3 39
070
4
030
43 1
00 1
000
dw
t
Qat
arN
umbe
r of
ves
sels
5 29
1
35
50
85
Num
ber
of v
esse
lsQ
atar
1 00
0 dw
t51
3
609
77
3 73
7 89
0 4
627
1 00
0 dw
t
Repu
blic
of
Kore
aN
umbe
r of
ves
sels
1 3
3 55
39
8 74
0 3
1 20
3 27
6
1 23
6 N
umbe
r of
ves
sels
Repu
blic
of
Kore
a
1 00
0 dw
t6
250
51
5 33
0 33
160
17
102
95
55
994
15
8 34
56
186
1 0
00 d
wt
Russ
ian
Fede
ratio
nN
umbe
r of
ves
sels
2 1
1 1
45
114
45
7 50
3
269
1 49
6 22
1
787
Num
ber
of v
esse
lsRu
ssia
n Fe
dera
tion
1 00
0 dw
t5
2 3
8 2
135
10 6
45
424
252
269
216
13 9
58
6 37
0 40
20
368
1 0
00 d
wt
Saud
i Ara
bia
Num
ber
of v
esse
ls18
20
3
13
1 55
13
7 19
2 N
umbe
r of
ves
sels
Saud
i Ara
bia
1 00
0 dw
t4
944
5 05
5 11
2 42
6 2
10 5
39
2 20
1 12
740
1 0
00 d
wt
Sing
apor
eN
umbe
r of
ves
sels
8 17
2
1 2
1 22
3
35
1 98
71
2 90
2 20
4 4
1 11
0 N
umbe
r of
ves
sels
Sing
apor
e
1 00
0 dw
t53
95
6 20
30
2 6
40
2 41
0 24
0 3
437
5 4
553
22 0
83
34 1
04
4 32
4 13
5 38
563
1 0
00 d
wt
Swed
enN
umbe
r of
ves
sels
9 3
17
1 13
4
1 27
4
13
31
123
184
307
Num
ber
of v
esse
lsSw
eden
1 00
0 dw
t40
8 11
16
1 7
688
49
75
851
156
300
589
3 29
5 3
101
6 39
6 1
000
dwt
Switz
erla
ndN
umbe
r of
ves
sels
10
1 5
13
25
21
11
21
2 10
9 72
18
1 N
umbe
r of
ves
sels
Switz
erla
nd
1 00
0 dw
t40
5 97
19
9 86
1
220
272
361
426
34
3 10
1 1
790
4 89
0 1
000
dwt
Thai
land
Num
ber
of v
esse
ls5
1 1
1 11
38
57
28
6 1
344
Num
ber
of v
esse
lsTh
aila
nd
1 00
0 dw
t14
3 4
291
29
56
1 00
5 1
529
3 62
5 5
154
1 00
0 dw
t
Turk
eyN
umbe
r of
ves
sels
6 3
1 1
1 18
23
4 77
75
1
417
755
2 1
174
Num
ber
of v
esse
lsTu
rkey
1 00
0 dw
t35
15
5 17
8 35
30
58
1 7
584
4 17
6 91
9 57
13
749
9
726
6 23
481
1 0
00 d
wt
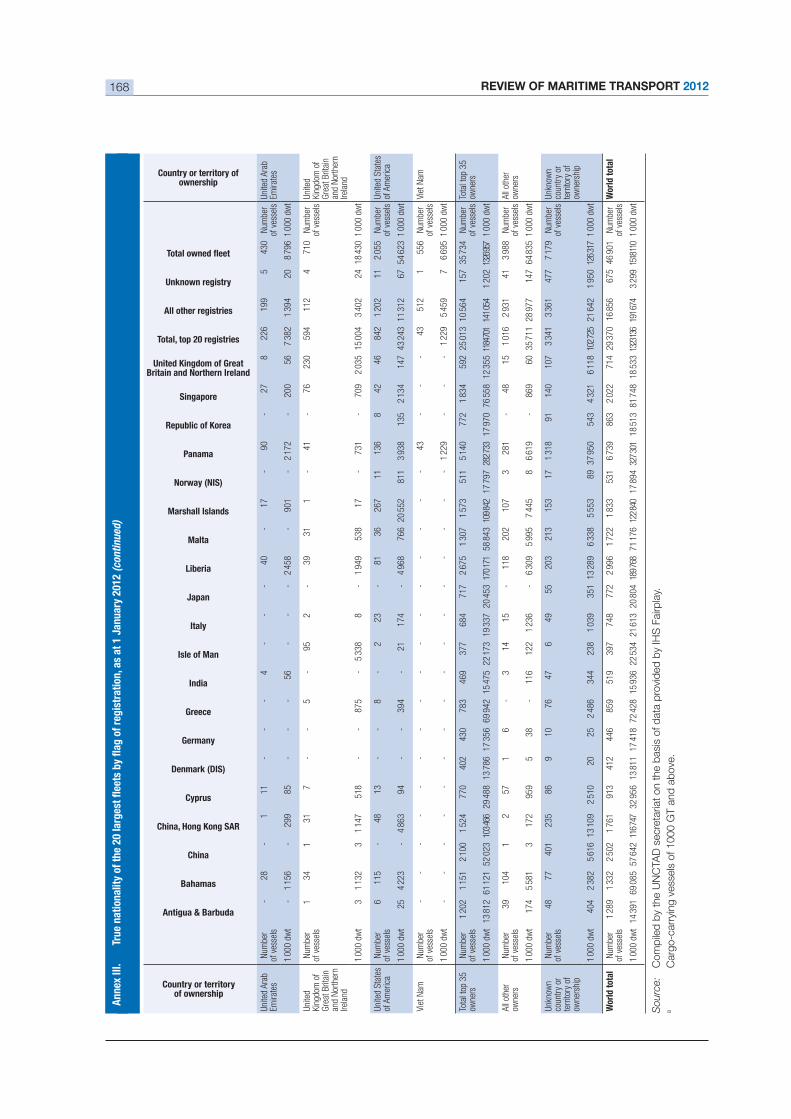
REVIEW OF MARITIME TRANSPORT 2012168
(con
tinu
ed)
Country or territory of ownership
Antigua & Barbuda
Bahamas
China
China, Hong Kong SAR
Cyprus
Denmark (DIS)
Germany
Greece
India
Italy
Japan
Liberia
Norway (NIS)
Panama
Republic of Korea
Singapore
United Kingdom of Great Britain and Northern Ireland
Total, top 20 registries
All other registries
Unknown registry
Country or territory of ownership
Uni
ted
Ara
b Em
irate
sN
umbe
r of
ves
sels
28
1 11
4
40
17
90
27
8 22
6 19
9 5
430
Num
ber
of v
esse
lsU
nite
d A
rab
Emira
tes
1 00
0 dw
t1
156
299
85
56
2 45
8 90
1 2
172
200
56
7 38
2 1
394
20
8 79
6 1
000
dwt
Unite
d Ki
ngdo
m o
f G
reat
Brit
ain
and
Nor
ther
n Ire
land
Num
ber
of v
esse
ls1
34
1 31
7
5 95
2
39
31
1 41
76
23
0 59
4 11
2 4
710
Num
ber
of v
esse
lsUn
ited
King
dom
of
Gre
at B
ritai
n an
d N
orth
ern
Irela
nd
1 00
0 dw
t3
1 13
2 3
1 14
7 51
8 87
5 5
338
8 1
949
538
17
731
709
2 03
5 15
004
3
402
24
18 4
30 1
000
dw
t
Uni
ted
Stat
es
of A
mer
ica
Num
ber
of v
esse
ls6
115
48
13
8 2
23
81
36
267
11
136
8 42
46
84
2 1
202
11
2 05
5 N
umbe
r of
ves
sels
Uni
ted
Stat
es
of A
mer
ica
1 00
0 dw
t25
4
223
4 86
3 94
39
4 21
17
4 4
968
766
20 5
52
811
3 93
8 13
5 2
134
147
43 2
43
11 3
12
67
54 6
23 1
000
dw
t
Viet
Nam
Num
ber
of v
esse
ls43
43
51
2 1
556
Num
ber
of v
esse
lsVi
et N
am
1 00
0 dw
t1
229
1 22
9 5
459
7 6
695
1 00
0 dw
t
Tota
l top
35
owne
rsN
umbe
r of
ves
sels
1 20
2 1
151
2 10
0 1
524
770
402
430
783
469
377
684
717
2 67
5 1
307
1 57
3 51
1 5
140
772
1 83
4 59
2 25
013
10
564
15
7 35
734
N
umbe
r of
ves
sels
Tota
l top
35
owne
rs
1 00
0 dw
t13
812
61
121
52
023
103
466
29
488
13
786
17
356
69
942
15
475
22
173
19
337
20
453
170
171
58
843
109
842
17 7
97 2
82 7
33
17 9
70
76 5
58
12 3
55 1
184 7
01 1
41 0
54
1 20
2 1 3
26 95
7 1
000
dwt
All o
ther
ow
ners
Num
ber
of v
esse
ls39
10
4 1
2 57
1
6 3
14
15
118
202
107
3 28
1 48
15
1
016
2 93
1 41
3
988
Num
ber
of v
esse
lsAl
l oth
er
owne
rs
1 00
0 dw
t17
4 5
581
3 17
2 95
9 5
38
116
122
1 23
6 6
309
5 99
5 7
445
8 6
619
869
60
35 7
11
28 9
77
147
64 8
35 1
000
dw
t
Unkn
own
coun
try
or
terr
itory
of
owne
rshi
p
Num
ber
of v
esse
ls48
77
40
1 23
5 86
9
10
76
47
6 49
55
20
3 21
3 15
3 17
1
318
91
140
107
3 34
1 3
361
477
7 17
9 N
umbe
r of
ves
sels
Unkn
own
coun
try
or
terr
itory
of
owne
rshi
p
1 00
0 dw
t40
4 2
382
5 61
6 13
109
2
510
20
25
2 48
6 34
4 23
8 1
039
351
13 2
89
6 33
8 5
553
89
37 9
50
543
4 32
1 6
118
102
725
21 6
42
1 95
0 12
6 31
7 1
000
dwt
Wor
ld t
otal
Num
ber
of v
esse
ls1
289
1 33
2 2
502
1 76
1 91
3 41
2 44
6 85
9 51
9 39
7 74
8 77
2 2
996
1 72
2 1
833
531
6 73
9 86
3 2
022
714
29 3
70
16 8
56
675
46 9
01
Num
ber
of v
esse
lsW
orld
tot
al
1 00
0 dw
t14
391
69
085
57
642
116
747
32
956
13
811
17
418
72
428
15
936
22
534
21
613
20
804
189
768
71
176
122
840
17
894
327
301
18
513
81
748
18
533
1 32
3 136
191
674
3
299
1 518
110
1 00
0 dw
t
Sourc
e:
Com
pile
d b
y th
e U
NC
TAD
secre
taria
t on t
he b
asi
s of d
ata
pro
vid
ed
by
IHS
Fairp
lay.
aC
arg
o-c
arr
ying v
ess
els
of 1000 G
T a
nd
ab
ove
.

STATISTICAL ANNEX 169
Country/territory2009 2010 Rank 2010
(2009)
Albania 68 780 86 875 113 (114)
Algeria 250 095 279 784 89 (88)
Antigua and Barbuda 29 150 24 615 123 (123)
Argentina 1 626 835 2 021 675 42 (42)
Aruba 125 000 130 000 107 (107)
Australia 6 200 325 6 668 075 20 (20)
Austria 330 995 350 461 78 (82)
Bahamas 1 297 000 1 125 000 53 (43)
Bahrain 279 799 289 956 87 (91)
Bangladesh 1182121 1 356 099 48 (50)
Barbados 75 015 80 424 114 (113)
Belgium 9 701 494 10 984 824 13 (13)
Belize 31 344 31 919 122 (122)
Benin 272 820 316 744 84 (85)
Brazil 6 590 363 8 138 608 18 (18)
Brunei Darussalam 85 577 99 354 109 (111)
Bulgaria 136 444 142 611 104 (101)
Cambodia 207 577 224 206 95 (93)
Cameroon 245 538 285 069 88 (90)
Canada 4 191 568 4 829 806 28 (28)
Cayman Islands 44 215 40 281 121 (120)
Chile 2 795 990 3 171 958 34 (33)
China 108 799 933 130 290 443 1 (1)
China, Hong Kong SAR 21 040 096 23 699 242 4 (4)
China, Taiwan Province of 11 352 097 12 501 107 11 (11)
Colombia 2 056 789 2 443 786 38 (39)
Congo 291 917 338 916 82 (83)
Costa Rica 875 687 1 013 483 55 (56)
Côte d'Ivoire 677 029 607 730 69 (60)
Croatia 130 740 137 048 106 (105)
Cuba 290 098 228 346 93 (84)
Cyprus 353 913 349 357 79 (78)
Denmark 621 546 709 147 60 (63)
Djibouti 519 500 600 000 70 (69)
Dominican Republic 1 263 467 1 382 679 47 (44)
Ecuador 1 000 895 1 221 849 51 (52)
Egypt 6 250 443 6 709 053 19 (19)
El Salvador 126 369 145 774 103 (106)
Estonia 130 939 151 969 102 (103)
Finland 1 125 532 1 247 520 49 (51)
France 4 490 583 5 346 799 25 (25)
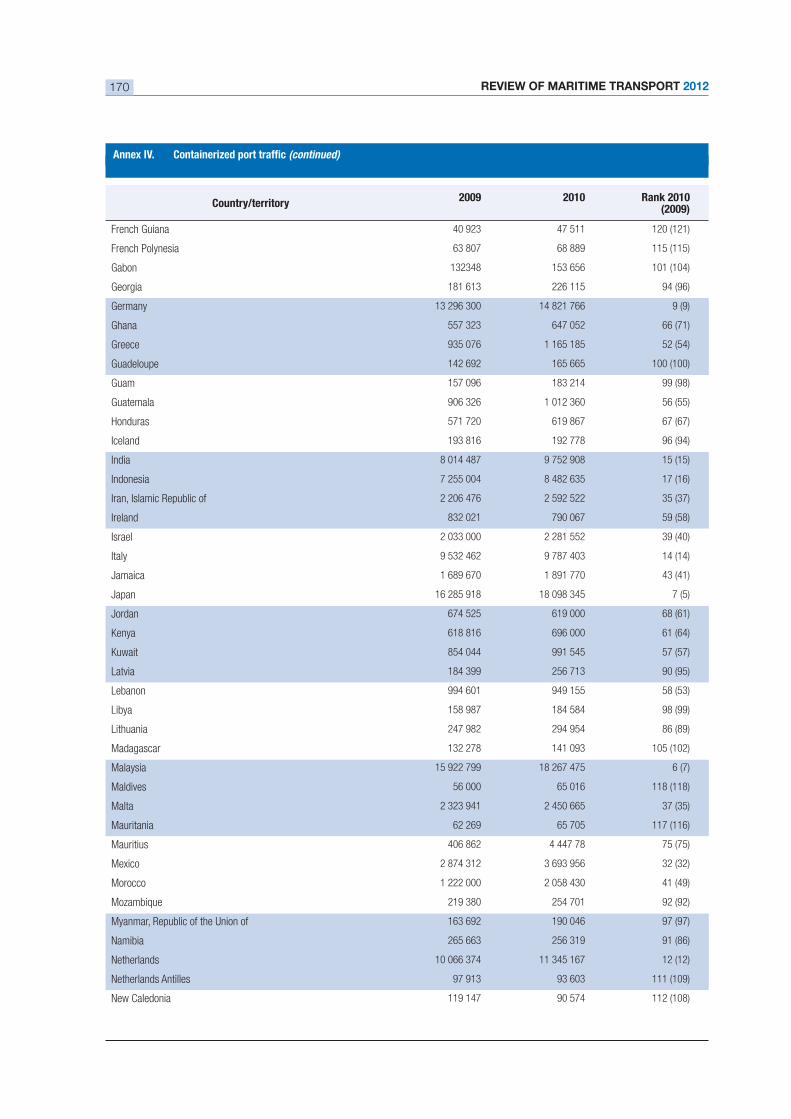
REVIEW OF MARITIME TRANSPORT 2012170
(continued)
Country/territory2009 2010 Rank 2010
(2009)
French Guiana 40 923 47 511 120 (121)
French Polynesia 63 807 68 889 115 (115)
Gabon 132348 153 656 101 (104)
Georgia 181 613 226 115 94 (96)
Germany 13 296 300 14 821 766 9 (9)
Ghana 557 323 647 052 66 (71)
Greece 935 076 1 165 185 52 (54)
Guadeloupe 142 692 165 665 100 (100)
Guam 157 096 183 214 99 (98)
Guatemala 906 326 1 012 360 56 (55)
Honduras 571 720 619 867 67 (67)
Iceland 193 816 192 778 96 (94)
India 8 014 487 9 752 908 15 (15)
Indonesia 7 255 004 8 482 635 17 (16)
Iran, Islamic Republic of 2 206 476 2 592 522 35 (37)
Ireland 832 021 790 067 59 (58)
Israel 2 033 000 2 281 552 39 (40)
Italy 9 532 462 9 787 403 14 (14)
Jamaica 1 689 670 1 891 770 43 (41)
Japan 16 285 918 18 098 345 7 (5)
Jordan 674 525 619 000 68 (61)
Kenya 618 816 696 000 61 (64)
Kuwait 854 044 991 545 57 (57)
Latvia 184 399 256 713 90 (95)
Lebanon 994 601 949 155 58 (53)
Libya 158 987 184 584 98 (99)
Lithuania 247 982 294 954 86 (89)
Madagascar 132 278 141 093 105 (102)
Malaysia 15 922 799 18 267 475 6 (7)
Maldives 56 000 65 016 118 (118)
Malta 2 323 941 2 450 665 37 (35)
Mauritania 62 269 65 705 117 (116)
Mauritius 406 862 4 447 78 75 (75)
Mexico 2 874 312 3 693 956 32 (32)
Morocco 1 222 000 2 058 430 41 (49)
Mozambique 219 380 254 701 92 (92)
Myanmar, Republic of the Union of 163 692 190 046 97 (97)
Namibia 265 663 256 319 91 (86)
Netherlands 10 066 374 11 345 167 12 (12)
Netherlands Antilles 97 913 93 603 111 (109)
New Caledonia 119 147 90 574 112 (108)
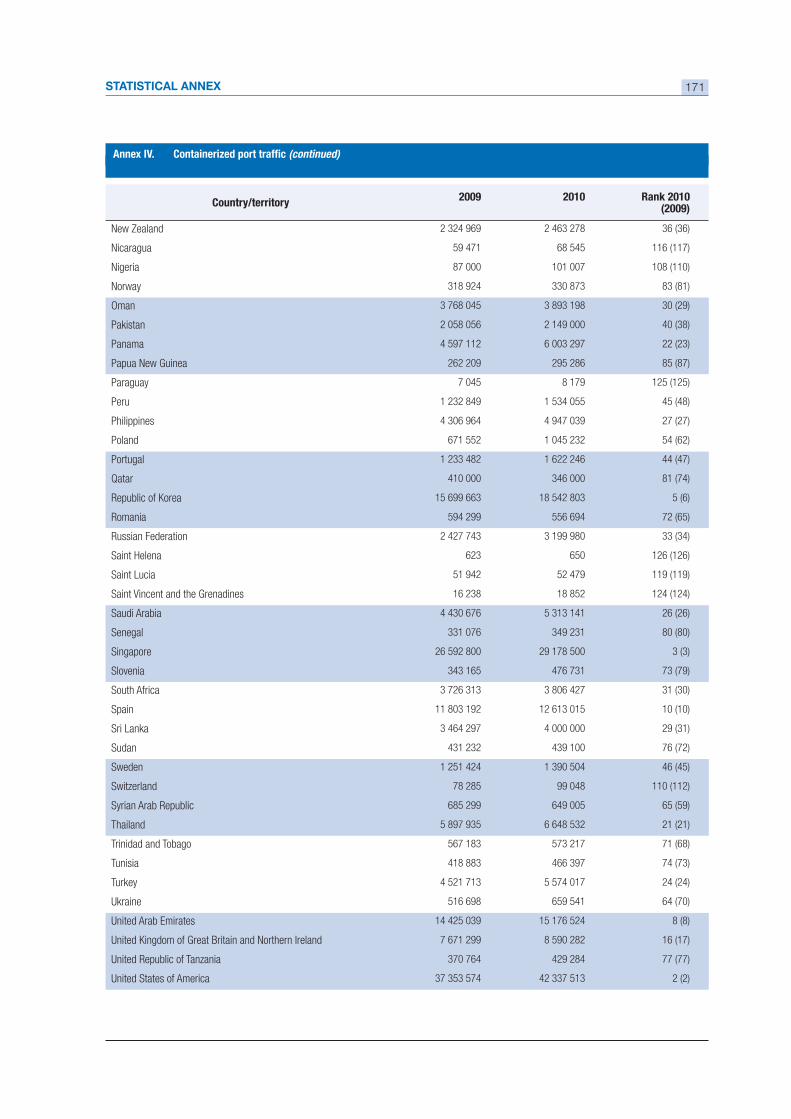
STATISTICAL ANNEX 171
Country/territory2009 2010 Rank 2010
(2009)
New Zealand 2 324 969 2 463 278 36 (36)
Nicaragua 59 471 68 545 116 (117)
Nigeria 87 000 101 007 108 (110)
Norway 318 924 330 873 83 (81)
Oman 3 768 045 3 893 198 30 (29)
Pakistan 2 058 056 2 149 000 40 (38)
Panama 4 597 112 6 003 297 22 (23)
Papua New Guinea 262 209 295 286 85 (87)
Paraguay 7 045 8 179 125 (125)
Peru 1 232 849 1 534 055 45 (48)
Philippines 4 306 964 4 947 039 27 (27)
Poland 671 552 1 045 232 54 (62)
Portugal 1 233 482 1 622 246 44 (47)
Qatar 410 000 346 000 81 (74)
Republic of Korea 15 699 663 18 542 803 5 (6)
Romania 594 299 556 694 72 (65)
Russian Federation 2 427 743 3 199 980 33 (34)
Saint Helena 623 650 126 (126)
Saint Lucia 51 942 52 479 119 (119)
Saint Vincent and the Grenadines 16 238 18 852 124 (124)
Saudi Arabia 4 430 676 5 313 141 26 (26)
Senegal 331 076 349 231 80 (80)
Singapore 26 592 800 29 178 500 3 (3)
Slovenia 343 165 476 731 73 (79)
South Africa 3 726 313 3 806 427 31 (30)
Spain 11 803 192 12 613 015 10 (10)
Sri Lanka 3 464 297 4 000 000 29 (31)
Sudan 431 232 439 100 76 (72)
Sweden 1 251 424 1 390 504 46 (45)
Switzerland 78 285 99 048 110 (112)
Syrian Arab Republic 685 299 649 005 65 (59)
Thailand 5 897 935 6 648 532 21 (21)
Trinidad and Tobago 567 183 573 217 71 (68)
Tunisia 418 883 466 397 74 (73)
Turkey 4 521 713 5 574 017 24 (24)
Ukraine 516 698 659 541 64 (70)
United Arab Emirates 14 425 039 15 176 524 8 (8)
United Kingdom of Great Britain and Northern Ireland 7 671 299 8 590 282 16 (17)
United Republic of Tanzania 370 764 429 284 77 (77)
United States of America 37 353 574 42 337 513 2 (2)
(continued)
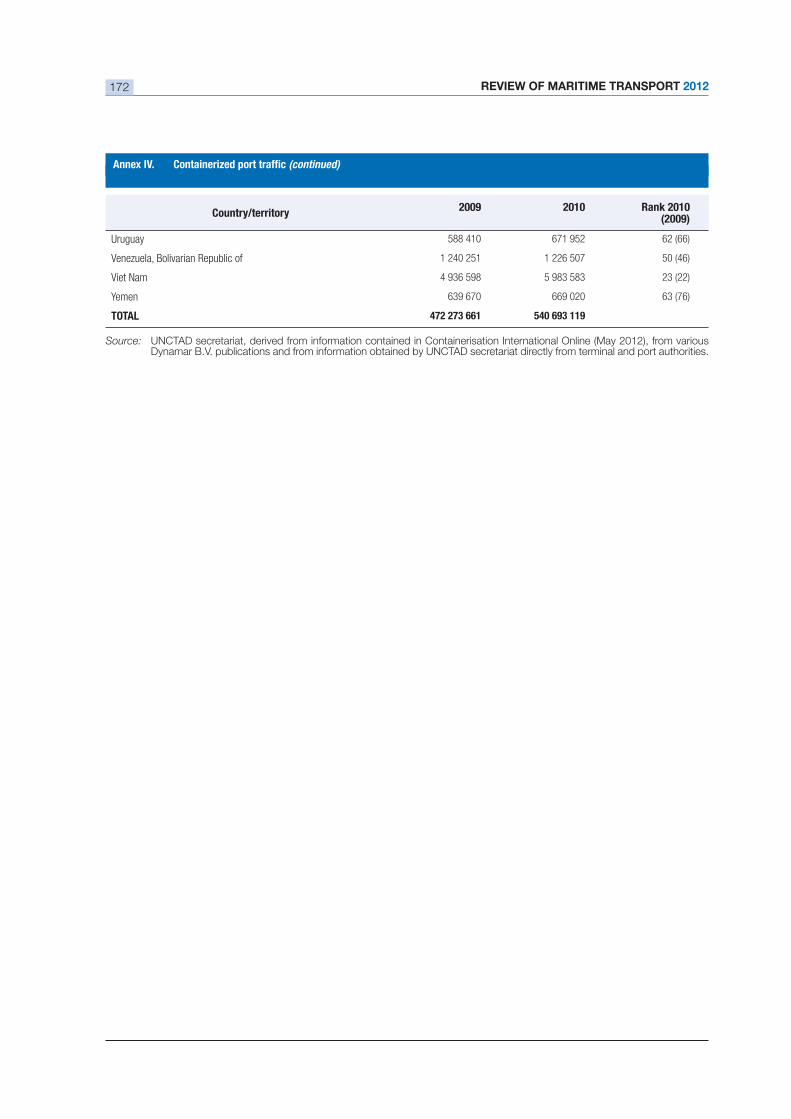
REVIEW OF MARITIME TRANSPORT 2012172
(continued)
Country/territory2009 2010 Rank 2010
(2009)
Uruguay 588 410 671 952 62 (66)
Venezuela, Bolivarian Republic of 1 240 251 1 226 507 50 (46)
Viet Nam 4 936 598 5 983 583 23 (22)
Yemen 639 670 669 020 63 (76)
TOTAL
Source: UNCTAD secretariat, derived from information contained in Containerisation International Online (May 2012), from various Dynamar B.V. publications and from information obtained by UNCTAD secretariat directly from terminal and port authorities.
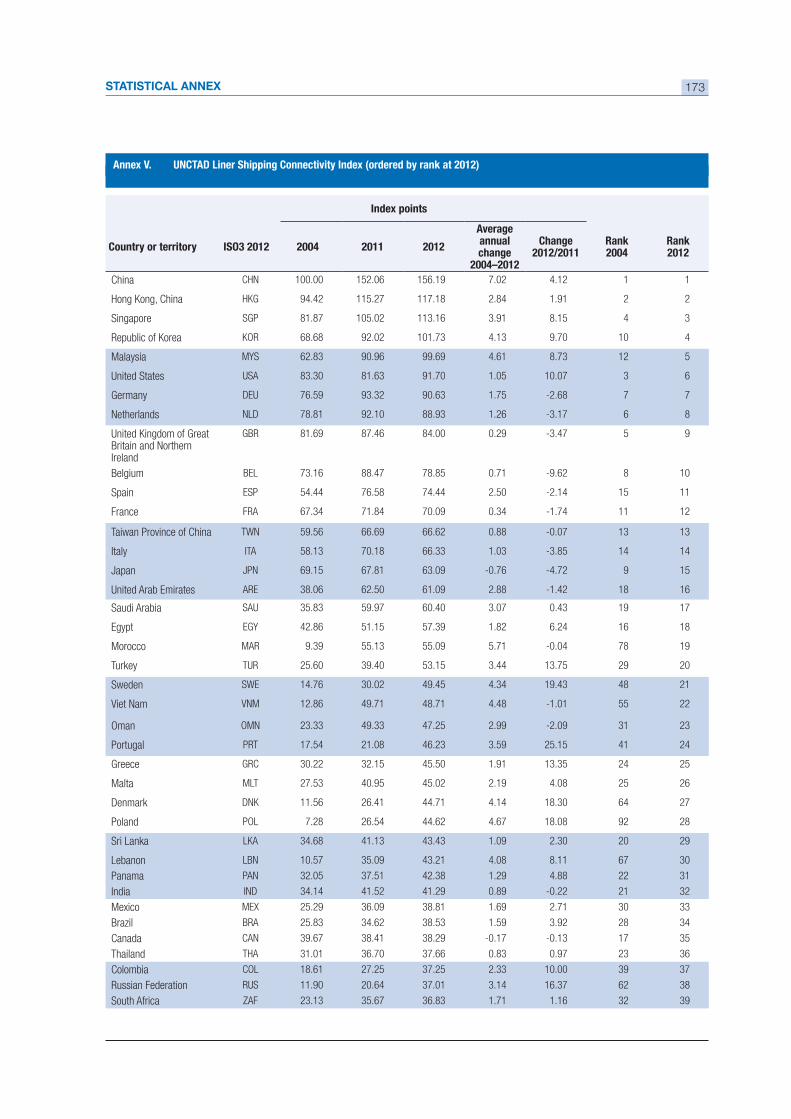
STATISTICAL ANNEX 173
Index points
Country or territory 2004 2011 2012
Average annual change
2004–2012
Change 2012/2011
Rank 2004
Rank 2012
China CHN 100.00 152.06 156.19 7.02 4.12 1 1
Hong Kong, China HKG 94.42 115.27 117.18 2.84 1.91 2 2
Singapore SGP 81.87 105.02 113.16 3.91 8.15 4 3
Republic of Korea KOR 68.68 92.02 101.73 4.13 9.70 10 4
Malaysia MYS 62.83 90.96 99.69 4.61 8.73 12 5
United States USA 83.30 81.63 91.70 1.05 10.07 3 6
Germany DEU 76.59 93.32 90.63 1.75 7 7
Netherlands NLD 78.81 92.10 88.93 1.26 6 8
United Kingdom of Great Britain and Northern Ireland
GBR 81.69 87.46 84.00 0.29 5 9
Belgium BEL 73.16 88.47 78.85 0.71 8 10
Spain ESP 54.44 76.58 74.44 2.50 15 11
France FRA 67.34 71.84 70.09 0.34 11 12
Taiwan Province of China TWN 59.56 66.69 66.62 0.88 13 13
Italy ITA 58.13 70.18 66.33 1.03 14 14
Japan JPN 69.15 67.81 63.09 9 15
United Arab Emirates ARE 38.06 62.50 61.09 2.88 18 16
Saudi Arabia SAU 35.83 59.97 60.40 3.07 0.43 19 17
Egypt EGY 42.86 51.15 57.39 1.82 6.24 16 18
Morocco MAR 9.39 55.13 55.09 5.71 78 19
Turkey TUR 25.60 39.40 53.15 3.44 13.75 29 20
Sweden SWE 14.76 30.02 49.45 4.34 19.43 48 21
Viet Nam VNM 12.86 49.71 48.71 4.48 55 22
Oman OMN 23.33 49.33 47.25 2.99 31 23
Portugal PRT 17.54 21.08 46.23 3.59 25.15 41 24
Greece GRC 30.22 32.15 45.50 1.91 13.35 24 25
Malta MLT 27.53 40.95 45.02 2.19 4.08 25 26
Denmark DNK 11.56 26.41 44.71 4.14 18.30 64 27
Poland POL 7.28 26.54 44.62 4.67 18.08 92 28
Sri Lanka LKA 34.68 41.13 43.43 1.09 2.30 20 29
Lebanon LBN 10.57 35.09 43.21 4.08 8.11 67 30
Panama PAN 32.05 37.51 42.38 1.29 4.88 22 31
India IND 34.14 41.52 41.29 0.89 21 32
Mexico MEX 25.29 36.09 38.81 1.69 2.71 30 33
Brazil BRA 25.83 34.62 38.53 1.59 3.92 28 34
Canada CAN 39.67 38.41 38.29 17 35
Thailand THA 31.01 36.70 37.66 0.83 0.97 23 36
Colombia COL 18.61 27.25 37.25 2.33 10.00 39 37
Russian Federation RUS 11.90 20.64 37.01 3.14 16.37 62 38
South Africa ZAF 23.13 35.67 36.83 1.71 1.16 32 39
Annex V. UNCTAD Liner Shipping Connectivity Index (ordered by rank at 2012)
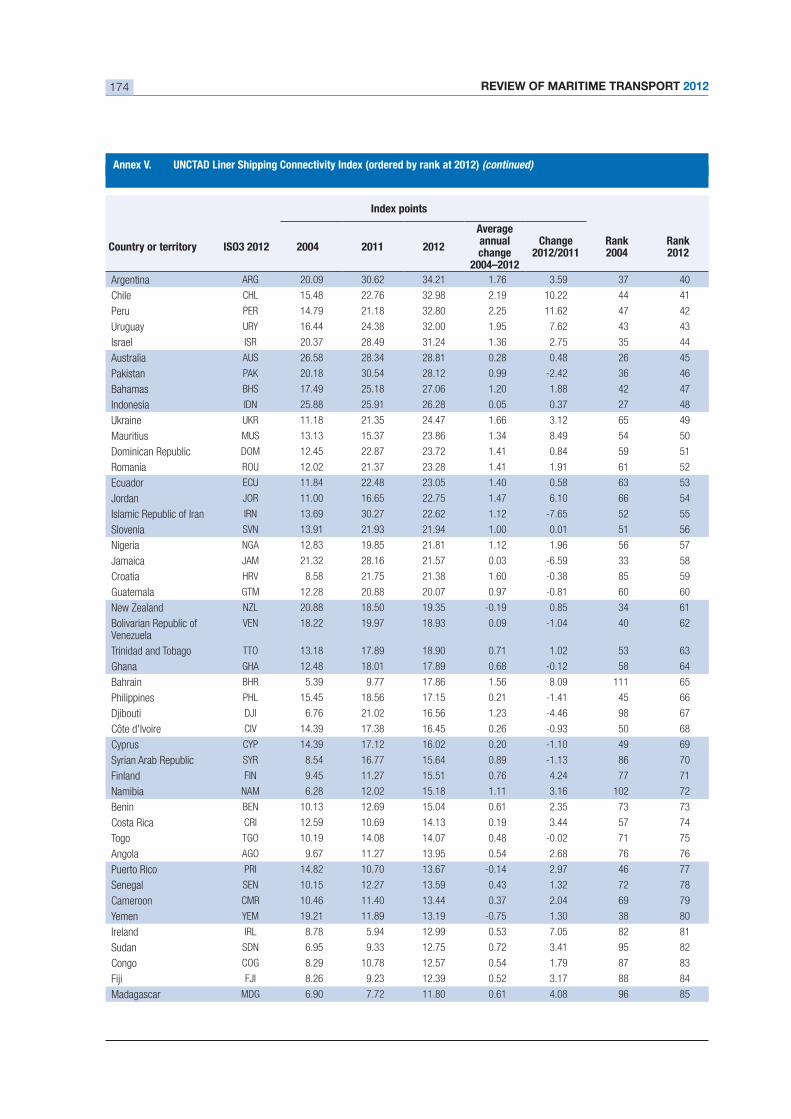
REVIEW OF MARITIME TRANSPORT 2012174
Annex V. UNCTAD Liner Shipping Connectivity Index (ordered by rank at 2012) (continued)
Index points
Country or territory 2004 2011 2012
Average annual change
2004–2012
Change 2012/2011
Rank 2004
Rank 2012
Argentina ARG 20.09 30.62 34.21 1.76 3.59 37 40
Chile CHL 15.48 22.76 32.98 2.19 10.22 44 41
Peru PER 14.79 21.18 32.80 2.25 11.62 47 42
Uruguay URY 16.44 24.38 32.00 1.95 7.62 43 43
Israel ISR 20.37 28.49 31.24 1.36 2.75 35 44
Australia AUS 26.58 28.34 28.81 0.28 0.48 26 45
Pakistan PAK 20.18 30.54 28.12 0.99 36 46
Bahamas BHS 17.49 25.18 27.06 1.20 1.88 42 47
Indonesia IDN 25.88 25.91 26.28 0.05 0.37 27 48
Ukraine UKR 11.18 21.35 24.47 1.66 3.12 65 49
Mauritius MUS 13.13 15.37 23.86 1.34 8.49 54 50
Dominican Republic DOM 12.45 22.87 23.72 1.41 0.84 59 51
Romania ROU 12.02 21.37 23.28 1.41 1.91 61 52
Ecuador ECU 11.84 22.48 23.05 1.40 0.58 63 53
Jordan JOR 11.00 16.65 22.75 1.47 6.10 66 54
Islamic Republic of Iran IRN 13.69 30.27 22.62 1.12 52 55
Slovenia SVN 13.91 21.93 21.94 1.00 0.01 51 56
Nigeria NGA 12.83 19.85 21.81 1.12 1.96 56 57
Jamaica JAM 21.32 28.16 21.57 0.03 33 58
Croatia HRV 8.58 21.75 21.38 1.60 85 59
Guatemala GTM 12.28 20.88 20.07 0.97 60 60
New Zealand NZL 20.88 18.50 19.35 0.85 34 61
Bolivarian Republic of Venezuela
VEN 18.22 19.97 18.93 0.09 40 62
Trinidad and Tobago TTO 13.18 17.89 18.90 0.71 1.02 53 63
Ghana GHA 12.48 18.01 17.89 0.68 58 64
Bahrain BHR 5.39 9.77 17.86 1.56 8.09 111 65
Philippines PHL 15.45 18.56 17.15 0.21 45 66
Djibouti DJI 6.76 21.02 16.56 1.23 98 67
Côte d'Ivoire CIV 14.39 17.38 16.45 0.26 50 68
Cyprus CYP 14.39 17.12 16.02 0.20 49 69
Syrian Arab Republic SYR 8.54 16.77 15.64 0.89 86 70
Finland FIN 9.45 11.27 15.51 0.76 4.24 77 71
Namibia NAM 6.28 12.02 15.18 1.11 3.16 102 72
Benin BEN 10.13 12.69 15.04 0.61 2.35 73 73
Costa Rica CRI 12.59 10.69 14.13 0.19 3.44 57 74
Togo TGO 10.19 14.08 14.07 0.48 71 75
Angola AGO 9.67 11.27 13.95 0.54 2.68 76 76
Puerto Rico PRI 14.82 10.70 13.67 2.97 46 77
Senegal SEN 10.15 12.27 13.59 0.43 1.32 72 78
Cameroon CMR 10.46 11.40 13.44 0.37 2.04 69 79
Yemen YEM 19.21 11.89 13.19 1.30 38 80
Ireland IRL 8.78 5.94 12.99 0.53 7.05 82 81
Sudan SDN 6.95 9.33 12.75 0.72 3.41 95 82
Congo COG 8.29 10.78 12.57 0.54 1.79 87 83
Fiji FJI 8.26 9.23 12.39 0.52 3.17 88 84
Madagascar MDG 6.90 7.72 11.80 0.61 4.08 96 85
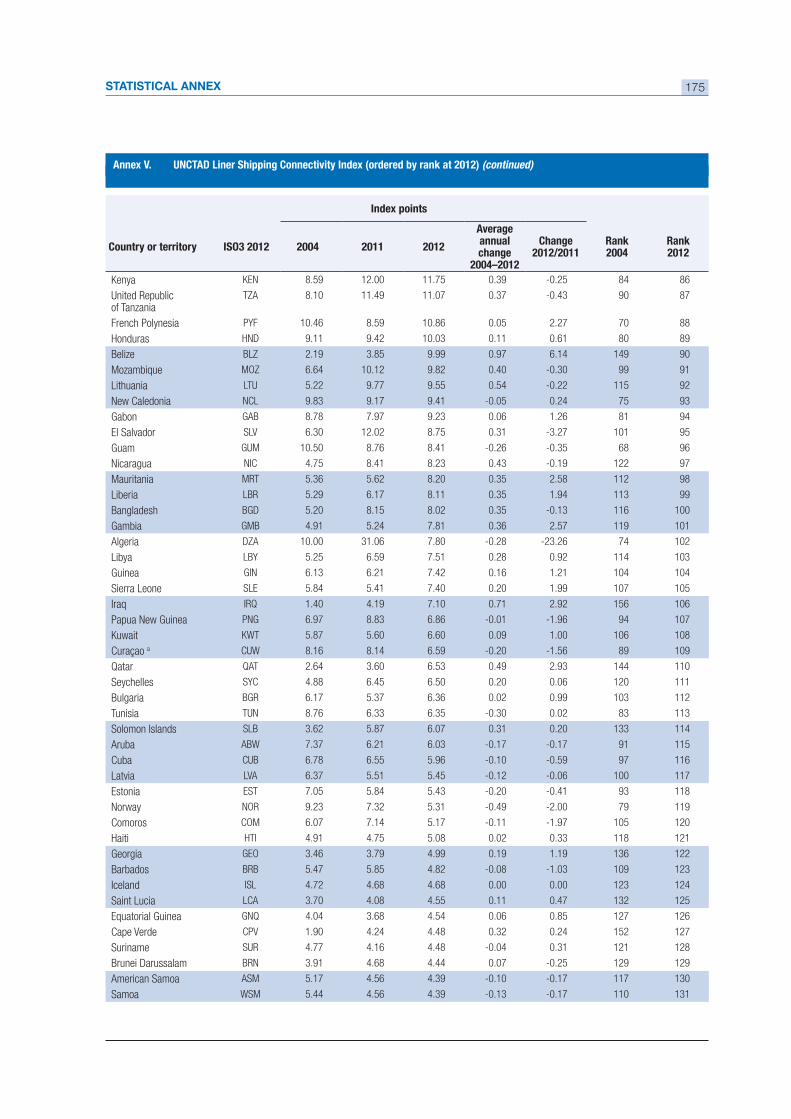
STATISTICAL ANNEX 175
Annex V. UNCTAD Liner Shipping Connectivity Index (ordered by rank at 2012) (continued)
Index points
Country or territory 2004 2011 2012
Average annual change
2004–2012
Change 2012/2011
Rank 2004
Rank 2012
Kenya KEN 8.59 12.00 11.75 0.39 84 86
United Republic of Tanzania
TZA 8.10 11.49 11.07 0.37 90 87
French Polynesia PYF 10.46 8.59 10.86 0.05 2.27 70 88
Honduras HND 9.11 9.42 10.03 0.11 0.61 80 89
Belize BLZ 2.19 3.85 9.99 0.97 6.14 149 90
Mozambique MOZ 6.64 10.12 9.82 0.40 99 91
Lithuania LTU 5.22 9.77 9.55 0.54 115 92
New Caledonia NCL 9.83 9.17 9.41 0.24 75 93
Gabon GAB 8.78 7.97 9.23 0.06 1.26 81 94
El Salvador SLV 6.30 12.02 8.75 0.31 101 95
Guam GUM 10.50 8.76 8.41 68 96
Nicaragua NIC 4.75 8.41 8.23 0.43 122 97
Mauritania MRT 5.36 5.62 8.20 0.35 2.58 112 98
Liberia LBR 5.29 6.17 8.11 0.35 1.94 113 99
Bangladesh BGD 5.20 8.15 8.02 0.35 116 100
Gambia GMB 4.91 5.24 7.81 0.36 2.57 119 101
Algeria DZA 10.00 31.06 7.80 74 102
Libya LBY 5.25 6.59 7.51 0.28 0.92 114 103
Guinea GIN 6.13 6.21 7.42 0.16 1.21 104 104
Sierra Leone SLE 5.84 5.41 7.40 0.20 1.99 107 105
Iraq IRQ 1.40 4.19 7.10 0.71 2.92 156 106
Papua New Guinea PNG 6.97 8.83 6.86 94 107
Kuwait KWT 5.87 5.60 6.60 0.09 1.00 106 108
Curaçao a CUW 8.16 8.14 6.59 89 109
Qatar QAT 2.64 3.60 6.53 0.49 2.93 144 110
Seychelles SYC 4.88 6.45 6.50 0.20 0.06 120 111
Bulgaria BGR 6.17 5.37 6.36 0.02 0.99 103 112
Tunisia TUN 8.76 6.33 6.35 0.02 83 113
Solomon Islands SLB 3.62 5.87 6.07 0.31 0.20 133 114
Aruba ABW 7.37 6.21 6.03 91 115
Cuba CUB 6.78 6.55 5.96 97 116
Latvia LVA 6.37 5.51 5.45 100 117
Estonia EST 7.05 5.84 5.43 93 118
Norway NOR 9.23 7.32 5.31 79 119
Comoros COM 6.07 7.14 5.17 105 120
Haiti HTI 4.91 4.75 5.08 0.02 0.33 118 121
Georgia GEO 3.46 3.79 4.99 0.19 1.19 136 122
Barbados BRB 5.47 5.85 4.82 109 123
Iceland ISL 4.72 4.68 4.68 0.00 0.00 123 124
Saint Lucia LCA 3.70 4.08 4.55 0.11 0.47 132 125
Equatorial Guinea GNQ 4.04 3.68 4.54 0.06 0.85 127 126
Cape Verde CPV 1.90 4.24 4.48 0.32 0.24 152 127
Suriname SUR 4.77 4.16 4.48 0.31 121 128
Brunei Darussalam BRN 3.91 4.68 4.44 0.07 129 129
American Samoa ASM 5.17 4.56 4.39 117 130
Samoa WSM 5.44 4.56 4.39 110 131
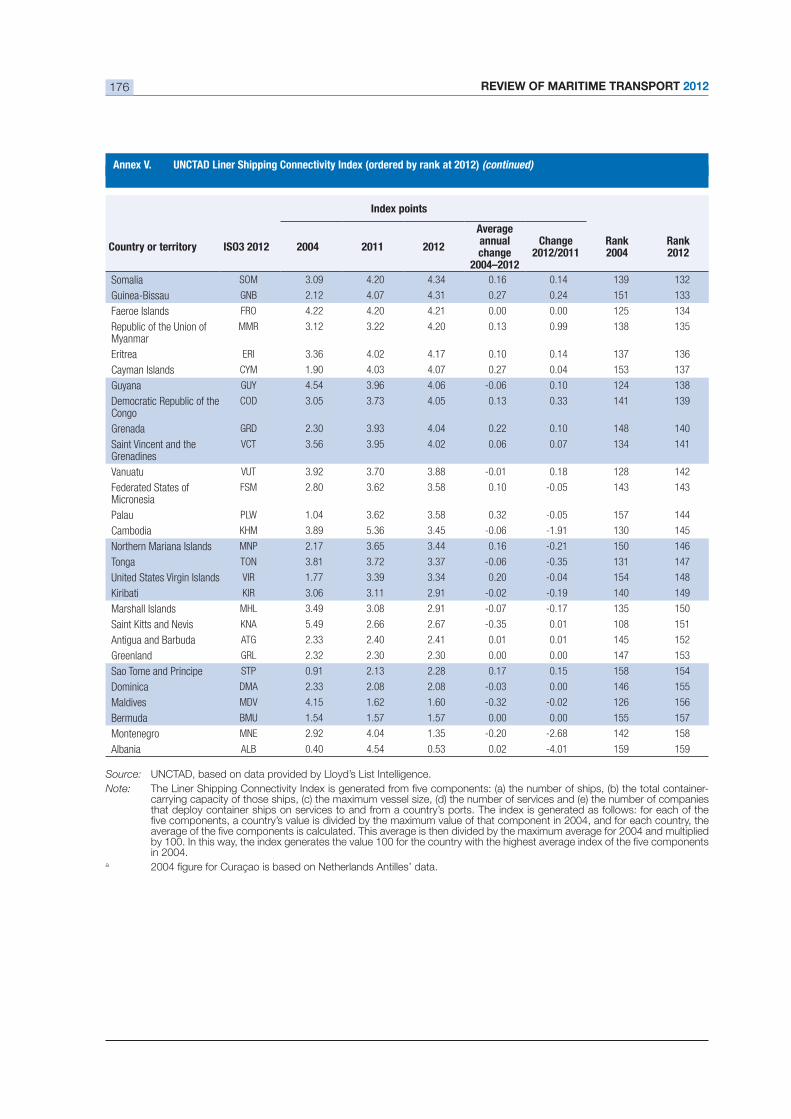
REVIEW OF MARITIME TRANSPORT 2012176
Annex V. UNCTAD Liner Shipping Connectivity Index (ordered by rank at 2012) (continued)
Index points
Country or territory 2004 2011 2012
Average annual change
2004–2012
Change 2012/2011
Rank 2004
Rank 2012
Somalia SOM 3.09 4.20 4.34 0.16 0.14 139 132
GNB 2.12 4.07 4.31 0.27 0.24 151 133
Faeroe Islands FRO 4.22 4.20 4.21 0.00 0.00 125 134
Republic of the Union of Myanmar
MMR 3.12 3.22 4.20 0.13 0.99 138 135
Eritrea ERI 3.36 4.02 4.17 0.10 0.14 137 136
Cayman Islands CYM 1.90 4.03 4.07 0.27 0.04 153 137
Guyana GUY 4.54 3.96 4.06 0.10 124 138
Democratic Republic of the Congo
COD 3.05 3.73 4.05 0.13 0.33 141 139
Grenada GRD 2.30 3.93 4.04 0.22 0.10 148 140
Saint Vincent and the Grenadines
VCT 3.56 3.95 4.02 0.06 0.07 134 141
Vanuatu VUT 3.92 3.70 3.88 0.18 128 142
Federated States of Micronesia
FSM 2.80 3.62 3.58 0.10 143 143
Palau PLW 1.04 3.62 3.58 0.32 157 144
Cambodia KHM 3.89 5.36 3.45 130 145
Northern Mariana Islands MNP 2.17 3.65 3.44 0.16 150 146
Tonga TON 3.81 3.72 3.37 131 147
United States Virgin Islands VIR 1.77 3.39 3.34 0.20 154 148
Kiribati KIR 3.06 3.11 2.91 140 149
Marshall Islands MHL 3.49 3.08 2.91 135 150
Saint Kitts and Nevis KNA 5.49 2.66 2.67 0.01 108 151
Antigua and Barbuda ATG 2.33 2.40 2.41 0.01 0.01 145 152
Greenland GRL 2.32 2.30 2.30 0.00 0.00 147 153
Sao Tome and Principe STP 0.91 2.13 2.28 0.17 0.15 158 154
Dominica DMA 2.33 2.08 2.08 0.00 146 155
Maldives MDV 4.15 1.62 1.60 126 156
Bermuda BMU 1.54 1.57 1.57 0.00 0.00 155 157
Montenegro MNE 2.92 4.04 1.35 142 158
Albania ALB 0.40 4.54 0.53 0.02 159 159
Source: UNCTAD, based on data provided by Lloyd’s List Intelligence.
Note: carrying capacity of those ships, (c) the maximum vessel size, (d) the number of services and (e) the number of companies that deploy container ships on services to and from a country’s ports. The index is generated as follows: for each of the
in 2004. a
Q U E S T I O N N A I R E
Review of Maritime Transport, 2012
In order to improve the quality and relevance of the Review of Maritime Transport, the UNCTAD secretariat would greatly appreciate your views on
this publication. Please complete the following questionnaire and return it to:
Readership SurveyDivision on Technology and LogisticsUNCTADPalais des Nations, Room E.704CH-1211 Geneva 10, SwitzerlandFax: +41 22 917 0050E-mail: [email protected]
Thank you very much for your kind cooperation.
1. What is your assessment of this publication?
Excellent Good Adequate Poor Presentation and readability
Comprehensiveness of coverage
Quality of analysis
Overall quality
2. What do you consider the strong points of this publication?
3. What do you consider the weak points of this publication?
4. For what main purposes do you use this publication?
Analysis and research Education and training
Policy formulation and management Other(specify)
5. How many people do you share/disseminate the Review of Maritime Transport with?
Less than 10 Between 10 and 20 More than 20

6. Which of the following best describes your area of work?
Government Public enterprise
Non-governmental organization Academic or research
International organization Media
Private enterprise institution Other (specify)
7. Personal information
Name (optional):
E-mail: (optional):
Country of residence:
8. Do you have any further comments?
***
HOW TO OBTAIN THIS PUBLICATION
Sales publications may be purchased from distributors of United Nations publications throughout the world.
They may also be obtained by writing to:
300 E 42nd Street, 9th Floor, IN-919J
New York, NY, 10017 USA
Tel: +1-212-963-8302
Fax: +1-212-963-3489
Email:[email protected]
https://unp.un.org/
For further information on UNCTAD’s work on trade logistics, please visit: www.unctad.org/ttl
and for the Review of Maritime Transport 2012:www.unctad.org/rmt2012
E-mail:[email protected]
To read more and to subscribe to the UNCTAD Transport Newsletter, please visit:http://www.unctad.org/transportnews
Pho
to c
redi
t : ©
Jan
Hof
fman
n
USD 95ISBN 978-92-1-112860-4
Printed at United Nations, GenevaGE.12-51936–November 2012–1,980
UNCTAD/RMT/2012
United Nations publicationSales No. E.12.II.D.17ISSN 0566-7682