Developing Service Quality Measurement Approach for the ...
72
Thien Le Developing Service Quality Measurement Approach for the Wholesale Banking Operation Unit of a Bank Helsinki Metropolia University of Applied Sciences Master’s Degree Industrial Management Master’s Thesis 24 April 2017
-
Upload
khangminh22 -
Category
Documents
-
view
6 -
download
0
Transcript of Developing Service Quality Measurement Approach for the ...
Thien Le
Developing Service Quality Measurement Approach for the Wholesale Banking Operation Unit of a Bank
Helsinki Metropolia University of Applied Sciences
Master’s Degree
Industrial Management
Master’s Thesis
24 April 2017

Preface
My study journey has been very interesting and challenging. The journey helped me to
grow and be more professional by introducing me ideas and ways to plan and do rigorous
ground work before the actual execution. I learned how important it is to be very clear of
your object before doing any work. The work should be strictly done to achieve the ob-
jective and only then it is meaningful.
I want to humbly express my gratitude to Mr. Z who help me by introducing me to the
WBO unit of the bank. Thank you, Head of Customer Service, for giving me this oppor-
tunity to showcase my skills.
Thank you, teachers, for giving such helpful guidance. It was a long journey to crystalize
the objective of this thesis and I want to thank Dr. Thomas Rohweder for sharing his
brilliant insights for me to achieve it. My professional English writing skills have improved
a lot thanks to Zinaida Grabovskaia and Sonja Holappa and want to specially thank you
for the patience you had for me.
Thank you, all the stakeholders for interviews and workshops. The experts in the WBO
welcomed me well and helped me to get right information’s and contacts. I want to em-
phasize that this study was done as a co-creation and it would be impossible without the
input of the WBO unit.
Thank you, classmates for the support. The class spirit was very high and I think it moti-
vated us all to graduate. Thank you, family members and friends for believing in me.
Thien Le
Helsinki
April 24, 2017

Abstract
Author Title Number of Pages Date
Thien Le Developing Service Quality Measurement for the Wholesale Banking Operation Unit of a Bank 55 pages + 4 appendices 24 April 2017
Degree Master of Engineering
Degree Programme Industrial Management
Instructors
Dr. Thomas Rohweder, Principal Lecturer Zinaida Grabovskaia, PhL, Senior Lecturer Sonja Holappa, Senior Lecturer
This thesis focus on one of the problem area found in the Customer Satisfaction study made
for the Wholesale Banking Operation Unit (WBO) of the bank. The selected problem is poor
accessibility to phone service. Accessibility to Service is one of the strategic focus points of
the bank. It is necessary to measure the problem to manage it. Therefor the objective of this
thesis is to develop a set of suitable Key Performance Indicators and a measurement of
Service Quality of Phone Accessibility.
This thesis reveals that the WBO unit needs to urgently act to improve Phone Accessibility
Service Levels. Phone calls are answered too slow and too many customers are hanging up
the phone before accessing to the service.
Good customer service is also about avoiding doing anything that could annoy the custom-
ers. Letting customers to wait on the line annoys them. Better Phone Accessibility would
improve customer satisfaction and therefore also improve customer loyalty and profitability.
The measurement model can be replicated to other problem areas and introduced to other
departments of the bank.
The customers might be annoyed if they are always bothered with survey questions. The
measurement model is not based on survey questions and can be repeated periodically
without annoying the customers.
Keywords Service Quality, Key Performance Indicator, Measurement, Accessibility, Banking Industry, Customer Satisfaction

4
Contents
Preface
Abstract
Table of Contents
List of Figures
List of Tables
1 Introduction 1
1.1 Business Context 1
1.2 Business Challenge, Objective and Outcome 2
1.3 Thesis Outline 2
2 Method and Material 4
2.1 Research Approach 4
2.2 Research Design 5
2.3 Data Collection and Analysis 7
3 Current State Analysis 11
3.1 Overview of Current State Analysis Stage 11
3.2 Background of the Unit, Its Services and Customer Service Descriptions 12
3.2.1 Customer Segmentation 12
3.2.2 Customer Service in the Unit 13
3.2.3 Annual Customer Satisfaction Benchmark Study (Secondary Data) 15
3.3 Primary Data Analysis 17
3.4 Summary of the Key Findings from the Current State Analysis 25
4 Best Practice of Building Service Quality Measurement 28
4.1 Measuring Service Quality 28
4.2 Building Key Performance Indicators 32
4.3 Service Accessibility KPI’s in Call Centers 35
4.4 Conceptual Framework of Service Quality KPI Measurement of Accessibility by Phone 36
5 Building Proposal on Service Quality KPIs for Customer Service Phone Accessibility and Measurement Model for the WBO unit 39
5.1 Overview of Proposal Building Stage 39
5.2 Identified KPIs for Service Quality of Phone Accessibility 39
5.3 Skype Raw Data Analysis 41
5
5.4 Proposal Draft 41
6 Validation of the Proposal 45
6.1 Overview of Validation Stage 45
6.2 Summary of Final Proposal 45
6.3 Quality Attributes of the KPI Measurement 47
6.4 Next Steps and Recommendations 49
6.5 Managerial Implications 51
7 Conclusions 52
7.1 Executive Summary 52
7.2 Thesis Evaluation 54
7.2.1 Logic 54
7.2.2 Relevance 54
7.2.3 Validity 54
7.2.4 Reliability 55
References 1
Appendices
Appendix 1. Measurement Expectation
Appendix 2. Customer Journey (FX)
Appendix 3. Customer Journey (Custody)
Appendix 4. Measurement Calculations

6
List of Figures
Figure 1. Research design of this study.
Figure 2. Details of data 1-3 collections.
Figure 3. Performance benchmark (based on the Annual customer satisfaction bench-
mark study, 2016).
Figure 4. Customer experience statements: six problem areas (based on the Annual
customer satisfaction benchmark study, 2016).
Figure 5. Raw data sources (CSA findings).
Figure 6. Six Stages of Proactive Balanced Scorecard (Chytas et al. 2011).
Figure 7. Service Quality KPI Measurement of Accessibility by Phone (Conceptual
Framework).
Figure 8. The Measurement Model (as suggested in the conceptual framework).
Figure 9. KPI Relationship Map (as defined in co-creation session).
Figure 10. Measurement Result (calculated with initial proposal for validation).
Figure 11. Measurement hierarchy 1 (next step recommendation to the WBO unit).
Figure 12. Measurement Hierarchy 2 (next step recommendation to the WBO unit).

7
List of Tables:
Table 1. Customer segmentation in the bank.
Table 2. Service descriptions of FXMM and Custody Services.
Table 3. Contact preferences of the customers (from the Annual customer satisfaction
benchmark study, 2016).
Table 4. Annual customer satisfaction benchmark study 2016 (overview).
Table 5. Report template, Area 1 (Trade Confirmations are late).
Table 6. Report template, Area 2 (Service is slow).
Table 7. Report template, Area 3 (Service is Rude).
Table 8. Report template, Area 4 (Poor accessibility to the Outlook service).
Table 9. Report template, Area 4 (Poor accessibility to the Skype service).
Table 10. Report template, Area 5 (Confirmations are late).
Table 11. Report template, Area 6 (FXMM Error handling process is slow).
Table 12. Report template, Area 6 (Custody Service Error handling process is slow).
Table 13. Missing data (CSA findings).
Table 14. Service Quality Dimensions (Parasuraman et al. 1988: 23).
Table 15. Suggested Service Quality Measurement.
Table 16. Data Analysis Sub-Categories (Staron et al 2016: 175).
Table 17. Data Analysis KPI Quality Attributes (Staron et al. 2016: 176).
Table 18. Phone accessibility: Service Quality KPIs (Anton 1997. Cited in: Feinberg et al
2002: 175).
Table 19. Identified Service Quality KPIs for Phone Accessibility (from literature and the
current state analysis).
Table 20. KPI Analysis (co-creation with WBO unit in workshop).
Table 21. Result Scale (co-creation with WBO unit in workshop).
Table 22. Initial Proposal (developed based on Measurement Model).
Table 23. KPI Results (after validation).
Table 24. KPI Measurement Quality Attribute Results (answers from validation work-
shop).
1
1 Introduction
This thesis explores the use of generic customer satisfaction measurement data to cre-
ate a more pragmatic Service Quality measurement model that the bank can use to im-
prove its services. The banking industry is heavily regulated and the only way to differ-
entiate is to be more customer centric than competitors. This means providing better
services to satisfy the customer. To continuously improve the service level of the bank,
the bank needs to have means to measure service quality. In the end, any service im-
provement should have a positive effect on customer satisfaction levels.
Business practice suggests that satisfied customers are more likely to use the service
again and thus generate more revenue. Satisfied customers are more likely to promote
the company to their own personal network, which in turn will help the company to attract
more customers. It is crucial to the bank to know where in the provided service the cus-
tomer is not satisfied so that the company would know what to improve. Unsatisfied cus-
tomers will change to another bank and, in the worst case, spread poor report by word
of mouth about the bank to their networks leading to fewer potential customers. As Jim
Proebstle, a famous consultant and president of Prodyne Inc. and NAMA knowledge
source partner says:
‘’Customer Satisfaction is a proactive, offensive strategy in every
business’’ (Refermat, 2010)
As such, the first logical step to improve service should be to measure service quality in
a meaningful way that would give crucial information for the next steps.
Following this logic, this Thesis concentrates on developing the service quality measure-
ment model that indicates to improvement areas that would lead to higher customer sat-
isfaction. With this information, the bank can evaluate their service levels effectively and
informatively.
1.1 Business Context
The case company of this Thesis is a bank, and the case unit that the study is carried
out for is the Wholesale Banking Operation Unit. This unit serves Finnish speaking cus-

2
tomers in wholesale banking. This unit mostly serves corporate and institutional custom-
ers that require services in Foreign Exchange and Money Markets (FXMM) and Custody
Services.
1.2 Business Challenge, Objective and Outcome
The case company’s strategy is to be customer centric. To implement this strategy in the
Customer Service unit the first step is to find a way to measure service quality to manage
the service level. The bank has ordered an annual customer satisfaction benchmark
study from an external consulting company, and the bank receives the result once a year.
The benchmark is used for comparing how their service compares to other banks but it
is too generic and is not pragmatic enough to be utilized as a service development tool.
This benchmark makes a foundation for developing a more pragmatic Key Performance
Indicator (KPI) based measurement approach model that shows where and what to im-
prove.
Accordingly, the objective of this study is to develop a KPI-based measurement approach
to perform more detailed service quality measurement using a select problem area as
an example for the Wholesale Banking Operation unit in Finland.
The outcome of this study is, thus, a KPI-based measurement approach and a detailed
service quality measurement for one case example.
1.3 Thesis Outline
The scope of this study includes developing a set of KPIs for one problem area and the
KPI measurement of it. The study uses the problem areas found in the Customer Satis-
faction survey to analyse how the Unit could get service quality information inde-
pendently. One of the problem areas is chosen to find out what kinds of KPIs could be
useful in operationalization of the problem.
This thesis is written in seven sections. Section 1 contains the thesis introduction. Sec-
tion 2 describes the methods and materials used in this thesis. Section 3 contains the
current state analysis (CSA). This section gives the understanding of what kind of cus-
tomer satisfaction data is valuable to the unit and what kind of data is already available.

3
This understanding is obtained based on interview analysis and process descriptions.
Section 4 contains a literature review where existing knowledge about the issues raised
in Section 3 are discussed. To address the issues found in Section 3, a conceptual
framework is built from the relevant elements of theories and existing knowledge. In Sec-
tion 5, the conceptual framework is used together with key findings found in the CSA to
build an initial proposal; this proposal is built in co-creation with WBO unit. Section 6
discusses the results from testing the initial proposal in a pilot run. Section 7 summarises
the findings of the study.

4
2 Method and Material
This section describes the research approach, research design and data collection and
analysis. The goal of this section is to give an overall picture of how this study was con-
ducted.
2.1 Research Approach
The research approach selected for this study is a qualitative case study. Qualitative
case study is a research approach that takes a problem or a challenge and thoroughly
investigates its environment and root causes or Robert K. Yin says:
‘’A case study is an empirical inquiry that investigates a contemporary phenom-
enon within its real-life context, especially when the boundaries between the
phenomenon and the context are not clearly evident. The case study inquiry
copes with the technically distinctive situation in which there will be many
variables of interest that data points and as one result relies on multiple
sources of evidence, with data needing to converge in a triangulating fashion,
and as another result benefits from the prior development of theoretical proposi-
tions to guide data collection and analysis.” (Yin 2003: 13-14)
Qualitative research uses qualitative data collection methods, such as interviews and
workshops. This is especially true for the case study which typically relies on:
‘’Public information, company-internal documentation and implicit/explicit
knowledge collection (workshops, interviews) in-house or using bench-
marks of competitors, similar units in other fields.’’(Huhta 2014)
The data provides a holistic picture of the current state to pin point problem areas that
need to be fixed.
In this study, the author acts as an external consultant that focuses on exploring the
insights coming from the case company’s experts, with the aim to learn about the case
and share this learning with the case company. The case company is then left to act
upon the learnings and insights from the case.

5
This study is a prototype testing to a theory. The theory that is tested is the recommended
solution. It is tested on one problem area and it will be reviewed how well it will be repli-
cated to other substances.
2.2 Research Design
Research design is a framework that illustrates how the research is executed. The re-
search design in this study has five steps and three data rounds with four outcomes, as
shown in Figure 1 below.

Appendix 2
1
Figure 1. Research design of this study.

7
As seen in Figure 1, the first step was to define the objective. The next step is to conduct
the current state analysis (CSA) on Customer Services of WBO unit with Data 1. The
CSA is done by gathering and analysing the primary and secondary data. The outcome
of this step is the key findings of the CSA. The findings from Data 1 serve as a guideline
for what to look for in literature. Therefore, in order to search for valuable input from
existing knowledge and literature, the study needs to identify the needs and challenges
of the case company. Only then will it be possible to find literature that is valuable to the
study. With these key findings, the next step is to use them to find relevant existing
knowledge from literature and best practice, in order to build a conceptual framework.
The conceptual framework will serve as a tool to build a relevant, knowledge based pro-
posal for the case company. Thus, this study aims for a synthesis of input from relevant
theories that support building the solution.
The conceptual framework in this study serves as a draft of elements and methods to
build a unique service quality measurement model, tailored for the context of the case
company. Then, the conceptual framework and key findings from the CSA are merged
into the initial proposal, and introduced to the case company’s experts through co-crea-
tion. The initial proposal is built in the workshops used as means for co-creation. In these
workshops, the experts evaluate the draft and give comments and inputs to improve it.
This is a method to confirm that the proposal will be useful and meaningful to the case
company. The comments and inputs will serve as input (Data 2) to the initial proposal. In
this manner, the Initial proposal for the service quality measurement model is built.
The initial proposal is tested with one of the problem areas. This means extracting ser-
vice quality measurement data and applying it to the initial proposal approach to analyse
the data. The proposed approach is then fine-tuned based on the results, and feedback
(Data 3) is analysed to build the final proposal.
2.3 Data Collection and Analysis
This study uses three rounds of data collection, 1-3. The details of data 1-3 collection
rounds are summarized in Table 1 below.

8
The primary data for this study comes from interviews and workshops as well as internal
documents from the company. The case company provided Customer Journey Descrip-
tions (Appendix 2 & 3) that help to create Service Descriptions (Table 2). In addition, this
study also uses the secondary data.
The secondary data is the annual customer satisfaction benchmark study ordered by the
case company from an external consulting company, and the results of which the bank
receives once a year. The benchmark is used for comparing how the case company’s
service compares to other banks’ service. This benchmark is used since it makes a foun-
dation for developing a more pragmatic and systematic model to gather service quality
data that would show where and what to improve. The current annual customer satisfac-
tion benchmark study is considered too generic and is not pragmatic enough to be uti-
lized as a service development tool.
With both the primary and secondary data, the study provides a holistic view of the busi-
ness challenge and its immediate environment.
Figure 2 below shows details of data 1-3 collections.

9
Data collection point
Data Source Content of data col-lection
Outcome of data collection
Participants Date & duration
Current State Analysis
Data 1a Documents Service Descriptions Understanding of measurement en-vironment
From Head of Cus-tomer Service
15.01.2017
Data 1b Documents Customer Journey Descriptions
Understanding of customer touch points
From expert 2 and Head of Customer Service
15.01.2017
Data 1c Interview Measurement expec-tations
Understanding of requirements
Head of Customer Service and 3 ex-perts
18-27.01.2017 30min-1h
Data 1d Interview Operation systems and measurement points
Understanding of available usable data
2 IT experts 08.02.2017 1h 13.02.2017 1h
Building proposal for KPI’s
Data 2a Workshop Inputs to proposal Initial Proposal With expert 1 15.03.2017 1h
Validation of Proposal Data 3a Workshop (via
email) First extract of ser-vice quality measure-ment
Initial measure-ment result
With expert 1 16.03.2017
Data 3b Workshop Feedback of measu-rement
Improvement in-puts
Head of Customer Service and expert 1 29.3.2017 46min
Figure 2. Details of data 1-3 collections.

10
As shown in Figure 2, data collection is done in three rounds.
Data 1, for the current state analysis, collects data to gain an understanding of the case
company’s operating environment and the current tools for measuring customer satis-
faction and the expectations. Data 1 is used to find the gaps in the current practices for
measuring customer satisfaction. These identified gaps will later guide the search for
useful existing knowledge and best practice from literature. The relevant elements iden-
tified from literature are then merged into the conceptual framework that is built based
on best practice and theories. After that, the conceptual framework is used to build a
proposal for the case company, with the help of experts.
The interviews conducted for Data 1 collection used question templates that were spe-
cially designed for them. In Data 1c collection, the Head of the Customer Service and
three experts from the WBO unit were interviewed. In Data 1d, two IT experts were in-
terviewed based on the findings from Data 1c. Questions for Data 1 interviews and a
summary of the field notes can be found in Appendix 1.
Data 2 collects data to build a proposal for the case company, with the help of the case
company experts. These data are collected from the workshops conducted in the case
company. Data 2 was constructed with the Expert of the WBO unit, who was appointed
to help by the Head of Customer Service. Questions for Data 2 interviews and a summary
of the field notes can be found in Appendix 2. The outcome of Data 2b is the initial meas-
urement result.
Data 3, validation of proposal, was gathered from workshop with the WBO unit gives
improvement suggestions to the suggested measurement model. A summary of Data 3
field notes can be found in Appendix 3.
Next section is the beginning of the research. As mentioned in research design, it is the
current state analysis of the Customer Services of WBO unit.

11
3 Current State Analysis
This section discusses about the context of the current service of the bank and the cur-
rent means for evaluating customer satisfaction. The sections starts by describing the
service (in Section 3.2) and the analysis of the key issues found with report templates (in
Section 3.3). It summarize the issues that are needed to be solved in key findings in
current state analysis (in Section 3.4).
3.1 Overview of Current State Analysis Stage
The goal of the CSA is to describe and analyze the current situation and explain what is
currently available as the means for measuring customer satisfaction, what is currently
possible to measure with these means, and what is not in; as well as to establish what
is needed for measuring service quality in a pragmatic and systematic way. To reach this
goal, the Current state analysis follows a three-step logic.
The first step aims to understand the operating environment with Data 1 documents 1A
(Service Descriptions) and 1B (Customer Journeys) and identify the key issues related
to Customer Satisfaction.
The second step uses the key issues to conduct 1C (Requirements and needs analysis)
interviews to find out what kind of data elements are needed to further analyze the iden-
tified issues.
The third step was done to establish if there are data elements already existing in the
systems in use that can be drawn out into the reports. These insights from Data 1 are
collected in 1D (Operating System and Measurement Points) interviews, with the help of
an IT expert.
Finally, the CSA also gives a summary of issues that needs to be solved and argues why
these issues, among many others, were selected. These selected issues will give a foun-
dation for the search for best practice and existing knowledge in the next section, Liter-
ature review.
The findings and details of the CSA are described below.

12
3.2 Background of the Unit, Its Services and Customer Service Descriptions
The case unit of this study is the Wholesale Banking Operation (WBO) unit. This unit is
now divided in two functions, the Foreign Exchange (FX) and Money Markets (MM); and
the Custody Services.
The WBO unit has recently gone through some structural changes. Before the structural
change, they had three product-groups called Fixed Income, Foreign Exchange and
Derivate. After the structural change, they now have product groups called Foreign Ex-
change (FXMM) and Custody Services.
3.2.1 Customer Segmentation
In the current service concept, for providing high quality services, the bank needs to
know to which segment the customer seeking certain services belongs to. Typically,
companies do segmentation because of resource planning. For the bank, it is also im-
portant to prioritize important customer’s that bring more revenue to the company com-
pared to the other customers.
Customer Service is not using a segmentation system of their own but, uses the seg-
mentation of the bank as a guideline. Currently, the bank uses a three-tier segmentation
as shown in Table 1 below.
Table 1. Customer segmentation in the bank.
As seen in Table 1, there are three types of customers: Tier 1, Tier 2 and Tier 3. Tier 1
customers are the most important and they have their own key account managers. Tier
1 customers always have top priority in Customer Service.
Currently, criteria for the segmentation includes Revenue/ Volumes per Today/Yester-
day, Revenue/ Volume potential, Cross-Asset, where revenues are sum up from all the
13
product categories and Service effectiveness where the service value is compared to
revenue potential.
In the WBO Unit, the FXMM customers are companies. The customers of Custody Ser-
vice are Asset Managers. Asset Managers manage their own customers’ assets and they
represent their customers in front of the bank. All the asset managers are treated equally
but revenue and revenue potential have an effect if there is a need in changing of the
pricing or/and customer activity has changed from agreements.
From the customer’s perspective, the WBO unit in its both functions, i.e. Foreign Ex-
change (FXMM) and Custody Services, have one point of service entry, namely the Cus-
tomer Service. In the next Section 3.2.2 the Customer Service is described.
3.2.2 Customer Service in the Unit
The Customer Services are responsible for customer’s overall customer satisfaction be-
cause they are the customer interface. The main communicating tool with the customer
is email and telephone. They have one Microsoft Outlook mailbox and one common
Skype telephone service number where the customer can contact the Customer Service.
After the initial contact by the customer, a handler from Customer Service will pick up
the case and then there might be communication through the handler’s own email ad-
dress or phone number.
FXMM and Custody Services have different kinds of services and the future goal of the
Customer Services is that all the handlers would master all of them. The current services
of the Unit are summarized in Table 2 below.

14
Table 2. Service descriptions of FXMM and Custody Services.
As shown in Table 2 above, the main responsibility of Customer Services is to make sure
the service is smooth and stress-free for the customer throughout the service process.
The similarity in these two services is proactively checking that the needed information
is sufficient and correct.
As mentioned before, currently, Customer Service acts as one point of entry for the cus-
tomer. Table 3 below shows contact preferences of the customer.
Table 3. Contact preferences of the customers (from the Annual customer satisfaction
benchmark study, 2016).
As seen in Table 3, 46% of the customers in 2016 preferred ‘’A group number to gener-
alists that cover all areas’’. These generalists are handlers that work for customer service
and they have the capabilities to solve all the issues within customer service area. It
seems that it could become a trend if the growth in the preference continues like from

15
2015 to 2016.This preference matches the WBO’s goal to train all the Customer Service
handlers to be these kinds of generalists. The next Section 3.2.3 describes how well the
Customer Service has performed compared to competition.
3.2.3 Annual Customer Satisfaction Benchmark Study (Secondary Data)
The Wholesale Banking Operation (WBO) orders annually a study from an external con-
sultant to benchmark their services to their competitors. The last benchmark was done
before the structural changes so the product groups are representing that time as sum-
marised in Table 4 below.
Table 4. Annual customer satisfaction benchmark study 2016 (overview).
In Table 4, the Back office highlighted refers to the Customer Service function. Since this
study focuses on the Customer Service function, changes in the product groups are not
harmful. The importance is to find similar kinds of problems throughout the product
groups in FXMM and Custody Services. The target is to be able to find an approach to
address problems in both services, FMXX and Custody Services.
As shown in Table 4, the Annual customer satisfaction benchmark study is based on
interviews conducted in 39 different banks by telephone from 20 May 2016 to 21 June
2016.
In 2016, based on the results of the annual study, the performance of the bank compared
to the competitors is top class, as shown in Figure 3 below. Still, the problem is that there
is little difference with the competition.

16
Figure 3. Performance benchmark (based on the Annual customer satisfaction bench-
mark study, 2016).
As seen in Figure 3, the bank has the best overall performance score. The trend is show-
ing positive development since a big drop in 2014 in performance. In 2016, the bank is
in the first or second place in almost every performance category. In category ‘’Accurate
Confirmation’’ the bank is in the fifth place and ‘’Settlement Efficiency’’ in the third place.
In these categories, there is room for improvement. In Accessibility the bank was ranked
second with the satisfaction score 4,11 on a scale from one to five.
The most valuable information of the benchmark is qualitative and descriptive data that
was drawn from the interviews. This data analysed customer experience descriptions
and helps to analyze what kind of information is needed to tackle the issues mentioned
in the interviews. Based on the results of the interviews there are six statements sum-
marized from the interviews into six problem statements. Figure 4 below shows the six
problem statements.

17
Figure 4. Customer experience statements: six problem areas (based on the Annual
customer satisfaction benchmark study, 2016).
The six problem areas in Figure 4 provide the focus for the interviews conducted in the
WBO unit. An interview template was created to find out what kind of data is needed to
tackle the problem areas found in Figure 4. The next subsection analyses the findings
from these interviews.
3.3 Primary Data Analysis (Current State, Needs and Requirements Interviews)
Four people from the WBO unit were interviewed, including The Head of the unit and
three experts. According to the Head of the unit, these people should be able give a
sufficient and holistic view of what kind of data is needed to further analyze the problem
areas.
Next, the problem statements are analysed in more detail, describing the results of the
CSA, needs and requirements interviews.
Problem statement 1, “Trade Confirmations are late”
The statement “Trade Confirmations are late” is related only to the FXMM side because
the Custody Services do not deal with Trade Confirmations. A data report template was
created to analyze the issues mentioned in this statement, as shown in Table 5 below.

18
Table 5. Report template, Area 1 (Trade Confirmations are late).
As seen in Table 5, “Confirmation Sender” indicates if the confirmation was sent by the
customer or the bank and this enables choosing the point of view. Customer ID indicates
the name of the customer company. Customer type indicates to which customer segment
this customer belongs. Deal Reference indicates the specific deal number.
‘Handler’ indicates the customer service worker from the WBO unit that is handling the
case. ‘Confirmation channel’ indicates the channel that sends a confirmation to the cus-
tomer. Processing channel indicates the system in the bank that processes the confir-
mation. ‘Receiving system’ indicates which system receives the confirmation from the
processing system. ‘Product type’ indicates what kind of service is dealt with. ‘Type of
procedure’ indicates the point in the confirmation process. ‘Confirmation receive time’
indicates the time confirmation was received in the processing system. ‘Day of week’
indicates the day of week that the confirmation was received. ‘Confirmation send time’
indicates the time the confirmation was sent from the processing system to the receiving
system. ‘Error type’ indicates an error that slows the process down if there was one.
‘Type of insufficient information’ indicates what kind of insufficient information was in-
volved if the error type was insufficient information.
In the interviews, the Head of Customer Services stated, as follows:
‘’There are European Market Infrastructure Regulations (EMIR) rules
on how fast the confirmation is needed to be sent’’ (Head of Customer
Services)
As this citation illustrates, the Head of Customer Services points out that this issue is not
only related to customer experience but is also heavily regulated.

19
Among the most important categories for the Unit, this report template in Table 3 points
to the ‘Elapsed Times’ from the time the confirmation is received to the time it is sent
forward. This report makes it possible to see what the most common reasons for delayed
confirmations were to pin point problem areas. There are also possibilities to see the
elapse time statistics per each ‘handler’, ‘customer type’, ‘confirmation channel’, ‘pro-
cessing system’, ‘receiving system’, ‘product type’, ‘type of procedure’, ‘day of week’ and
‘error type’.
Finally, the category ‘Supporting reports’ points to four types of supporting reports. ‘Audit
log’ and ‘Status log’ is already in use. ‘Audit log’ shows the whole history of the confir-
mation and ‘Status log’ shows the time stamps of different statuses that the confirmation
has had. However, the results of the interviews indicate that the Unit is currently missing
‘System update log’ and ‘Average response time report’. ‘System update log’ would tell
if the reason for the delay was a system update at that time. ‘Average response time’
would allow comparing different response times to the average.
Importantly, all the data needed for making this report in the report template is currently
available as raw data in the FXMM legacy systems.
Problem statement 2, “Service is slow”
The statement “Service is slow” can only mean long response times to a customer in-
quiry/request. The main communicating tools are Skype phone calls and e-mail. In Skype
calls, the inquiry/requests are dealt with immediately or the communication is changed
into e-mail designed for Outlook, the email platform in use in the unit.
The report template summarized the categories of customer experience relevant to Prob-
lem area 2, as shown in Table 6 below.

20
Table 6. Report template, Area 2 (Service is slow).
As seen in Table 6, the key categories related to the customer experience in problem
area 2 often repeat the categories already used for Area 1. In this template, ‘Request
type’ indicates type of service request that the customer asks from the handler. ‘Case
open’ and ‘Case close time’ indicates when the case was opened to process and closed.
‘Elapsed time’ indicates the time it took to process the case. ‘Handler’s comment’ indi-
cates to handler’s comment if there was any special reason for delay.
“It would be valuable to know what the response time is to the received
email and who responded in customer service’’ (Expert in Custody Ser-
vices)
As this citation illustrates, Expert in Custody Services points out that to analyze the prob-
lem area, the response time is the key. The response time is translated to elapsed time
in the report template.
As seen in Table 5 earlier, the main criteria related to customer expectation in Area 2
also include information of ‘Elapsed time’ from the time when the case is opened to the
time the case is closed. There are possibilities to see elapsed time statistics per ‘cus-
tomer type’, ‘handler’, ‘type of procedure’, ‘product type’ and ‘request type’.
Finally, the category ‘Supporting reports’ points to three types of supporting reports. All
of the three types of supporting reports the Unit is currently missing. First is the ‘System
performance log for all relevant systems’ that would help to find out if the delay was
because of some system malfunction. Second is the ‘Warning report for the next three
days if expected to have low performance in any relevant systems’. The third report is
the ‘Outlook queue log’ that would show how many unread messages there are in the
group inbox in a time line.
21
Importantly, all the data needed for making this report in the report template is currently
available as raw data in the FXMM legacy systems.
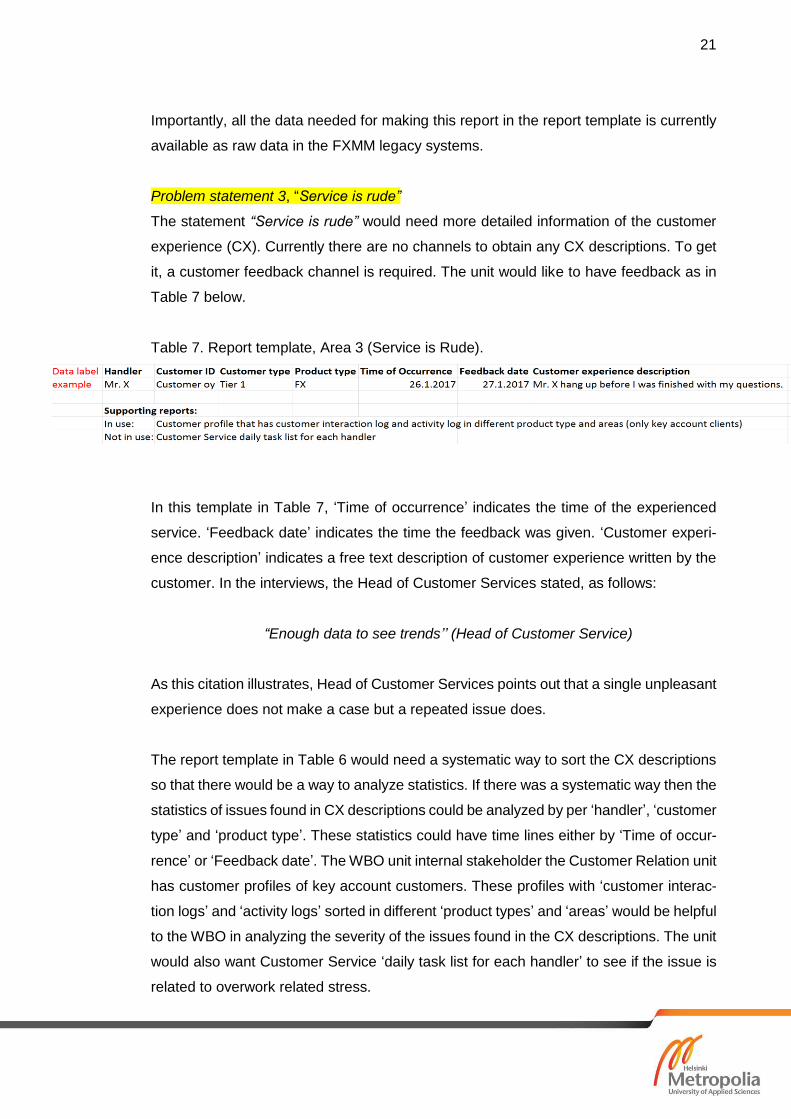
Problem statement 3, “Service is rude”
The statement “Service is rude” would need more detailed information of the customer
experience (CX). Currently there are no channels to obtain any CX descriptions. To get
it, a customer feedback channel is required. The unit would like to have feedback as in
Table 7 below.
Table 7. Report template, Area 3 (Service is Rude).
In this template in Table 7, ‘Time of occurrence’ indicates the time of the experienced
service. ‘Feedback date’ indicates the time the feedback was given. ‘Customer experi-
ence description’ indicates a free text description of customer experience written by the
customer. In the interviews, the Head of Customer Services stated, as follows:
“Enough data to see trends’’ (Head of Customer Service)
As this citation illustrates, Head of Customer Services points out that a single unpleasant
experience does not make a case but a repeated issue does.
The report template in Table 6 would need a systematic way to sort the CX descriptions
so that there would be a way to analyze statistics. If there was a systematic way then the
statistics of issues found in CX descriptions could be analyzed by per ‘handler’, ‘customer
type’ and ‘product type’. These statistics could have time lines either by ‘Time of occur-
rence’ or ‘Feedback date’. The WBO unit internal stakeholder the Customer Relation unit
has customer profiles of key account customers. These profiles with ‘customer interac-
tion logs’ and ‘activity logs’ sorted in different ‘product types’ and ‘areas’ would be helpful
to the WBO in analyzing the severity of the issues found in the CX descriptions. The unit
would also want Customer Service ‘daily task list for each handler’ to see if the issue is
related to overwork related stress.

22
Problem Statement 4, ‘’Poor accessibility to the service’’
The statement ‘’Poor accessibility to the service’’ can be divided in two per the two main
communication tools in use. The report templates were done separately to Skype and
Outlook. The Outlook report template is shown below in Table 8.
Table 8. Report template, Area 4 (Poor accessibility to the Outlook service).
The report template in Table 8 can give statistic information of three kinds of response
times. First is the response ‘time from receiving the email to the time it was responded’.
The second is the response ‘time from opening the email to read to the time it was re-
sponded’. The third is the difference between the first two to find out what the reaction
time was from the ‘time the message was received to the time it was opened’. These
statistics can be analyzed per ‘handler’, ‘customer type’, ‘product type’, ‘query type’, ‘re-
ceive time’, ‘day of week’ and ‘number of interaction’. The unit would want to conduct a
survey to the Customer Relation Unit to find out if they have any suggestion on how to
improve customer contact points. The same statement’s Skype report template is shown
below in Table 9.
Table 9. Report template, Area 4 (Poor accessibility to the Skype service).
The report template in Table 9 can give statistic information of how many times the calls
were transferred and how long did the customer need to wait before the call is answered.
These statistics can be analyzed per ‘handler’, ‘customer type’, ‘query type’, ‘time of call’,
‘call duration’ and by ‘the phone number’ that received the calls. In the interviews, the
Head of Customer Services stated, as follows:
“If the calls are transferred several times, that upsets the customer’’
(Head of Customer Service)

23
As this citation illustrates, Head of Customer Services points out that a high number of
transfer calls indicates to a service level that needs improvement.
The unit would like to have three different kinds of supporting reports. First would be
‘Skype performance log’ to find out if the poor accessibility is due to Skype performance.
Second would be ‘CX descriptions of poor accessibility’. This would come from the feed-
back channel described in Table 5. The third one would be ‘Skype call volume log’ that
would give indications of if poor accessibility is due to congestion on the phone lines.
Problem statement 5, ‘’Confirmations are incorrect’’
The statement “Confirmations are incorrect” are also again only related to FXMM like in
the statement “Trade confirmations are late”. The data report template for the statement
“Confirmations are incorrect” is shown below in Table 10.
Table 10. Report template, Area 5 (Confirmations are late).
The report template in Table 10 can give statistic information of ‘error types’. These error
type statistics can be analyzed by ‘handler’, ‘customer type’, ‘product type’, ‘processing
system’ and ‘receiving system’. The most common error types can be further investigated
by ‘error descriptions’ and this would pin point problem areas. The customer profile would
help as a supporting report in this case too. All the data needed in this report template is
available as raw data in FXMM legacy systems.
Problem statement 6, ‘’Error handling process is slow’’
The statement “Error handling process is slow” concerns both FXMM and Custody Ser-
vices. They both use different legacy systems and have different error handling logic.
Data report template for FXMM is shown below in Table 11.
Table 11. Report template, Area 6 (FXMM Error handling process is slow).

24
The report template in Table 11 can give statistics information of ‘elapsed time’ from the
time the error was noticed to the time it was solved. These elapsed time statistics can be
analyzed by ‘handler’, ‘customer type’, ‘product type’, ‘type of procedure’, ‘error type’,
‘processing system’ and ‘receiving system’.
“When the issue is IT problem, then it gets slow and difficult’’ (Expert
of FX)
As this citation illustrates, Expert of FX points out that IT related problems take more time
and it is valuable to analyze if there is a way to prevent the most common types of IT
issues.
The same statement’s Custody Services report template is shown below Table 12.
Table 12. Report template, Area 6 (Custody Service Error handling process is slow).
In this template in Table 12, ‘Settlement instruction number’ indicates specific settlement
case. ‘Status’ indicates the processing status of the settlement. ‘Settlement date’ indi-
cates the due date of the settlement. ‘Days pending over’ indicates how many days the
current day is over the settlement day. ‘Subcustodian status’ indicates the status mes-
sage that the subcustodian has given. This information is helpful to find out why there
was a delay from the subcustodian side. The report template in Table 11 can give statis-
tics information of different settlement instruction statuses. The focus should be on set-
tlements that are pending and have passed the settlement date. The status statistics can
be analyzed by ‘handler’, ‘customer type’, ‘days pending over’, ‘error code’ and ‘sub-
custodian status’. Both FXMM and Custody Service would like to have the ‘customer
profiles’ and ‘audit logs’ to help in finding reasons for slow error handling process, as
well. All the raw data needed for data report templates in Table 9 and 10 is available in
the legacy systems.
In summary, all the raw data needed to further investigate each statement are available
except for the statement ‘’Service is rude”. A feedback channel is needed to get customer
experience description to further investigate that statement. The raw data for other re-
ports comes from FXMM legacy systems, Custody Service legacy systems, Skype re-

25
porting tool and Outlook reporting tool. The legacy systems need a Graphical User Inter-
face (GUI) to be built to extract the data. The unit needs to fill a project template that
describes the features and needs of the reports and sends it to the IT-departments to
obtain cost estimations. Then the project is introduced to a forum where IT and Business
decision makers meet once a month. From the IT and Business joint meeting, the project
to extract the data can be approved and the prioritization is set. Outlook and Skype re-
porting tools give out readymade reports and diagrams that are close to the requirements
set in the data report templates. This means that the readymade reports can be used in
this study in the developed approach. In Q3 2017, a Case Management system is
planned to be implemented in the unit which could be good news. There is a possibility
that all the reports mentioned above can be extracted from the system.
3.4 Summary of the Key Findings from the Current State Analysis (Data Collection 1)
The Wholesale Banking Operation (WBO) unit has two functions, FXMM and Custody
Services. They both serve to ensure smooth and stress-free customer experience by
proactively checking that the needed information is sufficient and correct in both services
(discussed in Section 3.1, Background of the Unit, Its Services and Customer Service).
The Unit prioritizes their customers by customer types (discussed in Section 3.2.2, Cus-
tomer segmentation). Tier 1 customers are the most important and resources should be
allocated accordingly.
According to the Annual customer satisfaction study 2016 (discussed in Section 3.2.2,
Annual customer satisfaction study), the unit is scoring well compared to its competitors.
There were, however, six dissatisfaction areas found when conducting the interviews in
the study. These dissatisfaction areas were, however, too generic and difficult to meas-
ure and for draw any conclusions, based solely on them. After internal stakeholder inter-
views, the study investigated the six areas in detail, from the point of view of measuring
the customer experience, and found two kinds of reports needed to investigate the dis-
satisfaction areas.
The first type of report that can help to measure these problem areas is the data analysis
reports from the legacy systems and communication tools. The study also discovered

26
that the raw data is already available but it needs resources and investment to extract
the data into the pivot form.
The second type of report that can help to measure these problem areas is the Customer
Experience description report that has no sources of data yet, but these types of data
are needed and were found as missing currently.
As for the first type of data that can already be found from the legacy systems and com-
munication tools, they are summarized in Figure 5. below.
Figure 5. Raw data sources (CSA findings).
As seen in Figure 5, the key categories of customer experience data that can already be
measured based on the data from the legacy systems and communication tools, they
include all the report raw data except for problem area 3, ‘’Service is rude’’.
As for the second type of data that cannot yet be collected, but is needed and missing
currently, they are summarized in Table 13 below.
Table 13. Missing data (CSA findings).
Problem Area Missing Data
3 Customer experience description
As seen in Table 13, the key categories of customer experience data that cannot be
currently measured but are needed and currently missing is only Customer experience
descriptions.

27
As seen in the findings above, both types of categories measuring customer satisfaction
are required to be in-built into the comprehensive feedback channel. If done, this channel
would help to easily extract this data and improve customer experience in the Unit.
This study has chosen to scope down the objective to (a) setting KPI’s and (b) measuring
Service Quality for one problem area. The chosen problem area for improving Service
Quality is ‘Poor Accessibility through Skype’. This was chosen because according to the
Head of Customer Service there are two areas the unit has chosen to focus on and they
are Service Accessibility and Error Handling. Skype raw data was available and in con-
sideration to this study’s time schedule, it is the logical choice. In this study Skype calls
are treated like phone calls therefor the study investigate ‘Poor Phone Accessibility’.
In the next Section 4, this study aims to answer three questions. The first one is how to
use this available raw data to measure Service Quality. The second question is what the
requirements of Key Performance Indicators (KPI) are and the third question is what kind
of KPI’s exist for Phone Accessibility.
28
4 Best Practice of Building Service Quality Measurement
This section’s aim is to provide existing knowledge of how to reach the objective of the
study, which is to develop a set of suitable KPIs and use them to perform detailed service
quality measurement using a select problem area. The chosen problem area is Poor
Accessibility through Phone. This section starts with measuring Service Quality. Second
section discusses how to build and the requirements of KPIs in the measurement. The
third section explains what kinds of KPIs are in use in other call centers that might be
useful.
4.1 Measuring Service Quality
Service quality means the comparison of service performance to the customer experi-
ence (Parasuraman et al, 1988). Lywood et al (2009: 212) found that the UK call centers
customer experience had a ''statically significant influence on company profitability cen-
ters''. Also Carr (1999: 15) found: '’Three researchers examined the satisfaction levels
and buying behavior of customers At PNC Bank and found clear evidence that compa-
nies reap far greater economic rewards from highly satisfied customers than they do
from the merely satisfied''. Eggert and Ulaga (2002: 116) came to the conclusion that
‘’customer perceived value leads to satisfaction which, in turn, leads to positive behav-
ioral intentions''. Hill and Alexander (2000: 2) mention that ''Customer Satisfaction is a
measure of how an organization's total product performs in a relation to a set of customer
expectations''. In summary, service performance influences customer experience that
influences customer satisfaction and satisfied customers leads to higher profitability.
Measuring Key Performance Indicators help managers to manage their business areas
or as Dumond (1994: Abstract) found ''results indicate that the performance measure-
ment system determines an individual′s decision‐making performance. The broader,
more effectiveness‐oriented measures also tend to make the individuals more confident
and satisfied with their operating environment and decisions''. The effectiveness-oriented
measure emphasizes the selection of what to measure. Frei (2008) recommended to
seek understanding of what are the customer's preferences to focus on and the aspects
that is needed to be done well and sacrifice on the aspects that are less important in the
eyes of the customer. A Commerce Bank chose to focus on the experience of visiting
the physical branch and didn't go into price competition or aggressive acquisition strat-
egy. This decision led to significant growth in retail customer base. Watkinson (2012)

29
discuss that in banking industry brand value is less important. The customer values more
effortless experience. To make the customer experience effortless, the company should
consider parameters time on task, convenience and simplicity. The bank First Direct ex-
ecuted this logic by taking all the bothersome task of the customer to do them self like
admin work in changing accounts.
There are many ways to look at Service Quality to determine the focus. In this study two
different ways are introduced. In the first one, Brady and Cronin (2001) explains that
customers perceive the service quality in three dimension: outcome, interaction and en-
vironmental quality. As mentioned by Watkinson (2013), the banking industry should fo-
cus on making their customer experience effortless so in these three dimensions the
interaction is the most important for banks. In the second way, Parasuraman et al. (1988)
suggest a tool called SERVQUAL. SERVQUAL is a 22-item instrument that tries to find
out service quality through five dimensions. Basic idea is to find out through a survey
what is the gap between perception and expectation of given services. The survey ques-
tions are in scale of seven from strongly disagree to strongly agree. Retail banking was
one of the service areas that the SERVQUAL study was based on (Parasuraman, A et
al, 1991). The five dimensions are described in Table 14 below.
Table 14. Service Quality Dimensions (Parasuraman et al. 1988: 23).
As seen from Table 14, the five dimensions are Tangibles, Reliability, Responsiveness,
Assurance and Empathy. ‘’Accessibility to Service’’ is a metric for Responsiveness di-
mension.
Customer surveys are one method to collect customer experience data. The problem in
surveys is, they take a lot of time and effort from both company and customers. Mihelis
et al. (2001) introduced a customer satisfaction survey that was made for The Commer-
cial Bank of Greece. The survey had three main outcomes. First outcome was to find out
weak and the strong points of the bank. Second outcome was performance evaluation

30
of the bank and third was identification of distinctive critical group of customers. The
survey was divided by categories and every category had group of sub-categories. All
the sub-categories were weighted and the total satisfaction score represented the head
category score. The head category was also weighted and the total score was the
''Global Satisfaction'' percentage. The survey also made it possible to analyze the results
by customer segments. This weighted category system is efficient way to find out from
top-down where the problem is by searching categories with low scores and high weight.
Hermann et al. (2000) discussed how important it is to combine internal process excel-
lence focus and external wide understanding of customer needs focus. Grigoroudis et
al. (2013: 21) summarized it well:
''The long-term success of a banking organization is related to its ability to
adapt to changing customer preferences and needs. For this reason, a cus-
tomer orientation and a continuous improvement philosophy is adopted in
order to design and provide products and services that meet the customer
requirements. This justifies the importance of internal and external service
quality assessment and the incorporation of quality measures in the perfor-
mance evaluation of business organizations. Furthermore, the ability of
banking institutions to respond to changing market conditions may provide
a significant competitive advantage against competition. Given the range
of factors that influence performance of the bank, this dynamic market en-
vironment justifies the necessity to improve the service delivery process
and the efficiency of the organization. Within this context, banking organi-
zations evaluate their efficiency not only in terms of operational results, but
also taking into account service quality and customer satisfaction perfor-
mance.''
Therefor as mentioned in the citation, a well-constructed measurement includes both
service performance indicators and customer satisfaction indicators. In the research by
Grigoroudis et al. (2013), Data Envelopment Analysis (DEA) was used but the results
were just performance comparison between the different branch of the case bank. DEA
is for comparing efficiency of different Decision Making Units (DMUs) (Banker et al.
1986). DEA is insufficient measurement tool for Service Quality measurement for a spe-
cific unit because it doesn’t highlight areas that needs to be improved.

31
A Proactive Balanced Scorecard is a performance measurement tool introduced by Chy-
tas et al. (2011). The tool has six stages and they are described in Figure 6 below.
Figure 6. Six Stages of Proactive Balanced Scorecard (Chytas et al. 2011).
As seen from Figure 6, the first stage is setting strategic objectives and Critical Success
Factors for the measurement. The Second stage is identifying the KPIs. The Third stage
is setting targets for the identified KPIs. Butz and Goodstein (1996) mentioned that there
are three levels of Customer Value to be considered when setting up Service Quality KPI
targets. The first level is expected value which represent the base service level that the
customer expects. The second level is desired value that represent the service level that
the customer would like to have and the third level is unanticipated value that represent
the service level that exceeds the customers’ expectations and desires.
The fourth stage is defining relationships among the identified KPI to see which KPIs
affect the other. The fifth stage is to assign linguistic variables to weights and concept.
This means that all the different KPIs are translated to one scale and experts evaluate
each KPI’s importance by weighting them. The sixth stage is continuous improvement
where the all the previous stages are updated according to needs in periods of time.
The combination of all the mentioned measurement logic, is summarized in Table 15
below.
Table 15. Suggested Service Quality Measurement.
Category KPI (scaled from 0% to 100%)
= KPI(1) x Weight + KPI(2) x Weight + … KPI(n) x Weight
= Service Quality KPI’s + Customer Satisfaction KPI’s
As seen from Table 15, the Category KPI is calculated by weighting all the identified KPIs
and summing their weighted value. The identified KPI includes both Service Quality and
Customer Satisfaction KPIs.
32
4.2 Building Key Performance Indicators
Modern day digitalization has make it easier to extract data from operational systems.
According to Kaskinen (2007) there are Software Solution Providers specialized in de-
veloping automated KPI reporting tools. This is viable option if there is no digitalization
know-how in-house. First step is to map out what kind of data is necessary to extract.
From McKinsey consultancy Markovitch and Willmott (2014: 3) explain how ''a European
bank is midway through an ambitious program to digitize its top 20 processes'' and to do
that they need to ''define a digital vision for each product and a road map to get there''.
This method requires resources in planning but the rewards justifies the means.
There are two different useful business performance analysis methods identified by
Spiess et al (2014: 9-10). Descriptive analysis ''describes the status or the history of the
system or the process under investigation''. This is for root cause analytics. Predictive
analysis ''seek to derive a future state of the system under test''. For example, comparing
error data to usage data to predict churn rate. Best case scenario would be having KPIs
for both of the analysis methods.
Key Performance Indicator identification is easier when the requirements for good KPI is
known. Staron et al(2016) defined a KPI quality model with 59 quality attributes. These
59 attributes are under five quality dimensions: Data Analysis, Data Preparation, Data
Collection, Organizational Reference Context and Standard Reference Model. For this
study only Data Analysis dimension is relevant because of the defined objective.
There are 17 quality attributes in Data Analysis dimension and they are under four sub-
categories. The four categories are described in the Table 16 below.

33
Table 16. Data Analysis Sub-Categories (Staron et al 2016: 175).
As seen from Table 16, the sub-categories are Information Product, Interpretation, Indi-
cator, and Analysis Model. The 17 Quality Attributes under the subcategories are de-
scribed in Table 17 below.

34
Table 17. Data Analysis KPI Quality Attributes (Staron et al. 2016: 176).

35
The 17 KPI Quality Attributes seen in Table 17, gives hints on how to build up KPIs. First
define business goals, then map out information need to reach the goals. With the infor-
mation need extract relevant data and calculate ‘’variable assigned a value by applying
the analysis model to base and/or derived measures’’ (Staron et al. 2016: 170). Then
check if the KPI fulfill the other 15 Quality Attributes in Table 17.
4.3 Service Accessibility KPI’s in Call Centers
An article by Richard A. Feinberg, Leigh Hokama, Rajesh Kadam, IkSuk Kim, (2002:
175) explain what are the KPIs used in Call Centers for Service Accessibility, quoting
from a book by Anton, J et al. on Callcenter Management.
“One measures the quality of call center service by measuring and tracking
average speed of answer (ASA), queue time (amount of time caller is in the
line for answer), percentage of callers who have satisfactory resolution on
the first call, abandonment rate (the percentage of callers who hang up or
disconnect prior to answer), average talk time (total time caller was con-
nected to telephone service representative), adherence (are agents in their
seats as scheduled), average work time after call (time needed to finish
paper work, do research after the call itself has been completed), percent-
age calls blocked (percentage of callers who receive a busy signal and
could not even get in to the queue), time before abandoning (average time
caller held on before giving up in queue), inbound calls per TSR eight hour
shift, TSR turnover (the number of telephone service representatives who
left in a period of time, usually annually), total calls, and service levels (calls
answered in less than x seconds divided by number of total calls).’’(Anton
1997. Cited in: Feinberg et al 2002: 175)
As mention in the citation, there are many defined Service Quality KPIs for call centers.
Table 18 below summarizes the Service Quality KPI’s that are directly related to Acces-
sibility.

36
Table 18. Phone accessibility: Service Quality KPIs (Anton 1997. Cited in: Feinberg et al
2002: 175).
As seen in Table 18, there are seven different KPIs that describe the Service Quality of
Phone Accessibility. CA Technologies (2015), was argued that the KPI should have three
attributes. First attribute is Consistency by measuring the KPI in set periods, for example
monthly every month to see the development of the service level. Second attribute is
Communication, where the KPI is communicated to right audience to be useful. The third
attribute is Actionable, where the ‘’inform actions that can improve performance’’. The
consultancy gave an example of a Service Level target: ''A service provider that delivers
a help desk may commit to answering 95% of incoming calls within 20 seconds.''(CA
Technologies 2015: 4)
In conclusion, the KPIs for Service Quality of Phone Accessibility need to have targets
to see how well the performance is compared to target.
4.4 Conceptual Framework of Service Quality KPI Measurement of Accessibility by Phone
The conceptual framework (CF) for this study is synthesis of existing knowledge gathered
from the literature that was explained earlier in Section 4.
The conceptual framework is divided into three categories that relates to the three sub-
headings emphasized previously and discussed in the corresponding sections. The first

37
category, Measurement of KPI, consists of the key elements identified from theories
discussed in Section 4.1. Measuring Service Quality. The second category, Requirements
of KPI and the measurement model, consist of consists of the key elements identified
from theories discussed in Section 4.2. Building Key Performance Indicators. The third
category, Identification of KPI, consists of consists of the key elements identified from
theories discussed in Section 4.3. Service Accessibility KPIs in Call Centers. The concep-
tual framework is illustrated in Figure 7 below.
Figure 7. Service Quality KPI Measurement of Accessibility by Phone (Conceptual Frame-
work).
As seen from Figure 7, the conceptual framework is based on eight sources. The arrows
in the CF means that Identification of KPI is based on requirements and identified KPI
should fulfill the requirements. The same logic goes with Measurement and Require-
ments. Identification of KPI is one part of Measurement of KPI theories.
In conclusion, KPIs for Service Quality of Accessibility are identified and the Measure-
ment Model suggest that the KPIs are scaled to same scale and weighted. Then the
overall score is calculated by summing up the weighted score. The KPIs also include

38
Customer Satisfaction KPI. The KPIs and the measurement model is checked that they
meet the requirements.
Next, Section 5 describes the proposal building phase. The proposal is based on the
findings from the conceptual framework and the current state analysis.

39
5 Building Proposal on Service Quality KPIs for Customer Service Phone
Accessibility and Measurement Model for the WBO unit
This section merges the results of the current state analysis and the conceptual frame-
work towards the building of the proposal using data 2.
5.1 Overview of Proposal Building Stage
The proposal is co-created with the WBO unit to develop a set of KPIs for measuring
how easily the customer can reach the service of WBO unit by calling them on the phone.
Then the Measurement Model is crafted into Initial Proposal that the WBO unit can use
to measure Service Quality of Phone Accessibility.
Proposal building is done in several steps. First, proposal building starts with combining
the KPIs found from the current state analysis and those identified in Section 5.2 of the
literature review.
Second, the data from readymade Skype reports (Data 2) are analyzed by checking if
the data from the reports can be used for the selected KPI’s in Section 5.3.
Third, the relationship between the KPI’s are mapped out to define the importance of
each of the KPIs.
Fourth, the result scale is defined that the developed composite KPI would give valuable
information.
Fifth, the measurement model is formulated in to mathematical equation that results in
the composite KPI. This is the initial proposal. Third to fifth steps are in Section 5.4
Proposal Draft.
5.2 Identified KPIs for Service Quality of Phone Accessibility
The KPIs for Service Quality of Phone Accessibility, as found in literature and the current
state analysis, are summarized in Table 19 below.

40
Table 19. Identified Service Quality KPIs for Phone Accessibility (from literature and the
current state analysis).
As seen from Table 19 most of the KPIs are from Literature (Anton et al. 1997) and only
two are from current state analysis. The Accessibility Customer Satisfaction Score is kept
from the annual customer satisfaction survey that was used as the mother study of this
thesis. The Transfer Rate comes as a suggestion from the interviews made in the current
state analysis.

41
5.3 Skype Raw Data Analysis
The expert of WBO unit extracted the raw data from Skype telephone system. Together
with the expert, these data was analyzed to get the data needed for the KPIs. It was
agreed to only focus on incoming calls to group number of the WBO unit in January. The
findings can be seen in Table 20 below.
Table 20. KPI Analysis (co-creation with WBO unit in workshop).
As seen from Table 20, ‘Percentage of Call Blocked’, ‘Inbound Calls per Handler’ and
‘Transfer Rate’ has no usable data in the raw data. The operational KPIs are then ‘Aver-
age Speed of Answer’, ‘Abandonment Rate’, ‘Average Talk Time’, ‘Time Before Aban-
doning’, ‘Service Level of Total Calls’ and ‘Accessibility Customer Satisfaction Score’.
5.4 Proposal Draft
As suggested earlier in the conceptual framework, the next steps for building the devel-
oped approach are shown in Figure 8 below.

42
Figure 8. The Measurement Model (as suggested in the conceptual framework).
As seen from Figure 8, the next step is to establish targets. To scale all the KPIs into one
scale (from 0 to 100), all the KPIs need to have a target and unacceptable level defined.
The target represents the score of 100 and the unacceptable level the score of 0. Also,
weighting of the importance of the KPI is done by giving points from 0 to 100.
A set of examples of targets, unacceptable levels and weights were send to the expert
of the WBO unit and the expert replied with the ones that are going to be used in the
measurement. The relationships among the identified KPIs were defined to make it eas-
ier to assign importance weights for the KPIs. The relationship map between identified
operational KPIs is shown below in Figure 9.
Figure 9. KPI Relationship Map (as defined in co-creation session).
As seen from Figure 9, the Input Indicators ‘Average Speed of Answer’, ‘Average Talk
Time’ and ‘Time Before Abandoning’ are KPIs that describe customer behavior and gives
reasons to Output Indicators’ Service Quality. ‘Average Speed of Answer’ and ‘Average

43
Talk Time’ can give information why ‘Service Level of Total Calls’ are in the found level.
‘Time Before Abandoning’ tells how long the customers are willing to queue before aban-
doning the call so the call abandoning rate is higher if the customers’ patience is lower
and therefor the ‘Service Level’ should be higher. Therefor the ‘Service Level’ and ‘Aban-
donment Rate’ affects the ‘Accessibility Customer Satisfaction Score’. In this study, it
means that Output Indicators are the ones that has importance weight.
The result of the measurement is scaled from 0% to 100%. The 100% score indicates
that the service level has reach the target. The 0% score indicates that the service level
is in unacceptable level. The linguistic variables were set to all the scores from 1% to
99% as seen in Table 21 below. These were set in the proposal building phase.
Table 21. Result Scale (co-creation with WBO unit in workshop).
As seen from Table 21, there are only three more scale levels added. In the workshop,
it was agreed to keep it simple and informative of the urgency degree of the action
needed to be done to improve the service level. 80-99% score would be good result and
does not need much attention. 60-79% score would need to be improved and the man-
agement should motivate the staff to answer the phone quicker. 1-59% score would need
urgent action and the management should find the root cause of the low service level
and fix it.
The Measurement Model in Figure 8 also need to be formulated in mathematical equa-
tions to be operationalized. Therefor the mathematical equations are summarized in Ta-
ble 22 below.

44
Table 22. Initial Proposal (developed based on Measurement Model).
As seen from Table 22, the Initial Proposal has many variables that has acronyms based
on the first letter of the word. Result (R) indicates to the KPI’s calculated result like shown
in Table 19. Target (T) and Unacceptable level (UL) are set by the unit. Score (S) indi-
cates to the calculated result that is between Target and Unacceptable level. The calcu-
lation method depends on which is larger, the Target or the Unacceptable level. Points
(P) are given to each KPI from 0 point to 100 points, depending on how important the
KPI is to the unit. Weight (W) is the KPI’s points divided by all the point summed up.
Therefor Weight indicates the KPI’s influence percentage on the Composite KPI. The
Composite KPI is calculated by summing up the weighted scores.
The initial proposal is used in the next section to get the measurement results of Service
Quality of phone accessibility for the WBO unit.

45
6 Validation of the Proposal
This section describes how the proposal was validated in a workshop with the Head of
Customer Service and the expert who helped in the co-creation of the proposal.
6.1 Overview of Validation Stage
Validation has happened in two validation phases. The first validation phase was the
actual measurement of Service Quality of Phone Accessibility, and the second phase
was a meeting with the Head of the Customer Services and expert of the WBO unit where
the KPI initial proposal was discussed and evaluated, and suggestions given where it
should be improved. There were no improvement changes needed to be done to the
proposal after the validation workshop.
The second validation phase is to make sure that the developed KPIs and the initial
proposal of how to measure Service Quality of Phone Accessibility are high quality.
The 17 questions made for the workshop were based on data analysis KPI Quality At-
tributes (as suggested by Staron et al. 2016) that was described in Table 17.
Validation stage is concluded with Next Steps and Recommendations in Section 6.4 and
Managerial Implication in Section 6.5.
6.2 Summary of Final Proposal
In the current state analysis was found that Tier 1 customers has the highest priority and
the service should be better for them. Therefore, Tier 1 result are analyzed separately
and compared to Total result. The KPI result is shown in Table 23 below.

46
Table 23. KPI Results (after validation).
As seen from Table 21, only ‘Abandoment Rate’, ‘Service Level’ and ‘Accessibility Cus-
tomer Satisfaction score’ have the points and were calculated in the measurement. ‘Ser-
vice Level’ was set to measure all the calls that were answered within 20 seconds per
CA Technology Consultancies recommendation to Call Centers.
The measurement is calculated by multiplying the KPI’s score with the assigned weight
and adding all the KPIs up. The full calculations can be seen in Appendix 4. The results
from the measurement are shown in Figure 10 below.

47
Figure 10. Measurement Result (calculated with initial proposal for validation).
As seen from Figure 10, the Service Quality measurement score for Phone Accessibility
was 22% for the Total incoming external calls to the group number in January and 28%
for only Tier 1 customer of the external calls to the group number in January. Both scores
fall into the category of ‘’Needs Urgent Action’’ as can be seen in Table 21. Both Head
of the Customer Service and the expert agrees to the finding.
The average answering time is 24 seconds and as the Head of Customer Service said
‘’ it takes already ten seconds for Skype to connect the call to the handler
and we hope that this could be improved when we change our phone sys-
tem from Skype to Genesis.’’ (Head of Customer Services)
As this citation explains, there is already improvement initiatives for Phone Accessibility
by the WBO unit.
6.3 Quality Attributes of the KPI Measurement
The quality of the KPI measurement is defined by seventeen question shown in Table
24 below.

48
Table 24. KPI Measurement Quality Attribute Results (answers from validation workshop).

49
As seen in Table 24, the KPI and the KPI measurement is possible to be updated, it is
linked to business goals, gives valuable information, it is objective, easy to interpret,
linked to the unit, has no unnecessary elements, represents Phone Accessibility consist-
ently, possible to perform periodically, easy to reproduce the result, procedures are clear,
no privacy or tempering risk and it measures accurately Service Quality of WBO Phone
Accessibility.
In question number 4, ‘’ Does this KPI give enough information compared to information
need?’’, the answer was ‘’no’’ because the Transfer Rate was not included due to all
calls were considered as transferred so the data was unreliable.
‘’We have the goal of First Time Right’’ (Head of Customer Services)
As this citation illustrates, Head of Customer Services points out that it is important to
see if the customer get their problem solved with the first handler or is the calls frequently
transferred forward.
In question number 7, ‘’Does this KPI support more than one information need of the
organization’’, the answer was ‘’no’’ because it is only useful for the WBO unit.
In question number 12, ‘’Is the measurement difficult to execute correctly?’’, the answer
was ‘’only getting correct Tier 1 data is difficult’’ because Tier 1 customers are identified
by their phone numbers that are given to the WBO unit and if the calls come from other
numbers then the result does not give wholesome picture.
Overall, the Head of Customer Service and the expert are satisfied and pleased with the
Service Quality KPI measurement of Phone Accessibility.
6.4 Next Steps and Recommendations
Recommended next step is to use the initial proposal (Table 22) to other problem areas.
The logical next problem area would be Accessibility to Service via email where email
response times are measured as shown in Figure 11 below.

50
Figure 11. Measurement hierarchy 1 (next step recommendation to the WBO unit).
As seen in Figure 11, Phone Accessibility and Email Response Times are under Acces-
sibility to Service which is calculated by weighting sub-categories and summing up the
score like in the measurement model. Accessibility to Service and Service Speed are
under Responsiveness that represents one of the five Service Quality Dimensions (Par-
asuraman, A et al. 1988). All five Dimensions should be considered as shown in Figure
12 below.
Figure 12. Measurement Hierarchy 2 (next step recommendation to the WBO unit).

51
As seen in Figure 12, all the five dimensions after weighting and summing up the score
would give the total Service Level KPI score of the WBO unit. As a manager, it would be
easy to see from the weights and scores which dimension should the unit put focus in
and dig deeper to see the KPIs under them. For an example, Responsiveness has heavy
weight that indicates its importance and low score that indicates that something must be
done there. Then in Responsiveness can be seen that Accessibility to Service is the
reason for low score and particularly in Phone Accessibility there is very low score be-
cause phones are not answered fast enough and customers hang up because they are
tired of waiting on the line.
6.5 Managerial Implications
Use the developed Service Quality of Phone Accessibility measurement ap-
proach once a month every month to see trends and possibly see improvement in
phone accessibility service quality. By measuring, the problem is acknowledge and in
the in the back of the handlers’ mind. This gives psychological pressure to the handler
to answer the phone calls faster and therefor serve the customer better.
Map the digital process of the most important customer interaction points. The CSA
of this study has very good ground work of where and how the necessary data for other
problem area’s related data can be retrieved. The WBO unit should work closely with
the IT support unit to plan data extraction process for retrieving valuable information
about the found problem areas. The WBO unit will have a new Case Management Sys-
tem in Quarter 3 in 2017 and the digital process mapping should be done before imple-
mentation to possibly be included in the Case Management System and to avoid dou-
ble work.
Spread the Service Quality measurement approach to other departments of the
bank. This approach can be used by any kind of service department. Other call centers
of the bank can use the same KPI’s developed for Phone Accessibility for WBO unit.
The KPI hierarchy system could be copy to any service unit of the bank with minor
modifications.

52
7 Conclusions
This Section contains the executive summary of the thesis and the thesis evaluation.
7.1 Executive Summary The WBO unit wanted to improve and develop their service. To do that, it is necessary
to be able to manage the service well first. To manage the service, the unit needs more
information about the current service quality. Therefor the object of the thesis was to
develop a KPI-based measurement approach for a more detailed service quality meas-
urement using a select problem area as an example. The selected problem area was
‘’Poor Accessibility to Service’’ and the focus was accessibility to phone service. This
problem area was chosen because Service Accessibility is one of the strategic focus
points of the company and because the data to execute the measurement was availa-
ble.
The chosen research method was qualitative case study done by external consultant.
The study began with current state analysis where the service of the unit was studied
to see what they did and what were the problem areas by stakeholder interviews. Six
problem areas were identified and for these six problem areas the study mapped out
what kind of more detailed information was needed to address them and where and
how to retrieve the data containing the needed information. Theories and ideas were
collected from literature to develop Service Quality measurement approach and the ini-
tial proposal was designed in co-creation with the WBO unit by workshops. The pro-
posal was validated by the actual measurement and with 17 KPI quality attribute ques-
tions.
The developed Service Quality measurement approach in this study has two main
parts. First part is the customized KPIs developed for Phone Accessibility. Second part
is the measurement model that uses these KPIs to calculate a composite KPI for Ser-
vice Quality of the unit in Phone Accessibility. From the customized KPIs, six KPIs
were chosen. Three of them were input indicators that gave reasons to current service
levels and remaining three output indicators that described the service level. In the
measurement model the output indicators were weighted according to their importance
and scaled from 0% to 100% for calculating the score. In the composite KPI calcula-
tion, the weighted scores were sum upped and it gave Phone Accessibility Service
Quality score of 22% to total calls. The most valued customers of the bank are called

53
Tier 1 customers. Tier 1 had separate measurement and it scored 28%, which is higher
score than the total calls had but clearly not good enough to distinguish superior ser-
vice level that the Tier 1 customers deserves. The scale of the score had linguistic vari-
ables determined and these scores indicate that the WBO unit needs to take ‘urgent
actions’ to improve their Phone Accessibility. Input indicators tells that the calls are not
answered fast enough and therefor 25% of the calls are abandon before they are an-
swered. Total calls got 22% score only because the composite KPI includes ‘customer
satisfaction score for accessibility’ and the customers has score the bank 4.11 from a
scale from 1 to 5. The customer satisfaction score is from annual customer satisfaction
survey that includes 39 banking organizations that manage their back offices. The 4.11
is the second highest score for ‘Accessibility’, so benchmarked to other organizations
the unit is doing well. Without the customer satisfaction score in the composite KPI, the
total calls score would have been 0%. The customer satisfaction score was included to
see both internal and external point of views. Internally measured the unit get 0% score
but the customers are still satisfied because they get even worse service from other
banks. Therefor it is correct that the Service Quality of Phone Accessibility is low in-
stead of 0% and it needs urgent actions.
In the validation workshop, the 17 quality attribute questions helped to understand how
successful the developed approach was. Overall the approach reach it object to give
more detailed information about service quality and help the unit to manage the service
better. The feedback from the unit was very positive and they found the approach use-
ful and plan to use it. The Head of Customer Service plan to introduce the approach to
other departments of the bank.
The developed Service Quality measurement approach help the unit to manage their
service better by giving detailed information of where in their service they excel and
where there is room for improvement. The approach is recommended to be used in a
hieratical system of KPIs where ‘the unit’s service quality’ is in the top and it goes down
to five service quality dimensions. The ‘accessibility to service’ is under the ‘respon-
siveness’ service quality dimension. This hieratical system allows the unit to prioritize
their resources in service development. The unit can analyze with the system which
problem area is the most critical by the scores and important weights of each KPI. The
developed Service Quality measurement approach and the hieratical system together
forms a practical tool to develop the service of the unit.
54
7.2 Thesis Evaluation
The goal of this study was to conduct research that is both rigorous and relevant, as well
as logical, and providing valid and reliable results. The quality of this study is ensured by
set of criteria’s. The set is: Logic, Relevance, Validity and Reliability.
7.2.1 Logic
Logic as a concept means ‘’cause-and-effect explanation of an action, decision, event,
phenomenon, or solution.’’ (Business Dictionary: Logic) In this study, by keeping focus
on the objective and only analyzing issues related to the objective, the logic will be logi-
cal. A logical Research design is a base for this study. The Research design is introduced
in Section 2.2 and objective is closer to be fulfilled by every step of the way. This is also
a way to keep the study logical. The logic of this thesis relies on the research design that
is constructed in steps, and is followed in a way that the objective was reached in the
end of the study.
7.2.2 Relevance
Relevance means ‘’relation to the matter at hand.’’(Merriam-Webster: Relevance) In this
study, relevance is ensured by taking these steps. First of all, relevance is ensured by
selecting the data (Data 1-3, as field work) and information (literature, best practice, as
desk work) that is relevant. In the field work, relevance is ensured by selecting the people
for the interviews and workshops that are experts in the field that is studied, and are
relevant experts also in the case company context. Data from interviews and secondary
data are analyzed. Then relevant conclusions are drawn and checked with the case com-
pany experts. In the desk work, relevant information is gathered from literature to help
solve the case company challenge. Its relevance is ensured by first identifying the gaps
from the current state analysis. Thus, only relevant problems are further treated. This
thesis is relevant because the KPI measurement gave valuable information to the WBO
unit.
7.2.3 Validity
Validity tests that ‘the instrument measures what it is intended to measure.’’(Huhta 2014)

55
In this study, validity is ensured by taking these steps. To ensure validity of data collec-
tion and selection of participants, key stakeholders were chosen to collect data for the
current state analysis, who are experts from the industry that represents a holistic and
objective view of the environment and the problem. In addition, the proposed outcome is
validated with a pilot and by interviewing experts, and improved into a feasible solution.
Here, the goal is to test the solution and confirm its validity for the problem and the case
context. In Section 6.3. the Head of Customer Service and expert of WBO unit both also
agreed that the KPI measurement measures what it supposed to measure.
7.2.4 Reliability
Reliability means that the result would be the same even the study is repeated many
times. To ensure reliability Yin suggest to ‘’use case study protocol, develop case study
database (collection). ‘’ (Yin 2003:34-39). Reliability is ensured by taking these steps. In
this thesis there are multiple interviews, data and literature sources that ensures reliabil-
ity. To ensure reliability of data collection, the interviews are collected from multiple
sources and the result does not only reflect any one person’s opinion. Moreover, the
interviews are supported by the secondary data from the annual customer satisfaction
study.

1 (3)
References
Anton, J. (1997). Callcenter Management: By the Numbers. West Lafayette: Purdue Uni-
versity Press.
Banker, R.; Charnes, A.; Cooper, W.(1986). Some Models for Estimating Technical and
Scale Inefficiencies in Data Envelopment Analysis. Management Science.
Vol. 30 (9), 1078.
Brady, M. (2001). Some New Thoughts on Conceptualizing Perceived Service Quality:
A Hierarchical Approach. Journal of Marketing Vol. 65 (3), 34-49.
Business Dictionary (2017). Business Dictionary: Logic. Available from: http://www.busi-
nessdictionary.com/ (Accessed 21.3.2017)
Butz, H. and Goodstein, L. (1996). Measuring Customer Value: Gaining the Strategic
Advantage. Organizational Dynamics Vol. 24 (3), 63-77.
Carr, N. (1999). Marketing: The Economics of Customer Satisfaction. Harvard Business
Review Vol. 77 (2), 15-18.
CA Technologies (2015). Key Performance Indicators, Esthablising the Metrics that
Guides Success. Available from: http://www.ca.com/de/~/media/Files/white-
papers/key-performance-indicators.PDF (Accessed 21.3.2017)
Chytas, P.; Glykas, M.; Valiris, G. (2011) A Proactive Balanced Scorecard. International
Journal of Information Management Vol. 31 (5), 460-468.
Dumond, J. (1994). Making Best Use of Performance Measures and Information. Inter-
national Journal of Operations & Production Management Vol. 14 (9), 16-31.
Eggert, A. and Ulaga, W. (2002). Customer Perceived Value: A Substitute for Satisfac-
tion in Business Markets? The Journal of Business & Industrial Marketing
Vol. 17 (2/3), 107-118.

2 (3)
Feinber, A.; Hokama, L.; Kadam, R.; Kim, I. (2002). Operational Determinants of Caller
Satisfaction in the Banking/ Financial Services Call Center. International
Journal of Bank Marketing Vol. 20 (4), 174-180.
Frei, F. (2008). The Four Things a Service Business Must Get Right. Harvard Business
Review Vol 86 (4), 70-80.
Grigoroudis, E.; Tsitsiridi, E.; Zopounidis, C. (2013). Linking customer satisfaction, em-
ployee appraisal, and business performance: an evaluation methodology in
the banking sector. Annals of Operation Research Vol. 205 (1), 5-27.
Hermann, A.; Huber, F.; Braunstein, C. (2000). Market-driven Product and Service De-
sign:Bridging the Gap Between Customer Needs, Quality Management, and
Customer Satisfaction. International Journal of Production Economics Vol.
66 (1), 77-96.
Hill, N. and Alexander, J. (2000). Handbook of Customer Satisfaction and Loyalty Meas-
urement. 2nd ed. Gower Publishing Limited
Huhta, M. (2014). Research Skills. Metropolia University of Applied Sciences, MEng In-
dustrial Management program: Lecture, Autumn 2014.
Kaskinen, J. (2007). Creating Best-in-Class KPI Program. Strategic Finance Vol. 89 (4),
29.
Lywood, J.; Stone, M.; Ekinci, Y. (2009). Customer Experience and Profitability: An Ap-
plication of the Emphaty Rating Index (ERIC) in UK Call Centres. Database
Marketing and Customer Strategy Management Vol. 16 (3), 207-214.
Markovitch, S. and Willmott, P. (2014). Accelerating the Digitalization of Business Pro-
cesses. McKinsey Quarterly. May 2014
Merriam-Webster (2017). Merriam-Webster: Relevance. Available from: www.merriam-
webster.com (Accessed 21.3.2017)

3 (3)
Mihelis, G.; Grigoroudis, E.; Siskos, Y.; Politis, Y.; Malandrakis, Y. (2001). Customer
Satisfaction Measurement in the Private Bank Sector. European Journal of
Operational Research
Parasuraman, A.; Zeithaml, V.; Berry, L. (1988). SERVQUAL: A Multiple-Item Scale for
Measuring Consumer Perceptions of Service Quality. Journal of Retailing
Vol. 64 (1), 12.
Parasuraman, A.; Zeithaml, V.; Berry, L. (1991). Refinement and Reassessment of the
SERVQUAL Scale. Journal of Retailing Vol. 67 (4), 420-450.
Refermat, E. (2010). Measure Satisfaction to Retain Customers. Automatic Merchan-
diser. Available from:
http://www.vendingmarketwatch.com/article/10256721/measure-satisfac-
tion-to-retain-customers (Accessed 21.03.2017)
Spiess, J.; T’Joens, Y.; Dragnea, R.; Spencer, P.; Philippart, L. (2014). Using Big Data
to Improve Customer Experience and Business Performance. Bell Labs
Technical Journal Vol. 18 (4), 3-17.
Staron, M.; Meding, W.; Niesel, K.; Abran, A. (2016). A Key Performance Indicator Qual-
ity Model and It's Industrial Evaluation. Confrence Publishing Services. DOI
10.1109/IWSM-Mensura.2016.9
Watkinson, M. (2013). The Ten Principles Behind Great Customer Experience. FT Press
Yin, R.K. (2003). Case Study Research – Design and Methods. 3rd ed. Thousand Oaks:
Sage Publications.

Appendix 1
1 (4)
Measurement Expectation
Expectation Assessment interview 2
Title Head of Customer Services Audio EA 02
Date 18.1.2017
Start 15:13
End 16:04
What kind of data would you need to have in evidence to take corrective actions:
1. Trade Confirmations are late
What time the trade was done and when it was send out.
Product area (FX, MM etc.), confirmation channel(email, fax, mail, swift), Customer type
System update log.
2. Service is slow
System performance log and warning system. Bottleneck mapping tool.
Outlook que log.
3. Service is rude
Description of bad customer experience. Customer type, product area, time of occurance
Enough data to see trends.
4. Bad accessibility to service
Phone (Skype) and email primary communication tools.
Phone: Which number was called, what time, Skype performance log, unanswered call, answering time, amount of call tranfer times,
Email: Customer type, respond time, what time message was received and when case was opened,
When customer reach out for the first time, how to make sure that they have enough information to process the case smoothly. (template)
Instruction video of e-markets for customers that haven't used it before.
5. Confirmations are incorrect
Customer type, product type, handler, what data was incorrect, customer profile and history log from key account managers, amount of incorrect confirmation in a timeline
6. Error handling process is slow
Timeline data of from error entry to solution. Customer type, product type, handler, Customer respond time, what time the error was noticed and who noticed it, what kind of an error. Volume of errors in a timeline.
Error log per error category
Expectation Assessment interview 1
Title Expert in Custody Services Audio EA 01
Date 18.1.2017
Start 13:42
End 14:10
What kind of data would you need to have in evidence to take corrective actions:
1. Trade Confirmations are late
Custody Services does not have trade confirmation.
Similar kind of service point could be settlement instructions handled late.
Valuable information for solving the problem would be measuring the time from receiving the settlement until handeled and send to the market.
Also measure the average time for manually handeled cases and investigate futher the cases that exceed drasticly from the average.
2. Service is slow
It would be valuable to know what the respond time is to the received email and who responded in customer service.
3. Service is rude
Anymous information is valuable too but knowing which client is unsatisfied to the service gives more information.
To know what went wrong we need a descriptions of bad service that the customer experienced.
Service person's name who gave bad service but the data should be kept confidental and modify to be anymous if necessary.
4. Bad accessibility to service
Email and phone are the main service communication tools for customer service.
Compare the amount of phone calls received to answered phone calls to see the percentage of customer who did not get immediate respond as wanted.
How many messages was exchanged between customer and customer service before the case is closed would highlight cases that did not go smoothly.
5. Confirmations are incorrect
Not in Custody services
6. Error handling process is slow
How long is the pending settlement instruction pending after settlement date would high light problem cases.
How many settlement we have and how many didn't settled during the settlement date would be a good performance indicator.
Client history profile where there would be information of the market and settlement times.

Appendix 1
2 (4)
Expectation Assessment interview 2
Title Head of Customer Services Audio EA 02
Date 18.1.2017
Start 15:13
End 16:04
What kind of data would you need to have in evidence to take corrective actions:
1. Trade Confirmations are late
What time the trade was done and when it was send out.
Product area (FX, MM etc.), confirmation channel(email, fax, mail, swift), Customer type
System update log.
2. Service is slow
System performance log and warning system. Bottleneck mapping tool.
Outlook que log.
3. Service is rude
Description of bad customer experience. Customer type, product area, time of occurance
Enough data to see trends.
4. Bad accessibility to service
Phone (Skype) and email primary communication tools.
Phone: Which number was called, what time, Skype performance log, unanswered call, answering time, amount of call tranfer times,
Email: Customer type, respond time, what time message was received and when case was opened,
When customer reach out for the first time, how to make sure that they have enough information to process the case smoothly. (template)
Instruction video of e-markets for customers that haven't used it before.
5. Confirmations are incorrect
Customer type, product type, handler, what data was incorrect, customer profile and history log from key account managers, amount of incorrect confirmation in a timeline
6. Error handling process is slow
Timeline data of from error entry to solution. Customer type, product type, handler, Customer respond time, what time the error was noticed and who noticed it, what kind of an error. Volume of errors in a timeline.
Error log per error category

Appendix 1
3 (4)
Expectation Assessment interview 3
Title Expert of Custody and FX Audio EA 03
Date 27.1.2017
Start 9:21
End 10:29
What kind of data would you need to have in evidence to take corrective actions:
1. Trade Confirmations are late
Confirmation sender , Handler, product type, Type of procedure, processing system, receive confirmation time, sending confirmation time, duration,
Status log (already in use)
2. Service is slow
Handler, product type, type of procedure, processing system, case open time, case close time, duration, case type
3. Service is rude
Handler, Customer experience description, date, day of occurance, product type, customer segmentation , customer ID
Customer profile --> Customer interaction log, activity in different product types and areas(CRU responsibilities)
4. Bad accessibility to service
Email (Outlook): many address but going to one email address, handler, case open time, respond time, duration, product type, customer segmentation, customer ID, Query type
Skype phone: Handler, customer experience descriptions, query type, time of call, Time of answer, end time, duration, customer segmentation, customer ID
5. Confirmations are incorrect
Handler, confirmation sender, entry log -> high light where went wrong, product type, customer type, customer ID, processing system
6. Error handling process is slow
Handler, confirmation sender, entry log -> high light where went wrong, product type, customer type, customer ID, processing system
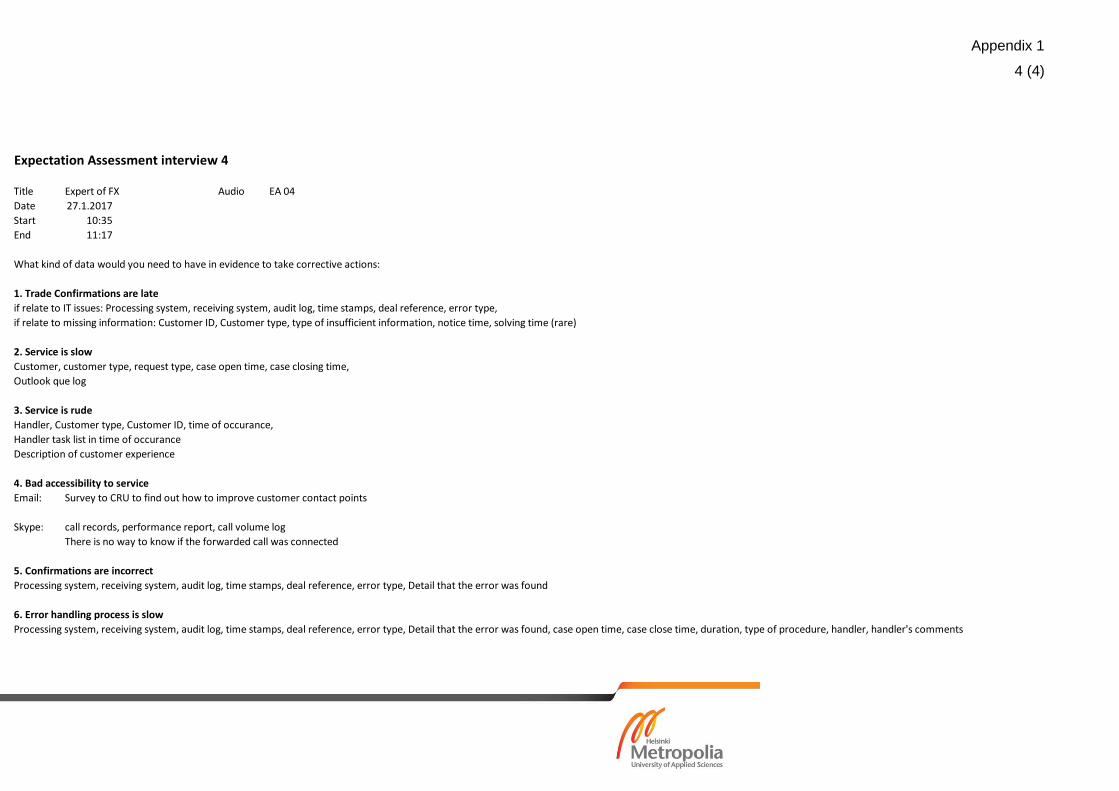
Appendix 1
4 (4)
Expectation Assessment interview 4
Title Expert of FX Audio EA 04
Date 27.1.2017
Start 10:35
End 11:17
What kind of data would you need to have in evidence to take corrective actions:
1. Trade Confirmations are late
if relate to IT issues: Processing system, receiving system, audit log, time stamps, deal reference, error type,
if relate to missing information: Customer ID, Customer type, type of insufficient information, notice time, solving time (rare)
2. Service is slow
Customer, customer type, request type, case open time, case closing time,
Outlook que log
3. Service is rude
Handler, Customer type, Customer ID, time of occurance,
Handler task list in time of occurance
Description of customer experience
4. Bad accessibility to service
Email: Survey to CRU to find out how to improve customer contact points
Skype: call records, performance report, call volume log
There is no way to know if the forwarded call was connected
5. Confirmations are incorrect
Processing system, receiving system, audit log, time stamps, deal reference, error type, Detail that the error was found
6. Error handling process is slow
Processing system, receiving system, audit log, time stamps, deal reference, error type, Detail that the error was found, case open time, case close time, duration, type of procedure, handler, handler's comments

Appendix 2
1
Customer Journey (FX)
FX and MM Corporate
Step 1 Step 2 Step 3 Step 4 Step 5 Step 6 Step 7 Step 8 Step 9
Customer Service
interaction
receiving payment
instructions and
confirmation preferences
from customer, deliver
customer Bank's payment
instructions
request from dealer or
customer to change deal
details requires handling
of the deal, if deal is
cancelled or modified CS
might need to contact
customer or
correspondent bank to
recall payment
customer might request
resending confirmation or
payment reset documents,
customer might also
request sending of
separate market value
report, it could happen
that sending of customers
confirmation fails due to
incorrect FAX or e-mail->
CS needs to contact
customer to find correct
ones.
if customer's and Bank's
confirmation do not match
it is CS who contacts the
customer. If customer
notifies the descrepancy
first, they call Bank. If
there are problems with
customer e.g. not
returning confirmations in
time/not at all it is CS who
can bring the issue up
with local relationship
manager to discuss the
issue with customer
CS handles the netting
process with customers
as this requires daily
dialoque confirming the
amounts, value dates and
payment instructions. It is
important that customer
gets hold of us and all is
confirmed with timely
manner as well as
professonal.
If any problem with
settlement, customer
contacts CS or vise versa.
CS takes necessary
action to get the situation
corrected. CS might need
to talk to internal
stakeholders like Nostro
(reconciliation unit) or
Relationship manager.
Waiting time: 0-30 min 0-10 min 1-15 min 1-15 min 1-5 min N.A. * *Touch time: 10-25 min 1-5 min 1-15min 1-3 min 1-10 min 1-4 min 1 min - 30 min 2-30 min 1 min - 4 hours
Cycle time: 1-1,5 hour 5-15 min 1-30 min 1-3 min 1-25 min 1 min - 15 days 1 min - 2 days 2min - 1 month 1 min - 1 week
* W: 7-->9 up to 1 day
* W: 7-->8 up to 1 day
Register Customer4 eyes principle on
Register Customer
- Receive information from
Traders
- Update in local systems
(DK & FI)
- Set up customer info
and SSI on network share
(SE)
-Establish cpty
- Add TCC-link
- WSS (SSI & Confo)
- Add shortname to CSS
client
- Add dispatch registry
- Update TOBO / E-
Markets
- Update Infinity
- Monitor group mail
- Consent agreement if
customer wants
agreement
- Agree on if customer is
netting or not
- Control FSI release
- Dispatch registry
- CSS MT101 clients
Settlement
- Monitor WSS queues
- Update/ check missing
FSI
- Manual marked
customers
- Manage Get Back Funds
- Monitor NOP deals
- Monitor group mail
Send Confirmations
- Regular Mail
- Fax
- Swift
- Resend failed
confirmation
Input controlReconciliation/ Error
handling
- Investigate problems
regarding postings
- Reconciliation of
suspence, internals some
nostro and error accounts
- Make corrections
4 eyes principle on
Input controlConfirmation Matching
- Monitor ProMatch
- Monitor Misys
- Monitor FX All
- Monitor Traiana
Harmony FI: Investigate
discrepancies and /or
missing confirmation
- GDW: Matching,
monitoring, chasing
- Investigate problems
regarding payments (pre
or on value date)
-Investigate problems
regarding payments (after
value date)
- Take needed actions
Investigations/ Error
handling
- Monitor SRQ and take
actions
- WSS netting (agree with
clients or trader)
- CSS netting (DK+NO for
MT101)
- Manual MT900 (NO)
- Manual MT101 (SE all /
DK MM / NO FXMM
- Man CB postings
- NO, FI: Monitor CSS for
failed postings + swift and
inform others
- Monitor PS + Merwa for
NAK´ed swifts
- NO: Monitor ProPos
- SE: INL
- FI FX deals: AGIO
- FI FX/MM: Manual
booking, CUPO, cover
check, SITI correction
- Approve deals from
Repair Sight Verify or
move back to Waiting for
Repair

Appendix 3
1
Customer Journey (Custody Services)
Customer sends RFP to
CRU, who KYCs the client
Custody Sales sends
proposal to customer
Client is setup in all relevant
systems (Asteri, AP-Hoito,
eCustody, Calypso, Kase,
Ulko & relevant FO
systems). Client data flows
through to most relevant
systems automatically when
certain criterias are met.
Custody client buys shares
from Bank Markets.
Customer receives
confirmation from Markets
Custody client sends us
instructions
Bank receives &
checks instruction. If
instruction meets STP
requirements, it will be
automatically
processed. If instruction
is non-stp, instruction
will be handled
manually by TR
Services
Bank sends instruction
(mt540-543) to market
and sends feedback
from market back
(mt548) to our custody
client
Markets trade settles.
Settlement instruction
settles in market, Bank
sends custody client
settlement confirmation
(mt544-547)
Our Global Custody
client sends us an
instruction from their
commission account to
their client's account
(final beneficiary).
The shares will be
booked to our account
with our sub-custodian,
where the shares are
actually held by Bank.
The booking will be
reflected to customers
safekeeping account by
Bank's safekeeping
system.
TR Services report the
trade by regulatory
requirements (for Bank
Markets trades). Asset
Services & Support sends
out monthly statements of
transaction & holdings.
NOC units reconcile most of Bank's
Global positions in Corona. Position
differences are investigated locally. Some
manual reconciliations are handled
locally.
Asset Services receives
information about a corporate
action from the market and takes
necessary actions within Bank.
Customer
Asset Manager Rich Man Plc
CRU Custody Sales Asset Services & Support Transaction Services Transaction Services Transaction Services Transaction Services Transaction Services Transaction Services Transaction Services Transaction Services TR Services NOC NOC
Custody Sales Client Relations Transaction Services Asset Services & Support Transaction Services Asset Services
Custody Sales Safekeeping & Settlement FI & NO (IT) Issuer Services/Client Relations
Client Relations
A trade may have settled,
however, the client wants
it to be cancelled (ie
reversed as settled
instructions can not be
cancelled) and will require
assistance. In some
markets the client may be
stamp duty liable or other
extra fees any have
occurred and customer
services will inform the
client proactively when the
fees are known
Clients are advised on
incorrect transfer
instructions
Occationally
subcustodians and/or
subcustody accounts
may be changed, and
the clients need to be
informed of the new
account and SSI's
(Standard Settlement
Instructions) so that their
counterparties know
how to instruct correctly
For the time being customer services
handle the communication with
subcustodians
Instruction processing Instruction processingCustody client buys from their
client
Customer Services may
be involved at this stage
already, eg. Providing
swift templates and/or
demonstrating eCustody
Client may require help with
sending settlement
instructions either via
eCustody or swift.
Customer services may
demonstrate eCustody in
person or over the phone,
or alternatively provide clit
with swift templates for
settlement instructions. This
stage often involves
advising and checking
clients' swift messages in
order to check the
instruction has come
through.
Customers contact us if they
are issuing a new global
bond which is not yet open in
the system for the security to
be opened before sending
thir instrucions
Custody client will sell their
clients' securities and will
transfer them to their own
account first. The client is
informed if their client does
not have the sufficient
position or the account is
incorrect. Alternatively the
client may contact customer
services and wonder why the
transfer and/or market
instruction have not
settled/processed.
Clients are advised on incorrect
instruction which do not even
come through the system
(customer services need to check
failed swift messages) or clients
contact us to check if instructions
have come through
Clients are being
advised on potential
incorrect instructions
informed by the
settlement team. If
transfer instructions do
not go through (from
the client's client) the
client will be contacted,
as this ofthen results
the market instruction
not going through
either
Should the
subcustodian inform of
any incorrect
instructions/reject an
instruction, customer
services will contact the
client and advise on
how to proceed and
how an instruction
needs to be corrected,
clients may contact
Customer Services if
they have any reasons
to wonder why certain
instructions have not
settled, (eg. the
counterparty may insist
the instruction having
settled in which case we
will contact the
subcustodian in the
market) or they have
sent an instruction late
and wish the instruction
to be processed asap.
Client may have
questions regarding any
cancellations and
receiving their money
back (or paying back in
case of a cancelled sell
instruction)
Final beneficiary
receives shares (buy)Safekeeping
Customer Services
Legal
Compliance
Instruction settlementStatic Data & agreements Corporate ActionReporting (Client &
regulatory)Customer need
Reconciliation between Bank &
subcustodians/CSDsBank proposal
Custody client trades in the
exchange
Custody client sells (buys) to(from)
their client

Appendix 3
1
Measurement Calculations