
Towards a Measurement of Paper Pulp Quality: Ultrasonic Spectroscopy of Fibre Suspensions
111
LICENTIATE THESIS Luleå University of Technology Department of Computer Science and Electrical Engineering EISLAB 2006:20|:02-757|: -c -- 06 ⁄20 -- 2006:20 Towards a Measurement of Paper Pulp Quality: Ultrasonic Spectroscopy of Fibre Suspensions Yvonne Aitomäki
Transcript of Towards a Measurement of Paper Pulp Quality: Ultrasonic Spectroscopy of Fibre Suspensions

LICENTIATE T H E S I S
Luleå University of TechnologyDepartment of Computer Science and Electrical Engineering
EISLAB
2006:20|: 02-757|: -c -- 06 ⁄20 --
2006:20
Towards a Measurement of PaperPulp Quality: Ultrasonic
Spectroscopy of Fibre Suspensions
Yvonne Aitomäki

Towards a Measurement of PaperPulp Quality: Ultrasonic
Spectroscopy of Fibre Suspensions
Yvonne Aitomaki
EISLABDept. of Computer Science and Electrical Engineering
Lulea University of TechnologyLulea, Sweden
Supervisor:
Torbjorn Lofqvist, Jerker Delsing

ii

Dedicated to the memory of Bernard Schlecht who taught me to climb
and inspired me to study

iv

Abstract
For the paper and pulp industry in Sweden and Finland to remain competitive againstcountries with lower overheads, they have to constantly strive to improve the quality andthe efficiency of the manufacturing processes. One of the ways of doing this is to introducesensors that will provide valuable online feedback on the characteristics of the pulp sothat adjustments can be made to optimise the manufacturing process. The measurementmethod proposed in this thesis is based on ultrasound, since it is rapid, inexpensive, non-destructive and non-intrusive. Thus could be done online. Since ultrasound propagationand attenuation depends on the material properties through which is propagates, it hasthe potential to provide measurements of material properties such as pulp fibre densityand elasticity.
The aim of this thesis is to investigate the possibility of using ultrasound to measurepulp fibre material properties. The idea is to solve the inverse problem of estimatingthese properties from attenuation measurements and to establish the degree of accuracyto which this can be done. Firstly a model is developed and is tested with synthetic fibresto establish is validity. It is then used to solve the inverse problem of estimating mate-rial properties from attenuation measurements, again with synthetic fibres, to test theaccuracy to which these properties can be estimated. Resonance peaks in the frequencyresponse of the attenuation were found. On closer investigation it was established thatthe location of these peaks in the frequency domain is sensitive to the diameter of thefibres and their material properties. If the diameter is known, these peaks improve theaccuracy of the estimation process. The results of the estimation process for syntheticfibre suspensions show values for the shear modulus are within known ranges but theestimation of Poisson’s ratio and Young’s modulus is poor. Improving the model or theestimation procedure may lead to better results.
For the method as it is to have application in the paper and pulp industry thereare certain conditions that need to be fulfilled. These are that we find peaks in thefrequency response of the attenuation in pulp, know the diameter distribution of thefibres and the hollow nature of the fibres does not significantly alter the results. Wecan then, potentially, be able to establish the shear modulus of the pulp fibres. If theshear modulus is a factor in paper quality, we may be close to an online measurement ofpaper pulp quality using ultrasonic spectroscopy. Improving the model may allow us toestimate further properties and take into account the fibres being hollow.
The thesis consists of two parts. The first part includes an overview of the pulp andpaper industry and current testing methods, background theory on which the model isbased and an overview of the model that is used in predicting ultrasound attenuation.
v

vi
There then follows a summary of the work done, some addition points are raised in thediscussion before drawing conclusions. Finally we discuss what needs to be done to takethis further. The second part contains a collection of four papers describing the research.

vii
Contents
Chapter 1 – Introduction 1
Chapter 2 – Paper and Pulp Industry 32.1 Paper and Pulp Manufacturing Process . . . . . . . . . . . . . . . . . . . 32.2 Current Methods of Pulp Quality Measurement . . . . . . . . . . . . . . 3
Chapter 3 – Ultrasound in Suspensions 53.1 Overview . . . . . . . . . . . . . . . . . . . . . . . . . . . . . . . . . . . . 53.2 Historical Background . . . . . . . . . . . . . . . . . . . . . . . . . . . . 123.3 Simple Cylinder Scattering (SCS) model . . . . . . . . . . . . . . . . . . 13
Chapter 4 – Summary of the Papers 194.1 Paper A - Estimating Suspended Fibre Material Properties by Modelling
Ultrasound Attenuation . . . . . . . . . . . . . . . . . . . . . . . . . . . 194.2 Paper B -Ultrasonic Measurements and Modelling of Attenuation and
Phase Velocity in Pulp Suspensions . . . . . . . . . . . . . . . . . . . . . 194.3 Paper C -Inverse Estimation of Material Properties from Ultrasound At-
tenuation in Fibre suspensions . . . . . . . . . . . . . . . . . . . . . . . . 204.4 Paper D - Sounding Out Paper Pulp: Ultrasound Spectroscopy of Dilute
Viscoelastic Fibre Suspensions . . . . . . . . . . . . . . . . . . . . . . . . 20
Chapter 5 – Discussion 23
Chapter 6 – Conclusion 27
Chapter 7 – Further Work 297.1 Getting this to work . . . . . . . . . . . . . . . . . . . . . . . . . . . . . 29
Paper A 391 Introduction . . . . . . . . . . . . . . . . . . . . . . . . . . . . . . . . . . 422 Theory . . . . . . . . . . . . . . . . . . . . . . . . . . . . . . . . . . . . . 433 Experimental . . . . . . . . . . . . . . . . . . . . . . . . . . . . . . . . . 474 Results . . . . . . . . . . . . . . . . . . . . . . . . . . . . . . . . . . . . . 485 Conclusions . . . . . . . . . . . . . . . . . . . . . . . . . . . . . . . . . . 496 Further Work . . . . . . . . . . . . . . . . . . . . . . . . . . . . . . . . . 507 Appendix . . . . . . . . . . . . . . . . . . . . . . . . . . . . . . . . . . . 50
Paper B 531 Introduction . . . . . . . . . . . . . . . . . . . . . . . . . . . . . . . . . . 552 Phase Velocity . . . . . . . . . . . . . . . . . . . . . . . . . . . . . . . . . 563 Attenuation . . . . . . . . . . . . . . . . . . . . . . . . . . . . . . . . . . 59

4 Conclusion . . . . . . . . . . . . . . . . . . . . . . . . . . . . . . . . . . . 615 Further Work . . . . . . . . . . . . . . . . . . . . . . . . . . . . . . . . . 61
Paper C 671 Introduction . . . . . . . . . . . . . . . . . . . . . . . . . . . . . . . . . . 692 Theory . . . . . . . . . . . . . . . . . . . . . . . . . . . . . . . . . . . . . 703 Experiment . . . . . . . . . . . . . . . . . . . . . . . . . . . . . . . . . . 714 Results and Discussion . . . . . . . . . . . . . . . . . . . . . . . . . . . . 745 Conclusion . . . . . . . . . . . . . . . . . . . . . . . . . . . . . . . . . . . 816 Appendix . . . . . . . . . . . . . . . . . . . . . . . . . . . . . . . . . . . 837 Acknowlegments . . . . . . . . . . . . . . . . . . . . . . . . . . . . . . . 83
Paper D 871 Introduction . . . . . . . . . . . . . . . . . . . . . . . . . . . . . . . . . . 892 Theory . . . . . . . . . . . . . . . . . . . . . . . . . . . . . . . . . . . . . 903 Results . . . . . . . . . . . . . . . . . . . . . . . . . . . . . . . . . . . . . 914 Conclusion . . . . . . . . . . . . . . . . . . . . . . . . . . . . . . . . . . . 93

Acknowledgements
I would like to thank my supervisor Torbjorn Lofqvist, for his comments and support. Iwould also like to thank Jerker Delsing for reminding me of the big picture. Thanks alsoto my friends and colleagues at CSEE for their support and patient nodding as I ranton about waves, boundary conditions and about the fact that I’ve done it wrong - oh noits all okay again etc, etc. I would especially like to thank Kristina Berglund, who hasshown amazing flare at correcting my English and has patiently gone through versionafter version of this thesis and most importantly come up with the elastic band analogy.Appreciation also goes the Forskningskola for Kvinnor, for giving me the confidence toforge ahead and for the laughing therapy.
Finally my special thanks goes to my husband, Erik, without whose support I couldnot have done this. And my Mum and Dad for the proof-reading and comments.
ix

x

Part I

xii

Chapter 1
Introduction
In 2005, Sweden produced 11.7 million metric tons of paper and pulp. In 2002, Finlandand Sweden were the third and fourth largest producers of paper and pulp and togetherthey make up for 12% of the world’s paper and pulp production. With an annual turnoverof EUR 74 billion, the pulp and paper industry is a vital part of the European paper andforest economic cluster[1].
For the paper and pulp industry in Sweden and Finland to remain competitive againstcountries with lower overheads, they have to constantly strive to improve the quality andthe efficiency of the manufacturing process. In 2000, the paper and pulp industry wasresponsible for 2% of the primary energy consumption of the EU’s twelve member states.The high cost of energy in Europe make improvements in energy efficiency a considerablecost saving. The balance is then to reduce the energy consumption whilst maintainingquality. Hence the need for improving process control.
A large number of instruments exist for measuring different aspects of pulp, such asthe brightness, chemical analysis, consistency and fibre properties [2]. With the increasein computer processing power, rapid image analysis has allowed optical measurementtechniques to become standard practice in the paper and pulp manufacturing process inScandinavia. Examples of devices that use optical-based image analysis are the STFIFibremaster, (Lorentsen-Wettre, Sweden) and the Kajaani FS300 (Metso Automation,Finland). Although they provide valuable information on a number of fibre properties,since the method is optical, material properties such as elasticity cannot be measured.Or, in layman’s terms ‘No matter how much you stare at an elastic band, you still don’tknow how stretchy it is´.
A recent development in the online measurement of paper quality control is the use ofa laser ultrasonic sensor (Berkeley Lab, Berkeley, California). This measures the bendingstiffness and out-of-plane shear rigidity. Trials using this device started in 2003.
This device is an example where material properties can be estimated using ultrasoundsince they affect the attenuation and wave speed of the ultrasonic wave as it progressesthrough the material. Hence the use of ultrasound measurement methods can providerapid, inexpensive, non-destructive and non-intrusive measurements. Historically, there
1

2 Introduction
have been a number of attempts to introduce ultrasonics into the paper and pulp industrybut up until 1998 these were without much success. A summary of these is given by [3].One of the reasons given was the emphasis the industry had on quantity rather thanquality. The economic climate, at least in Europe, has changed and it would seemthat the emphasis is now on quality and efficiency. The indications for this are fromthe widespread use of optical devices for monitoring pulp in Scandinavia. However,the correlation between optical fibre characteristics and paper quality has had variablesuccess [4]. This is perhaps because fibre material property measurements are missing.In this case ultrasound based measurements could have the potential to provide the keyto increased process efficient by supplying this missing data.
The aim of this thesis is to investigate the possibilities of being able to use ultrasoundto estimate the material properties of pulp fibres in suspension. The material propertieswe intend to measure are the shear modulus, Young’s modulus and density.
Given this feedback, one can envisage the paper manufacturing plant of the futurehaving ultrasonic devices for measuring density and elasticity at each stage in the pulpmaking process. Each stage could then be adjusted to the type or condition of thewood fibre being fed into the process. The plant would have an online paper qualitymeasurement device, such as the laser ultrasonic sensor, to correlate the information onthe individual fibre properties, at each stage in the process, with the output quality ofthe paper.
The thesis is composed of two parts: firstly a general background and secondly papersthat have been either published or submitted for publication. The general background isdivided into an overview of the paper manufacturing process and current testing methodsin paper pulp. Some aspects of the physics of ultrasound propagation are discussedbefore presenting the historical background on the modelling of ultrasound propagationin suspensions. We then present an overview of the simple cylinder scattering (SCS)model and a summary of the papers is given in Chapter 4. We discuss some additionalissues not tackled in the papers before drawing conclusions. Finally we discuss whatneeds to be done to take this further. The second part contains a collection of fourpapers describing the research.

Chapter 2
Paper and Pulp Industry
2.1 Paper and Pulp Manufacturing Process
There are three basic types of pulp manufacturing: chemical, mechanical and pulp fromrecycled paper. In the chemical pulp manufacturing process, the wood is cooked in asolution of chemicals. The lignin of the wood is made soluble and the fibres separate aswhole fibres. In mechanical pulp manufacturing, the wood fibres may also be exposedto heat and pressure, such as in thermomechanical pulps, [5], before being separated bygrinding or milling. An overview of these different processes is provided in [6].
2.2 Current Methods of Pulp Quality Measurement
Due to the large number of different factors that contribute to make paper to the desiredspecifications, the main method of testing paper pulp quality is to making the pulp intopaper and testing the resulting paper [7]. This can be done in laboratory setting toassess differences due to wood types or different treatment processes and more recently,the effects of recycling [8].
There is a whole plethora of devices available for monitoring the pulp at differentstages of the process. Devices are available for measuring fibre consistency, chemicalcomposition, brightness, yield, and visual features of the fibre that can be measured usingoptical devices. Some of which, like the optical devices, are available online. Definitionsof these qualities are given in [2]. If we concentrate on the measurement techniques ordevices available for measure Young’s modulus, density and shear modulus, the list ofavailable devices and techniques are considerably shorter.
The stiffness of individual fibre can be measured and through this Young’s modulusestablished. The first of the two main method used is done by setting the fibre in av-shaped notch on the tip of a thin capillary tube submersed in water. Water is thenallowed flow through the capillary. This water flow is increased until the middle part ofthe fibre reaches a preset mark [2]. The second method is to measure the extent to which
3

4 Paper and Pulp Industry
a fibre has followed the contour of a wire set between the fibre and a glass plate, when ahydraulic pressure is applied. This process has been automated and is available [2].
The SFTI fibremaster, gives an indication of the stiffness through a measurementquantity referred to as bendability. This is defined as the difference in form factor whenmeasured with high and normal flows in the STFI measuring cell. The form factor is theratio of the greatest extension of the fibre to the real length of the fibre in the same pro-jected plane [9]. The greatest extension is the degree of extension in the projected planein which the fibre has its greatest bending. The use of flow and optical measurement,results in the ability of the system to provide a measurement related to the elasticity ofthe fibre. One of the problems with this method is that the fibre is projected onto twodimensions so that deflection in the third dimension is not considered and hence a sourceof inaccuracy in the measurement.
Methods or devices measuring the fibre material density in industrial setting havenot been found. However, assessment of wood fibre density have been investigated bysubmerged float techniques by [10]. These results showed that the density is changed bythe degree of delignification upto 20%. Hence chemical processes do affect the densityof the fibre material. The density of the fibre structure depends to a large extent onthe wall thickness. If this collapses the fibre will be denser. Measurement of fibre wallthickness are made by optical devices, such as the Fibermaster, and coarseness valuesare calculated where coarseness is the mass per unit length.
Measurements of shear modulus have not been found for pulp fibres.

Chapter 3
Ultrasound in Suspensions
3.1 Overview
Ultrasound is simply sound with higher frequencies than that the human ear can detect(>20kHz), hence theories on audible sound also apply to ultrasound. As sound propagatesthrough a medium its amplitude decreases as the energy in the wave is absorbed. If thesound is a pulse then it will contain different frequencies and the shorter the pulse, themore frequencies it will contain. Sound waves with different frequencies are absorbed,or attenuated, by different amounts depending on the medium. In fluids, the classicalexplanation for attenuation is that it is due to the viscosity of the fluid as well as tothermal conduction. For non-metallic fluids, the attenuation due to thermal conductionis negligible compared to that due to viscosity [11]. Unfortunately for most commonliquids this does not account for all the attenuation mechanisms. In water, this excessattenuation is attributed to structural relaxation. An additional viscosity term, bulkviscosity, is therefore introduced to take this into account. The resulting relationship forthe attenuation in terms of the material properties is
α ≈ ω2
(η′
B
) √ρ1
2, (3.1)
η′ =4
3η + ηB, (3.2)
where B is the adiabatic bulk modulus, ω is the angular frequency, ρ1 the density ofwater and η is the viscosity and ηB is the bulk viscosity. For water, ηB is approximatelythree times that of the η. From equation (3.1) we see that as frequency increases theattenuation increases proportional to frequency squared.
In solids, the attenuation per wavelength can be approximated to the phase differencethe stress and the strain, also referred to as the loss tangent, tan δ [12] [13]. Stress andstrain are related by the elastic modulus, M . To model the phase difference between
5

6 Ultrasound in Suspensions
then, we let M become a complex number such that
M = M ′ + iM ′′ (3.3)
and
tan δ =M ′
M ′′ (3.4)
In terms of attenuation of the solid, αf , this becomes
αf =πf
c2
tan δ (3.5)
The mechanism by which the wave propagates through a medium depends on itsmaterial properties. In a fluid that is not close to any boundaries, the wave velocity,c1 depends on the adiabatic bulk modulus and the density of the fluid (see equation(3.6)). It also has a term depending on the frequency of the wave squared and a functionof the ratio of the viscosity to the adiabatic bulk modulus squared. As the frequencyincreases so does the velocity, but the ratio of the viscosity to the bulk modulus is small(≈ 2 · 10012), the effect is less noticeable than the effect the frequency has on attenuationin a fluid. The equation for this relationship is:
c1 ≈√
1 +3
8ω2
(η′
B
)2
(3.6)
The approximation in this last expression and that for attenuation in a fluid, equation(3.1), is because this assumes that the term η′/B � 1.
(a) Shear wave
Figure 3.1: Diagram of a shear wave propagating a solid.
If we consider wave motion in an unbound solid two types of waves can exist: acompressional wave and a shear wave. The shear wave is a transverse wave, where

3.1. Overview 7
the particle motion is perpendicular to the direction of propagation, as shown in thediagram in Figure 3.1. The wave depends only on the shear modulus of the material.The compressional wave is a longitudinal wave where the particle motion is in the samedirection as the direction of propagation of the wave. If a sinusoidal force acts on asurface such that it is evenly compressed, as shown in Figure 3.2, then the velocity ofthe wave generated depends on Young’s modulus. However, if the surface is not evenlycompressed, such as is generally the case in an unbound solid, then both compressionand shear waves will occur. Further details can be found in [14]. In the analysis in themodel, we assume that the shear wave is perpendicular to the compression wave [15]. Wecan visualise this by imagining a plate in a soft solid, such as a gel. If a transverse waveis generated in the plate, and as a point in the plate moves up and down it compressesand expands the gel above it. This generates a compression wave perpendicular to thetransverse wave. The velocity of this compression wave depends on the shear modulus,and on the bulk elasticity of the material. The bulk elasticity is used in place of Young’smodulus because we cannot assume that the surfaces perpendicular to the applied stressare now free to move [14].
(b) Compression wave
Figure 3.2: Diagram of a pure compression wave propagating through a solid.
The equations for these relationships are:
c2s =√
(μ/ρ2) (3.7)
c2 =
√((K +
4
3μ)/ρ2) (3.8)
where c2s is the shear wave velocity, μ is the shear modulus, and ρ2 is the density ofthe solid. c2 is the compressional wave velocity, and K is the bulk modulus. When asolid medium is unbound we assume that the waves in the solid will be the combinedcompression and shear waves. Dispersion is taken into account, as the elastic modulii arecomplex as described earlier in the definition of the loss tangent.

8 Ultrasound in Suspensions
The diagrams in Figure 3.1 and Figure 3.2 show the effect on an element of a solid.If we now imagine an infinitely long cylinder that is excited evenly along its z axis, froma particular point in (x,y), the displacement will be a shown in Figure 3.3. From thiskind of excitation we can expect that both compression and shear waves will propagatein the cylinder. Complications do arise however, because of the boundary. This will bediscussed at a later point.
Shear wave
Compression
wave
Force in the form of
an ultrasonic wave
Undistribed cylinderDistorted cylinder
z
y
x
Figure 3.3: Cylinder excited by a force acting at a particular point in (x,y) and evenly in the zdirection.
In a suspension, the wave travels from a fluid to either a solid or another fluid. Asthe wave hits the boundary of the two media part of the wave is reflected and part ofthe wave is transmitted. In the simple case of a plane wave arriving at a boundary thatis perpendicular to the direction of the wave, calculating ratio of the intensity of thetransmitted wave to the reflected wave is straight forward. This is done by consideringthe boundary condition at the interface and assuming the velocity and momentum to becontinuous at this point. The result is that the amplitude of the wave being reflecteddepends on the difference in the characteristic impedances of the two media where thecharacteristic impedance is the product of the density by the velocity of the wave. Sincewe have considered a plane wave and a flat boundary, the only waves propagating arecompression waves. The calculation is more elaborate if the wave progression is notperpendicular to the boundary and the interface on a solid. Details of this can be foundin [14].
So, in short, the attenuation of the sound or ultrasound wave tells us something about

3.1. Overview 9
the nature of the medium the wave has passed through. If we now consider a sound wavetravelling through a suspension of solid particles in a fluid, the attenuation of the soundwave will depend on the viscosity of the fluid, the bulk viscosity of the fluid, the differencein the characteristic impedance between the fluid and the solid i.e. differences in densityand wave velocity in these two media, and finally the attenuation in the solid itself whichis a function of loss tangent. Although this is not an exhaustive list it highlights thepossibility of being able to estimate these parameters by measuring the attenuation ofsound in a suspension of a solid in a fluid. Before going on to discuss the model, we mustconsider other effects that occur in a suspension, where we have two different mediainteracting.
3.1.1 Thermoelastic Scattering
Associated with a pressure wave of the ultrasound is a temperature wave, which is inphase with the pressure wave. This is depicted in the Figure 3.4, and shows an increase intemperature as the pressure increases during the compression part of the sound wave anddecreasing again during the rarefraction part of the wave as the pressure decreases. In
Time
Am
pli
tud
e
Pressure
Temperature material 1
Temperature material 2
Figure 3.4: Plot of a Pressure wave with two temperature waves in different media
a suspension, there are two media that normally have different thermal properties. Theresult is that the temperature wave in the suspended particle is different in amplitude tothat of the surrounding liquid. In order that there be no discontinuity at the boundary,heat flows into and out of the boundary layer to compensate for this difference in tem-perature. This causes the boundary layer to expand and contract and hence become the

10 Ultrasound in Suspensions
source of a secondary wave (Figure 3.5). This is known as thermoelastic scattering. If weconsider the particle to be spherical like or cylindrical, the effect, as viewed from a crosssection through the cylinder or sphere, is of a symmetric monopole wave emanating fromthe scatterer. This wave decays quickly and is not noticable at a large distance from the
Pulsating
Boundary
layer
Scatterer
Figure 3.5: Diagram of an pulsating boundary layer, the source of a secondary sound wave.
scatterer. It does however dissipate energy and in some cases, such as for an emulsionof sunflower oil and water it can be the dominant effect in attenuation [16]. For fibreswhere the scatter diameter is close to the wavelength of the ultrasonic wave, this effectis small [17].
3.1.2 Viscous effects
In the previous section we discussed the attenuation and motion of a fluid not close to aboundary. We now consider the added effect of a boundary on a fluid. The added effectcomes from the transverse motion the fluid is subjected to, due to the viscosity of thefluid and the proximity of a boundary. A description of this effect is given in [11]. Theresult is that the fluid has a secondary wave which is a function of the distance from theboundary
u′ = ue−(1+1j)z/δ (3.9)
δ =√
2η/ρ1ω (3.10)
Where u′ is the secondary wave, u is the primary wave, propagating parallel to theboundary, z is the distance perpendicular to boundary. The quantity δ is the viscouspenetration depth or viscous skin depth. The effect of this viscous skin disappears as zincreases until the resulting velocity is just that of the primary wave. At a large distancefrom the scatterer this wave is not noticeable, but as with the thermoelastic wave, itdoes dissipate energy at the boundary. The above expression is valid if the wavelengthis much greater than the skin depth.

3.1. Overview 11
3.1.3 Other waves
In unbound solid, the wave progression can be described in terms of compression wavesand shear waves. When a boundary is present additional constraints are place on themotion of an element in the medium. The results of these constraints are differentpropagation modes that depend not only on the elastic modulii but on the type andshape of the boundary. The following are some examples of these modes.
For a free cylinder excited so that a wave travels down its axis, it can produce torsionalwaves and flexural waves, as well as the compressional waves already discussed.
For a plate, the surface can exhibit Rayleigh waves, if the surface is free to move, orStonely waves if the surface is constrained e.g. by a fluid, and Love waves. If a wave hitsa boundary of a plate at a particular angle a creeping wave can be generated along thesurface. If the plate is thin, Lamb waves can propagate. [18]
If the boundary is cylindrical, circumferential waves called whispering gallery canwaves exist [19]. These are named after the effect they created in round buildings suchas the dome of St. Paul Cathedral and are shown in Figure 3.6
Figure 3.6: Whispering Gallery waves.
In the model that we present in the next section, these different modes are not con-sidered per sae. But, the shear waves and the compression waves that are modelled, aresubjected to the constraints of the boundaries. The effect on the velocity (or pressure)field is therefore the same if it is calculated using the modes listed above. However,the explanation for the behaviour, such as resonance is more difficult, if not impossible,unless we consider the modes described above.
3.1.4 Resonance
Resonance of a free cylinder occurs if the wavelength of a wave, or a multiple of wave-lengths of a wave, travelling in the scatter matches the distance to one of the boundariesof the scatterer. If the wave is a compressional wave travelling down its axis then if awhole number of wavelengths fit into the length it will resonate. If a cylinder is excited

12 Ultrasound in Suspensions
so that a wave travels down its axis, it can produce compressional waves, torsional wavesand flexural waves. All of which can produce resonance effects. Further description ofthese phenomena is given in [11]
If a free cylinder is excited so that a compression wave travels in the radial direction,then resonance may occur if the wavelength matches the diameter. If we look at the caseof a nylon fibre of diameter 55 μm, with a wave velocity of 2345 ms−1, the frequency atwhich this would occur would be 42 MHz, from f = c/λ (where λ is the wavelength and cis the wave velocity). This is much higher than the frequency range we are investigating.However, this type of excitation develops surface waves on the surface of the cylinder [20].Since the path the wave is travelling is now equal to the circumference, 2πR, the frequencyat which resonance occurs is less than that of the compressional wave travelling radially.The waves that are excited are not just shear and compressional waves but are likelyto be Rayleigh waves if the cylinder surface is free, and Stonely waves, if the cylinder isconstrained, as when the cylinder is submersed in a fluid. In addition Whispering Gallerywaves could also be generated.
Proof of the existence of these circumferential waves is given when the radius of thecylinder is large in comparison to the wavelength i.e. large values of ka where k is thewave number and a in this case is the radius [19]. But as yet we have no proof at lowervalues of ka. Thus, it is uncertain which type of wave is causing the resonance peaks inthe nylon in the frequency range we are investigating. The resonance that is producedis a function of the frequency, wave velocity (both compressional and shear) and theradius of the cylinder. Since the cylinder is surrounded by water, the resonance is also afunction of the ratio of the water density to the fibre density and to the velocity of thewave in water. This is discussed in more detail in Paper D. Further work is required toexplore these resonance effects
We will now turn to examining the work that has been done in modelling thesedifferent phenomena in the scattering of ultrasound in suspensions before presenting anoverview of the SCS model.
3.2 Historical Background
The propagation of sound in suspension has been discussed for at least a hundred years.Rayleigh [21] calculated the scattering effect of small spherical obstacles in a non-viscousatmosphere, when considering the effect on sound of fog and showed that the attenuationdepends on the number of scattering particles and the ratio of their diameter to thewavelength of the sound. Knudsen [22] used expressions by Sewell in the calculation ofattenuation for spherical and cylindrical particles in a viscous fluid to model audible soundin fog and smoke. Incidentally, Sewell’s work confirmed the futility of using suspendedor stretched wires for absorbing sound in rooms. In 1953, Epstein and Carhart [23]developed a model for the attenuation of sound by spherical particles where energy lossis due to the thermal and viscous losses in the boundary layer as well as scattering fromthe particle itself.
This model was modified slightly by Allegra and Hawley [24] and the resulting

3.3. Simple Cylinder Scattering (SCS) model 13
Epstein-Carhart[23]/Allegra-Hawley [24] (ECAH) model has been the basis for inves-tigations on attenuation and velocity measurements in emulsions [16]. A summary ofdifferent experiments on suspensions based on acoustic scattering theories is given in[25], though which specific model has been used in each case is not mentioned. In 1982,Habeger [17] derived a cylindrical version of ECAH model and tested this with experi-ments on suspensions of viscoelastic polymer fibres in water. The fibre parameters thatwere known or could be measured, using alternative methods, were used in the modelwith no adjustments. The values of the loss tangent and Poisson’s ratio were set to fitthe experimental data.
As the concentration increases, models relying on number of particles multiplied bythe attenuation of a single scatterer start to become less appropriate. Multiple scatteringmodels such as those developed by [26] have been developed for spherical particles butthis cannot be directly applied to other shapes.
Another type of model that has actually been applied to paper pulp is Biot’s model[27]. However, Habeger [17] claims that more difficulties lie in trying to assess the struc-tural and material properties required in this model than in establishing the materialproperties in a scattering model.
Habeger [17] used the results of work on synthetic fibres to explain qualitatively theeffect of the refining process on paper pulp using the results of ultrasound attenuationmeasurement and suggested more work was warranted [28]. The attenuation model usedin this thesis is based on Habeger’s model. To make the model more amenable to use insolving the inverse problem, where we estimate material properties from measurement ofattenuation, an analytical solution for coefficients of expansion, Bn, was sought. This isderived in detail in Paper A. A general understanding of the model is presented in thenext section.
3.3 Simple Cylinder Scattering (SCS) model
In the SCS model, we calculate the energy loss of an ultrasound wave after it has inter-acted with an infinitely long, cylindrical particle as depicted in Figure 3.7. The particlematerial is assumed to be viscoelastic and isotropic. To do this we need to establish theenergy carried by the scattered wave. To simplify the problem, we split the velocity intotwo parts: one from the gradient of a scalar potential and the other from the curl of avector potential. The first part represents a longitudinal wave and the second a trans-verse wave [15]. The problem is then solved in terms of these wave potentials. Hence ifwe wish to calculate the velocity then
V = ∇φ + ∇× A (3.11)
Where φ is the scalar potential and A is the vector potential.Normally a vector potential would require three scalar potentials to define it but
in this case we define the vector potential as being transverse to the wave, hence weneed only two scalar potentials. We take, as our starting point, the wave equation:one for the fluid and one for the solid. This relates the wave numbers to these scalar

14 Ultrasound in Suspensions
Figure 3.7: Diagram of an ultrasound plane wave being scattered off a cylindrical particle.
or wave potentials. The stress, strain and velocities can be expressed in terms of thewave potentials. These are divided into their cylindrical components, which make theboundary conditions simpler to apply. In the general case boundary conditions are thatthe velocities and the stresses in all three of the cylindrical co-ordinates are continuousacross the solid/fluid interface.
However, before applying the boundary conditions, the wave potentials are expressedin terms of Bessel functions. Any function can be expressed as a series of Bessel function[29] so in general
f(z) = aoJo(z) + 2∞∑
n=1
anJn(z). (3.12)
Here the function f(z) is expressed in a series of Bessel functions of the first order, Jn(z)and unknown coefficients of expansion, an. In particular, the function exp(ir cos θ) [30]can be expressed as
eir cos θ = Jo(r) + 2∞∑
n=1
inJn(r)cos(nθ). (3.13)
In cylindrical coordinates, r is the distance in the radial direction and θ is the angular dis-tance. Hence solutions to the wave equation, when expressed in cylindrical co-ordinates,can be expressed in terms of Bessel functions. We continue therefore, by expanding theincident wave potential in the fluid and the wave potentials in the solid in terms of Besselfunctions. The reflected wave potential in the fluid (and the shear waves potentials thatexist in Habeger’s model [17]) have to be expanded in terms of Bessel functions of thethird order, often referred to as Hankel functions, as these potentials are not defined atthe origin, i.e. do not span across r = 0. Because each order of the series is orthogonal,each of the n terms in the expansion can be treated separately. In this way we can solvethe system of equations for the unknown coefficients of expansion.
The next part is to relate the coefficients of expansion to the energy loss of the incidentwave as it interacts with a number of cylindrical scatterers. The average loss per unit

3.3. Simple Cylinder Scattering (SCS) model 15
time due to the viscous and thermal processes has been showed by [23] to be equal tothe product of the velocity and the stress integrated over the surface.
L =1
2�
( ∫V ∗
j τijdSi
), (3.14)
where L is the energy loss per unit time and length, V ∗j is the conjugate of the velocity,
τij is the stress.If we assume we are at a large distance from the scatterer then these losses come
down to the losses being a function of no other potentials but that of the reflected wave.This is shown in the expression for the energy loss L per unit time and per unit lengthby,
L = −ωρ1
∞∑n=0
� (εn(Bn + BnB∗n)) , (3.15)
where εn = 1 for n = 0, εn = 2 for n > 0 and Bn are the coefficients of expansion. ρ1 isthe density of the water and ω is the angular frequency. � indicates that only the realpart is taken. To this we have to add the losses due to the scattering, which again, ata large distance from the scatterer come down to the losses being a function of no otherpotentials but that of the reflected wave,
Ls = ωρ1
∞∑n=0
� (εnBnB∗n) . (3.16)
The total energy loss Lt is therefore the sum of 3.15 and 3.16,
Lt = −ωρ1
∞∑n=0
� (εnBn) . (3.17)
Since we know the mean energy flow is [23]
E =1
2kc1ωρ1, (3.18)
where kc1 is the wave number of the compression wave in the fluid. Hence the attenuationdue to a single scatterer is
α =Lt
E=
−2
kc1
∞∑n=0
� (Bnεn) . (3.19)
Multiply this by the number of particles per unit length, N where
N = fr/(πR2) (3.20)
and where fr is the volume fraction, and R is the radius of the scatterer. We also takeinto account the fact that these fibres lie at different angles to the oncoming wave by

16 Ultrasound in Suspensions
taking the average cosine of attenuation over the range of angles from 0◦ to 90◦. Thefinal expression is
α =−2fr
πR2kc1
�(∫ π
2
0
εnBn cos(ψ)dψ
). (3.21)
In this derivation an assumption is made in the step from equation (3.14) to equation(3.15) that the effect of viscosity of the water is negligible. More specifically,
limr→∞
τrr = (iωρ1 − 2ηk2c1
)(φ0 + φr) − 2η(φ01,rr + φr1,rr) (3.22)
to
limr→∞
τrr ≈ iωρ1(φ0 + φr), (3.23)
where τrr is the stress in the radial direction, η is the viscosity, φo is the incident wavepotential, φr is the reflected wave potential and φ01,rr and φr1,rr are the gradients of theincident and reflective wave potentials along the r-axis in equation (3.22) respectively.
To account for this assumption the attenuation of water is added to the attenuationcalculated in equation (3.21). This final expression is therefore,
α =−2fr
πR2kc1
�(∫ π
2
0
εnBn cos(ψ)dψ
)+ αw, (3.24)
where αw is the attenuation due to water.In addition to being able to calculate the attenuation, from the coefficients of expan-
sions we can also calculate the wave potentials in the area surrounding a single fibre. Theresulting wave potential from a single fibre is shown in Figure 3.8. To clarify the effectof the fibre on the reflected field potential the same plot is drawn but this time with theincident wave potential removed in Figure 3.9.

3.3. Simple Cylinder Scattering (SCS) model 17
-0.5
0
0.5
-0.5
0
0.5-1.5
-1
-0.5
0
0.5
1
1.5
x-direction (mm)y-direction (mm)
Am
pli
tud
e o
f th
e W
av
e P
ote
nti
al
Figure 3.8: Amplitude of the wave potential surrounding a fibre scattering an plane ultrasonicwave.
-0.50
0.5-0.5
0
0.5-1.5
-1
-0.5
0
0.5
1
1.5
x-direction (mm)y-direction (mm)
Am
pli
tud
e o
f th
e W
av
e P
ote
nti
al
Figure 3.9: Amplitude of the reflected wave potential surrounding a fibre scattering an planeultrasonic wave.

18 Ultrasound in Suspensions

Chapter 4
Summary of the Papers
4.1 Paper A - Estimating Suspended Fibre Mater-
ial Properties by Modelling Ultrasound Attenu-
ation
Authors: Yvonne Aitomaki and Torbjorn LofqvistReproduced from: Proceedings of International Conference ‘Mathmatical Modelling ofWave Phenomena 2005´
SummaryThe SCS model is described in detail. This is compared to the model that includesthermal and viscous shear effects in the fluid derived by Habeger [17]. Experimentalderived attenuation for a suspension of nylon fibres cut from fishing line in water iscompared to the predicted attenuation from the model results. The nylon used in thefishing line is a polyamide copolymer so the exact material properties of the fibre weredifficult to establish since the type of the copolymer was not known. The results laybetween those expected for nylon 66 and nylon 6. Resonance peaks in the attenuationwere both predicted and found experimentally. The conclusion was that it appears themodel is sufficiently sensitive to material properties that estimation of these propertiesfrom the attenuation may be possible.
4.2 Paper B -Ultrasonic Measurements and Mod-
elling of Attenuation and Phase Velocity in Pulp
Suspensions
Authors: Jan Niemi, Yvonne Aitomaki and Torbjorn LofqvistReproduced from: Proceeding of IEEE Ultrasonic Symposium, Rotterdam, Holland 2005
19

20 Summary of the Papers
SummaryThis paper introduces a method of performing phase unwrapping that minimises dis-continuities in the phase shift. This is used to calculate the phase velocity in pulps ofdifferent consistency. The results show that dispersion is caused by fibres and correlateswith mass fraction. Attenuation measurements of pulp are also made, with the aim offinding resonance peaks in the frequency response of the attenuation predicted by themodel. Clear peaks are not found. This is thought to be due to the affect of the dis-tributed diameters of the pulp fibres. Estimations of the properties are made from thesecurves but comparison with known values was not done. This is due to the difficulties incarrying out single fibre tests on saturated wood fibres.Personal contributionWork based on the attenuation was carried out by myself. The phase velocity work wascarried out by Jan Niemi.
4.3 Paper C -Inverse Estimation of Material Prop-
erties from Ultrasound Attenuation in Fibre sus-
pensions
Authors: Yvonne Aitomaki and Torbjorn LofqvistTo be submitted to: Elsevier Ultrasonics
SummaryIn this paper experiments on nylon 66 give evidence for the effect that different diameterhave on the attenuation. This supports the SCS model. An optimisation procedure isimplemented to estimate the accuracy with which material parameter can be estimatedfrom the model. The results show that the shear modulus is within expected range.Density measurement are overestimated by 10%-15%. However, Poisson’s ratio is overes-timated and consequently underestimates the value of Young’s Modulus. The suggestedreason for this is that the model underestimates of the attenuation at high frequencies.This could be caused by additional attenuation effects that have not been taken intoaccount by the model or due to the anisotropic nature of the fibres.
4.4 Paper D - Sounding Out Paper Pulp: Ultra-
sound Spectroscopy of Dilute Viscoelastic Fibre
Suspensions
Authors: Yvonne Aitomaki and Torbjorn LofqvistSubmitted to: Acoustics and ultrasonics in the processing of industrial soft solids

4.4. Paper D - Sounding Out Paper Pulp: Ultrasound Spectroscopy ofDilute Viscoelastic Fibre Suspensions 21
SummaryThe reason why the resonance peaks appear in the frequency response of the attenuationis explored in this paper. We show here that the resonance of the first peaks is connectedto the shear wave velocity in the fibre and its diameter. Hence experimentally determiningthe location of the first resonance peak will help establish the value of the shear modulus.This backs up the results in Paper C, which showed that the shear modulus was estimatedto within a previously established range. The reason that the first resonance peaks areassociated with shear waves is because the shear waves has a lower velocity than thecompression wave. The exact nature of the wave that causes this resonance is not yetestablished, since the proof that they are Rayleigh waves relies on asymptotic valuesfor the Bessel functions, which are only valid for ka (the product of the radius and thewave number) values much greater than one. Since this is not the case with the fibresuspension used, we cannot draw the same conclusion that the peaks in attenuation arealso caused by Rayleigh waves.

22 Summary of the Papers

Chapter 5
Discussion
Some issues are raised in the papers on the reliability of the experimental measurementsand the accuracy of the model. We take the opportunity now, to discuss these in moredetail here.
The temperature dependency of attenuation of water has not been addressed in thesepapers. However, data from [31] shows the effect of attenuation on water and is plottedbelow.
15 20 25 301.6
1.8
2
2.2
2.4
2.6
2.8
3x 10
−14
Temperature ( °C )
Atte
nuat
ion
(10
−15
f −2 )
Figure 5.1: Temperature dependence of Attenuation per frequency squared [31]
Using this data and the temperature of the suspension used in Paper C that givesthe maximum attenuation difference, the error in the attenuation is estimated at 6%.Temperature adjustment will be made in future experiments.
The results of the parameter estimation in Paper C showed that the compression wavevelocity in the fibre is overestimated. This could be because the model underestimatesthe attenuation. One way of increasing the theoretical attenuation at high frequencies
23

24 Discussion
without moving the peak due to the shear velocity, and consequently the shear modulusand density, is to assume a higher value of Poisson’s ratio. This increases the compres-sional wave velocity. This is shown in Figure 5.2 where the best-fit line is taken fromthat of the 55 μm fibre used in the experiments described in Paper C. For this plot,Poisson’s ratio was estimated at 0.49, and compared to a theoretical attenuation calcu-lated using Poisson’s ratio of 0.42. As can be seen, the attenuation is lower. Hence themost likely explanation for this overestimation of the velocity is that the model under-estimates the attenuation at high frequencies, which causes the parameter optimisationprocess to increase the value of Poisson’s ratio, and hence the compressional wave speed,when matching the theoretical and experimental attenuation.
0 5 10 150
10
20
30
40
50
60
70
Frequency (Mhz)
Atte
nuat
ion
(np/
m)
Poissons Ratio = 0.49Poissons Ratio = 0.42
Figure 5.2: Effect of reducing Poisson’s ratio on the Attenuation [31]
One possible reason for the lower prediction of attenuation at higher frequencies isthe effect of neglecting multiple scattering effects. Multiple scattering is where the waveinteracts with more than one scatterer. Although multiple scattering theories exist,they have only been developed for spherical particles so far [26]. A possible way ofapproximating this effect is to assume that the next interaction is the same as if it werethe first interaction. But, that in addition we add the intrinsic attenuation of the wavetravelling through a solid. An approximation for the attenuation in a solid have beengiven earlier in equation (3.5). So, the complete theoretical attenuation becomes:
αt = α + (1 − fr)αw + frαf (5.1)
where α is the attenuation calculated from the SCS model presented in equation 3.21,αw is the attenuation of water and αf is the attenuation in the solid.
Further investigations using this modification will be carried out to see if it improvesthe predicted attenuation at higher frequencies.
The effect of temperature on the attenuation in water, neglecting thermal effectsand transverse waves in the water all affect the level of the attenuation but should notsignificantly affect the shape of the attenuation curve over this frequency range. Thus

25
these factors could be ignored if comparative measures are required or compensationmade for them. However, the consequence of the possible multiple scattering effects willaffect the shape of the attenuation curve and this leads to more unpredictable errors inthe estimation of the parameters.

26 Discussion

Chapter 6
Conclusion
As far as online paper pulp quality measurement goes, we have established that wecan estimated shear modulus and to a certain extent density, from nylon 66 fibres insuspension (Paper A & C). But more importantly, we propose that the frequency rangethat should be used is in the region where the wavelength is of the order of the radius(Paper C & D). Some initial trials have been done on pulps which have highlighted theproblem of non-uniformity of radius of the fibres and the difficulty with assessing theaccuracy of these measurements (Paper B).
When solving inverse problems, one is always faced with the fact that the result couldbe caused by a number of different inputs. The more information one has, the better thechances of finding an accurate estimation of these inputs. In our application the resultis the attenuation measurement and the inputs are the material properties. In lookingat higher frequencies where the wavelength is comparable to the size of the scatterer, wemay be introducing errors into the model, as effects that have not been accounted foraffect the accuracy, but in increasing the frequency range we also obtain more informationabout the material properties. The key is then to find the right balance.
For the method as it is to have application in the paper and pulp industry thereare certain conditions that need to be fulfilled. These are that we find peaks in thefrequency response of the attenuation in pulp, know the diameter distribution of thefibres and the hollow nature of the fibres does not significantly alter the results. Wecan then, potentially, be able to establish the shear modulus of the pulp fibres. If theshear modulus is a factor in paper quality, we may be nearer than we think to the onlinemeasurement of paper pulp quality using ultrasonic spectroscopy. Improving the modelmay allow us to estimate further properties and take into account the fibres being hollow.
27

28 Conclusions

Chapter 7
Further Work
7.1 Getting this to work
The aim of these studies is to develop an online fibre characterization measurementmethod for use in the paper and pulp industry. Questions that we have to address totake this project further are:
• Is this model adequate for modelling hollow fibres?
• Does work for different materials?
• How accurate is the parameter estimation for other materials?
• How do we deal with non-uniform diameters?
• Can we get more data to improve the parameter estimation?
Is this model adequate for modelling hollow fibres?
Models are available for layered cylinders [32]. However, the set of equations to solve islarger and another parameter is required to be estimated but, due to the slip boundarycondition used, the equations are not as involved as the set used in the SCS model. Asa first step we can experiment on hollow and solid synthetic fibres to assess the effectthis has on attenuation. Using the layered model we could also predict the differences.If the model predicts the attenuation better than the SCS model then this could be usedin place the SCS model in the parameter estimation procedure.
Does work for different materials?
To establish the reliability of the estimation of material properties different types of fibreshould be tested. The plan is to continue to test with rayon and polyester fibres.
29

30 Further Work
We also intend to work with pulp testing laboratories in an effort to gain more accurateknowledge of the material properties of pulp fibres in suspension. Of particular interestis the variability from one pulp to another and the degree of accuracy required by thepulp manufactures for the parameter estimation to be useful in controlling pulp or paperproduction.
How do we deal with non-uniform fibres?
Pulp fibres differ considerably from one other. They have different diameters, thicknesses,and elasticity. However, their density does not vary much. The different densities of thefibres come from differences in the wall thickness. If data is available on the fibre wallthickness and the diameter, it might be possible to estimate fibre properties as wasdone in Paper B. However, it seems unlikely that both diameter and material propertiescould both be estimated. This depends considerably on the variation in the pulp fibres.Different sizes should produce peaks at different frequencies. This may provide a goodmeans of differentiating between the type of fibre in the pulp. However, large fibres mayhave different properties from smaller fibres and will consequently add further ambiguityin solving the inverse problem.
Can we get more data to improve the parameter estimation?
In inverse problems, the more data there is available the less ambiguous the solution.Hence we need to search for ways of obtaining more data.
Increasing the frequency range
Increasing the frequency range increases the spectra available for the estimation process.From Paper C, the suggestion is to aim for frequencies where at least the first resonancepeak is available. Since pulp fibres have average diameters of 30 to 40 microns as opposedto 50 to 55 microns of the nylon, the frequency range could be increased to investigatewhether resonance peaks exist beyond the range we are currently using.
Investigating the possibility of modelling to measure phase
In [33], the coefficient of expansion of the reflected wave from which the attenuation isderived is expressed in terms of a phase shift. Using this model we can model both thephase velocity shift and attenuation and hence take two measurements to fit both setsto the data.
Will laser excitation provide us with more information?
Work is currently being done using photoacoustics to characterise paper pulp. It maybe possible that this would provide additional information on the pulp fibres such as thevolume fraction, or even their diameters, that can be used to improve the estimation ofthe material properties.

31
Figure 7.1: Solving the Inverse Problem

32

References
[1] “Swedish foresty agency international statistics.” http://www.svo.se/minskog/ Tem-plates/EPFileListing.asp?id=16698, 2006-03-04.
[2] J. Levlin and L. Soderhjelm, Pulp and Paper Testing. Fapet Oy, 1999.
[3] P. Brodeur and J. Gerhardstein, “Overview of applications of ultrasonics in the pulpand paper industry,” in 1998 IEEE Ultrasonics Symposium, pp. 809–815, 1998.
[4] Salesperson, “Lorentzen-wettre personal communication,” April 2006.
[5] K. K. Pitea, Valkommen till en rundvandring in Kappa Kraftliner Pitea. 2006.
[6] T. Wikstrom, Flow and rheology of pulp suspensions at medium consistency. Phdthesis, Chalmers University of Technology, 2002.
[7] M. Jansson, “Stfi-packforsk personal communication,” Feb 2006.
[8] M. Jansson and A. Jacobs, “Recycling fibres undergo fibre wall analysis,” Beyond,no. 1, p. 4, 2006.
[9] H. Karlsson and P. Fransson, “Stfi fibermaster fives the papermaker new muscles,”Sv. Papperstidning, vol. 10, no. 26, 97.
[10] E. Ehrnrooth, Softening and mechanical behaviour of single wood pulp fibres - the in-fluence of matrix composition and chemical and physical characteristics. Phd thesis,Department of Wood and Polymer Chemistry, University of Helsinki, 1982.
[11] L. Kinsler, A. Frey, A. Coppens, and J. Sanders, Fundamentals of Acoustics. JohnWiley and Sons Inc., 4 ed. ed., 2000.
[12] Kolsky, Stress Waves in Solids, ch. V, p. 118. Dover, 1963.
[13] A. Bhatia, Ultrasonic Absorption, ch. 11, p. 272. Dover, 1968.
[14] Kolsky, Stress Waves in Solids. Dover, 1963.
33

34
[15] P. Morse and H. Feshbach, Method of Theoretical Physics, vol. II, ch. 13. McGraw-Hill Book Company, Inc, 1953.
[16] D. McClements and M. Povey, “Scattering of ultrasound by emulsions,” Journal ofPhysics D: Applied Physics, vol. 22, pp. 38–47, 1989.
[17] C. Habeger, “The attenuation of ultrsound in dilute polymeric fiber suspensions,”Journal of Acoustical Society of America, vol. 72, pp. 870–878, sep 1982.
[18] Y. Fung, Foundations of Solid Mechanics. Prentice-Hall, 1965.
[19] J. Dickey, G. Frisk, and H. Uberall, “Whispering gallery wave modes on elasticcylinders,” Journal of the Acoustical Society of America, vol. 59, pp. 1339–1346,June 1976.
[20] R. Doolittle, H. Uberall, and P. Ugincius, “Sound scattering by elastic cylinders,”Journal of the Acoustical Society of America, vol. 43, no. 1, pp. 1–14, 1968.
[21] Rayleigh, The Theory of Sound. Macmillan, 1926.
[22] V. Knudsen, J. Wilson, and N. Anderson, “The attenuation of audible sound in fogand smoke,” The Journal fo the Acoustical Society of America, vol. 20, pp. 849–857,Nov 1948.
[23] P. Epstein and R. Carhart, “The absorption of sound in syspensions and emulsions. i.water fog in air,” The Journal of the Acoustical Society of America, vol. 25, pp. 553–565, May 1953.
[24] J. Allegra and S. Hawley, “Attenation of sound in suspension and emulsions: The-ory and experiments,” The Journal of the Acoustical Society of America, vol. 51,pp. 1545–1564, 2 1972.
[25] M. Povey, Ultrasonic Techniques for Fluid Characterization, ch. A.4, p. 179. Acad-emic Press, 1997.
[26] P. Lloyd and M. Berry, “Wave propagations through an assembly of spheres iv.relations between different multiple scattering theories,” Proc. Phys. Soc., vol. 91,pp. 678–688, 1967.
[27] D. Adams, Ultrasonic transmission through paper fiber suspensions. PhD thesis,University of London, 1975.
[28] C. Habeger and G. Baum, “Ultrasonic characterizations of fibre suspension,” IPCTechnical Paper series 118, The Institue of Paper Chemistry, Appleton, Wisconsin,Nov 1981.
[29] M. Abramowitza and I. Stegun, Handbook of mathematical functions. Dover, 1972.

35
[30] M. Morse, P and K. Ingard, Theoretical Acoustics, ch. 8, p. 401. Princetown Uni-versity Press, 1986.
[31] F. Fisher and V. Simmons, “Sound absorption in sea water,” Journal of the Acousti-cal Society of America, vol. 62, pp. 558–564, Sept 77.
[32] L. Flax and N. W., “Acoustic reflection from layered elastic absorptive cylinders,”Journal of the Acoustical Society of America, vol. 61, pp. 307–312, Feb 1977.
[33] J. Faran, “Sound scattering by solid cylinders and spheres,” Journal of the AcousticalSociety of America, vol. 23, pp. 405–418, July 1951.

36

Part II

38

Paper A
Estimating Suspended FibreMaterial Properties by Modelling
Ultrasound Attenuation
Authors:Yvonne Aitomaki and Torbjorn Lofqvist
Reformatted version of paper originally published in:Proceedings of International Conference ‘Mathmatical Modelling of Wave Phenomena2005´
c© Vaxjo University Press, Reprinted with permission
39

40 Paper A

Estimating Suspended Fibre Material Properties by
modelling Ultrasound Attenuation
Yvonne Aitomaki and Torbjorn Lofqvist
Abstract
An analytical model for use in the inverse problem of estimating material properties ofsuspended fibres from ultrasonic attenuation has been developed. The ultrasound at-tenuation is derived theoretically from the energy losses arising when a plane wave isscattered and absorbed off an infinitely long, isotropic, viscoelastic cylinder. By neglect-ing thermal considerations and assuming low viscosity in the suspending fluid, we canmake additional assumptions that provide us with a tractable set of equations that canbe solved analytically. The model can then be to used in inverse methods of estimatingmaterial properties. We verify the model with experimentally obtained values of attenu-ation for saturated Nylon fibres. The experimental results from Nylon fibres show localpeaks in the attenuation which are thought to be due to the resonant absorption at theeigenfrequencies of the fibres. The results of the experiments show that the model issufficiently sensitive to detect differences in different types of Nylon. Applications forsuspended fibre characterization can be found in the paper manufacturing industry.
List of Symbols
Unless otherwise indicated subscript 1 refers to the fluid medium and subscript 2 refers to the solidmedium.
A1,A2 transverse vector potentials M,N transverse vector potentialac R × kc M elastic modulusas R × ks R radius of the fibreacc R × kcc r , θ,
zcylindrical coordinates
asc R × ksc V velocityacs R × kcs α acoustic attenuationBn, Dn, Encoefficients of expansion α1 acoustic attenuation ın waterCp heat capacity in the fluid β thermal expansivityc velocity of sound tan δ2 loss tangent of the viscoelastic solidc complex speed of sound in the sound εij strainfr volume fraction of fibres η1 viscosity of the fluidH
(1)n nth order Hankel function of the first
kindΓl
ij Christoffel symbol
Jn nth order Bessel function of the firstkind
λ wavelength
K heat conductivity coefficient ω angular frequency

42 Paper A
k unit vector along the z-axis in cylin-drical
ρ density
co-ordinates λ2, μ2 Lame’s 1st and 2nd constantskc wave number of the compressional
waveυ2 Poisson’s ratio
ks wave number of the transverse wave ψ the angle between the incident wavekcc wave number of the compressional
waveand the longitudinal axis of the cylin-der
along the r-axis φc compressional wave scalar potentialkcs wave number component of the φo incident compressional wave
compressional wave along the z-axis scalar potentialksc wave numbers of the transverse wave φr reflected compressional wave
along the r-axis scalar potentialχ, ξ transverse wave scalar potentials
1 Introduction
Our research is aimed at the on-line estimation of the characteristics of pulp fibres sus-pended in water. An application is in the paper manufacturing industry where esti-mating fibre characteristics can potentially improve the quality control of the finishedpaper. The measurement method used is based on ultrasound as it is rapid, inexpensive,non-destructive and non-intrusive.
The focus of our investigation is on establishing the material properties of the sus-pended, fluid-saturated fibres from ultrasonic attenuation measurements. To do this weneed to solve the inverse problem of deriving these properties from the attenuation. Wetherefore require a model that relates attenuation to material properties and one that isanalytical since this is more amenable than numerical solutions for solving the inverseproblem. Habeger established a model related attenuation to material properties, wherethe equations are solved numerically [1]. We have developed an analytical solution basedon the same equations.
Habeger’s model is a cylindrical extension of the Epstein-Carhart [2]/Allegra-Hawley[3] model. In the calculation of attenuation, the set of equations are solved numericallyand are based on a number of different material properties. By neglecting thermal effectsand assuming low viscosity in the suspending fluid, we can make additional assumptionsthat provide us with a more tractable set of equations that can then be solved analytically.
In this paper we describe the simplified model used to relate the attenuation to thematerial properties of the fluid saturated fibres. We compare the analytical solution withthat obtained by a numerical solution of the non-simplified equation system [1], to verifythe validity of the additional assumptions that are made. We then verify the model withexperimentally obtained values of attenuation for saturated Nylon fibres. We go on todiscuss the results, draw conclusions and outline the next steps in our investigations.

43
2 Theory
The attenuation is derived from calculating the energy losses arising when a plane waveis incident upon an infinitely long, straight cylinder. The cylinder material is assumedto be isotropic and viscoelastic. The energy losses taken into account are from the wavebeing partially reflected, partially transmitted at the solid/fluid interface and from thegeneration of damped, transverse waves in the solid medium at the boundary. The highlydamped thermal skin layer, that is generated by the acoustically induced pulsations ofthe solid is shown by [1] to have the greatest effect where the thermal wavelength is ofthe order of the radius. We, therefore, consider frequencies above this region and hencethe thermal effects are neglected in the derivation of attenuation. The advantage is thatthe thermal material properties of the fibre and fluid can then be neglected, reducingthe number of material properties in the solution and hence increasing the feasibility ofestimating the remaining material properties from attenuation measurements. A viscouswave in the fluid (as defined by [2]) is also generated but again this is highly dampedand is neglected in the final stages of the derivation.
Expressions for the wave potentials from the conservation of mass, energy and mo-mentum were derived by [2] and are expressed for the fluid as:
∇ · A1 = 0 (1)
∇2φc1 = − k2c1
φc1 (2)
∇×∇× A1 = k2s1A1 (3)
V1 = − ∇φc1 + ∇× A1 (4)
where, kc1 = ω/c1 and ks1 =√
iωρ1/η1.In the solid, the displacement potentials are used instead of the velocity potentials.
Hence,
∇ · A2 = 0 (5)
∇2φc2 = − k2c2
φc2 (6)
∇×∇× A2 = k2s2A2 (7)
V2 = iω (∇φc2 −∇× A2) (8)
where kc2 = ω/(c2(1 − i tan δ2/2)) and ks2 =√
iωρ2/μ2. Further details of the definitionfor the wave number in a viscoelastic solid and the complex shear modulus, μ2, aredescribed in the Appendix.
The stress tensor can be expressed in terms of the wave potentials:
τij1 = η1
[(k2
s1− 2k2
c1)φc1
]δij + 2η1εij (9)
τij2 =[(ω2ρ2 − 2μ2k
2c2
)φc2
]δij + 2μ2εij (10)

44 Paper A
Where the strain is
εij =1
2(Vi,j + Vj,i − 2Γl
ijVl) (11)
The fluid wave potential is divided into an incident part and a reflected part, φc1 =φo1 + φr1 . The incident plane wave potential, φo1 , is expressed in cylindrical coordinatesand we let this equal ei(kcc1r+kcs1z−ωt) as in [1].
Since the plane of the cylinder lies at an angle ψ to the incident wave, the wavenumbers are expressed in terms of their components along the cylindrical coordinateaxes.
kcc1 = kc1 cos(ψ) (12)
kcs1 = kc1 sin(ψ) (13)
The inicident wave potential is expanded using Bessel functions of the first kind [4] as
φo1 =
(J0(kcc1r) + 2
∞∑n=1
in cos nθJn(kcc1r)
)ei(kcs1z−ωt) (14)
And the reflected wave potential in the fluid expanded using Hankel functions of the firstkind:
φr1 =
(B01H
(1)0 (kcc1r) + 2
∞∑n=1
in cos nθBn1H(1)n (kcc1r)
)ei(kcs1z−ωt) (15)
The combination of the equations (14) and (15) give us an expression for φo1 expandedin terms of Bessel and Hankel functions. To meet the boundary conditions for all valuesof z and t, the time and z dependence of the potentials must be the same as φo1 . Theequivalent expression for the compressional wave potential in the solid is
φc2 =
(B02J0(kcc2r) + 2
∞∑n=1
in cos nθBn2Jn(kcc2r)
)ei(kcs1z−ωt) (16)
where, kcc2 =√
(k2c2− k2
cs1).
To meet the boundary conditions in cylindrical coordinates, the transverse potentialcan be expanded in terms of two independent scalar potentials, see [5] such that, M =∇× χk, N = ∇×∇× ξk and A = M + N. Where χ and ξ are solutions to the scalarHelmholtz equation so, ∇2χ = −k2
s2χ and ∇2ξ = −k2
s2ξ. The energy dissipated by the
transverse waves in the fluid are however very small when the viscosity is low hence theseare neglected. Expanding the transverse waves in solid in terms of Bessel and Hankelfunctions we get
k2s2
ξ2 =
(D02J0(ksc2r) + 2
∞∑n=1
in∂ cos nθ
∂θDn2Jn(ksc2r)
)ei(kcs1z−ωt) (17)
ikcs1χ2 =
(E02J0(ksc2r) + 2
∞∑n=1
in cos nθEn2Jn(ksc2r)
)ei(kcs1z−ωt) (18)

45
where, ksc2 =√
k2s2− k2
cs2.
The boundary conditions are that the velocity along the surface normal and thestresses in all directions are continuous at the solid-fluid interface. So at r = R2, Vr1 = Vr2 ,τrr1 = τrr2 , τrθ1 = τrθ2 and τrz1 = τrz2 . Since we neglect the velocity of the viscous wavein the fluid we do not consider the boundary conditions of continuous velocity at thesolid/fluid interface in the θ and z directions. The boundary conditions are expressed interms of the potentials using (4), (8) and (9)-(11) and then expanded according to (14)-(18). The angular dependencies of the functions are orthogonal so the coefficients can bedetermined by applying the boundary condition to each order of expansion separately.
For n �= 0,
acc1J′(acc1) + Bn1acc1H
(1)′n (acc1)
= −iω[Bn2acc2J
′n(acc2) − En2asc2J
′n(asc2) + n2Dn2Jn(asc2)
](19)
η1
{[(a2
s1− 2a2
c1)Jn(acc1)− 2a2
cc1J ′′
n(acc1)] + Bn1 [(a2s1− 2a2
c1)H(1)
n (acc1)− 2a2cc1
H(1)′′n (acc1)]
}= μ2
{Bn2 [(a
2s2− 2a2
c2)Jn(acc2) − 2a2
cc2J ′′
n(acc2)] + 2Dn2n2[Jn(asc2) − asc2J
′n(asc2)]
+ 2En2a2sc2
J ′′n(asc2)
}(20)
η1
{acc1J
′n(acc1) − Jn(acc1) + Bn1 [acc1H
(1)′n (acc1) − H(1)
n (acc1)]}
= μ2
{Bn2 [acc2J
′n(acc2) − Jn(acc2)] +
1
2Dn2 [n
2Jn(asc2) − asc2J′n(asc2) + a2
sc2J ′′
n(asc2)]
+ En2 [Jn(asc2) − asc2J′n(asc2)]
}(21)
η1
{2acs1 [acc1J
′n(acc1) + acc1Bn1H
(1)′n (acc1)]
}= μ2
{2acs1acc2Bn2J
′n(acc2) + Dn2n
2acs1Jn(asc2) + En2asc2J′n(asc2)
(a2sc2
− a2cs1
)
acs1
}(22)
For n = 0, Dn2 is only present (21) hence the solution in this case is that Dn2 = 0. Hencefor n = 0 there are 3 equations and 3 unknowns and for n �= 0 there are 4 equations and4 unknowns. The expression for the coefficients Bn1 , Bn2 , Dn2 , En2 was then found forn = 0 and n �= 0 using Maple c©,Maplesoft, Waterloo, Canada.
This gives us the solution to the conservation equations. The subsequent derivationof the loss in energy due to the the scattering and absorption by the cylinder follows thatof [1]. The resulting expression for the attenuation, α is:
α =−2fr
πR2kc1
�(∫ π
2
0
cos(ψ)(B01 + 2B11 + 2B21)dψ
)(23)

46 Paper A
2 4 6 8 10 12 14 16 18 200
100
200
300
400
500
Frequency (MHz)
Atte
nuat
ion
(Np/
m)
Rayon NumericalRayon Analytical
Figure 1: test
2 4 6 8 10 12 14 16 18 200
20
40
60
80
100
120
Frequency (MHz)
Atte
nuat
ion
(Np/
m)
Polyester NumericalPolyester AnalyticalNylon NumericalNylon Analytical
Figure 2: Attenuation as a function of frequency for different fibres. The attenuation is ex-pressed in nepers per meter (Np/m),where neper (Np) is a dimensionless unit [6]. η1 =9.4 × 10⁻⁴ Nsm−2, ρ1 = 996 kgm−3, c1 = 1490ms−1, K1 = 0.59Wm−1K−1, Cp1 = 4.14 ×10³ Jkg−1K−1, β2 = 2.36 × 10⁻⁴ K−1. The parameter values for the fibres are shown in ta-ble 1.2
Rayon Nylon PolyesterR (m) 13 ×10−6 30 ×10−6 13 ×10−6
tan δ2 0.125 0.2 0.1υ2 0.3 0.4 0.4ρ2(kgm−3) 1400 1140 1340c2(ms−1) 1090 1340 5860K2(Wm−1K−1) 0.15 0.36 0.038Cp2(Jkg−1K−1) 1.5 ×10³ 1.42 ×10³ 1.02 ×10³
β2(K−1) 36×10−5 6×10⁻⁵ 1.7×10⁻⁵
Table 1.2: Parameter values of the different fibres used in the numerical and analytical models
Note that in the insertion of asymptotic values for the Bessel and Hankel function asr → ∞, Habeger’s [1] expression appears to be missing a factor of 2. The attenuation isthe sum to infinity of a series of Bn1 where n is an integer. However, when calculating theattenuation, the energy associated with the the higher order was assumed to be negligibleand the series was truncated at n = 2. The attenuation calculated does not take intoaccount the attenuation of the compressional wave through the water itself. This is,therefore, added to the attenuation of the fibres calculated above and is assumed to beα1 = 25 × 10−15f2 taken from [6], where f is the frequency.
The effects of the additional assumptions that were made to derive the analyticalmodel can be assessed by comparing the attenuation predicted by the analytical solu-tion presented here and the numerical solution presented by [1]. These assumptions arethat the acoustic attenuation from thermal processes are negligible and that the viscouswave generated in the fluid is also negligible. The results of the differences between thepredicted attenuation are shown in figure 2 for three different types of polymer fibres:

47
Rayon, Nylon and Polyester. In general the discrepancy in the results is proportional tothe attenuation. The two curves for each fibre have a similar shapes, with the excep-tion of Polyester at low frequencies. This exception is not further examined here. Theeffect the assumptions have depends on the frequency range and radius used as well asthe fluid properties and the thermal properties of the fibre. In the cases examined here,the discrepancies are not large, although the effect these errors have on the parameterestimation needs to be assessed when the model is used in solving the inverse problem.
We have, therefore, a simplified expression for α that can be used in solving theinverse problem. It is a function of the material properties of the saturated fibre and thesuspending fluid, the radius of the fibre and fibre volume fraction. The next step is thento verify the model with experimentally obtained values of attenuation from suspensionof fibre with known material properties and uniform radius.
3 Experimental
The experimental setup consists of a broadband transducer with a centre frequency of10 MHz (V311), manufactured by Panametrics, Waltham, MA, USA. A pulser/receiver5072PR from Panametrics was used to excite the transducer and amplify the receivedsignal. The signal was then digitized using a CompuScope 14100 oscilloscope card, byGage Applied Technologies Inc., Lachine, QC, Canada, with 14-bit resolution and asampling rate of 100 MHz. All data was stored in a computer for off-line analysis.The resulting time-domain waveforms were calculated using the average of 100 sampledwaveforms to reduce random noise. Before the averaging, the sampled waveforms arealigned to reduce timing jitter by using a method proposed by [7]. A digital thermometerF250, by Automatic Systems Laboratories LTD, England, monitored the temperatureboth in the suspension under test and in the room. The temperature was used to calculatethe speed of sound in the water [8]. The fibre suspension was carefully poured into themeasurement cell and then stirred until the majority of the air bubbles were removed.The measurement cell is described in detail in [9]. The attenuation of the sample wascalculated according to [10].
The fibre suspension was made of Nylon fishing line, (STROFTTM GTM) with anominal diameter of 60 μm,1 chopped to a length of approximately 4 mm. The Nylonwas a polyamide copolymer tempered to improve its tensile strength. The fibres wereweighed and mixed with water to a concentration of 0.5% by weight. They were then leftin water for 3 days to stabilise the temperature and to allow the fibres to become fullysaturated. To prevent the fibres from settling during the test the suspension was stirredgently. A set of 30 runs were taken each with an average of 100 pulses.
1Permissbile diameter fluctuation ±1 μm, Permissible norminal size deviation +38μm

48 Paper A
2 4 6 8 10 12 140
10
20
30
40
50
60
70
80
90
100
Frequency (MHz)
Atte
nuat
ion
(Np/
m)
Nylon 6Nylon 6,6Experimental Data
Figure 3: test
2 4 6 8 10 12 140
0.2
0.4
0.6
0.8
1
1.2
1.4
1.6
1.8
2
Frequency (MHz)
Nor
mal
ised
Atte
nuat
ion
+/− 2 STDAverage Normalised Attenuation
Figure 4: Attenuation as a function of frequency for a suspension of Nylon fibres in waterat 0.5% concentration. Modelled and experimental attenuation values. Parameters for thesaturated fibres are in shown in table 1.3. Right-hand figure is the Average of the Attenuationnormalised by the value of the attenuation at 5MHz to remove the variance directly proportionalto the attenuation.
4 Results
Figure 4 show the results from the 0.5% concentration of suspended Nylon fibres. As wecan see there is a large variation in the level of attenuation although the shape of thecurve is similar in all the measurement with local peaks in the attenuation at 4.8 MHzand at 7.7 MHz.
In the right-hand figure 4, the attenuation has been normalised by the value of theattenuation at 5MHz to remove the effect of variance directly proportional to the atten-uation. Attenuation proportional variance is thought to be due to the inherent inho-mogeneity of the suspension as the attenuation is proportional to the volume fraction.The fibres form flocs and through a combination of stirring and settling each time anultrasonic pulse is emitted it travels through a different arrangement of fibres resulting ina different volume concentration and hence a different attenuation. The remaining vari-ance, shown in the normalised attenuation graph increases with increasing attenuationand this is thought to be due to an decrease in the signal to noise ratio at the higherlevels of attenuation found at higher frequencies.
The modelled attenuation is plotted in figure 4 with two possible set of parameterswhich are listed in table 1.3. The material properties are however, difficult to establish.The density was taken from the manufacturer data sheet, and adjusted for 5% waterabsorption. The speed of sound in Nylon 6 was taken from Habeger [1], whereas forNylon 6,6 although the rod velocity was taken from his measurements in saturated fibres,Poisson’s ratio in Nylon 6,6 was taken as 0.39 [11]. This means the speed of sound inNylon 6,6 was calculated as 2345 ms−1. Poisson’s ratio for Nylon 6 was taken as the valuethat gave the best fit in Habeger[1] experiments. The exact value of the loss tangent was

49
Nylon 6 Nylon 6,6R (μm) 46.8 ± 0.4 46.8 ± 0.4c2(ms−1) 1340 2345ρ2(kgm−3) 1131 1131υ2 0.3 0.39tan δ2 0.2 0.15
Table 1.3: Parameter values used for Nylon
adjusted to best fit the experimental data as it can vary from very low, 0.01, in lightlycrossed amorphous polymer to 3 depending on the molecular structure [12].
As the plots show, neither Nylon 6 or Nylon 6,6 fits the whole range. Nylon 6, gives agood fit for the low frequencies and Nylon 6,6 for the higher frequencies. The wide marginof error in the elastic constants and hence the speed of sound and the fact that the Nylonused was a polyamide copolymer, tempered to improve its tensile strength, could explainsome of the discrepancies between the model results and the experimental results. Otherexplanations are that the values of the material parameters are not constant across thefrequency range we are examining or that some of the fibres are not freely suspended butinteract with one another which results in unpredictable ultrasonic attenuation. Multiplescattering would also cause differences between predicted and experimental results.
The peaks are thought to correspond to the resonant absorption at the eigenfrequen-cies of the cylinder, possibly of the shear wave, as opposed to reflections of internal wavesfrom the ends of the fibres. This is because the peaks appear in both the experimentaland the modelled values of attenuation and the modelled values are based on cylindersof infinite length.
5 Conclusions
In conclusion, we have established an analytical model relating the attenuation of ul-trasound, in a suspension of fibres in a low viscosity fluid, to the material properties ofthe fibres. This model is amenable for use in solving the inverse problem of determiningmaterial properties of saturated fibres from measurements of attenuation. The results ofthe experiments indicate that the Nylon tested, a polyamide copolymer, has propertiesbetween that of Nylon 6 and Nylon 6,6. The material properties of saturated fibres aredifficult to assess and hence have large margin of error. The results suggests that themodel is sufficiently sensitive to material properties to detect differences in different typesof Nylon.
The additional assumptions made that allow the analytical solution to be derivedcauses some discrepancies in the calculation of attenuation. However, the large variationsin attenuation thought to be due to the inherent inhomogeneity, is likely to mask thesedifferences.

50
6 Further Work
The elastic properties of the saturated Nylon fibres need to be investigated with analternative method to verify that they do indeed lie between that of Nylon 6 and Ny-lon 6,6. Investigations at different concentrations need to be carried out to test if theinhomogeneity of the attenuation is the cause of the attenuation proportional variation.
Further work needs to be done to establish the cause of the local peaks in the frequencyresponse of the attenuation. By testing other materials and different diameters of fibresthe accuracy of the model can be assessed further.
The next step is then to use this model in solving the inverse problem in suspensionsof greater complexity such as paper pulp where online data on the material properties ofwood fibre in suspension is required. For this, a method for optimising the fitting of themodelled attenuation to the experimental values needs to be developed. The effects ofnon-uniform diameters and anisotropic nature of the pulp fibres also need to be assessed.
7 Appendix
Here, we have defined the elastic modulus involved in the vibratory motion as complex and equal to:
M2(ω) = M ′2 − iM ′′
2 , where M2(ω) = λ2(ω) + 2μ2(ω) (24)
tan δ2 is then defined as the phase difference between the real and imaginary part of the elastic modulus:
tan δ2 = −M ′′2
M ′2
(25)
Denoting the compressional speed of sound in the solid as complex where c2 = c′2 − ic′′2 we get
c′22 − c′′22 =M ′
2
ρ2
, 2c′2c′′2 =
M ′2 tan δ2
ρ2
(26)
As tan δ2 is small at the limit tan δ → 0, which is the equivalent of assuming c′2 � c′′2 we get,
c2 ≈ c′2
(1 − i
tan δ2
2
)(27)
With the additional assumption that k′c2
� k′′c2
we get the same expression as derived by [13]. For easeof readability in the main text, the prime that distinguishes the real from the imaginary part has beendropped. So, in the main text, c2 = c′2.
μ2 can be expression in terms of Poisson’s ratio, υ2 and the complex speed of sound using (24) and(27), if we assume that Poisson’s ratio is real at these frequencies.
μ2 =(
0.5 − υ2
1 − υ2
)c′2ρ2(1 − i tan δ2) (28)

References
[1] C. Habeger, “The attenuation of ultrsound in dilute polymeric fiber suspensions,”Journal of Acoustical Society of America, vol. 72, pp. 870–878, sep 1982.
[2] P. Epstein and R. Carhart, “The absorption of sound in syspensions and emulsions. i.water fog in air,” The Journal of the Acoustical Society of America, vol. 25, pp. 553–565, May 1953.
[3] J. Allegra and S. Hawley, “Attenation of sound in suspension and emulsions: The-ory and experiments,” The Journal of the Acoustical Society of America, vol. 51,pp. 1545–1564, 2 1972.
[4] M. Morse, P and K. Ingard, Theoretical Acoustics, ch. 8, p. 13. Princetown UniversityPress, 1986.
[5] P. Morse and H. Feshbach, Method of Theoretical Physics, vol. II, ch. 13. McGraw-Hill Book Company, Inc, 1953.
[6] L. Kinsler, A. Frey, A. Coppens, and J. Sanders, Fundamentals of Acoustics, ch. 8.Wiley, 4 ed., 1999.
[7] A. Grennberg and M. Sandell, “Estimation of subsample time delay differences innarrowband ultrasonic echoes using the hilbert transform correlation,” IEEE Trans-actions on Ultrasonics, Ferroelectrics, and Frequency Control, vol. 41, no. 5, pp. 588–595, 1994.
[8] N. Bilaniuk and G. S. K. Wong, “Speed of sound in pure water as a function oftemperature,” The Journal of the Acoustical Society of America, vol. 93, no. 4,pp. 2306–2306, 1993.
[9] T. Lofqvist, “Ultrasonic wave attenuation and phase velocity in a paper-fibre sus-pension,” in Proc.IEEE Ultrasonics Symposium, vol. 1, pp. 841–844, Oct 1997.
[10] D. McClements and P. Fairley, “Frequency scanning ultrasonic pulse echo reflec-tometer,” Ultrasonics, vol. 30, pp. 403–405, 1992.
[11] L. Pedersen, “Tables of acoustic properties of materials,” 2002.
51

52
[12] J. Ferry, Viscoelastic Properties of Polymers, ch. 2, pp. 46–47. John Wiley & SonsInc, 3rd ed., 1980.
[13] M. Povey, Ultrasonic Techniques for Fluid Characterization, ch. A.4, p. 179. Acad-emic Press, 1997.

Paper B
Ultrasonic Measurements andModelling of Attenuation and
Phase Velocity in Pulp Suspensions
Authors:Jan Niemi, Yvonne Aitomaki and Torbjorn Lofqvist
Reformatted version of paper originally published in:Proceedings of IEEE Ultrasonic Symposium, pp.775-779 (Rotterdam, Holland),2005
c© 2005 IEEE, Reprinted with permission
53

54 Paper B

Ultrasonic Measurements and Modelling of
Attenuation and Phase Velocity in Pulp Suspensions
Jan Niemi, Yvonne Aitomaki and Torbjorn Lofqvist
AbstractIn the manufacturing process of paper the mass fraction and material properties of thefibres in the pulp suspension are important for the quality of the finished product. This
study presents two different methods of pulp characterisation. The first is based onphase velocity, which we use to investigate the composition of the pulp. Here a methodis presented where the optimal number of circular shifts within the sampling window ofthe signal is determined which gives, in a weakly dispersive medium, a continuous phasespectrum and minimizes the likelihood of discontinuities within the bandwidth. Hence,
the ambiguity in phase unwrapping is avoided. The results from phase velocitymeasurements show that the phase velocity weakly increases with increasing amount of
fines in the suspension. The dispersion is caused by the fibres and it correlates withfibre mass fraction. The second method is based on attenuation and is used to
characterise the wood fibres. The results of the attenuation experiments show that it ispossible to inversely calculate wood fibre properties by fitting the model to the
experimental data, if the fibre diameter distribution is known. However, the accuracy ofthese calculation is difficult to determined and more work in this area is required.
1 Introduction
In the manufacturing process of paper the mass fraction and material properties of thefibres in the pulp suspension are important for the quality of the finished product. Whenusing recycled paper, fibres with unknown and varying material properties enter theprocess. Therefore, there is an increasing demand for methods of on-line characterisationof the pulp suspension as well as the fibres in suspension.
This study presents two different methods of pulp characterisation. The first is basedon phase velocity, which we use to investigate the composition of the pulp. The secondis based on attenuation and is used to characterise the wood fibres.
In the first method, we investigate how the phase velocity changes with different massfractions of fibres and fines. To determine the phase velocity, a method is proposed basedon a method by [1], where the an echo is circularly shifted an optimal number of samples.
In the second method, to be able to characterise the wood fibres, we use an analyticalmodel which relates the material properties of saturated fibres to the attenuation. Wethen aim to solve the inverse problem of identifying which values result in the best fit ofthe model to the attenuation values calculated from experiments.

56 Paper B
2 Phase Velocity
2.1 Theory and experiments
When determining the phase velocity from pulse-echo measurements, one encounters theproblem of performing a correct phase unwrapping. The problem is well known andhas been addressed in earlier investigations, for instance [2]. The problem arises whenthe phase velocity is calculated from the phase spectra of a the Fourier transform ofeach of the two echoes. In this study, we propose a method, termed Minimum PhaseAngle (MPA), that determines an optimal number of circular shifts to the windowedsignal which results in a continuous phase spectrum and minimizes the likelihood ofdiscontinuities within the bandwidth. Therefore the ambiguity in the phase unwrappingis avoided. To experimentally test the method experiments were performed in pulpfibre suspensions, which are weakly dispersive. The experiments were carried out usingthe pulse-echo technique in a custom designed test cell. A schematical view of themeasurement cell used in this study is shown in Fig. 1.
Time
S1 S2
Ste
el
refl
ec
tor
Sa
mp
le
spa
ce
Bu
ffe
r-
ro
d
Tra
ns-
du
ce
r
d
1
2
3
Figure 1: Lattice diagram of the pulse-echo measurement system used this study
The echoes from the interfaces depend on the initial pulse pressure amplitude p0(t)emitted from the transducer and the reflection and transmission coefficients of the differ-ent interfaces. For simplicity, we omit the reflection and transmission coefficients and theattenuation. With these assumptions, the echoes from the interfaces between the bufferrod/suspension and suspension/steel reflector are
P1(ω) = P0(ω)e−2j ω
c1d1 = P0(ω)e−jϕ1(ω) (1)
P2(ω) = P0(ω)e−2jω(
d1c1
+d2c2
)= P0(ω)e−jϕ2(ω) (2)
where P1(ω) and P2(ω) are the Fourier transform of the echoes p1(t) and p2(t), re-spectively. d1 and d2 are the distance in respective medium. The factor 2 above comes

57
from that the fact the pulse is travelling back and forth through the medium. c1 and c2
are the velocities in the buffer rod and pulp suspension, respectively. P0(ω) is the Fouriertransform of the initial emitted pulse from the transducer. Note that echo p1(t) has anextra phase shift of π compared to p2(t).
2.2 The method of minimum phase angle
To reduce the ambiguity in the phase unwrapping the following method is proposed.
td2
td1
ts2
ts1
time
p1 p2
t=0
p0
Figure 2: The received signal with illustrations of the time delays and time shifts
The sampled signal is divided into two sampling windows with time delays td = nd/fs
shown in Fig. 2 where nd is the number of samples that the sampling window is delayedand fs is the sampling frequency. Within each sampling window the signal is circularlyshifted sample by sample. At each shift, a calculation of the phase angle is carried outas
PA =1
f2 − f1
f2∑m=f1
ϕ2m (3)
where ϕm is the phase spectrum within the frequency bandwidth of f1 < m < f2
of the shifted sample. Thereafter a sign shift of the echo is carried out, representinga phase shift of π, and again circularly shifted and calculated with the same method.The results are compared and the circularly shifted sample that gives a phase spectrumwithout discontinuities and minimum value of PA is then chosen. The outcome is thenthe optimal time shift of ts = ns/fs where ns is the number of samples the signal isshifted.
This results in two time delays, the time delay from the sampling window and timedelay from the circular shift within the window. This gives the phase spectrum for the

58 Paper B
respective echoes as
ϕ1(ω) = φ1(ω) + ω(td1 + ts1) (4)
ϕ2(ω) = φ2(ω) + ω(td2 + ts2) (5)
where φ1 and φ2 are the respective phase spectra of the circularly shifted signal. td1
and td2 are the time delay for respective sampling window. ts1 and ts2 are the circularshift within respective sampling window. An illustration of how PA changes when echop1(t) is circularly shifted within the sampling window is shown in Fig. 3. In this example,the minimum of PA is found when p1(t) is shifted 100 samples to the left and inverted.Fig.2.3(c) shows the phase spectrum at the minimum of PA for p1(t) and −p1(t). Wecan see that the inverted signal has a phase spectrum with the minimum likelihood of adiscontinuity being present in the spectrum.
The phase velocity for a pulp suspension sample can be expressed using (1)-(2) and(4)-(5) as
c2(ω) =ω2d2
ω(t2 − t1) + θ(ω) − θd(ω) + mπ(6)
where t1 = td1 + ts1, t2 = td2 + ts2, θ(ω) = φ2(ω)−φ1(ω), θd(ω) is the phase differencedue to diffraction [3] and m is a correction term if a phase shift of π is added by theproposed method. In this study m = 0 if the proposed method inverts p1(t) to compensatefor the extra phase shift that occurred, m = 1 if p1(t) and p2(t) are not inverted andm = −1 if both p1(t) and p2(t) are inverted.
2.3 Experiment
The experimental setup consists of a broadband transducer with a centre frequency of10 MHz (V311), manufactured by Panametrics, Waltham, MA, USA. A pulser/receiver5072PR from Panametrics was used to excite the transducer and amplify the received sig-nal. The signal was then digitized using a CompuScope 14100 oscilloscope card, by GageApplied Technologies Inc., Lachine, QC Canada, with 14-bit resolution and a samplingrate of 100 MHz. All data was stored in a computer for off-line analysis. The resultingtime-domain waveforms were calculated off-line using the average of 100 sampled wave-forms to reduce random noise. Before the averaging process, the sampled waveformsare aligned to reduce timing jitter by employing a method proposed by [4]. A digitalthermometer F250, by Automatic Systems Laboratories LTD, England, monitored thetemperature both in the suspension under test and in the room. The temperature inthe pulp suspensions under test was 20.0 ± 0.2◦C. The pulp suspensions was carefullypoured into the measurement cell and thereafter stirred slowly to remove air bubblesfrom the suspension. An illustration of the measurement cell is shown in Fig. 1 andis described in detail in [5]. To accurately determine the distance d2 in the cell, pure,distilled water was used as a reference since it has a well known relationship betweenspeed of sound and temperature, see [6]. Using the temperature of the calibration fluid

59
and a cross-correlation technique to determine the time-of-flight for an ultrasonic pulse,the distance d2 was found to be 0.03010± 0.00004 m.
The pulp samples used in this study were produced from thermo-mechanical pulp(TMP). The TMP was fractionated by Bauer-McNett fractionator according to SCAN-standard 6:69 [7]. This process separated the pulp into two fractions; a fibre fractionand a fines fraction. The fibre fraction consists of fibres that passed the 48 wire mesh,resulting in fibre lengths that vary between 1-3 mm and diameter of 20-50 μm. The fineswere obtained by passing the pulp through the 200 wire mesh and then subsequentlyfiltered through 400 wire mesh. They have a length of 30-74 μm and a diameter of a fewμm. Both the fines and fibre size distributions were analyzed using a Kajaani Fiberlabinstrument, Metso Corporation, Finland. From these fractions, a set of samples weremade by mixing fibres and fines at predetermined ratios between 0-1.0% by mass.
2.4 Results
The results from the phase velocity measurement for suspensions containing only finesis shown in Fig.4. The figure shows that the velocity dispersion is small within thebandwidth of the ultrasonic pulse, 1.8-10 MHz, and that the phase velocity increaseswith increasing amount of fines in the suspension.The uncertainty in the measurement is±0.3 m/s based on ±2 standard deviations.
Fig. 5, shows measurements of phase velocity for samples where the mass faction offibres are the same as for fines. In this case, the velocity dispersion is noticeable and itis seen to correlate well with mass fraction, giving higher velocity dispersion with highermass fraction. As an example, the velocity for 1.0% mass fraction changes from thelowest below 4 MHz to be the highest above.
3 Attenuation
3.1 Theory
The model is based on calculating the energy loss in the scatter wave from an infinitelylong, viscoelastic, isotropic, cylindrical fibre. It is described in full in [8]. In [8], themodelled attenuation agrees well with experimental results of synthetic fibres such asnylon and shows localised extrema in the frequency response of attenuation. These peaksin frequency response of the attenuation are thought to be at the vibrational modes ofthe fibres. Although the locations of these peaks depend largely on the diameter of thesaturated fibres, they also depend on their material properties.
In nylon, the locations of the peaks are more repeatable and hence more reliable thanthe measurement of the attenuation itself which varies due to the inhomogeneous natureof the suspension. The repeatability of the frequency at which these peaks occur andthe fact that changes in diameter, Poisson’s Ratio, Young’s Modulus and the density ofthe fibre produce different effects on the shape of the modelled frequency response of the

60 Paper B
attenuation, means that the suspension can be better characterised if these extrema canbe located.
The aim is, therefore, to determine if localised extrema also exist in the frequencyresponse of the attenuation of wood fibres. This would allow us to solve the inverseproblem with less ambiguity than attempting to solve the inverse problem from a simplecurve.
The model shows the attenuation in the frequency range 1Mhz to 25MHz to be verysensitive to fibre diameter. Using an average fibre diameter of 40 μm localised maxima inattenuation were predicted to be between 5MHz to 10MHz. However, the wood fibres inpaper pulp have different diameters hence the diameter distribution of the wood samplesis required to produce expected attenuation.
3.2 Experiment
The same measurement cell and paper pulp samples were used as in the phase velocityexperiments. As the diameter of wood fibres are smaller than nylon the peaks are ex-pected to appear at a higher frequency. Hence a 30MHz transducer (Panametric V333)was used and the signal digitised by a CompuScope 102G oscilloscope card (Gage Ap-plied Technologies, Inc Lachine QC Canada) with a 10-bit resolution and a sample rateof 2GHz. The distance the signal travelled was calculated using the method previouslydescribed. Since the initial echo from the buffer rod could not be easily identified, theattenuation in the sample was obtained using pure, distilled water as reference giving,
αs(f) = αw(f) +1
2d2
ln
( |Pw(f)||Ps(f)|
)(7)
where αs is the attenuation in the sample, d2 is the distance travelled by the signal,Ps(f) is the amplitude in the frequency domain of the second echo in the sample andPw(f) is the amplitude in the frequency domain of the second echo in water. αw(f) isthe attenuation of water [9] and is assumed to be
αw(f) = 25 · 10−15f2 (8)
3.3 Results
Figure 6 is a comparison of the experimentally calculated average attenuation and themodelled attenuation. Good agreement has been obtained by adjusting the saturatedwood fibre properties. The maximum at 2.2MHz in the experimental results is notreflected in the model results though a small maximum does exists at 2.4MHz and aslightly large one at 3.2MHz, corresponding to fibres with diameters of 60 μm and 40μmrespectively. This lack of agreement could be because the model is for a fibre that iscontinuous over its cross section. As wood fibres are hollow the vibrational modes, whichare believed to be causing the maxima, will not occur at the frequencies predicted by themodel. However, it may also be due differences between the distribution of the diametersin this particular sample and that used in the size analysis. The peak could also be an

61
experimental artifact. The sensitivity of the modelled attenuation on the fibre diameter,means the distribution of the diameters is the dominant factor in determining the materialproperties of the suspended fibres. With unknown fibre diameter distributions, thereis a greater possibility of determining the diameters of the fibres if the local extremain the frequency response of the attenuation are clear. However, the superposition ofmaxima and minima of one wood fibre diameter with other fibres of a different diametersresults in a the smoothing of the signal, masking the effects of the individual fibres. Thefeaturelessness of the curve means that the calculation of the material properties fromthe experimental measured attenuation is ambiguous. Combinations of different valuescan give similar results.
4 Conclusion
In this study we have considered measurements of phase velocity and attenuation in pulpsuspensions. The proposed method to calculate phase velocity avoids the ambiguity withphase unwrapping if the medium is weakly dispersive. The result shows that the phasevelocity increases with increasing amount of fines in the suspension. The dispersion iscaused by the fibres and it correlates with fibre mass fraction.
The results of the attenuation experiments show that it is possible to inversely cal-culate wood fibre properties by fitting the model to the experimental data, if the fibrediameter distribution is known. However, the accuracy of these calculation is difficult todetermined and more work in this area is required.
5 Further Work
The proposed minimum phase angle, or MPA, method has to be tested in cases whenthe phase velocity is highly dispersive.
The peak in the experimental results of the frequency response of attenuation at2.2MHz needs further investigation. Experiments on synthetic fibres are being carriedout to explore the effect of hollow compared to solid fibres. If these effects are significant,further development of the model is required to take this into account.

62
0 50 100 150 200-1
-0.8
-0.6
-0.4
-0.2
0
0.2
0.4
0.6
0.8
1
sample
am
pli
tud
e [
V]
p1
(t)
(a)
0 20 40 60 80 100 120 1400
1
2
3
4
5
6
7
8x 10
−5
sample shift
PA
−p1
(t)
p1
(t)
(b)
0 5 10 15 20−4
−3
−2
−1
0
1
2
3
4
Frequency [MHz]
Ph
ase
sp
ect
rum
[ra
d]
−p1
(t) n=100
p1
(t) n=93
(c)
Figure 3: (a) shows echo p1(t). (b) shows the results of pa(m) from p1(t) and when p1(t) isinverted. (c) shows the phase spectrum of p1(t) and −p1(t) when the echoes are shifted 93 and100 samples respectively, i.e at respective minimum of pa

63
0 2 4 6 8 10 121480
1481
1482
1483
1484
1485
1486
Frequency [MHz]
Ph
ase
Ve
loci
ty [
m/s
]
fib 0.0% fin 0.25%
fib 0.0% fin 0.50%
fib 0.0% fin 0.75%
fib 0.0% fin 1.0%
Figure 4: Phase velocity in pulp suspension containing fines and no fibres
0 2 4 6 8 10 121480
1481
1482
1483
1484
1485
1486
Frequency [MHz]
Ph
ase
Ve
loci
ty [
m/s
]
fib 0.25% fin 0.0%
fib 0.50% fin 0.0%
fib 0.75% fin 0.0%
fib 1.00% fin 0.0%
Figure 5: Phase velocity in pulp suspension containing fibres and no fines

64
2 4 6 8 10 12 14 16 18 200
10
20
30
40
50
60
70
80
Frequency (MHz)
Atte
nuat
ion
(Np/
m)
Modelled resultsAverage Attenuation (Expt)2*Std of Mean
Figure 6: Comparison of the modelled attenuation to the measured attenuation for 0.5% concen-tration of wood fibres. Plot of the mean and 2x STD of the mean for 300 readings. The followingmaterial properties for saturated wood fibres were used in the model: density=1500 kg/m3, Pois-son ratio = 0.45, speed of sound= 1050 m/s and loss tangent=0.2. The properties of water wereassumed to be: density=996 kg/m3, speed of sound=1490 m/s, and viscosity=9.4 · 10−4Pa · s

References
[1] P. He, “Experimental verification of models for determining dispersion from atten-uation,” IEEE Transactions on Ultrasonics, Ferroelectrics, and Frequency Control,vol. 46, no. 3, pp. 706–714, 1999.
[2] J. Tribolet, “A new phase unwrapping algorithm,” IEEE Transactions on Acoustics,Speech, and Signal Processing, vol. 25, no. 2, pp. 170–177, 1977.
[3] P. Rogers and A. Van Buren, “An exact expression for the lommel diffraction correc-tion integral,” Journal of the Acoustical Society of America, vol. 55, no. 4, pp. 724 –8, 1974.
[4] A. Grennberg and M. Sandell, “Estimation of subsample time delay differences innarrowband ultrasonic echoes using the hilbert transform correlation,” IEEE Trans-actions on Ultrasonics, Ferroelectrics, and Frequency Control, vol. 41, no. 5, pp. 588–595, 1994.
[5] T. Lofqvist, “Ultrasonic wave attenuation and phase velocity in a paper-fibre suspen-sion,” in Proc.IEEE Ultrasonics Symposium, vol. 1, pp. 841–844, Oct 1997.
[6] N. Bilaniuk and G. S. K. Wong, “Speed of sound in pure water as a function of tem-perature,” The Journal of the Acoustical Society of America, vol. 93, no. 4, pp. 2306–2306, 1993.
[7] Scandinavian Pulp, Paper and Board Testing Committee, Stockholm, SCAN-M 6:69,Fibre fractionation of mechnical pulp in the McNett apparatus.
[8] Y. Aitomaki and T. Lofqvist, “Measuring suspended fibre material properties bymodelling ultrasound attenuation,” in Mathematical Modelling of Wave Phenomena,2005. To be published.
[9] L. Kinsler, A. Frey, A. Coppens, and J. Sanders, Fundamentals of Acoustics. JohnWiley and Sons Inc., 4 ed. ed., 2000.
65

66

Paper C
Inverse Estimation of MaterialProperties from Ultrasound
Attenuation in Fibre Suspensions
Authors:Yvonne Aitomaki and Torbjorn Lofqvist
Reformatted version of paper originally published in:To be submitted to: Elsevier Ultrasonics.
c©
67

68 Paper C

Inverse Estimation of Material Properties from
Ultrasound Attenuation in Fibre Suspensions
Yvonne Aitomaki and Torbjorn Lofqvist
Abstract
A model based on ultrasound scattering is experimentally verified for a dilute suspen-sion of synthetic fibres in water. We then compare the accuracy of material properties ofthe fibres estimated from fitting the model to experimental measurements of attenuationto material properties of the fibres from other sources. The experimental results supportthe theory that the resonance peaks in the frequency response of the attenuation are afunction of the diameter of the fibre. The estimated value of shear modulus is in line withpreviously reported values and the density is estimated to between 10% and 15%. Pois-son’s ratio is overestimated, leading to underestimation of the Young’s modulus. Thisoverestimation of Poisson’s ratio is thought to be due to a lack of accuracy of the modelat high frequencies. It appears that the accuracy of the estimation procedure dependson frequency range containing resonance peaks. Further work on the model is requiredto increase its accuracy at higher frequencies to improve the estimation of Poisson’s ratioand Young’s modulus.
1 Introduction
This study is part of ongoing research in the paper pulp characterisation using ultra-sound. The quality of paper pulp depends on the large number of factors and someof these are the properties of the pulp fibre itself [1]. Monitoring pulp characteristicshas, therefore, the potential to provide paper manufacturers with increased control overtheir pulp production. The measurement method being investigated is based on ultra-sound, as it is rapid, inexpensive, non-destructive and non-intrusive. Consequently, sucha measurements could be done online.
Two approaches that can be used to model ultrasound propagation in paper pulp areto model it either as a solid porous media or to as cylindrical scatters suspended in a fluid.The solid porous media approach has been applied to paper pulp using Biot’s model ofthe attenuation and velocity of ultrasound [2]. However, the structural and solid/fluidinteraction parameters are many and difficult to establish. Using dilute solutions andhigher frequencies than the Biot model, scattering models can be considered. Epstein-Carhart [3]/Allegra-Hawley [4], (ECAH), model and the Harker and Temple model [5]have been developed for spherical like particles in suspension. A review of these theoriesconcerning their use in determine particle size distribution is found in [6]. Most ofthe work has, however, been concentrated on spherical particles. Studies of cylindrical

70 Paper C
particles have concentrated on large scatterers, where the product of the wave numberand the radius, kR, is large. In these studies, back-scattering rather than attenuation isconsidered [7], [8].
One of the closest models to that of a suspension of pulp fibres in water is thatdeveloped by Habeger [9]. This is a cylindrical extension of the ECAH model and relatesthe attenuation to the properties of water, the properties of the fibre, and the fibreconcentration. In the calculation of attenuation, the equations are based on a numberof different material properties and are solved numerically. By neglecting thermal effectsand assuming low viscosity in the suspending fluid, a more tractable set of equations isreached that can be solved analytically [10].
In this paper, we investigate whether this simplified cylinder scattering model (SCS)can be used to solve the inverse problem of estimating material properties of cylindricalparticles in suspension from the attenuation of ultrasound across a range of frequencies.The aim is to apply this to pulp fibres suspended in water but since natural fibres havenon-uniform diameters and have variable material properties, nylon fibres in water wereused to test the accuracy of the estimation of material properties from experimentallyobtained ultrasound attenuation.
We start by describing the simplified SCS model and the experimental procedure usedto obtain the frequency response of attenuation of a suspension of nylon fibres in water.We discuss the results and ways in which they can be improved both by refining thetheoretical model and the experimental procedure.
2 Theory
In the SCS model, the attenuation is calculated from the energy losses arising when aplane wave is incident upon an infinitely long, straight cylinder. The cylinder material isassumed to be isotropic and viscoelastic. The energy losses taken into account are fromthe wave being partially reflected, partially transmitted at the solid-fluid interface andfrom the generation of damped, transverse waves in the solid medium at the boundary.The highly damped thermal skin layer, that is generated by the acoustically inducedpulsations of the solid is shown by [9] to have the greatest effect where the thermal wave-length is of the order of the radius. We therefore consider frequencies above this region,thus reducing the number of material properties in the solution and increasing the feasi-bility of estimating the remaining material properties from attenuation measurements. Aviscous wave in the fluid (as defined by [3]) is also generated but due to the low viscosity,the energy loss due to this wave is small and is neglected. The derivation is presented by[10] and the resulting equation for the attenuation α is
α =−2fr
πR2kc1
∞∑n=0
�(∫ π
2
0
εnBn cos(ψ)dψ
)(1)
where fr is the volume fraction; R is the radius of the fibre; kc1 is the wave number ofthe compressional wave in water; ψ is the angle of between the plane of the fibre and

71
the direction of the oncoming ultrasound wave; n is a positive real integer; εn has thevalue 1 if n = 0 otherwise εn = 2 and where Bn is the nth expansion coefficient of thewave potential of the reflected wave. With the assumptions stated above, the solutionfor the coefficients Bn, comes from using the boundary condition of continuous velocityin the radial direction and continuous stress in radial, tangential and axial directions atthe fluid-solid interface. These conditions are expressed in terms of the wave potentialsof the incident wave and reflected wave in the fluid and the compressional and shearwave potentials in the fibre. The result is an expression for Bn as a function of thefluid properties: viscosity, density and velocity of the compressional wave and the fibreproperties: shear modulus, density, loss tangent, velocity of the compressional and shearwaves. The shear modulus is a function of the density and velocity of the shear wave.The shear wave velocity is related to the compressional wave velocity by Poisson’s ratio.The actual expression for Bn is solved using Maple c© (Maplesoft, Waterloo, Canada). Ascan be seen in equation 2, the attenuation is a sum of Bn. In our experiments on nylonin water, four terms (n =3) were used, as higher terms did not have any significant effecton the attenuation in the frequency range we are considering. We note, however, frominvestigation of particulate solutions, it has been empirically established that the numberof term to use is n = 1.05kc1R + 4 [6].
We compensate for an assumption in the derivation of the attenuation that viscosityof water is neglected, once the expansion coefficients have be established, by adding theattenuation of water to the attenuation calculated by equation 2.
3 Experiment
The experiments were carried out using the pulse-echo technique. A schematic view ofthe measurement cell used in this study is shown in Fig. 1.
The attenuation of the sample can be calculated using distilled water as a calibrationmedium such that,
αE(f) =1
2dln(
S ′2
S1
), (2)
where f is the frequency, S1 = S1(f) is the frequency dependant amplitudes of the firstand S ′
2 = S ′2(f) is the frequency dependant amplitudes of the calibrated second echo
and d is the distance between the buffer rod and steel reflector. The calibration withwater compensates for losses due to transmission at the sample-steel interface, transduceralignment and possible diffraction effects.
Three fibre suspensions were made up using different diameters of Nylon 66 fibres(Swissflock, Emmenbrucke, Switzerland). The fibres are identified by their fineness valuesand their dimension are given in Table 3. The fibres were weighed and mixed with distilledwater to a concentration of 0.5% by weight.
The broadband transducer (V319, Panametrics, Waltham, MA, USA) used had acentre frequency of 15 MHz. The transducer was excited and the received signal amplifiedby a pulser/receiver (Model 5073PR, Panametrics). The signal was then digitized using

72 Paper C
Time
S1 S2
Ste
el
refl
ec
tor
Sa
mp
le
spa
ce
Bu
ffe
r-
ro
d
Tra
ns-
du
ce
r
d
1
2
3
Figure 1: Lattice diagram of the pulse-echo measurement system used this study.
Fibre Fineness Diameter ± 2xSTD Length(dTex) (10−6 m) (10−3 m)
1.7 17.32±0.54 1.217 51.07±0.64 1.522 55.17±0.91 1.5
an oscilloscope card (CompuScope 12400, Gage Applied Technologies Inc., Lachine, QC,Canada) with a 12-bit resolution and a sampling rate of 400 MHz. All data were storedin a computer for off-line analysis.
Calculating the attenuation from each individual time-domain waveform and thenaveraging causes a bias in the results [11]. To reduce this bias the following procedurewas used. The time-domain waveforms were aligned to reduce timing jitter using amethod proposed by [12], then the discrete Fourier transform was applied to each echo.The frequency dependent amplitude of the second echo in the frequency domain, S ′
2, wasthen calibrated with the echoes from a sample of distilled water by letting
S ′2 = S2
A2K
A1
, (3)
where S2 frequency dependent amplitude of the second echo in the frequency domain,A1 = A1(f) and A2 = A2(f) are the frequency dependent amplitudes of the first andsecond echoes in water, K is the effect of the theoretical attenuation by water, K =exp(25 · 10−15f 22d) [13].
The echoes could then be averaged and the standard deviation calculated, using thetechnique described in [11]. Note that the noise in the signal from the distilled water

73
Material Property Upper Value Lower ValueDensity (kgm−1) 900 2000Wave velocity (compression wave) (ms−1) 500 7000Poisson’s ratio 0.2 0.5Loss tangent 0 1
Table 3.1: Table of limits used in the parameter estimation procedure.
sample is assumed to be insignificant as the attenuation of the ultrasound in water islow, resulting in a high signal-to-noise ratio.
The cell was calibrated using water, emptied and carefully filled with the fibre suspen-sion. Each measurement set consisted of a sequence of 100 pulses and their echoes. Fivesets were taken and the sample was stirred after each reading. The cell was emptied andrinsed with temperature-controlled water, before the cell was filled with the next sampleand the process repeated. Once all three samples were measured, the whole procedurewas repeated twice more but with the samples measured in a different order.
A digital thermometer (Model F250, Automatic Systems Laboratories LTD, England)monitored the temperature in the sample under test. During the whole process thetemperature of the suspension varied from a minimum of 20.75±0.2 ◦C to a maximum of21.47±0.2 ◦C. The temperature of the water during calibration was taken and used tocalculate the wave velocity. The distance d of the measurement cell in Figure 1 was foundusing this wave velocity and a cross-correlation technique to determine the time-of-flightfor an ultrasonic pulse.
Method for Parameter Optimisation
A non-linear least squares fit was found using a subspace trust region method and isbased on the interior-reflective Newton method implemented by the lsqnonlin function inMatlab c© (MathWorks, Inc., Natick, Massachusetts, USA). Since this function searchesthe whole number space, boundaries were implemented so that values outside reasonablelimits were discarded. The limits are given in Table 3.1. Three initial values wereused and are listed in Table 3.2. To optimise this procedure, the modelled attenuationcalculation was simplified by assuming all the fibres were at a uniform angle of π/6 ratherthan integrating over the range 0 to π/2 for each iteration of the best-fit algorithm. Theangle π/6 was used as this gave a close fit to the attenuation calculated when the wholerange is used. Once the different initial starting points had either converged or timed out,the value to which they converged was used as the starting point for the slower, moreaccurate optimisation estimation where the attenuation is calculated from integratingover fibre angles from 0 to π/2.

74 Paper C
Material Property Set 1 Set 2 Set 3Density (kgm−1) 1131 1000 1000Wave velocity (compression wave) (ms−1) 1340 500 2500Poisson’s ratio 0.3 0.2 0.4Loss tangent 0.2 1 0.1
Table 3.2: Table of Initial values used in the parameter estimation procedure.
4 Results and Discussion
4.1 Predicted and Experimental Attenuation
Figure 2 shows the predicted attenuation from the model using the material data fromTable 6 in the Appendix and the diameters of the fibres used in the experiments. Thepeaks are believed to be caused by resonance in the fibres associated with the fibrediameter. The location in the frequency domain of these peaks is therefore a functionof the diameter of the fibre, as seen in this figure where the material properties are keptconstant and the fibre diameters change. The frequency range is chosen to match thebandwidth of the transducer. The results of the experimental attenuation calculations
0 5 10 150
20
40
60
80
100
120
Frequency (Mhz)
Atte
nuat
ion
(np/
m)
17μm fibres51μm fibres55μm fibres
Figure 2: Predicted Attenuation for 17μm, 51μm and 55μm Nylon 66 fibres using materialdata from Table 6.
for all three fibre diameters are shown in Figure (3). The standard deviations are small

75
in the chosen frequency region where the maximum standard deviation of the average is0.6 Npm−1, 2.9 Npm−1 and 2.4 Npm−1 for the 17 μm, 51 μm and 55 μm fibres, respectively.The maximum standard deviation occurs at the higher frequencies where the signal-to-noise ratio is small.
2 4 6 8 10 12 140
10
20
30
40
50
60
70
80
Frequency (MHz)
Att
en
ua
tio
n (
Np
/m)
17μm
51μm
55μm
Figure 3: Experimental Attenuation for 17μm, 51μm and 55μm Nylon 66 fibres.
The most notable aspect in comparing Figure 2 and Figure 3 is that either a dampingmechanism is missing from the model or that the data available for the loss tangent is notaccurate for these fibres. A plot of the tabulated data with the loss tangent set to 0.2 andthe diameter set to 55 μm is shown in Figure 4 and shows that the predicted attenuationis now closer to the experimental attenuation. Although the fibres are different lengths,1.2 mm compared to 1.5 mm, the appearance of a resonance peak for the 51 μm andthe 55 μm fibre within 1 MHz of the predicted peaks supports the theory that the peaksin the attenuation are resonance peaks associated with the diameter of the fibres. Thesmall difference in diameter between the 51 μm fibres and the 55 μm fibre does not resultin a difference in the frequency of the peaks as predicted by the theoretical results. Thisis most likely caused by differences in the material properties of the fibres tested.
The problem of a lack of homogeneity of the fibre suspension is reduced by taking alarge number of readings. On average the mass fraction of the measured suspension is

76 Paper C
equal to that of the whole sample. The volume fraction is calculated as,
fr =ρ1mf
ρ2(1 − mf )(4)
where mf is the mass fraction, ρ1 is the density of the water and ρ2 is the density ofthe fibre. In the parameter estimation procedure, the mass fraction is kept constant.The volume fraction is therefore re-calculated with every iteration of the fit functionfor different values of density. Differences between predicted and observed attenuation
0 5 10 150
20
40
60
80
100
120
Frequency (Mhz)
Att
en
ua
tio
n (
np
/m)
Habeger model
SCS model
SCS modified loss tangent
Figure 4: Predicted Attenuation from the complete numerical solution Habeger [9] and for thepresent model for 55μm Nylon 66 fibres using material data from Table 6.
could also be due to neglecting both the thermal considerations and the generation oftransverse waves in the water. Using the tabulated data, we can solve Habeger’s equationsnumerical [9] to predict the attenuation to assess the error due to neglecting thermal andshear waves in the fluid. This is presented in Figure 4 and validates these assumptions,in this frequency range and for this fibre diameter and with these material properties.
Errors in the experimentally obtained attenuation exist from not adjusting the atten-uation of water to the temperature of the suspension. The attenuation is assumed to be25 ·10−15f 2 Npm−1 throughout. Since the attenuation of water is used in the calibration,this may contribute to slight discrepancies at high frequencies.

77
4.2 Parameter Estimation
Figure 5 shows the theoretical attenuation using the estimated parameter values for eachfibre diameter. As can be seen a close fit has been achieved for all three fibres diameters.
2 4 6 8 10 12 140
20
40
60
2 4 6 8 10 12 140
20
40
60
0
20
40
60
Expt 55μmModel 55μm
Expt 51μmModel 51μm
Expt 17μmModel 17μm
Figure 5: Plot of the experimental results and the best-fit lines for all the Nylon 66 fibres ofdifferent diameters.
The initial values found from the parameter estimation procedure for the 17 μm fibresoverestimated the density by 50%. Since this is unrealistic, the results presented inFigure 6 for the 17 μm fibres are from the estimation procedure run with the density andloss tangent set to that of the 55 μm fibres so that comparisons of the estimated materialproperties can be made to known fibre properties.
However, this raises serious doubts on the possibility of using parameter estimationwhen data is only available in frequency range before the first resonance peak, such as isthe case for the 17 μm diameter fibre. In this frequency range, with a fibre diameter of17 μm, the number of combinations of values that that fit the monotonic curve seen inthis region are too numerous or that the model is insensitive in this region to changes inthe density and loss tangent. Evidence for the latter explanation comes from resonancescattering theory (RST) [8] where it is suggested that in between two eigenfrequenciesthe scatterer appears as an impenetrable object. Further work on the sensitivity of the

78 Paper C
model in this region is required to establish this.Estimations of the parameters were also calculated for the average attenuation ± 1
standard deviation. This gives us an indication of the sensitivity of the parameters tochanges in attenuation. The density and Poisson ratio vary by max 0.8% and max 0.4%,respectively, whereas, the loss tangent and velocity have max variation of 3.1% and 6.8%.This variation consequently affects the Young’s modulus and shear modulus, which havea max variation of 4.7% and 5.0% respectively.
A feature in the experimental curves that is not matched by either of the best-fitlines is the dip in the 17 μm fibre at 12 MHz (Figure 5). This could be caused by eitherexperimental factors that has not been considered or by one of the model assumptionsnot being justified. This dip in attenuation coincides with dips in the attenuation of the51 μm and 55 μm fibres, also at 12 MHz. The model assumes the cylinder is infinitelylong but since the 17 μm and the larger diameter fibres have different lengths, this leadsto conclude that the length is not causing the anomaly. It was however noted that thefirst echo in both water and the sample drops rapidly at this point so we concluded thatexperiments with different transducers are required to eliminate the possibility of thisdip being an experimental artefact.
In manufacturing as the nylon is drawn into fibres, its molecules are aligned and itsaxial stiffness increases compared to bulk material [14], [15]. Values of axial Young’smodulus are 5.7GPa [15]. However in [15] it is shown Young’s modulus is 3.5 GPa in thetransverse direction and found to be constant with draw ratio. Young’s modulus, E, forthe fibres is calculated from the density, ρ2, Poisson’s ratio, υ and the velocity of thecompressional wave, c2 as
E =(1 + υ)(1 − 2υ)
(1 − υ)ρ2c
22. (5)
The values for Young’s modulus calculated from the estimated material values, presentedin Figure 6, range from 2.05 GPa to 2.63 GPa. We would expect these values to be closerto the transverse values as it is assumed that as the angle of incidence of the sound waveto the fibre axis deviates away from the normal, more of the wave is reflected hence onlya small proportion of the ultrasound wave propagates at an angle close to the fibre axis.Even considering that we should compare the results to the transverse value instead ofthe axial value, all these values appear to be underestimated by approximately 35%-50%.
The shear modulus, μ is calculated from
μ =(0.5 − υ)
(1 − υ)ρ2c
22 (6)
Using the estimated values for these properties, the shear modulus ranges from 0.68 GPato 0.88 GPa (Figure 7). These findings are in good agreement with Wakelin et al [14]who gave values ranging from 0.62 GPa to 0.95 GPa. The agreement with [15] data is notas good, this may be because the difference in form of the nylon. In [15] film was testedand in [14] fibres were tested.

79
17 51 55 Tabulated Value
0.5
1
1.5
2
2.5
3
3.5x 10
9
Fibre (μ m)
You
ng´s
Mod
ulus
(G
Pa)
Figure 6: Chart of Young’s modulus calculated from estimated material properties and thetabulated value of Young’s modulus (Table 6).
17 51 55 Tabulated Value
1
2
3
4
5
6
7
8
9x 10
8
Fibre (μ m)
She
ar M
odul
us (
GP
a)
Figure 7: Chart of shear modulus calculated from estimated material properties and the tabulatedvalue of shear modulus (Table 6).
The wave velocity (Figure 8) for the 17 μm fibre is estimated as 2030 ms−1, whichis comparable to 2345ms−1 [9] and 2620 ms−1 [16]. However, the values for the largerdiameters appear to be overestimated. A possible explanation for this is that the modelis not as accurate at high frequencies and tends to underestimate the attenuation possiblybecause additional attenuation processes exists that have not been taken into account.To compensate, the estimation process selects a value of c2 much greater than the truevalue to reduce the error between the modelled and experimental attenuation values inthis frequency region.
One possible reason for the lower prediction of attenuation at higher frequencies isthe effect of neglecting multiple scattering. In the model the attenuation from a singleparticle is simply multiplied by the number of particles. These effects could potentiallybe approximated by adding the attenuation due to the loss tangent of the material, inproportion to the fibre fraction to the original calculation of attenuation in equation(2).

80 Paper C
17 51 55 Tabulated Value1000
2000
3000
4000
5000
6000
Fibre (μ m)
Spe
ed o
f Sou
nd (
m/s
)
Figure 8: Estimated and tabulated values of velocity of the compression wave (Table 6).
Another reason for the lower prediction of the attenuation may come from modelling thefibre as an isotropic material. Adjustments to the model could be made for these effects,or the estimation process could be modified so that more weight is put on the match inthe lower frequency region. These methods could potentially increase the accuracy of theestimation of the wave velocity.
17 51 55 Tabulated Value0.3
0.35
0.4
0.45
0.5
Fibre (μ m)
Poi
sson
´s r
atio
Figure 9: Estimated and tabulated values of Poisson’s ratio (Table 6).
The estimated values for Poisson’s ratio are 0.42 for the 17 μm fibres and 0.49 for thelarger fibres. The 0.42 value is in agreement with other sources as indicated in Figure9, however the 0.49 value is excessively high. The size of the shear wave speed, andhence the shear modulus, relative to the size of the compression wave speed, c2 is setby Poisson’s ratio. Hence, if the shear wave speed has been accurately estimated butthe value of c2 is overestimated, the result is an overestimation of Poisson’s ratio. Aconsequence of overestimated values of Poisson’s ratio is that Young’s modulus will be

81
underestimated as can be seen from equation 5.
The estimates for density are shown in Figure 10 and show that it is overestimatedin all three fibres. The density of bulk Nylon 66 is 1140 kgm−3 whereas the model over-estimates density by 10% to 15%. The drawing of nylon has been shown to increase thedensity by 0.1% only [17] hence this cannot account for the difference in density seen here.The problem, highlight earlier, of the inaccuracy of the model at high frequencies causingPoisson ratio to be overestimated, could also cause the density to be overestimated.
17 51 55 Tabulated Value1000
1050
1100
1150
1200
1250
1300
Fibre (μ m)
Den
sity
(kg
/m3 )
Figure 10: Estimated and tabulated values of density (Table 6).
The estimated loss tangent values are about 0.3, which is an order of magnitudelarger than the values measured by [15] as shown in Figure 11. If we assume that thepeaks in the attenuation are due to resonance, one possible explanation for this largediscrepancy in the loss tangent is that it is being calculated from a point where the fibresare resonating (since the loss tangent for the 17 μm fibres was set to that of the 55 μmfibres). Hence, the amount of energy lost due to internal friction is probably higher atthis point, where displacements are larger, than at other frequencies where the fibres arenot resonating.
5 Conclusion
The experimental results support the theory that the resonance peaks are a functionof the diameter of the fibre. Increasing the loss tangent of the material improves thefit considerably. This increase in value of the loss tangent may be more realistic underconditions of resonance.
The estimation process, in this study, is not reliable when only measurements fromthe frequency range before the first resonance peak is available, such as was the case forthe 17 μm diameter fibre. This may be because the number of combinations of valuesthat that fit the monotonic curve seen in this region is too great or that the model is
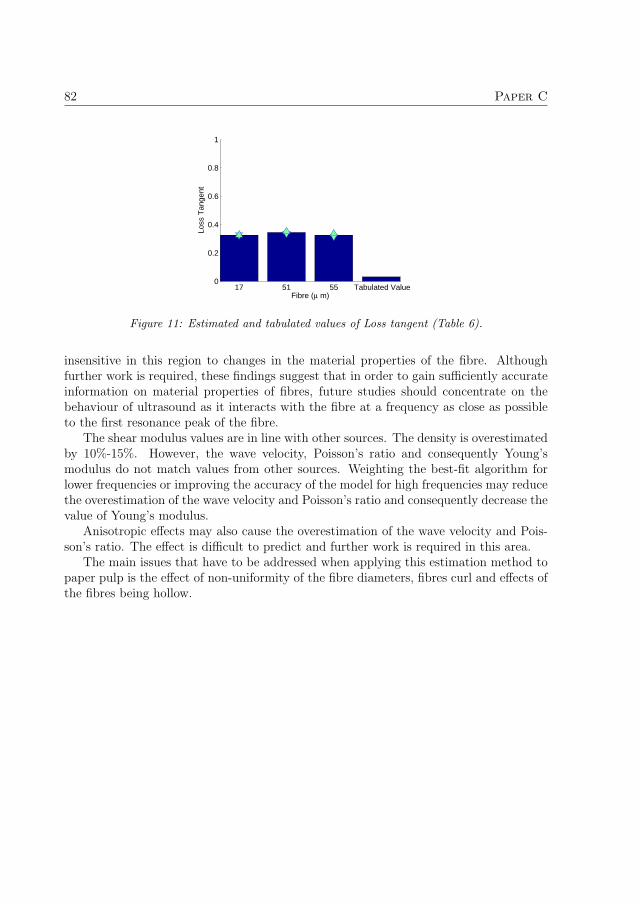
82 Paper C
17 51 55 Tabulated Value0
0.2
0.4
0.6
0.8
1
Fibre (μ m)
Loss
Tan
gent
Figure 11: Estimated and tabulated values of Loss tangent (Table 6).
insensitive in this region to changes in the material properties of the fibre. Althoughfurther work is required, these findings suggest that in order to gain sufficiently accurateinformation on material properties of fibres, future studies should concentrate on thebehaviour of ultrasound as it interacts with the fibre at a frequency as close as possibleto the first resonance peak of the fibre.
The shear modulus values are in line with other sources. The density is overestimatedby 10%-15%. However, the wave velocity, Poisson’s ratio and consequently Young’smodulus do not match values from other sources. Weighting the best-fit algorithm forlower frequencies or improving the accuracy of the model for high frequencies may reducethe overestimation of the wave velocity and Poisson’s ratio and consequently decrease thevalue of Young’s modulus.
Anisotropic effects may also cause the overestimation of the wave velocity and Pois-son’s ratio. The effect is difficult to predict and further work is required in this area.
The main issues that have to be addressed when applying this estimation method topaper pulp is the effect of non-uniformity of the fibre diameters, fibres curl and effects ofthe fibres being hollow.

83
6 Appendix
Material Property Value SourceTensile modulus (axial, DR 3) 5.7 GPa Leug et al [15]Tensile modulus (transverse) 3.1 GPa Leug et al [15]Shear Modulus (fibre) 0.62 GPa -0.95 GPa Wakelin et al [14]Shear Modulus (film) 1.05 GPa -1.1 GPa Leug et al [15]Wave velocity (compression wave)* 2345 ms−1 Habeger [9]Wave velocity (compression wave) 2620 ms−1 Mathieu and Schweitzer [16]Density* 1140 kgm−3 Rhodia Technical Fibers,
Valence, FrancePoisson’s ratio* (bulk) 0.41 Goodfellow, Devon, USALoss tangent* 0.03 Leug et al [15]Heat capacity 1420 Jkg◦K Habeger [9]Heat conductivity coefficient 0.36 Wm−1K−1 Habeger [9]Thermal expansivity 6.0e-5 K−1 Habeger [9]
Table 3.3: Table of values for Nylon 66 and their source. The asterisk indicates values thathave been used in the model.
7 Acknowlegments
I wish to thank to Swissflock for providing the fibres and Rhodia for the nylon fibreproperties. My thanks go also to Jan Niemi and Jesper Martinsson for their support andtheir programming code.

84

References
[1] J. Levlin and L. Soderhjelm, Pulp and Paper Testing. Fapet Oy, 1999.
[2] D. Adams, Ultrasonic transmission through paper fiber suspensions. PhD thesis,University of London, 1975.
[3] P. Epstein and R. Carhart, “The absorption of sound in syspensions and emulsions. i.water fog in air,” The Journal of the Acoustical Society of America, vol. 25, pp. 553–565, May 1953.
[4] J. Allegra and S. Hawley, “Attenation of sound in suspension and emulsions: The-ory and experiments,” The Journal of the Acoustical Society of America, vol. 51,pp. 1545–1564, 2 1972.
[5] A. Harker and J. Temple, “Velocity and attenuation of ultrsound in suspensions ofparticles in fluids,” Journal of Physics D: Applied Physics, vol. 21, pp. 1576–1588,1988.
[6] R. Challis, M. Povey, M. Mather, and A. Holmes, “Ultrasound techniques for charac-terizing colliodal dispersions,” Reports in Progress in Physics, vol. 68, pp. 1541–1637,2005.
[7] L. Flax and N. W., “Acoustic reflection from layered elastic absorptive cylinders,”Journal of the Acoustical Society of America, vol. 61, pp. 307–312, Feb 1977.
[8] L. Flax, L. Dragonette, and H. Uberall, “Theory of elastic resonance excitation bysound scattering,” Journal of the Acoustical Society of America, vol. 63, pp. 723–730,Mar 1978.
[9] C. Habeger, “The attenuation of ultrsound in dilute polymeric fiber suspensions,”Journal of Acoustical Society of America, vol. 72, pp. 870–878, sep 1982.
[10] Y. Aitomaki and T. Lofqvist, “Measuring suspended fibre material properties bymodelling ultrasound attenuation,” in Mathematical Modelling of Wave Phenomena,2005. To be published.
[11] J. Martinsson, Statistical tools for ultrasonic analysis of dispersive fluids. Licentiatethesis, Lulea University of Technology, 2005.
85

86
[12] A. Grennberg and M. Sandell, “Estimation of subsample time delay differences innarrowband ultrasonic echoes using the hilbert transform correlation,” IEEE Trans-actions on Ultrasonics, Ferroelectrics, and Frequency Control, vol. 41, no. 5, pp. 588–595, 1994.
[13] L. Kinsler, A. Frey, A. Coppens, and J. Sanders, Fundamentals of Acoustics. JohnWiley and Sons Inc., 4 ed. ed., 2000.
[14] J. Wakelin, E. Voong, D. Montgomery, and J. Dusenbury, “Vibroscope measure-ments of the elastic moduli of nylon 66 and dacron filaments of various draw ratios,”Journal of Applied Physics, vol. 26, pp. 786–792, july 1955.
[15] L. W., K. Ho, and C. Choy, “Mechanical relaxations and moduli of oriented nylon66 and nyon 6,” Journal of Polymer Science, vol. 22, pp. 1173–1191, 1984.
[16] J. Mathieu and P. Schweitzer, “Measurement of liquid density by ultrasoundbackscattering analysis,” Meausurement Science and Technology, vol. 15, pp. 869–876, 2004.
[17] C. Black and M. Dole, “Density of undrawn, drawn and annealed nylon filaments,”Journal of Polymer Science, vol. 3, no. 3, pp. 353–364, 1948.

Paper D
Sounding Out Paper Pulp:Ultrasound Spectroscopy of Dilute
Viscoelastic Fibre Suspensions
Authors:Yvonne Aitomaki and Torbjorn Lofqvist
Reformatted version of paper originally published in:Submitted to: Acoustics and ultrasonics in the processing of industrial soft solids
c©
87

88 Paper D

Sounding out Paper Pulp: Ultrasound Spectroscopy
of Dilute Viscoelastic Fibre Suspensions
Yvonne Aitomaki and Torbjorn Lofqvist
Abstract
A model of attenuation of ultrasound in fibre suspensions is compared to a modelof backscattering pressure from submersed cylinders subjected to a sound wave. Thisanalysis is carried out in the region where the wavelength is of the same order as that ofthe diameter of the fibre. In addition we assume the cylinder scatterer to have no intrinsicattenuation and the longitudinal axis of the scatterer is assumed to be perpendicular tothe direction of propagation of the incident wave. Peaks in the frequency response of boththe backscattering pressure, expressed in the form of a form function, and the attenuationare shown to correspond. Similarities between the models are discussed. Since the peaksin the form function are due to resonance of the cylinder, we infer that the peaks inthe attenuation are also due to resonance. The exact nature of the waves causing theresonance are still unclear however the first resonance peaks are related to the shearwave and hence the shear modulus of the material. The aim is to use the attenuationmodel for solving the inverse problem of calculating paper pulp material properties fromattenuation measurements. The implications of these findings for paper pulp propertyestimation is that the supporting fluid could, if possible, be matched to density of that ofpulp fibres and that the estimation of material properties should be improved by selectinga frequency range that in the region of the first resonance peaks.
1 Introduction
This study is part of a project aimed at the on-line characterisation of pulp fibres sus-pended in water, as used in the paper manufacturing industry. An analytical model wasdeveloped to relate ultrasound attenuation to the material properties of the fibre and thesupporting fluid. This model was presented in [1]. This has then been used this to solvethe inverse problem of estimating material properties from measurements of ultrasonicattenuation in dilute suspensions of viscoelastic fibres [2].
Experiments from these studies showed local peaks in the frequency response of theattenuation [1][2]. The focus of the study is on the cause of these peaks. A large body ofwork exists on attenuation due to suspended spherical particles, as reviewed in [3]. How-ever, for cylindrical scatterers, much of the work has been based on backscattering andin the regime where the ratio of the wavelength to the diameter of the scatterer is small[4][5][6][7][8][9]. One of the theories arising from these works is the Resonance ScatteringTheory (RST) [5]. This study compares the backscattering from theory developed for a

90 Paper D
submersed cylinder [10] to a model of ultrasonic attenuation in a suspension of fibres ina fluid [1]. The theory developed by [10] is essentially the same as the nuclear scatteringtheory introduced in the derivation of the RST theory [5]. In this study we will use therewritten version of [10] found in [11] since this matches the propagation direction of thewave used in the attenuation model.
Once a comparison of the resonance peaks is made, the explanation for the peaks inthe backscattering is investigated to see if it is valid for the peaks found in the attenuation.
2 Theory
The attenuation is calculated from the simple cylinder scattering, (SCS), model [1]. Thederivation of this model follows Habeger [12] cylindrical extension of the Epstein andCarhart [13]/Allegra Hawley [14] model. The resulting expression for the attenuation, α,of a suspension of fibres in a fluid of low viscosity, such as water is
α =−2fr
πR2k�
(∫ π2
0
(ε2nBn) cos(ψ)dψ
), (1)
where fr is the volume fraction; R is the radius of the fibre; k is the wave number ofthe wave in water; ψ is the angle of the fibre to the direction of the oncoming planeultrasound wave; εn = 1, if n = 0, otherwise εn = 2, and n is a positive integer. Bn arethe nth expansion coefficients of the wave potential of the reflected wave. The coefficients,Bn, are a function of the fluid properties: viscosity, density and speed of the compressionwave and the fibre properties: shear modulus, density, loss tangent and speed of boththe compression and the shear wave. The speed of the shear wave is a function of theshear modulus and the density and is related to the compression wave speed by Poisson’sratio.
For the purpose of the comparison between the attenuation and backscattering weassume that the axial plane of the fibres is perpendicular to the direction of propagationof the wave. Since we are focusing on the frequency at which the peaks occur we alsoassume that there is no intrinsic attenuation in the cylinder. This is done by setting theloss tangent to zero.
The expression for backscattering pressure from a cylinder at a large distance fromthe cylinder is
Ps ≈√
2a
2reikrf∞(π) (2)
where Ps is the scattering pressure; a is the size of the scatterer and in this case equalsR; r is the distance to the scatterer centre, k is the wave number of the wave in the fluidand f∞(π) is the form function [10], [5].
The form function can be expressed using a phase shift expression, where the phaseshift is that between the incident and reflected wave such that:
f∞(π) =2√πka
∞∑n=0
(−1)nεn sin(ηn)e−i(ηn+ 3π4
) (3)

91
where ηn is the phase shift [11] and is defined as,
ηn = arctan
[tan δn(ka)
tan αn(ka) + tan φn(kLa, kT a)
tan βn(ka) + tan φn(kLa, kT a)
](4)
The following functions were used in the above equation:
tan αn(x) = −xJ ′
n(x)Jn(x)
, (5)
tan βn(x) = −xN ′
n(x)Nn(x)
, (6)
tan δn(x) = −xJn(x)Nn(x)
, (7)
tan φn(kLa, kT a) =ρ1(kT a)2
2ρ2
×
tan αn(kLa)
tan αn(kLa) + 1− n2
n2 − (kT a)2
2+ tan αn(kT a)
n2 − (kT a)2
2 + tan αn(kLa)
tan αn(kLa) + 1− n2 · (tan αn(kT a) + 1)
n2 − (kT a)2
2+ tan αn(kT a)
.
(8)
Here, ρ1 is the density of the water; ρ2 is the density of the solid, kT is the wave numberof the shear wave in the solid; kL is the wave number of the compression wave in the solidand n is a positive integer. Jn and Nn are Bessel function of the 1st kind and 2nd kindrespectively, to the order n and J ′
n and N ′n are the derivatives of the Bessel functions of
the 1st kind and 2nd kind respectively, to the order n.The frequency range is expressed in terms of normalised frequency Fn = ka, and we
consider the range Fn from 0.2 to 5. The series expansion is truncated after eleven terms.
3 Results
The parameters in the models are set based on the material properties of Nylon 66 andwater. However, as previously stated we are focusing on the frequency at which the peaksoccur, so the loss tangent of the cylinder material is set to zero. To ease the comparisonbetween the peaks in both backscattering and the attenuation, the amplitude of theattenuation is scaled and offset by 2 units. The results are presented in Figure 1.
Under these conditions there is a good match between the backscattering form func-tion, f∞(π) and the attenuation, α. The match between these two functions has two

92 Paper D
0 1 2 3 4 50
0.05
0.1
0.15
0.2
0.25
0.3
0.35
Frequency (Mhz)
Fun
ctio
n A
mpl
itude α
f∞(π)
Figure 1: Plot of the acoustic attenuation, α, and the form function, f∞(π), against normalisedfrequency for nylon fibres suspended in water. To ease the comparison between the peaks in bothfunctions, the amplitude of the attenuation is scaled and offset by 2 units.
consequences. Firstly, the solution for the expansion coefficients used by Faran [10] canbe used in the calculation of attenuation -equation (2) -instead of the solution for theexpansion coefficient used in the attenuation. This results in a simpler solution as thatused by Faran [10] uses slip boundary conditions. We can then compare the amplitudes ofthe attenuation calculated using the two different solutions for the expansion coefficientsand hence the effects of the different boundary conditions. Work on this continues.
The second consequence of the match between the form function and the attenuationis that the resonance peaks in the form function have been well discussed, in both [10]and [6]. Faran [10] states that the normal modes of the cylinder are found when thenormal component of the stress and the tangential component of the shear stress at thesolid boundary are zero gives a condition which is identical to setting the denominatorof Equation (8) to zero. Using this condition the normal modes can be calculated fromEquation (8). Faran [10] also discusses that a shift in the resonance frequency of animmersed cylinder due to the reactive component of the acoustic impedance acting onthe scatterer by the surrounding fluid. Although in his study this shift was small asthe metal cylinders that were used had much greater densities than the surroundingfluid, in our case, where the density of nylon is close to that of water, the effect will beconsiderable. When calculating the normal mode for nylon, the first mode occurs at anormalised frequency of 1.4 (R = 44 μm, 7.8 MHz), however, the effect of the surroundingfluid moves this peak to a normalised frequency of 1.0 (R = 44 μm, 5.3 MHz). The

93
frequency can be found by setting the denominator in equation 4 to zero. Also discussedis the fact that the since the speed of the shear waves is much lower than the speed ofthe compression wave. The first modes to appear are from the shear wave. Since then = 0 does not support shear waves, the frequency of this mode depends on the speedof the wave and hence occurs at a normalised frequency of 3.57 (R = 44 μm, 19.3 MHz).These calculations are for a cylinder with no loss.
Resonances in backscattering are explained as being caused by creeping waves in thefluid and in the solid [6]. However, the assumption used in these explanations is thatthe normalised frequency is much greater than 1, which is not the case here. Hence theactual wave propagation modes in this region of normalised frequency are still not clear.
4 Conclusion
From the results so far it appears that the coefficient derived by Faran [10] for backscat-tering can be used to derive attenuation. From this model, the resonance modes of acylinder and a cylinder in water can be obtained. They confirm that the peaks in theattenuation curves are due to resonance. It appears as if the shear waves are causingfirst peaks in the ultrasound attenuation although the exact nature of these waves hasnot been established. These calculations have been done under the conditions of no loss.
The implication of these findings for the use of estimating material properties of paperpulp from ultrasound attenuation are that, if possible, the density of the surrounding fluidshould be as close as possible to that of the suspended fibre. This increases the phaseshift in the suspension and increases the dependency of the attenuation on the materialproperties of the fibre. The frequency range should also be set, if possible, so thatresonance peaks exists within the range. Since the frequencies of the peaks depend onthe material properties of the fibre, identifying these frequencies should aid in estimatingmaterial properties.

94

References
[1] Y. Aitomaki and T. Lofqvist, “Measuring suspended fibre material properties bymodelling ultrasound attenuation,” in Mathematical Modelling of Wave Phenomena,2005. To be published.
[2] Y. Aitomaki, Towards a measurement of paper pulp quality: ultrasonic spectroscopyof fibre suspensions. Licentiate thesis, Lulea University of Technology, 2005.
[3] R. Challis, M. Povey, M. Mather, and A. Holmes, “Ultrasound techniques for charac-terizing colliodal dispersions,” Reports in Progress in Physics, vol. 68, pp. 1541–1637,2005.
[4] H. Uberall, G. Gaunaurd, and J. Diarmuid Murphy, “Acoustic surface wave pulsesand the ringing of resonances,” Journal of the Acoustical Society of America, vol. 72,pp. 1014–1017, Sept 1982.
[5] J. Diarmuid Murphy, J. George, A. Nagl, and H. Uberall, “Isolation of the resonantcomponent in acoustic scattering from fluid-loaded elastic spherical shells,” Journalof the Acoustical Society of America, vol. 65, pp. 368–373, Feb 1979.
[6] L. Flax, L. Dragonette, and H. Uberall, “Theory of elastic resonance excitation bysound scattering,” Journal of the Acoustical Society of America, vol. 63, pp. 723–730,Mar 1978.
[7] H. Uberall, L. Dragonette, and L. Flax, “Relation between the creeping waves andthe normal modes of vibration of a curved body,” Journal of the Acoustical Societyof America, vol. 61, pp. 711–715, Mar 1977.
[8] J. Dickey, G. Frisk, and H. Uberall, “Whispering gallery wave modes on elasticcylinders,” Journal of the Acoustical Society of America, vol. 59, pp. 1339–1346,June 1976.
[9] G. Frisk, J. Dickey, and H. Uberall, “Surface wave modes on elastic cylinders,”Journal of the Acoustical Society of America, vol. 58, pp. 996–1008, Nov 1975.
[10] J. Faran, “Sound scattering by solid cylinders and spheres,” Journal of the AcousticalSociety of America, vol. 23, pp. 405–418, July 1951.
95

96
[11] J. Mathieu and P. Schweitzer, “Measurement of liquid density by ultrasoundbackscattering analysis,” Meausurement Science and Technology, vol. 15, pp. 869–876, 2004.
[12] C. Habeger, “The attenuation of ultrsound in dilute polymeric fiber suspensions,”Journal of Acoustical Society of America, vol. 72, pp. 870–878, sep 1982.
[13] P. Epstein and R. Carhart, “The absorption of sound in syspensions and emulsions. i.water fog in air,” The Journal of the Acoustical Society of America, vol. 25, pp. 553–565, May 1953.
[14] J. Allegra and S. Hawley, “Attenation of sound in suspension and emulsions: The-ory and experiments,” The Journal of the Acoustical Society of America, vol. 51,pp. 1545–1564, 2 1972.