Performance Center Quick Start Guide
35
Software Version: 12.60-12.63 Performance Center Quick Start Go to HELP CENTER ONLINE http://admhelp.microfocus.com/pc/ Document Release Date: May 20, 2019 | Software Release Date: May 2019
-
Upload
khangminh22 -
Category
Documents
-
view
0 -
download
0
Transcript of Performance Center Quick Start Guide
Software Version: 12.60-12.63
Performance Center
Quick Start
Go to HELP CENTER ONLINEhttp://admhelp.microfocus.com/pc/
Document Release Date: May 20, 2019 | Software Release Date: May 2019
Legal Notices
DisclaimerCertain versions of software and/or documents (“Material”) accessible here may contain branding from Hewlett-Packard Company
(now HP Inc.) and Hewlett Packard Enterprise Company. As of September 1, 2017, the Material is now offered by Micro Focus, a
separately owned and operated company. Any reference to the HP and Hewlett Packard Enterprise/HPE marks is historical in nature,
and the HP and Hewlett Packard Enterprise/HPE marks are the property of their respective owners.
WarrantyThe only warranties for products and services of Micro Focus and its affiliates and licensors (“Micro Focus”) are set forth in the
express warranty statements accompanying such products and services. Nothing herein should be construed as constituting an
additional warranty. Micro Focus shall not be liable for technical or editorial errors or omissions contained herein. The information
contained herein is subject to change without notice.
Restricted Rights LegendContains Confidential Information. Except as specifically indicated otherwise, a valid license is required for possession, use or
copying. Consistent with FAR 12.211 and 12.212, Commercial Computer Software, Computer Software Documentation, and
Technical Data for Commercial Items are licensed to the U.S. Government under vendor's standard commercial license.
Copyright Notice© Copyright 2001 - 2019 Micro Focus or one of its affiliates.
Quick StartPerformance Center
Performance Center (12.60-12.63) Page 2 of 35
Contents
Performance Center 1
Welcome to This Guide 5How This Guide is Organized 5
Chapter 1: Introducing Performance Center 6Performance Center Testing Process 6
What is the testing process? 6
Performance Testing Applications 7
Chapter 2: Creating Vuser Scripts 8Recording Vuser Scripts 8
How do I start recording user activity? 8
How do I record a script? 9
How do I view my script? 10
How do I save the script? 12
Chapter 3: Creating and Designing Performance Tests 13Logging in to Performance Center 13
Adding Vuser Scripts to Performance Center 14
How do I upload the Vuser Script? 14
Monitoring Performance Tests 14
What is a monitor profile? 14
How do I create a monitor profile? 15
Creating Performance Tests 15
How do I create a performance test 15
Designing Performance Tests 16
How do I open the Performance Test Designer? 16
How do I design the performance test? 16
How do I add the monitor profile to the test? 18
Chapter 4: Running Performance Tests 19Creating Test Sets 19
What is a test set? 19
How do I create a test set? 19
Reserving Timeslots 20
How do I reserve a timeslot? 20
Running Performance Tests 21
How do I run the performance test? 21
Quick StartPerformance Center
Performance Center (12.60-12.63) Page 3 of 35
What does the Performance Test Run page display? 22
Chapter 5: Post-Run Analysis and Trending 24Analyzing Performance Test Run Results 24
How do I view Analysis information? 24
Did I reach my goals? 26
How can I view the graphs? 26
How can I compare data from different graphs? 28
How can I sort graph data? 29
How can I publish my findings? 30
Viewing Performance Improvements and Regressions 30
What steps are involved in working with trend reports? 30
Creating the Trend Report 30
Viewing Trend Report Data 32
Send Us Feedback 34
Quick StartPerformance Center
Performance Center (12.60-12.63) Page 4 of 35
Performance Center (12.60-12.63) Page 5
Welcome to This GuideWelcome to the Performance Center Quick Start. Performance Center is Micro Focus's Web-enabled global performance testing tool, designed to streamline the testing process and increasethe test efficiency for multiple concurrent performance tests across multiple geographic locations.
This Quick Start is a self-paced guide designed to lead you through the process of creating,running, and analyzing a performance test, and to introduce you to the Performance Centertesting environment.
Note: This guide assumes that your Performance Center environment has been fullyinstalled and configured, and that a domain and project have been set up. For details,contact your Performance Center administrator.
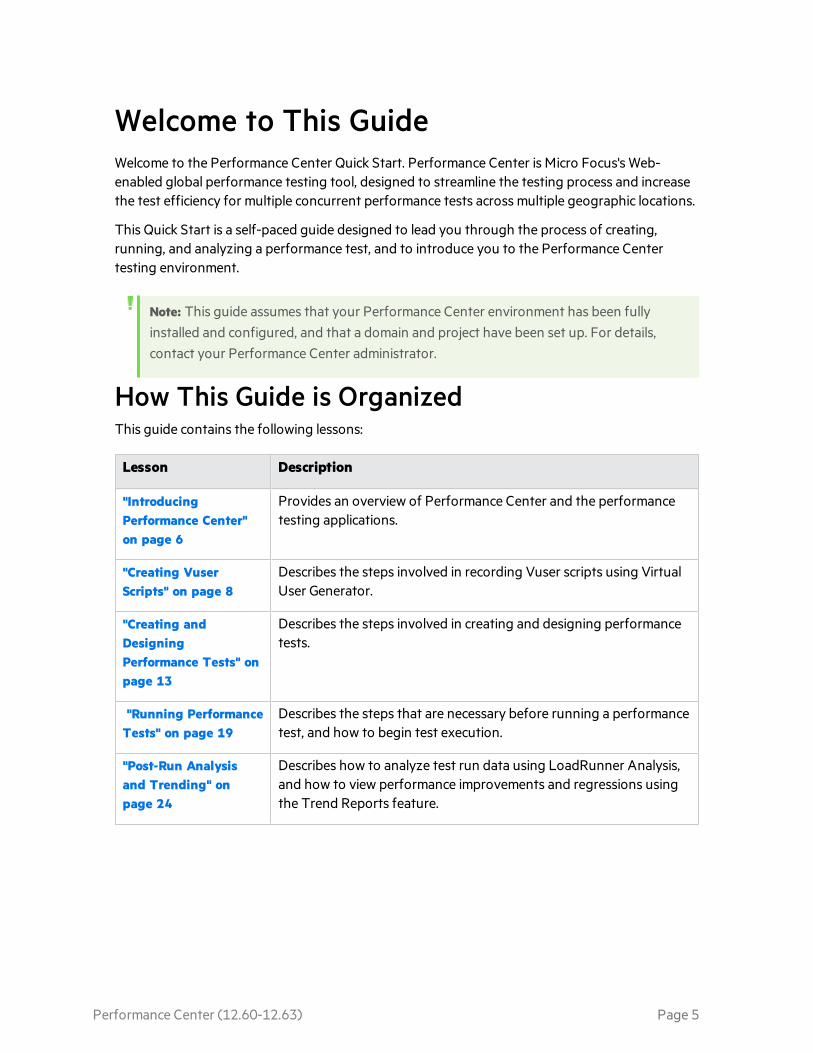
How This Guide is OrganizedThis guide contains the following lessons:
Lesson Description
"IntroducingPerformance Center"on page 6
Provides an overview of Performance Center and the performancetesting applications.
"Creating VuserScripts" on page 8
Describes the steps involved in recording Vuser scripts using VirtualUser Generator.
"Creating andDesigningPerformance Tests" onpage 13
Describes the steps involved in creating and designing performancetests.
"Running PerformanceTests" on page 19
Describes the steps that are necessary before running a performancetest, and how to begin test execution.
"Post-Run Analysisand Trending" onpage 24
Describes how to analyze test run data using LoadRunner Analysis,and how to view performance improvements and regressions usingthe Trend Reports feature.
Chapter 1: Introducing Performance CenterThis lesson provides a brief overview of Performance Center, and of the applications that are involved inthe testing process.
Notes:
l The Quick Start describes how to run a performance test with a single host functioning asboth a Controller and a load generator (C+LG). However, due to possible heavy load on theController and load generator hosts during a performance test, it is best practice to assignthese functions to separate host machines.
l Ensure that the latest standalone versions of Virtual User Generator (VuGen)and LoadRunner Analysis are installed on your system.
l You can find additional help on developing a Vuser script in VuGen, with a step-by-stepexample, in the LoadRunner Tutorial.
In this lesson you will learn about:
l " Performance Center Testing Process" below
l "Performance Testing Applications" on the next page
Performance Center Testing ProcessUsing Performance Center, you create performance tests in which you define the events that occurduring a testing session. During a test, Performance Center replaces human users at physical machineswith virtual users, or Vusers. These Vusers create load on your systemby emulating actions of typicalusers in a repeatable and predictable manner.
What is the testing process?The testing process consists of the following basic processes:
l Creating the script. Capturing typical end-user business processes performed on your application.
l Designing the performance test. Setting up the test environment by defining events that occurduring the testing session.
l Preparing to run the performance test. Adding the performance test to a test set and reserving atimeslot for the test.
l Running the performance test. Driving, managing, and monitoring the test.
l Analyzing the results and viewing performance trends. Analyzing the performance data generatedduring the test run, and viewing trending information which identifies performance improvementsand regressions over time.
These processes are explained in more detail in the lessons that follow.
Performance Center (12.60-12.63) Page 6 of 35
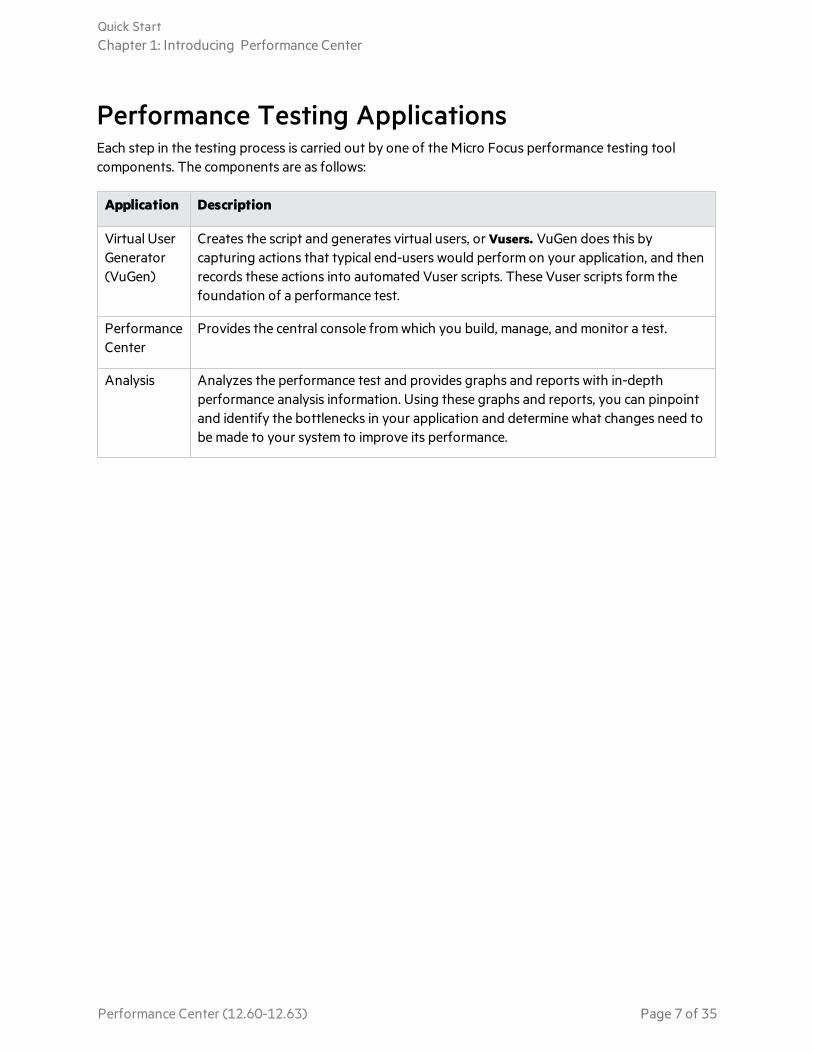
Performance Testing ApplicationsEach step in the testing process is carried out by one of the Micro Focus performance testing toolcomponents. The components are as follows:
Application Description
Virtual UserGenerator(VuGen)
Creates the script and generates virtual users, or Vusers. VuGen does this bycapturing actions that typical end-users would perform on your application, and thenrecords these actions into automated Vuser scripts. These Vuser scripts form thefoundation of a performance test.
PerformanceCenter
Provides the central console fromwhich you build, manage, and monitor a test.
Analysis Analyzes the performance test and provides graphs and reports with in-depthperformance analysis information. Using these graphs and reports, you can pinpointand identify the bottlenecks in your application and determine what changes need tobemade to your system to improve its performance.
Quick StartChapter 1: Introducing Performance Center
Performance Center (12.60-12.63) Page 7 of 35
Chapter 2: Creating Vuser ScriptsThis lesson explains the steps involved in recording Vuser scripts using Virtual User Generator.
In this lesson you will learn about:
l "Recording Vuser Scripts" below
Recording Vuser ScriptsYou record Vuser scripts using Virtual User Generator (VuGen). A Vuser script is a record of a typicalend-user business process. VuGen works on a record-and-playback principle. As you walk through abusiness process on your application, VuGen records your actions into an automated script which laterforms the foundation of the performance test.
Tip: You can find additional help on developing a Vuser script in VuGen, with a step-by-stepexample, in the LoadRunner Tutorial.
This section includes:
l "How do I start recording user activity?" below
l "How do I record a script?" on the next page
l "How do I view my script?" on page 10
l "How do I save the script?" on page 12
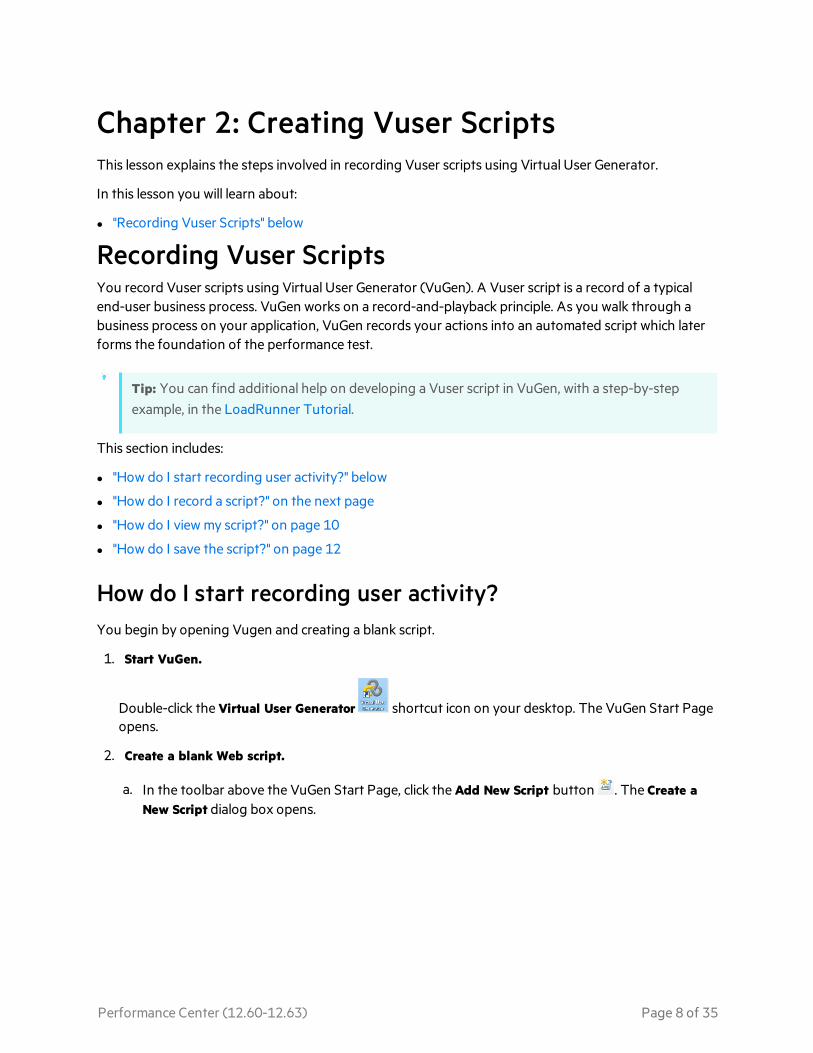
How do I start recording user activity?You begin by opening Vugen and creating a blank script.
1. Start VuGen.
Double-click the Virtual User Generator shortcut icon on your desktop. The VuGen Start Pageopens.
2. Create a blank Web script.
a. In the toolbar above the VuGen Start Page, click the Add New Script button . The Create aNew Script dialog box opens.
Performance Center (12.60-12.63) Page 8 of 35

A protocol is the language that your client uses to communicate with the back end of the system.
b. Make sure the Category type is Single Protocol. VuGen displays a list of the protocols that areavailable for a single-protocol script.
c. From the list of available protocols, select a protocol (example: for a Web-based application,select Web - HTTP/HTML) and click Create. VuGen creates a blank Vuser script and displays thescript in the VuGen Editor.
How do I record a script?The next stage in creating user emulation is recording the events performed by a real user. In theprevious section, you created an empty script. In this section, you will record a script.
Note: The following exercise explains how to record a scripts for a Web-based application (Web -HTTP/HTML).
1. Start recording.
a. Click the Record button on the VuGen toolbar. The Start Recording dialog box opens.
b. In the Record into action box, select Action.
c. In Record, select Web Browser.
d. In the URL address box, type the URL address on theWeb application under test.
e. Keep all other default settings.
f. Click Start Recording. A new web browser opens and displays theWeb application under test.
Quick StartChapter 2: Creating Vuser Scripts
Performance Center (12.60-12.63) Page 9 of 35
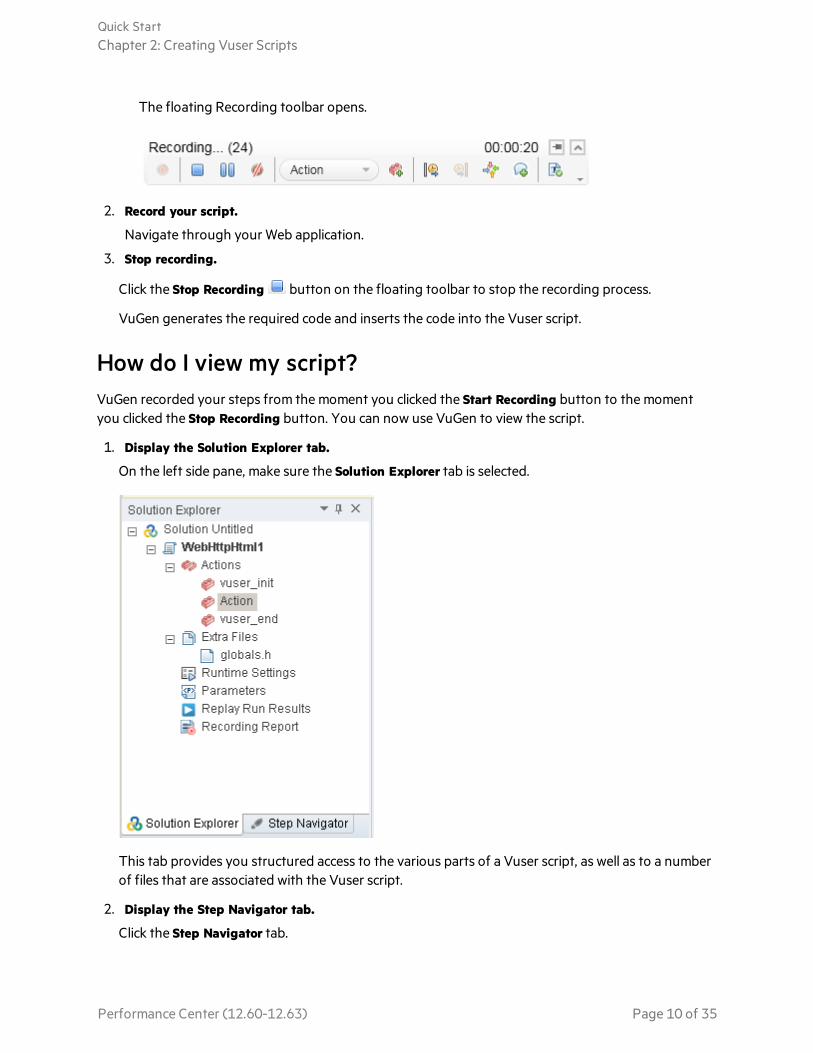
The floating Recording toolbar opens.
2. Record your script.
Navigate through your Web application.
3. Stop recording.
Click the Stop Recording button on the floating toolbar to stop the recording process.
VuGen generates the required code and inserts the code into the Vuser script.
How do I view my script?VuGen recorded your steps from themoment you clicked the Start Recording button to the momentyou clicked the Stop Recording button. You can now use VuGen to view the script.
1. Display the Solution Explorer tab.
On the left side pane, make sure the Solution Explorer tab is selected.
This tab provides you structured access to the various parts of a Vuser script, as well as to a numberof files that are associated with the Vuser script.
2. Display the Step Navigator tab.
Click the Step Navigator tab.
Quick StartChapter 2: Creating Vuser Scripts
Performance Center (12.60-12.63) Page 10 of 35

The Step Navigator displays an icon-based view of the script that lists the actions of the Vuser assteps. For each action you performed during recording, VuGen generated a corresponding step inthe Step Navigator.
The Step Navigator displays a snapshot icon to indicate that a specific step contains a snapshot.
3. View a step in the VuGen Editor.
Make sure Tools > Options > Editor> General > Show Class\Function Browser is selected in theVuGen Editor.
Double-click any step in the Step Navigator to display the corresponding function in the VuGenEditor. The Editor displays a text-based view of the script.
Quick StartChapter 2: Creating Vuser Scripts
Performance Center (12.60-12.63) Page 11 of 35
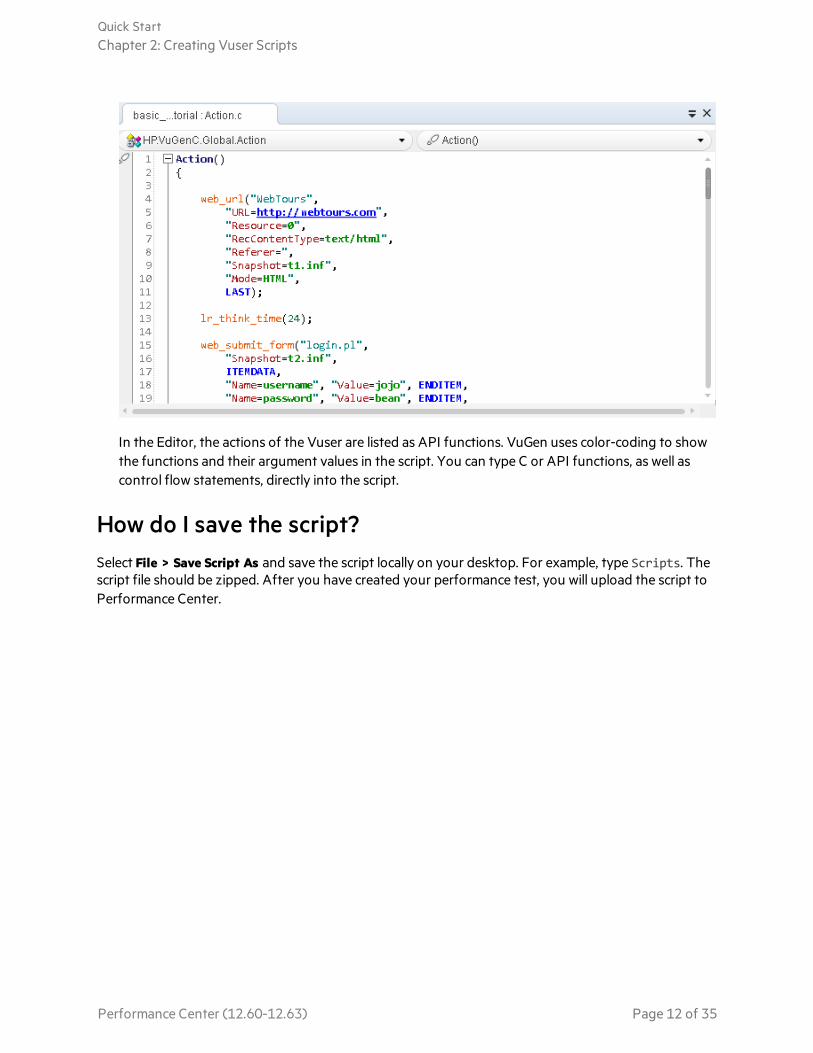
In the Editor, the actions of the Vuser are listed as API functions. VuGen uses color-coding to showthe functions and their argument values in the script. You can type C or API functions, as well ascontrol flow statements, directly into the script.
How do I save the script?Select File > Save Script As and save the script locally on your desktop. For example, type Scripts. Thescript file should be zipped. After you have created your performance test, you will upload the script toPerformance Center.
Quick StartChapter 2: Creating Vuser Scripts
Performance Center (12.60-12.63) Page 12 of 35
Chapter 3: Creating and DesigningPerformance TestsThis lesson explains how to manage test assets in Performance Center, and the steps involved increating and designing a performance test.
In this lesson you will learn about:
l "Logging in to Performance Center" below
l "Adding Vuser Scripts to Performance Center" on the next page
l "Monitoring Performance Tests" on the next page
l "Creating Performance Tests" on page 15
l "Designing Performance Tests" on page 16
Logging in to Performance CenterYou log into Performance Center as follows:
1. Open your web browser and type the Performance Center Server URLhttp://<PCS server name>/loadtest.
Note: If more than one Performance Center server is installed in your system together witha load balancer, you should access My Performance Center by entering the load balancer'sURL. Alternatively, you can also enter the server's defined internal URL.
2. TheMy Performance Center Login window opens.
If Performance Center was configured for external authentication, the Login and Password fieldsdo not appear in this window. For more details on external authentication, see the ALM ExternalAuthentication Configuration Guide.
3. In the Login box, type your user name.
4. In the Password box, type the password assigned to you by your site administrator.
5. Select the Automatically log in to my last domain and project on this machine check box if youwant Performance Center to automatically log in to the last project in which you were working.
6. Click the Authenticate button. Performance Center verifies your user name and password anddetermines which domains and projects you can access. If you specified automatic login,Performance Center opens.
7. In the Domain list, select a domain. By default, the last domain in which you were working isdisplayed.
8. In the Project list, select a project. By default, the last project in which you were working isdisplayed.
9. Click Login. Performance Center opens.
Performance Center (12.60-12.63) Page 13 of 35
Adding Vuser Scripts to Performance CenterThe first step in your test design process is to add your Vuser script to Performance Center. Adding thescript involves two steps: Creating a scripts folder, and uploading the script to the folder.
How do I upload the Vuser Script?You upload the script fromwithin Performance Center, as follows:
1. Make sure the script is saved locally and is zipped.
2. From the Performance Center navigation toolbar, click and select Test Management (underTesting).
3. Create a script folder.
a. Select Subject.
b. Click the New Folder button, and specify a name for the folder, for example, Scripts.
c. Click OK to add the folder.
4. On the module toolbar, click the Upload Script button. The Upload Scripts dialog box opens.
5. In the Select Folder box, select the scripts folder you created above.
6. Click the Select button and navigate to the location of the zipped script file.
7. Click Upload to upload the script.
Monitoring Performance TestsYou monitor performance test execution using the Performance Center online monitors.
For example, you use the SystemResource monitors to monitor a machine's system resource usageduring a performance test and identify server performance bottlenecks.
A primary factor in a transaction's response time is its system resource usage. Using the PerformanceCenter resource monitors, you can monitor theWindows Resource usage on amachine during a testrun, and determine why a bottleneck occurred on a particular machine.
What is a monitor profile?To monitor server resources during the test, you select the type of monitors to run and the serverswhose resources you want to monitor. You then add the measurements to monitor for each server.These monitor settings can be saved as a monitor profile which can be used by any performance test inyour project.
The following section will show you how to create a monitor profile and how to add aWindowsResource Monitor to it.
Quick StartChapter 3: Creating and Designing Performance Tests
Performance Center (12.60-12.63) Page 14 of 35
How do I create a monitor profile?You create and configure monitor profile as follows:
1. From the Performance Center navigation toolbar, click and select Monitors (under Assets).
2. Create a folder for the monitor profile.
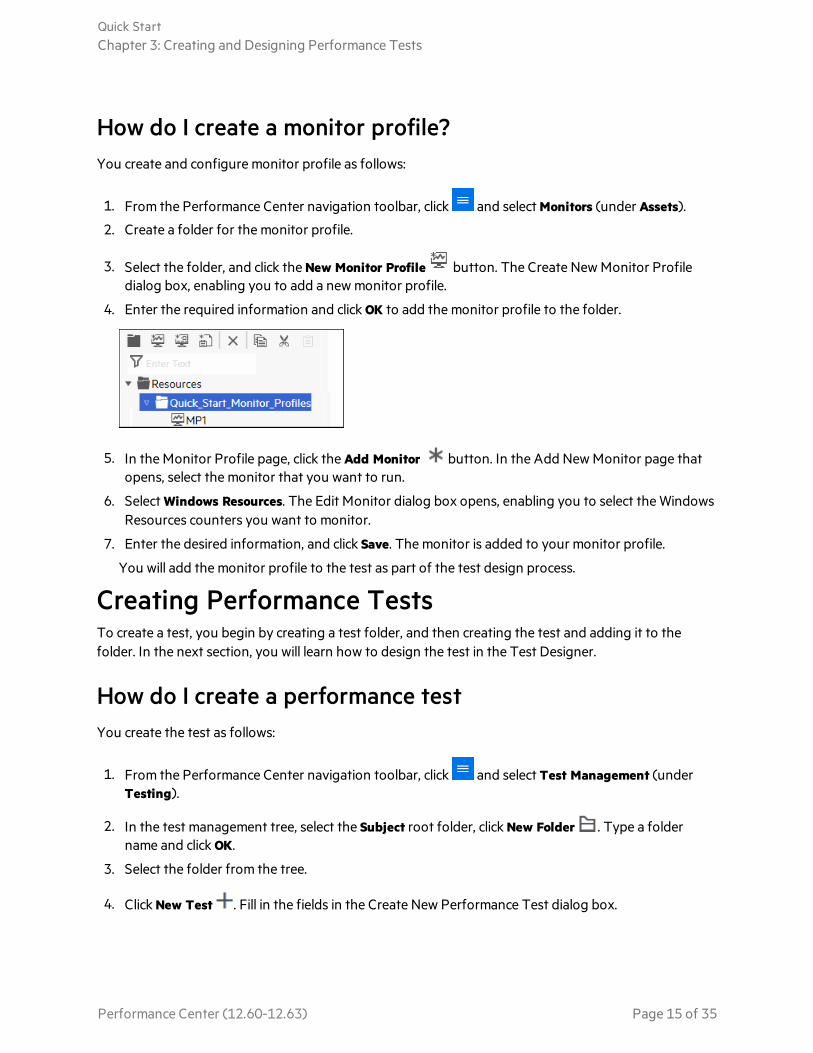
3. Select the folder, and click the New Monitor Profile button. The Create NewMonitor Profiledialog box, enabling you to add a newmonitor profile.
4. Enter the required information and click OK to add the monitor profile to the folder.
5. In the Monitor Profile page, click the Add Monitor button. In the Add NewMonitor page thatopens, select the monitor that you want to run.
6. Select Windows Resources. The Edit Monitor dialog box opens, enabling you to select theWindowsResources counters you want to monitor.
7. Enter the desired information, and click Save. The monitor is added to your monitor profile.
You will add the monitor profile to the test as part of the test design process.
Creating Performance TestsTo create a test, you begin by creating a test folder, and then creating the test and adding it to thefolder. In the next section, you will learn how to design the test in the Test Designer.
How do I create a performance testYou create the test as follows:
1. From the Performance Center navigation toolbar, click and select Test Management (underTesting).
2. In the test management tree, select the Subject root folder, click New Folder . Type a foldername and click OK.
3. Select the folder from the tree.
4. Click New Test . Fill in the fields in the Create New Performance Test dialog box.
Quick StartChapter 3: Creating and Designing Performance Tests
Performance Center (12.60-12.63) Page 15 of 35

Designing Performance TestsYou design your performance test in the Performance Test Designer.
How do I open the Performance Test Designer?You open the test designer as follows:
1. From the Performance Center navigation toolbar, click and select Test Management (underTesting).
2. Select the test you created above, and click the Edit Test button on the toolbar. The PerformanceTest Designer opens.
How do I design the performance test?From the Groups & Workload view in the Performance Test Designer, you perform the basic test designsteps. You design the test as follows:
1. Assign a Controller to the test.
a. Click the browse button adjacent to the Controller box. The Select Controller dialog boxopens.
b. Select Specific.
c. Select from the list the host machine that has been assigned the Controller and Load Generator(C+LG) purpose.
2. Add Vuser scripts.
a. If the Scripts Tree pane is not displayed on the right, click the Select Scripts button on thetoolbar to open it. The Scripts Tree displays the script that you uploaded previously toPerformance Center.
b. In the Scripts Tree, select the script and click the left arrow to add it to the test. The scriptappears in the Groups pane.
3. Add load generators.
Quick StartChapter 3: Creating and Designing Performance Tests
Performance Center (12.60-12.63) Page 16 of 35
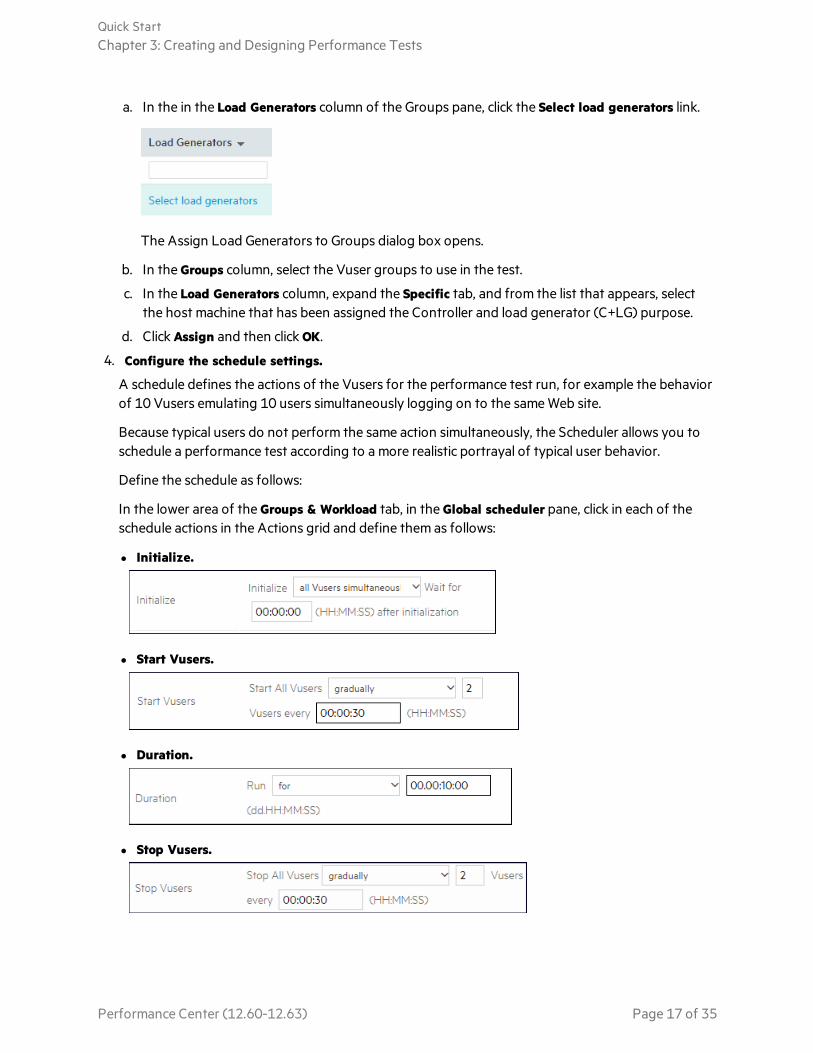
a. In the in the Load Generators column of the Groups pane, click the Select load generators link.
The Assign Load Generators to Groups dialog box opens.
b. In the Groups column, select the Vuser groups to use in the test.
c. In the Load Generators column, expand the Specific tab, and from the list that appears, selectthe host machine that has been assigned the Controller and load generator (C+LG) purpose.
d. Click Assign and then click OK.
4. Configure the schedule settings.
A schedule defines the actions of the Vusers for the performance test run, for example the behaviorof 10 Vusers emulating 10 users simultaneously logging on to the sameWeb site.
Because typical users do not perform the same action simultaneously, the Scheduler allows you toschedule a performance test according to a more realistic portrayal of typical user behavior.
Define the schedule as follows:
In the lower area of the Groups & Workload tab, in the Global scheduler pane, click in each of theschedule actions in the Actions grid and define them as follows:
l Initialize.
l Start Vusers.
l Duration.
l Stop Vusers.
Quick StartChapter 3: Creating and Designing Performance Tests
Performance Center (12.60-12.63) Page 17 of 35
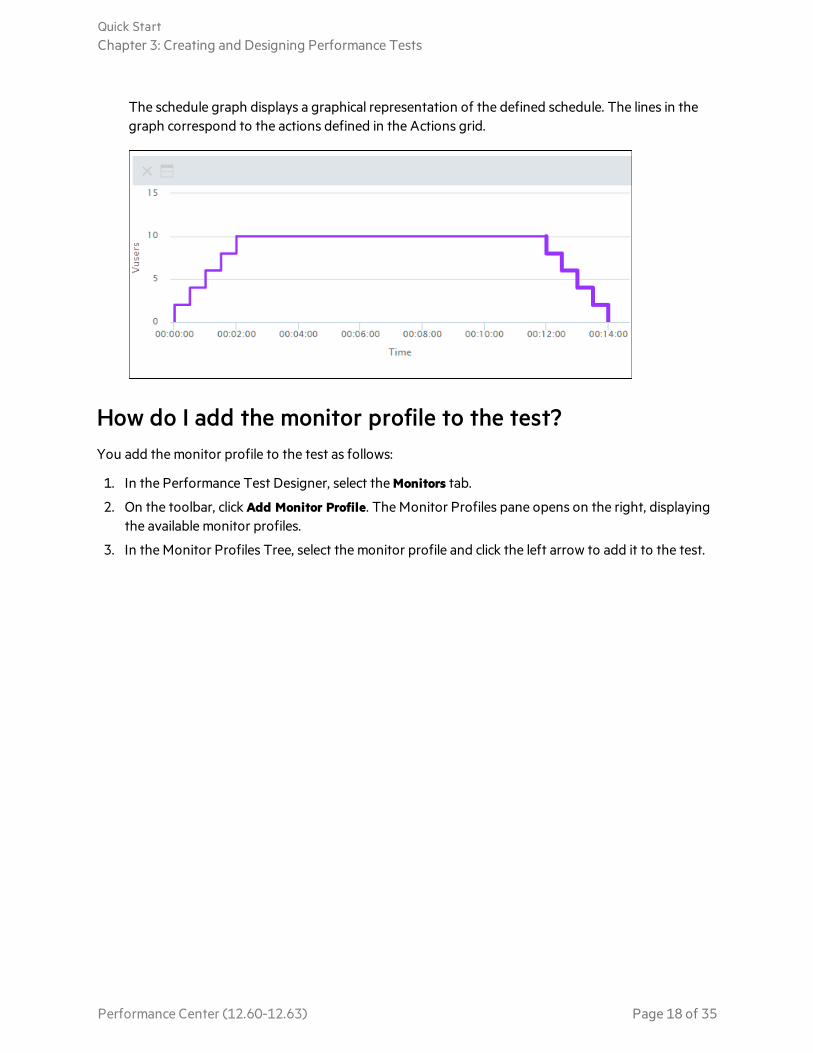
The schedule graph displays a graphical representation of the defined schedule. The lines in thegraph correspond to the actions defined in the Actions grid.
How do I add the monitor profile to the test?You add the monitor profile to the test as follows:
1. In the Performance Test Designer, select the Monitors tab.
2. On the toolbar, click Add Monitor Profile. The Monitor Profiles pane opens on the right, displayingthe available monitor profiles.
3. In the Monitor Profiles Tree, select the monitor profile and click the left arrow to add it to the test.
Quick StartChapter 3: Creating and Designing Performance Tests
Performance Center (12.60-12.63) Page 18 of 35
Chapter 4: Running Performance TestsThis lesson explains the steps that are necessary before you run the performance test, and how to begintest execution.
In this lesson you will learn about:
l "Creating Test Sets" below
l "Reserving Timeslots" on the next page
l "Running Performance Tests" on page 21
Creating Test SetsThe next step in the performance testing process is the creation of a performance test set.
What is a test set?After you design the performance test in the Testing module, you organize the test execution bycreating a test set, and adding an instance of the test to the test set. The purpose of a test set is toenable you to group together tests that were created for similar goals.
How do I create a test set?You create the test set and add the test to it as follows:
1. Create the test set.
a. In the Performance Test Designer, click the Run button at the bottom of the page. The Assignand Select Test Set dialog box opens.
Tip: You can also create or assign a test set from the Create New Performance Testdialog box. For details, see "How do I create a performance test" on page 15
b. Click the Root test set folder, and click the New Folder button. Specify a name for the TestSet folder, for example, Test_set_folder.
c. Click OK to add the folder.
d. Select the folder you created above, and click the New Test Set button. The Create NewPerformance Test Set dialog box opens.
e. Enter the test set name. Click OK. The test name is added to the tree.
2. Assign the performance test to the test set.
a. Select the test set and click Assign.
Performance Center (12.60-12.63) Page 19 of 35
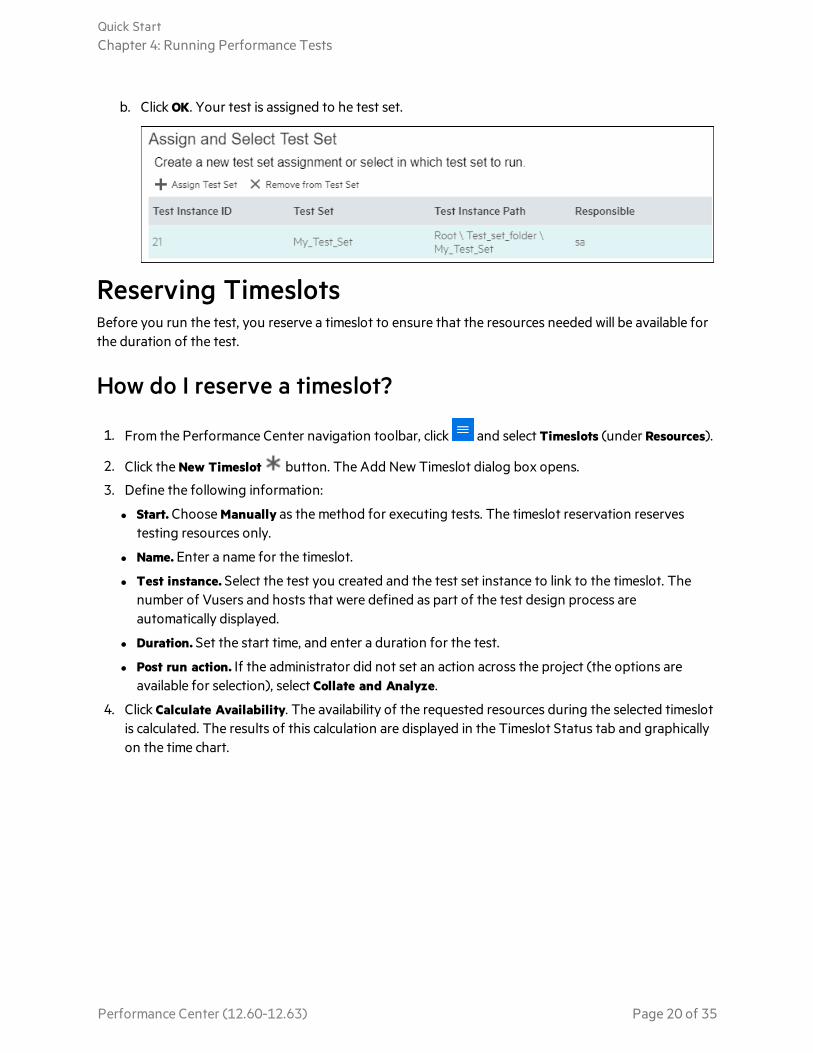
b. Click OK. Your test is assigned to he test set.
Reserving TimeslotsBefore you run the test, you reserve a timeslot to ensure that the resources needed will be available forthe duration of the test.
How do I reserve a timeslot?
1. From the Performance Center navigation toolbar, click and select Timeslots (under Resources).
2. Click the New Timeslot button. The Add New Timeslot dialog box opens.
3. Define the following information:
l Start. Choose Manually as the method for executing tests. The timeslot reservation reservestesting resources only.
l Name. Enter a name for the timeslot.
l Test instance. Select the test you created and the test set instance to link to the timeslot. Thenumber of Vusers and hosts that were defined as part of the test design process areautomatically displayed.
l Duration. Set the start time, and enter a duration for the test.
l Post run action. If the administrator did not set an action across the project (the options areavailable for selection), select Collate and Analyze.
4. Click Calculate Availability. The availability of the requested resources during the selected timeslotis calculated. The results of this calculation are displayed in the Timeslot Status tab and graphicallyon the time chart.
Quick StartChapter 4: Running Performance Tests
Performance Center (12.60-12.63) Page 20 of 35

Note: If the timeslot cannot be reserved, reselect your resources or adjust the start time,taking into account the reasons displayed in the Timeslot Status tab.
5. When you find a valid timeslot, click Submit to save the timeslot.
Running Performance TestsNow that you have designed the performance test, added an instance of the test to a test set, andreserved a timeslot for the test, you are ready to run the test and observe how your applicationperforms under load.
How do I run the performance test?You run the performance test as follows:
1. From the Performance Center navigation toolbar, click and select Test Management (underTesting).
2. Select your test in the test management tree.
3. Click the Run Test button. The Run Performance Test dialog box opens.
Quick StartChapter 4: Running Performance Tests
Performance Center (12.60-12.63) Page 21 of 35

4. Click the Reserved Timeslot tab.
5. Select the timeslot you reserved, and click Run.
The Initializing Run page displays the performance test initialization steps performed byPerformance Center, and the status for each step. If each step is completed successfully, theperformance test starts running and the Performance Test Run page opens. The Test Run pageenables you to manage and monitor the test as it runs.
What does the Performance Test Run page display?The Performance Test Run page is the control center fromwhich the test run is managed andmonitored.
The Performance Test Run page displays the following:
Pane/Tab Description
Summary The Summary pane at the top of the page displays a synopsis of the runningperformance test.
Quick StartChapter 4: Running Performance Tests
Performance Center (12.60-12.63) Page 22 of 35
Pane/Tab Description
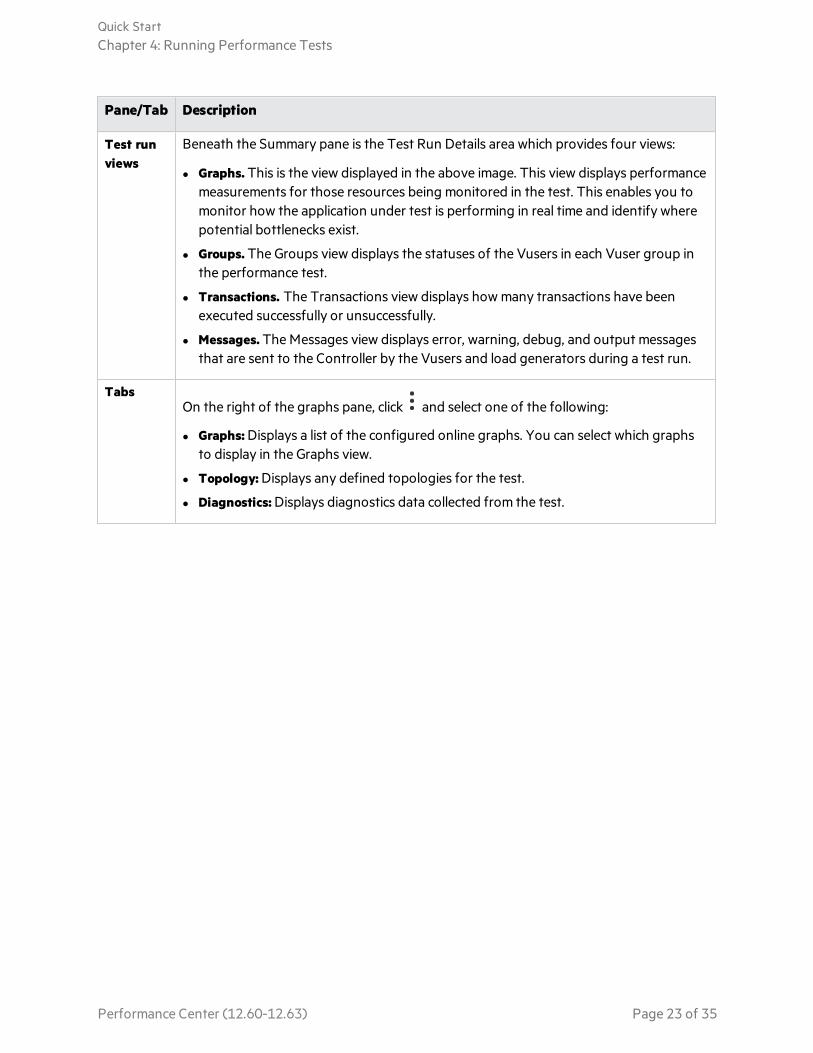
Test runviews
Beneath the Summary pane is the Test Run Details area which provides four views:
l Graphs. This is the view displayed in the above image. This view displays performancemeasurements for those resources being monitored in the test. This enables you tomonitor how the application under test is performing in real time and identify wherepotential bottlenecks exist.
l Groups. The Groups view displays the statuses of the Vusers in each Vuser group inthe performance test.
l Transactions. The Transactions view displays howmany transactions have beenexecuted successfully or unsuccessfully.
l Messages. TheMessages view displays error, warning, debug, and output messagesthat are sent to the Controller by the Vusers and load generators during a test run.
TabsOn the right of the graphs pane, click and select one of the following:
l Graphs: Displays a list of the configured online graphs. You can select which graphsto display in the Graphs view.
l Topology: Displays any defined topologies for the test.
l Diagnostics: Displays diagnostics data collected from the test.
Quick StartChapter 4: Running Performance Tests
Performance Center (12.60-12.63) Page 23 of 35
Chapter 5: Post-Run Analysis and TrendingThis lesson explains how to analyze test run data using LoadRunner Analysis, and how to viewperformance improvements and regressions using the Trend Report feature.
In this lesson you will learn about:
l "Analyzing Performance Test Run Results" below
l "Viewing Performance Improvements and Regressions" on page 30
Analyzing Performance Test Run ResultsNow that you have completed running the performance test, you can use LoadRunner Analysis toanalyze the performance data generated during the test run. Analysis gathers the performance datainto detailed graphs and reports. Using these graphs and reports, you can pinpoint and identify thebottlenecks in the application, and determine what changes need to bemade to the system to improveits performance.
How do I view Analysis information?l To view Analysis data for your actual performance test, you perform the following steps:
a. Open Analysis.
Click Start > All Programs > Micro Focus > LoadRunner > Analysis.
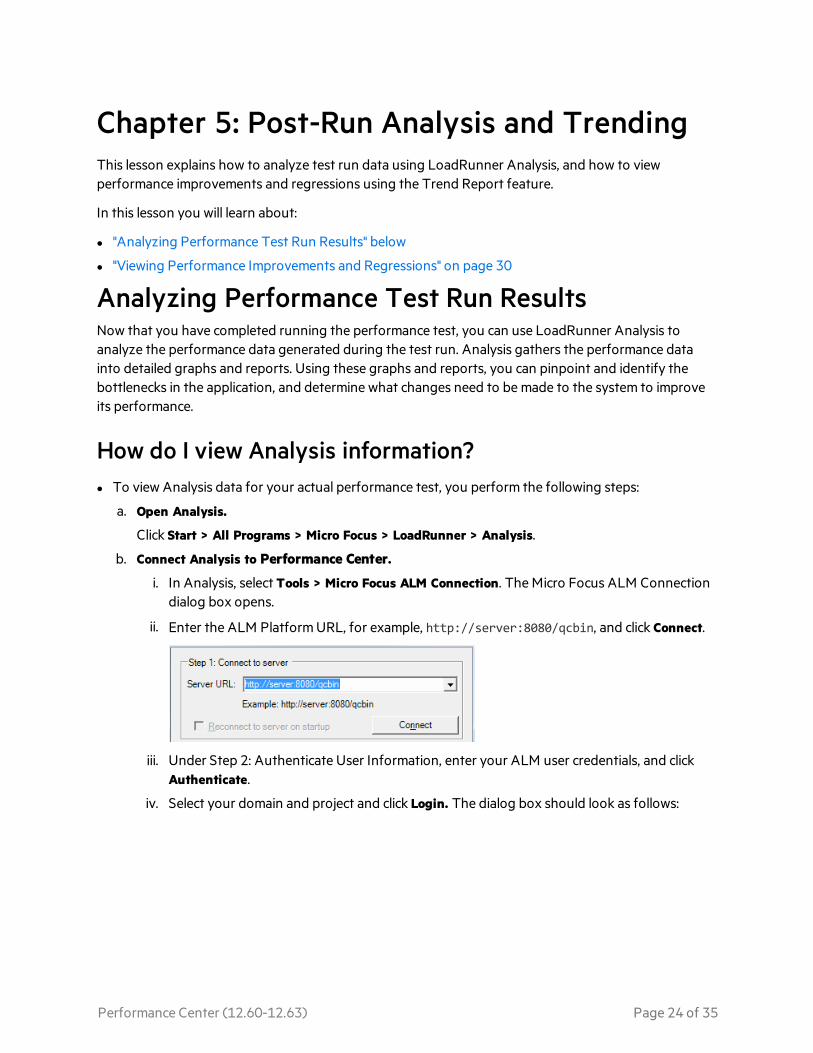
b. Connect Analysis to Performance Center.
i. In Analysis, select Tools > Micro Focus ALM Connection. The Micro Focus ALM Connectiondialog box opens.
ii. Enter the ALM PlatformURL, for example, http://server:8080/qcbin, and click Connect.
iii. Under Step 2: Authenticate User Information, enter your ALM user credentials, and clickAuthenticate.
iv. Select your domain and project and click Login. The dialog box should look as follows:
Performance Center (12.60-12.63) Page 24 of 35
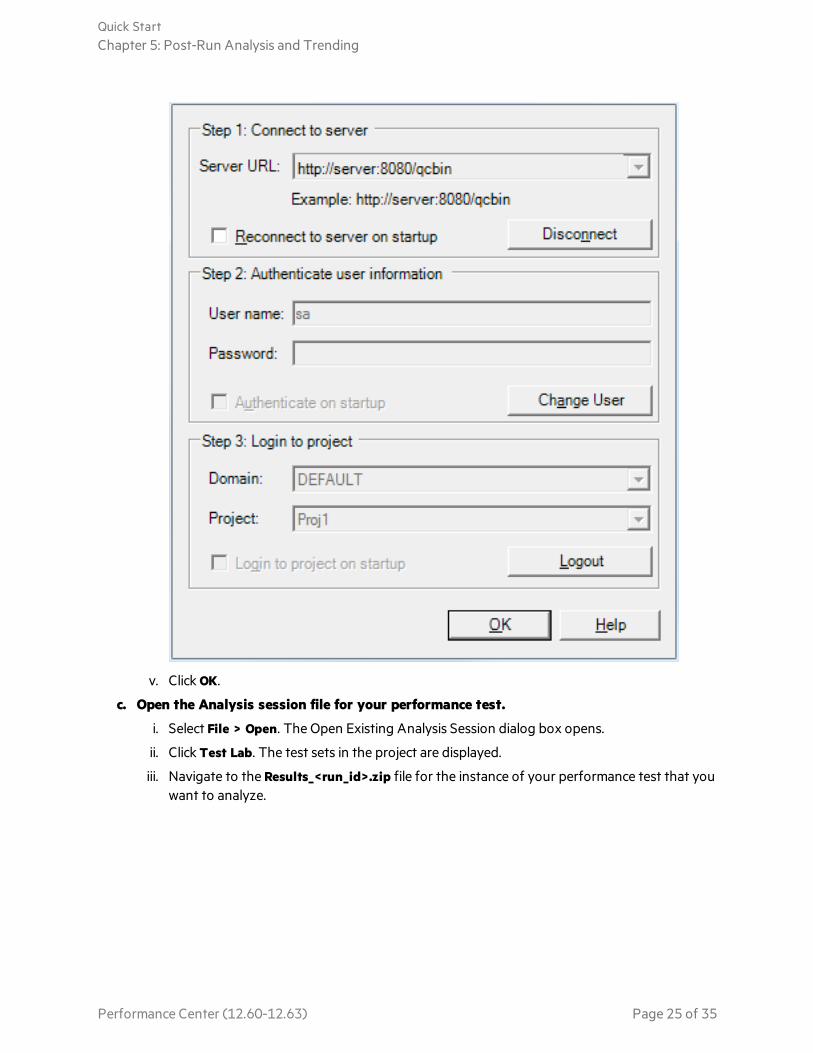
v. Click OK.
c. Open the Analysis session file for your performance test.
i. Select File > Open. The Open Existing Analysis Session dialog box opens.
ii. Click Test Lab. The test sets in the project are displayed.
iii. Navigate to the Results_<run_id>.zip file for the instance of your performance test that youwant to analyze.
Quick StartChapter 5: Post-Run Analysis and Trending
Performance Center (12.60-12.63) Page 25 of 35

iv. Double-click the Results_<run_id>.zip file. The Analysis session file is downloaded fromPerformance Center and is opened in Analysis.
l To provide for more interesting results, a sample Analysis session is provided, which is based on aperformance test similar to the one you ran. For details on how to open the sample Analysis session,see the LoadRunner Tutorial.
The data contained in the sample session is examined in more detail in the sections that follow.
Did I reach my goals?Analysis opens displaying the Summary Report. The Summary Report provides general informationabout the performance test run. In the Statistics Summary of the report, you can see howmany Vusersran in the test and view other statistics such as the total/average throughput, and the total/averagehits. The Transaction Summary of the report lists a summary of the behavior of each transaction.
How can I view the graphs?The graph tree in the left pane of the Analysis window shows the graphs that are open for viewing.From the graph tree, you can choose to open new graphs and remove graphs that you no longer wantto view. The graphs are displayed in the graph viewing area in the right pane of the Analysis window.You can view data from the selected graphs in the graph legend in the lower pane of the window.
As an example, we will now analyze the Average Transaction Response Time graph. Using this graph,you can view the behavior of the problematic transactions during each second of the performance testrun. In this section, you view the behavior of the check_itinerary transaction.
To open and analyze the Average Transaction Response Time graph:
1. Choose Graph > Add New Graph. The Open a New Graph dialog box opens.
2. Under Transactions, select Average Transaction Response Time.
Quick StartChapter 5: Post-Run Analysis and Trending
Performance Center (12.60-12.63) Page 26 of 35
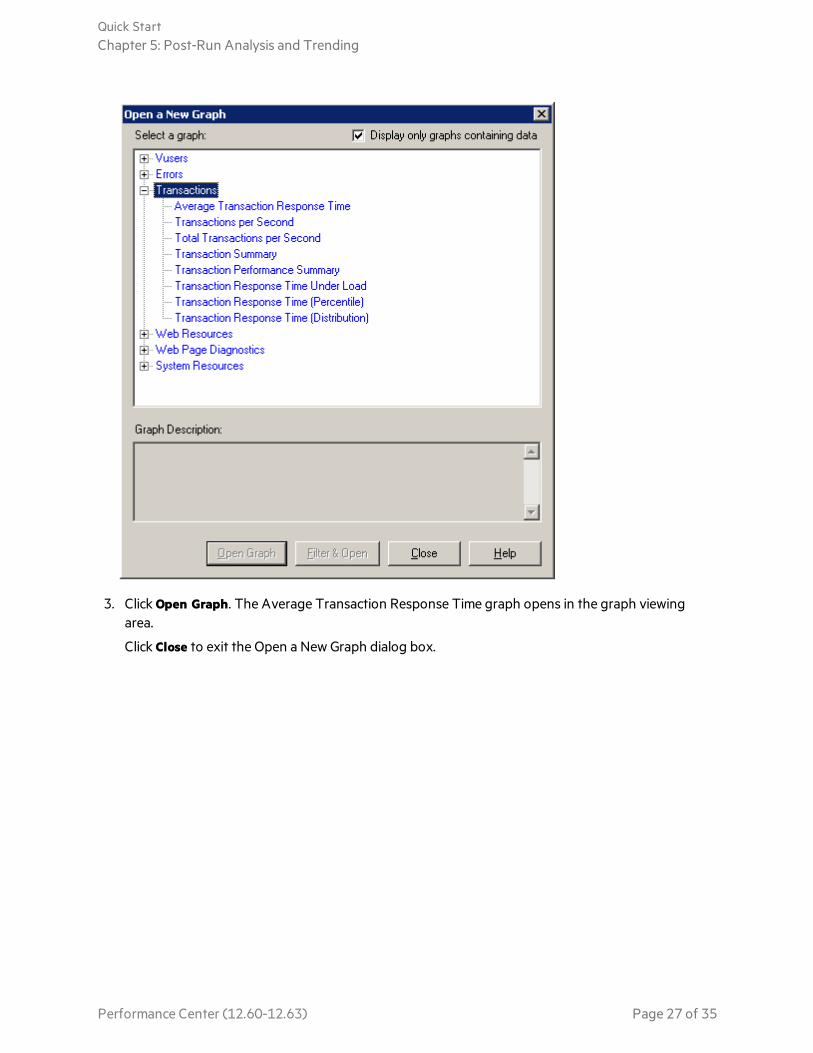
3. Click Open Graph. The Average Transaction Response Time graph opens in the graph viewingarea.
Click Close to exit the Open a New Graph dialog box.
Quick StartChapter 5: Post-Run Analysis and Trending
Performance Center (12.60-12.63) Page 27 of 35

4. In the legend, click check_itinerary. The check_itinerary transaction is highlighted in the graph andin the legend below the graph.
Notice how the average response time of the check_itinerary transaction fluctuates greatlycompared to the other transactions at the bottom of the graph, which follow amore or less stableaverage response time.
How can I compare data from different graphs?You can join two graphs together to see the effect of one graph's data upon another graph's data. Thisis called correlating two graphs. For example, you can correlate the Running Vusers graph with theAverage Transaction Response Time graph to see the effect of a large number of Vusers on theaverage response time of the transactions.
1. Choose Graph > Add New Graph. The Open a New Graph dialog box opens.
2. Under Vusers, select Running Vusers.
Quick StartChapter 5: Post-Run Analysis and Trending
Performance Center (12.60-12.63) Page 28 of 35
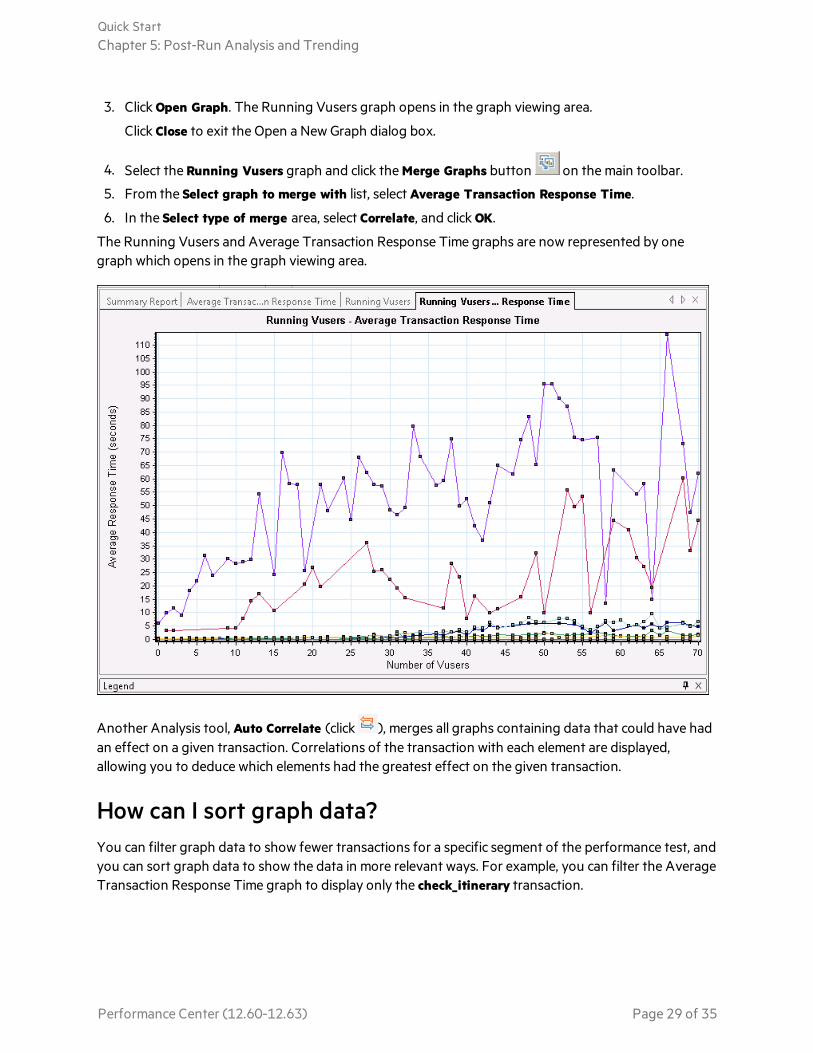
3. Click Open Graph. The Running Vusers graph opens in the graph viewing area.
Click Close to exit the Open a New Graph dialog box.
4. Select the Running Vusers graph and click the Merge Graphs button on the main toolbar.
5. From the Select graph to merge with list, select Average Transaction Response Time.
6. In the Select type of merge area, select Correlate, and click OK.
The Running Vusers and Average Transaction Response Time graphs are now represented by onegraph which opens in the graph viewing area.
Another Analysis tool, Auto Correlate (click ), merges all graphs containing data that could have hadan effect on a given transaction. Correlations of the transaction with each element are displayed,allowing you to deduce which elements had the greatest effect on the given transaction.
How can I sort graph data?You can filter graph data to show fewer transactions for a specific segment of the performance test, andyou can sort graph data to show the data in more relevant ways. For example, you can filter the AverageTransaction Response Time graph to display only the check_itinerary transaction.
Quick StartChapter 5: Post-Run Analysis and Trending
Performance Center (12.60-12.63) Page 29 of 35

1. Click Average Transaction Response Time in the graph tree to open the graph.
2. Select the graph and click the Set Filter/Group by button .
3. In the Transaction Name value box, select check_itinerary and click OK.
The filtered graph displays only the check_itinerary transaction and hides all the other transactions.
How can I publish my findings?You can publish the findings from your analysis session in an HTML or Microsoft Word report. TheHTML report can be opened and viewed in any browser. TheWord report is more comprehensive thanthe HTML report, enabling you to include general information about the performance test and toformat the report to include your company's name, logo, and the author's details.
For details about analyzing performance test results, refer to the LoadRunner Analysis User Guide.
Viewing Performance Improvements andRegressionsA trend report is a Performance Center feature that allows you to view changes in performance fromone performance test to another, or across several performance tests. By analyzing these changes, youcan easily identify improvements or regressions in the measurement's performance.
For example, if you would like to analyze the performance trend of the average transaction responsetimemeasurement of Transaction X, then the trend report would display the changes in the responsetime from one test to the next, clearly indicating whether this measurement improved (where theresponse time decreased) or regressed (where it increased).
What steps are involved in working with trend reports?The process of creating and viewing a trend report involves the following steps:
l Step 1 - Creating the trend report. Creating the basic trend report by defining its name, descriptionand selecting a template.
l Step 2 - Adding test runs to the trend report. Extracting test run data fromAnalysis to the trendreport.
l Step 3 - Viewing trend report data. Opening the trend view and analyzing the trending information.
Creating the Trend Report
You create the trend report from themain Trend Reports page.
To create the trend report:
Quick StartChapter 5: Post-Run Analysis and Trending
Performance Center (12.60-12.63) Page 30 of 35

1. Open the main Performance Trending page.
From the Performance Center navigation toolbar, click and select Performance Trending(under Applications).
2. Open the Trend Report Creation page.
On the Performance Trending page, click the New Trend Report button. The Create New TrendReport page opens.
3. Define the General Details and Content and Layout settings.
a. In the Create New Trend Report page, define the following information:o In the General Details pane, enter a name and description for the trend report.o In the General Contents and Layout pane, select the Transaction Trends template.
b. Click Create to create the trend report. The Select Test Runs to Trend Report dialog boxsuperimposes on the Trend Overview tab.
4. Add Performance Test Runs to the Trend Report.
From the Project, Test Set and Test lists respectively, select the performance test that you want totrend. All analyzed instances of the performance test appear in the table.
Quick StartChapter 5: Post-Run Analysis and Trending
Performance Center (12.60-12.63) Page 31 of 35
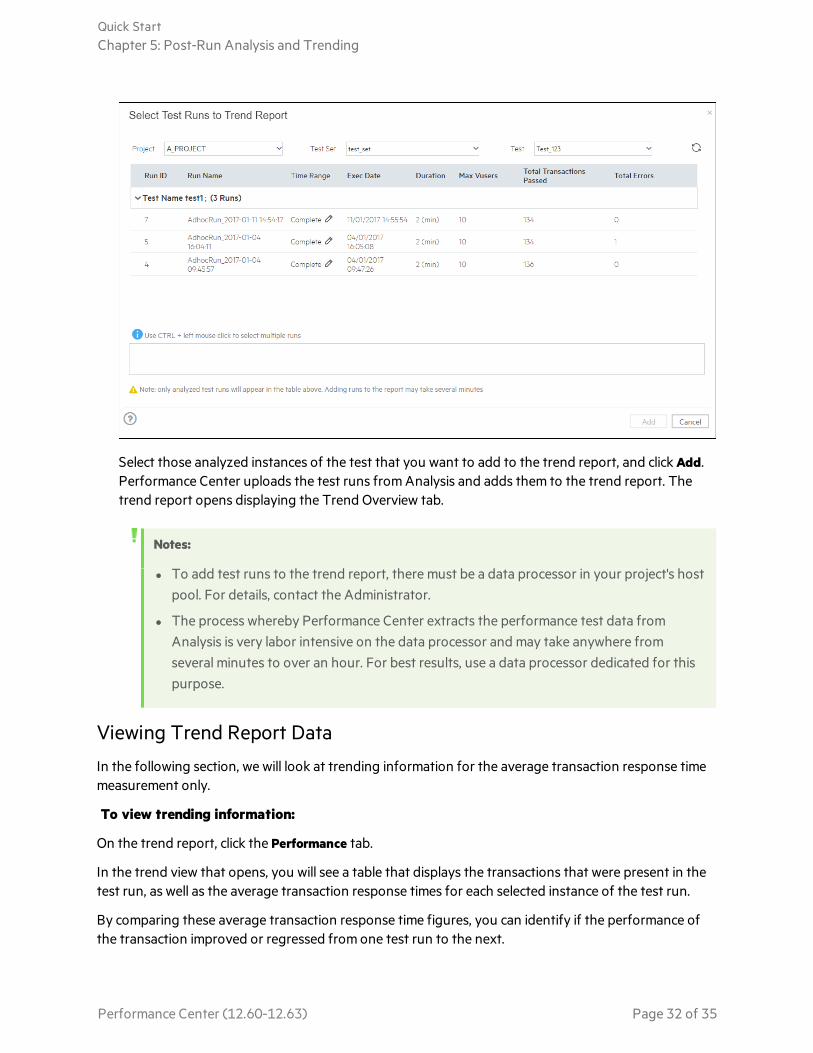
Select those analyzed instances of the test that you want to add to the trend report, and click Add.Performance Center uploads the test runs fromAnalysis and adds them to the trend report. Thetrend report opens displaying the Trend Overview tab.
Notes:
l To add test runs to the trend report, there must be a data processor in your project's hostpool. For details, contact the Administrator.
l The process whereby Performance Center extracts the performance test data fromAnalysis is very labor intensive on the data processor and may take anywhere fromseveral minutes to over an hour. For best results, use a data processor dedicated for thispurpose.
Viewing Trend Report Data
In the following section, we will look at trending information for the average transaction response timemeasurement only.
To view trending information:
On the trend report, click the Performance tab.
In the trend view that opens, you will see a table that displays the transactions that were present in thetest run, as well as the average transaction response times for each selected instance of the test run.
By comparing these average transaction response time figures, you can identify if the performance ofthe transaction improved or regressed from one test run to the next.
Quick StartChapter 5: Post-Run Analysis and Trending
Performance Center (12.60-12.63) Page 32 of 35

The following example illustrates this point.
In the trend view shown above, four transactions (TRX_01, TRX_02, TRX_03, and TRX_04) aredisplayed and their average Transaction Response Timemeasurement is being trended from fourperformance test runs: 3, 4, 5, and 6.
Test run 3 has been automatically defined as the baseline run, (as indicated by the word Base inbrackets). This means that the average transaction response times contained in the other tests arecompared to test run 3 only.
In test run 3, the average transaction response time for TRX_01 was 2.045. The average transactionresponse time for the same transaction in test run 4 was 4.073, which represents a slower response timeand therefore a regression in the performance of this measurement. The percentage differencebetween the two figures is displayed in parenthesis, in this case +99.17%.
In test run 6, the average transaction response time for TRX_01 was 1.05, which represents a fasterresponse time that test run 3, and therefore a performance improvement. The percentage differencebetween the two figures is displayed in parenthesis, in this case -48.66%.
Quick StartChapter 5: Post-Run Analysis and Trending
Performance Center (12.60-12.63) Page 33 of 35

Send Us FeedbackLet us know how we can improve your experience with the Quick Start.Send your email to: [email protected]
Performance Center (12.60-12.63) Page 34 of 35