Percutaneous Endoscopic Gastrostomy versus Nasogastric ...
10
nutrients Article Percutaneous Endoscopic Gastrostomy versus Nasogastric Tube Feeding: Oropharyngeal Dysphagia Increases Risk for Pneumonia Requiring Hospital Admission Wei-Kuo Chang 1, *, Hsin-Hung Huang 1 , Hsuan-Hwai Lin 1 and Chen-Liang Tsai 2 1 Division of Gastroenterology, Department of Internal Medicine, Tri-Service General Hospital, National Defense Medical Center, Taipei 114, Taiwan; [email protected] (H.-H.H.); [email protected] (H.-H.L.) 2 Division of Pulmonary and Critical Care, Department of Internal Medicine, Tri-Service General Hospital, National Defense Medical Center, Taipei 114, Taiwan; [email protected] * Correspondence: [email protected]; Tel.: +886-2-23657137; Fax: +886-2-87927138 Received: 3 November 2019; Accepted: 4 December 2019; Published: 5 December 2019 Abstract: Background: Aspiration pneumonia is the most common cause of death in patients with percutaneous endoscopic gastrostomy (PEG) and nasogastric tube (NGT) feeding. This study aimed to compare PEG versus NGT feeding regarding the risk of pneumonia, according to the severity of pooling secretions in the pharyngolaryngeal region. Methods: Patients were stratified by endoscopic observation of the pooling secretions in the pharyngolaryngeal region: control group (<25% pooling secretions filling the pyriform sinus), pharyngeal group (25–100% pooling secretions filling the pyriform sinus), and laryngeal group (pooling secretions entering the laryngeal vestibule). Demographic data, swallowing level scale score, and pneumonia requiring hospital admission were recorded. Results: Patients with NGT (n = 97) had a significantly higher incidence of pneumonia (episodes/person-years) than those patients with PEG (n = 130) in the pharyngeal group (3.6 ± 1.0 vs. 2.3 ± 2.1, P < 0.001) and the laryngeal group (3.8 ± 0.5 vs. 2.3 ± 2.2 vs, P < 0.001). The risk of pneumonia was significantly higher in patients with NGT than in patients with PEG (adjusted hazard ratio = 2.85, 95% CI: 1.46–4.98, P < 0.001). Cumulative proportion of pneumonia was significantly higher in patients with NGT than with PEG for patients when combining the two groups (pharyngeal + laryngeal groups) (P = 0.035). Conclusion: PEG is a better choice than NGT feeding due to the decrease in risk of pneumonia requiring hospital admission, particularly in patients with abnormal amounts of pooling secretions accumulation in the pyriform sinus or leak into the laryngeal vestibule. Keywords: oropharyngeal dysphagia; aspiration pneumonia; percutaneous endoscopic gastrostomy; nasogastric tube 1. Introduction Percutaneous endoscopic gastrostomy (PEG) and nasogastric tube (NGT) feeding are widely used for delivering enteral nutrition to patients with dysphagia [1,2]. Current guidelines recommend PEG for long-term and NGT for short-term enteral nutrition [3–5]. However, patients are commonly placed on NGT for long-term enteral feeding in Asian countries [6–8]. Aspiration pneumonia is the most common cause of death in patients with PEG and NGT feeding [9,10]. Meta-analyses of pneumonia risk did not observe that patients with NGT were at higher risk than those with PEG, but these results may be due to high levels of statistical heterogeneity between studies [2,11,12]. Subgroup analysis is required to explore the variation across studies. Nutrients 2019, 11, 2969; doi:10.3390/nu11122969 www.mdpi.com/journal/nutrients
-
Upload
khangminh22 -
Category
Documents
-
view
3 -
download
0
Transcript of Percutaneous Endoscopic Gastrostomy versus Nasogastric ...

nutrients
Article
Percutaneous Endoscopic Gastrostomy versusNasogastric Tube Feeding: Oropharyngeal DysphagiaIncreases Risk for Pneumonia RequiringHospital Admission
Wei-Kuo Chang 1,*, Hsin-Hung Huang 1, Hsuan-Hwai Lin 1 and Chen-Liang Tsai 2
1 Division of Gastroenterology, Department of Internal Medicine, Tri-Service General Hospital, NationalDefense Medical Center, Taipei 114, Taiwan; [email protected] (H.-H.H.);[email protected] (H.-H.L.)
2 Division of Pulmonary and Critical Care, Department of Internal Medicine, Tri-Service General Hospital,National Defense Medical Center, Taipei 114, Taiwan; [email protected]
* Correspondence: [email protected]; Tel.: +886-2-23657137; Fax: +886-2-87927138
Received: 3 November 2019; Accepted: 4 December 2019; Published: 5 December 2019�����������������
Abstract: Background: Aspiration pneumonia is the most common cause of death in patientswith percutaneous endoscopic gastrostomy (PEG) and nasogastric tube (NGT) feeding. This studyaimed to compare PEG versus NGT feeding regarding the risk of pneumonia, according to theseverity of pooling secretions in the pharyngolaryngeal region. Methods: Patients were stratified byendoscopic observation of the pooling secretions in the pharyngolaryngeal region: control group(<25% pooling secretions filling the pyriform sinus), pharyngeal group (25–100% pooling secretionsfilling the pyriform sinus), and laryngeal group (pooling secretions entering the laryngeal vestibule).Demographic data, swallowing level scale score, and pneumonia requiring hospital admission wererecorded. Results: Patients with NGT (n = 97) had a significantly higher incidence of pneumonia(episodes/person-years) than those patients with PEG (n = 130) in the pharyngeal group (3.6 ± 1.0vs. 2.3 ± 2.1, P < 0.001) and the laryngeal group (3.8 ± 0.5 vs. 2.3 ± 2.2 vs, P < 0.001). The risk ofpneumonia was significantly higher in patients with NGT than in patients with PEG (adjusted hazardratio = 2.85, 95% CI: 1.46–4.98, P < 0.001). Cumulative proportion of pneumonia was significantlyhigher in patients with NGT than with PEG for patients when combining the two groups (pharyngeal+ laryngeal groups) (P = 0.035). Conclusion: PEG is a better choice than NGT feeding due to thedecrease in risk of pneumonia requiring hospital admission, particularly in patients with abnormalamounts of pooling secretions accumulation in the pyriform sinus or leak into the laryngeal vestibule.
Keywords: oropharyngeal dysphagia; aspiration pneumonia; percutaneous endoscopic gastrostomy;nasogastric tube
1. Introduction
Percutaneous endoscopic gastrostomy (PEG) and nasogastric tube (NGT) feeding are widely usedfor delivering enteral nutrition to patients with dysphagia [1,2]. Current guidelines recommend PEGfor long-term and NGT for short-term enteral nutrition [3–5]. However, patients are commonly placedon NGT for long-term enteral feeding in Asian countries [6–8].
Aspiration pneumonia is the most common cause of death in patients with PEG and NGTfeeding [9,10]. Meta-analyses of pneumonia risk did not observe that patients with NGT were athigher risk than those with PEG, but these results may be due to high levels of statistical heterogeneitybetween studies [2,11,12]. Subgroup analysis is required to explore the variation across studies.
Nutrients 2019, 11, 2969; doi:10.3390/nu11122969 www.mdpi.com/journal/nutrients

Nutrients 2019, 11, 2969 2 of 10
Oropharyngeal dysphagia has been identified as a serious risk factor for patients developingaspiration pneumonia [13,14]. Endoscopy allows for direct observation of food accumulation in thepyriform sinus and other risks such as food entering below the vocal cords, which is common withoropharyngeal dysphagia [15–17]. With upper gastrointestinal (UGI) endoscopy, clinicians can observethe amount and location of accumulated pooling secretions in the pharyngolaryngeal region [17–20].
The aim of this study was to compare the risk of developing pneumonia requiring hospitaladmission between individuals using PEG versus NGT for long-term feeding according to UGIendoscopic observation of the severity of pooling secretions in the pharyngolaryngeal region.
2. Materials and Methods
2.1. Study Design
Between January 2015 and December 2018, UGI endoscopy was performed to evaluate theseverity of pooling secretions in the pharyngolaryngeal region in consecutive patients needing tubefeeding for more than 4 weeks. Follow-up data were collected regarding subsequent pneumoniathat required hospitalization. Patients were excluded due to age less than 20 years, pregnancy,or poor pharyngolaryngeal observations during endoscopy. The present study was approved by theInstitutional Review Board of Tri-Service General Hospital, Taiwan. The patients were informed of thedetails of this study and allowed to participate after providing written informed consent.
2.2. Demographic and Clinical Data
Basic and clinical patient characteristics were recorded, such as age, gender, body mass index,serum albumin levels, reasons for tube feeding, duration of tube feeding, swallowing level scale score,and pneumonia requiring admission. The swallowing level scale score was assessed using the AmericanSpeech-Language-Hearing Association National Outcome Measurement System [21]. The swallowinglevel scale scores range between 1–7, with lower numbers indicating greater oral intake limitationand increased risk of pneumonia. Specifically, swallowing level scale scores between 1 and 3 aretypically seen in tube-dependent patients, and those between 4 and 7 are usually seen in those on totaloral intake. Pneumonia was diagnosed based on radiological evidence of pulmonary consolidation,serum white cell count >10,000/mm3, temperature >38 ◦C, shortness of breath, and required hospitaladmission [22].
2.3. UGI Endoscopy with Pharyngolaryngeal Observations
The choice of premedication was dependent on the preference of the endoscopist. Most ofthe endoscopic procedures were performed using topical anesthesia without intravenous sedation.Patients fasted for at least 4 h and were placed in the left lateral decubitus position. The tip of the UGIendoscope was inserted through a mouthpiece with its axis aligned with that of the patient’s esophagus.With advancement of the endoscope along the midline of the palate, the uvula could be visualizedover the base of the tongue. The scope was rotated a little, past the uvula, and gently advanced withanterior flexion to visualize the pyriform sinus, laryngeal vestibule, vocal cords, and upper part of thetrachea (Figure 1). A digital video recorder (HVO-550MD; Sony, Tokyo, Japan) was connected to themonitoring system of the endoscope.
Patients were evaluated according to the endoscopic observation of the amount and location ofaccumulated pooling secretions in the pharyngolaryngeal region (Figure 2) [23–25]. The severity ofpooling secretions in the pharyngolaryngeal region was stratified into 3 groups: control group (<25%of pooling secretions filling the pyriform sinus), pharyngeal group (25–100% of pooling secretionsfilling the pyriform sinus but not entering the laryngeal vestibule), and laryngeal group (poolingsecretions entering the laryngeal vestibule) [17].

Nutrients 2019, 11, 2969 3 of 10Nutrients 2019, 11, x FOR PEER REVIEW 3 of 10
Figure 1. Endoscopic view of the pharyngolaryngeal region.
Figure 2. Endoscopic views of pooling secretions (arrow) in the pharyngolaryngeal region. Absence of pooling secretions filling the right side pyriform sinus (A), pooling secretions filling the right side pyriform sinus (B), and thin pooling secretions (C) or thick secretions (D) entering the laryngeal vestibule.
Figure 1. Endoscopic view of the pharyngolaryngeal region.
Nutrients 2019, 11, x FOR PEER REVIEW 3 of 10
Figure 1. Endoscopic view of the pharyngolaryngeal region.
Figure 2. Endoscopic views of pooling secretions (arrow) in the pharyngolaryngeal region. Absence of pooling secretions filling the right side pyriform sinus (A), pooling secretions filling the right side pyriform sinus (B), and thin pooling secretions (C) or thick secretions (D) entering the laryngeal vestibule.
Figure 2. Endoscopic views of pooling secretions (arrow) in the pharyngolaryngeal region. Absenceof pooling secretions filling the right side pyriform sinus (A), pooling secretions filling the right sidepyriform sinus (B), and thin pooling secretions (C) or thick secretions (D) entering the laryngeal vestibule.
2.4. Statistical Analysis
Statistical analyses were performed using SPSS 22.0 (IBM Inc., Armonk, NY, USA). Parametriccontinuous data were compared by analysis of variance (ANOVA). Categorical data were comparedusing the χ2 test and Yate’s correction or Fisher’s exact test. Regression analyses were performedto calculate the adjusted odds ratios with 95% confidence intervals (CI) for the risk associated withpneumonia. Multivariate regression analyses were used to assess the risk of pneumonia with adjustmentfor the age, gender, body mass index, serum albumin levels, reasons for tube feeding, duration of
Nutrients 2019, 11, 2969 4 of 10
tube feeding, and swallowing level scale score as potential confounding factors. P value < 0.05 wasconsidered statistically significant.
3. Results
3.1. Demographic and Clinical Data
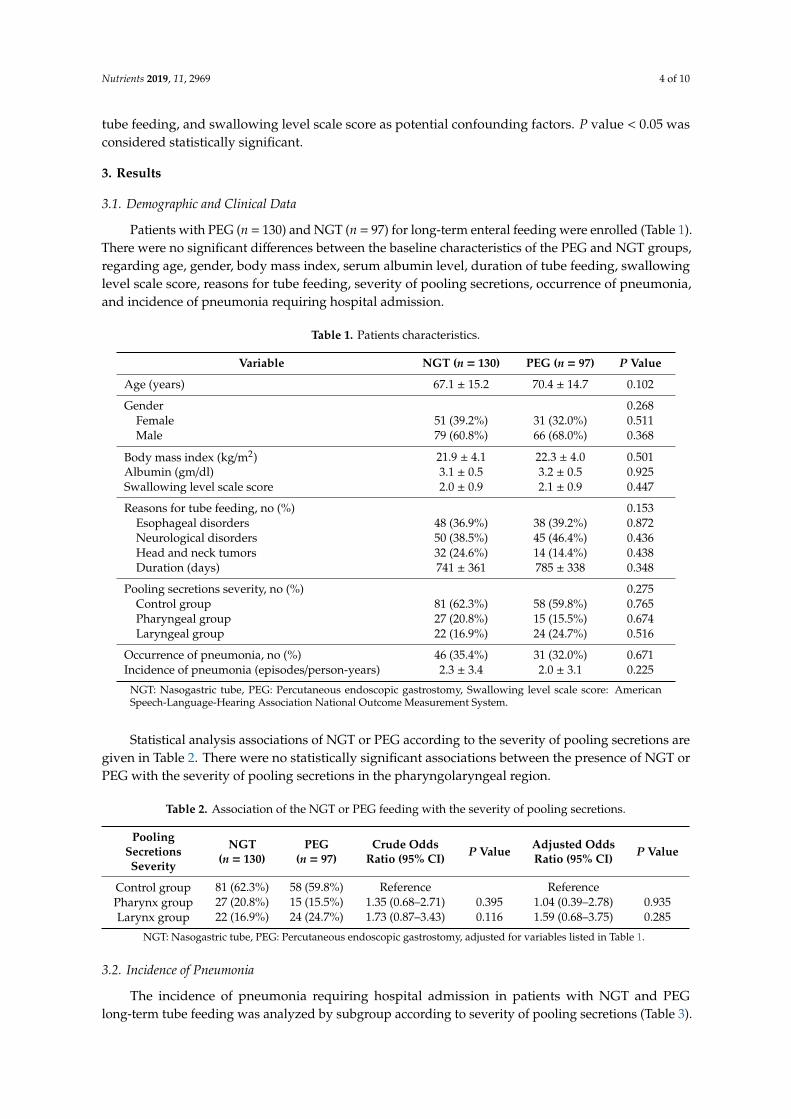
Patients with PEG (n = 130) and NGT (n = 97) for long-term enteral feeding were enrolled (Table 1).There were no significant differences between the baseline characteristics of the PEG and NGT groups,regarding age, gender, body mass index, serum albumin level, duration of tube feeding, swallowinglevel scale score, reasons for tube feeding, severity of pooling secretions, occurrence of pneumonia,and incidence of pneumonia requiring hospital admission.
Table 1. Patients characteristics.
Variable NGT (n = 130) PEG (n = 97) P Value
Age (years) 67.1 ± 15.2 70.4 ± 14.7 0.102
Gender 0.268Female 51 (39.2%) 31 (32.0%) 0.511Male 79 (60.8%) 66 (68.0%) 0.368
Body mass index (kg/m2) 21.9 ± 4.1 22.3 ± 4.0 0.501Albumin (gm/dl) 3.1 ± 0.5 3.2 ± 0.5 0.925Swallowing level scale score 2.0 ± 0.9 2.1 ± 0.9 0.447
Reasons for tube feeding, no (%) 0.153Esophageal disorders 48 (36.9%) 38 (39.2%) 0.872Neurological disorders 50 (38.5%) 45 (46.4%) 0.436Head and neck tumors 32 (24.6%) 14 (14.4%) 0.438Duration (days) 741 ± 361 785 ± 338 0.348
Pooling secretions severity, no (%) 0.275Control group 81 (62.3%) 58 (59.8%) 0.765Pharyngeal group 27 (20.8%) 15 (15.5%) 0.674Laryngeal group 22 (16.9%) 24 (24.7%) 0.516
Occurrence of pneumonia, no (%) 46 (35.4%) 31 (32.0%) 0.671Incidence of pneumonia (episodes/person-years) 2.3 ± 3.4 2.0 ± 3.1 0.225
NGT: Nasogastric tube, PEG: Percutaneous endoscopic gastrostomy, Swallowing level scale score: AmericanSpeech-Language-Hearing Association National Outcome Measurement System.
Statistical analysis associations of NGT or PEG according to the severity of pooling secretions aregiven in Table 2. There were no statistically significant associations between the presence of NGT orPEG with the severity of pooling secretions in the pharyngolaryngeal region.
Table 2. Association of the NGT or PEG feeding with the severity of pooling secretions.
PoolingSecretionsSeverity
NGT(n = 130)
PEG(n = 97)
Crude OddsRatio (95% CI) P Value Adjusted Odds
Ratio (95% CI) P Value
Control group 81 (62.3%) 58 (59.8%) Reference ReferencePharynx group 27 (20.8%) 15 (15.5%) 1.35 (0.68–2.71) 0.395 1.04 (0.39–2.78) 0.935Larynx group 22 (16.9%) 24 (24.7%) 1.73 (0.87–3.43) 0.116 1.59 (0.68–3.75) 0.285
NGT: Nasogastric tube, PEG: Percutaneous endoscopic gastrostomy, adjusted for variables listed in Table 1.
3.2. Incidence of Pneumonia
The incidence of pneumonia requiring hospital admission in patients with NGT and PEGlong-term tube feeding was analyzed by subgroup according to severity of pooling secretions (Table 3).

Nutrients 2019, 11, 2969 5 of 10
The incidence of pneumonia (episodes/person-years) was significantly higher in patients with NGTversus PEG for the patients in the pharyngeal group (3.6 ± 1.0 vs. 2.3 ± 2.1, P < 0.001) and the laryngealgroup (3.8 ± 0.5 vs. 2.3 ± 2.2 vs, P < 0.001), but not for patients in the control group (2.1 ± 0.5 vs.1.8 ± 1.7, P = 0.362).
Table 3. Incidence of pneumonia in patients with tube feeding.
Variable NGT (n = 130) PEG (n = 97) P Value
Incidence of pneumonia (episodes/person-years)Control group 2.1 ± 0.5 1.8 ± 1.7 0.362Pharyngeal group 3.6 ± 1.0 2.3 ± 2.1 <0.001Laryngeal group 3.8 ± 0.5 2.3 ± 2.2 <0.001
NGT: Nasogastric tube, PEG: Percutaneous endoscopic gastrostomy.
3.3. Risk Factor of Pneumonia
Multivariable regression analysis (Table 4) demonstrated that the risk of pneumonia requiringhospital admission was significantly higher in patients with NGT compared to patients with PEG(adjusted odds ratio = 2.85, 95% CI: 1.46–4.98, P < 0.001). The risk of pneumonia was significantlylower in patients with esophageal disorders (adjusted odds ratio = 0.35, 95% CI: 0.17–0.77, P = 0.010),but significantly higher in patients with neurological disorders (adjusted odds ratio = 1.27, 95% CI:1.09–2.31, P = 0.042) and head and neck tumors (adjusted odds ratio = 1.34, 95% CI: 1.10–2.45, P = 0.038).
Table 4. Multivariable analysis of the risk factors of pneumonia.
VariableWith
Pneumonia(n = 77)
WithoutPneumonia
(n = 150)
Crude OddsRatio
(95% CI)P Value
Adjusted OddsRatio
(95% CI)P Value
Age (years) 70.6 ± 14.3 67.4 ± 15.4 1.05 (0.92–1.09) 0.126 1.03 (0.98–1.05) 0.129
GenderFemale 25 (32.5%) 57 (38.0%) Reference ReferenceMale 52 (67.5%) 93 (62.0%) 1.28 (0.71–2.28) 0.467 1.21 (0.55–2.14) 0.426
NGT vs. PEGPEG 31 (40.3%) 66 (44.0%) Reference ReferenceNGT 46 (59.7%) 84 (56.0%) 2.88 (1.63–5.08) <0.001 2.85 (1.46–4.98) <0.001
Body mass index (kg/m2) 21.6 ± 4.2 22.3 ± 4.0 0.97 (0.91–1.04) 0.223 0.99 (0.91–1.08) 0.835Albumin (gm/dL) 3.1 ± 0.5 3.4 ± 0.6 0.36 (0.21–0.65) 0.002 0.49 (0.21–1.43) 0.168Swallowing level scale score 2.0 ± 1.3 3.1 ± 2.3 0.72 (0.60–0.88) 0.001 0.91 (0.70–1.18) 0.433
Reasons for feeding tube, no (%)Esophageal disorders 17 (22.1%) 69 (46.0%) 0.48 (0.28–0.85) 0.004 0.35 (0.17–0.77) 0.010Neurological disorders 39 (50.6%) 56 (37.3%) 1.36 (1.11–2.78) 0.001 1.27 (1.09–2.31) 0.042Head and neck tumors 21 (27.3%) 25 (16.7%) 1.63 (1.20–2.94) 0.001 1.34 (1.10–2.45) 0.038
Pooling secretions severity, no (%)Control group 32 (41.6%) 107 (71.3%) Reference ReferencePharynx group 23 (29.8%) 23 (15.3%) 3.34 (1.57–6.66) 0.001 1.24 (0.99–2.08) 0.051Larynx group 22 (28.6%) 20 (13.4%) 3.66 (1.63–7.99) 0.001 1.73 (1.16–2.24) 0.023
NGT: Nasogastric tube, PEG: Percutaneous endoscopic gastrostomy, Swallowing level scale score: AmericanSpeech-Language-Hearing Association National Outcome Measurement System, CI: Confidence interval.
The risk of pneumonia was significantly increased in both the pharyngeal group (adjusted oddsratio = 1.25, 95% CI: 1.03–2.10, P = 0.048) and the laryngeal group (adjusted odds ratio = 1.79, 95% CI:1.18–2.30, P = 0.017), compared to the control group.
3.4. Cumulative Proportion of Pneumonia
From the Kaplan–Meier estimate, the cumulative proportion of pneumonia (%) requiring hospitaladmission in patients with NGT was slightly higher than those with PEG, but did not reach statisticalsignificance, P = 0.671. The cumulative proportion of pneumonia in all three groups (laryngeal,

Nutrients 2019, 11, 2969 6 of 10
pharyngeal, control) in patients with NGT was slightly higher than those with PEG, but it did not reachstatistical significance (P = 0.067, P = 0.345, and P = 0.792, respectively) (Figure 3).
Nutrients 2019, 11, x FOR PEER REVIEW 6 of 10
statistical significance, P = 0.671. The cumulative proportion of pneumonia in all three groups (laryngeal, pharyngeal, control) in patients with NGT was slightly higher than those with PEG, but it did not reach statistical significance (P = 0.067, P = 0.345, and P = 0.792, respectively) (Figure 3).
Figure 3. Cumulative proportion of pneumonia of 3 groups (control, pharyngeal, and laryngeal groups) of percutaneous endoscopic gastrostomy (PEG) versus nasogastric tube (NGT).
The cumulative proportion of pneumonia requiring hospital admission was significantly higher in patients with NGT than in those with PEG for patients combining the pharyngeal and laryngeal groups (P = 0.035), but not for patients in the control group, P = 0.792 (Figure 4).
Figure 4. Cumulative proportion of percutaneous endoscopic gastrostomy (PEG) versus nasogastric tube (NGT) feeding with (pharyngeal + laryngeal groups) and without (control) visual evidence of oropharyngeal dysphagia.
Figure 3. Cumulative proportion of pneumonia of 3 groups (control, pharyngeal, and laryngeal groups)of percutaneous endoscopic gastrostomy (PEG) versus nasogastric tube (NGT).
The cumulative proportion of pneumonia requiring hospital admission was significantly higherin patients with NGT than in those with PEG for patients combining the pharyngeal and laryngealgroups (P = 0.035), but not for patients in the control group, P = 0.792 (Figure 4).
Nutrients 2019, 11, x FOR PEER REVIEW 6 of 10
statistical significance, P = 0.671. The cumulative proportion of pneumonia in all three groups (laryngeal, pharyngeal, control) in patients with NGT was slightly higher than those with PEG, but it did not reach statistical significance (P = 0.067, P = 0.345, and P = 0.792, respectively) (Figure 3).
Figure 3. Cumulative proportion of pneumonia of 3 groups (control, pharyngeal, and laryngeal groups) of percutaneous endoscopic gastrostomy (PEG) versus nasogastric tube (NGT).
The cumulative proportion of pneumonia requiring hospital admission was significantly higher in patients with NGT than in those with PEG for patients combining the pharyngeal and laryngeal groups (P = 0.035), but not for patients in the control group, P = 0.792 (Figure 4).
Figure 4. Cumulative proportion of percutaneous endoscopic gastrostomy (PEG) versus nasogastric tube (NGT) feeding with (pharyngeal + laryngeal groups) and without (control) visual evidence of oropharyngeal dysphagia.
Figure 4. Cumulative proportion of percutaneous endoscopic gastrostomy (PEG) versus nasogastrictube (NGT) feeding with (pharyngeal + laryngeal groups) and without (control) visual evidence oforopharyngeal dysphagia.
4. Discussion
To our knowledge, this is the first study to demonstrate: (a) a significantly higher incidence ofpneumonia in patients with NGT than in PEG for abnormal amounts of pooling secretions accumulationin the pyriform sinus (pharyngeal group) or leak into the laryngeal vestibule (laryngeal groups),(b) a significantly higher risk factor for the pneumonia in patients with NGT than in PEG, and (c)a significantly higher cumulative proportion of pneumonia in patients with NGT than in PEG forpatients in the pharyngeal and laryngeal groups compared to control.
Nutrients 2019, 11, 2969 7 of 10
Traditional diagnosis of oropharyngeal dysphagia is reached by clinical feeding evaluation,along with either fiberoptic endoscopic evaluation of swallow (FEES) or videofluoroscopic evaluationof swallow [26]. Symptoms of oropharyngeal dysphagia include coughing, choking, drooling,and regurgitation when swallowing liquids or solid food [19]. Absence of cough and airway protectiveresponses renders oropharyngeal aspiration difficult to detect [27]. Lack of access to these tools oftenresults in underrating or even neglecting the issue of dysphagia [28]. There is a need for a practical tool,such as UGI endoscopy with pharyngolaryngeal observations, for every patient with long-term tubefeeding who is at risk of aspiration pneumonia. UGI endoscopy with pharyngolaryngeal observationsis modified from FEES and has three advantages over FEES for the patients on long-term tube feeding.
(A) Patients do not need to have sufficient cognitive and physical skills: FEES can be carried outonly when the patient has sufficient cognitive and physical skills to undergo testing with a modifiedtexture of food or liquid [20,29]. UGI endoscopic pharyngolaryngeal observations can be routinely usedfor patients who do not have sufficient cognitive abilities, especially for many tube-feeding patientswith concomitant advanced neurological diseases such as stroke, dementia, and Parkinson’s disease.
(B) Left lateral decubitus vs. upright position: Patients were placed in the left lateral decubitusposition during the UGI endoscopy with pharyngolaryngeal observations, which differs from theupright position with an adjustable chair used in FEES [25,30]. UGI endoscopy provides clinicalinformation closer to the patient’s real-world situations, especially for those patients lying in bed orwith neurological conditions. When patients are placed in the left lateral decubitus position, endoscopicobservation of the accumulated pooling secretions might fill the lowermost area of the right side ofthe pyriform sinus, leak into the laryngeal vestibule or vocal cords, and flow into the left side of thepyriform sinus (Figure 2C,D).
(C) Fasting vs. test foods challenge: Patients were fasted before and during the UGI endoscopywith pharyngolaryngeal observations. FEES requires a feeding challenge with test foods of differentconsistencies. Daily production of 1000–1500 mL of saliva may transiently present in the oral cavity [18].For patients with normal swallowing function, pooling secretions can be minimized by swallowingmultiple times. UGI endoscopy is widely used for diagnosis or treatment for dysphagic patientswho need long-term tube feeding. UGI endoscopic pharyngolaryngeal observations allow for directobservation of abnormal pooling secretions in the pharyngolaryngeal region, and indicate whichpatients may be at the risk for the subsequent development of aspiration pneumonia during long-termtube feeding.
A Cochrane systematic review and meta-analysis of the impact of PEG versus NGT feedingfor 645 adults with swallowing disturbance did not favor PEG for improved pneumonia outcomesdue to high levels of statistical heterogeneity (I2 = 81%) [2]. To address heterogeneity, subgroupanalyses was performed in this study. PEG versus NGT were well-matched in terms of the age, gender,body mass index, serum albumin level, swallowing level scale score, and reasons for tube feeding.Comparing PEG and NGT, we found that the incidence of pneumonia and cumulative proportion ofpneumonia were significantly higher in patients with oropharyngeal dysphagia, but not in patientswithout oropharyngeal dysphagia (control group). This result suggests that risk of pneumonia favorsPEG over NGT in patients with oropharyngeal dysphagia.
The development of aspiration pneumonia depends on the cough reflex, volume and pH levelof aspirated material, and the integrity of the immune system [27]. NGT that passes through thegastroesophageal sphincter may increase gastroesophageal reflux [31] and NGT that passes throughthe upper esophageal sphincter may interfere with the protective cough reflexes, thereby increasingthe risk of aspiration [32–34].
Limitations: First, randomized controlled trials are ideal when comparing interventions, but givenethical and logistical challenges, randomized trials on enteral feeding are unlikely to be performed incurrent clinical practice [35]. Aspiration pneumonia occurs when food, saliva, pharyngeal secretions,or gastric contents are breathed into the lungs [8,36–38]. Therefore, the degree that the aspiration ofcolonized oropharyngeal contents contributes to pneumonia is uncertain [39,40]. It was not possible to

Nutrients 2019, 11, 2969 8 of 10
identify the cause of pneumonia that required admission; rather, it was the reflux of gastric contents ororopharyngeal pooling secretions. Finally, this study was performed at a single tertiary care hospital,so generalizability may be limited due to small sample size. One of this study’s strengths is that thelong follow-up period may help reduce this potential effect.
5. Conclusions
PEG is a better choice for long-term tube feeding compared to NGT due to the decreased risk ofdeveloping pneumonia requiring hospital admission, especially for patients with abnormal amounts ofsecretions accumulation in the pyriform sinus or leak into the laryngeal vestibule. These findings areuseful in the development of clinical guidelines and to inform discussions among health care providers,patients, and family members with regards to long-term feeding methods.
Author Contributions: Conceptualization, W.-K.C. and C.-L.T.; methodology, W.-K.C., H.-H.H. and H.-H.L.;formal analysis, W.-K.C.; resources, W.-K.C.; data curation, W.-K.C., H.-H.H. and H.-H.L.; writing-Original draftpreparation, W.-K.C.; writing-Review and editing, W.-K.C.; project administration, W.-K.C. All authors had accessto the data and played essential roles in writing the manuscript.
Funding: This work was funded by the Tri-Service General Hospital (TSGH-C108-070).
Conflicts of Interest: The authors report no conflict of interest.
References
1. Rowat, A. Enteral tube feeding for dysphagic stroke patients. Br. J. Nurs. 2015, 24, 138. [CrossRef]2. Gomes, C.A., Jr.; Andriolo, R.B.; Bennett, C.; Lustosa, S.A.; Matos, D.; Waisberg, D.R.; Waisberg, J. Percutaneous
endoscopic gastrostomy versus nasogastric tube feeding for adults with swallowing disturbances. CochraneDatabase Syst. Rev. 2015, 5, CD008096. [CrossRef]
3. Stroud, M.; Duncan, H.; Nightingale, J. Guidelines for enteral feeding in adult hospital patients. Gut 2003, 52,vii1–vii12. [CrossRef]
4. Loser, C.; Aschl, G.; Hebuterne, X.; Mathus-Vliegen, E.M.; Muscaritoli, M.; Niv, Y.; Rollins, H.; Singer, P.;Skelly, R.H. ESPEN guidelines on artificial enteral nutrition–percutaneous endoscopic gastrostomy (PEG).Clin. Nutr. 2005, 24, 848–861.
5. Pash, E. Enteral Nutrition: Options for Short-Term Access. Nutr. Clin. Pract. 2018, 33, 170–176. [CrossRef]6. Lin, L.C.; Li, M.H.; Watson, R. A survey of the reasons patients do not chose percutaneous endoscopic
gastrostomy/jejunostomy (PEG/PEJ) as a route for long-term feeding. J. Clin. Nurs. 2011, 20, 802–810.[CrossRef]
7. Mamun, K.; Lim, J. Role of nasogastric tube in preventing aspiration pneumonia in patients with dysphagia.Singap. Med. J. 2005, 46, 627–631.
8. Metheny, N.A.; Schallom, L.; Oliver, D.A.; Clouse, R.E. Gastric residual volume and aspiration in critically illpatients receiving gastric feedings. Am. J. Crit. Care 2008, 17, 512–519.
9. Abuksis, G.; Mor, M.; Plaut, S.; Fraser, G.; Niv, Y. Outcome of percutaneous endoscopic gastrostomy (PEG):Comparison of two policies in a 4-year experience. Clin. Nutr. 2004, 23, 341–346. [CrossRef]
10. Moran, C.; O’Mahony, S. When is feeding via a percutaneous endoscopic gastrostomy indicated? Curr. Opin.Gastroenterol. 2015, 31, 137–142. [CrossRef]
11. Jaafar, M.H.; Mahadeva, S.; Morgan, K.; Tan, M.P. Percutaneous endoscopic gastrostomy versus nasogastricfeeding in older individuals with non-stroke dysphagia: A systematic review. J. Nutr. Health Aging 2015, 19,190–197. [CrossRef] [PubMed]
12. Wang, J.; Liu, M.; Liu, C.; Ye, Y.; Huang, G. Percutaneous endoscopic gastrostomy versus nasogastric tubefeeding for patients with head and neck cancer: A systematic review. J. Radiat. Res. 2014, 55, 559–567.[CrossRef] [PubMed]
13. Almirall, J.; Rofes, L.; Serra-Prat, M.; Icart, R.; Palomera, E.; Arreola, V.; Clave, P. Oropharyngeal dysphagiais a risk factor for community-acquired pneumonia in the elderly. Eur. Respir. J. 2013, 41, 923–928. [CrossRef][PubMed]
14. Masiero, S.; Pierobon, R.; Previato, C.; Gomiero, E. Pneumonia in stroke patients with oropharyngealdysphagia: A six-month follow-up study. Neurol. Sci. 2008, 29, 139–145. [CrossRef] [PubMed]
Nutrients 2019, 11, 2969 9 of 10
15. Sakamoto, T.; Horiuchi, A.; Nakayama, Y. Transnasal endoscopic evaluation of swallowing: A bedsidetechnique to evaluate ability to swallow pureed diets in elderly patients with dysphagia. Can. J. Gastroenterol.2013, 27, 459–462. [CrossRef] [PubMed]
16. Raju, G.S. Value of screening the laryngopharyngeal area during routine upper gastrointestinal endoscopy.Nat. Clin. Pract. Gastroenterol. Hepatol. 2005, 2, 22–23. [CrossRef]
17. Chang, W.K.; Huang, H.H.; Lin, H.H.; Tsai, C.L. Evaluation of Oropharyngeal Dysphagia in Patients WhoUnderwent Percutaneous Endoscopic Gastrostomy: Stratification Risk of Pneumonia. JPEN J. Parenter.Enteral Nutr. 2019. [CrossRef]
18. Scheel, R.; Pisegna, J.M.; McNally, E.; Noordzij, J.P.; Langmore, S.E. Endoscopic Assessment of SwallowingAfter Prolonged Intubation in the ICU Setting. Ann. Otol. Rhinol. Laryngol. 2016, 125, 43–52. [CrossRef]
19. Baijens, L.W.; Clave, P.; Cras, P.; Ekberg, O.; Forster, A.; Kolb, G.F.; Leners, J.C.; Masiero, S.; Mateos-Nozal, J.;Ortega, O.; et al. European Society for Swallowing Disorders—European Union Geriatric Medicine Societywhite paper: Oropharyngeal dysphagia as a geriatric syndrome. Clin. Interv. Aging 2016, 11, 1403–1428.[CrossRef]
20. Neubauer, P.D.; Hersey, D.P.; Leder, S.B. Pharyngeal Residue Severity Rating Scales Based on FiberopticEndoscopic Evaluation of Swallowing: A Systematic Review. Dysphagia 2016, 31, 352–359. [CrossRef]
21. Kim, J.; Oh, B.M.; Kim, J.Y.; Lee, G.J.; Lee, S.A.; Han, T.R. Validation of the videofluoroscopic dysphagia scalein various etiologies. Dysphagia 2014, 29, 438–443. [CrossRef] [PubMed]
22. Teasell, R.W.; McRae, M.; Marchuk, Y.; Finestone, H.M. Pneumonia associated with aspiration followingstroke. Arch. Phys. Med. Rehabil. 1996, 77, 707–709. [CrossRef]
23. Neubauer, P.D.; Rademaker, A.W.; Leder, S.B. The Yale Pharyngeal Residue Severity Rating Scale: AnAnatomically Defined and Image-Based Tool. Dysphagia 2015, 30, 521–528. [CrossRef] [PubMed]
24. Murray, J.; Langmore, S.E.; Ginsberg, S.; Dostie, A. The significance of accumulated oropharyngeal secretionsand swallowing frequency in predicting aspiration. Dysphagia 1996, 11, 99–103. [CrossRef] [PubMed]
25. Farneti, D.; Fattori, B.; Nacci, A.; Mancini, V.; Simonelli, M.; Ruoppolo, G.; Genovese, E. The Pooling-score(P-score): Inter- and intra-rater reliability in endoscopic assessment of the severity of dysphagia.Acta Otorhinolaryngol. Ital. 2014, 34, 105–110. [PubMed]
26. Ortega, O.; Martin, A.; Clave, P. Diagnosis and Management of Oropharyngeal Dysphagia Among OlderPersons, State of the Art. J. Am. Med. Dir. Assoc. 2017, 18, 576–582. [CrossRef]
27. Marik, P.E. Aspiration pneumonitis and aspiration pneumonia. N. Engl. J. Med. 2001, 344, 665–671. [CrossRef]28. Dziewas, R.; Beck, A.M.; Clave, P.; Hamdy, S.; Heppner, H.J.; Langmore, S.E.; Leischker, A.; Martino, R.;
Pluschinski, P.; Roesler, A.; et al. Recognizing the importance of dysphagia: Stumbling blocks and steppingstones in the twenty-first century. Dysphagia 2017, 32, 78–82. [CrossRef]
29. Granell, J.; Garrido, L.; Millas, T.; Gutierrez-Fonseca, R. Management of oropharyngeal Dysphagia inlaryngeal and hypopharyngeal cancer. Int. J. Otolaryngol. 2012, 2012, 157630. [CrossRef]
30. Srivanitchapoom, P.; Pandey, S.; Hallett, M. Drooling in Parkinson’s disease: A review. Parkinsonism Relat.Disord. 2014, 20, 1109–1118. [CrossRef]
31. Satou, Y.; Oguro, H.; Murakami, Y.; Onoda, K.; Mitaki, S.; Hamada, C.; Mizuhara, R.; Yamaguchi, S.Gastroesophageal reflux during enteral feeding in stroke patients: A 24-hour esophageal pH-monitoringstudy. J. Stroke Cerebrovasc. Dis. 2013, 22, 185–189. [CrossRef] [PubMed]
32. Dziewas, R.; Warnecke, T.; Hamacher, C.; Oelenberg, S.; Teismann, I.; Kraemer, C.; Ritter, M.; Ringelstein, E.B.;Schaebitz, W.R. Do nasogastric tubes worsen dysphagia in patients with acute stroke? BMC Neurol. 2008, 8,28. [CrossRef] [PubMed]
33. Wang, Z.Y.; Chen, J.M.; Ni, G.X. Effect of an indwelling nasogastric tube on swallowing function in elderlypost-stroke dysphagia patients with long-term nasal feeding. BMC Neurol. 2019, 19, 83. [CrossRef] [PubMed]
34. Gomes, G.F.; Pisani, J.C.; Macedo, E.D.; Campos, A.C. The nasogastric feeding tube as a risk factor foraspiration and aspiration pneumonia. Curr. Opin. Clin. Nutr. Metab. Care 2003, 6, 327–333. [CrossRef]
35. Dennis, M.S.; Lewis, S.C.; Warlow, C.; Collaboration, F.T. Effect of timing and method of enteral tube feedingfor dysphagic stroke patients (FOOD): A multicentre randomised controlled trial. Lancet 2005, 365, 764–772.[CrossRef]
36. Carrion, S.; Cabre, M.; Monteis, R.; Roca, M.; Palomera, E.; Serra-Prat, M.; Rofes, L.; Clave, P. Oropharyngealdysphagia is a prevalent risk factor for malnutrition in a cohort of older patients admitted with an acutedisease to a general hospital. Clin. Nutr. 2015, 34, 436–442. [CrossRef]

Nutrients 2019, 11, 2969 10 of 10
37. Pinto, G.; Zetola, V.; Lange, M.; Gomes, G.; Nunes, M.C.; Hirata, G.; Lagos-Guimaraes, H.N. Program todiagnose probability of aspiration pneumonia in patients with ischemic stroke. Int. Arch. Otorhinolaryngol.2014, 18, 244–248. [CrossRef]
38. Komiya, K.; Rubin, B.K.; Kadota, J.I.; Mukae, H.; Akaba, T.; Moro, H.; Aoki, N.; Tsukada, H.; Noguchi, S.;Shime, N.; et al. Prognostic implications of aspiration pneumonia in patients with community acquiredpneumonia: A systematic review with meta-analysis. Sci. Rep. 2016, 6, 38097. [CrossRef]
39. Weir, K.A.; McMahon, S.; Taylor, S.; Chang, A.B. Oropharyngeal aspiration and silent aspiration in children.Chest 2011, 140, 589–597. [CrossRef]
40. Lee, J.S.; Collard, H.R.; Raghu, G.; Sweet, M.P.; Hays, S.R.; Campos, G.M.; Golden, J.A.; King, T.E., Jr. Doeschronic microaspiration cause idiopathic pulmonary fibrosis? Am. J. Med. 2010, 123, 304–311. [CrossRef]
© 2019 by the authors. Licensee MDPI, Basel, Switzerland. This article is an open accessarticle distributed under the terms and conditions of the Creative Commons Attribution(CC BY) license (http://creativecommons.org/licenses/by/4.0/).