correlation of splenic arfi with endoscopic findings of ...
155
“CORRELATION OF SPLENIC ARFI WITH ENDOSCOPIC FINDINGS OF ESOPHAGEAL VARICES IN CHRONIC LIVER PARENCHYMAL DISEASE” DISSERTATION SUBMITTED TO THE TAMIL NADU Dr. M.G.R MEDICAL UNIVERSITY, CHENNAI IN PARTIAL FULFILLMENT OF THE REGULATIONS FOR THE AWARD OF DEGREE OF M.D IN RADIODIAGNOSIS. BY DR. MUTHUSUBRAMANIAN.R GUIDE: DR. RAJA KUMAR.R DEPARTMENT OF RADIOLOGY PSG INSTITUTE OF MEDICAL SCIENCES AND RESEARCH PEELAMEDU, COIMBATORE – 641004 TAMILNADU, INDIA “CORRELATION OF SPLENIC ARFI WITH ENDOSCOPIC
-
Upload
khangminh22 -
Category
Documents
-
view
0 -
download
0
Transcript of correlation of splenic arfi with endoscopic findings of ...
“CORRELATION OF SPLENIC ARFI WITH ENDOSCOPIC
FINDINGS OF ESOPHAGEAL VARICES IN
CHRONIC LIVER PARENCHYMAL DISEASE”
DISSERTATION SUBMITTED TO
THE TAMIL NADU Dr. M.G.R MEDICAL UNIVERSITY, CHENNAI
IN PARTIAL FULFILLMENT OF THE REGULATIONS FOR THE
AWARD OF DEGREE OF M.D IN RADIODIAGNOSIS.
BY
DR. MUTHUSUBRAMANIAN.R
GUIDE: DR. RAJA KUMAR.R
DEPARTMENT OF RADIOLOGY
PSG INSTITUTE OF MEDICAL SCIENCES AND RESEARCH
PEELAMEDU, COIMBATORE – 641004
TAMILNADU, INDIA
“CORRELATION OF SPLENIC ARFI WITH ENDOSCOPIC
FINDINGS OF ESOPHAGEAL VARICES IN
CHRONIC LIVER PARENCHYMAL DISEASE”
DISSERTATION SUBMITTED TO
THE TAMIL NADU Dr. M.G.R MEDICAL UNIVERSITY, CHENNAI
IN PARTIAL FULFILLMENT OF THE REGULATIONS FOR THE
AWARD OF DEGREE OF M.D IN RADIODIAGNOSIS.
BY
DR. MUTHUSUBRAMANIAN.R
GUIDE: DR. RAJA KUMAR.R
DEPARTMENT OF RADIOLOGY
PSG INSTITIUTE OF MEDICAL SCIENCES AND RESEASRCH
PEELAMEDU, COIMBATORE – 641004
TAMILNADU, INDIA
CERTIFICATE BY THE GUIDE
This is to certify that the dissertation entitled “CORRELATION OF
SPLENIC ARFI WITH ENDOSCOPIC FINDINGS OF ESOPHAGEAL
VARICES IN CHRONIC LIVER PARENCHYMAL DISEASE” is the
bonafide original work of Dr. Muthusubramanian.R in the department
of Radiodiagnosis, PSG Institute of Medical Sciences and Research,
Coimbatore in partial fulfillment of the regulations for the award of
degree of M.D in Radiodiagnosis.
Signature of the guide
Dr. Raja Kumar.R, D.M.R.D., D.N.B
Associate professor,
Department of Radiodiagnosis,
PSGIMSR,
COIMBATORE.
CERTIFICATE
PSG INSTITIUTE OF MEDICAL SCIENCES
AND RESEASRCH, COIMBATORE
This is to certify that the dissertation entitled “CORRELATION OF
SPLENIC ARFI WITH ENDOSCOPIC FINDINGS OF ESOPHAGEAL
VARICES IN CHRONIC LIVER PARENCHYMAL DISEASE” is the
bonafide original work of Dr. Muthusubramanian.R in the department
of Radiodiagnosis, PSG Institute of Medical Sciences and Research,
Coimbatore in partial fulfillment of the regulations for the award of
degree of M.D in Radiodiagnosis.
Dr. Devanand .B, Dr. Ramalingam .S
Professor and HOD, Principal, Department of Radiodiagnosis, PSG IMS & R, PSG IMS & R, Coimbatore.
Coimbatore.
Place: Coimbatore
Date: 16.10.17
DECLARATION
I, Dr. Muthusubramanian .R solemnly declare that the
dissertation titled “CORRELATION OF SPLENIC ARFI WITH
ENDOSCOPIC FINDINGS OF ESOPHAGEAL VARICES IN CHRONIC
LIVER PARENCHYMAL DISEASE” was done by me at the department
of Radiodiagnosis, PSG Institute of Medical Sciences and Research,
Coimbatore during the period from December 2015 to September 2017
under the guidance and supervision of Dr. Raja Kumar .R, Associate
Professor, Department of Radio Diagnosis, PSG Institute of Medical
Sciences and Research, Coimbatore. This dissertation is submitted to the
Tamilnadu Dr.M.G.R. Medical University towards the partial fulfillment
of the requirement for the award of M.D. Degree in Radiodiagnosis.
I have not submitted this dissertation on any previous occasion to
any University for the award of any degree.
Place: Coimbatore Dr.Muthusubramanian .R
Date: 16.10.2017
ACKNOWLEDGEMENT Foremost, I would like to express my sincere gratitude to my professor and HOD
Dr. Devanand .B and my guide Dr. Raja Kumar .R for their ever friendly co-
operation which was present throughout the preparation of this work. This work
would not have been possible without their guidance, support and encouragement,
they were always been a key inspiration to me.
I would like to thank Dr. Ramalingam .S, Principal of PSG Institute of Medical
Sciences and Research for providing me with this opportunity and resources to
accomplish my research work.
I would like to thank and express my sincere gratitude to Dr. Devanand .B, HOD,
Prof Dr. Elango .N and Dr. Maheshwaran .V, Assistant Professor for providing me
the motivation, guidance in completing my research work and helping me with the
statistical analysis. They were very supportive right from the beginning to the final
stages of my research work and helping me battle minor indifferences and
providing me with valuable practical tips which were extremely helpful in
completing the work.
I would like to extend my heartfelt thanks to Dr. Venkatakrishnan .L, Professor
and Head, Department of Medical Gastroenterology and Dr. Krishnaveni .J,
Professor, Department of Medical Gastroenterology for helping me in providing
endoscopic findings and making consensus decisions on few challenging cases.
I would like to thank my fellow postgraduates and my dear friends for their
immense help and support during the entire period of my study and for making my
college life unforgettable.
My special thanks to my friend Dr. Karthikeyan for helping me in statistics and in
framing and formulating my thesis. He have helped me in various aspects of the
study and have aided me in completion of my thesis work.
Last, but not least, I would like to express my heartfelt gratitude to all the patients
who had participated in this study. Finally my sincere thanks and gratitude to the
associate professors, assistant professors, senior residents, staff and office people
for their immense support for carrying out and completing this work.
I dedicate this whole dissertation and all years of hard work to my Family and God
Almighty.
PLAGIARISM CERTIFICATE
This is to certify that this dissertation work titled
“CORRELATION OF SPLENIC ARFI WITH ENDOSCOPIC
FINDINGS OF ESOPHAGEAL VARICES IN CHRONIC
LIVER PARENCHYMAL DISEASE” of the candidate
Dr. Muthusubramanian .R with registration number 201518102 for
the award of M.D degree in the branch of Radiodiagnosis.
I personally verified the urkund.com website for the purpose of
Plagiarism check. I found that the uploaded thesis file contains
introduction to conclusion pages and result shows 1 % of plagiarism in
the dissertation.
Signature of the guide
Dr. Raja Kumar.R, D.M.R.D., D.N.B
Associate professor,
Department of Radiodiagnosis,
PSGIMSR,
COIMBATORE.
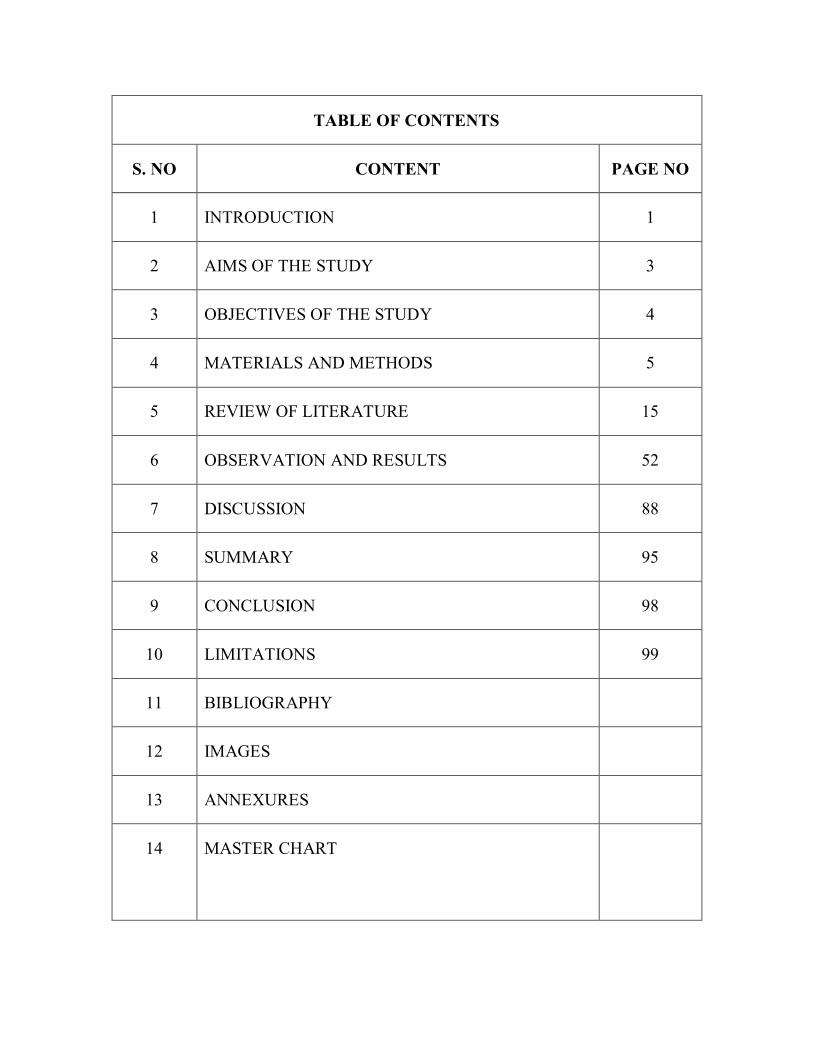
TABLE OF CONTENTS
S. NO CONTENT PAGE NO
1 INTRODUCTION 1
2 AIMS OF THE STUDY 3
3 OBJECTIVES OF THE STUDY 4
4 MATERIALS AND METHODS 5
5 REVIEW OF LITERATURE 15
6 OBSERVATION AND RESULTS 52
7 DISCUSSION 88
8 SUMMARY 95
9 CONCLUSION 98
10 LIMITATIONS 99
11 BIBLIOGRAPHY
12 IMAGES
13 ANNEXURES
14 MASTER CHART
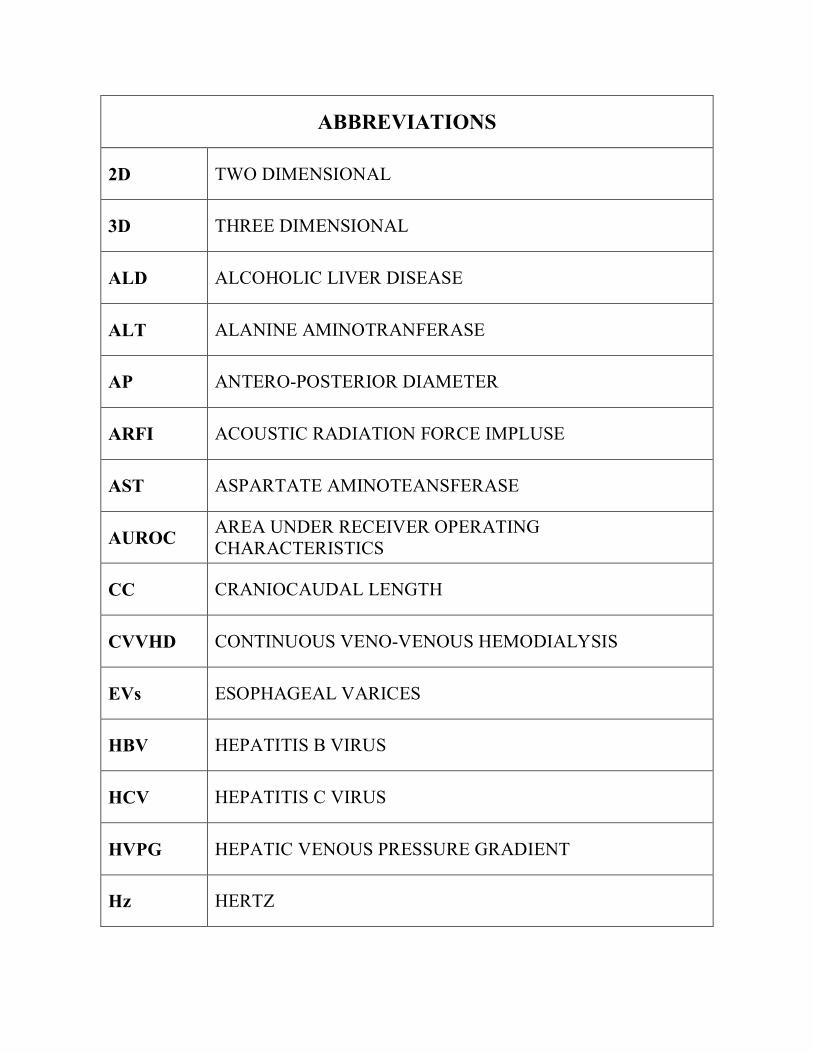
ABBREVIATIONS
2D TWO DIMENSIONAL
3D THREE DIMENSIONAL
ALD ALCOHOLIC LIVER DISEASE
ALT ALANINE AMINOTRANFERASE
AP ANTERO-POSTERIOR DIAMETER
ARFI ACOUSTIC RADIATION FORCE IMPLUSE
AST ASPARTATE AMINOTEANSFERASE
AUROC AREA UNDER RECEIVER OPERATING CHARACTERISTICS
CC CRANIOCAUDAL LENGTH
CVVHD CONTINUOUS VENO-VENOUS HEMODIALYSIS
EVs ESOPHAGEAL VARICES
HBV HEPATITIS B VIRUS
HCV HEPATITIS C VIRUS
HVPG HEPATIC VENOUS PRESSURE GRADIENT
Hz HERTZ
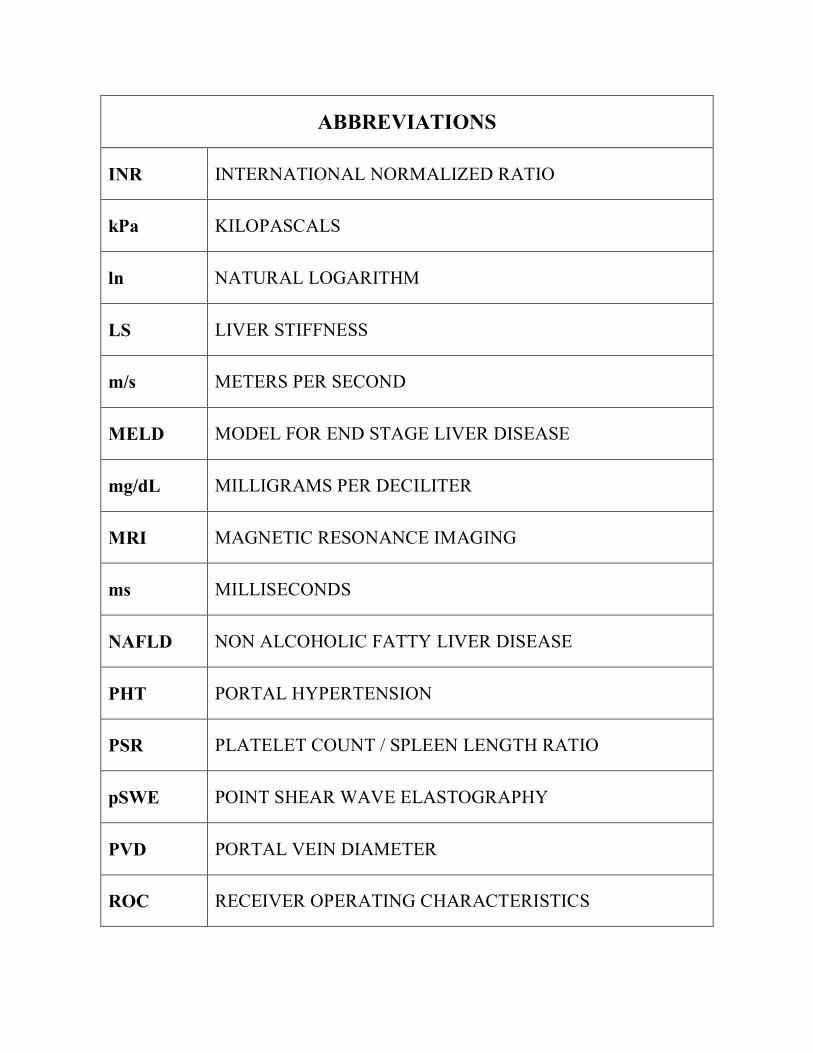
ABBREVIATIONS
INR INTERNATIONAL NORMALIZED RATIO
kPa KILOPASCALS
ln NATURAL LOGARITHM
LS LIVER STIFFNESS
m/s METERS PER SECOND
MELD MODEL FOR END STAGE LIVER DISEASE
mg/dL MILLIGRAMS PER DECILITER
MRI MAGNETIC RESONANCE IMAGING
ms MILLISECONDS
NAFLD NON ALCOHOLIC FATTY LIVER DISEASE
PHT PORTAL HYPERTENSION
PSR PLATELET COUNT / SPLEEN LENGTH RATIO
pSWE POINT SHEAR WAVE ELASTOGRAPHY
PVD PORTAL VEIN DIAMETER
ROC RECEIVER OPERATING CHARACTERISTICS
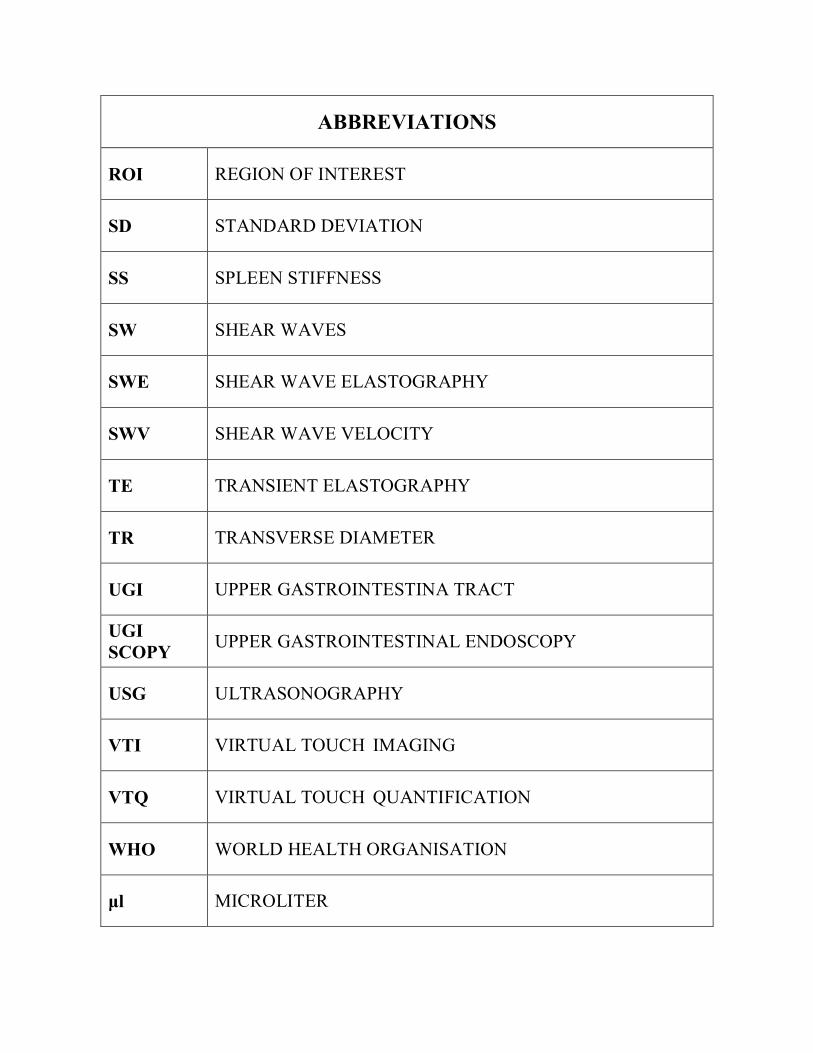
ABBREVIATIONS
ROI REGION OF INTEREST
SD STANDARD DEVIATION
SS SPLEEN STIFFNESS
SW SHEAR WAVES
SWE SHEAR WAVE ELASTOGRAPHY
SWV SHEAR WAVE VELOCITY
TE TRANSIENT ELASTOGRAPHY
TR TRANSVERSE DIAMETER
UGI UPPER GASTROINTESTINA TRACT
UGI SCOPY UPPER GASTROINTESTINAL ENDOSCOPY
USG ULTRASONOGRAPHY
VTI VIRTUAL TOUCH IMAGING
VTQ VIRTUAL TOUCH QUANTIFICATION
WHO WORLD HEALTH ORGANISATION
μl MICROLITER
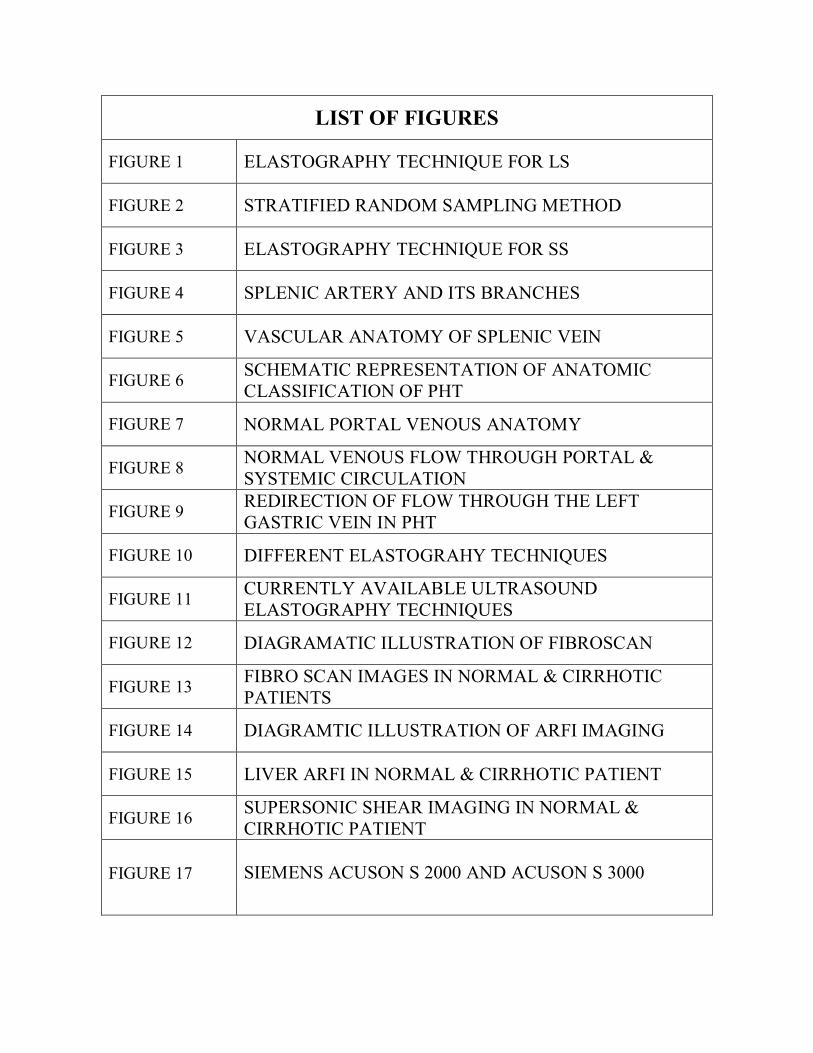
LIST OF FIGURES
FIGURE 1 ELASTOGRAPHY TECHNIQUE FOR LS
FIGURE 2 STRATIFIED RANDOM SAMPLING METHOD
FIGURE 3 ELASTOGRAPHY TECHNIQUE FOR SS
FIGURE 4 SPLENIC ARTERY AND ITS BRANCHES
FIGURE 5 VASCULAR ANATOMY OF SPLENIC VEIN
FIGURE 6 SCHEMATIC REPRESENTATION OF ANATOMIC CLASSIFICATION OF PHT
FIGURE 7 NORMAL PORTAL VENOUS ANATOMY
FIGURE 8 NORMAL VENOUS FLOW THROUGH PORTAL & SYSTEMIC CIRCULATION
FIGURE 9 REDIRECTION OF FLOW THROUGH THE LEFT GASTRIC VEIN IN PHT
FIGURE 10 DIFFERENT ELASTOGRAHY TECHNIQUES
FIGURE 11 CURRENTLY AVAILABLE ULTRASOUND ELASTOGRAPHY TECHNIQUES
FIGURE 12 DIAGRAMATIC ILLUSTRATION OF FIBROSCAN
FIGURE 13 FIBRO SCAN IMAGES IN NORMAL & CIRRHOTIC PATIENTS
FIGURE 14 DIAGRAMTIC ILLUSTRATION OF ARFI IMAGING
FIGURE 15 LIVER ARFI IN NORMAL & CIRRHOTIC PATIENT
FIGURE 16 SUPERSONIC SHEAR IMAGING IN NORMAL & CIRRHOTIC PATIENT
FIGURE 17 SIEMENS ACUSON S 2000 AND ACUSON S 3000
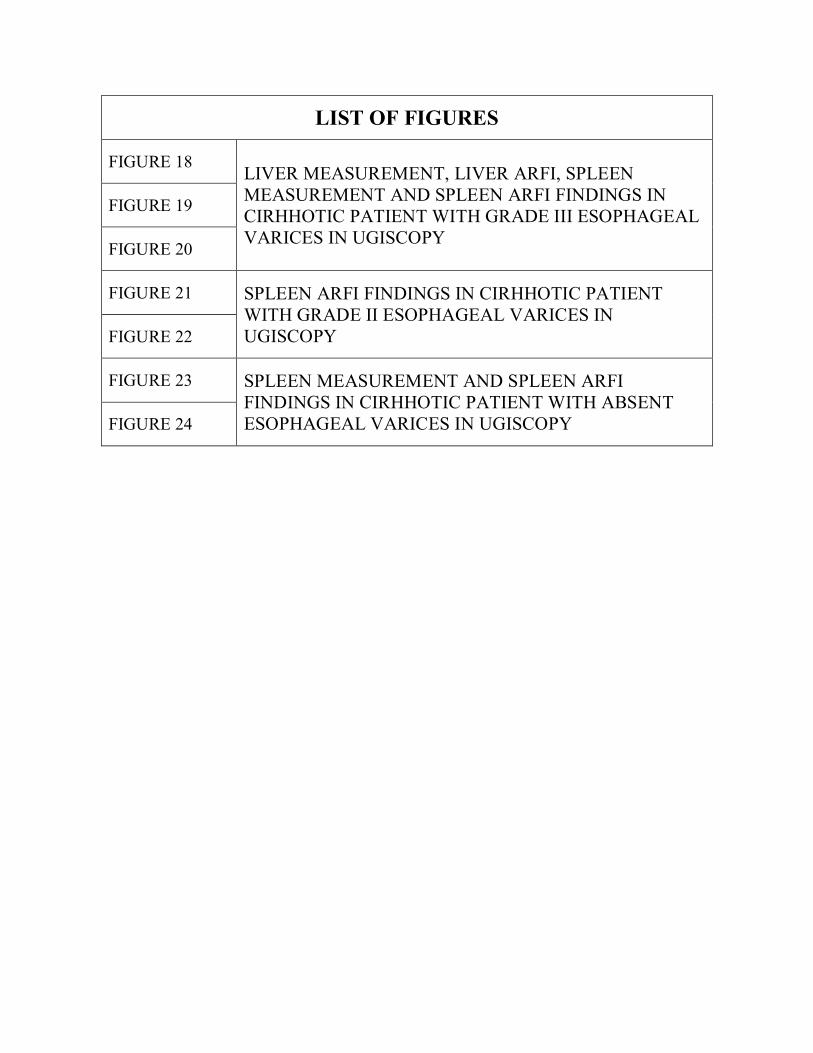
LIST OF FIGURES
FIGURE 18 LIVER MEASUREMENT, LIVER ARFI, SPLEEN MEASUREMENT AND SPLEEN ARFI FINDINGS IN CIRHHOTIC PATIENT WITH GRADE III ESOPHAGEAL VARICES IN UGISCOPY
FIGURE 19
FIGURE 20
FIGURE 21 SPLEEN ARFI FINDINGS IN CIRHHOTIC PATIENT WITH GRADE II ESOPHAGEAL VARICES IN UGISCOPY FIGURE 22
FIGURE 23 SPLEEN MEASUREMENT AND SPLEEN ARFI FINDINGS IN CIRHHOTIC PATIENT WITH ABSENT ESOPHAGEAL VARICES IN UGISCOPY FIGURE 24

LIST OF TABLES
TABLE 1 SEX DISTRIBUTION IN CIRRHOTICS WITH EVs
TABLE 2 SEX DISTRIBUTION IN CIRRHOTICS WITHOUT EVs
TABLE 3 ETIOLOGY DISTRIBUTION IN CIRRHOTICS WITH EVs
TABLE 4 ETIOLOGY DISTRIBUTION IN CIRRHOTICS WITHOUT EVs
TABLE 5 CHILD PUGH CLASS IN CIRRHOTICS WITH EVs
TABLE 6 CHILD PUGH CLASS IN CIRRHOTICS WITHOUT EVs
TABLE 7 MELD SCORE IN CIRRHOTICS WITH EVs
TABLE 8 MELD SCORE IN CIRRHOTICS WITHOUT EVs
TABLE 9 PLATELET COUNT IN CIRRHOTICS WITH EVs
TABLE 10 PLATELET COUNT IN CIRRHOTICS WITHOUT EVs
TABLE 11 AST / ALT RATIO IN CIRRHOTICS WITH EVs
TABLE 12 AST / ALT RATIO IN CIRRHOTICS WITHOUT EVs
TABLE 13 PVD IN CIRRHOTICS WITH EVS
TABLE 14 PVD IN CIRRHOTICS WITHOUT EVS
TABLE 15 PV FLOW VELOCITY IN CIRRHOTICS WITH EVs
LIST OF TABLES
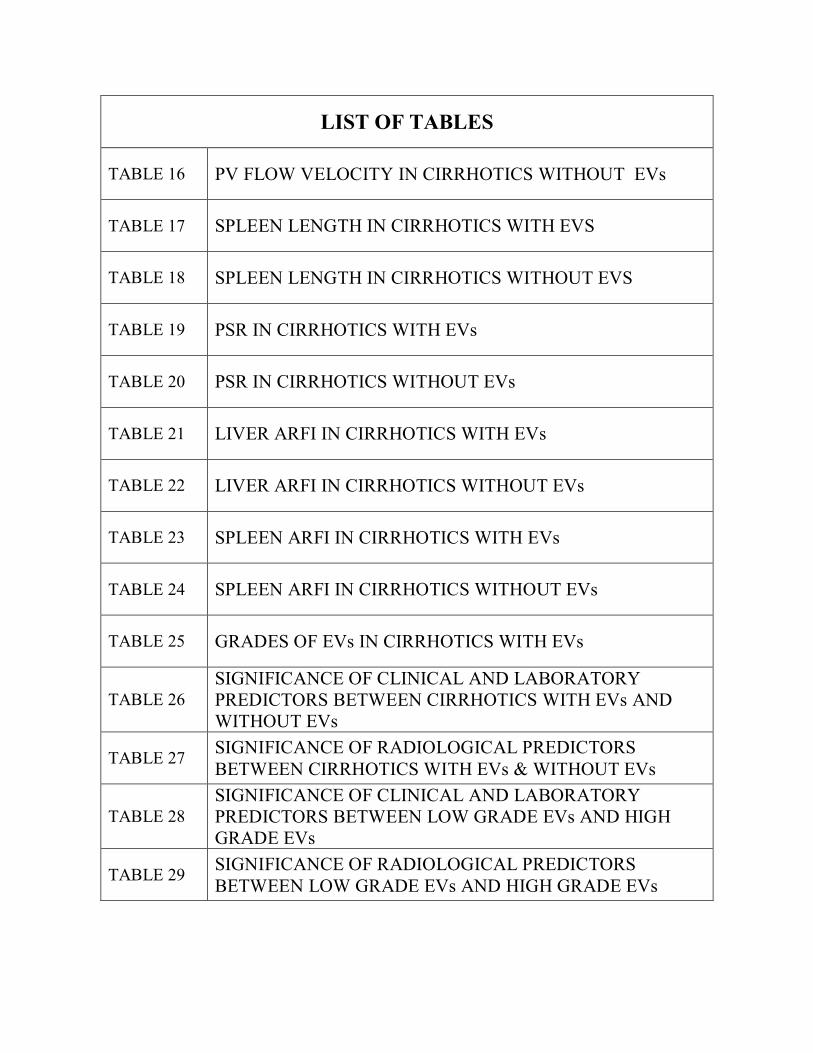
TABLE 16 PV FLOW VELOCITY IN CIRRHOTICS WITHOUT EVs
TABLE 17 SPLEEN LENGTH IN CIRRHOTICS WITH EVS
TABLE 18 SPLEEN LENGTH IN CIRRHOTICS WITHOUT EVS
TABLE 19 PSR IN CIRRHOTICS WITH EVs
TABLE 20 PSR IN CIRRHOTICS WITHOUT EVs
TABLE 21 LIVER ARFI IN CIRRHOTICS WITH EVs
TABLE 22 LIVER ARFI IN CIRRHOTICS WITHOUT EVs
TABLE 23 SPLEEN ARFI IN CIRRHOTICS WITH EVs
TABLE 24 SPLEEN ARFI IN CIRRHOTICS WITHOUT EVs
TABLE 25 GRADES OF EVs IN CIRRHOTICS WITH EVs
TABLE 26 SIGNIFICANCE OF CLINICAL AND LABORATORY PREDICTORS BETWEEN CIRRHOTICS WITH EVs AND WITHOUT EVs
TABLE 27 SIGNIFICANCE OF RADIOLOGICAL PREDICTORS BETWEEN CIRRHOTICS WITH EVs & WITHOUT EVs
TABLE 28 SIGNIFICANCE OF CLINICAL AND LABORATORY PREDICTORS BETWEEN LOW GRADE EVs AND HIGH GRADE EVs
TABLE 29 SIGNIFICANCE OF RADIOLOGICAL PREDICTORS BETWEEN LOW GRADE EVs AND HIGH GRADE EVs
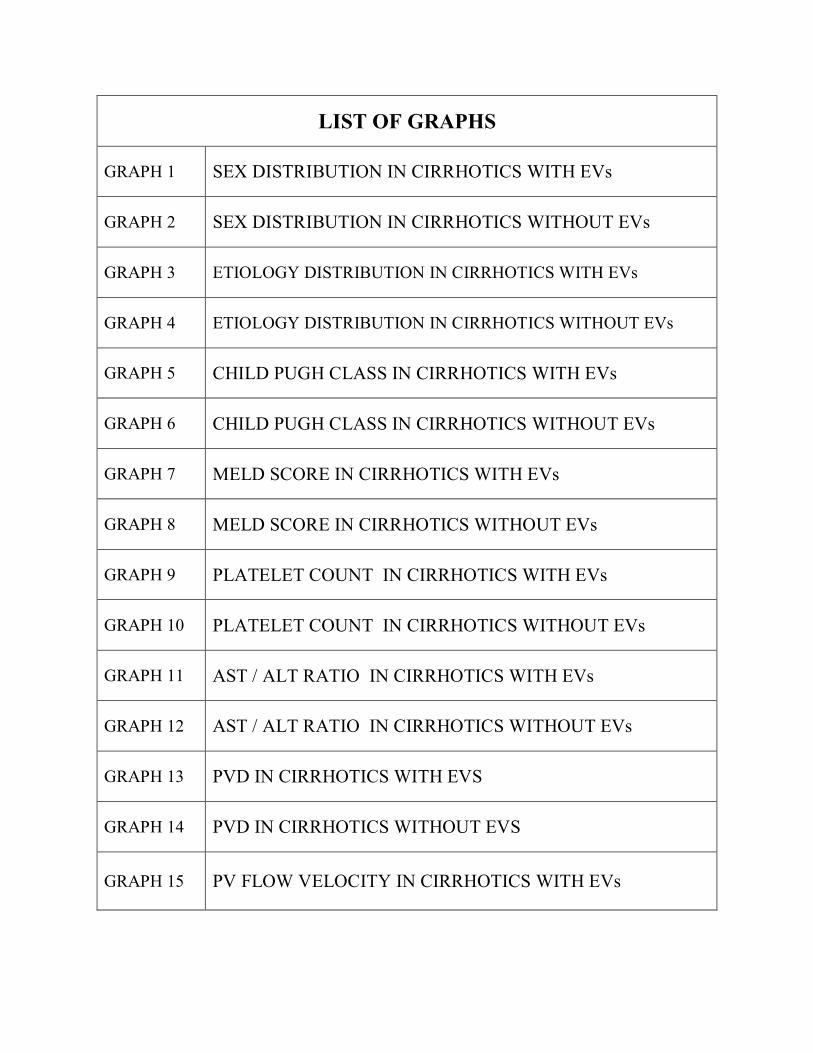
LIST OF GRAPHS
GRAPH 1 SEX DISTRIBUTION IN CIRRHOTICS WITH EVs
GRAPH 2 SEX DISTRIBUTION IN CIRRHOTICS WITHOUT EVs
GRAPH 3 ETIOLOGY DISTRIBUTION IN CIRRHOTICS WITH EVs
GRAPH 4 ETIOLOGY DISTRIBUTION IN CIRRHOTICS WITHOUT EVs
GRAPH 5 CHILD PUGH CLASS IN CIRRHOTICS WITH EVs
GRAPH 6 CHILD PUGH CLASS IN CIRRHOTICS WITHOUT EVs
GRAPH 7 MELD SCORE IN CIRRHOTICS WITH EVs
GRAPH 8 MELD SCORE IN CIRRHOTICS WITHOUT EVs
GRAPH 9 PLATELET COUNT IN CIRRHOTICS WITH EVs
GRAPH 10 PLATELET COUNT IN CIRRHOTICS WITHOUT EVs
GRAPH 11 AST / ALT RATIO IN CIRRHOTICS WITH EVs
GRAPH 12 AST / ALT RATIO IN CIRRHOTICS WITHOUT EVs
GRAPH 13 PVD IN CIRRHOTICS WITH EVS
GRAPH 14 PVD IN CIRRHOTICS WITHOUT EVS
GRAPH 15 PV FLOW VELOCITY IN CIRRHOTICS WITH EVs
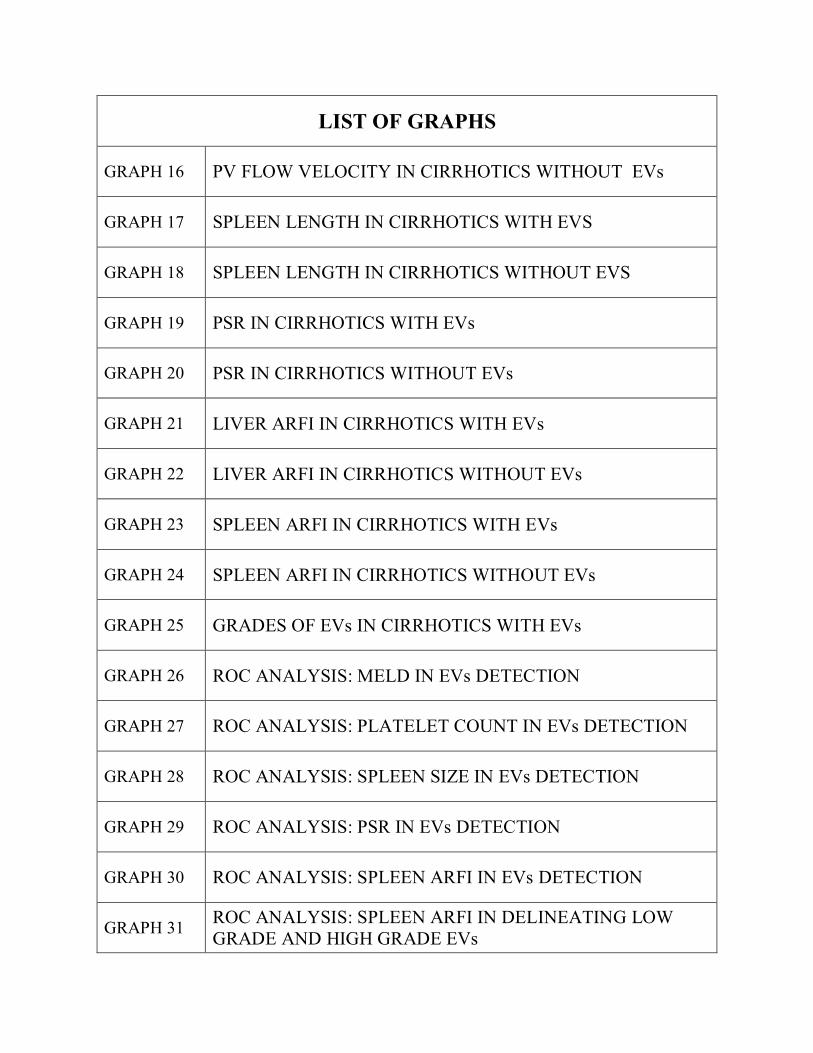
LIST OF GRAPHS
GRAPH 16 PV FLOW VELOCITY IN CIRRHOTICS WITHOUT EVs
GRAPH 17 SPLEEN LENGTH IN CIRRHOTICS WITH EVS
GRAPH 18 SPLEEN LENGTH IN CIRRHOTICS WITHOUT EVS
GRAPH 19 PSR IN CIRRHOTICS WITH EVs
GRAPH 20 PSR IN CIRRHOTICS WITHOUT EVs
GRAPH 21 LIVER ARFI IN CIRRHOTICS WITH EVs
GRAPH 22 LIVER ARFI IN CIRRHOTICS WITHOUT EVs
GRAPH 23 SPLEEN ARFI IN CIRRHOTICS WITH EVs
GRAPH 24 SPLEEN ARFI IN CIRRHOTICS WITHOUT EVs
GRAPH 25 GRADES OF EVs IN CIRRHOTICS WITH EVs
GRAPH 26 ROC ANALYSIS: MELD IN EVs DETECTION
GRAPH 27 ROC ANALYSIS: PLATELET COUNT IN EVs DETECTION
GRAPH 28 ROC ANALYSIS: SPLEEN SIZE IN EVs DETECTION
GRAPH 29 ROC ANALYSIS: PSR IN EVs DETECTION
GRAPH 30 ROC ANALYSIS: SPLEEN ARFI IN EVs DETECTION
GRAPH 31 ROC ANALYSIS: SPLEEN ARFI IN DELINEATING LOW GRADE AND HIGH GRADE EVs
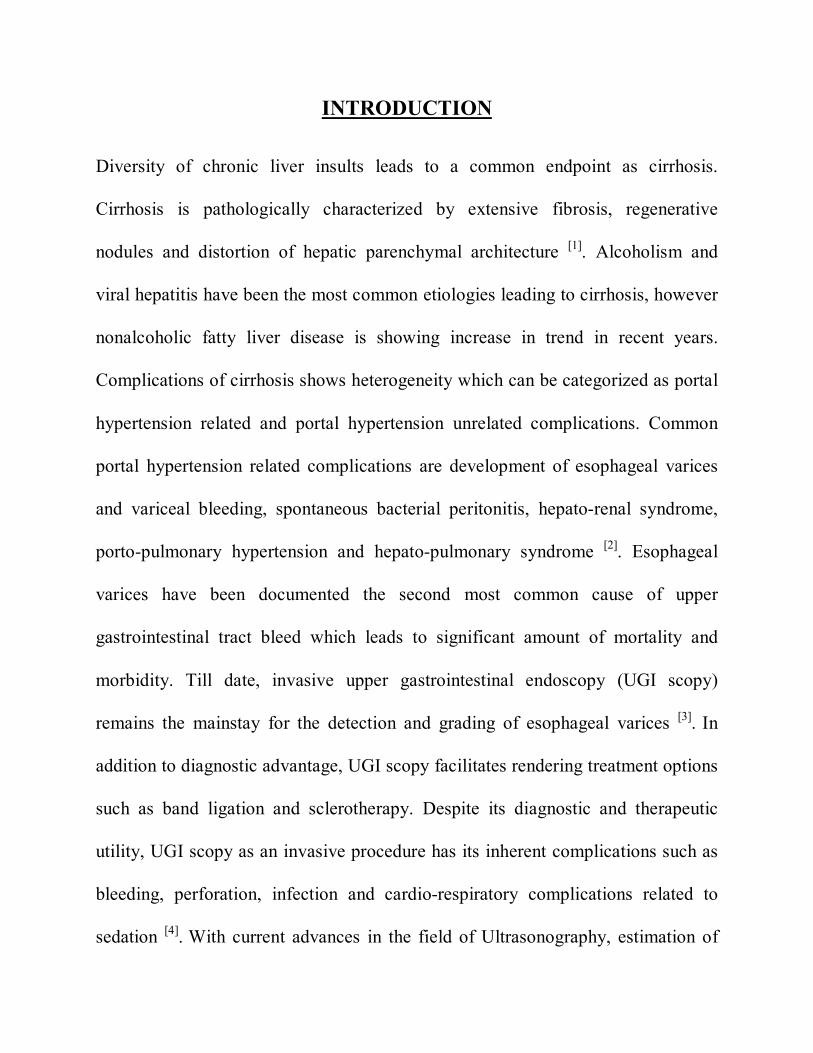
INTRODUCTION
Diversity of chronic liver insults leads to a common endpoint as cirrhosis.
Cirrhosis is pathologically characterized by extensive fibrosis, regenerative
nodules and distortion of hepatic parenchymal architecture [1]. Alcoholism and
viral hepatitis have been the most common etiologies leading to cirrhosis, however
nonalcoholic fatty liver disease is showing increase in trend in recent years.
Complications of cirrhosis shows heterogeneity which can be categorized as portal
hypertension related and portal hypertension unrelated complications. Common
portal hypertension related complications are development of esophageal varices
and variceal bleeding, spontaneous bacterial peritonitis, hepato-renal syndrome,
porto-pulmonary hypertension and hepato-pulmonary syndrome [2]. Esophageal
varices have been documented the second most common cause of upper
gastrointestinal tract bleed which leads to significant amount of mortality and
morbidity. Till date, invasive upper gastrointestinal endoscopy (UGI scopy)
remains the mainstay for the detection and grading of esophageal varices [3]. In
addition to diagnostic advantage, UGI scopy facilitates rendering treatment options
such as band ligation and sclerotherapy. Despite its diagnostic and therapeutic
utility, UGI scopy as an invasive procedure has its inherent complications such as
bleeding, perforation, infection and cardio-respiratory complications related to
sedation [4]. With current advances in the field of Ultrasonography, estimation of
elasticity of the tissue is made possible with Elastography. It is an ultrasonographic
analogue of manual palpation, based on the principle that pathology changes the
stiffness of the tissue. Shear Wave Elastography (SWE) is a technique of
elastography that uses “shear wave” generated within tissue secondary to the
acoustic push, the so called Acoustic Radiation Force Impluse (ARFI). In this
technique as no external compression is required and as a push impulse can be
directed anywhere, it is possible to attain a fine elastogram of entire pancreas.
Additionally, quantification of elasticity of particular region of interest based on
shear wave velocity (SWV) is possible [5]. Elasticity of the spleen will be decreased
in cirrhosis due to portal venous congestion and hyperplasia of splenic tissue;
hence the splenic stiffness will be increased. Portal venous congestion ensues in
the formation of porto-systemic collateral network. Esophageal varices are formed
due to blood pooling in the varicoid submucosal veins due to shunting of blood
from left gastric vein to azygos vein and superior vena cava via para esophageal
and esophageal veins [6]. Screening UGI scopy is recommended in all cirrhotic
patients in accordance with recent guidelines and primary prophylaxis against
variceal hemorrhage is called for, if indicated [7]. Implementing these guidelines is
confronted with cost, complications and invasiveness of UGI scopy. Henceforth, it
necessitates accurate and noninvasive methods for detecting and grading the
severity of esophageal varices.
AIMS OF THE STUDY
To evaluate splenic ARFI as a noninvasive tool for detection of esophageal
varices in chronic liver parenchymal disease
To assess the utility of splenic ARFI in differentiating low grade and high
grade esophageal varices
OBJECTIVES OF THE STUDY
PRIMARY OBJECTIVE:
To determine the utility of splenic ARFI as a non-invasive predictor of
esophageal varices
SECONDARY OBJECTIVE:
To evaluate the efficiency of splenic ARFI in delineating low grade and high
grade esophageal varices
To correlate the ability of splenic ARFI vs other proposed noninvasive
predictors in detection of esophageal varices
MATERIALS AND METHODS
STUDY DESIGN : Prospective case control study
STUDY PERIOD : January 2016 to February 2017
STUDY PLACE : Department of Radiodiagnosis, PSG Institute of Medical
Sciences and Research, Peelamedu, Coimbatore
SOURCE OF DATA : The present study comprised of patients presenting with
clinical / radiological features of chronic liver
parenchymal disease who underwent screening UGI
scopy for detection of esophageal varices
SAMPLE SIZE : Total of 100 patients with clinical / radiological features
of chronic liver parenchymal disease were included in
this study
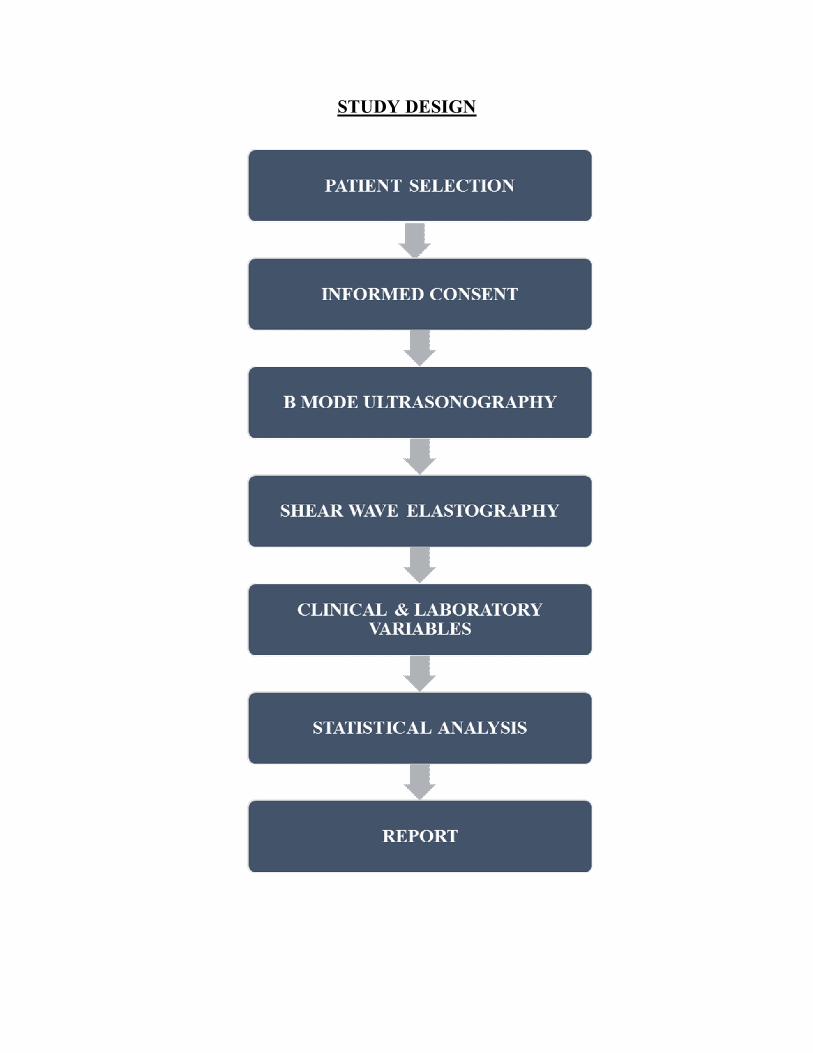
STUDY DESIGN
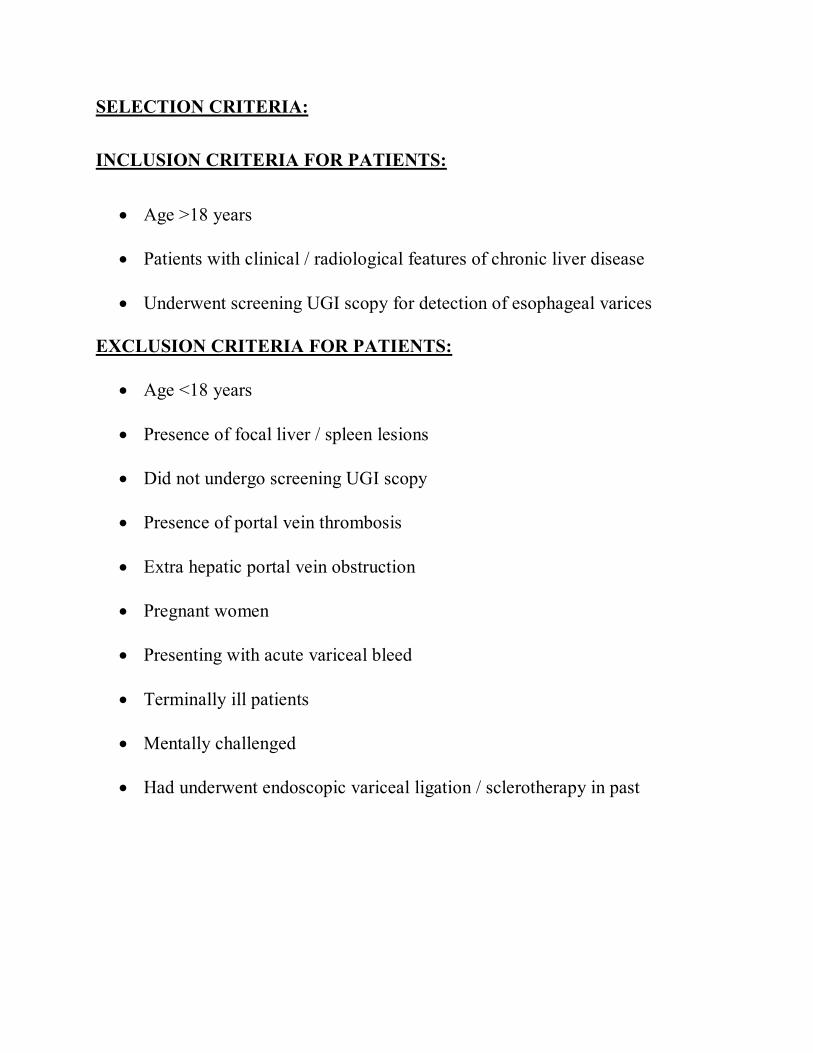
SELECTION CRITERIA:
INCLUSION CRITERIA FOR PATIENTS:
Age >18 years
Patients with clinical / radiological features of chronic liver disease
Underwent screening UGI scopy for detection of esophageal varices
EXCLUSION CRITERIA FOR PATIENTS:
Age <18 years
Presence of focal liver / spleen lesions
Did not undergo screening UGI scopy
Presence of portal vein thrombosis
Extra hepatic portal vein obstruction
Pregnant women
Presenting with acute variceal bleed
Terminally ill patients
Mentally challenged
Had underwent endoscopic variceal ligation / sclerotherapy in past
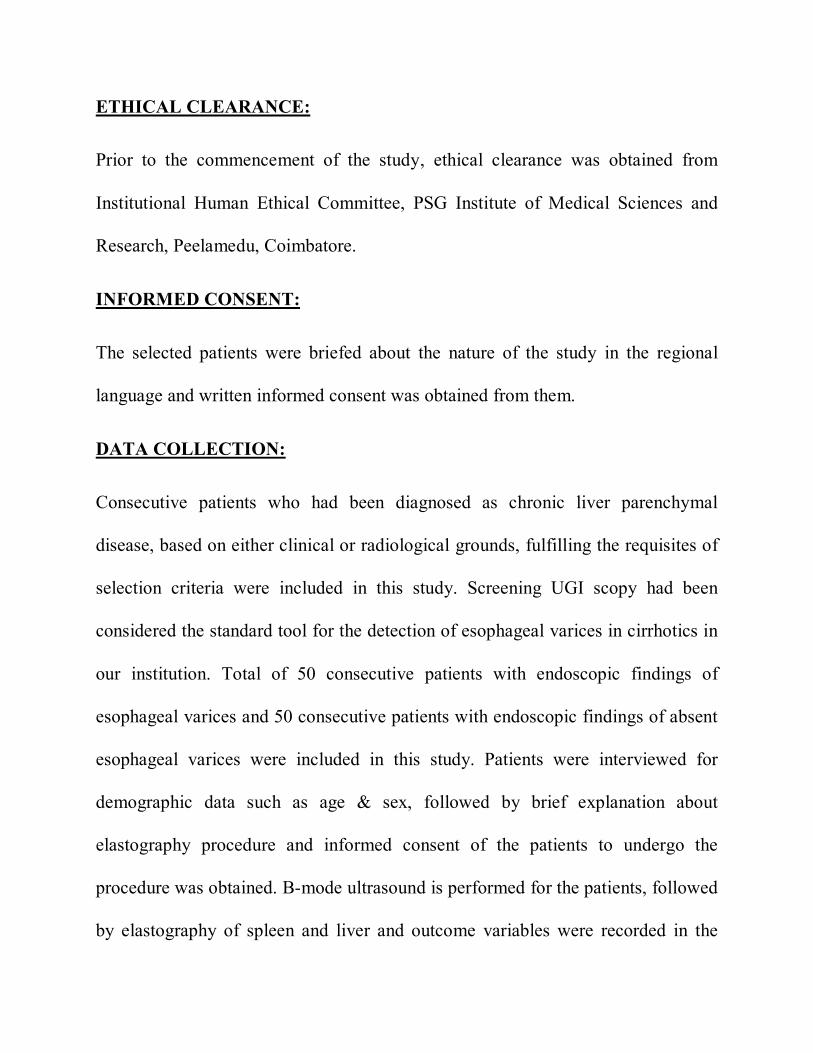
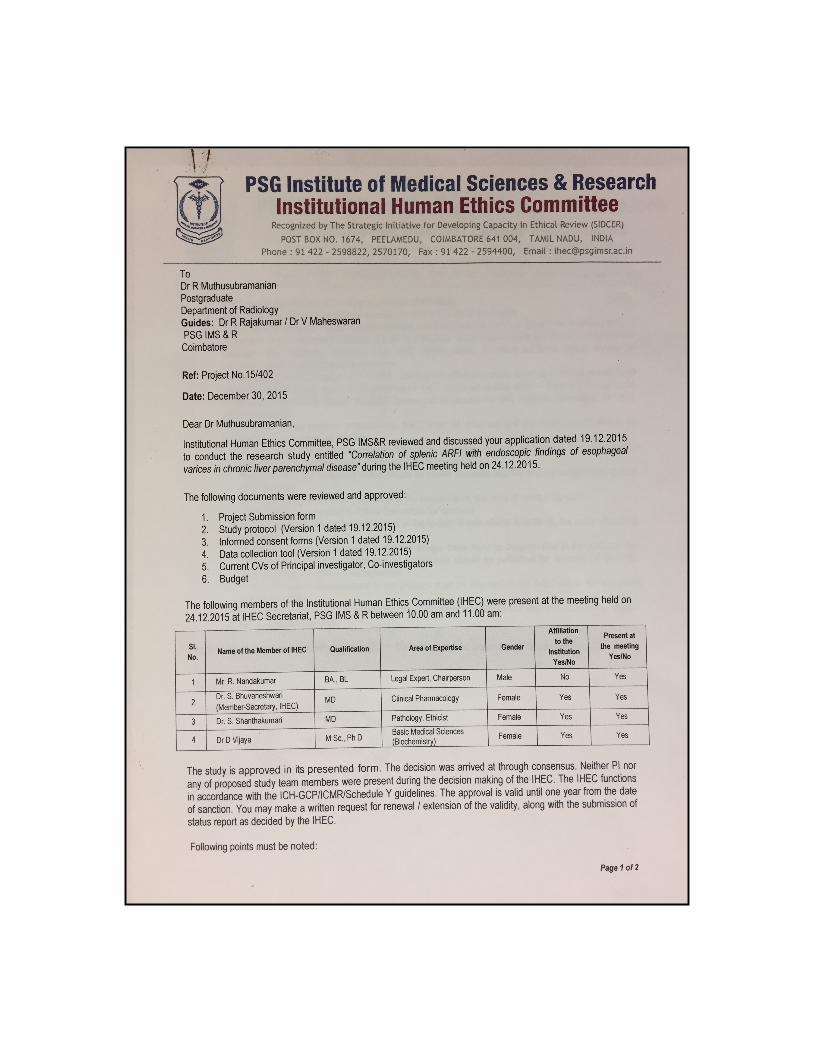
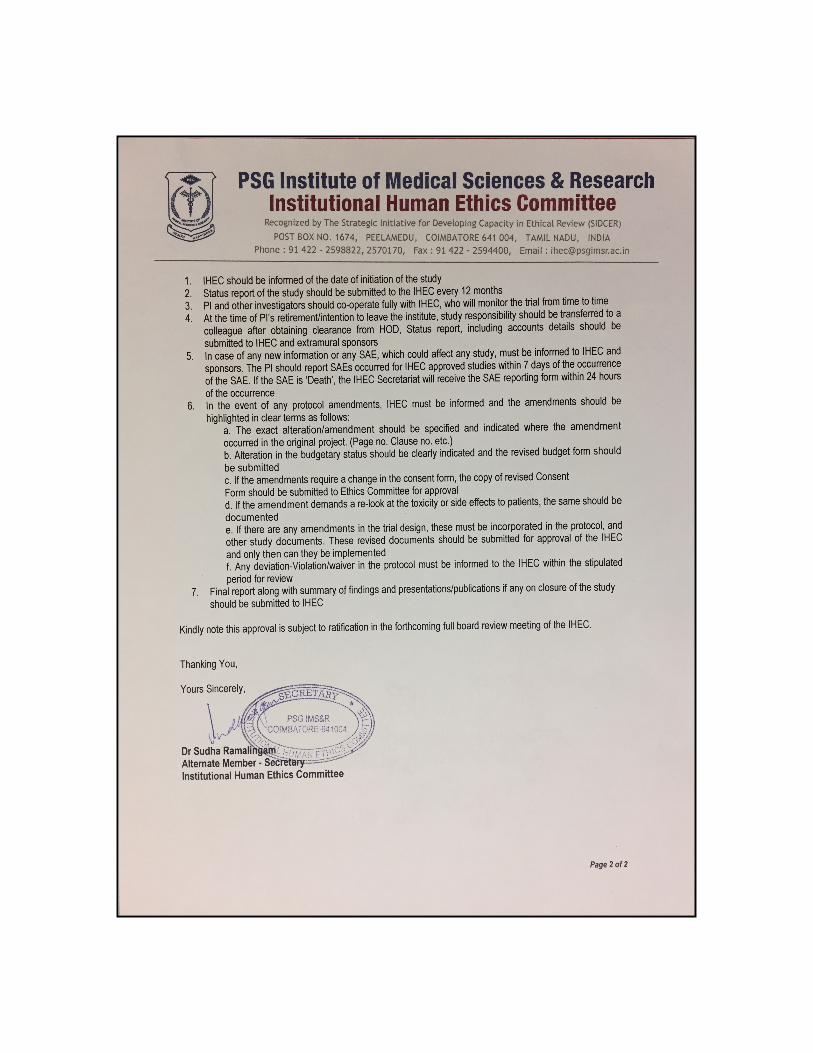
ETHICAL CLEARANCE:
Prior to the commencement of the study, ethical clearance was obtained from
Institutional Human Ethical Committee, PSG Institute of Medical Sciences and
Research, Peelamedu, Coimbatore.
INFORMED CONSENT:
The selected patients were briefed about the nature of the study in the regional
language and written informed consent was obtained from them.
DATA COLLECTION:
Consecutive patients who had been diagnosed as chronic liver parenchymal
disease, based on either clinical or radiological grounds, fulfilling the requisites of
selection criteria were included in this study. Screening UGI scopy had been
considered the standard tool for the detection of esophageal varices in cirrhotics in
our institution. Total of 50 consecutive patients with endoscopic findings of
esophageal varices and 50 consecutive patients with endoscopic findings of absent
esophageal varices were included in this study. Patients were interviewed for
demographic data such as age & sex, followed by brief explanation about
elastography procedure and informed consent of the patients to undergo the
procedure was obtained. B-mode ultrasound is performed for the patients, followed
by elastography of spleen and liver and outcome variables were recorded in the
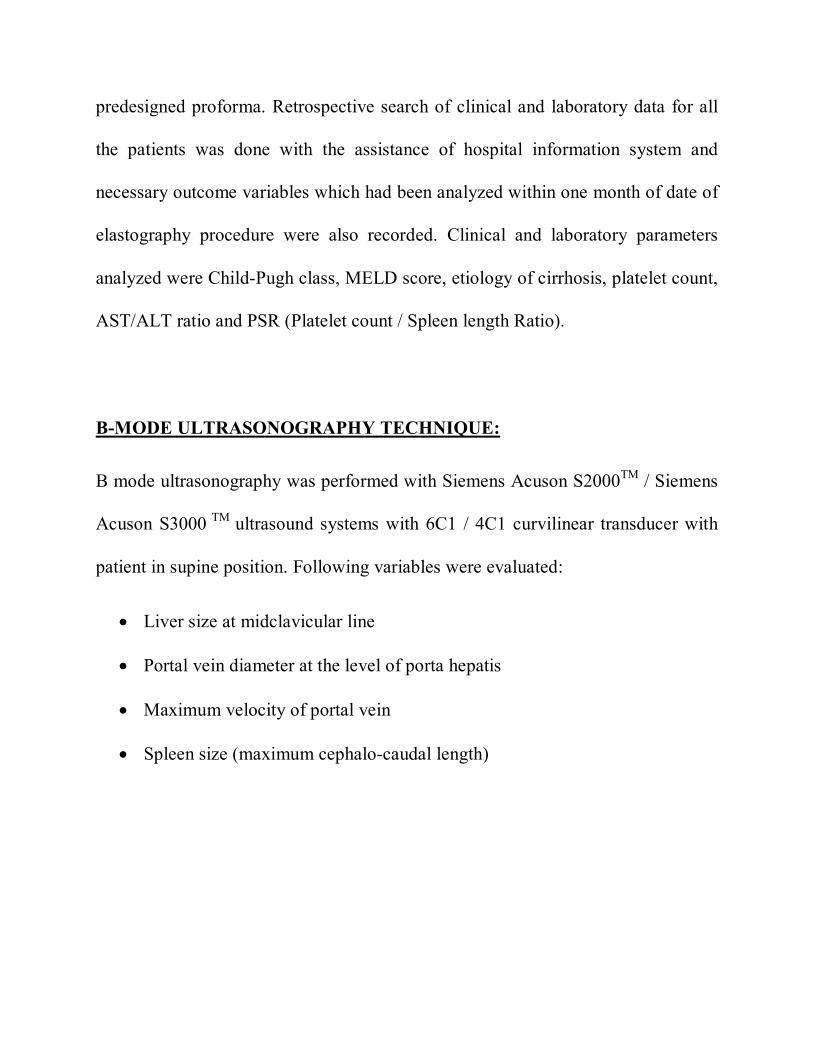
predesigned proforma. Retrospective search of clinical and laboratory data for all
the patients was done with the assistance of hospital information system and
necessary outcome variables which had been analyzed within one month of date of
elastography procedure were also recorded. Clinical and laboratory parameters
analyzed were Child-Pugh class, MELD score, etiology of cirrhosis, platelet count,
AST/ALT ratio and PSR (Platelet count / Spleen length Ratio).
B-MODE ULTRASONOGRAPHY TECHNIQUE:
B mode ultrasonography was performed with Siemens Acuson S2000TM / Siemens
Acuson S3000 TM ultrasound systems with 6C1 / 4C1 curvilinear transducer with
patient in supine position. Following variables were evaluated:
Liver size at midclavicular line
Portal vein diameter at the level of porta hepatis
Maximum velocity of portal vein
Spleen size (maximum cephalo-caudal length)
ELASTOGRAPHY TECHNIQUE:
PRINCIPLES OF ARFI:
It was performed with Siemens Acuson S2000TM / Siemens Acuson S3000 TM
ultrasound systems with ARFI enabled 6C1 / 4C1 curvilinear transducer. Shear
Wave Elastography (SWE) is a technique of elastography that uses “shear wave”
generated within tissue secondary to the acoustic push, the so called “Acoustic
Radiation Force Impluse” (ARFI). ARFI has two Virtual touch TM implementations
by Siemens Virtual Touch TM Quantification (VTQ) and Virtual Touch TM Imaging
(VTI). VTI obtains grey scale maps representing the 'hardness' or 'softness' of the
tissue on a grey scale map. VTQ shows the stiffness of target tissue within the ROI
digitally by measuring shear wave velocity (SWV), thus providing a quantitative,
objective, reproducible and comparable value. Spleen stiffness (SS) and liver
stiffness (LS) were assessed by means of shear wave elastography (ARFI - VTQ).
On performing VTQ, the tissue within the region of interest (ROI) identified on B
mode is excited mechanically using acoustic pulses for a short duration (<1ms) in
turn producing localized displacement of the tissue (1-10 micron) without any
external compression. Localized tissue displacement will generate acoustic shear
waves (SW). Data regarding the acoustic shear waves (SW) which are generated,
propagated and received are then framed into a function of Young’s modulus[8,9,10].
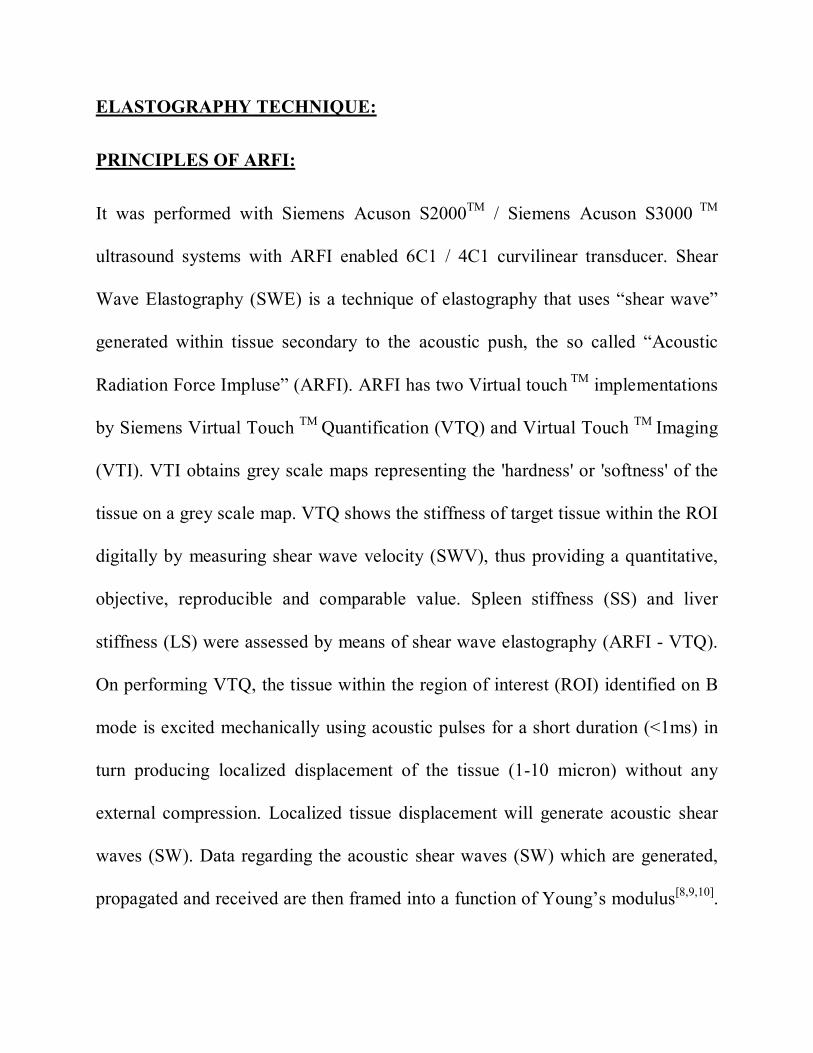
Values of this function represents the Shear wave velocity (m/s) which is the
measure of peak displacement, which is directly proportional to the tissue stiffness.
LIVER ARFI TECHNIQUE:
For the LS evaluation, patient was lying in left lateral decubitus position and
assessment was done in right lobe of liver by intercostal approach. In breath hold
position, region of interest measuring 10mm in depth and 5mm in width is placed
>1 cm below the level of liver capsule, in parenchyma devoid of visible blood
vessels and biliary channels and ARFI evaluation was done (Figure 1). 5 ARFI
values for each segment (V, VI, VII and VIII) in right lobe of liver were obtained.
Mean and median of total 20 ARFI measurements was automatically calculated
and expressed in meters per second (m/s). Only mean ARFI values are considered
for analysis. Henceforth, liver ARFI in this text represents mean liver ARFI.
FIGURE 1: ELASTOGRAPHY TECHNIQUE FOR LS
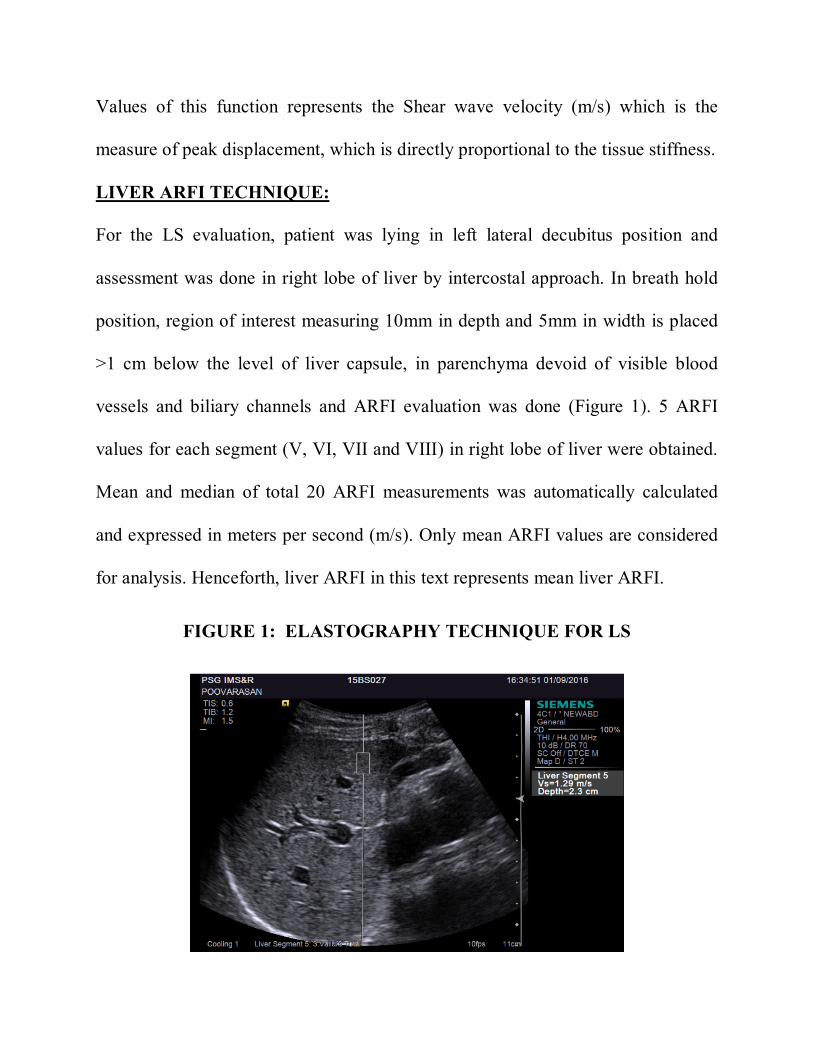
SPLEEN ARFI TECHNIQUE:
For the SS evaluation, patient was lying in right lateral decubitus position and
assessment was done by intercostal approach. In order to cover uniformly the
spleen, we adopted the stratified random sampling method used in the previous
studies (11) (Figure 2). Spleen will be subdivided into cranial external(1), cranial
central(2), cranial internal(1), intermediate external(1), intermediate central(1),
intermediate internal(1), caudal external(1), caudal central(1) and caudal internal
(1) segments. Numbers in the parenthesis represents the number of ARFI values
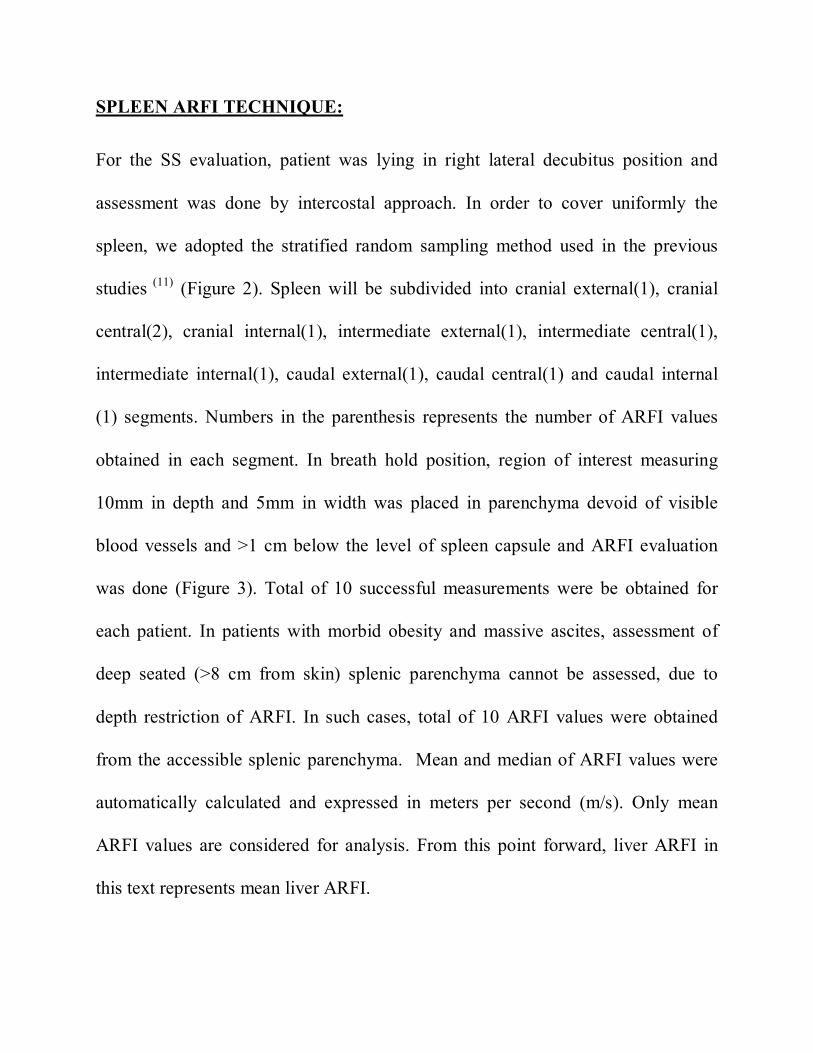
obtained in each segment. In breath hold position, region of interest measuring
10mm in depth and 5mm in width was placed in parenchyma devoid of visible
blood vessels and >1 cm below the level of spleen capsule and ARFI evaluation
was done (Figure 3). Total of 10 successful measurements were be obtained for
each patient. In patients with morbid obesity and massive ascites, assessment of
deep seated (>8 cm from skin) splenic parenchyma cannot be assessed, due to
depth restriction of ARFI. In such cases, total of 10 ARFI values were obtained
from the accessible splenic parenchyma. Mean and median of ARFI values were
automatically calculated and expressed in meters per second (m/s). Only mean
ARFI values are considered for analysis. From this point forward, liver ARFI in
this text represents mean liver ARFI.
FIGURE 2: STRATIFIED RANDOM SAMPLING METHOD [11]
FIGURE 3: ELASTOGRAPHY TECHNIQUE FOR SS
STATISTICAL ANALYSIS:
The data obtained was coded and entered in Microsoft Excel Spreadsheet. Data
was analyzed using SPSS version 20.0 statistical software. Categorical variables
were expressed as percentages and the comparative analysis was done using chi-
square test or Fischer exact test. Continuous variables were expressed as mean ±
standard deviation (SD) and the comparative analysis was done by independent
sample ‘t’ test. The receiver operating characteristics (ROC) curve was plotted and
the area under the curve was determined to the cut off points for statistically
significant variables. A probability value (p value) of less than or equal to 0.05 at
95% confidence interval was considered as statistically significant.
REVIEW OF LITERATURE
EMBRYOLOGY OF SPLEEN:
Spleen is one of the important organ of hematological and reticulo-endothelial
systems. It begins to develop in utero by fifth week of gestation. Mesenchymal cell
mass in mesogastrium coalesce together to form spleen. As the development
progresses, with intestinal rotation, greater curvature of stomach rotates to the left
and the spleen is carried along with it into the left upper quadrant [12].
MORPHOLOGICAL ANATOMY OF SPLEEN:
It is a wedge shaped organ, situated in the left hypochondrial niche formed by
stomach, diaphragm, chest wall, left kidney and phrenico-colic ligament. It is a
highly vascular organ with varying size and weight from person to person. Average
adult splenic dimensions are 12.5, 7.5 and 2.5cms. (CC, TR, AP respectively).
Morphologically, spleen has two poles (superior & inferior), three borders and two
surfaces. It is surrounded by thin capsule. Peritoneum completely covers the
spleen, except for the hilum, where splenic vessels and nerve pass through and
serves as attachment site for supporting ligaments (Gastrosplenic and
Splenorenal).[13]
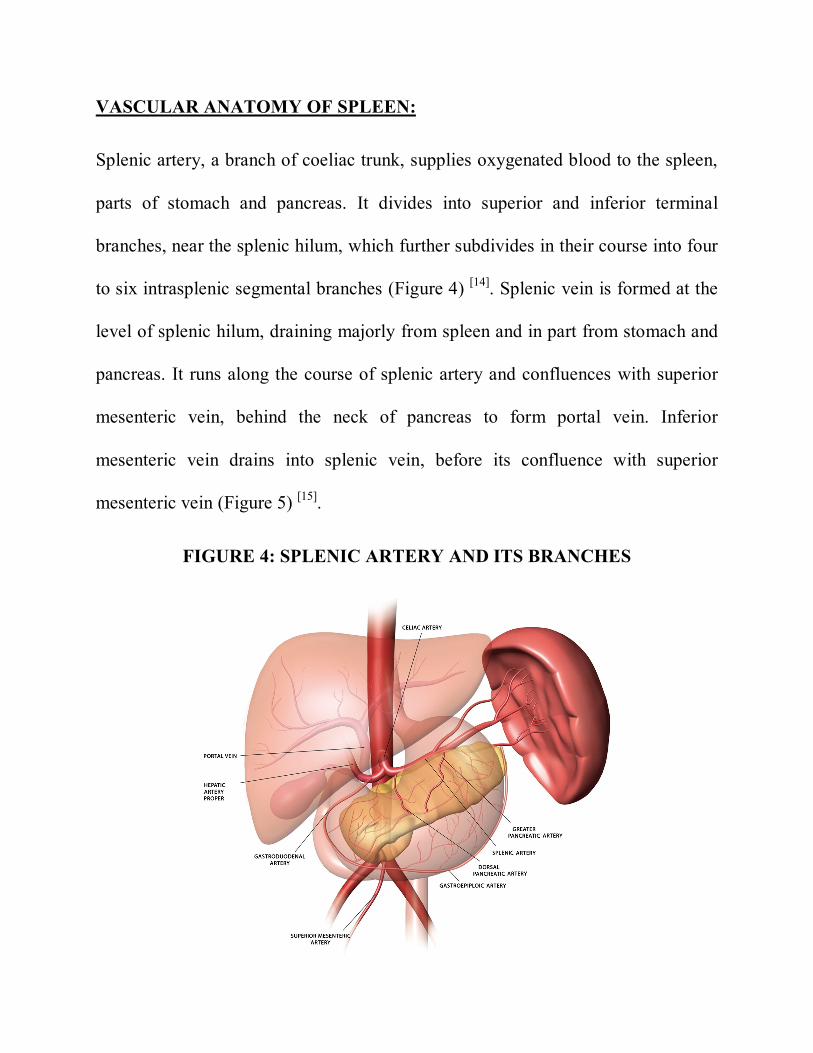
VASCULAR ANATOMY OF SPLEEN:
Splenic artery, a branch of coeliac trunk, supplies oxygenated blood to the spleen,
parts of stomach and pancreas. It divides into superior and inferior terminal
branches, near the splenic hilum, which further subdivides in their course into four
to six intrasplenic segmental branches (Figure 4) [14]. Splenic vein is formed at the
level of splenic hilum, draining majorly from spleen and in part from stomach and
pancreas. It runs along the course of splenic artery and confluences with superior
mesenteric vein, behind the neck of pancreas to form portal vein. Inferior
mesenteric vein drains into splenic vein, before its confluence with superior
mesenteric vein (Figure 5) [15].
FIGURE 4: SPLENIC ARTERY AND ITS BRANCHES
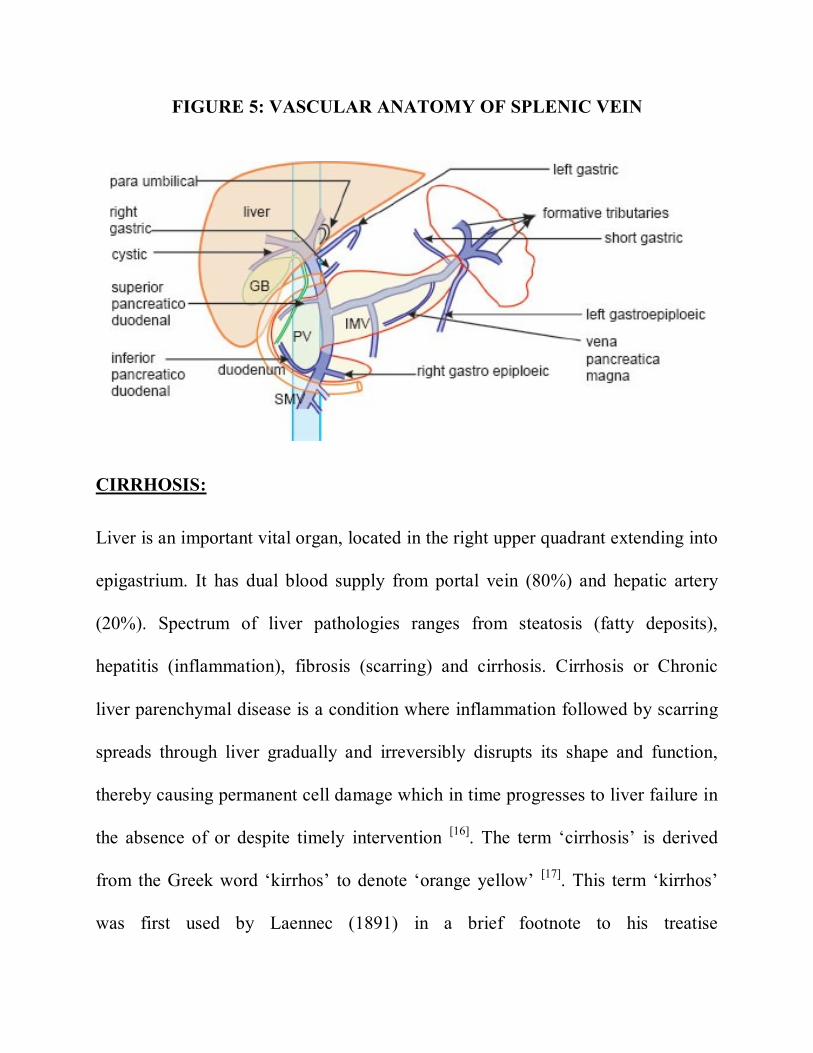
FIGURE 5: VASCULAR ANATOMY OF SPLENIC VEIN
CIRRHOSIS:
Liver is an important vital organ, located in the right upper quadrant extending into
epigastrium. It has dual blood supply from portal vein (80%) and hepatic artery
(20%). Spectrum of liver pathologies ranges from steatosis (fatty deposits),
hepatitis (inflammation), fibrosis (scarring) and cirrhosis. Cirrhosis or Chronic
liver parenchymal disease is a condition where inflammation followed by scarring
spreads through liver gradually and irreversibly disrupts its shape and function,
thereby causing permanent cell damage which in time progresses to liver failure in
the absence of or despite timely intervention [16]. The term ‘cirrhosis’ is derived
from the Greek word ‘kirrhos’ to denote ‘orange yellow’ [17]. This term ‘kirrhos’
was first used by Laennec (1891) in a brief footnote to his treatise
De auscultation mediate [18]. According to World Health Organization (WHO)
working party (1978) cirrhosis is defined as “A diffuse process characterized by
fibrosis and the conversion of normal liver architectures into structurally abnormal
nodules” [19]. Hepatitis refers to inflammation of liver parenchyma secondary to
any insult associated with influx of acute or chronic inflammatory cells. Cirrhosis
is diffuse, fibrosing, nodular progressive disease leading to disruption of entire
normal liver architecture [20]. Progression of long standing persistent liver injury
leads to cirrhosis. The pathophysiological mechanism of this injury varies, but the
common pathway remains a persistent wound healing progressing to fibrosis of
liver parenchyma [21].
EPIDEMIOLOGY & ETIOLOGY:
Cirrhosis affects 0.1% of European population, which corresponds to 14-26 new
cases per 100,000 inhabitants and an estimated 170,000 deaths per year [22]. Very
few data is available on the prevalence and incidence of cirrhosis in India. Previous
studies have shown that, mean age of diagnosis is 60 years with male
preponderance at male : female ratio of 1.3:4 [23].
Alcoholic Liver Disease (ALD) and Non Alcoholic Fatty Liver Disease (NAFLD)
are the major contributing factors for cirrhosis in developed countries while viral
hepatitis is identified as the major etiology of cirrhosis in developing
countries[24,25]. Patients with ALD have relatively high mortality rates compared to
patients with cirrhosis from other etiologies [26]. Diversity of liver insults leading to
cirrhosis are identified and can be enumerated as follows.
Etiologies of hepatic cirrhosis [20,21,27]
Most common causes:
Alcohol (60-70%)
Biliary obstruction (5-10%)
Primary or secondary biliary cirrhosis
Chronic hepatitis B or C (10%)
Hemochromatosis (5-10%)
NAFLD (10%)
Less common causes:
Autoimmune chronic hepatitis
Drugs and toxins
Metabolic disorders (Wilson’s disease)
Idiopathic / Miscellaneous (Sarcoidosis)
Infection (Schistosomiasis, Brucellosis)
Vascular (Veno-occlusive disease, Heart failure)
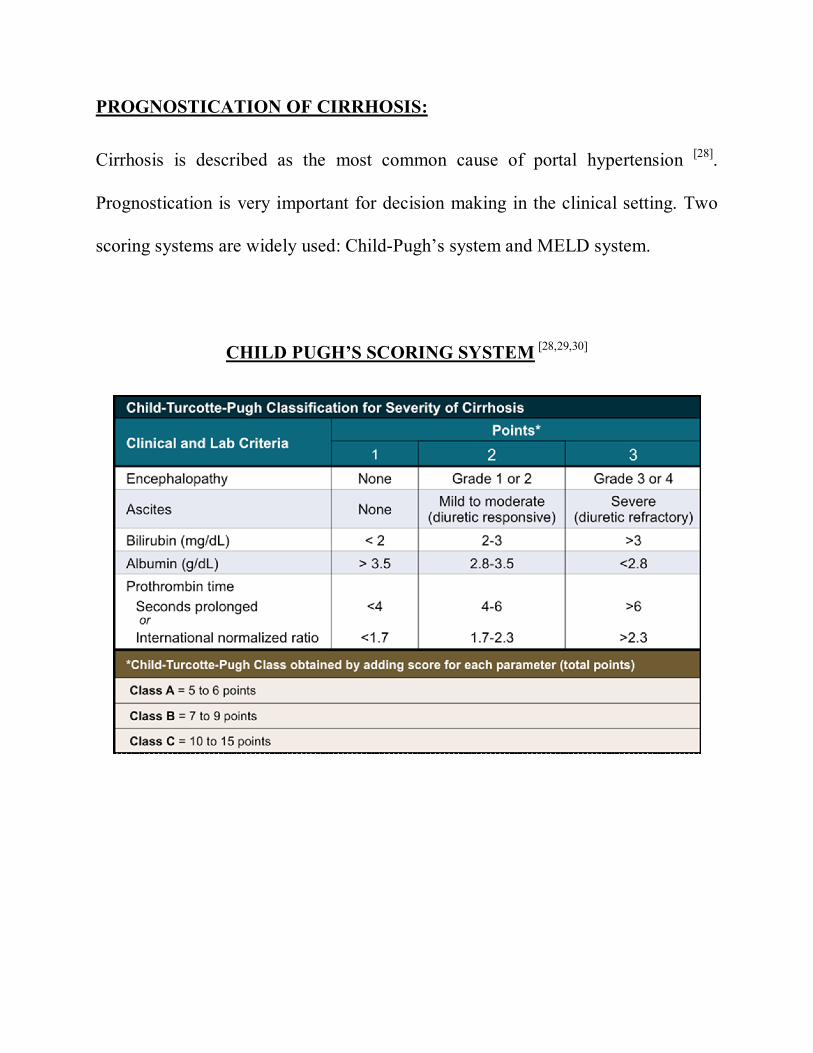
PROGNOSTICATION OF CIRRHOSIS:
Cirrhosis is described as the most common cause of portal hypertension [28].
Prognostication is very important for decision making in the clinical setting. Two
scoring systems are widely used: Child-Pugh’s system and MELD system.
CHILD PUGH’S SCORING SYSTEM [28,29,30]
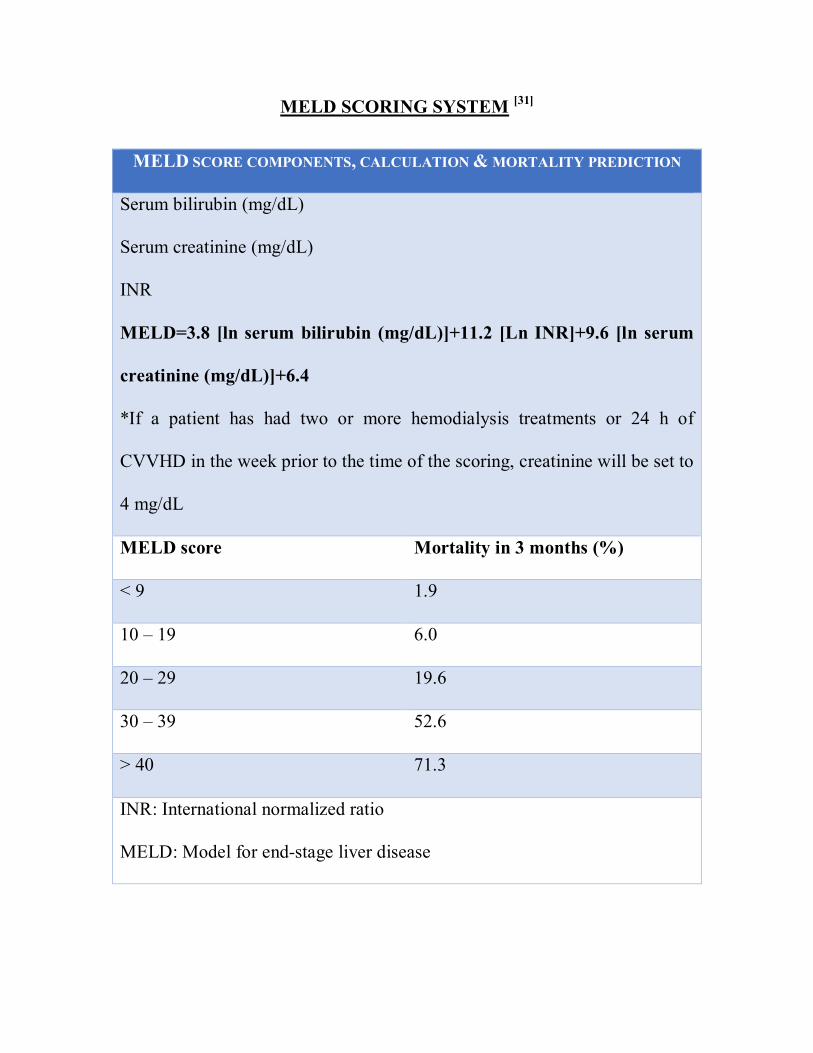
MELD SCORING SYSTEM [31]
MELD SCORE COMPONENTS, CALCULATION & MORTALITY PREDICTION
Serum bilirubin (mg/dL)
Serum creatinine (mg/dL)
INR
MELD=3.8 [ln serum bilirubin (mg/dL)]+11.2 [Ln INR]+9.6 [ln serum
creatinine (mg/dL)]+6.4
*If a patient has had two or more hemodialysis treatments or 24 h of
CVVHD in the week prior to the time of the scoring, creatinine will be set to
4 mg/dL
MELD score Mortality in 3 months (%)
< 9 1.9
10 – 19 6.0
20 – 29 19.6
30 – 39 52.6
> 40 71.3
INR: International normalized ratio
MELD: Model for end-stage liver disease
COMPLICATIONS OF CIRRHOSIS:
They contribute to significant morbidity and mortality of patients with cirrhosis
and can be broadly categorized as follows [32]:
PORTAL HYPERTENSION RELATED
o Esophageal variceal bleeding
o Hepato-renal syndrome
o Hepato-pulmonary syndrome
o Porto-pulmonary hypertension
o Spontaneous bacterial peritonitis
PORTAL HYPERTENSION UNRELATED
o Hepatocellular carcinoma
o Hepatic encephalopathy
o Hepatic osteodystrophy
o Hepatic sarcopenia
o Immune dysfunction and sepsis
PORTAL HYPERTENSION (PHT):
Dual blood supply to liver from low pressure portal venous circulation (80%) and
high pressure hepatic arterial circulation (20%) enters hepatic lobule at portal triad
and gets mixed in hepatic sinusoids. Sinusoids opens into the hepatic central vein
which further drains into hepatic veins and inferior vena cava [33]. Cirrhosis,
characterized by fibrosis and architectural distortion, ensues in increased vascular
resistance to portal flow which starts the chain of events leading to portal
hypertension. By definition, PHT represents increased pressure in the portal
venous system of about >10mmHg. Common clinical manifestations are
splenomegaly, ascites and gastrointestinal bleeding [34]. Apart from cirrhosis,
various other pathologies can lead to the development of PHT. Based on the
anatomical location, they are classified as pre-hepatic, intrahepatic and post-
hepatic (Figure 6).
CLASSIFICATION OF PORTAL HYPERTENSION: [33]
Prehepatic
Portal vein thrombosis – independent of cause
Splenic vein thrombosis
Splenic arterio-venous fistula
Intrahepatic
Presinusoidal
Chronic HBV / HCV
Sarcoidosis
Tuberculosis
Wilson’s disease
Hemochromatosis
Amyloidosis
Idiopathic portal hypertension
Benign and malignant neoplasms
Sinusoidal
Liver cirrhosis – independent of etiology
Acute viral or alcoholic hepatitis
Acute fatty liver of pregnancy
Post sinusoidal
Veno-occlusive disease
Alcoholic hyaline sclerosis of central veins
Extrahepatic
Budd Chiari disease, Inferior vena cava occlusion
Cardiac disease: Chronic right ventricular failure
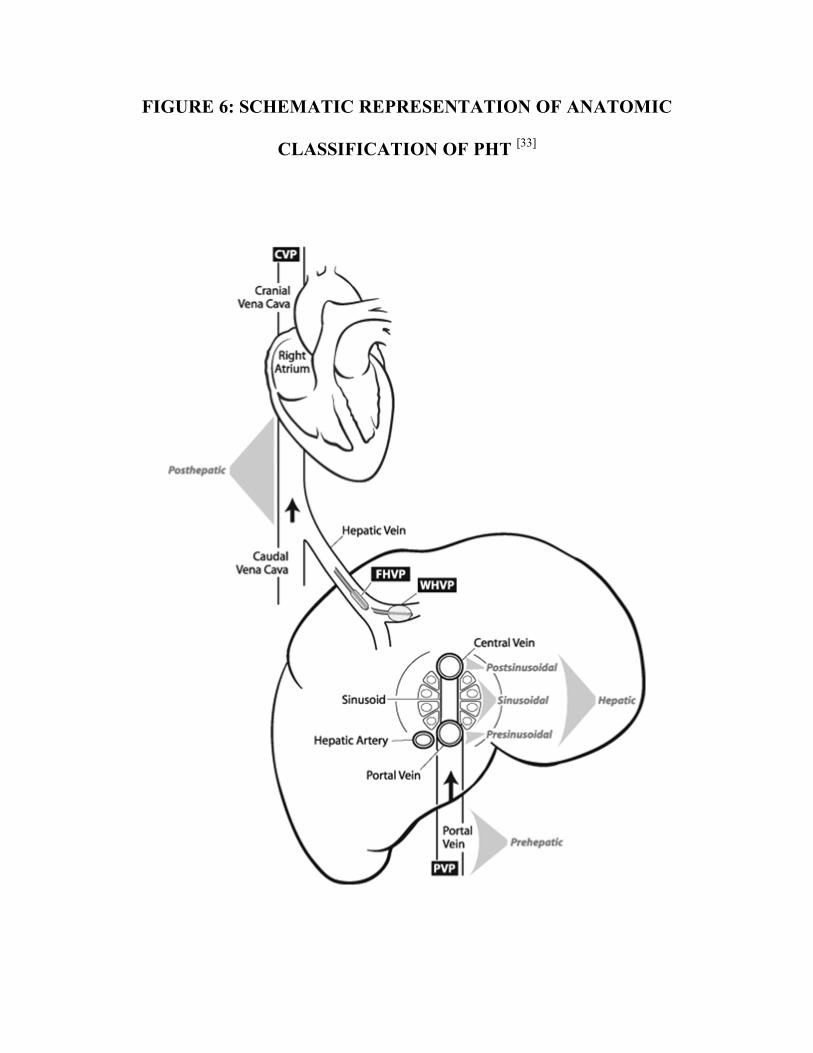
FIGURE 6: SCHEMATIC REPRESENTATION OF ANATOMIC
CLASSIFICATION OF PHT [33]
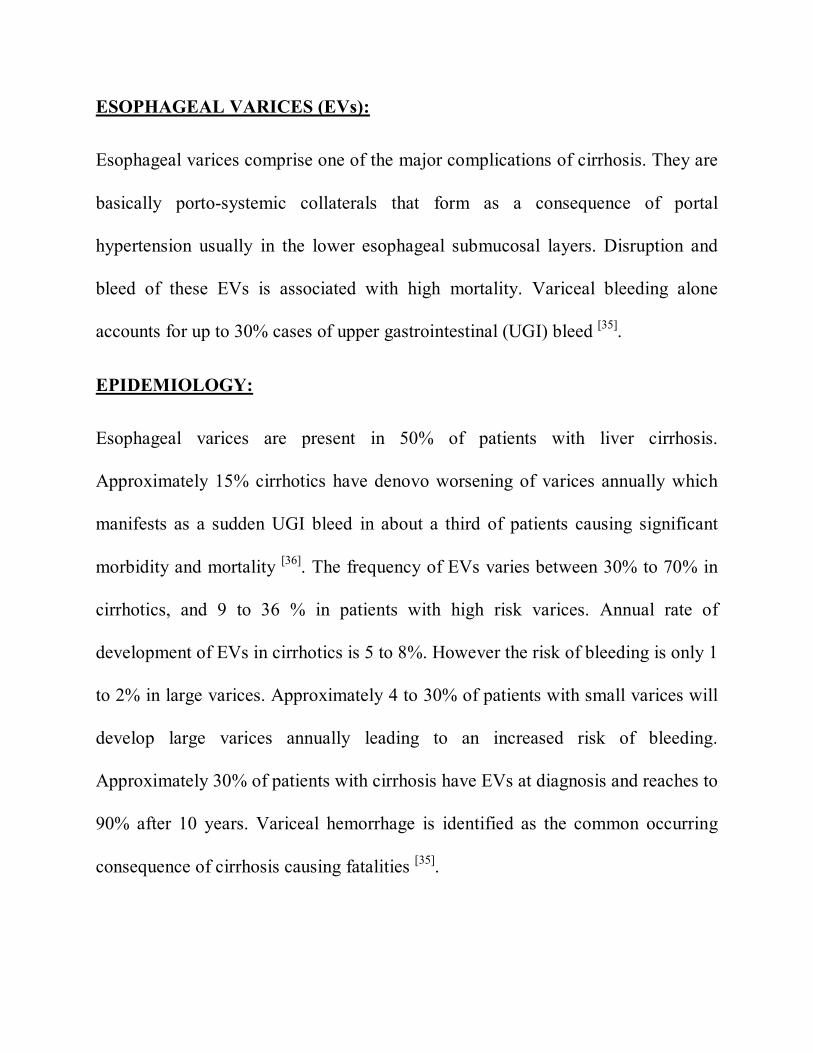
ESOPHAGEAL VARICES (EVs):
Esophageal varices comprise one of the major complications of cirrhosis. They are
basically porto-systemic collaterals that form as a consequence of portal
hypertension usually in the lower esophageal submucosal layers. Disruption and
bleed of these EVs is associated with high mortality. Variceal bleeding alone
accounts for up to 30% cases of upper gastrointestinal (UGI) bleed [35].
EPIDEMIOLOGY:
Esophageal varices are present in 50% of patients with liver cirrhosis.
Approximately 15% cirrhotics have denovo worsening of varices annually which
manifests as a sudden UGI bleed in about a third of patients causing significant
morbidity and mortality [36]. The frequency of EVs varies between 30% to 70% in
cirrhotics, and 9 to 36 % in patients with high risk varices. Annual rate of
development of EVs in cirrhotics is 5 to 8%. However the risk of bleeding is only 1
to 2% in large varices. Approximately 4 to 30% of patients with small varices will
develop large varices annually leading to an increased risk of bleeding.
Approximately 30% of patients with cirrhosis have EVs at diagnosis and reaches to
90% after 10 years. Variceal hemorrhage is identified as the common occurring
consequence of cirrhosis causing fatalities [35].
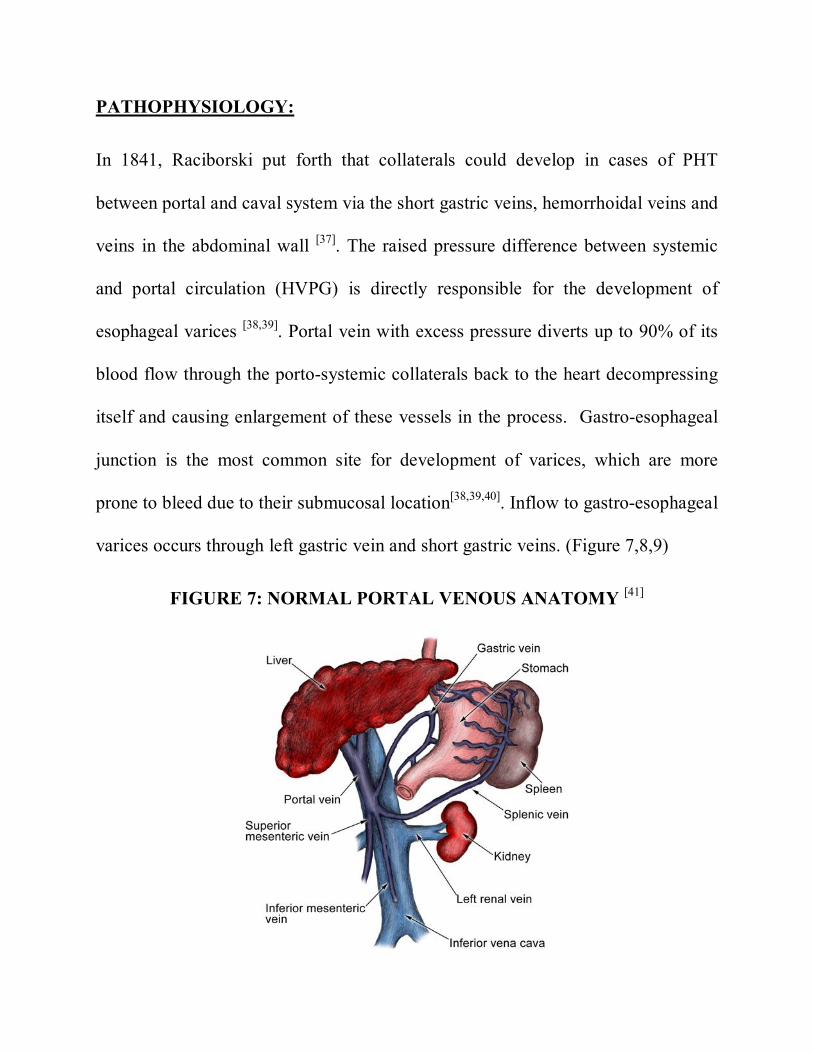
PATHOPHYSIOLOGY:
In 1841, Raciborski put forth that collaterals could develop in cases of PHT
between portal and caval system via the short gastric veins, hemorrhoidal veins and
veins in the abdominal wall [37]. The raised pressure difference between systemic
and portal circulation (HVPG) is directly responsible for the development of
esophageal varices [38,39]. Portal vein with excess pressure diverts up to 90% of its
blood flow through the porto-systemic collaterals back to the heart decompressing
itself and causing enlargement of these vessels in the process. Gastro-esophageal
junction is the most common site for development of varices, which are more
prone to bleed due to their submucosal location[38,39,40]. Inflow to gastro-esophageal
varices occurs through left gastric vein and short gastric veins. (Figure 7,8,9)
FIGURE 7: NORMAL PORTAL VENOUS ANATOMY [41]
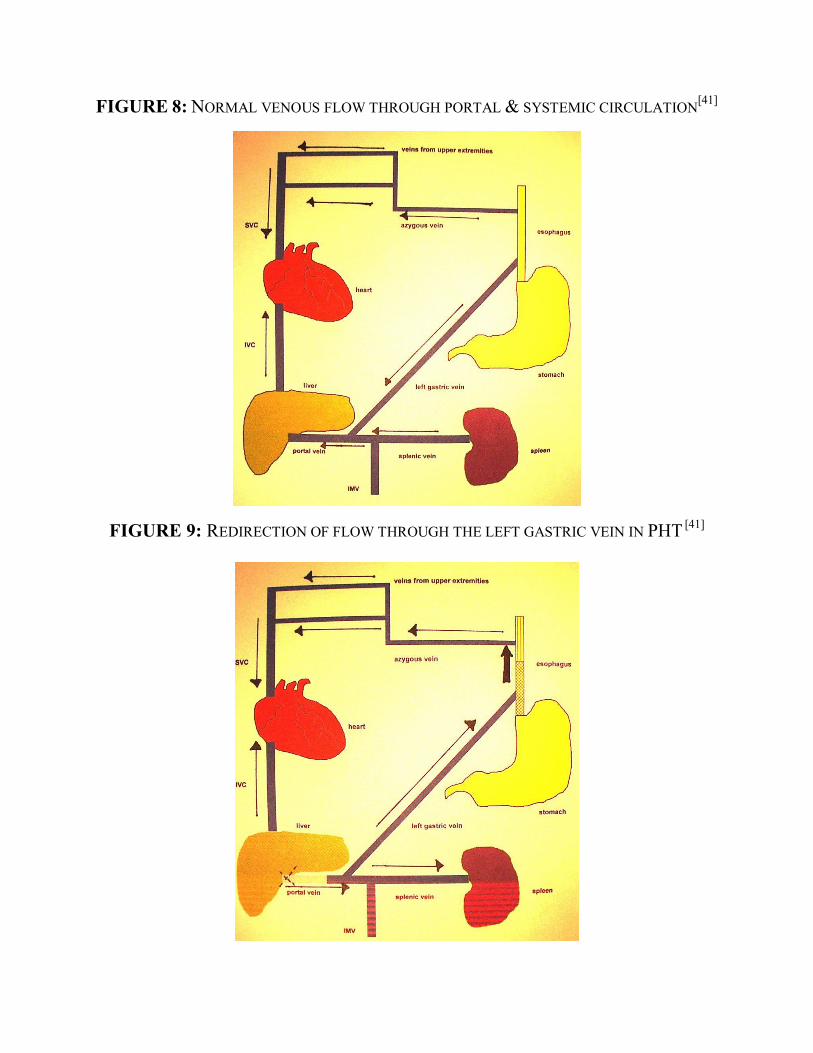
FIGURE 8: NORMAL VENOUS FLOW THROUGH PORTAL & SYSTEMIC CIRCULATION[41]
FIGURE 9: REDIRECTION OF FLOW THROUGH THE LEFT GASTRIC VEIN IN PHT [41]
DETECTION OF VARICES:
UGI scopy remains the gold standard diagnostic tool for detection of esophageal
varices worldwide. According to consensus, cirrhotic patients need regular
screening for esophageal varices by UGI scopy. If initial UGI scopy is negative for
varices, repeat examination should be scheduled in two to three years. If small
varices are detected at initial imaging, follow up is indicated in one to two
years[42,43]. Grading of EVs is subjective. Criteria for standardization of esophageal
varices have been studied extensively. Various classification systems have been
postulated for categorizing EVs: Japanese Research Society for Portal
Hypertension, Baveno V and Paquet.
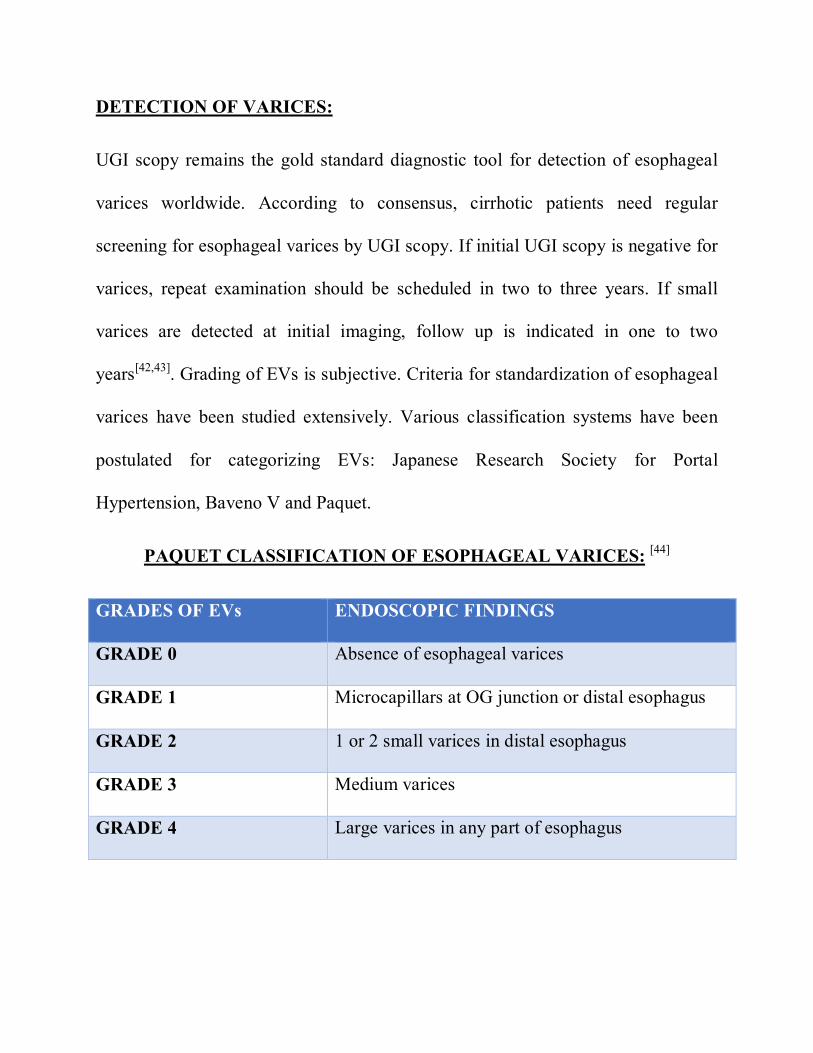
PAQUET CLASSIFICATION OF ESOPHAGEAL VARICES: [44]
GRADES OF EVs ENDOSCOPIC FINDINGS
GRADE 0 Absence of esophageal varices
GRADE 1 Microcapillars at OG junction or distal esophagus
GRADE 2 1 or 2 small varices in distal esophagus
GRADE 3 Medium varices
GRADE 4 Large varices in any part of esophagus
Mortality from liver cirrhosis related complications have shown a declining trend
in the developed countries, probably due to early detection and appropriate
management of complications. Though UGI scopy remains as a first line
diagnostic tool in detection of EVs, health care providers should keep in mind
about the intrinsic complications of this invasive procedure.
ELASTOGRAPHY:
Elastography is an Ultrasonographic (USG) analogue of manual palpation, based
on the principle that pathology changes the stiffness of the tissue. It measures the
elastic property of the tissues. It is implemented in clinical US and MR systems.
This technique does not measure stiffness directly, instead indirectly by measuring
the speed of shear waves propagating in the tissue of interest.
PRINCIPLES OF ELASTOGRAPHY:
Basic principle of elastography is that speed of shear waves depends on the
stiffness of the tissues. Shear waves travel faster in stiff tissues and slower in soft
tissues. For the estimation of tissue stiffness, various elastography techniques have
been developed and they may be classified according to the source, duration of
tissue formation and the modality used for tracking. Depending on the technique,
various stiffness parameters may be reported. Most commonly reported stiffness
parameters and corresponding units are shear wave speed in meters per second
(m/s), magnitude of complex shear modulus in kilopascals (kPa) and the young
elastic modulus in kilopascals. Two methods have been devised to study this
phenomenon, which are the strain elastography and the shear wave elastography
(Figures 10 and 11).
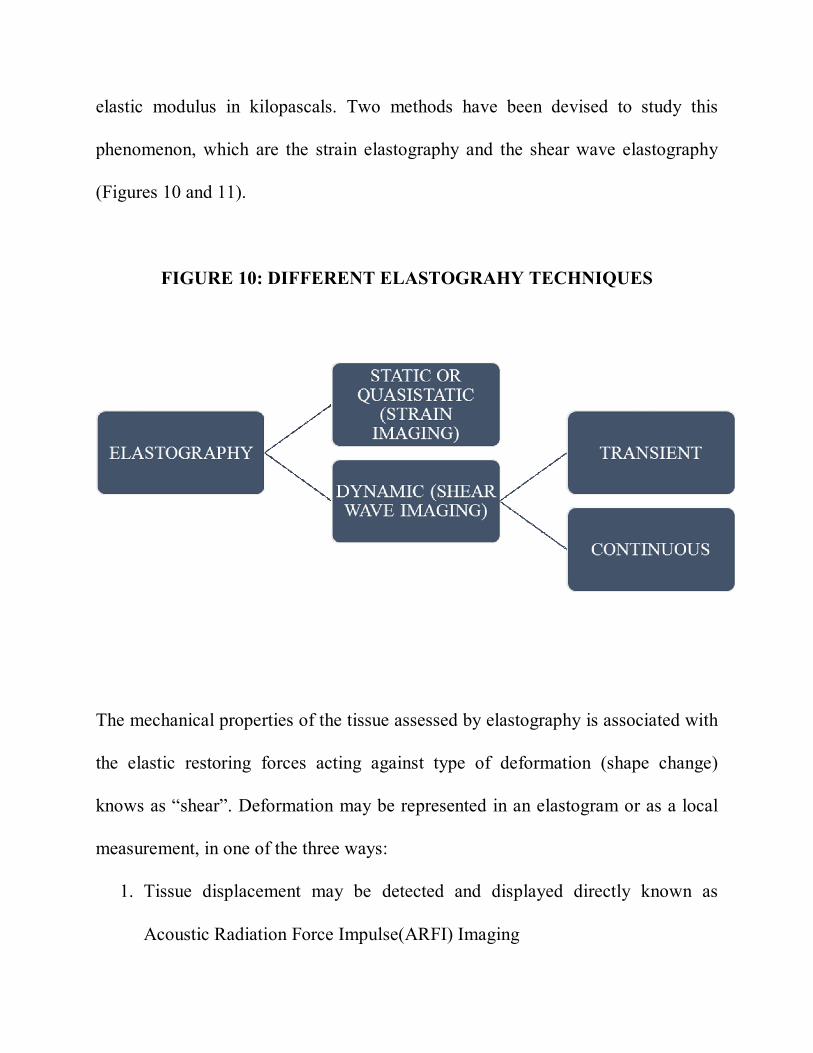
FIGURE 10: DIFFERENT ELASTOGRAHY TECHNIQUES
The mechanical properties of the tissue assessed by elastography is associated with
the elastic restoring forces acting against type of deformation (shape change)
knows as “shear”. Deformation may be represented in an elastogram or as a local
measurement, in one of the three ways:
1. Tissue displacement may be detected and displayed directly known as
Acoustic Radiation Force Impulse(ARFI) Imaging
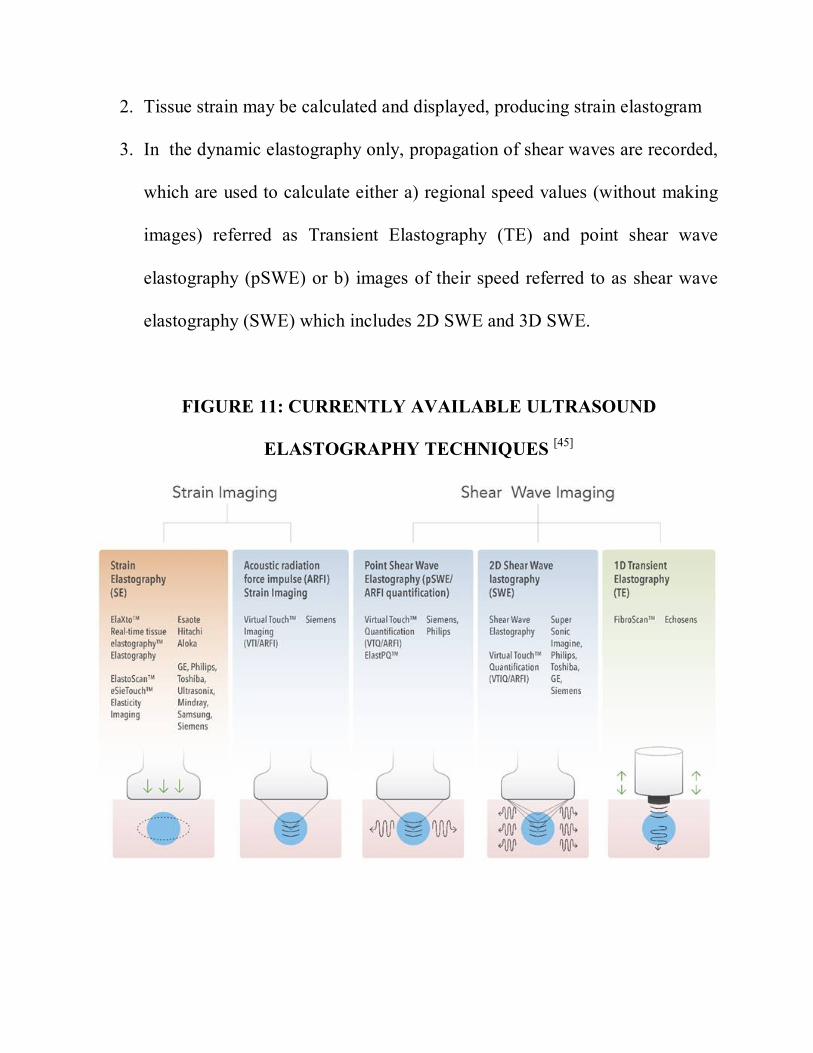
2. Tissue strain may be calculated and displayed, producing strain elastogram
3. In the dynamic elastography only, propagation of shear waves are recorded,
which are used to calculate either a) regional speed values (without making
images) referred as Transient Elastography (TE) and point shear wave
elastography (pSWE) or b) images of their speed referred to as shear wave
elastography (SWE) which includes 2D SWE and 3D SWE.
FIGURE 11: CURRENTLY AVAILABLE ULTRASOUND
ELASTOGRAPHY TECHNIQUES [45]
STATIC OR QUASISTATIC ELASTOGRAPHY:
In static elastography technique, stress is applied manual compression of tissues
whereas in quasistatic type, the transmitted physiological vibrations of the heart or
blood vessels act as stress. Static and quasistatic elastography have limited
applications in liver fibrosis. Example: eSie Touch in Siemens Healthcare.
DYNAMIC ELASTOGRAPHY:
It is also referred as shear wave imaging. By tracking shear waves propagating
through the media, it has the ability to assess stiffness and stiffness related
parameters. It works on basic principle that shear waves travel faster in stiff tissues
and slower in soft tissues. Stiffness of the tissues can be inferred, by measuring
shear wave speed within the tissues. Different techniques employs different range
of wave frequencies, hence stiffness related parameters obtained with various
techniques are not comparable. Example: Point shear wave elastography – Virual
Touch Quantification in Siemens.
TYPES OF WAVES IN ELASTOGRAPHY:
Waves which travel inside body organs can be categorized into two types namely
Compression waves and Shear waves. In compression waves, tissues move back
and forth in a direction parallel to wave propagation. Magnitude of compression
waves measures up to 1500m/s. Since, compression eaves propagate so rapidly,
they cannot be assessed accurately by current imaging techniques. Therefore,
present elastography techniques are based on shear waves. Shear waves propagate
at the magnitude of 1-10m/s with the direction of tissue motion perpendicular to
the wave propagation.
WAVE GENERATION:
Shear waves may be generated by applying mechanical vibration to the surface of
the body or focusing acoustic radiation force impulses inside the region of interest.
Few elastography techniques utilizes the former method of shear wave generation,
whereas others use the later. Former technique, utilizes the vibrator which
typically oscillates perpendicular to the body surface at a precisely controlled
frequency. Compression waves are generated and directed towards the body
surface, part of its energy is converted to shear waves by the process of “mode
conversion” (46). By this technique, precise control of shear wave frequency can be
obtained and associated energy absorption by tissue is minimal, but adequacy of
waves delivered into region of interest is not sufficient. Whereas later technique
employs focused acoustic compression pulses into the region of interest, part of its
energy is absorbed and released in the form of shear waves [47]. By this technique
wave delivery into area of interest more efficient than mechanic vibration
techniques. On contrary, ARFI is associated with higher power output, greater
energy absorption and difficulty in controlling shear wave frequency.
MECHANICAL PROPERTIES AND PARAMETERS:
Current clinically available techniques report the shear-wave speed, the magnitude
if complex shear modulus, or the Young modulus. The modulus parameters are
often referred to as “stiffness” in medical elastography literature. Two such
parameters are elasticity and viscosity. Elasticity is the mechanical property of a
material that tends to return to its original shape after a deformation. Viscosity
refers to the ability of the material to resist rapid movement or deformation.
Biologic tissues are considered to have both properties. (Viscoelastic)
TYPES OF DYNAMIC ELASTOGRAPHY:
Current techniques in dynamic elastography, use transient shear wave excitations
at a frequency of 50-400Hz [48,49,50].
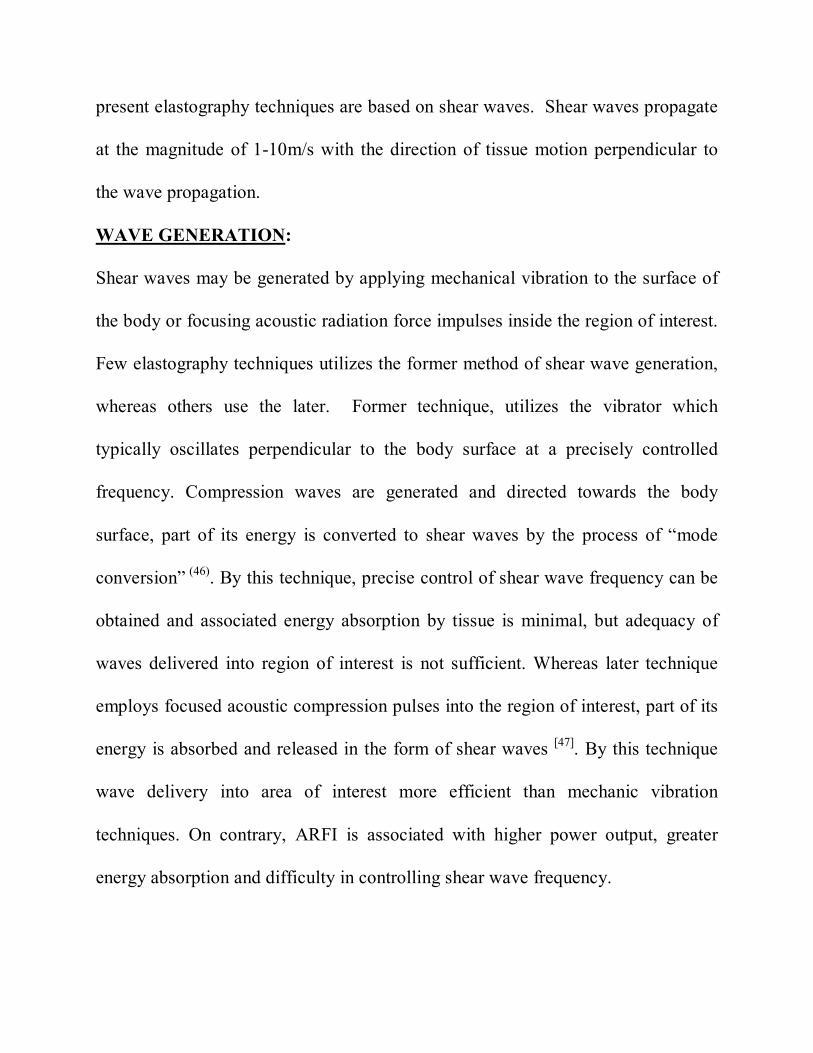
ONE DIMENSIONAL TRANSIENT ELASTOGRAPHY:
FibroScan (Echosens) was the first commercially available shear wave
measurement technique based on the concept of transient elastography. A single
element piston like ultrasound transducer mounted on a vibrating actuator
generates a transient vibration of short duration (<30ms) at a frequency of 50Hz[51].
The mechanical impulse generates a shear wave that propagates symmetrically
with respect to the axis of the single element transducer [48,51,52,53,54,55]. The
displacements induced by shear wave are tracked using ultrasonic eaves emitted
and received at very high frequency (6 kHz) by single element transducer. In
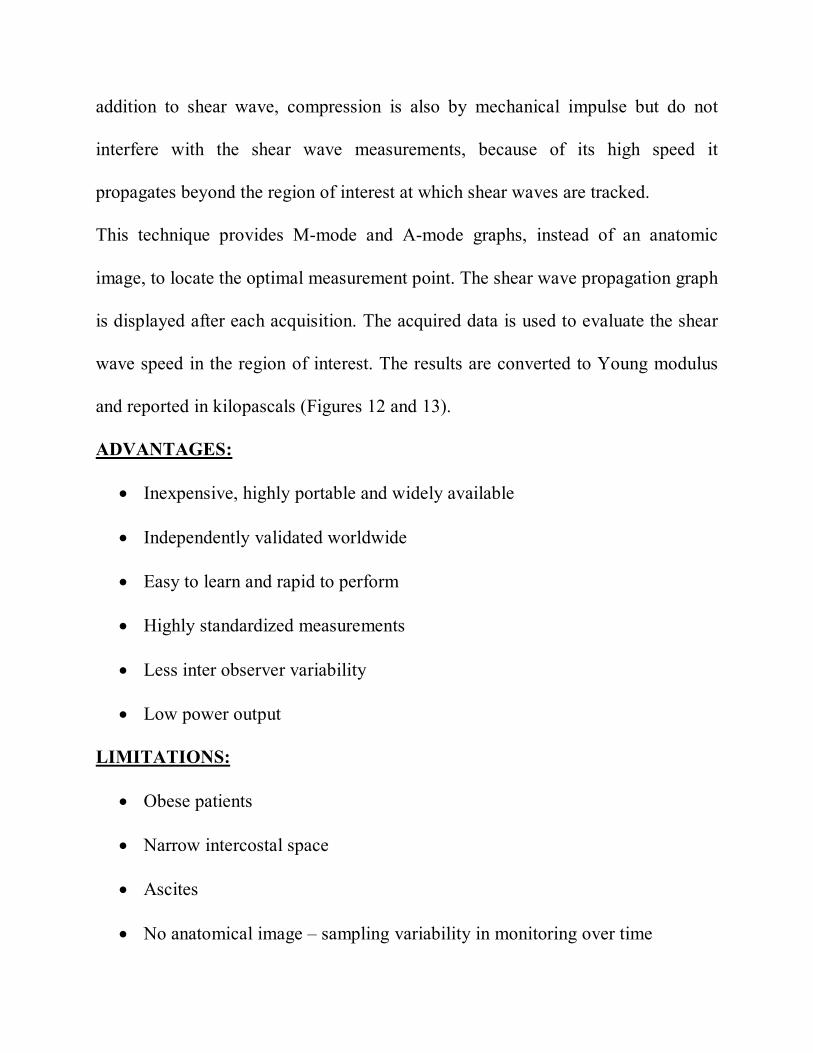
addition to shear wave, compression is also by mechanical impulse but do not
interfere with the shear wave measurements, because of its high speed it
propagates beyond the region of interest at which shear waves are tracked.
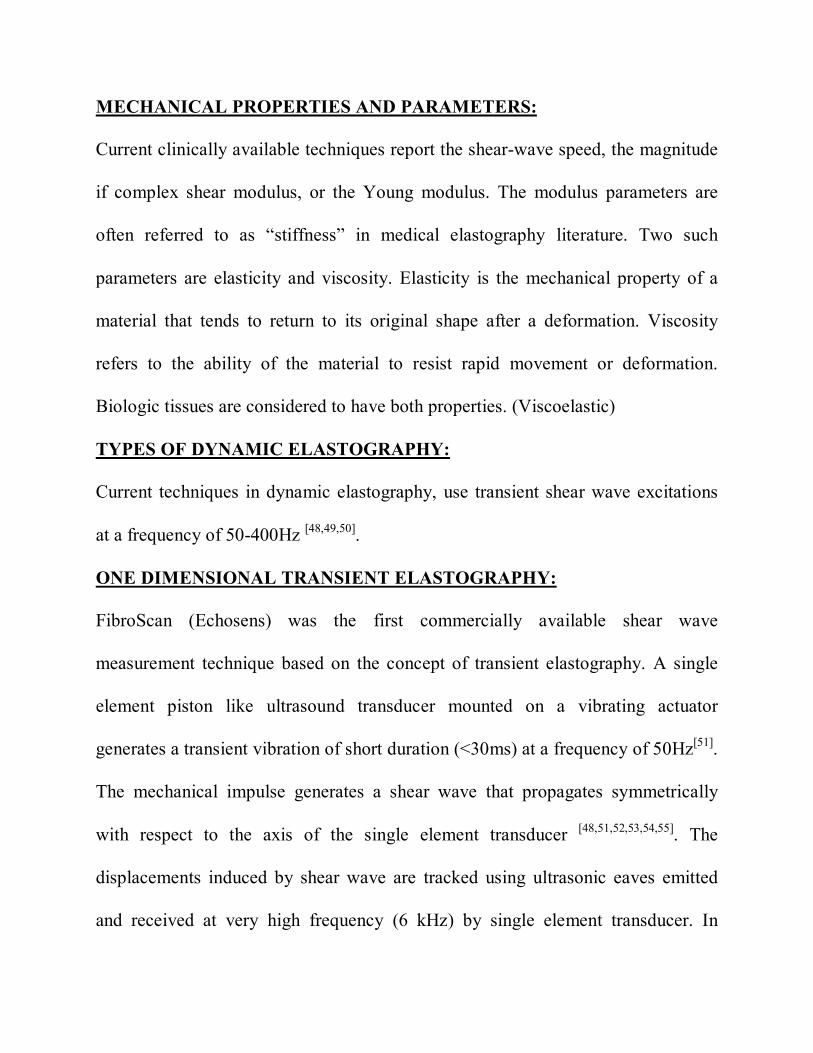
This technique provides M-mode and A-mode graphs, instead of an anatomic
image, to locate the optimal measurement point. The shear wave propagation graph
is displayed after each acquisition. The acquired data is used to evaluate the shear
wave speed in the region of interest. The results are converted to Young modulus
and reported in kilopascals (Figures 12 and 13).
ADVANTAGES:
Inexpensive, highly portable and widely available
Independently validated worldwide
Easy to learn and rapid to perform
Highly standardized measurements
Less inter observer variability
Low power output
LIMITATIONS:
Obese patients
Narrow intercostal space
Ascites
No anatomical image – sampling variability in monitoring over time
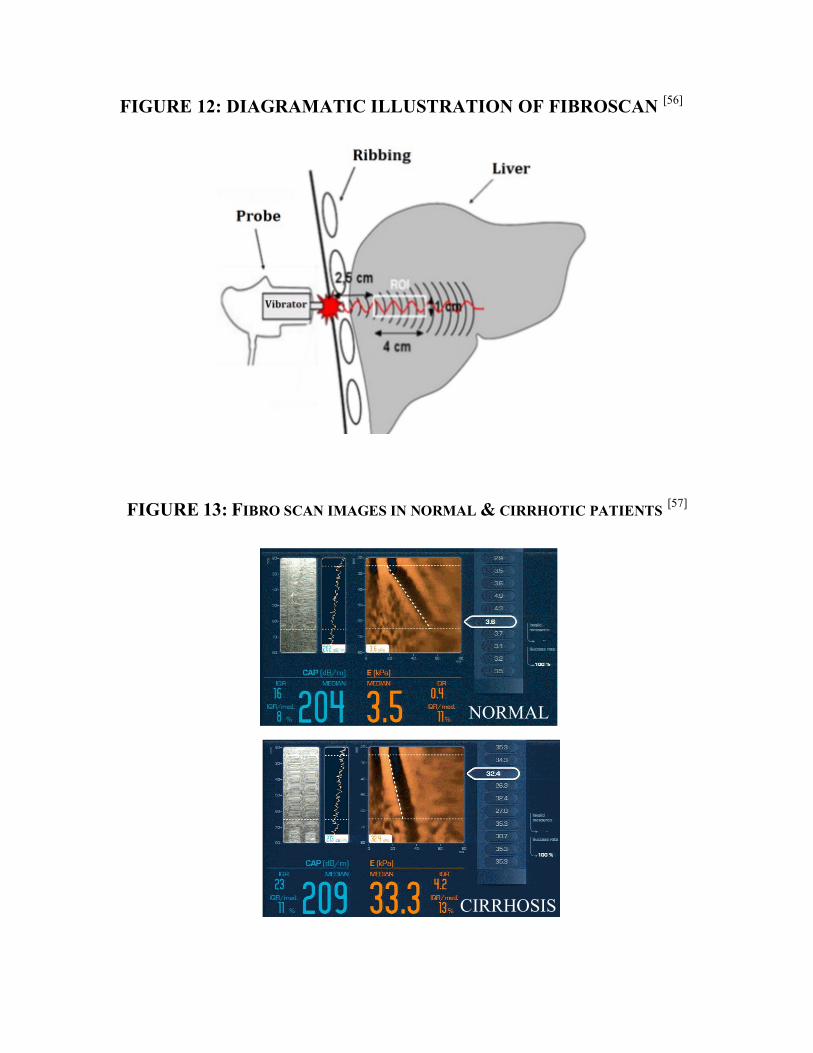
FIGURE 12: DIAGRAMATIC ILLUSTRATION OF FIBROSCAN [56]
FIGURE 13: FIBRO SCAN IMAGES IN NORMAL & CIRRHOTIC PATIENTS [57]
NORMAL
CIRRHOSIS
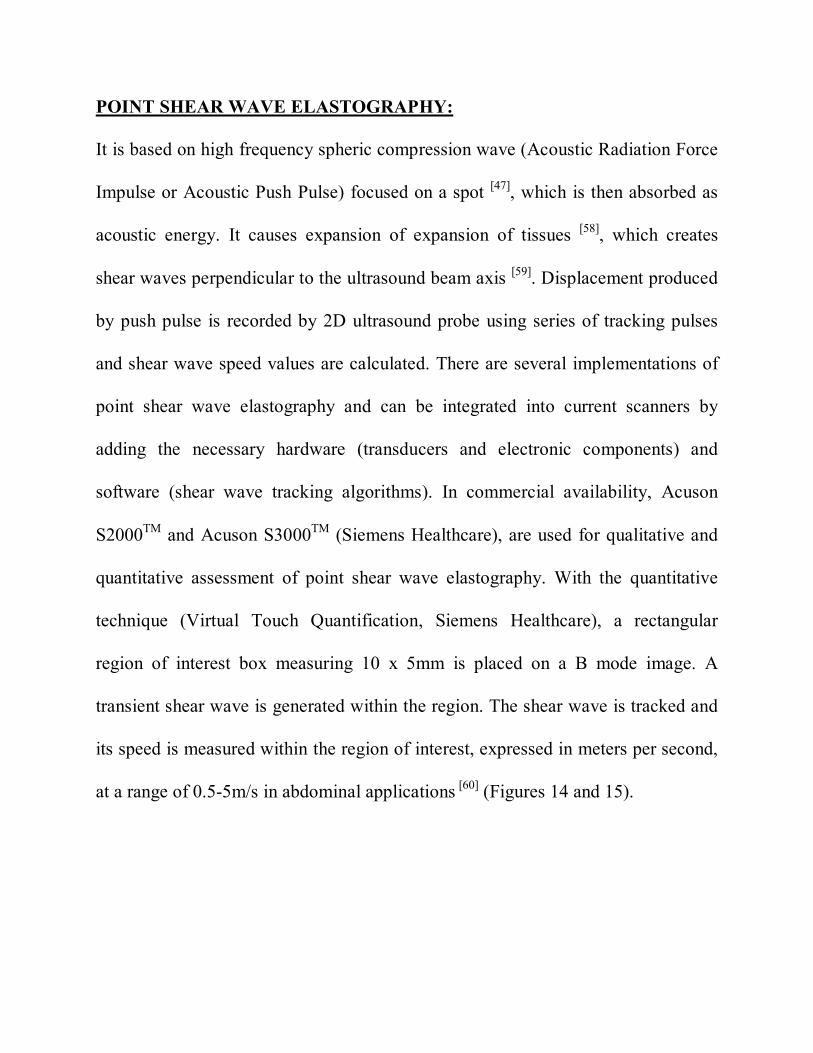
POINT SHEAR WAVE ELASTOGRAPHY:
It is based on high frequency spheric compression wave (Acoustic Radiation Force
Impulse or Acoustic Push Pulse) focused on a spot [47], which is then absorbed as
acoustic energy. It causes expansion of expansion of tissues [58], which creates
shear waves perpendicular to the ultrasound beam axis [59]. Displacement produced
by push pulse is recorded by 2D ultrasound probe using series of tracking pulses
and shear wave speed values are calculated. There are several implementations of
point shear wave elastography and can be integrated into current scanners by
adding the necessary hardware (transducers and electronic components) and
software (shear wave tracking algorithms). In commercial availability, Acuson
S2000TM and Acuson S3000TM (Siemens Healthcare), are used for qualitative and
quantitative assessment of point shear wave elastography. With the quantitative
technique (Virtual Touch Quantification, Siemens Healthcare), a rectangular
region of interest box measuring 10 x 5mm is placed on a B mode image. A
transient shear wave is generated within the region. The shear wave is tracked and
its speed is measured within the region of interest, expressed in meters per second,
at a range of 0.5-5m/s in abdominal applications [60] (Figures 14 and 15).
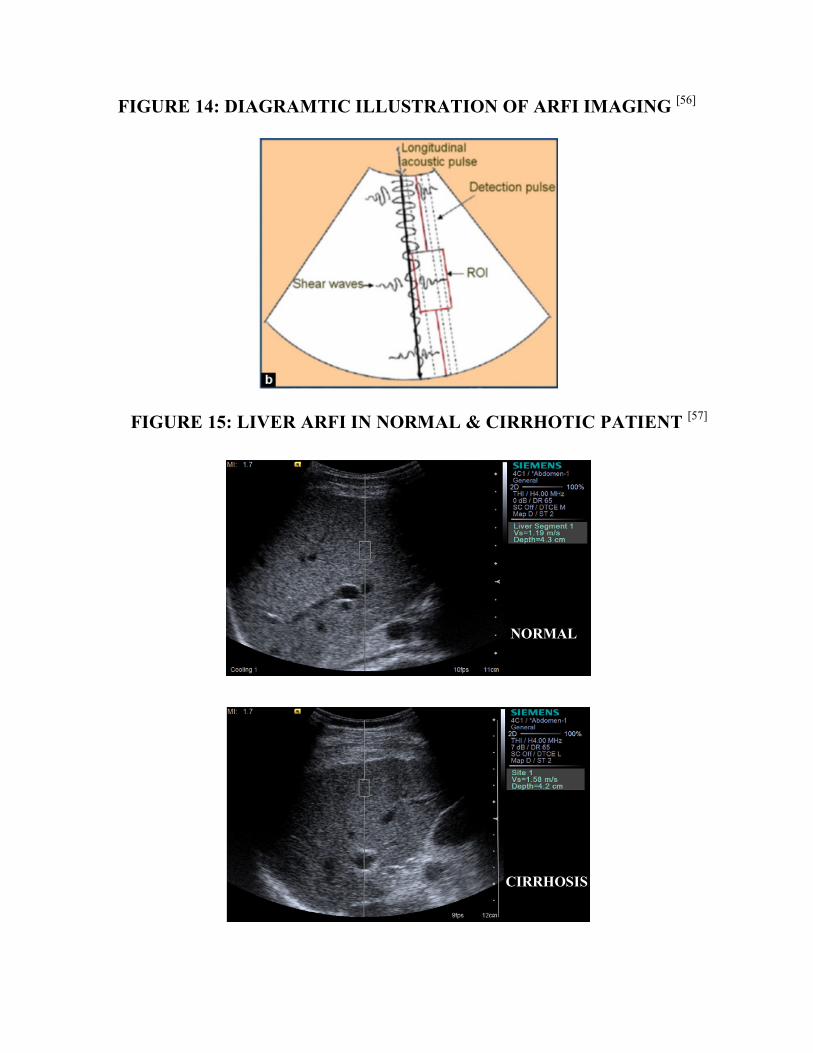
FIGURE 14: DIAGRAMTIC ILLUSTRATION OF ARFI IMAGING [56]
FIGURE 15: LIVER ARFI IN NORMAL & CIRRHOTIC PATIENT [57]
NORMAL
CIRRHOSIS
ADVANTAGES:
Allows the operator to evaluate specific region of interest
Same region of interest can be monitored on serial follow up
Can be performed in obese patients and in the presence of
LIMITATIONS:
More expertise
Experienced radiologist is needed to perform the procedure
Less validated worldwide
High energy absorption by tissues
SHEAR WAVE ELASTOGRAPHY:
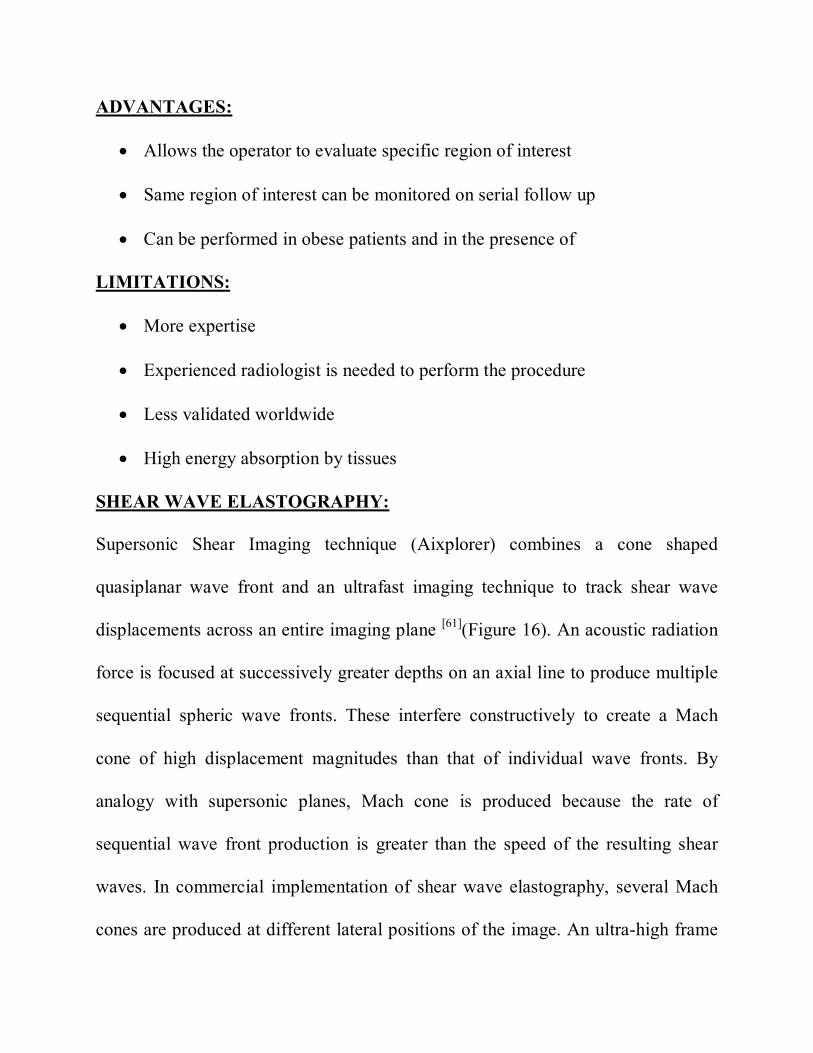
Supersonic Shear Imaging technique (Aixplorer) combines a cone shaped
quasiplanar wave front and an ultrafast imaging technique to track shear wave
displacements across an entire imaging plane [61](Figure 16). An acoustic radiation
force is focused at successively greater depths on an axial line to produce multiple
sequential spheric wave fronts. These interfere constructively to create a Mach
cone of high displacement magnitudes than that of individual wave fronts. By
analogy with supersonic planes, Mach cone is produced because the rate of
sequential wave front production is greater than the speed of the resulting shear
waves. In commercial implementation of shear wave elastography, several Mach
cones are produced at different lateral positions of the image. An ultra-high frame
rate (up to 15000 images per second) is used to scan the entire imaging plane in
one acquisition with high temporal resolution [49]. Combination of Mach cone
generation and fast imaging allows real time generation of elastogram. The results
are reported as meters per second or converted to the young modulus in
kilopascals.
ADVANTAGES:
Quantitative elastogram
Reduces sampling variability
LIMITATIONS:
Less commercially available
High cost of the equipment
FIGURE 16: SUPERSONIC SHEAR IMAGING IN NORMAL & CIRRHOTIC PATIENT [57]
NORMAL
CIRRHOSIS
NONINVASIVE DETECTION OF ESOPHAGEAL VARICES:
Variceal bleeding is the most lethal complication of cirrhosis and accounts for 20%
to 35% mortality. Recent search is in the development of prophylactic measures for
variceal bleeding, thereby improving patient’s prognosis and reducing the costs of
hospitalization [62]. American and European guidelines for primary prophylaxis of
esophageal variceal bleeding have been established and recommends screening
UGI scopy for all cirrhotic patients [63,64]. However, these guidelines imposes
onerous financial expenditure and intrinsic risks of the invasive procedure.
Previous studies on non-invasive clinical and radiological parameters for the
detection of esophageal varices have thrown light on this context, thereby reducing
the number of invasive UGI scopy for the screening of EVs in cirrhotics. Previous
studies in the literature showed differing results on the ability of these variables in
detecting esophageal varices.
CLINICAL PREDICTORS:
Clinical parameters evaluated in the recent studies were Child Pugh class, MELD
score, Platelet count and AST/ALT ratio.
RADIOLOGICAL PREDICTORS:
Radiological parameters assessed in the previous studies were liver size, spleen
size, portal vein diameter and flow velocity, PSR, liver and spleen ARFI.
CLINICAL PREDICTORS:
CHILD PUGH CLASS:
Cirrhotic patients categorized as Child-Pugh class B or C have high predilection
(x3 times) towards detection of esophageal varices or large esophageal varices in
comparison to Child-Pugh class A cirrhotics, was inferred by Zaman et al [65]. In a
prospective study of 299 patients newly diagnosed with chronic liver disease done
by Cherian et al (66) reported that three non-endoscopic predictors namely Child-
Pugh class, low platelet count and spleen diameter. On multivariate analysis, they
deduced that Child-Pugh class B or C, platelet count of <90,000 per μl and spleen
diameter of >160 mm were strong predictors in of large EVs.
MELD SCORE:
De Mattos et al inferred that there is conspicuous association of esophageal varices
with MELD score, platelet count, spleen diameter, platelet count/spleen diameter
ratio on univariate analysis(p<0.05)[67]. Striking association between esophageal
varices and MELD Score was revealed by Tafarel et al [68]. In a prospective study
of 51 patients by Chandail VS et al [69] deduced that MELD score is a reliable
noninvasive predictor of esophageal varices in cirrhotics and with cut off of 15.91
it can certainly differentiate cirrhotics with vs without esophageal varices with
maximum sensitivity, specificity and positive predictive value.
PLATELET COUNT:
Portal hypertension induced splenomegaly may lead to thrombocytopenia, in part
due to platelet sequestration. Literature search unwinds the large number of studies
performed in the assessment of correlation between platelet count and esophageal
varices [65,70,71,72]. Though low-platelet count is frequently considered as valid
laboratory parameter in predicting the presence of esophageal varices and large
esophageal varices in cirrhotics, but there is a broad variation in the cut-off level of
platelets ranging from 68,000 to 160,000 per μl with specificities ranging from 36–
73% and sensitivities from 71–90% and. Selection bias is likely to interpret for
much of this variation, with the most of the studies being retrospective and
constitutes heterogeneous patients cohorts resulting in both selection and spectrum
bias.
In contrary, Qamar et al [73], in their longitudinal study on 213 patients with chronic
liver disease with portal hypertension without EVs found that median of platelet
count at the time of occurrence of esophageal varices was 91,000. Although, no
reliable cut off value of platelet count could be depicted that precisely predicted the
presence of EVs (AUROC: 0.63). Thence, they deduced that platelet count is a
fallible noninvasive marker for detection of esophageal varices in cirrhotics.
AST/ALT RATIO:
AST/ALT ratio was proved useful in the prediction of cirrhosis. By natural
extension studies had been performed to assess its utility as a non-invasive marker
in the prediction of esophageal varices.
Nyblom et al [74], in their retrospective study inferred that AST/ALT ratios were
significantly higher in patients with varices when compared to those without (ratio:
1.8 versus 1.0).
Castera et al [75], in their prospective study, found that AST/ALT ratio significantly
differentiates cirrhotics with vs without EVs with cut off value > 1.12 with
sensitivity of 47.8%, specificity of 87%, PPV 42.3%, and NPV 89.2%, and an
AUROC of 0.69. Further in this study, a different cut-off of ≥1.0 demonstrated a
sensitivity of 68%, specificity of 89%, PPV 77%, and NPV 83%, with an AUROC
of 0.83 (0.72–0.94) for prediction of EVs. For the detection of large EVs, it
demonstrated a sensitivity of 68%, specificity of 77%, PPV of 41%, and NPV of
92%, and AUROC of 0.79 (0.64–0.94). Comprehensively, AST/ALT ratio
precisely classified 81% patients for the detection of EVs and 76% of patients with
large EVs.
In contrary, Kraja et al [76] in their prospective study of 199 patients found that no
significant association exists between AST/ALT ratio and the presence of
esophageal varices.
RADIOLOGICAL PREDICTORS:
Radiologic parameters such as portal vein diameter, portal blood velocity and
congestion index, spleen size, flow pattern in the hepatic veins, and the presence of
abdominal portosystemic collaterals are previously thought to have prognostic
significance but all with poor sensitivity and specificity. Radiological parameters
evaluated in the recent literature were portal vein diameter & flow velocity, spleen
length, platelet count – Spleen length ratio (PSR), liver stiffness and splenic
stiffness. Previous studies in the literature inferred varying results on the capability
of these radiological markers in detecting esophageal varices.
PORTAL VEIN DIAMETER (PVD):
Two studies, by Schepis et al [77] and Cottone et al [78], proved that PVD can be
considered as an independent radiological marker for prediction of the presence of
EVs vs without EVs in cirrhotics. Schepis et al [77] found PVD of 13.82 ± 2.1 mm,
amongst patients with esophageal varices, and 12.33 ± 2.04 mm amongst patients
without esophageal varices. In their studies, they found that PVD ≥ 13 mm had
100% sensitivity in predicting the presence of EVs.
Sarwar et al [79], postulated that PVD > 11 mm is independently associated with the
presence of EVs. Fook Hong et al [80], deduced a portal vein diameter of 1.15 ±
0.24 cm in cirrhotics with EVs and 1.05 ± 0.26 cm in cirrhotics without EVs.
PORTAL VEIN FLOW VELOCITY:
Diminished portal flow volume is associated with poor liver function tests and
PHT in cirrhotics and it might predict variceal bleeding [81], although there is
disagreement[82]. Dib et al [83] found that portal vein flow velocity can be
considered as non-invasive marker in detection of EVs with cut off value of
<12cm/sec at which maximum sensitivity and specificity were obtained.
SPLEEN LENGTH:
Chalasani et al [84] and Sudha Rain et al [85] proved that splenomegaly is a reliable
predictor of EVs in cirrhotics. Kumar et al [86] inferred that spleen diameter of >140
mm and portal vein diameter of >13 mm are reliable noninvasive radiological
markers of EVs in cirrhotics.
In another study, by Tarzamini et al [87] postulated that spleen diameter as
independent predictor of EVs with cut off value of more than 157 mm.
Thomopoulos et al [88] found that spleen length can be regarded as significant
predictor of EVs with cut off value of 13.5 cm which has 95% sensitivity and
37% specificity.
Sharma and Agarwal [89], in their study found that clinically palpable spleen
showed significant association with high grade varices, although they did not
measure the ultra-sonographic length of spleen. Mandal et al [90] postulated that
splenomegaly and portal vein diameter are reliable predictors of variceal
hemorrhage and also inferred that grading of EVs also correlate with splenic size
and portal vein diameter. In their study, average splenic size and portal vein
diameter in high grade varices were 14.43 ± 0.86 mm and 15.36 ± 2.14 cm
respectively.
PLATELET COUNT – SPLEEN LENGTH RATIO (PSR):
It is calculated by dividing the platelet number/mm3 by the maximum spleen length
in mm as estimated by abdominal ultrasound. In 2003, Giannini et al [91], proved
that PSR, spleen diameter and platelet count are significantly different among
cirrhotic patients with and without EVs. They found that PSR cut off value of 909
had 100% negative predictive value for the diagnosis of EVs.
In another study, González-Ojeda et al [92], proved that PSR is a reliable
noninvasive parameter to detect EVs independent of the grade with cutoff value of
≤ 884.3 which showed sensitivity of 84% and specificity of 70%.
In contrary, Chawla et al [93], found the inability PSR as an independent predictor
of EVs in cirrhotics.
LIVER STIFFNESS:
Elastographic methods of measuring liver stiffness has attracted enormous
attention in the last decade. Transient elastography (TE, FibroScan, Echosens,
France) is a noninvasive technique which was proved to be capable of assessing
hepatic fibrosis in patients with chronic liver diseases. Beyond its utility in
assessment and grading of hepatic fibrosis, it has been comprehensively studied in
the recent years, evaluating its ability to predict EVs in cirrhotics. Some variability
was observed in the results but in most studies showing a negative predictive value
of above 90%[94,95]. Nonetheless, these studies were highly heterogeneous and
thereby defining threshold value is difficult enough that TE could not be practiced
to triage the patients needing and not needing UGI scopy.
Liver stiffness measured by ARFI elastography may non-invasively predict the
presence or absence of clinically significant esophageal varices. Parvez, M.D.
Nadeem et al [96], found that ARFI values were significantly higher in cirrhotic
patients with clinically significant EVs as compared to cirrhotic patients without
significant EVs (3.63 ± 0.30 vs 2.01 ± 0.08, P < 0.001) and it has positive
correlation with the grade of EVs (r = 0.78, P < 0.043). They also found that ARFI
value of <2.0 m/s (≤grade 2 fibrosis) has high prediction towards the absence of
large EVs.
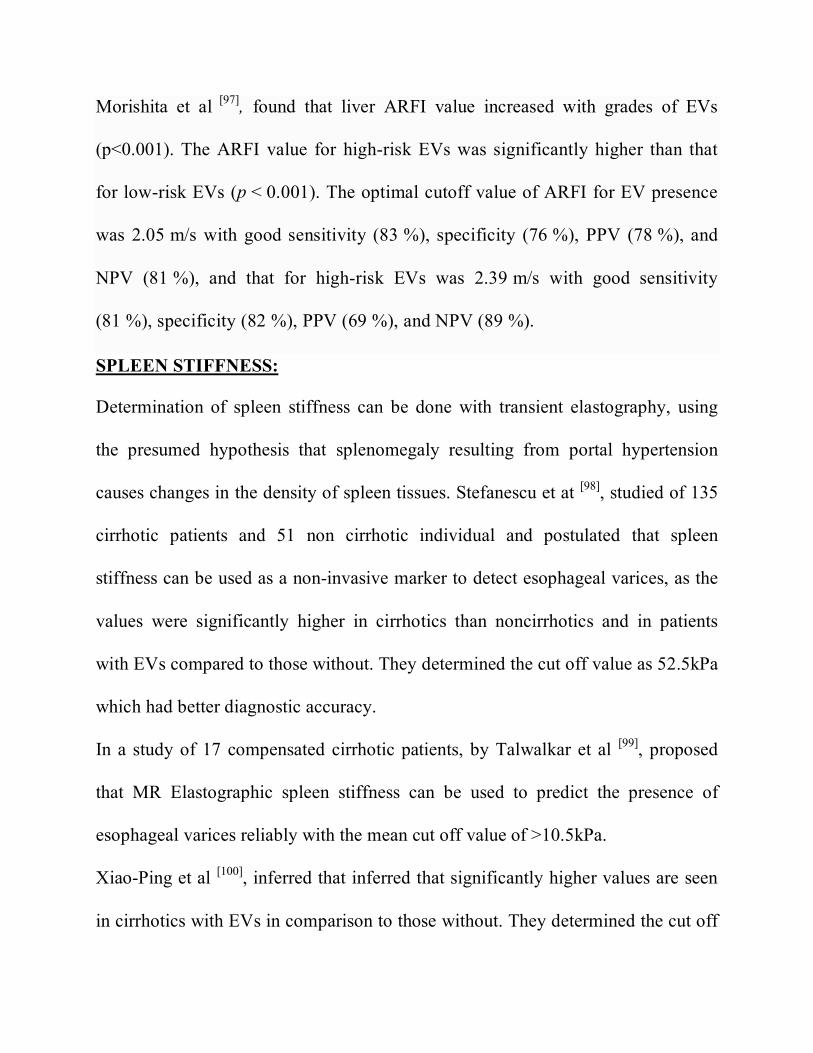
Morishita et al [97], found that liver ARFI value increased with grades of EVs
(p<0.001). The ARFI value for high-risk EVs was significantly higher than that
for low-risk EVs (p < 0.001). The optimal cutoff value of ARFI for EV presence
was 2.05 m/s with good sensitivity (83 %), specificity (76 %), PPV (78 %), and
NPV (81 %), and that for high-risk EVs was 2.39 m/s with good sensitivity
(81 %), specificity (82 %), PPV (69 %), and NPV (89 %).
SPLEEN STIFFNESS: Determination of spleen stiffness can be done with transient elastography, using
the presumed hypothesis that splenomegaly resulting from portal hypertension
causes changes in the density of spleen tissues. Stefanescu et at [98], studied of 135
cirrhotic patients and 51 non cirrhotic individual and postulated that spleen
stiffness can be used as a non-invasive marker to detect esophageal varices, as the
values were significantly higher in cirrhotics than noncirrhotics and in patients
with EVs compared to those without. They determined the cut off value as 52.5kPa
which had better diagnostic accuracy.
In a study of 17 compensated cirrhotic patients, by Talwalkar et al [99], proposed
that MR Elastographic spleen stiffness can be used to predict the presence of
esophageal varices reliably with the mean cut off value of >10.5kPa.
Xiao-Ping et al [100], inferred that inferred that significantly higher values are seen
in cirrhotics with EVs in comparison to those without. They determined the cut off
value of spleen ARFI as 3.16 m/s varices (AUROC = 0.83) can reliably
differentiates these two groups, thereby validating spleen ARFI as a non-invasive
marker for EVs in cirrhotics. Although, no significant association was determined
between liver ARFI and the presence of EVs.
Likely, Takuma et al [101], deduced the utility of spleen ARFI as initial non-invasive
screening test for the prediction of EVs in cirrhotics with cut off spleen stiffness of
3.18 m/s. Moreover, they also determined that spleen ARFI showed significant
correlation with severity of esophageal varices. Cutoff value of 3.30 m/s identified
patients with high grade EVs with a 99.4% negative predictive value and 98.9%
sensitivity. The presence of high grade EVs can be reliably ruled out with cut off
SS values of <3.3 m/s in patients with chronic liver parenchymal disease.
In contrary, Rifia et al [102], proved that spleen elastography is inferior to liver
elastography for the detection of portal hypertension.
OBSERVATION AND RESULTS
This prospective case control study was conducted at PSG institute of Medical
Sciences and Research, Peelamedu, Coimbatore from January 2016 to February
2017. A total of 100 patients with chronic liver disease (50 patients with EVs and
50 patients without EVs) were enrolled in this study. The data obtained was
analyzed between two groups: Cirrhotics with EVs vs Cirrhotics without EVs.
Mean age of patients in Cirrhotics with EVs group is 47.9 years (Range: 20 – 85
years) and in Cirrhotics without EVs group is 48.3 years (Range: 28 – 82 years).
All the patients in both groups had coarse echotexture of liver in B mode
ultrasound and surface nodularity is present in 48 patients (96%) in EVs group and
44 patients (88%) in without EVs group. Final results were interpreted in tables
and /or illustrative graphs as follows. Values expressed as A (B %), represents
actual numbers as A and percentage as B% within each group.
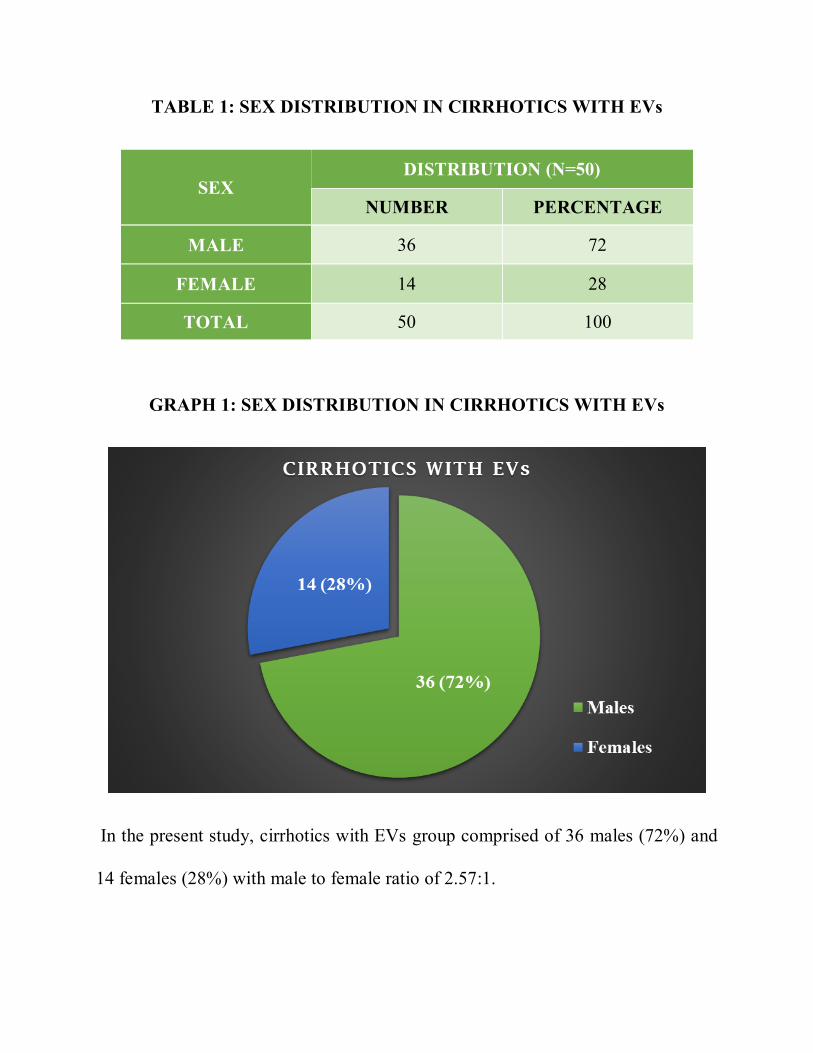
TABLE 1: SEX DISTRIBUTION IN CIRRHOTICS WITH EVs
SEX DISTRIBUTION (N=50)
NUMBER PERCENTAGE
MALE 36 72
FEMALE 14 28
TOTAL 50 100
GRAPH 1: SEX DISTRIBUTION IN CIRRHOTICS WITH EVs
In the present study, cirrhotics with EVs group comprised of 36 males (72%) and
14 females (28%) with male to female ratio of 2.57:1.
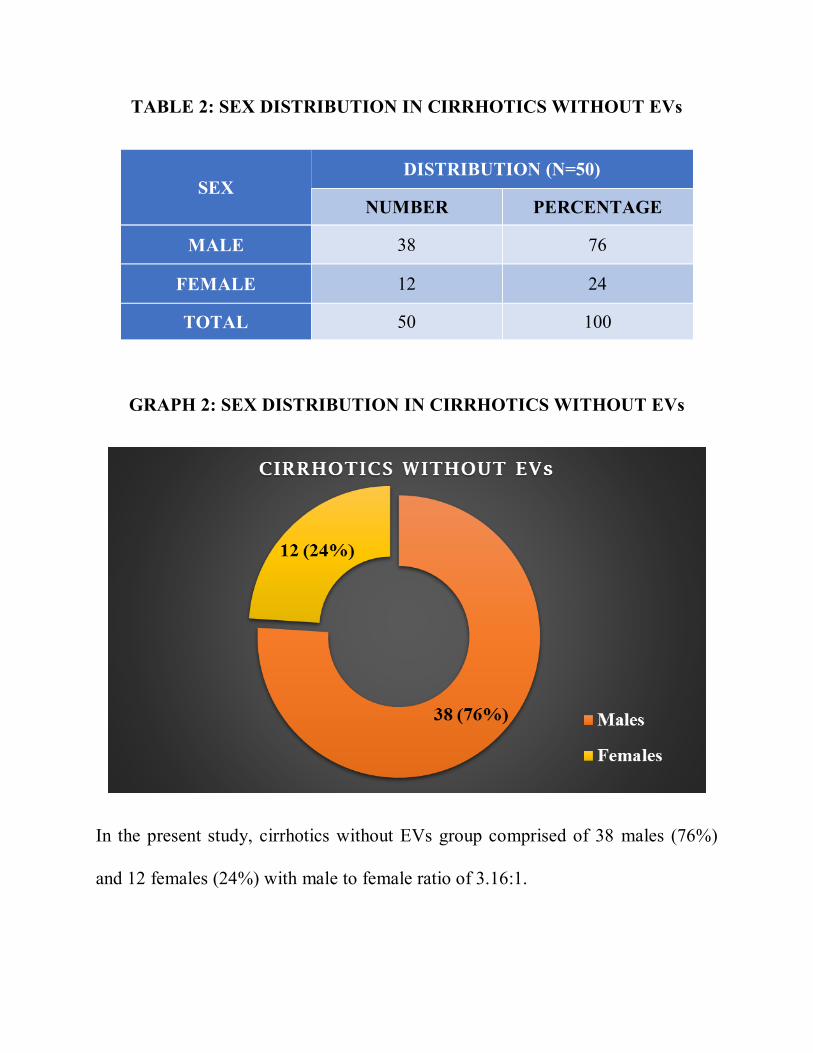
TABLE 2: SEX DISTRIBUTION IN CIRRHOTICS WITHOUT EVs
SEX DISTRIBUTION (N=50)
NUMBER PERCENTAGE
MALE 38 76
FEMALE 12 24
TOTAL 50 100
GRAPH 2: SEX DISTRIBUTION IN CIRRHOTICS WITHOUT EVs
In the present study, cirrhotics without EVs group comprised of 38 males (76%)
and 12 females (24%) with male to female ratio of 3.16:1.
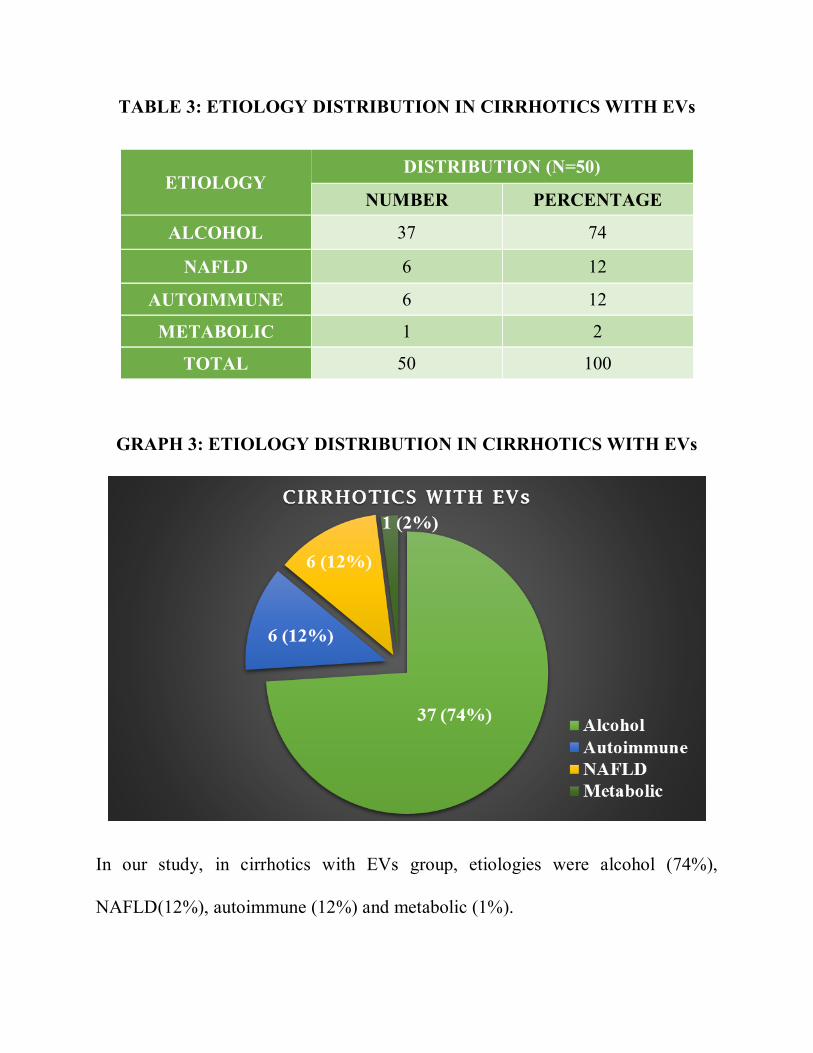
TABLE 3: ETIOLOGY DISTRIBUTION IN CIRRHOTICS WITH EVs
ETIOLOGY DISTRIBUTION (N=50)
NUMBER PERCENTAGE
ALCOHOL 37 74
NAFLD 6 12
AUTOIMMUNE 6 12
METABOLIC 1 2
TOTAL 50 100
GRAPH 3: ETIOLOGY DISTRIBUTION IN CIRRHOTICS WITH EVs
In our study, in cirrhotics with EVs group, etiologies were alcohol (74%),
NAFLD(12%), autoimmune (12%) and metabolic (1%).
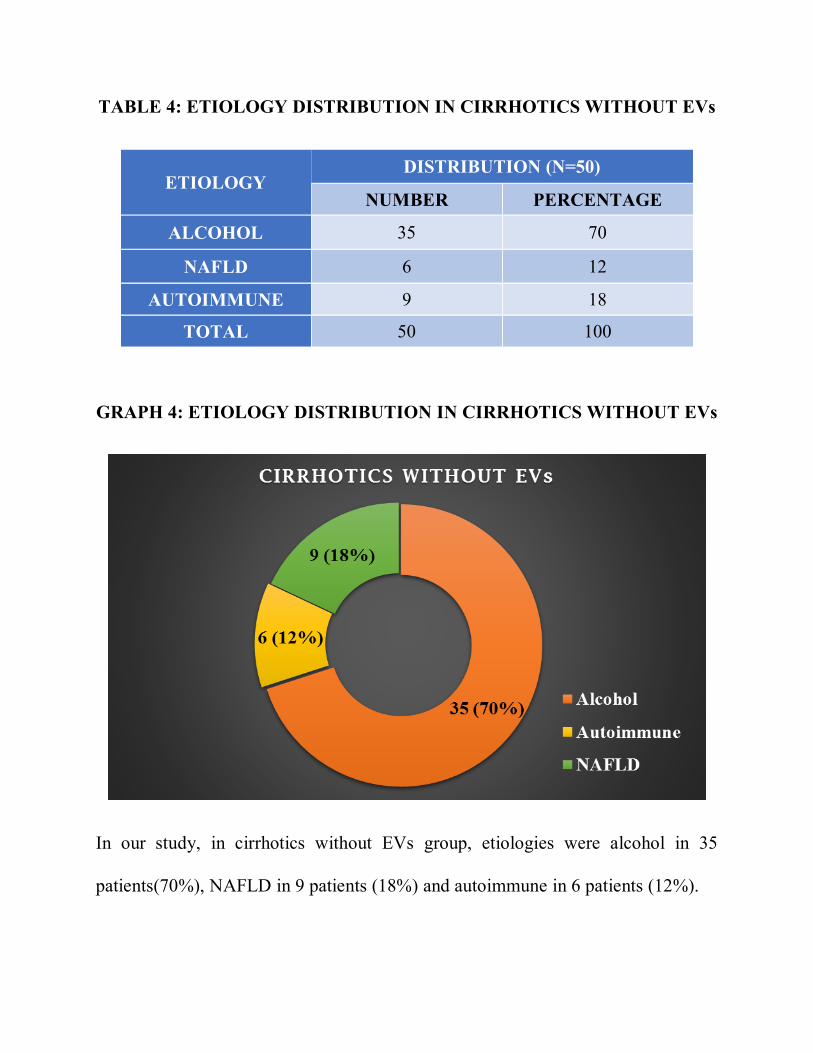
TABLE 4: ETIOLOGY DISTRIBUTION IN CIRRHOTICS WITHOUT EVs
ETIOLOGY DISTRIBUTION (N=50)
NUMBER PERCENTAGE
ALCOHOL 35 70
NAFLD 6 12
AUTOIMMUNE 9 18
TOTAL 50 100
GRAPH 4: ETIOLOGY DISTRIBUTION IN CIRRHOTICS WITHOUT EVs
In our study, in cirrhotics without EVs group, etiologies were alcohol in 35
patients(70%), NAFLD in 9 patients (18%) and autoimmune in 6 patients (12%).
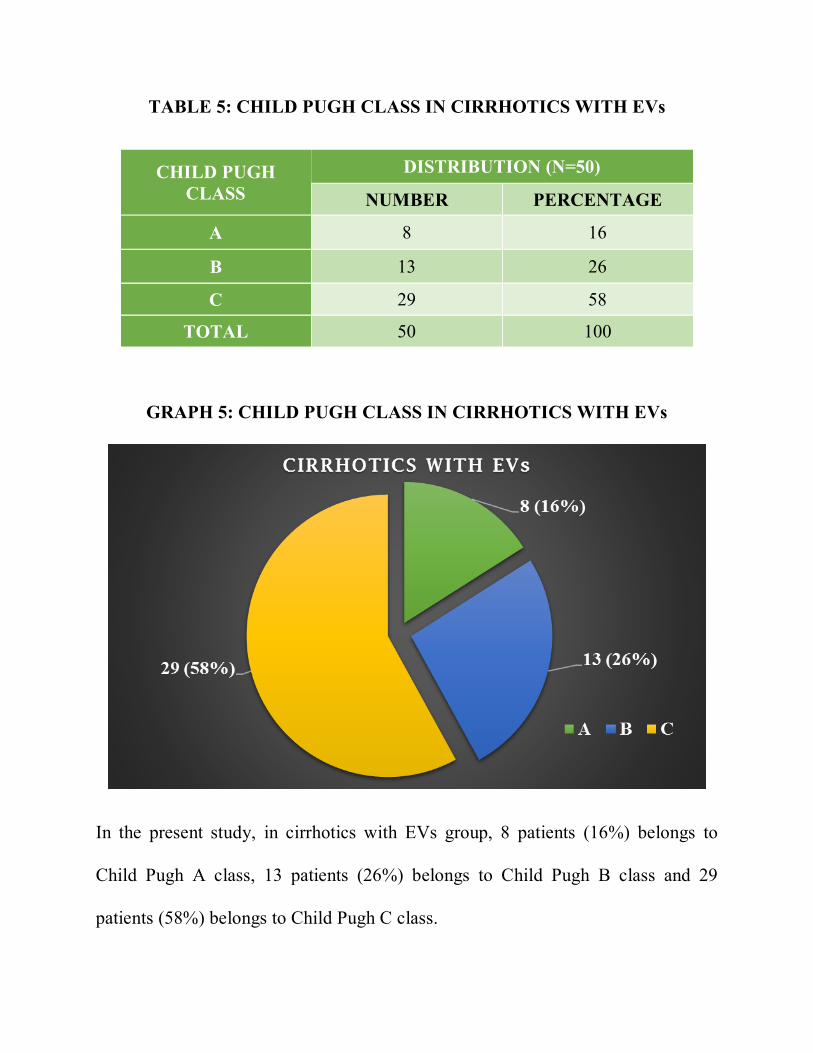
TABLE 5: CHILD PUGH CLASS IN CIRRHOTICS WITH EVs
CHILD PUGH CLASS
DISTRIBUTION (N=50)
NUMBER PERCENTAGE
A 8 16
B 13 26
C 29 58
TOTAL 50 100
GRAPH 5: CHILD PUGH CLASS IN CIRRHOTICS WITH EVs
In the present study, in cirrhotics with EVs group, 8 patients (16%) belongs to
Child Pugh A class, 13 patients (26%) belongs to Child Pugh B class and 29
patients (58%) belongs to Child Pugh C class.
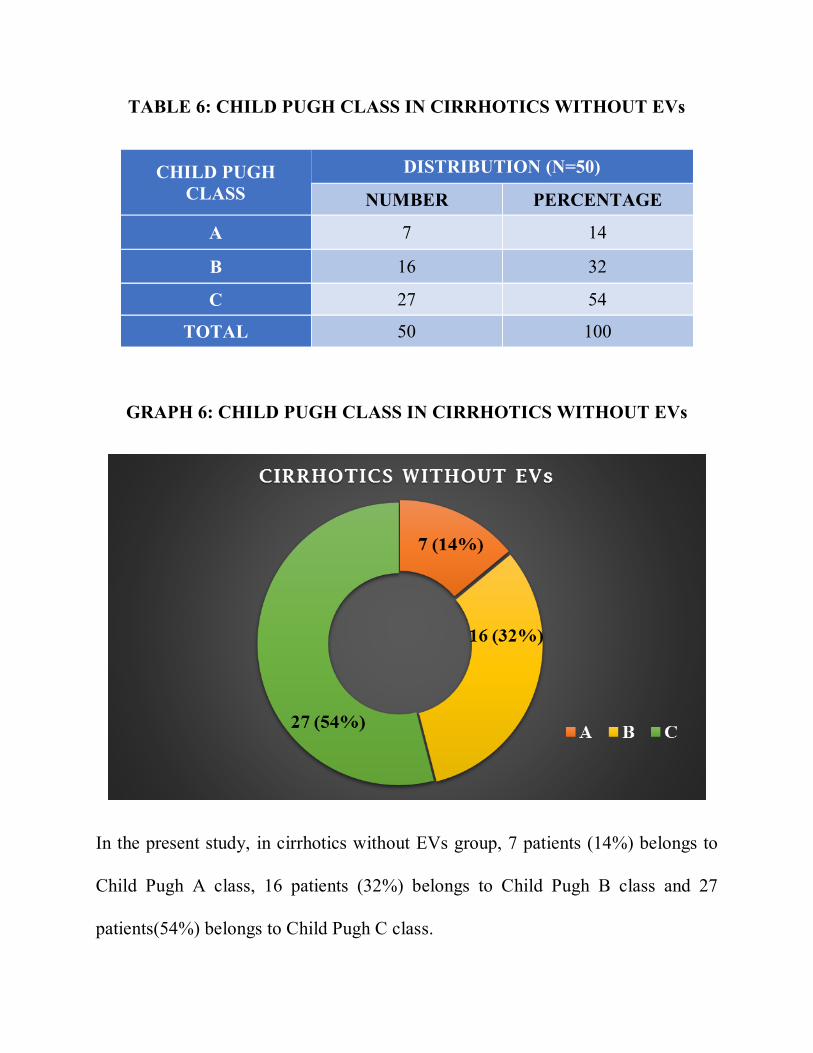
TABLE 6: CHILD PUGH CLASS IN CIRRHOTICS WITHOUT EVs
CHILD PUGH CLASS
DISTRIBUTION (N=50)
NUMBER PERCENTAGE
A 7 14
B 16 32
C 27 54
TOTAL 50 100
GRAPH 6: CHILD PUGH CLASS IN CIRRHOTICS WITHOUT EVs
In the present study, in cirrhotics without EVs group, 7 patients (14%) belongs to
Child Pugh A class, 16 patients (32%) belongs to Child Pugh B class and 27
patients(54%) belongs to Child Pugh C class.
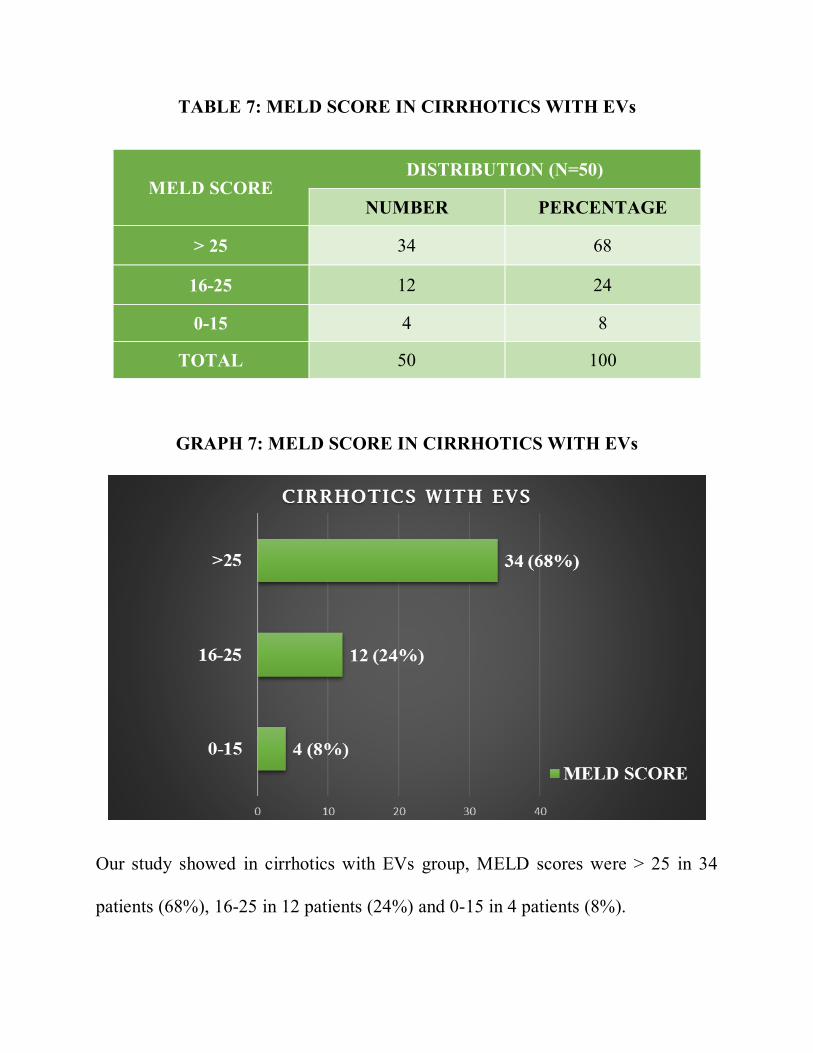
TABLE 7: MELD SCORE IN CIRRHOTICS WITH EVs
MELD SCORE DISTRIBUTION (N=50)
NUMBER PERCENTAGE
> 25 34 68
16-25 12 24
0-15 4 8
TOTAL 50 100
GRAPH 7: MELD SCORE IN CIRRHOTICS WITH EVs
Our study showed in cirrhotics with EVs group, MELD scores were > 25 in 34
patients (68%), 16-25 in 12 patients (24%) and 0-15 in 4 patients (8%).
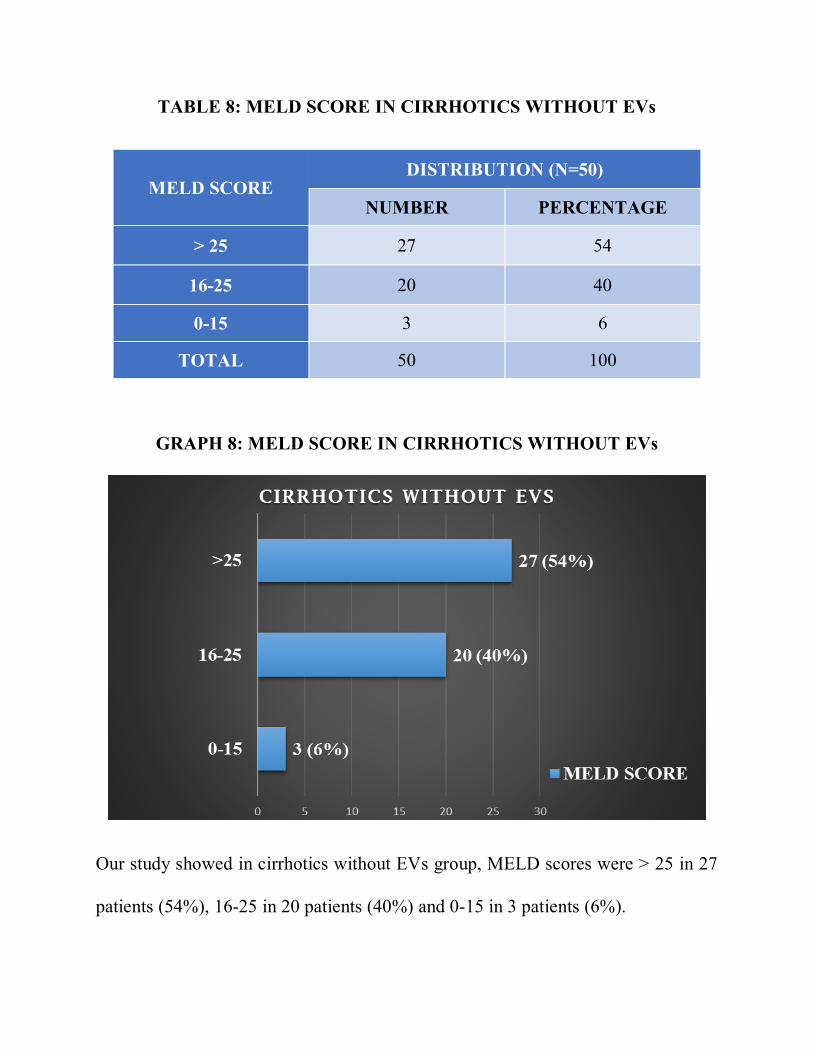
TABLE 8: MELD SCORE IN CIRRHOTICS WITHOUT EVs
MELD SCORE DISTRIBUTION (N=50)
NUMBER PERCENTAGE
> 25 27 54
16-25 20 40
0-15 3 6
TOTAL 50 100
GRAPH 8: MELD SCORE IN CIRRHOTICS WITHOUT EVs
Our study showed in cirrhotics without EVs group, MELD scores were > 25 in 27
patients (54%), 16-25 in 20 patients (40%) and 0-15 in 3 patients (6%).
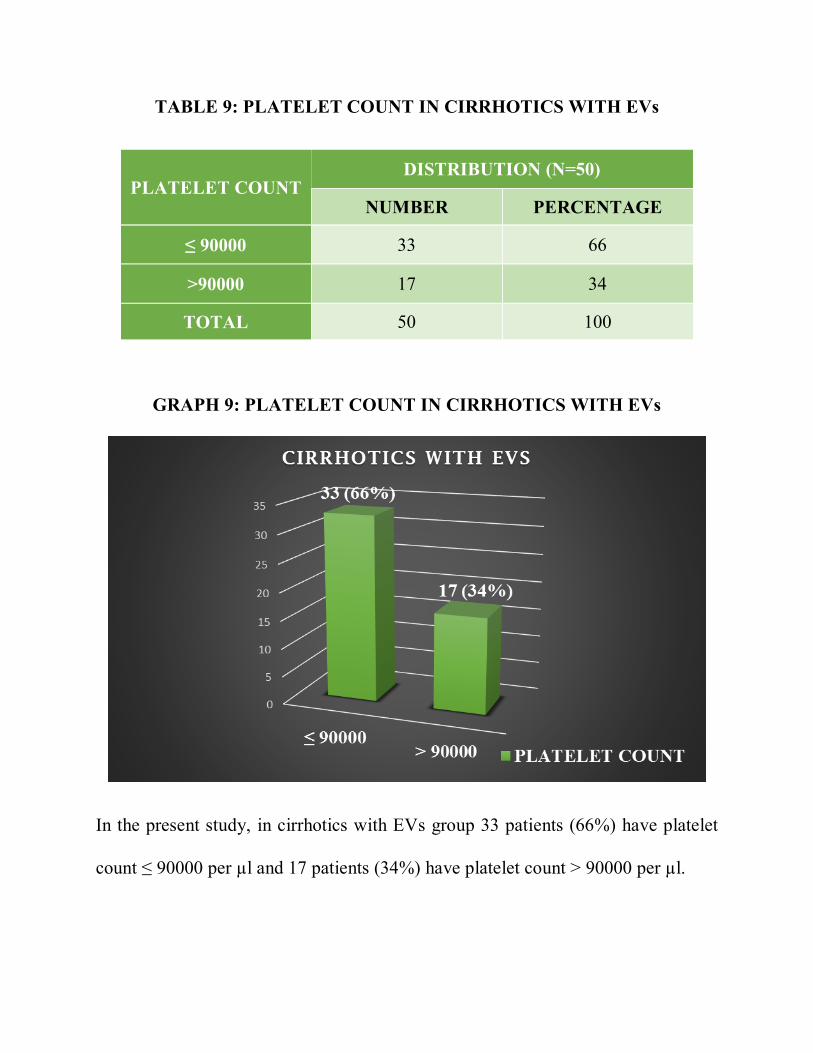
TABLE 9: PLATELET COUNT IN CIRRHOTICS WITH EVs
PLATELET COUNT DISTRIBUTION (N=50)
NUMBER PERCENTAGE
≤ 90000 33 66
>90000 17 34
TOTAL 50 100
GRAPH 9: PLATELET COUNT IN CIRRHOTICS WITH EVs
In the present study, in cirrhotics with EVs group 33 patients (66%) have platelet
count ≤ 90000 per µl and 17 patients (34%) have platelet count > 90000 per µl.
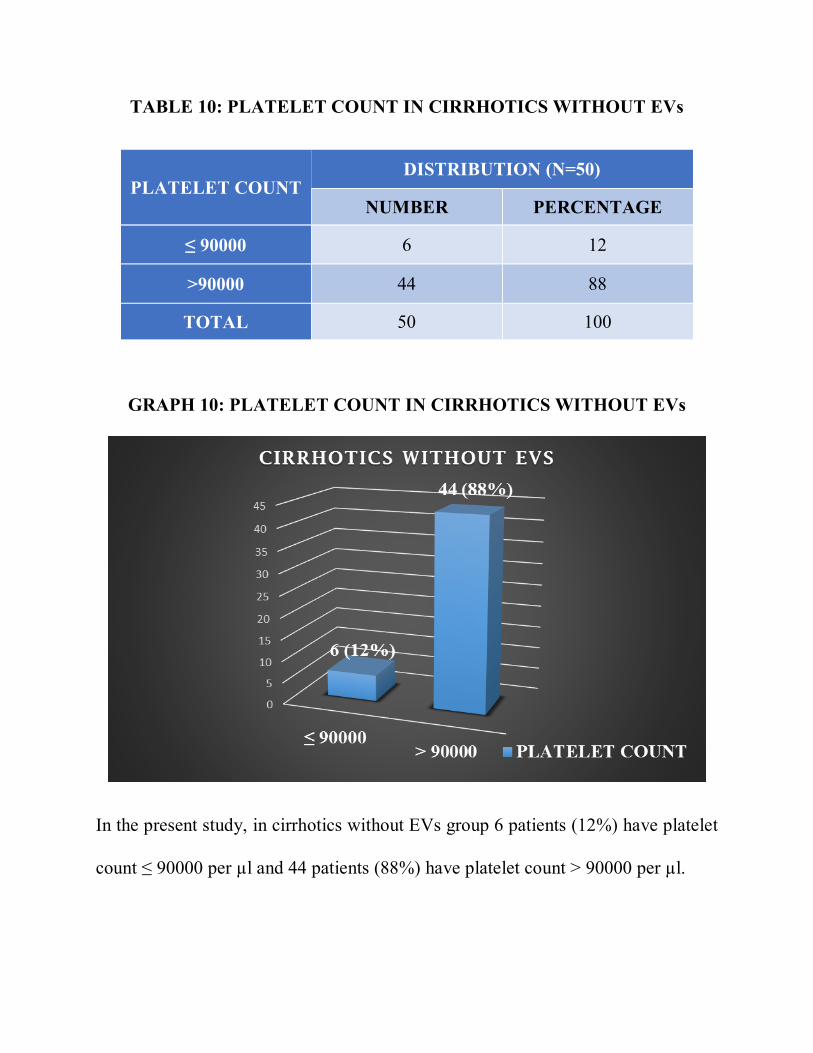
TABLE 10: PLATELET COUNT IN CIRRHOTICS WITHOUT EVs
PLATELET COUNT DISTRIBUTION (N=50)
NUMBER PERCENTAGE
≤ 90000 6 12
>90000 44 88
TOTAL 50 100
GRAPH 10: PLATELET COUNT IN CIRRHOTICS WITHOUT EVs
In the present study, in cirrhotics without EVs group 6 patients (12%) have platelet
count ≤ 90000 per µl and 44 patients (88%) have platelet count > 90000 per µl.
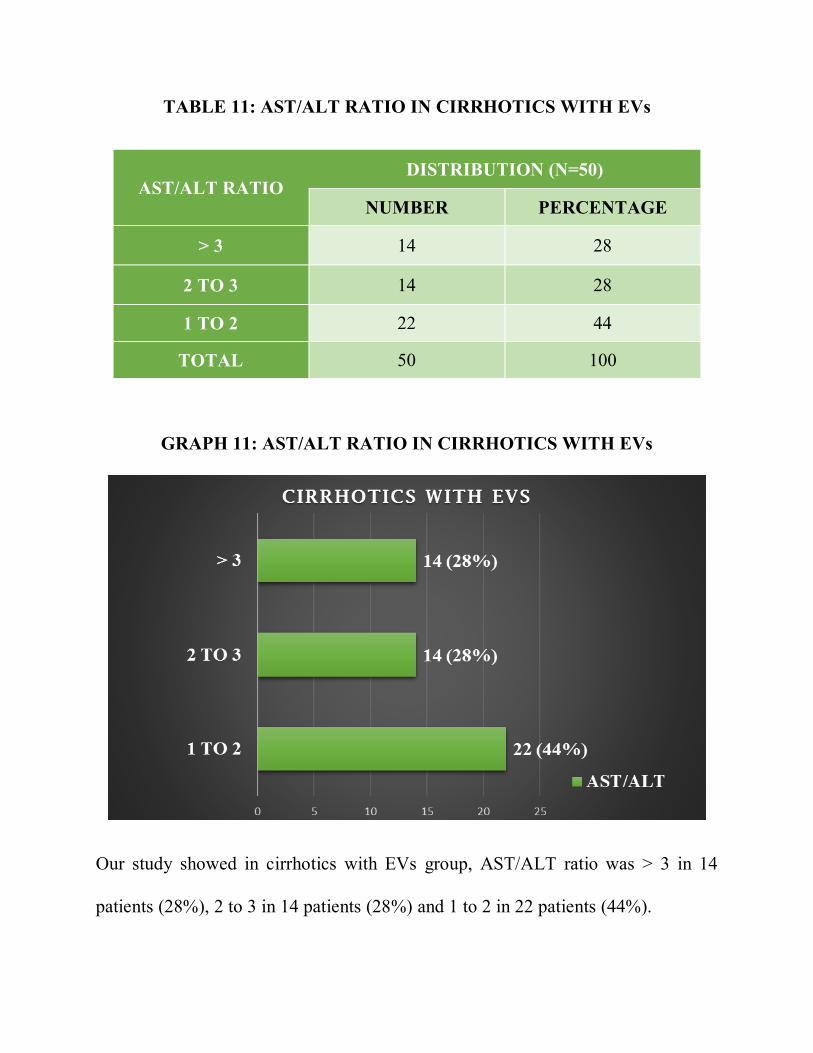
TABLE 11: AST/ALT RATIO IN CIRRHOTICS WITH EVs
AST/ALT RATIO DISTRIBUTION (N=50)
NUMBER PERCENTAGE
> 3 14 28
2 TO 3 14 28
1 TO 2 22 44
TOTAL 50 100
GRAPH 11: AST/ALT RATIO IN CIRRHOTICS WITH EVs
Our study showed in cirrhotics with EVs group, AST/ALT ratio was > 3 in 14
patients (28%), 2 to 3 in 14 patients (28%) and 1 to 2 in 22 patients (44%).
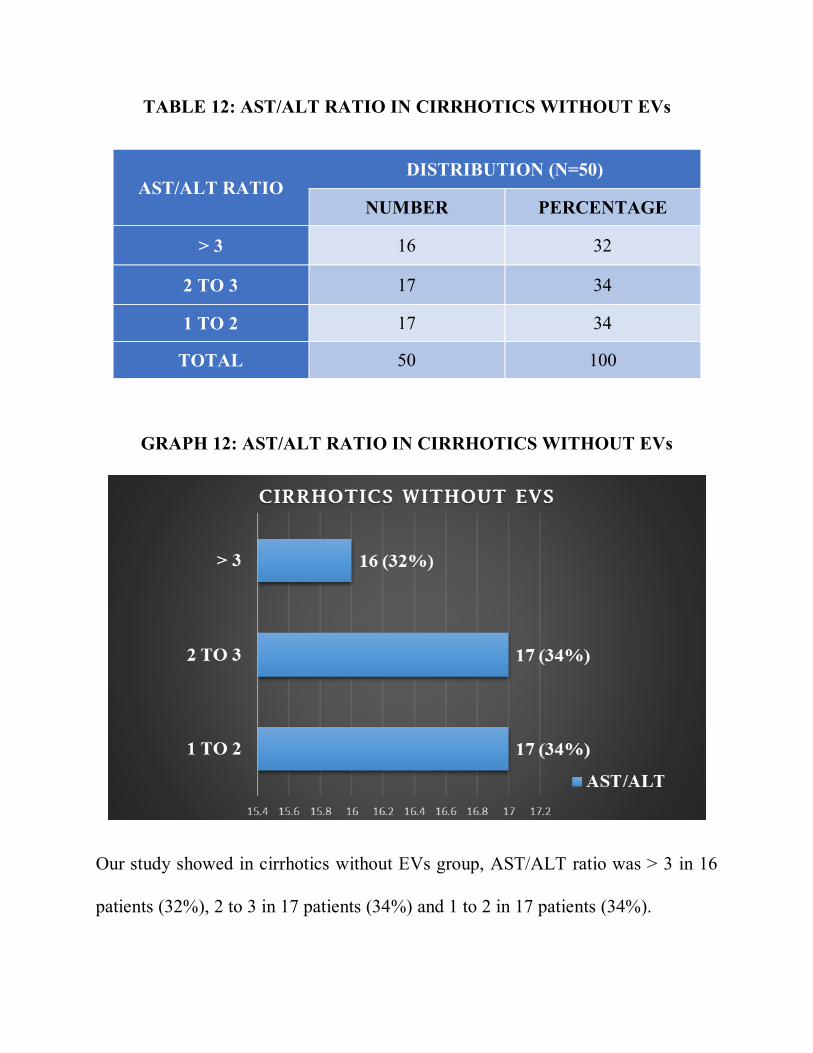
TABLE 12: AST/ALT RATIO IN CIRRHOTICS WITHOUT EVs
AST/ALT RATIO DISTRIBUTION (N=50)
NUMBER PERCENTAGE
> 3 16 32
2 TO 3 17 34
1 TO 2 17 34
TOTAL 50 100
GRAPH 12: AST/ALT RATIO IN CIRRHOTICS WITHOUT EVs
Our study showed in cirrhotics without EVs group, AST/ALT ratio was > 3 in 16
patients (32%), 2 to 3 in 17 patients (34%) and 1 to 2 in 17 patients (34%).
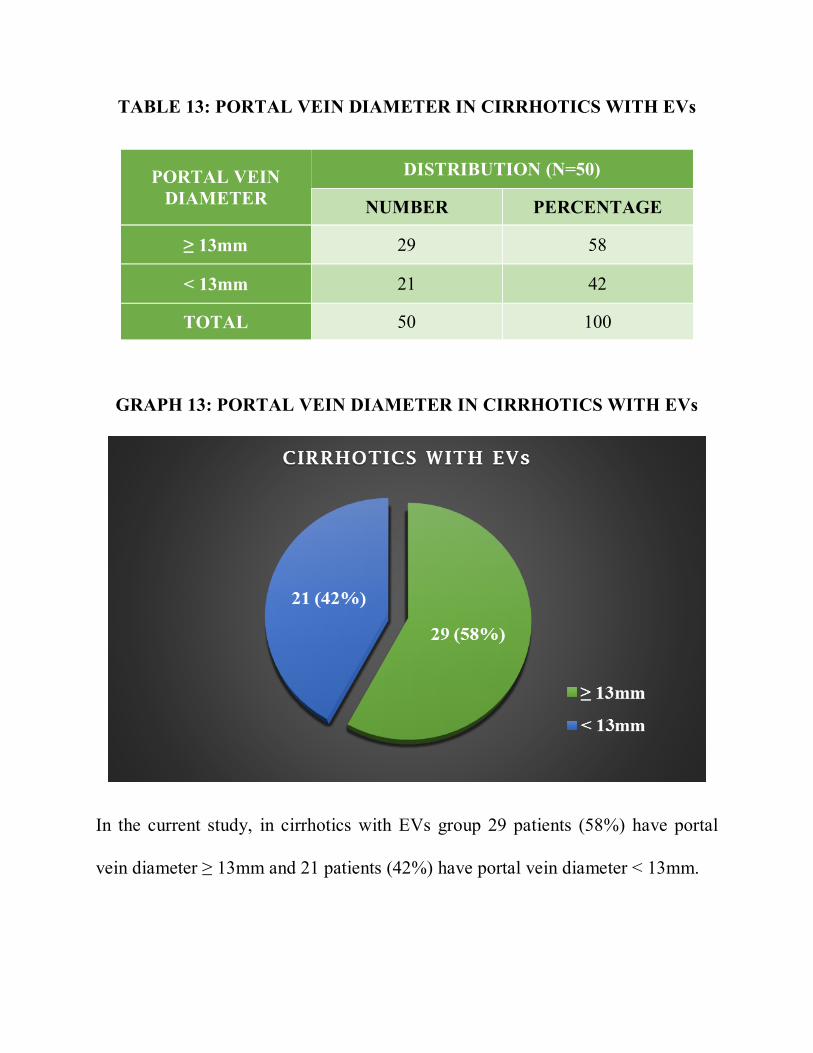
TABLE 13: PORTAL VEIN DIAMETER IN CIRRHOTICS WITH EVs
PORTAL VEIN DIAMETER
DISTRIBUTION (N=50)
NUMBER PERCENTAGE
≥ 13mm 29 58
< 13mm 21 42
TOTAL 50 100
GRAPH 13: PORTAL VEIN DIAMETER IN CIRRHOTICS WITH EVs
In the current study, in cirrhotics with EVs group 29 patients (58%) have portal
vein diameter ≥ 13mm and 21 patients (42%) have portal vein diameter < 13mm.
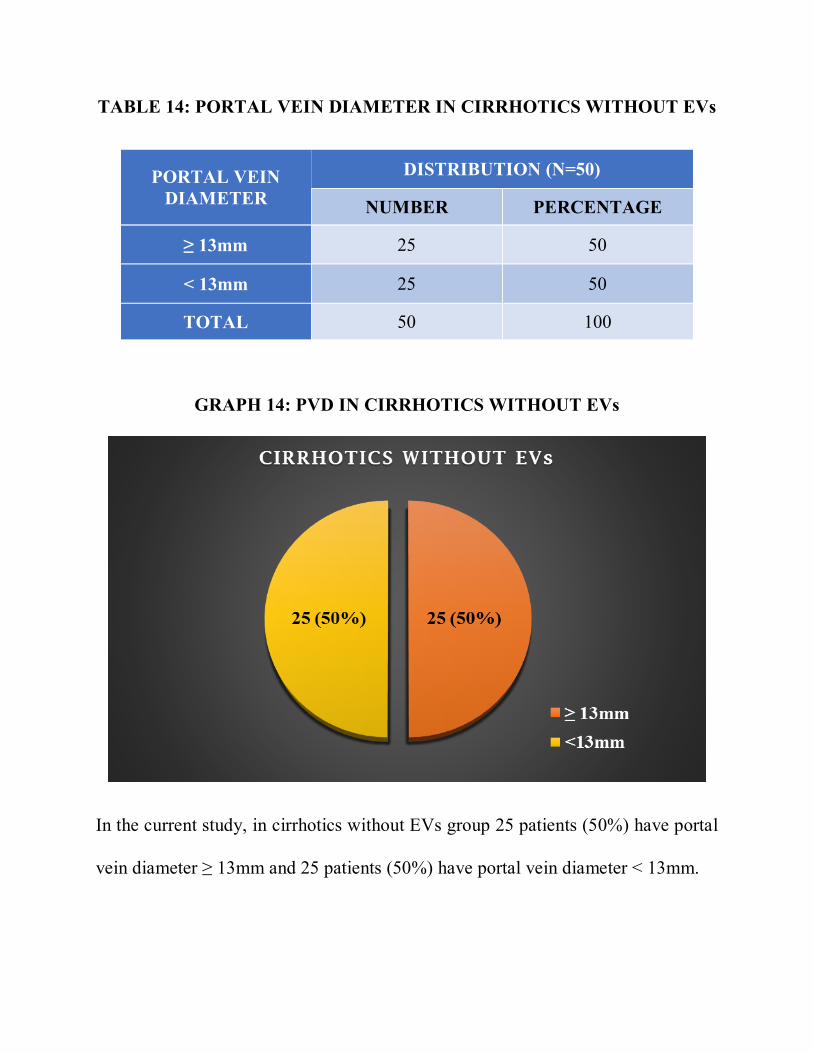
TABLE 14: PORTAL VEIN DIAMETER IN CIRRHOTICS WITHOUT EVs
PORTAL VEIN DIAMETER
DISTRIBUTION (N=50)
NUMBER PERCENTAGE
≥ 13mm 25 50
< 13mm 25 50
TOTAL 50 100
GRAPH 14: PVD IN CIRRHOTICS WITHOUT EVs
In the current study, in cirrhotics without EVs group 25 patients (50%) have portal
vein diameter ≥ 13mm and 25 patients (50%) have portal vein diameter < 13mm.
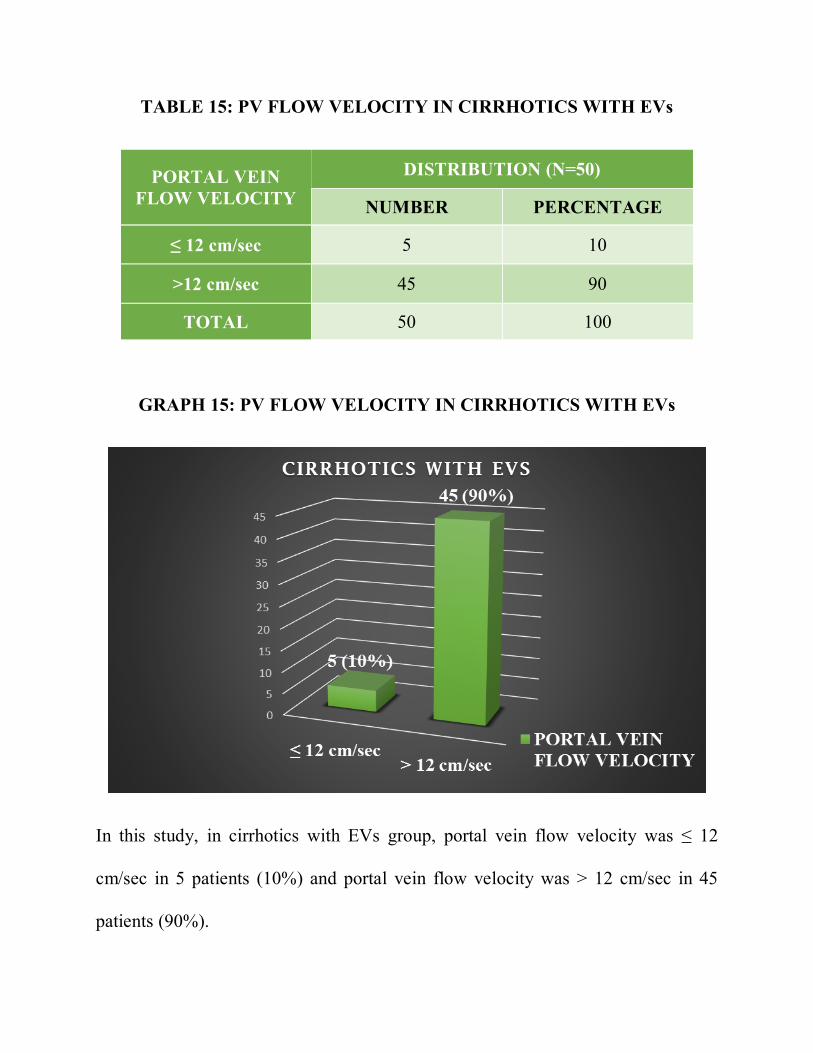
TABLE 15: PV FLOW VELOCITY IN CIRRHOTICS WITH EVs
PORTAL VEIN FLOW VELOCITY
DISTRIBUTION (N=50)
NUMBER PERCENTAGE
≤ 12 cm/sec 5 10
>12 cm/sec 45 90
TOTAL 50 100
GRAPH 15: PV FLOW VELOCITY IN CIRRHOTICS WITH EVs
In this study, in cirrhotics with EVs group, portal vein flow velocity was ≤ 12
cm/sec in 5 patients (10%) and portal vein flow velocity was > 12 cm/sec in 45
patients (90%).
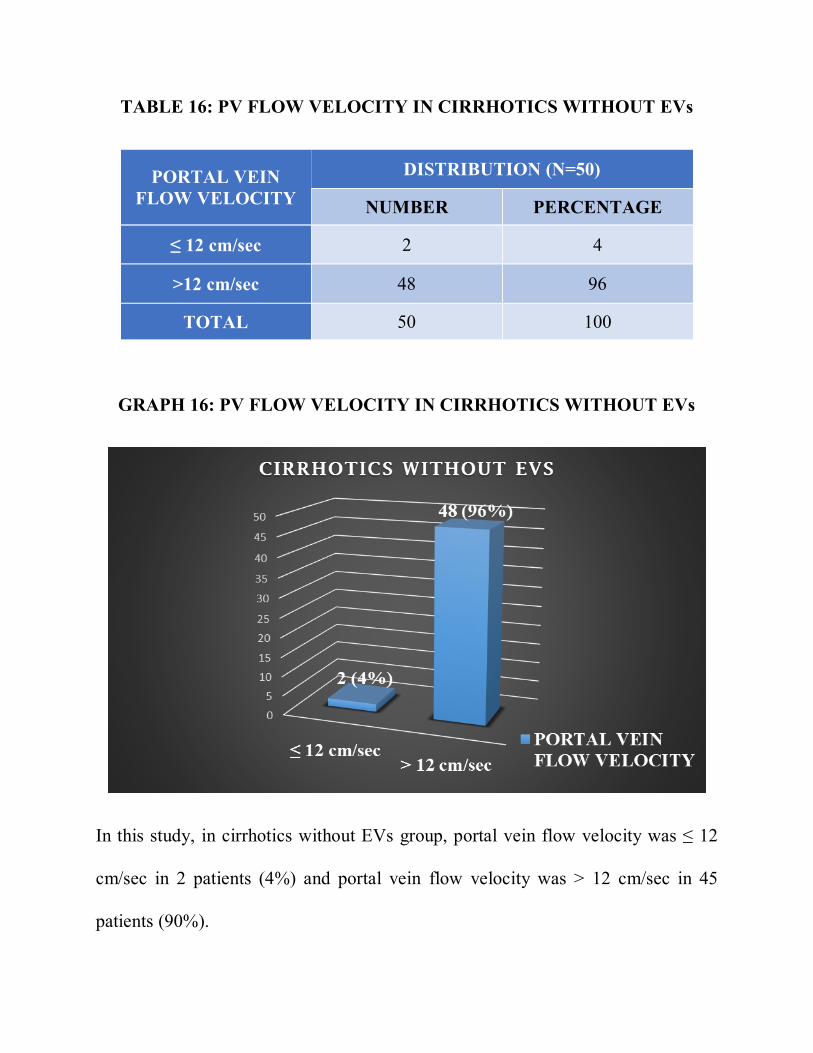
TABLE 16: PV FLOW VELOCITY IN CIRRHOTICS WITHOUT EVs
PORTAL VEIN FLOW VELOCITY
DISTRIBUTION (N=50)
NUMBER PERCENTAGE
≤ 12 cm/sec 2 4
>12 cm/sec 48 96
TOTAL 50 100
GRAPH 16: PV FLOW VELOCITY IN CIRRHOTICS WITHOUT EVs
In this study, in cirrhotics without EVs group, portal vein flow velocity was ≤ 12
cm/sec in 2 patients (4%) and portal vein flow velocity was > 12 cm/sec in 45
patients (90%).
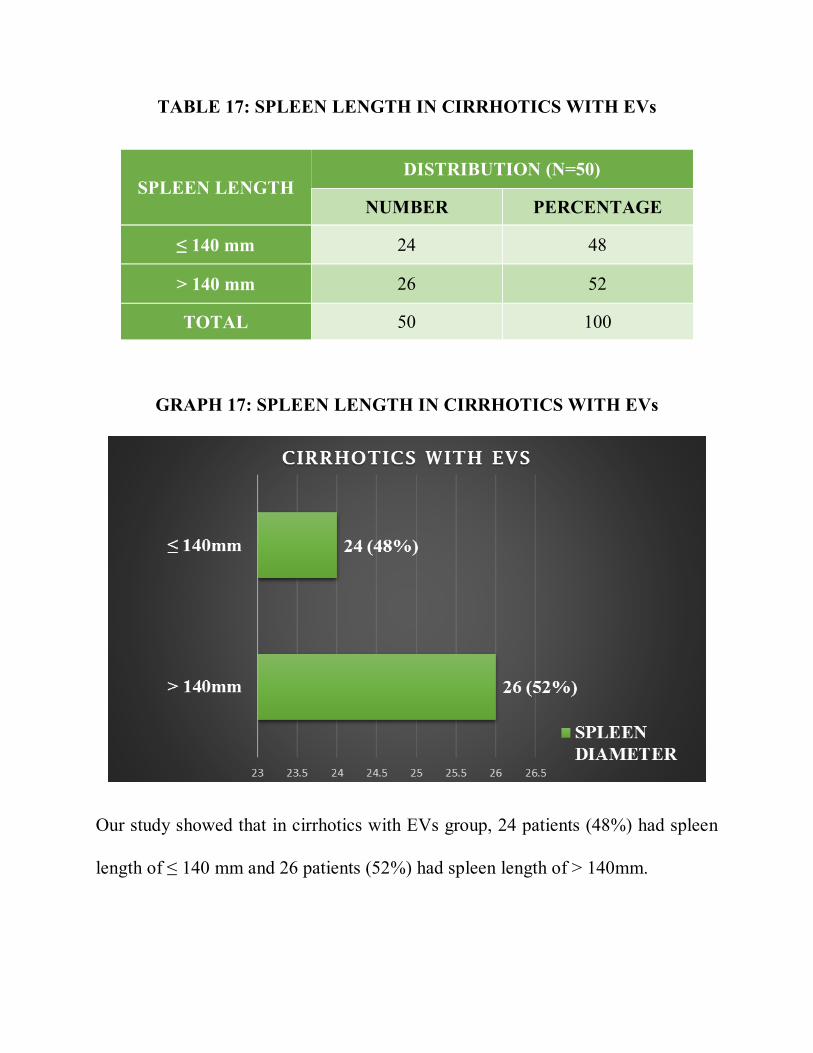
TABLE 17: SPLEEN LENGTH IN CIRRHOTICS WITH EVs
SPLEEN LENGTH DISTRIBUTION (N=50)
NUMBER PERCENTAGE
≤ 140 mm 24 48
> 140 mm 26 52
TOTAL 50 100
GRAPH 17: SPLEEN LENGTH IN CIRRHOTICS WITH EVs
Our study showed that in cirrhotics with EVs group, 24 patients (48%) had spleen
length of ≤ 140 mm and 26 patients (52%) had spleen length of > 140mm.
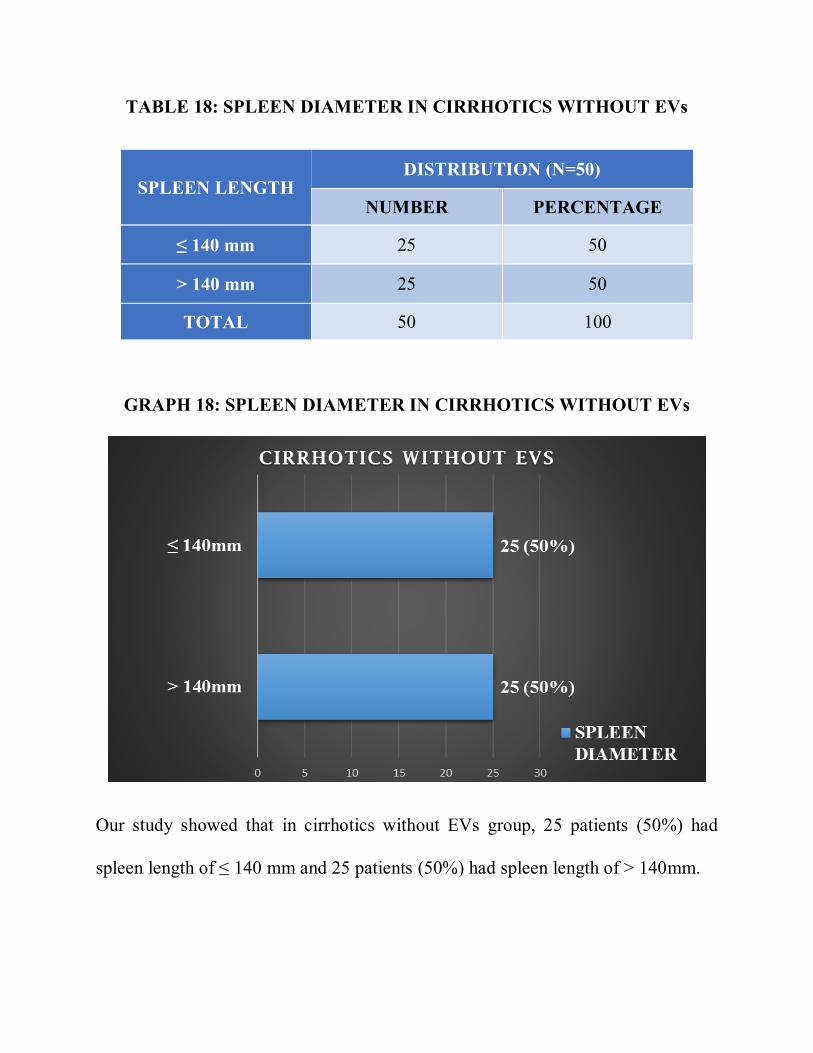
TABLE 18: SPLEEN DIAMETER IN CIRRHOTICS WITHOUT EVs
SPLEEN LENGTH DISTRIBUTION (N=50)
NUMBER PERCENTAGE
≤ 140 mm 25 50
> 140 mm 25 50
TOTAL 50 100
GRAPH 18: SPLEEN DIAMETER IN CIRRHOTICS WITHOUT EVs
Our study showed that in cirrhotics without EVs group, 25 patients (50%) had
spleen length of ≤ 140 mm and 25 patients (50%) had spleen length of > 140mm.
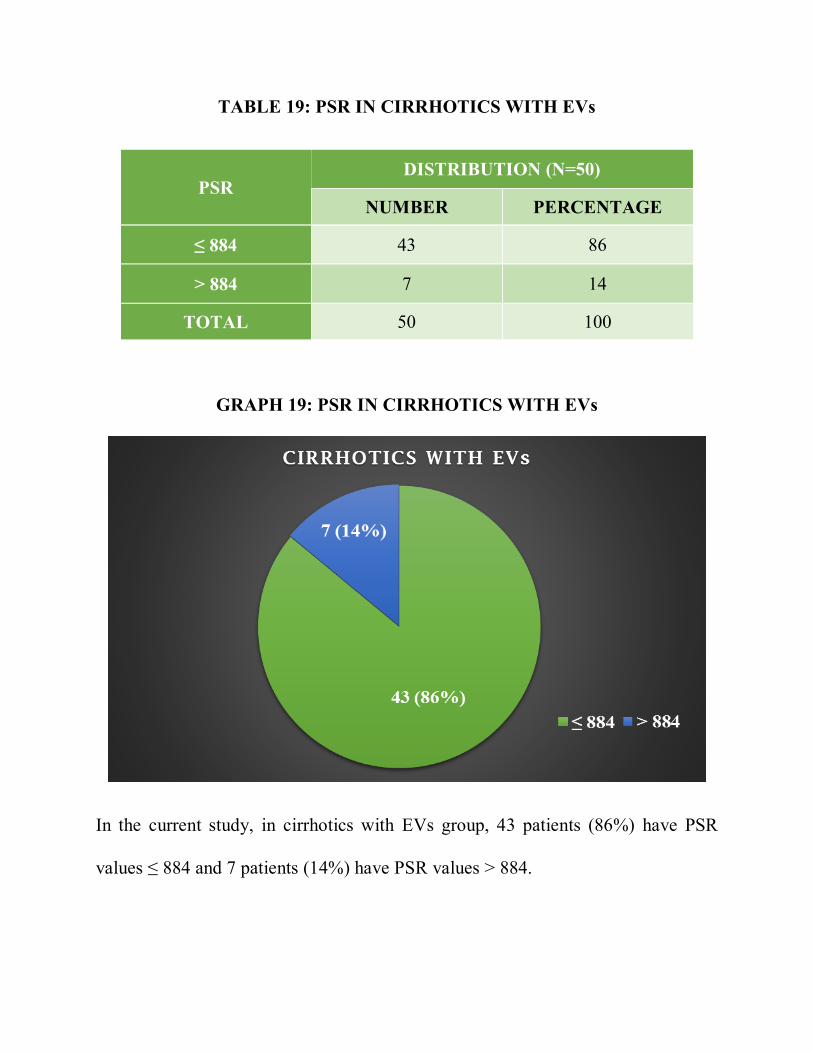
TABLE 19: PSR IN CIRRHOTICS WITH EVs
PSR DISTRIBUTION (N=50)
NUMBER PERCENTAGE
≤ 884 43 86
> 884 7 14
TOTAL 50 100
GRAPH 19: PSR IN CIRRHOTICS WITH EVs
In the current study, in cirrhotics with EVs group, 43 patients (86%) have PSR
values ≤ 884 and 7 patients (14%) have PSR values > 884.
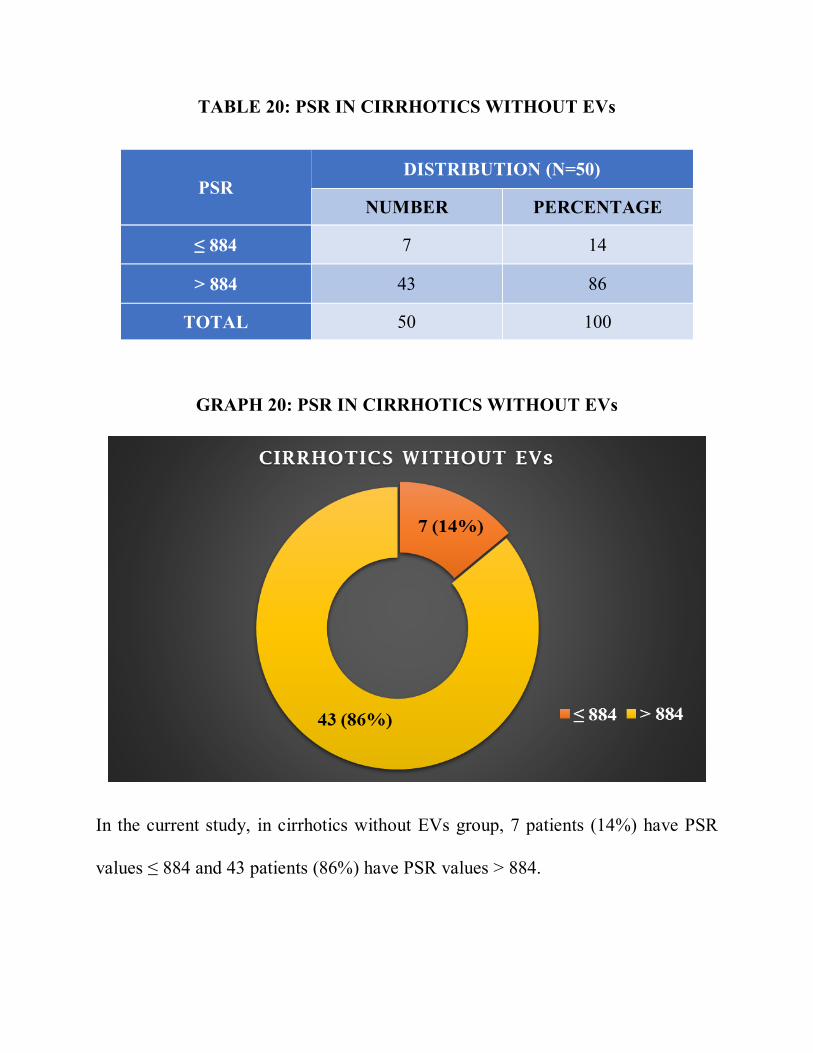
TABLE 20: PSR IN CIRRHOTICS WITHOUT EVs
PSR DISTRIBUTION (N=50)
NUMBER PERCENTAGE
≤ 884 7 14
> 884 43 86
TOTAL 50 100
GRAPH 20: PSR IN CIRRHOTICS WITHOUT EVs
In the current study, in cirrhotics without EVs group, 7 patients (14%) have PSR
values ≤ 884 and 43 patients (86%) have PSR values > 884.
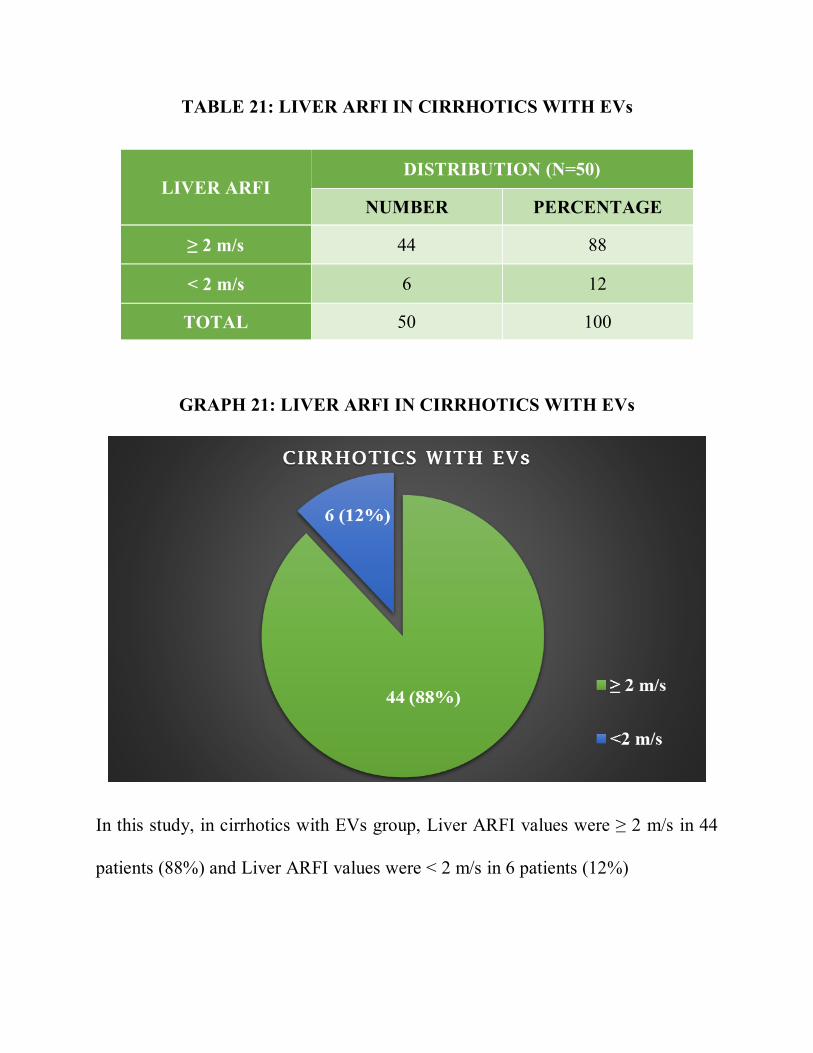
TABLE 21: LIVER ARFI IN CIRRHOTICS WITH EVs
LIVER ARFI DISTRIBUTION (N=50)
NUMBER PERCENTAGE
≥ 2 m/s 44 88
< 2 m/s 6 12
TOTAL 50 100
GRAPH 21: LIVER ARFI IN CIRRHOTICS WITH EVs
In this study, in cirrhotics with EVs group, Liver ARFI values were ≥ 2 m/s in 44
patients (88%) and Liver ARFI values were < 2 m/s in 6 patients (12%)
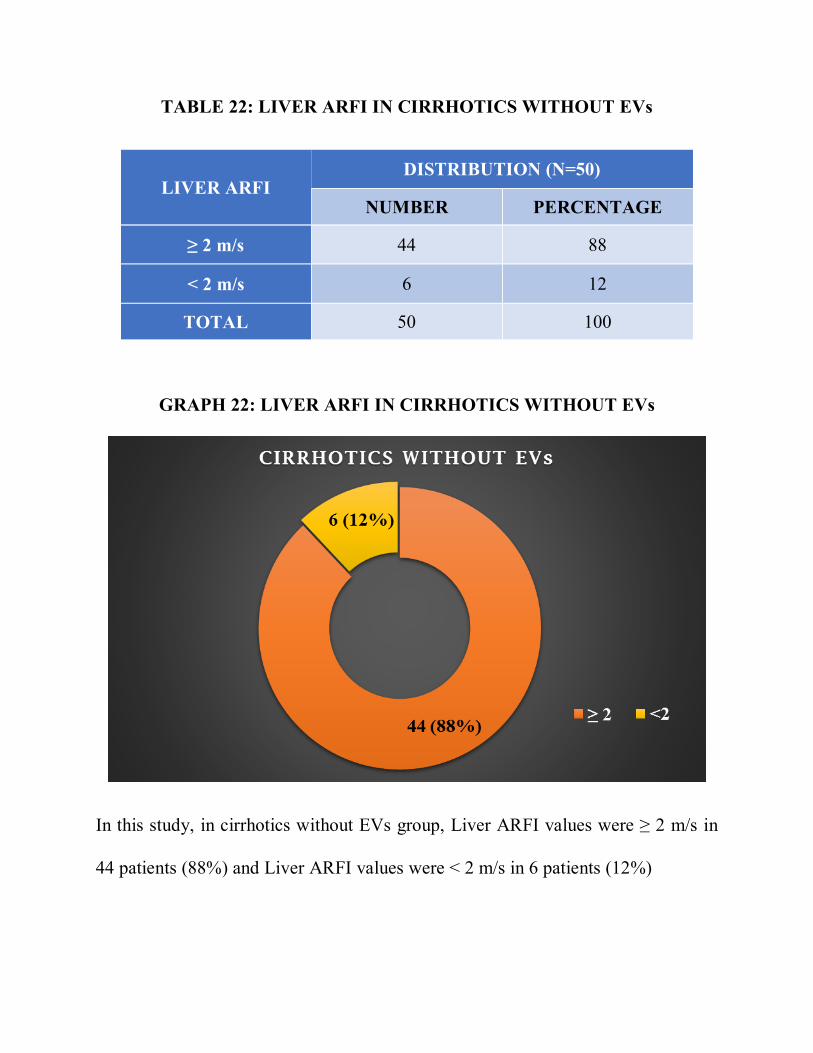
TABLE 22: LIVER ARFI IN CIRRHOTICS WITHOUT EVs
LIVER ARFI DISTRIBUTION (N=50)
NUMBER PERCENTAGE
≥ 2 m/s 44 88
< 2 m/s 6 12
TOTAL 50 100
GRAPH 22: LIVER ARFI IN CIRRHOTICS WITHOUT EVs
In this study, in cirrhotics without EVs group, Liver ARFI values were ≥ 2 m/s in
44 patients (88%) and Liver ARFI values were < 2 m/s in 6 patients (12%)

TABLE 23: SPLEEN ARFI IN CIRRHOTICS WITH EVs
SPLEEN ARFI DISTRIBUTION (N=50)
NUMBER PERCENTAGE
< 3.18 4 8
≥ 3.18 m/s 46 92
TOTAL 50 100
GRAPH 23: SPLEEN ARFI IN CIRRHOTICS WITH EVs
Our study showed that in cirrhotics with EVs group, 46 patients (92%) had spleen
ARFI values of ≥ 3.18m/s and 4 patients (8%) had ARFI values of < 3.18m/s.
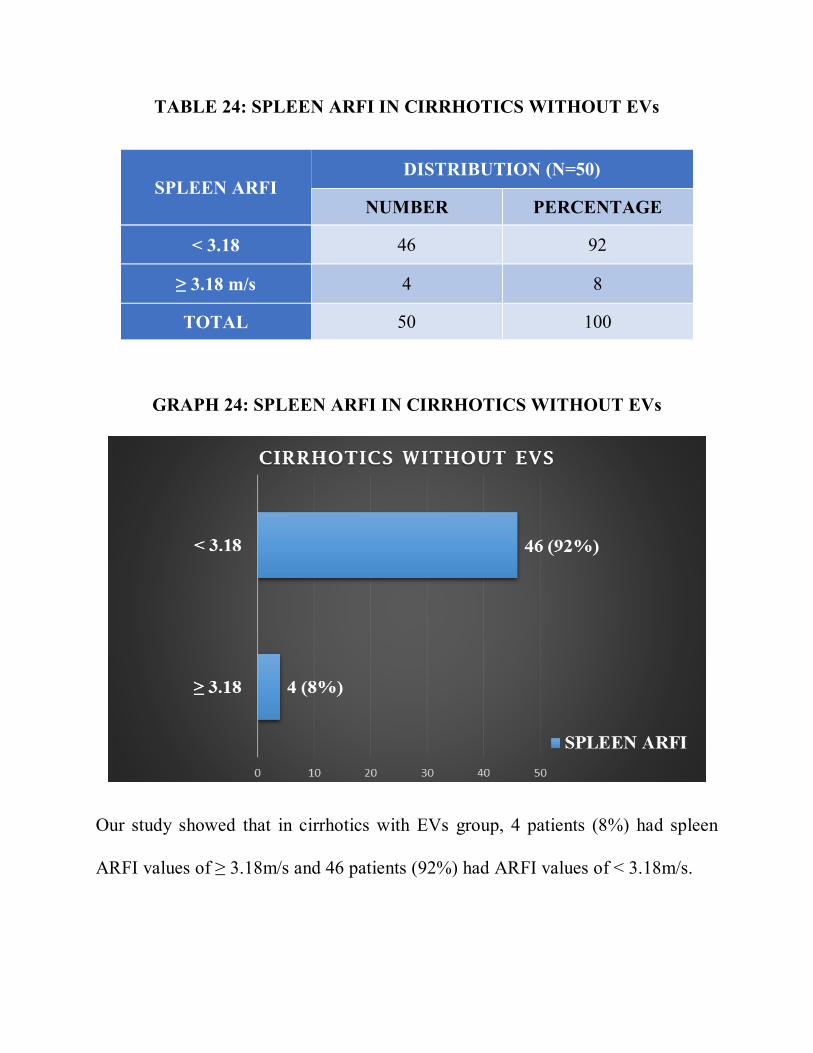
TABLE 24: SPLEEN ARFI IN CIRRHOTICS WITHOUT EVs
SPLEEN ARFI DISTRIBUTION (N=50)
NUMBER PERCENTAGE
< 3.18 46 92
≥ 3.18 m/s 4 8
TOTAL 50 100
GRAPH 24: SPLEEN ARFI IN CIRRHOTICS WITHOUT EVs
Our study showed that in cirrhotics with EVs group, 4 patients (8%) had spleen
ARFI values of ≥ 3.18m/s and 46 patients (92%) had ARFI values of < 3.18m/s.
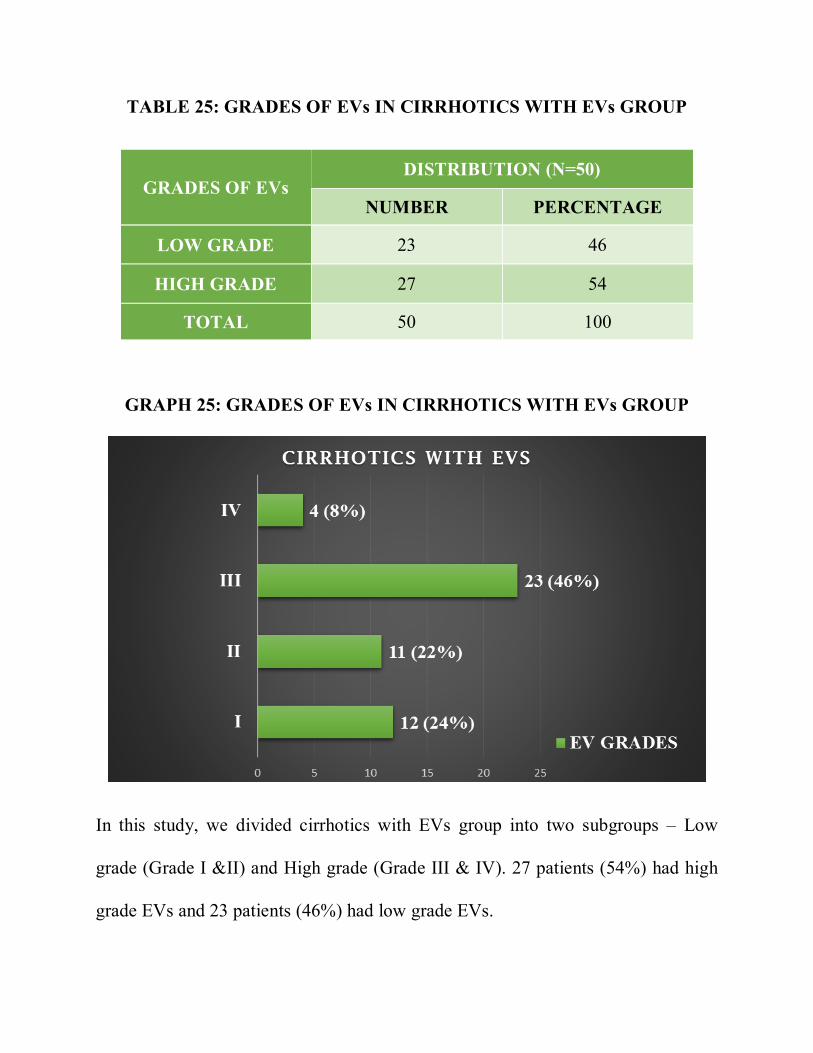
TABLE 25: GRADES OF EVs IN CIRRHOTICS WITH EVs GROUP
GRADES OF EVs DISTRIBUTION (N=50)
NUMBER PERCENTAGE
LOW GRADE 23 46
HIGH GRADE 27 54
TOTAL 50 100
GRAPH 25: GRADES OF EVs IN CIRRHOTICS WITH EVs GROUP
In this study, we divided cirrhotics with EVs group into two subgroups – Low
grade (Grade I &II) and High grade (Grade III & IV). 27 patients (54%) had high
grade EVs and 23 patients (46%) had low grade EVs.
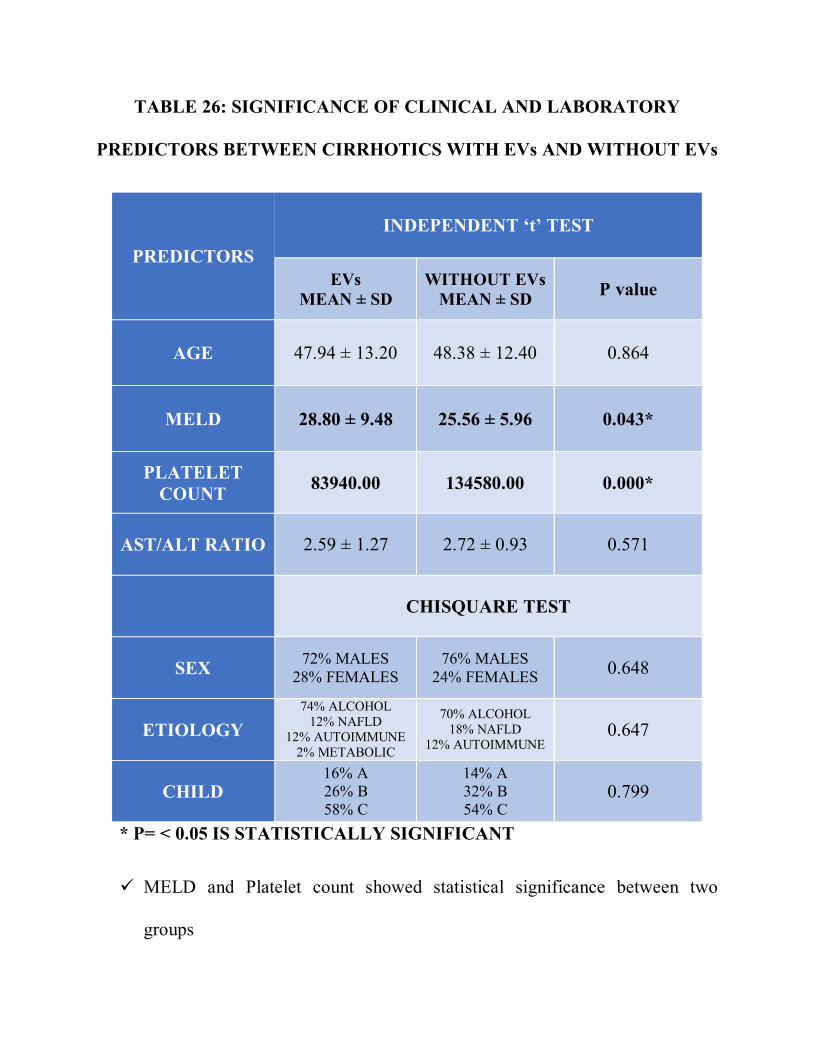
TABLE 26: SIGNIFICANCE OF CLINICAL AND LABORATORY
PREDICTORS BETWEEN CIRRHOTICS WITH EVs AND WITHOUT EVs
PREDICTORS
INDEPENDENT ‘t’ TEST
EVs MEAN ± SD
WITHOUT EVs MEAN ± SD P value
AGE 47.94 ± 13.20 48.38 ± 12.40 0.864
MELD 28.80 ± 9.48 25.56 ± 5.96 0.043*
PLATELET COUNT 83940.00 134580.00 0.000*
AST/ALT RATIO 2.59 ± 1.27 2.72 ± 0.93 0.571
CHISQUARE TEST
SEX 72% MALES 28% FEMALES
76% MALES 24% FEMALES 0.648
ETIOLOGY 74% ALCOHOL
12% NAFLD 12% AUTOIMMUNE
2% METABOLIC
70% ALCOHOL 18% NAFLD
12% AUTOIMMUNE 0.647
CHILD 16% A 26% B 58% C
14% A 32% B 54% C
0.799
* P= < 0.05 IS STATISTICALLY SIGNIFICANT
MELD and Platelet count showed statistical significance between two
groups
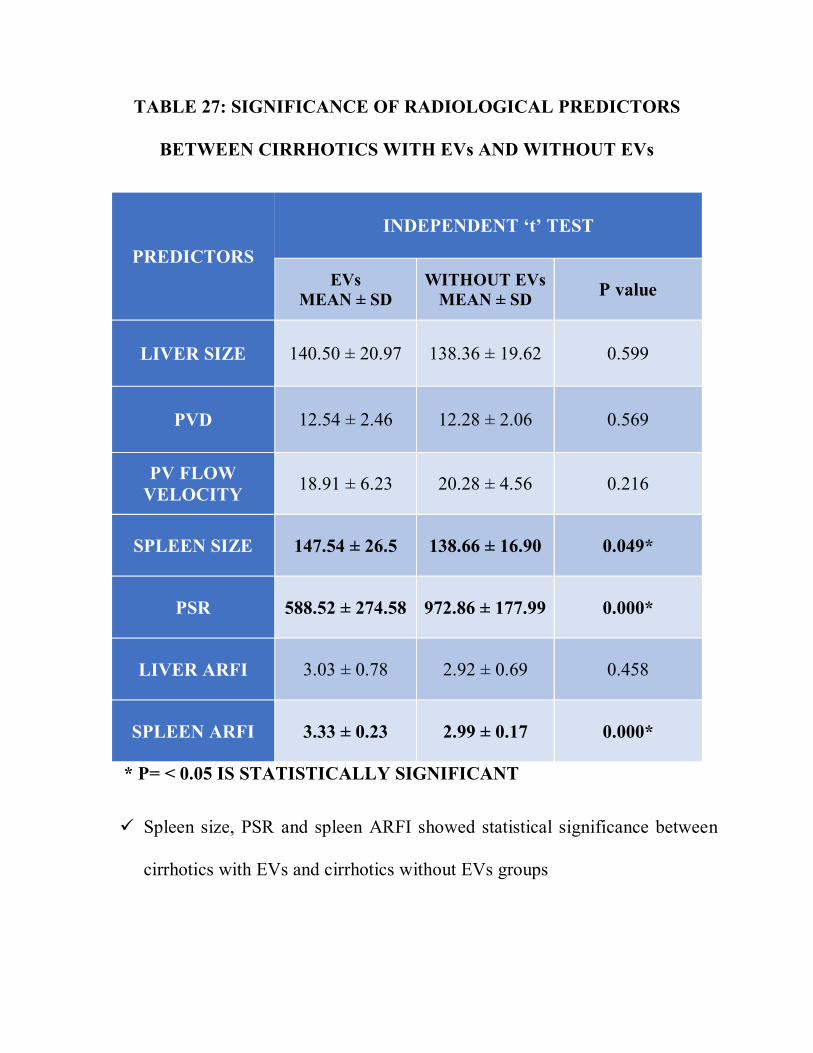
TABLE 27: SIGNIFICANCE OF RADIOLOGICAL PREDICTORS
BETWEEN CIRRHOTICS WITH EVs AND WITHOUT EVs
PREDICTORS
INDEPENDENT ‘t’ TEST
EVs MEAN ± SD
WITHOUT EVs MEAN ± SD P value
LIVER SIZE 140.50 ± 20.97 138.36 ± 19.62 0.599
PVD 12.54 ± 2.46 12.28 ± 2.06 0.569
PV FLOW VELOCITY 18.91 ± 6.23 20.28 ± 4.56 0.216
SPLEEN SIZE 147.54 ± 26.5 138.66 ± 16.90 0.049*
PSR 588.52 ± 274.58 972.86 ± 177.99 0.000*
LIVER ARFI 3.03 ± 0.78 2.92 ± 0.69 0.458
SPLEEN ARFI 3.33 ± 0.23 2.99 ± 0.17 0.000*
* P= < 0.05 IS STATISTICALLY SIGNIFICANT
Spleen size, PSR and spleen ARFI showed statistical significance between
cirrhotics with EVs and cirrhotics without EVs groups
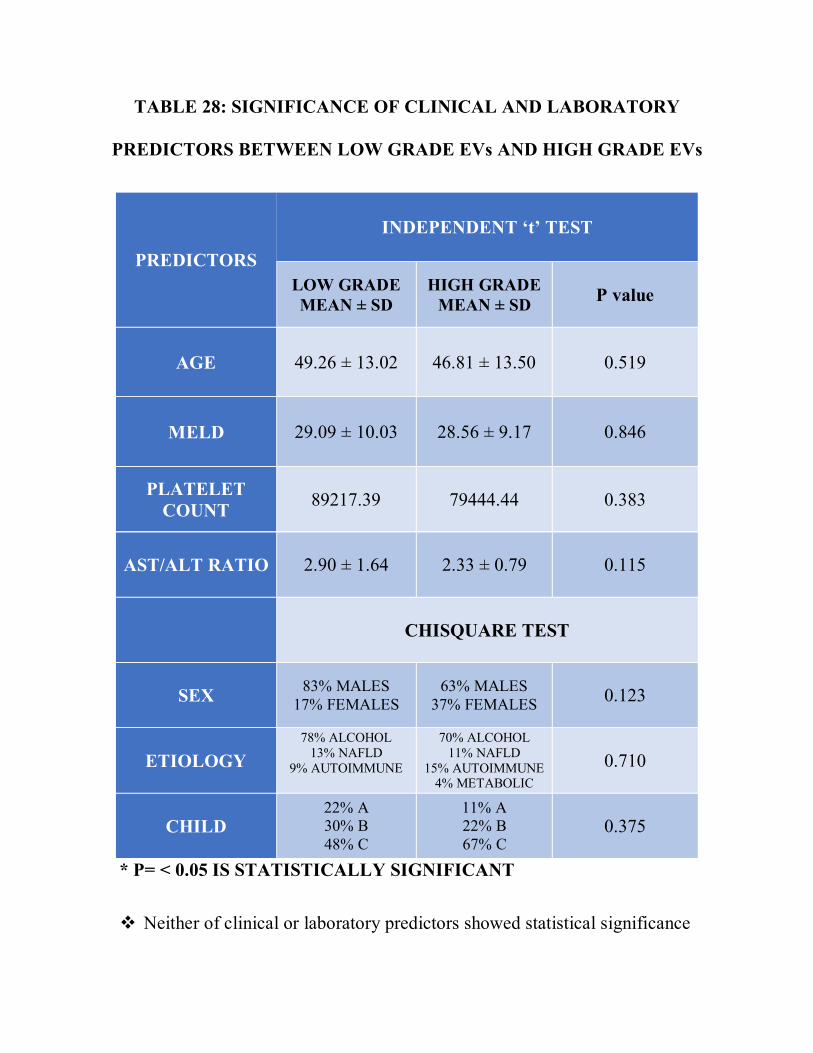
TABLE 28: SIGNIFICANCE OF CLINICAL AND LABORATORY
PREDICTORS BETWEEN LOW GRADE EVs AND HIGH GRADE EVs
PREDICTORS
INDEPENDENT ‘t’ TEST
LOW GRADE MEAN ± SD
HIGH GRADE MEAN ± SD P value
AGE 49.26 ± 13.02 46.81 ± 13.50 0.519
MELD 29.09 ± 10.03 28.56 ± 9.17 0.846
PLATELET COUNT 89217.39 79444.44 0.383
AST/ALT RATIO 2.90 ± 1.64 2.33 ± 0.79 0.115
CHISQUARE TEST
SEX 83% MALES 17% FEMALES
63% MALES 37% FEMALES 0.123
ETIOLOGY 78% ALCOHOL
13% NAFLD 9% AUTOIMMUNE
70% ALCOHOL 11% NAFLD
15% AUTOIMMUNE 4% METABOLIC
0.710
CHILD 22% A 30% B 48% C
11% A 22% B 67% C
0.375
* P= < 0.05 IS STATISTICALLY SIGNIFICANT
Neither of clinical or laboratory predictors showed statistical significance
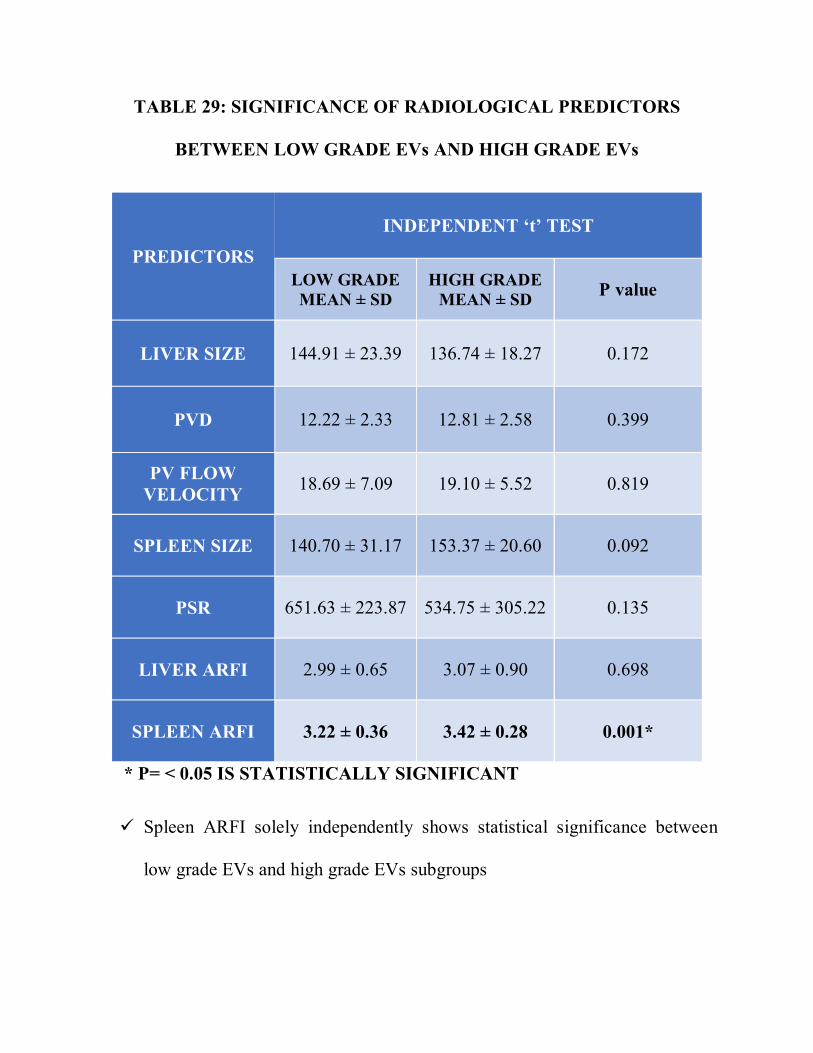
TABLE 29: SIGNIFICANCE OF RADIOLOGICAL PREDICTORS
BETWEEN LOW GRADE EVs AND HIGH GRADE EVs
PREDICTORS
INDEPENDENT ‘t’ TEST
LOW GRADE MEAN ± SD
HIGH GRADE MEAN ± SD P value
LIVER SIZE 144.91 ± 23.39 136.74 ± 18.27 0.172
PVD 12.22 ± 2.33 12.81 ± 2.58 0.399
PV FLOW VELOCITY 18.69 ± 7.09 19.10 ± 5.52 0.819
SPLEEN SIZE 140.70 ± 31.17 153.37 ± 20.60 0.092
PSR 651.63 ± 223.87 534.75 ± 305.22 0.135
LIVER ARFI 2.99 ± 0.65 3.07 ± 0.90 0.698
SPLEEN ARFI 3.22 ± 0.36 3.42 ± 0.28 0.001*
* P= < 0.05 IS STATISTICALLY SIGNIFICANT
Spleen ARFI solely independently shows statistical significance between
low grade EVs and high grade EVs subgroups
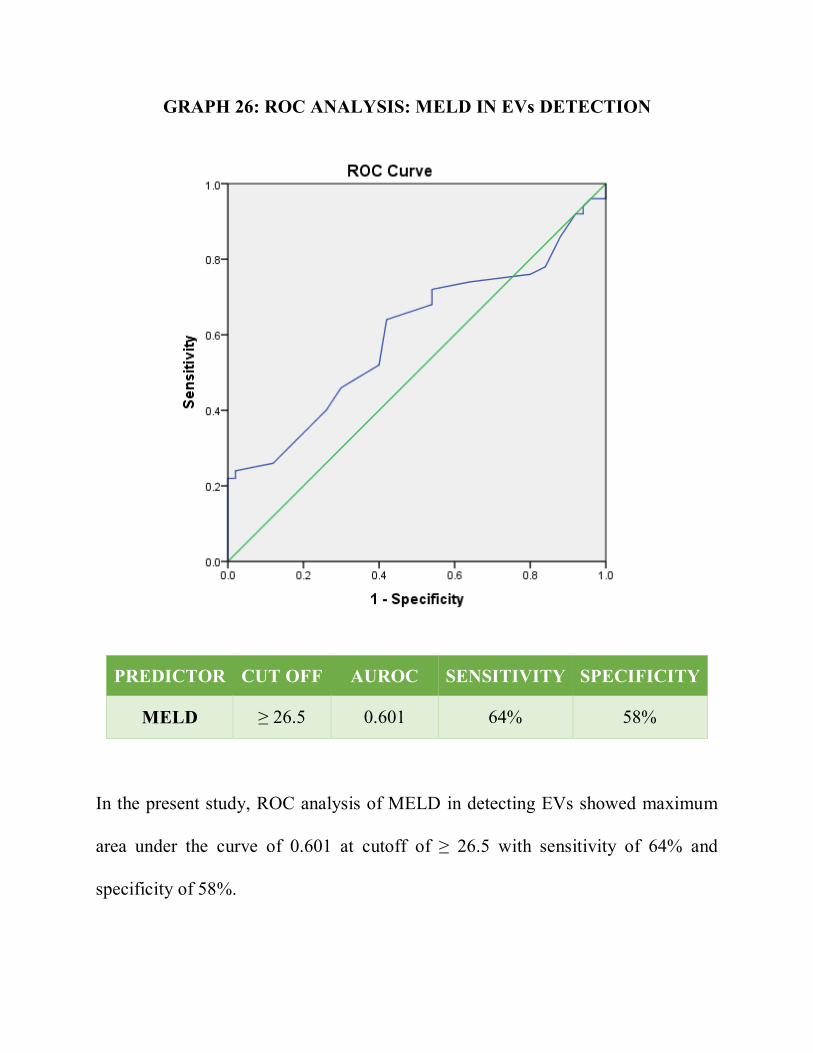
GRAPH 26: ROC ANALYSIS: MELD IN EVs DETECTION
PREDICTOR CUT OFF AUROC SENSITIVITY SPECIFICITY
MELD ≥ 26.5 0.601 64% 58%
In the present study, ROC analysis of MELD in detecting EVs showed maximum
area under the curve of 0.601 at cutoff of ≥ 26.5 with sensitivity of 64% and
specificity of 58%.
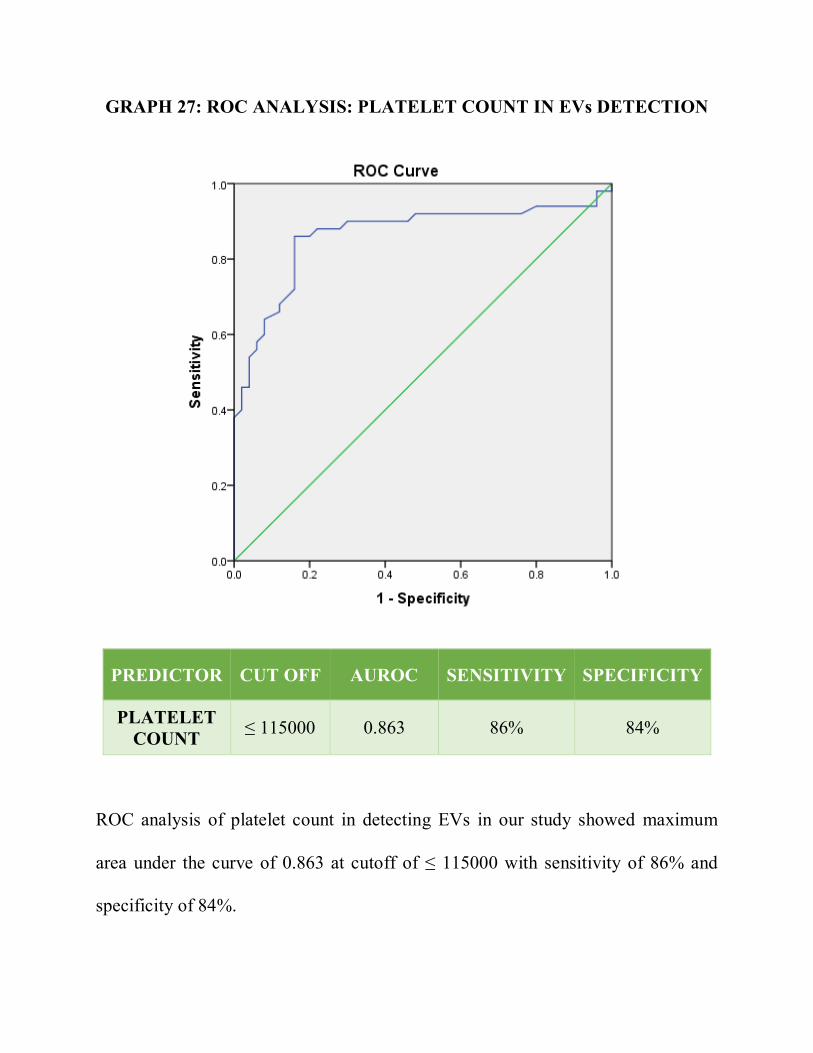
GRAPH 27: ROC ANALYSIS: PLATELET COUNT IN EVs DETECTION
PREDICTOR CUT OFF AUROC SENSITIVITY SPECIFICITY
PLATELET COUNT ≤ 115000 0.863 86% 84%
ROC analysis of platelet count in detecting EVs in our study showed maximum
area under the curve of 0.863 at cutoff of ≤ 115000 with sensitivity of 86% and
specificity of 84%.
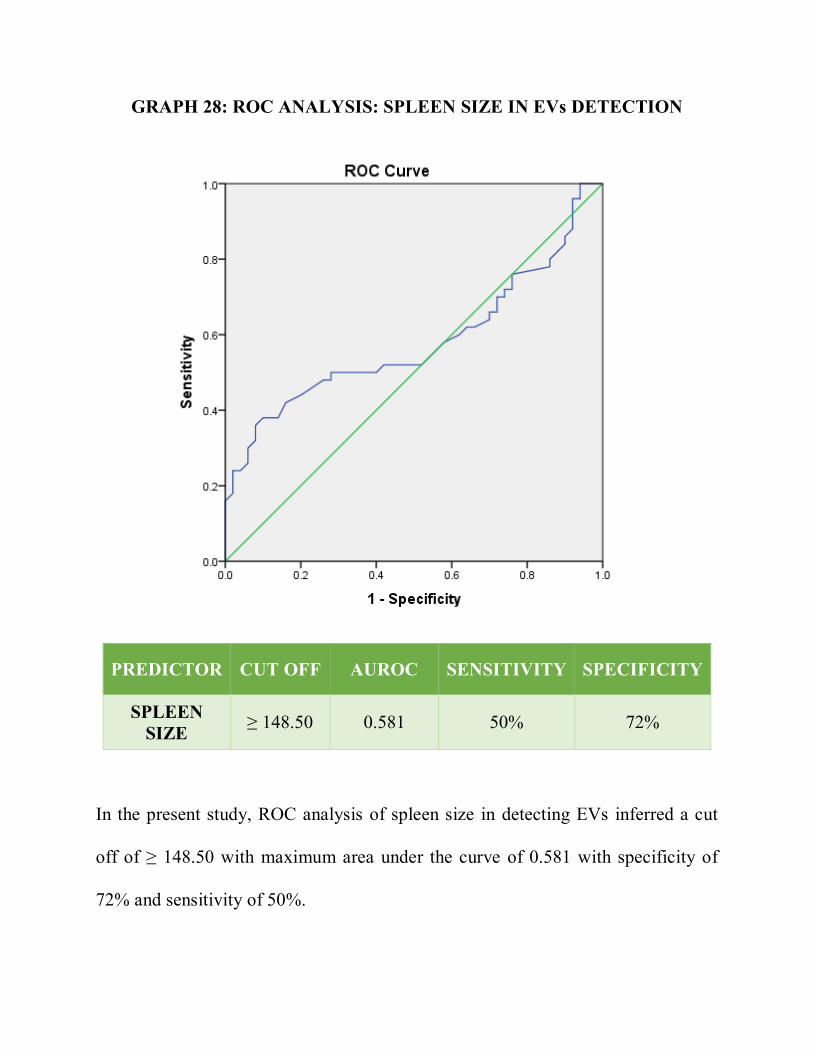
GRAPH 28: ROC ANALYSIS: SPLEEN SIZE IN EVs DETECTION
PREDICTOR CUT OFF AUROC SENSITIVITY SPECIFICITY
SPLEEN SIZE ≥ 148.50 0.581 50% 72%
In the present study, ROC analysis of spleen size in detecting EVs inferred a cut
off of ≥ 148.50 with maximum area under the curve of 0.581 with specificity of
72% and sensitivity of 50%.
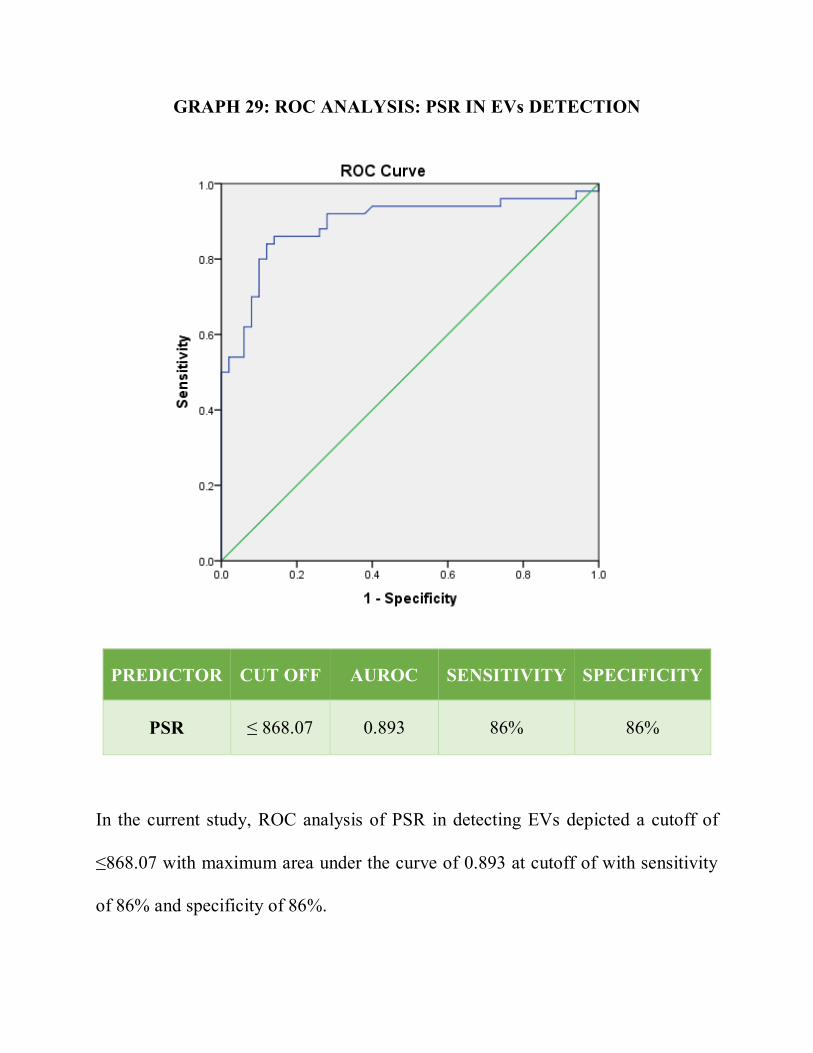
GRAPH 29: ROC ANALYSIS: PSR IN EVs DETECTION
PREDICTOR CUT OFF AUROC SENSITIVITY SPECIFICITY
PSR ≤ 868.07 0.893 86% 86%
In the current study, ROC analysis of PSR in detecting EVs depicted a cutoff of
≤868.07 with maximum area under the curve of 0.893 at cutoff of with sensitivity
of 86% and specificity of 86%.
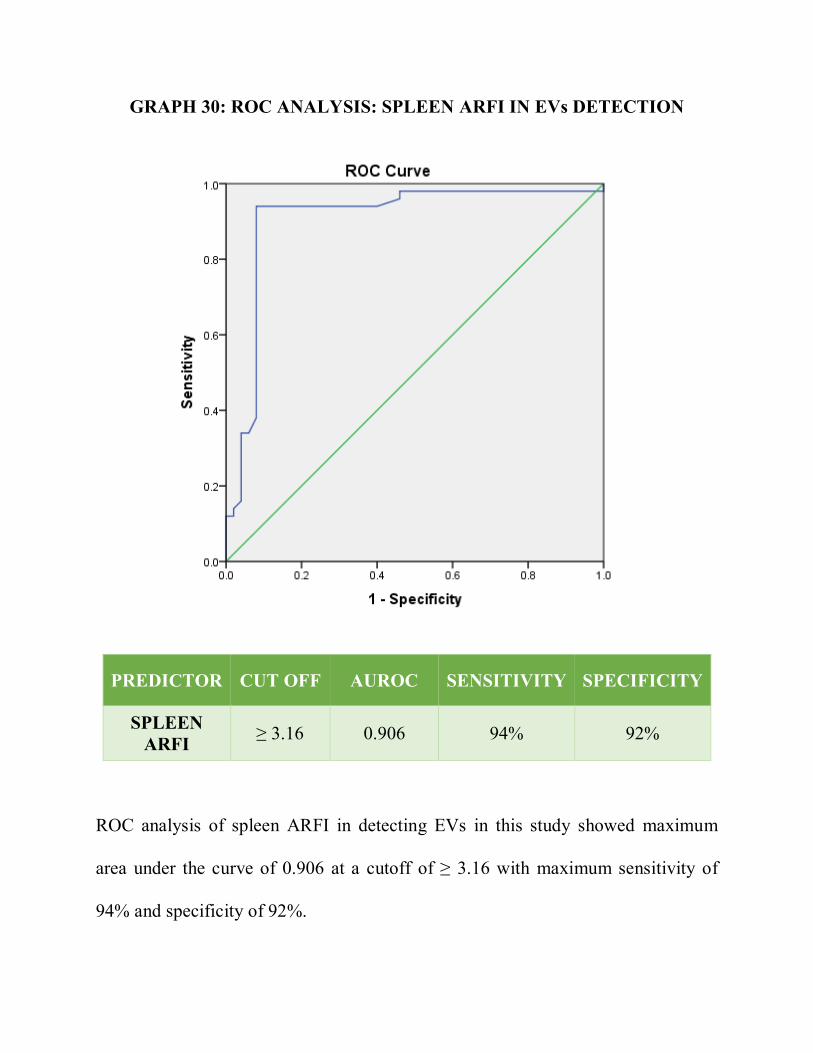
GRAPH 30: ROC ANALYSIS: SPLEEN ARFI IN EVs DETECTION
PREDICTOR CUT OFF AUROC SENSITIVITY SPECIFICITY
SPLEEN ARFI ≥ 3.16 0.906 94% 92%
ROC analysis of spleen ARFI in detecting EVs in this study showed maximum
area under the curve of 0.906 at a cutoff of ≥ 3.16 with maximum sensitivity of
94% and specificity of 92%.
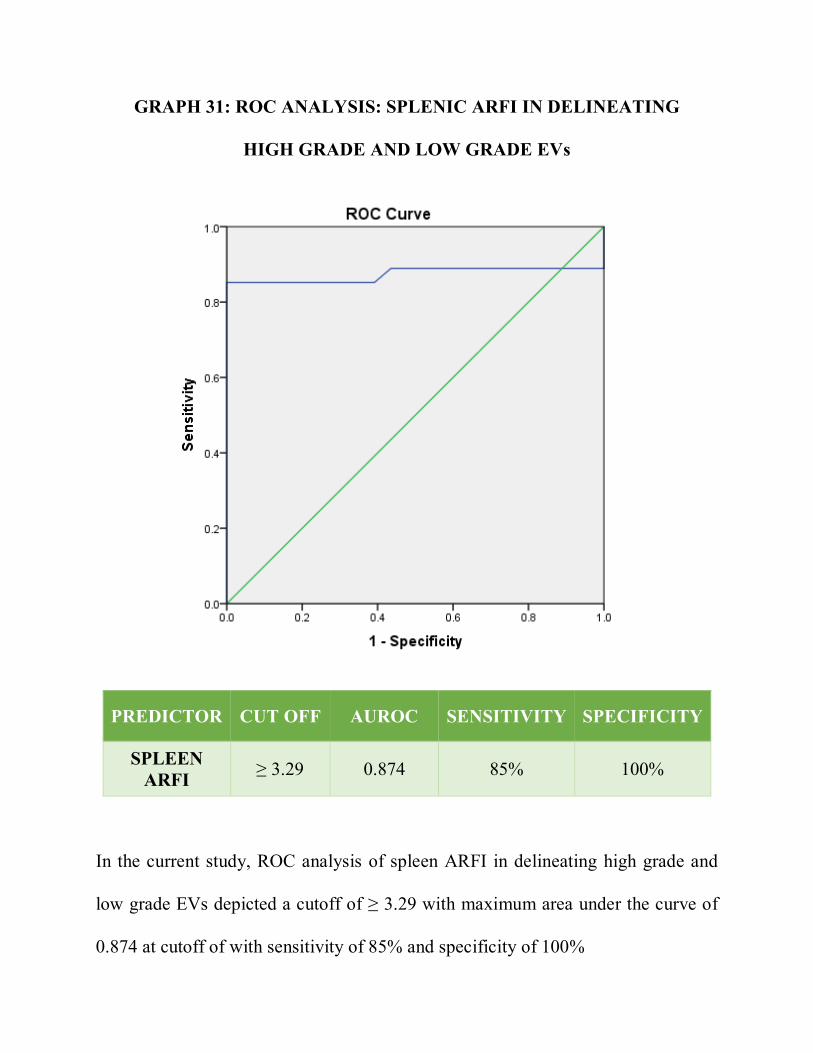
GRAPH 31: ROC ANALYSIS: SPLENIC ARFI IN DELINEATING
HIGH GRADE AND LOW GRADE EVs
PREDICTOR CUT OFF AUROC SENSITIVITY SPECIFICITY
SPLEEN ARFI ≥ 3.29 0.874 85% 100%
In the current study, ROC analysis of spleen ARFI in delineating high grade and
low grade EVs depicted a cutoff of ≥ 3.29 with maximum area under the curve of
0.874 at cutoff of with sensitivity of 85% and specificity of 100%
DISCUSSION
Recent guidelines endorse that endoscopic screening should be done for all
cirrhotic patients at the time of diagnosis to recognize those at high risk of bleeding
and possibly to benefit from primary prophylaxis [7]. Implementation of these
guidelines imposes huge burden on UGIscopy units and frequent testing over time
can decrease the compliance of patient. Moreover, UGIscopy is not always feasible
in peripheral centers. By noninvasive prediction of the presence of EVs, one can
recommend the appropriate category of patients to undergo invasive UGI scopy,
thereby reducing unnecessary endoscopic examinations and burden on endoscopy
units. Previous studies have correlated various radiological and laboratory
parameters either alone or in combination with the presence or absence of EVs in
cirrhotics. Although, the efficiency of parameters or combination of parameters
reported in each study differ amongst them, due to the heterogeneous nature of the
studies. Good predictive value of several non-endoscopic variables for the presence
or absence of EVs have been documented by many previous studies, but the data is
limited from our part of the country. This study was performed to assess the
effectiveness of various clinical, laboratory and radiological parameters, in reliably
detecting the existence of EVs and high grade EVs in cirrhotic patients.
In the present study, there is no significant association of demographic parameters
between the two study groups. Mean age of patients in varices group is 47.4 ± 13.2
years and in group without varices is 48.3 ± 12.4 years (p = 0.864). Varices group
is constituted by 36(72%) males and 14(28%) females and group without varices
constituted 38(76%) males and 12(24%) females (p = 0.648).
Previous studies by Zaman et al [65] and Cherian et al [66], showed that Child Pugh
class B or C cirrhotic patients, as compared to class A cirrhotics, have high
propensity towards the detection of EVs on UGI scopy. In contrary, our study
inferred no significant association between Child Pugh class and the presence of
EVs (p = 0.799).
In addition, we assessed MELD scores and found significant affiliation with
presence of EVs, in congruence to the results of previous studies by De Mattos et
al [67] , Tafarel et al [68] and Chandail VS et al [69]. We derived a cut off of ≥ 26.5
(AUROC: 0.601) with 64% sensitivity and 58% specificity. The cut off value is
relatively higher when compared to the previous study by Chandail VS et al, who
postulated that cut off of 15.91 can certainly predict the presence of EVs. Very
shallow specificity and sensitivity of MELD in detection of EVs provokes its
debatable utility.
Our findings were consistent with previous studies by Garcia-Tsao et al [70], Pilette
et al [71] and Chalasani et al [72]. In this study, we revealed that platelet count is a
self-determining factor for the prediction of EVs, as patients with EVs showed
higher mean (83940 per μl) of platelet count in comparison to patients without EVs
(p=0.000). We also derived a cutoff point of ≤ 115000 per μl (AUROC: 0.863),
with 86% sensitivity and 84% specificity for the detection of EVs in cirrhotics.
Unlike Qamar et al [73], who postulated that platelet count is a fallible noninvasive
marker for detection of EVs.
In agreement with Kraja et al [76], AST/ALT ratio didn’t show significant
difference between the two groups, suggesting its incompetency in the prediction
of EVs in cirrhotics (p= 0.571). However this finding was in contrast to previous
studies done by Nyblom et al [74] and Castera et al [75] which inferred that
AST/ALT ratio is significantly higher in cirrhotic patients with EVs than without
EVs.
On ultrasound examination, size of the liver in midclavicular line in EVs group
was 140 ± 20mm and in without EVs group was 138 ± 19mm. No significant
difference in the size of liver between the two groups is observed from this study
(p= 0.599).
Our findings were in contradiction with previous studies by Schepis et al (77) and
Cottone et al (78), who postulated that PVD with cutoff of PVD ≥ 13 mm had 100%
sensitivity in predicting the presence of EVs. Likely, Sarwar et al (79) and Fook
Hong et al (80) reported that PVD as independent radiological marker in prediction
of EVs. However, our study showed no significant variation in portal vein diameter
between cirrhotic patients with EVs and without EVs (p= 0.569).
Present study deduced that mean of portal vein flow velocity in cirrhotics with EVs
group is 18.91 ± 6.2 cm/sec and in without EVs group is 20.28 ± 2.5 cm/sec. No
significant difference in portal vein flow velocity was derived between these two
groups (p= 0.216). This finding is in contrary to previous study by Dib et al (83)
who postulated that portal vein flow velocity with cutoff of <12 cm/sec, reliably
depicts the presence of esophageal varices with maximum sensitivity and
specificity.
Our findings were consistent with previous studies by Chalasani et al (84), Sudha
Rain et al (85), Kumar et al (86), Thomopoulos et al (88), Sharma and Agarwal (89),
Mandal et al (90) and Tarzamini et al (87), who proved splenomegaly as an
independent predictor of esophageal varices. Kumar et al (86) derived a cutoff of
>140mm and Tarzamini et al (87) inferred a cutoff of >157mm for effective utility
of spleen length as a noninvasive predictor of EVs. In this study, we found that
mean length of spleen in cirrhotics with EVs was 147.54 ± 26mm and that of
without EVs was 138.66 ± 16mm, which showed significant variation between
these two groups (p= 0.049). In addition, we acquired a cutoff of ≥ 148.50mm
(AUROC: 0.581) with sensitivity of 50% and specificity of 72%. The cutoff
obtained in this study was midway between the cutoffs derived by Kumar et al (86)
and Tarzamini et al (87). However, low sensitivity of cut off obtained in this study,
imposes questionable consideration on the utility of spleen length in the prediction
of EVs.
Earlier studies by Giannini et al (91) in 2003, postulated that PSR, spleen diameter
and platelet count showed significant variation among cirrhotic patients with and
without EVs. They depicted cut off value of 909 with 100% negative predictive
value. This finding was supported by González-Ojeda et al (92) who proved that
PSR was an independent noninvasive parameter to detect EVs, independent of the
grade with cutoff value of ≤ 884.3 with 84% sensitivity and 70% specificity. In
endorsement with these studies, the present study also showed significant
difference in PSR between cirrhotic patients with EVs and without EVs (p= 0.000).
Mean of PSR in group with EVs was 588.52 and in group without EVs was
972.86. We acquired a cutoff of ≤ 868.07(AUROC: 0.893) with sensitivity of 86%
and specificity of 86%, which can be reliably employed for non-invasive detection
of EVs. Unlike Chawla et al (93) who postulated the PSR is not a reliable
noninvasive predictor of EVs in cirrhotics.
Our study in contradiction to previous studies by Nadeem et al [96] and Morishita et
al [97], inferred that there is no significant difference in liver stiffness measured by
elastography between cirrhotics with EVs and cirrhotics without EVs (p= 0.458).
Morishita et al [97] postulated the optimal liver ARFI cutoffs of 2.05m/s and
2.39m/s for the presence of EVs and detection of high risk EVs respectively.
In agreement with Takuma et al [101], our study also showed significant difference
in the values of spleen stiffness measured by ARFI between cirrhotics with EVs
and without EVs (p= 0.000). We acquired the optimal cutoff of ≥ 3.16m/s
(AUROC: 0.906) with sensitivity of 94% and specificity of 92%, thereby
validating spleen ARFI as a non-invasive radiological marker for the presence of
EVs in cirrhotics. Spleen ARFI cutoff of ≥ 3.16m/s obtained in the present study is
identical to cutoff of ≥ 3.16m/s acquired by Xiao-Ping et al [100] and in close
approximation with the cutoff of ≥ 3.18m/s reported by Takuma et al [101]. Our
findings are in contrary to the previous study by Rifia et al [102], which postulated
that spleen elastography is inferior to liver elastography in the prediction of
esophageal varices.
Amongst the noninvasive parameters which showed significant difference between
cirrhotics with EVs and without EVs, spleen ARFI had the highest sensitivity and
specificity for the detection of EVs. Henceforth, spleen ARFI can be regarded as
an independent noninvasive predictor of EVs in cirrhotics.
In the present study, we furthermore evaluated the utility of the above discussed
noninvasive clinical, laboratory and radiological parameters in the detection of
high grade EVs in cirrhotics. We divided the group of cirrhotics with EVs into two
subgroups – Low grade EVs (Grades I and II) and High grade EVs (Grades III and
IV). Of all the noninvasive parameters analyzed, spleen ARFI exclusively showed
significant difference between the two subgroups (p= 0.001). We derived the
optimal cutoff of ≥ 3.29m/s (AUROC: 0.874) with sensitivity of 85% and
specificity of 100%, which is in very close approximation with spleen ARFI cutoff
of ≥ 3.30m/s obtained by Takuma et al (101). Thereby substantiating spleen ARFI as
a non-invasive radiological marker for the presence of high grade EVs in
cirrhotics. In other words, the presence of high grade EVs can be reliably ruled out
with the spleen ARFI cutoff of < 3.29m/s in patients with chronic liver
parenchymal disease.
Although a recent meta-analysis based on a pooled analysis of 12 studies with
significant heterogeneity postulated that spleen ARFI measurement might be
suboptimal for the diagnosis of esophageal varices. Subgroup analysis exhibited
that the diagnostic performance of spleen ARFI was better in studies from Asia
than in those from Western countries perhaps due to variations in habitus and body
size [103]. Our study added a positive result for the utility of spleen ARFI to detect
esophageal varices in cirrhotic Indian population.
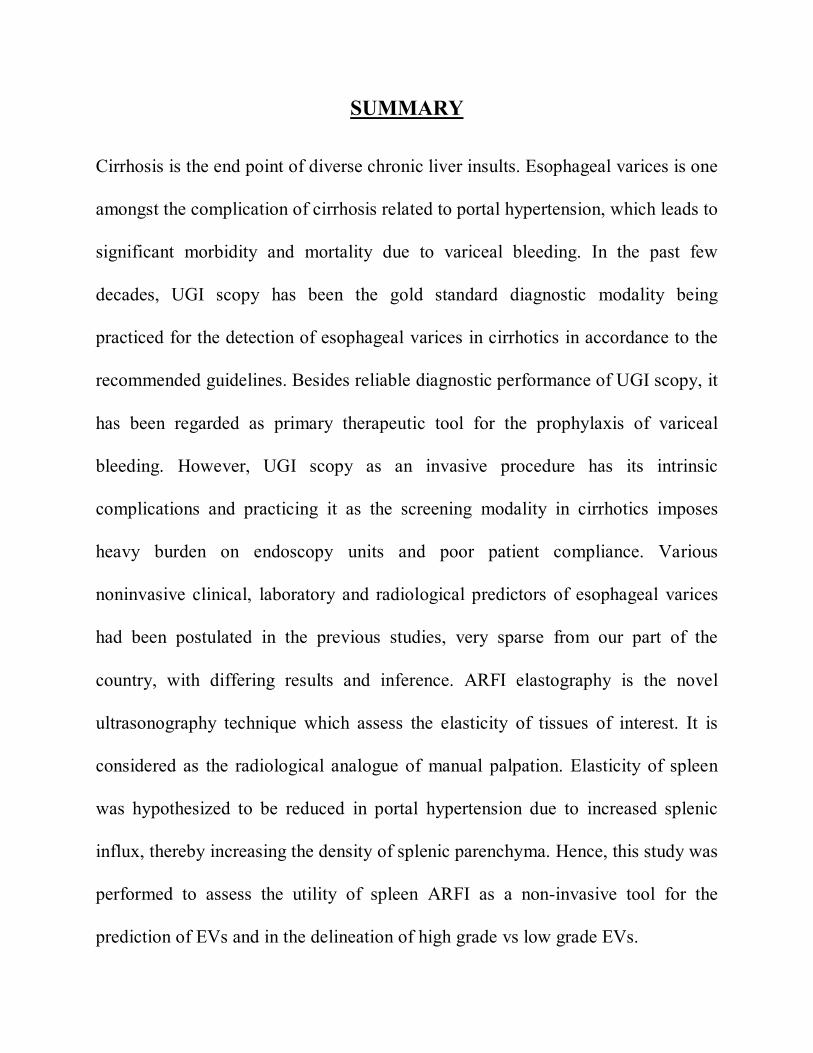
SUMMARY
Cirrhosis is the end point of diverse chronic liver insults. Esophageal varices is one
amongst the complication of cirrhosis related to portal hypertension, which leads to
significant morbidity and mortality due to variceal bleeding. In the past few
decades, UGI scopy has been the gold standard diagnostic modality being
practiced for the detection of esophageal varices in cirrhotics in accordance to the
recommended guidelines. Besides reliable diagnostic performance of UGI scopy, it
has been regarded as primary therapeutic tool for the prophylaxis of variceal
bleeding. However, UGI scopy as an invasive procedure has its intrinsic
complications and practicing it as the screening modality in cirrhotics imposes
heavy burden on endoscopy units and poor patient compliance. Various
noninvasive clinical, laboratory and radiological predictors of esophageal varices
had been postulated in the previous studies, very sparse from our part of the
country, with differing results and inference. ARFI elastography is the novel
ultrasonography technique which assess the elasticity of tissues of interest. It is
considered as the radiological analogue of manual palpation. Elasticity of spleen
was hypothesized to be reduced in portal hypertension due to increased splenic
influx, thereby increasing the density of splenic parenchyma. Hence, this study was
performed to assess the utility of spleen ARFI as a non-invasive tool for the
prediction of EVs and in the delineation of high grade vs low grade EVs.
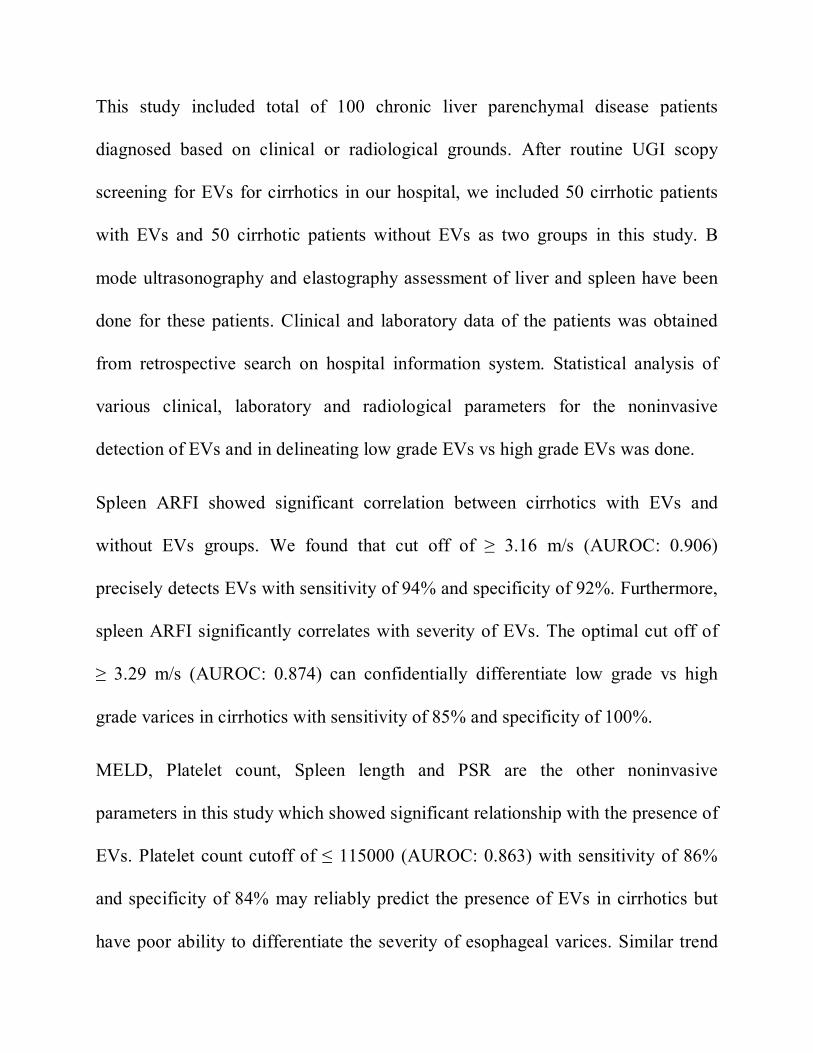
This study included total of 100 chronic liver parenchymal disease patients
diagnosed based on clinical or radiological grounds. After routine UGI scopy
screening for EVs for cirrhotics in our hospital, we included 50 cirrhotic patients
with EVs and 50 cirrhotic patients without EVs as two groups in this study. B
mode ultrasonography and elastography assessment of liver and spleen have been
done for these patients. Clinical and laboratory data of the patients was obtained
from retrospective search on hospital information system. Statistical analysis of
various clinical, laboratory and radiological parameters for the noninvasive
detection of EVs and in delineating low grade EVs vs high grade EVs was done.
Spleen ARFI showed significant correlation between cirrhotics with EVs and
without EVs groups. We found that cut off of ≥ 3.16 m/s (AUROC: 0.906)
precisely detects EVs with sensitivity of 94% and specificity of 92%. Furthermore,
spleen ARFI significantly correlates with severity of EVs. The optimal cut off of
≥ 3.29 m/s (AUROC: 0.874) can confidentially differentiate low grade vs high
grade varices in cirrhotics with sensitivity of 85% and specificity of 100%.
MELD, Platelet count, Spleen length and PSR are the other noninvasive
parameters in this study which showed significant relationship with the presence of
EVs. Platelet count cutoff of ≤ 115000 (AUROC: 0.863) with sensitivity of 86%
and specificity of 84% may reliably predict the presence of EVs in cirrhotics but
have poor ability to differentiate the severity of esophageal varices. Similar trend
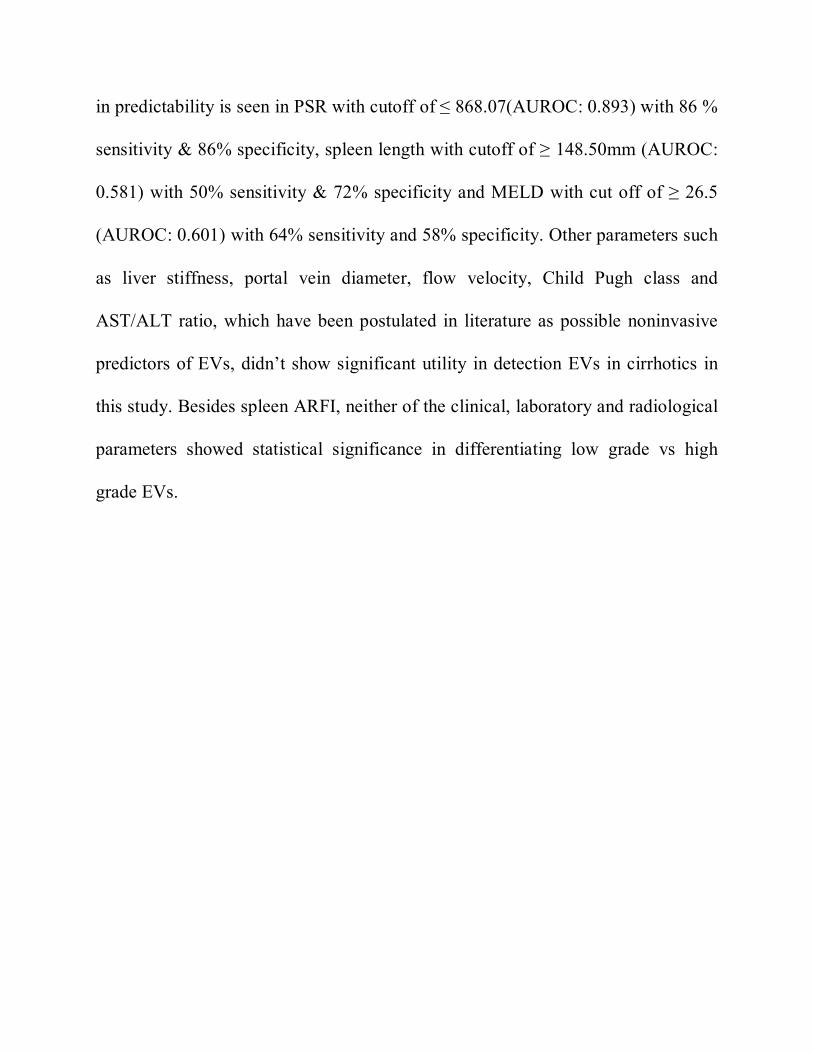
in predictability is seen in PSR with cutoff of ≤ 868.07(AUROC: 0.893) with 86 %
sensitivity & 86% specificity, spleen length with cutoff of ≥ 148.50mm (AUROC:
0.581) with 50% sensitivity & 72% specificity and MELD with cut off of ≥ 26.5
(AUROC: 0.601) with 64% sensitivity and 58% specificity. Other parameters such
as liver stiffness, portal vein diameter, flow velocity, Child Pugh class and
AST/ALT ratio, which have been postulated in literature as possible noninvasive
predictors of EVs, didn’t show significant utility in detection EVs in cirrhotics in
this study. Besides spleen ARFI, neither of the clinical, laboratory and radiological
parameters showed statistical significance in differentiating low grade vs high
grade EVs.
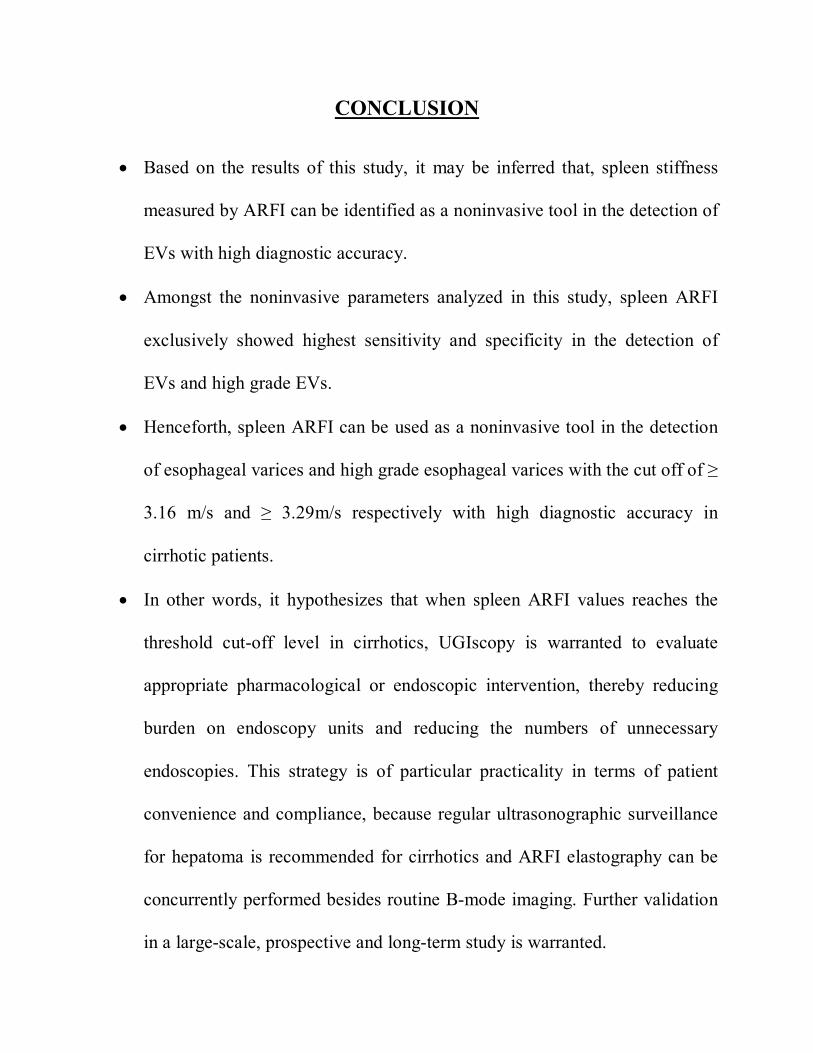
CONCLUSION
Based on the results of this study, it may be inferred that, spleen stiffness
measured by ARFI can be identified as a noninvasive tool in the detection of
EVs with high diagnostic accuracy.
Amongst the noninvasive parameters analyzed in this study, spleen ARFI
exclusively showed highest sensitivity and specificity in the detection of
EVs and high grade EVs.
Henceforth, spleen ARFI can be used as a noninvasive tool in the detection
of esophageal varices and high grade esophageal varices with the cut off of ≥
3.16 m/s and ≥ 3.29m/s respectively with high diagnostic accuracy in
cirrhotic patients.
In other words, it hypothesizes that when spleen ARFI values reaches the
threshold cut-off level in cirrhotics, UGIscopy is warranted to evaluate
appropriate pharmacological or endoscopic intervention, thereby reducing
burden on endoscopy units and reducing the numbers of unnecessary
endoscopies. This strategy is of particular practicality in terms of patient
convenience and compliance, because regular ultrasonographic surveillance
for hepatoma is recommended for cirrhotics and ARFI elastography can be
concurrently performed besides routine B-mode imaging. Further validation
in a large-scale, prospective and long-term study is warranted.
LIMITATIONS OF THE STUDY
Only few patients with grade IV EVs were been included in this study. It is
due to the lower prevalence of grade IV EVs, as in part by the practice of
generous prophylactic & therapeutic measures which heralds the progression
of severity of low grade EVs
Terminally ill patients are not included in this study, as they are incapable of
breath hold, which is mandate for the assessment of ARFI
It is a single center study
Inter observer variability is not assessed in this study
Future studies on this context should focus on multicenter design with evaluation
of equipment of various manufacturers and assessment of inter observer variability.
BIBLIOGRAPHY
1. Sangster GP, Previgliano CH, Nader M, Chwoschtschinsky E, and
Heldmann MG. MDCT Imaging Findings of Liver Cirrhosis: Spectrum of
Hepatic and Extrahepatic Abdominal Complications. HPB Surg
2013;129396:1-12.
2. Schuppan D, Afdhal NH. Liver Cirrhosis. Lancet 2008;371(9615):838-851.
3. Singh SP, Panigrahi MK. Spectrum of Upper Gastrointestinal Hemorrhage
in Coastal Odisha. Trop Gastroenterol 2013;34(1):14-17.
4. Riley S, Alderson SD, Birmingham. Complications of upper gastrointestinal
endoscopy. BSG Guidelines in Gastroenterology 2006 Nov:7-13.
5. Taljanovic MS, Gimber LH, Becker GW, Latt LD, Klauser AS, Melville
DM et al. Shear-Wave Elastography: Basic Physics and Musculoskeletal
Applications. Radiographics 2017 May-Jun;37(3):855-870.
6. Sharma M, Rameshbabu CS. Collateral Pathways in Portal Hypertension. J
Clin Exp Hepatol 2012 Dec;2(4):338-352.
7. Kim HY, Jin EH, Kim W, Lee JY, Woo H , Oh S et al. The Role of Spleen
Stiffness in Determining the Severity and Bleeding Risk of Esophageal
Varices in Cirrhotic Patients. Medicine (Baltimore) 2015 Jun;94(24):e1031.
8. Zhai L, Palmeri ML, Bouchard RR, Nightingale RW, Nightingale KR. An
integrated indenter-ARFI imaging system for tissue stiffness quantification.
Ultrason Imaging 2008;30:95-111.
9. Palmeri ML, Wang MH, Dahl JJ, Frinkley KD, Nightingale KR.
Quantifying hepatic shear modulus in vivo using acoustic radiation force.
Ultrasound Med Biol 2008;34:546-558.
10. Rees SL. Tissue Strain Analytics: Virtual Touch Tissue Imaging and
Quantification. Acuson 2000 Ultrasound System 2008 Oct. Siemens Medical
Solutions, USA.
11. Rizzo L, Attanasio M, Pinzone MR et al. A New Sampling Method for
Spleen Stiffness Measurement Based on Quantitative Acoustic Radiation
Force Impulse Elastography for Noninvasive Assessment of Esophageal
Varices in Newly Diagnosed HCV-Related Cirrhosis. BioMed Research
International 2014;Article ID 365982:1-8.
12. Radford M. Development of the spleen. J Anat Physiol 1908 Apr;42:288-
301.
13. Yildiz AE, Ariyurek MO, Karcaaltincaba M. Splenic Anomalies of Shape,
Size, and Location: Pictorial Essay. The Scientific World Journal
2013;Article ID 321810:1-9.
14. Madoff DC, Denys A, Wallace MJ, Murthy R, Gupta S, Pillsbury EP et al. Splenic Arterial
Interventions: Anatomy, Indications, Technical Considerations, and
Potential Complications. Radiographics 2005;25:191-211.
15. Sharma M, Babu CSR, Garg S, Rai P. Portal Venous System and Its
Tributaries: A Radial Endosonographic Assessment. Endoscopic Ultrasound
2012;1(2):96-107.
16. Zhou WC, Zhang QB, Qiao L. Pathogenesis of liver cirrhosis. World J
Gastroenterol 2014;20(23):7312-7324.
17. Arey LB, Burrows W, Greenhill JP, Hewitt RM. Dorland’s illustrated
medical dictionary 23rd edition. Philadelphia: Press of W.B. Saunders
Company; 1962.p.286.
18. Duffin JM. Why does cirrhosis belong to Laennec?. CMAJ 1987 Sep
1;137(5):393-6.
19. Anthony PP, Ishak KG, Nayak NC, Poulsen HE, Scheuer PJ, Sobin LH. The
morphology of cirrhosis. Recommendations on definition, nomenclature,
and classification by a working group sponsored by the World Health
Organization. J Clin Pathol 1978 May;31(5):395-414.
20. Heidelbaugh JJ, Bruderly M. Cirrhosis and chronic liver failure: part I.
diagnosis and evaluation. Am Fam Physician 2006 Sep 1;74(5):756-62.
21. Friedman S, Schiano T. Cirrhosis and its sequelae. In: Goldman L, Ausiello
D, eds. Cecil Textbook of Medicine. 22nd ed. Philadelphia, PA.:Saunders;
2004:936-44.
22. Zatoński WA, Sulkowska U, Mańczuk M, Rehm J, Boffetta P, Lowenfels
AB, et al. Liver cirrhosis mortality in Europe, with special attention to
Central and Eastern Europe. Eur Addict Res 2010;16(4):193-201.
23. Sørensen HT, Thulstrup AM, Mellemkjar L, Jepsen P, Christensen E, Olsen
JH, et al. Long-term survival and cause-specific mortality in patients with
cirrhosis of the liver: a nationwide cohort study in Denmark.
J Clin Epidemiol 2003 Jan;56(1):88-93.
24. Bosetti C, Levi F, Lucchini F, Zatonski WA, Negri E, La Vecchia C.
Worldwide mortality from cirrhosis: an update to 2002. J Hepatol 2007
May;46(5):827-39.
25. Nguyen GC, Segev DL, Thuluvath PJ. Nationwide increase in
hospitalizations and hepatitis C among inpatients with cirrhosis and sequelae
of portal hypertension. Clin Gastroenterol Hepatol 2007 Sep;5(9):1092-9.
26. Centre for Disease Control and Prevention. Alcohol – attributable deaths
and years of potential life lost – United States, 2001. MMWR Morb Mortal
Wkly 2004 Sep; 53:866-70.
27. Crawford JM. Liver and biliary tract. In: Kumar V, Abbas AK, Fausto N,
eds. Robbins and Cotran Pathologic Basis of Disease. 7th ed., Philadelphia,
Pa.:Elsevier Saunders; 2005:877-938.
28. Pugh RN, Murray-Lyon IM, Dawson JL, Pietroni MC, Williams R.
Transection of the oesophagus for bleeding oesophageal varices.
Br J Surg 1973 Aug;60(8):646-9.
29. Schiedermaier P. Splanchnic hemodynamics: cirrhotic versus non-cirrhotic
portal hypertension. Journal of Gastroenterology and Hepatology
2004;19:150-154.
30. Child CG, Turcotte JG. Surgery and portal hypertension.
Major Probl Clin Surg 1964;1:1-85.
31. Madkhali AA, Fadel ZT, Aljiffry MM, Hassanain MM. Surgical treatment
for hepatocellular carcinoma. Saudi J Gastroenterol 2015;21:11-17.
32. Nusrat S, Khan MS, Fazili J, Madhoun MF. Cirrhosis and its complications:
evidence based treatment. World J Gastroenterol 2014 May 14;20(18):5442-
60.
33. Buob S, Johnston AN, Webster CR. Portal hypertension: pathophysiology,
diagnosis and treatment. J Vet Intern Med 2011 Mar-Apr;25(2):169-86.
34. Rajekar H. Complication of Cirrhosis Portal Hypertension: A Review. J
Liver 2015;4:4.
35. LaBrecque D, Khan AG, Sarin SK, Le Mair AW. Esophageal varices –
Global guidelines. USA: World Gastroenterology Organisation; 2014.
36. Maruyama H, Yokosuka O. Pathophysiology of portal hypertension and
esophageal varices. Int J Hepatol 2012;895787:1-7.
37. Sandblom P. The history of portal hypertension. J R Soc Med 1993
Sep;86(9):544-6.
38. Garcia-Tsao G, Sanyal AJ, Grace ND, Carey W. Prevention and
management of gastroesophageal varices and variceal hemorrhage in
cirrhosis. Hepatology 2007;46:922-938.
39. Thalheimer U, Leandro G, Samonakis DN, Triantos CK, Patch D, Burroughs
AK. Assessment of the agreement between wedge hepatic vein pressure and
portal vein pressure in cirrhotic patients. Dig Liver Dis 2005 Aug;37(8):601-
8.
40. Sanyal AJ, Bosch J, Blei A, Arroyo V. Portal hypertension and its
complications. Gastroenterology 2008 May;134(6):1715-28.
41. Carale J, Katz J. Portal Hypertension – Anatomy. Available from:
http://emedicine.medscape.com/article/182098-overview#aw2aab6b2b2.
42. Grace ND, Groszmann RJ, Garcia-Tsao G, Burroughs AK, Pagliaro L,
Makuch RW, et al. Portal hypertension and variceal bleeding: An AASLD
single topic symposium. Hepatology 1998;28:868-880.
43. De Franchis. Evolving Consensus in Portal Hypertension Report of the
Baveno IV Consensus Workshop on methodology of diagnosis and therapy
in portal hypertension. J Hepatol 2005 Jul;43(1):167-76.
44. Philips CA, Sahney A. Oesophageal and gastric varices: historical aspects,
classification and grading: everything in one place. Gastroenterol Rep (Oxf)
2016 Aug;4(3):186-195.
45. Sigrist RMS, Liau J, Kaffas AE, Chammas MC, Willmann JK. Ultrasound
Elastography: Review of Techniques and Clinical
Applications. Theranostics 2017;7(5):1303-1329.
46. Huwart L, Sempoux C, Vicaut E, Salameh N, Annet L, Danse E, et al.
Magnetic resonance elastography for the noninvasive staging of liver
fibrosis. Gastroenterology 2008 Jul;135(1):32-40.
47. Nightingale K, Soo MS, Nightingale R, Trahey G. Acoustic radiation force
impulse imaging: in vivo demonstration of clinical feasibility.
Ultrasound Med Biol 2002 Feb;28(2):227-35.
48. Sandrin L, Fourquet B, Hasquenoph JM, Yon S, Fournier C, Mal F, et al.
Transient elastography: a new noninvasive method for assessment of hepatic
fibrosis. Ultrasound Med Biol 2003 Dec;29(12):1705-13.
49. Muller M, Gennisson JL, Deffieux T, Tanter M, Fink M. Quantitative
viscoelasticity mapping of human liver using supersonic shear imaging:
preliminary in vivo feasibility study. Ultrasound Med Biol 2009
Feb;35(2):219-29.
50. Chen S, Sanchez W, Callstrom MR, Gorman B, Lewis JT, Sanderson SO, et
al. Assessment of liver viscoelasticity by using shear waves induced by
ultrasound radiation force. Radiology 2013 Mar;266(3):964-70.
51. Audière S, Angelini ED, Sandrin L, Charbit M. Maximum likelihood
estimation of shear wave speed in transient elastography.
IEEE Trans Med Imaging 2014 Jun;33(6):1338-49.
52. Sandrin L, Tanter M, Gennisson JL, Catheline S, Fink M. Shear elasticity
probe for soft tissues with 1-D transient elastography. IEEE Trans Ultrason
Ferroelectr Freq Control 2002 Apr;49(4):436-446.
53. Catheline S, Thomas JL, Wu F, Fink MA. Diffraction field of a low
frequency vibrator in soft tissues using transient elastography. IEEE Trans
Ultrason Ferroelectr Freq Control 1999 Jul;46(4):1013-1019.
54. Gennisson JL, Deffieux T, Fink M, Tanter M. Ultrasound elastography:
Principles and techniques. Diagn Interv Imaging 2013 May;94(5):487-495.
55. Sandrin L, Cassereau D, Fink M. The role of the coupling term in transient
elastography. J Acoust Soc Am 2004 Jan;115(1):73-83.
56. Frulio N, Trillaud H.N.FrulioH.Trillaud. Ultrasound elastography in liver.
Diagn Interv Imaging. 2013 May;94(5):515-34.
57. Joeng WK, Lim HK, Lee HK, Jo JM, Kim Y. Principles and clinical
application of ultrasound elastography for diffuse liver disease.
Ultrasonography 2014 Jul;33(3):149-160.
58. Nightingale K. Acoustic Radiation Force Impulse (ARFI) Imaging: a
Review. Curr Med Imaging Rev 2011 Nov 1;7(4):328-339.
59. Sarvazyan AP, Rudenko OV, Swanson SD, Fowlkes JB, Emelianov SY.
Shear wave elasticity imaging: a new ultrasonic technology of medical
diagnostics. Ultrasound Med Biol 1998 Nov;24(9):1419-35.
60. Xu S, Wang Y, Tai DCS, Wang S, Cheng CL, Peng Q1, et al. qFibrosis: a
fully-quantitative innovative method incorporating histological features to
facilitate accurate fibrosis scoring in animal model and chronic hepatitis B
patients. J Hepatol 2014 Aug;61(2):260-269.
61. Bercoff J, Tanter M, Fink M. Supersonic shear imaging: a new technique
for soft tissue elasticity mapping. IEEE Trans Ultrason Ferroelectr Freq
Control 2004 Apr;51(4):396-409.
62. Maxime Mallet, Marika Rudler, Dominique Thabut. Variceal bleeding in
cirrhotic patients. Gastroenterol Rep (Oxf) 2017 Aug;5(3):185–192.
63. Grace ND. Diagnosis and treatment of gastrointestinal bleeding secondary
to portal hypertension. American College of Gastroenterology Practice
Parameters Committee. Am J Gastroenterol 1997 Jul;92(7):1081-91.
64. Jensen DM. Endoscopic screening for varices in cirrhosis: findings,
implications, and outcomes. Gastroenterology 2002;122:1620–1630.
65. Zaman A, Hapke R, Flora K, Rosen HR, Benner K. Factors predicting the
presence of esophageal or gastric varices in patients with advanced liver
disease. Am J Gastroenterol 1999 Nov;94(11):3292-3296
66. Cherian JV, Deepak N, Ponnusamy RP, Somasundaram A, Jayanthi V.
Non-invasive predictors of esophageal varices. Saudi J Gastroenterol 2011
Jan-Feb;17(1):64-8.
67. de Mattos AZ, de Mattos AA, Daros LF, Musskopf MI. Aspartate
aminotransferase-to-platelet ratio index (APRI) for the non-invasive
prediction of esophageal varices. Ann Hepatol 2013 Sep-Oct;12:910-4.
68. Tafarel JR, Tolentino LH, Correa LM, Bonilha DR, Piauilino P, Martins
FP et al. Prediction of esophageal varices in hepatic cirrhosis by
noninvasive markers. Eur J Gastroenterol Hepatol 2011;23:754-58.
69. Chandail VS, Kotwal SK, Koul S, Gupta R, Mahajan A. Non-invasive
markers for prediction of varices in patients with portal hypertension. Int J
Res Med Sci 2017;5:1007-10.
70. Garcia-Tsao G, Escorsell A, Zakko M. Predicting the presence of
significant portal hypertension and varices in compensated cirrhotic
patients. Hepatology 1997;26:927–30
71. Pilette C, Oberti F, Aube C. Non-invasive diagnosis of esophageal varices
in chronic liver disease. J Hepatol 1999;31:867-73.
72. Chalasani N, Imperiale TF, Ismail A. Predictors of large varices in patients
with cirrhosis. Am J Gastroenterol 1999;94:3285–91
73. Qamar AA, Grace ND, Groszmann RJ, Garcia-Tsao G, Bosch J, Burroughs
AK, et al. Platelet count is not a predictor of the presence or development
of gastroesophageal varices in cirrhosis. Hepatology 2008 Jan;47(1):153-9.
74. Nyblom H, Björnsson E, Simrén M, Aldenborg F, Almer S, Olsson R. The
AST/ALT ratio as an indicator of cirrhosis in patients with PBC. Liver
International 2006 Sep;26(7):840-5., vol. 26, no. 7, pp. 840–845, 2006
75. Castéra L, Le Bail B, Roudot-Thoraval F, Bernard PH, Foucher J,
Merrouche W, et al. Early detection in routine clinical practice of cirrhosis
and oesophageal varices in chronic hepatitis C: comparison of transient
elastography (FibroScan) with standard laboratory tests and non-invasive
scores. J Hepatol 2009;50:59-68.
76. Kraja B, Mone I, Akshija I, Koçollari A, Prifti S, Burazeri G. Predictors of
esophageal varices and first variceal bleeding in liver cirrhosis
patients. World J Gastroenterol 2017;23(26):4806-4814.
77. Schepis F, Cammà C, Niceforo D, Magnano A, Pallio S, Cinquegrani M et
al. Which Patients with Cirrhosis Should Undergo Endoscopic Screening
for Esophageal Varices Detection? Hepatology 2001;33(2):333-8.
78. Cottone M, D’Amico G, Maringhini A, Amuso M, Sciarrino E, Traina M et
al. Predictive Value of Ultrasonography in the Screening of Non-Ascitic
Cirrhotic Patients with Large Varices. Journal of Ultrasound in Medicine
1986 Apr;5(4):189-92.
79. Sarwar S, Khan AA, Alam A, Butt AK, Shafqat F, Malik K et al. Non-
Endoscopic Prediction of Presence of Esophageal Varices in Cirrhosis. J
Coll Physicians Surg Pak 2005;15:528-31.
80. Ng FH, Wang SY, Loo CK, Lam KM, Lai CW, Cheng CS. Prediction of
esophagogastric varices in patients with liver cirrhosis. J Gastroenterol
Hepatol 1999;14:785-90.
81. Zironi G, Gaiani S, Fenyves D, Rigamonti A, Bolondi L, Barbara L. Value
of measurement of mean portal flow velocity by Doppler flowmetry in the
diagnosis of portal hypertension. J Hepatol 1992 Nov;16(3):298-303.
82. Li FH, Hao J, Xia JG, Li HL, Fang H. Hemodynamic analysis of
esophageal varices in patients with liver cirrhosis using color Doppler
ultrasound. World J Gastroenterol 2005 Aug 7;11(29):4560-5.
83. Dib N, Konate A, Oberti F, Calès P. Non-invasive diagnosis of portal
hypertension in cirrhosis. Application to the primary prevention of varices. Gastroenterol Clin Biol 2005 Oct;29(10):975-87.
84. Chalasani N, Imperiale TF, Ismail A, Sood G, Carey M, Wilcox CM et al.
Predictors of large oesophageal varices in cirrhosis. Am J Gastroenterol
1999;94:3103-05.
85. Sudha Rani KVL, Sudarsi B, Siddeswari R, Manohar S. Correlation of
portal vein size with esophageal varices severity in patients with cirrhosis
of liver with portal hypertension. IJSRP 2015;5(1):1-5.
86. Sudhindta D Lakshman Kumar et al. JAPI 2003 Dec;5.
87. Tarzamni MK, Somi MH, Farhang S, Jalilvand M. Portal hemodynamics as
predictors of high risk esophageal varices in cirrhotic patients. World J
Gastroenterol 2008;14(12):1898-902.
88. Thomopoulos KC, Labropoulou-Karatza C, Mimidis KP, Katsakoulis EC,
Iconomou G, Nikolopoulou VN. Non-Invasive Predictors of the Presence
of Large Oesophageal Varices in Patients with Cirrhosis. Dig Liver Dis
2003;35(7):473-8.
89. Sharma SK, Aggarwal R. Prediction of large esophageal varices in patients
with cirrhosis of the liver using clinical laboratory and imaging parameters.
J Gastroenterol Hepatol 2007;22(11):1909-15.
90. Mandal L, Mandal SK, Bandyopadhyay D, Datta S. Correlation of portal
vein diameter and splenic size with gastroesophageal varices in cirrhosis of
liver. J Ind Aca Clin Med 2011;12(4):266-70.
91. Giannini E, Botta F, Borro P, Risso D, Romangnoli P, Fasoli A et al.
Platelet count/spleen diameter ratio: proposal and validation of a non-
invasive parameter to predict the presence of oesophageal varices in
patients with liver cirrhosis. Gut 2003;52:1200-05.
92. González-Ojeda A, Cervantes-Guevara G, Chávez-Sánchez M, Dávalos-
Cobián C, Ornelas-Cázares S, Macías-Amezcua MD et al. Platelet
count/spleen diameter ratio to predict esophageal varices in Mexican
patients with hepatic cirrhosis. World J Gastroenterol 2014 Feb
28;20(8):2079–84.
93. Chawla S, Katz A, Attar BM, Gupta A, Sandhu DS, Agarwal R. Platelet
count/spleen diameter ratio to predict the presence of esophageal varices in
patients with cirrhosis: a systematic review. Eur J Gastroenterol Hepatol
2012;24:431-6.
94. Sporea I, Raţiu I, Şirli R, Popescu A, Bota S. Value of transient
elastography for the prediction of variceal bleeding. World J Gastroenterol
2011;17(17):2206-10.
95. Wang HM, Lo GH, Chen WC, Hsu PI, Yu HC, Lin CK et al. Efficacy of
transient elastography in screening for large esophageal varices in patients
with suspicious or proven liver cirrhosis. J Dig Dis. 2012 Aug;13(8):430-8
96. Nadeem MD, Goenka MK, Bera C, Goenka U. ARFI Elastography of
Liver Can Predict the Presence of Clinically Significant Esophageal. J Clin
Exp Hepatol 2016 Jul;6:74-102.
97. Morishita N, Hiramatsu N, Oze T, Harada N, Yamada R, Miyazaki M et
al. Liver stiffness measurement by acoustic radiation force impulse is
useful in predicting the presence of esophageal varices or high-risk
esophageal varices among patients with HCV-related cirrhosis.
J Gastroenterol. 2014 Jul;49(7):1175-82.
98. Stefanescu H, Grigorescu M, Lupsor M, Procopet B, Maniu A, Badea R.
Spleen stiffness measurement using Fibroscan for the noninvasive
assessment of esophageal varices in liver cirrhosis patients. J Gastroenterol
Hepatol 2011 Jan;26(1):164-70.
99. Talwalkar JA, Yin M, Venkatesh S, Rossman PJ, Grimm RC, Manduca A,
et al. Feasibility of in vivo MR elastographic splenic stiffness
measurements in the assessment of portal hypertension. Am J Roentgenol
2009 Jul;193(1):122-7.
100. Ye XP, Ran HT, Cheng J, Zhu YF, Zhang DZ, Zhang P, Zheng YY.
Liver and Spleen Stiffness Measured by Acoustic Radiation Force Impulse
Elastography for Noninvasive Assessment of Liver Fibrosis and
Esophageal Varices in Patients With Chronic Hepatitis B. J Ultrasound
Med. 2012 Aug;31(8):1245-53.
101. Takuma Y, Nouso K, Morimoto Y, Tomokuni J, Sahara A,
Toshikuni N et al. Measurement of spleen stiffness by acoustic radiation
force impulse imaging identifies cirrhotic patients with esophageal varices.
Gastroenterology 2013 Jan;144(1):92-101.
102. Rifai K, Cornberg J, Bahr M, Mederacke I, Potthoff A, Wedemeyer
H et al. ARFI elastography of the spleen is inferior to liver elastography for
the detection of portal hypertension. Ultraschall Med 2011 Dec;32(2):24-
30.
103. Singh S, Eaton JE, Murad MH, Tanaka H, Iijima H, Talwalkar JA.
Accuracy of spleen stiffness measurement in detection of esophageal
varices in patients with chronic liver disease: systematic review and meta-
analysis. Clin Gastroenterol Hepatol 2014 Jun;12(6):935-45.
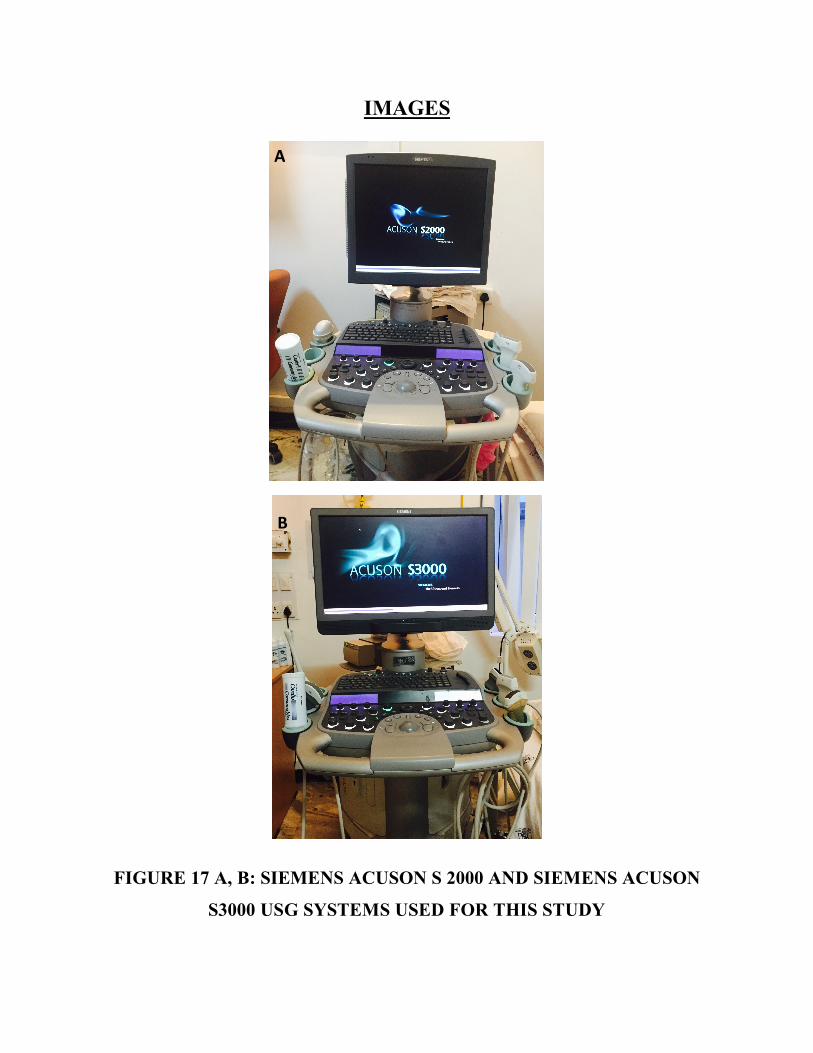
IMAGES
A
B
FIGURE 17 A, B: SIEMENS ACUSON S 2000 AND SIEMENS ACUSON
S3000 USG SYSTEMS USED FOR THIS STUDY
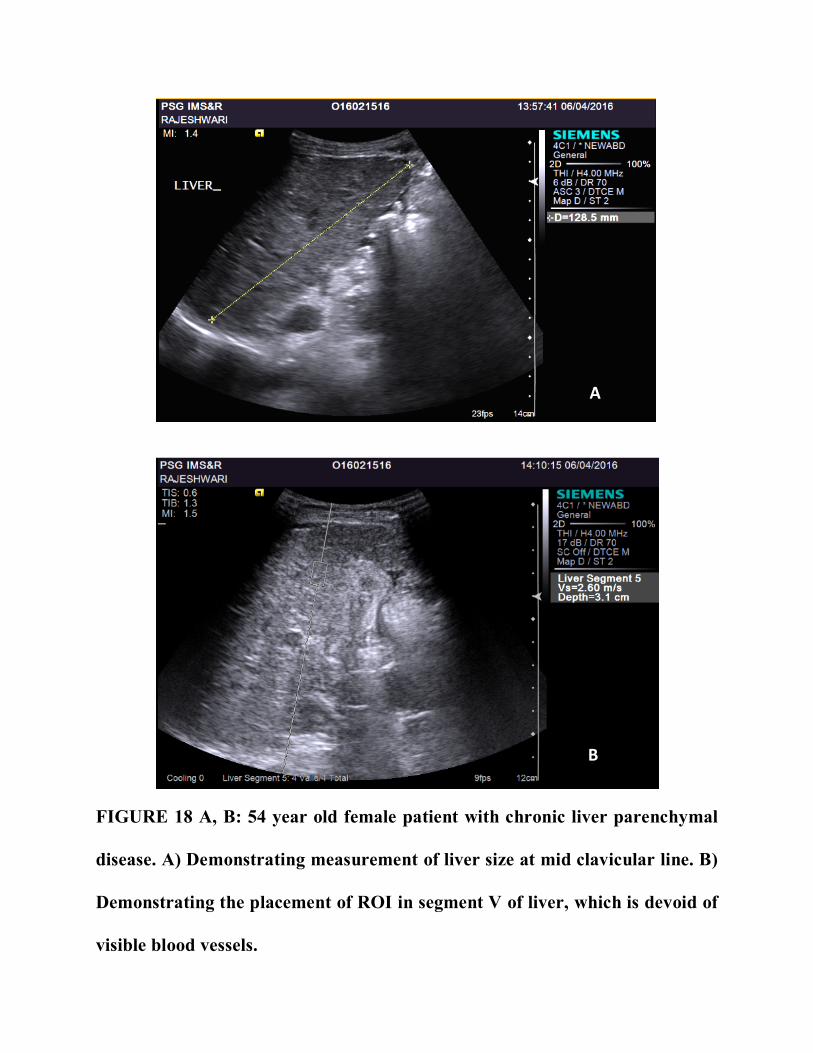
A
B
FIGURE 18 A, B: 54 year old female patient with chronic liver parenchymal
disease. A) Demonstrating measurement of liver size at mid clavicular line. B)
Demonstrating the placement of ROI in segment V of liver, which is devoid of
visible blood vessels.
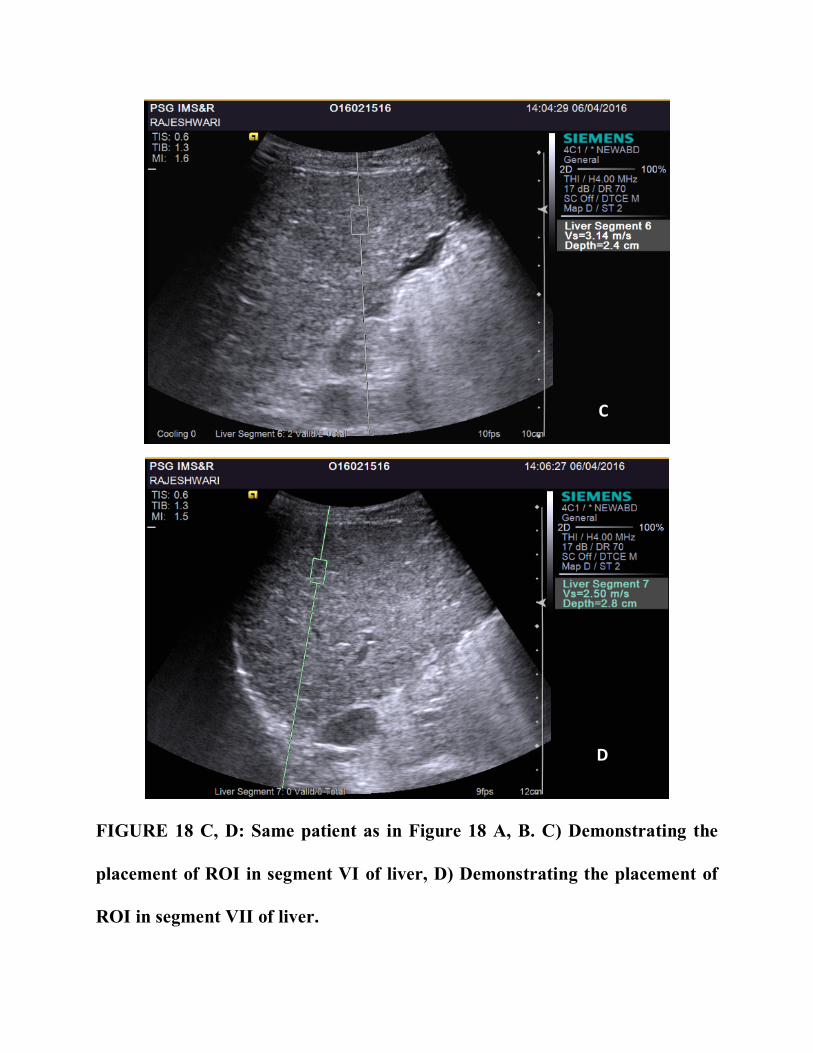
C
D
FIGURE 18 C, D: Same patient as in Figure 18 A, B. C) Demonstrating the
placement of ROI in segment VI of liver, D) Demonstrating the placement of
ROI in segment VII of liver.
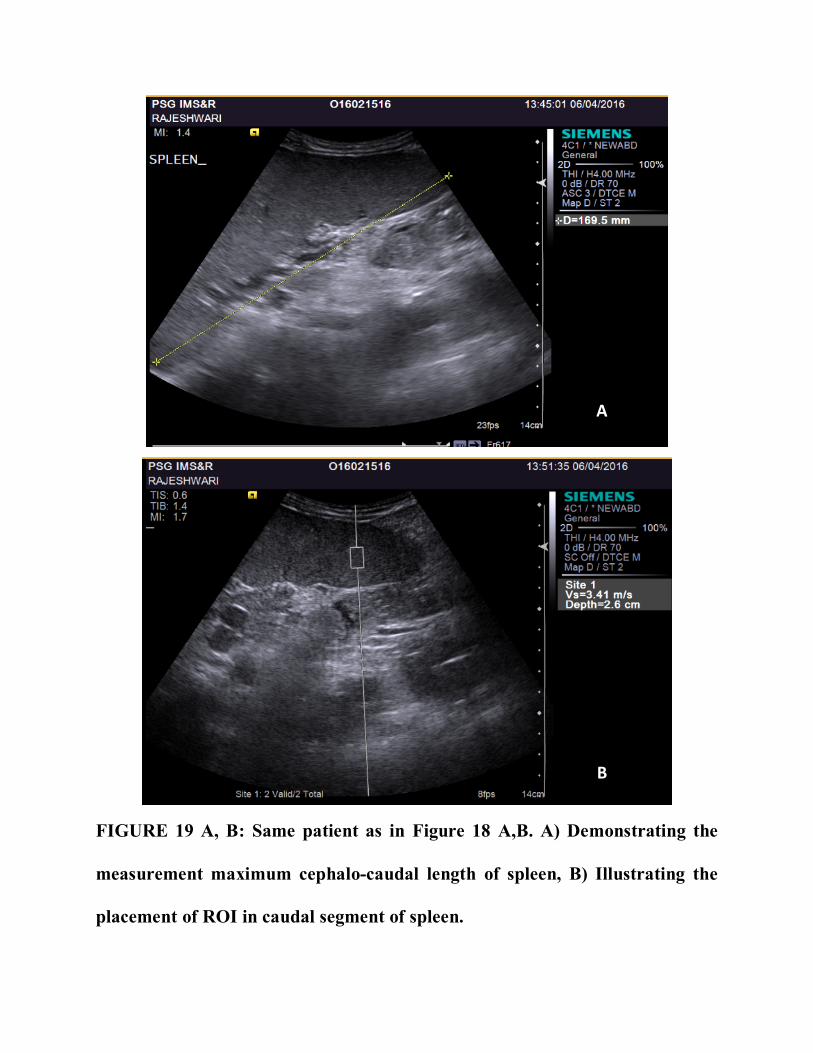
A
B
FIGURE 19 A, B: Same patient as in Figure 18 A,B. A) Demonstrating the
measurement maximum cephalo-caudal length of spleen, B) Illustrating the
placement of ROI in caudal segment of spleen.
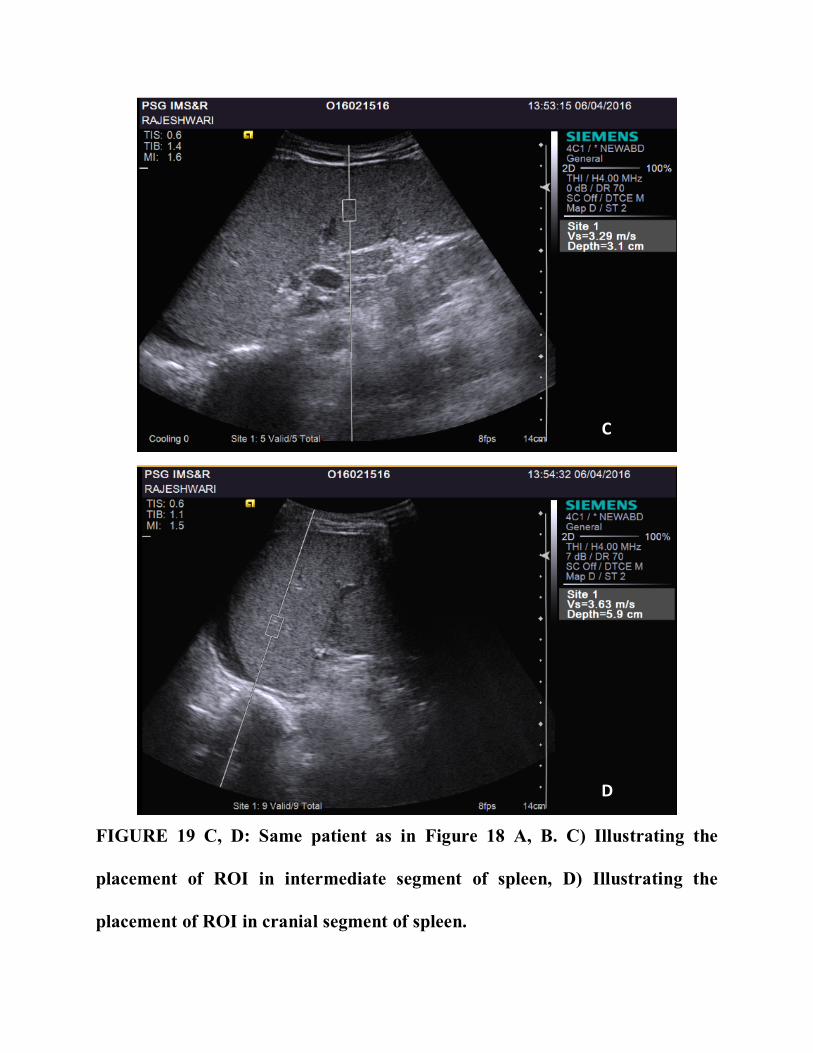
C
D
FIGURE 19 C, D: Same patient as in Figure 18 A, B. C) Illustrating the
placement of ROI in intermediate segment of spleen, D) Illustrating the
placement of ROI in cranial segment of spleen.
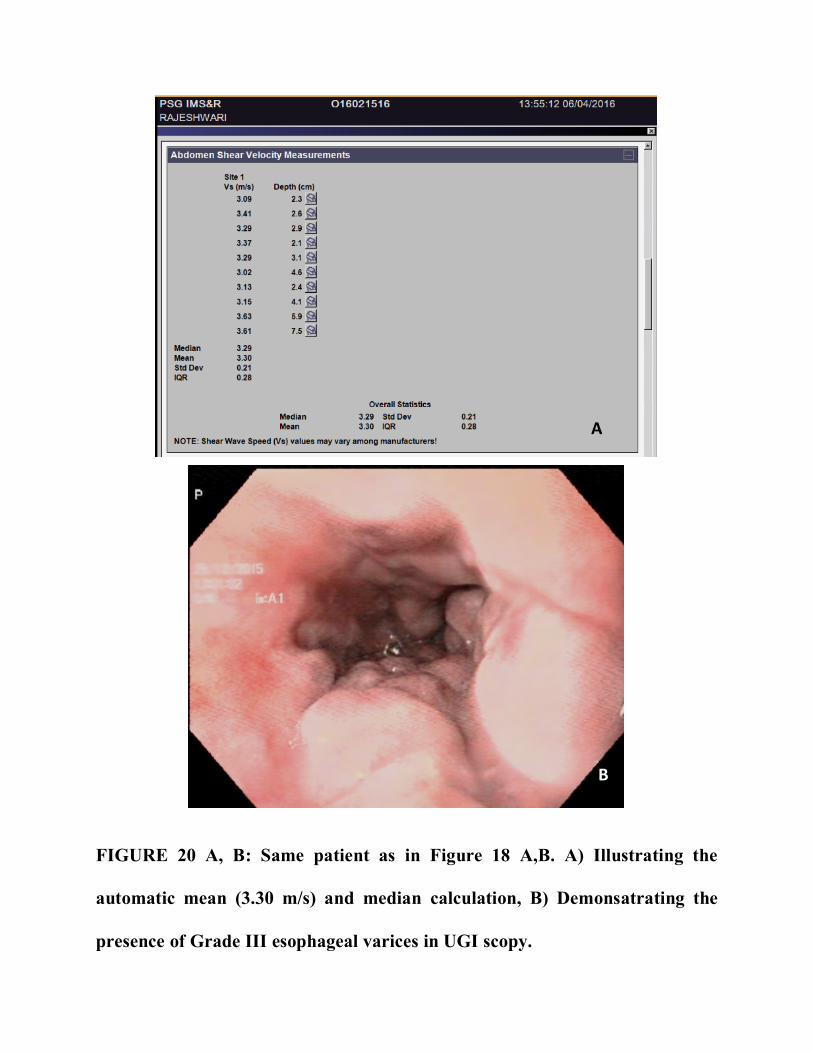
A
B
FIGURE 20 A, B: Same patient as in Figure 18 A,B. A) Illustrating the
automatic mean (3.30 m/s) and median calculation, B) Demonsatrating the
presence of Grade III esophageal varices in UGI scopy.
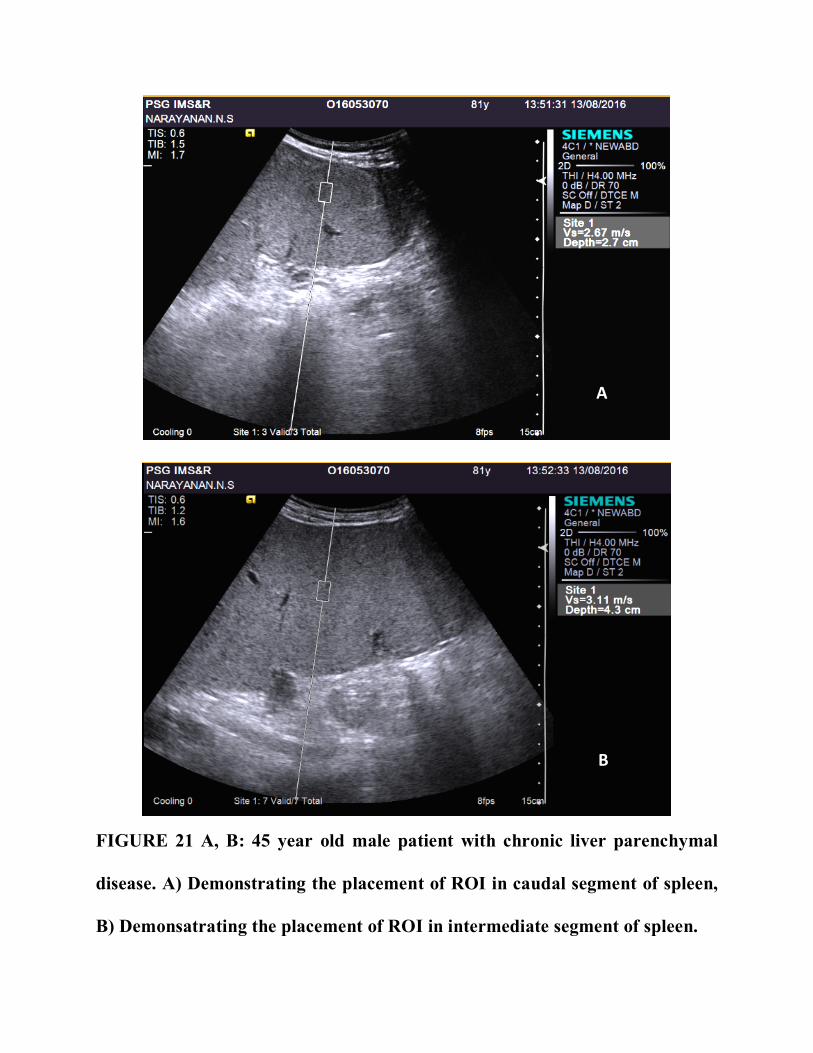
A
B
FIGURE 21 A, B: 45 year old male patient with chronic liver parenchymal
disease. A) Demonstrating the placement of ROI in caudal segment of spleen,
B) Demonsatrating the placement of ROI in intermediate segment of spleen.
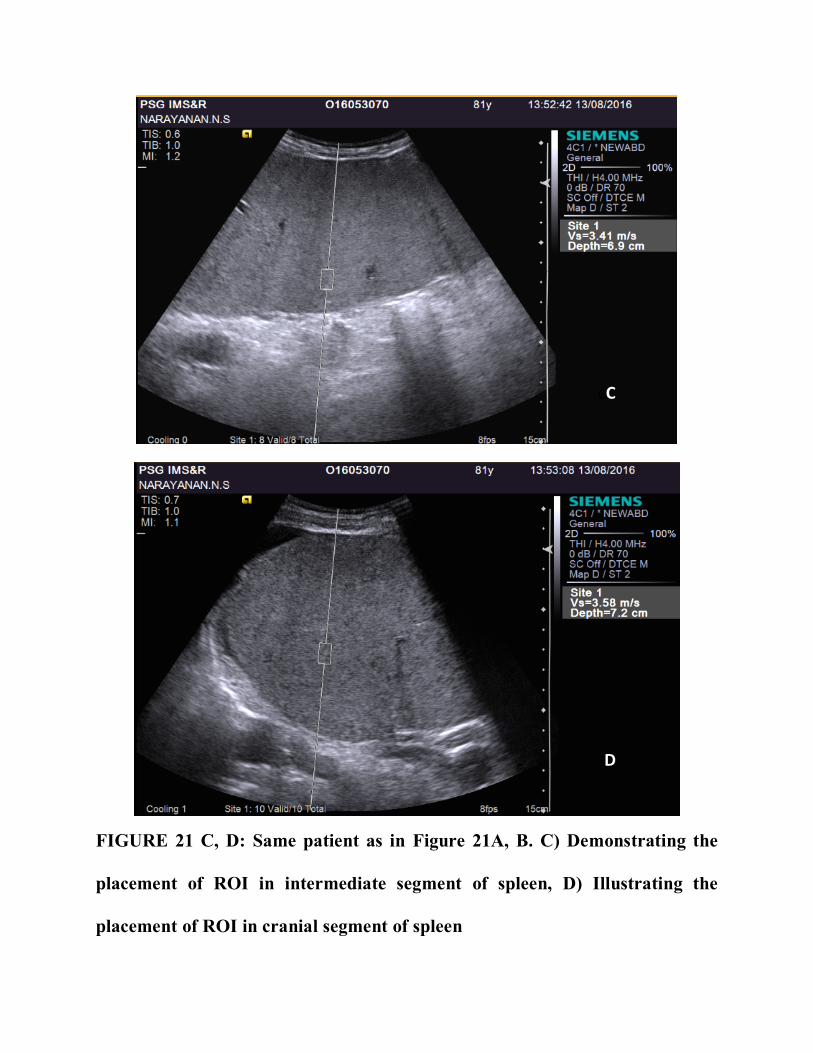
CC
D
FIGURE 21 C, D: Same patient as in Figure 21A, B. C) Demonstrating the
placement of ROI in intermediate segment of spleen, D) Illustrating the
placement of ROI in cranial segment of spleen
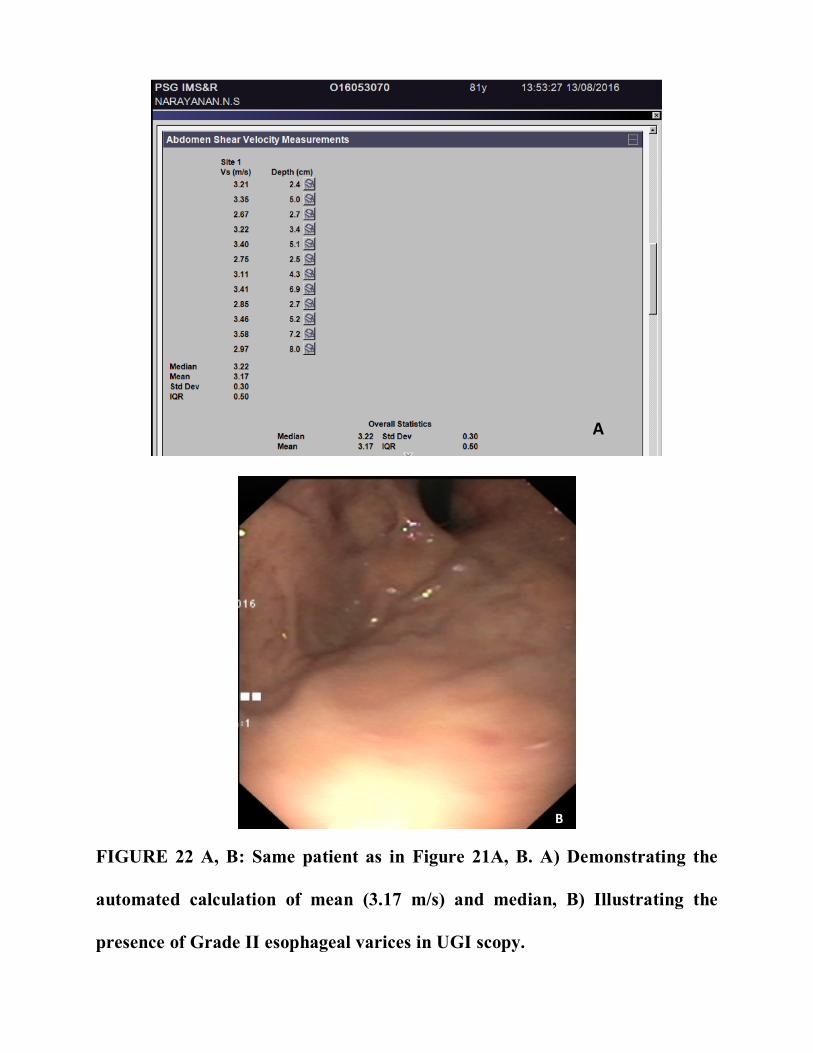
A
B
FIGURE 22 A, B: Same patient as in Figure 21A, B. A) Demonstrating the
automated calculation of mean (3.17 m/s) and median, B) Illustrating the
presence of Grade II esophageal varices in UGI scopy.
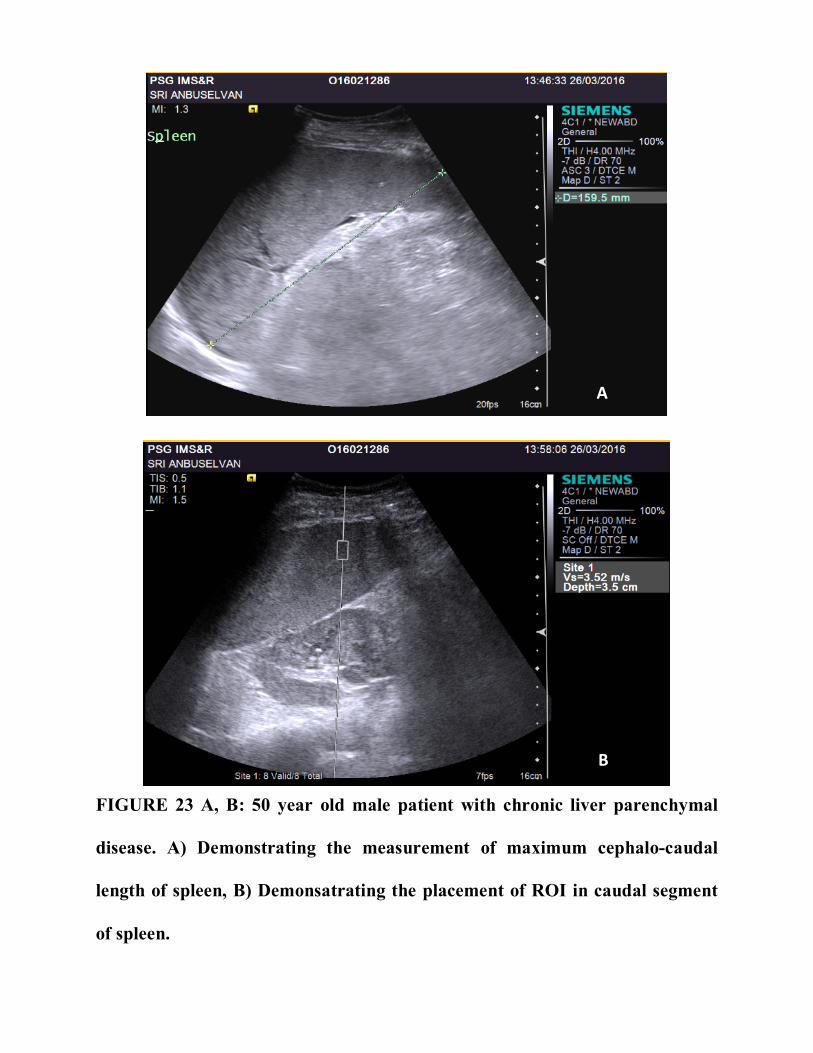
A
B
FIGURE 23 A, B: 50 year old male patient with chronic liver parenchymal
disease. A) Demonstrating the measurement of maximum cephalo-caudal
length of spleen, B) Demonsatrating the placement of ROI in caudal segment
of spleen.
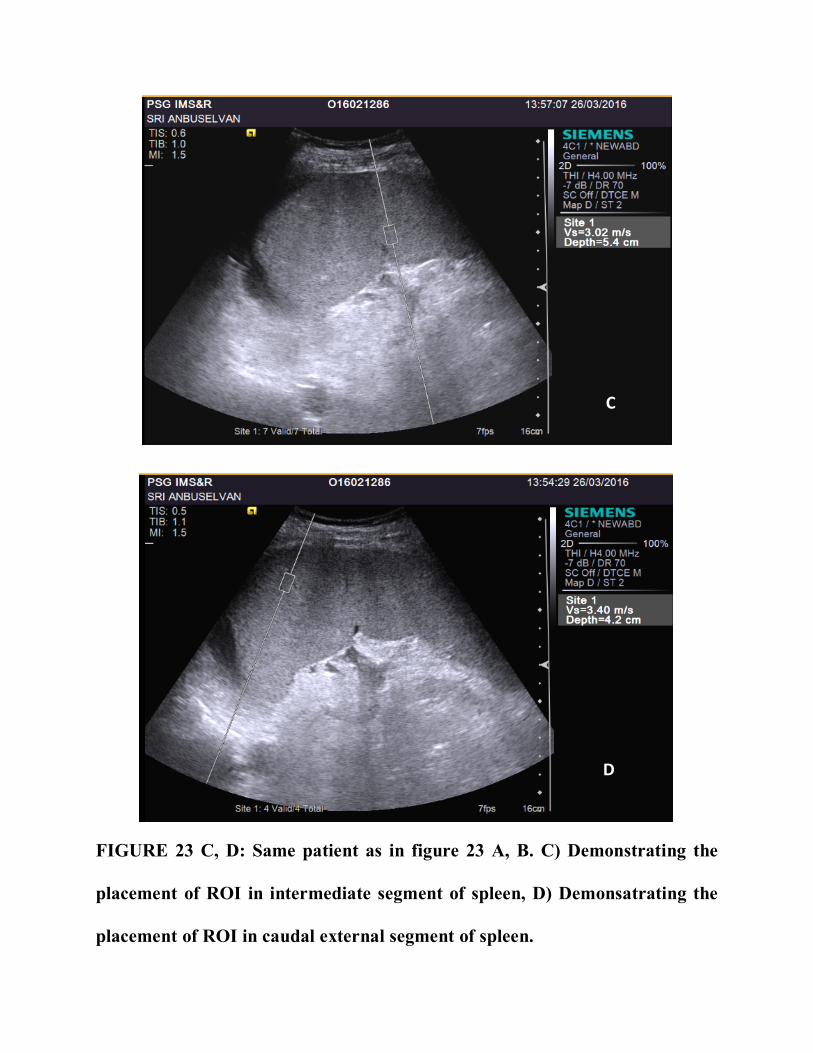
C
D
FIGURE 23 C, D: Same patient as in figure 23 A, B. C) Demonstrating the
placement of ROI in intermediate segment of spleen, D) Demonsatrating the
placement of ROI in caudal external segment of spleen.
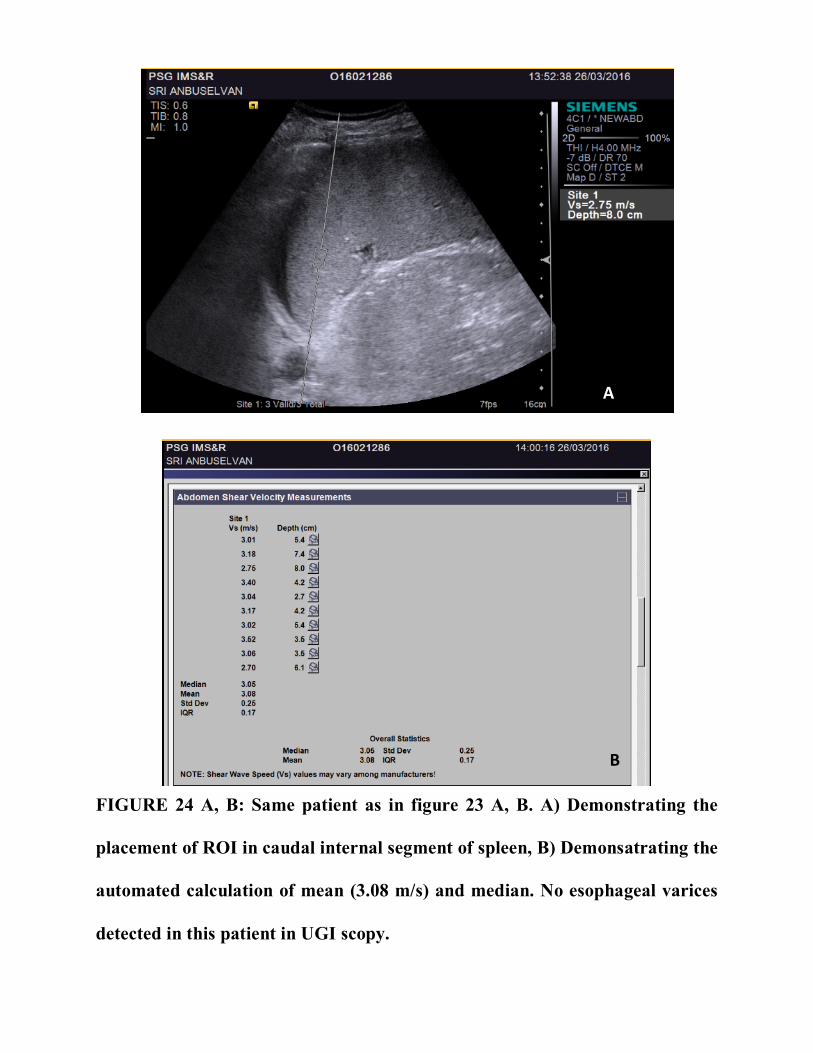
A
B
FIGURE 24 A, B: Same patient as in figure 23 A, B. A) Demonstrating the
placement of ROI in caudal internal segment of spleen, B) Demonsatrating the
automated calculation of mean (3.08 m/s) and median. No esophageal varices
detected in this patient in UGI scopy.
150 | P a g e
151 | P a g e
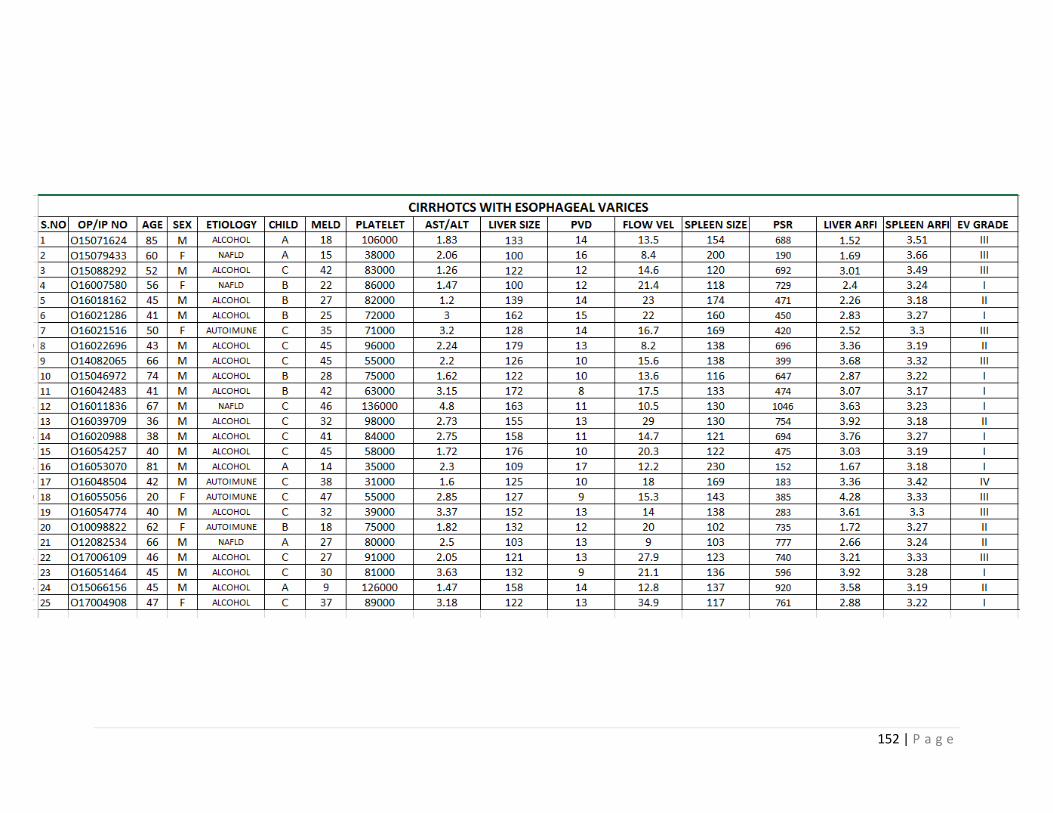
152 | P a g e
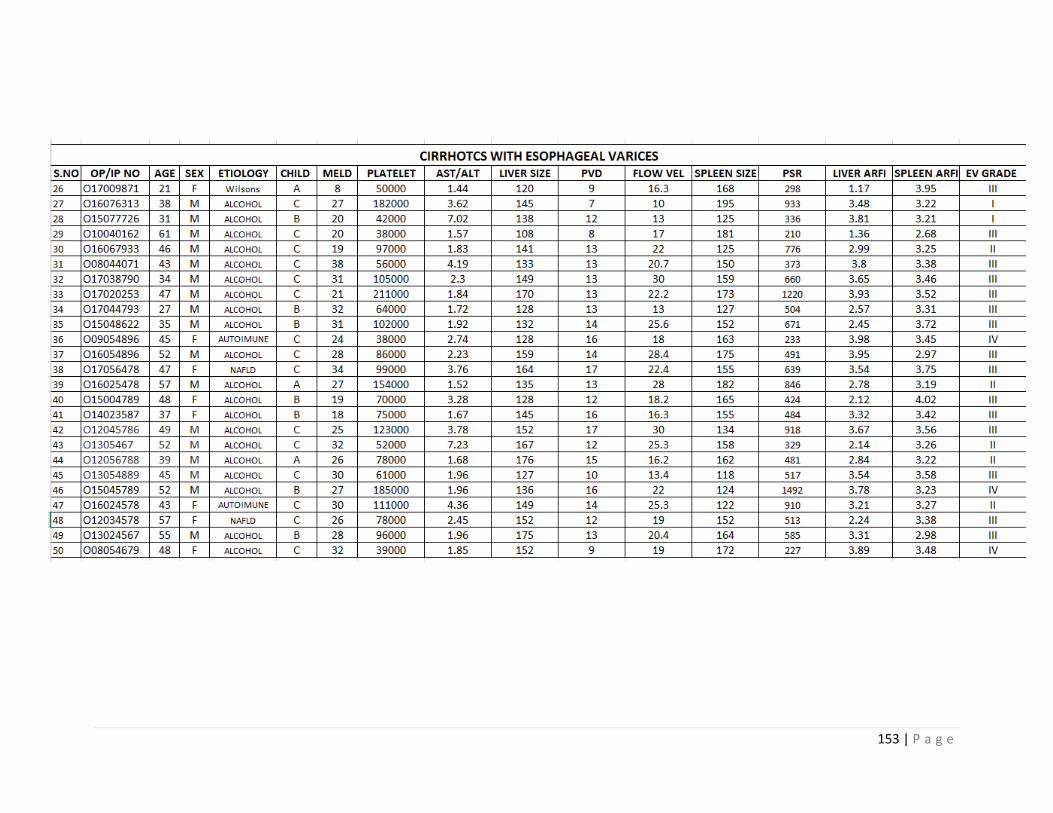
153 | P a g e
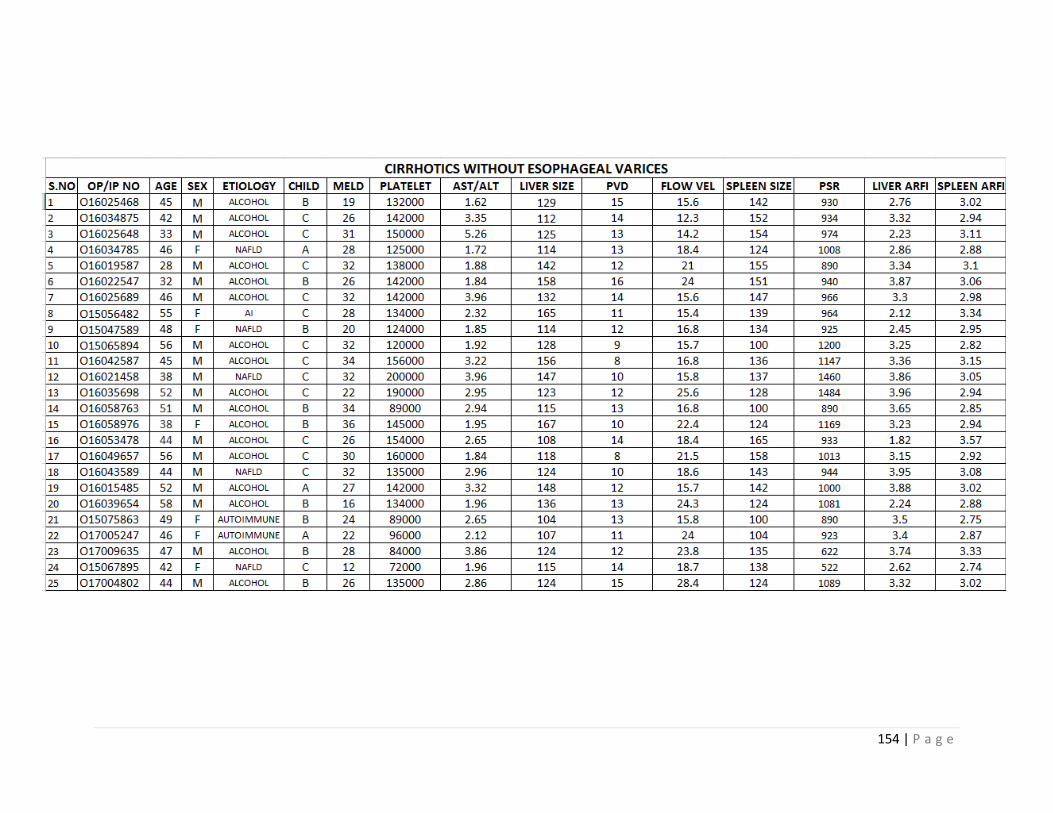
154 | P a g e
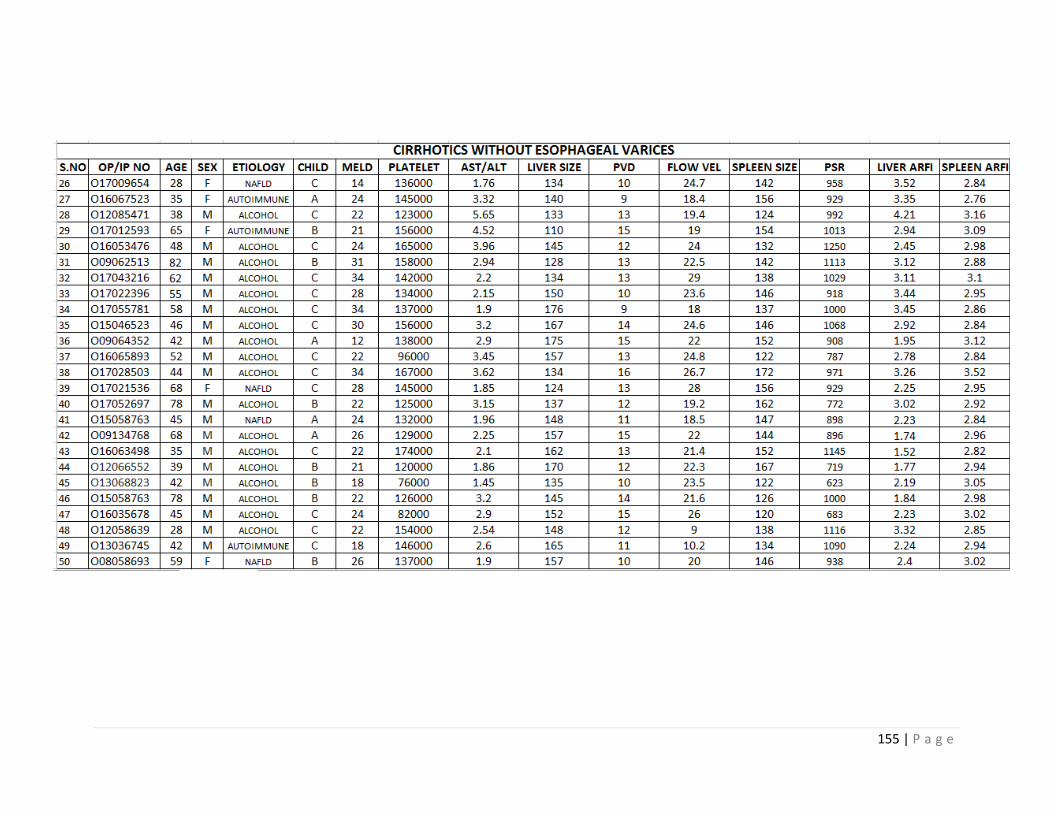
155 | P a g e