PDF - WMO Library - World Meteorological Organization |
28
-
Upload
khangminh22 -
Category
Documents
-
view
0 -
download
0
Transcript of PDF - WMO Library - World Meteorological Organization |

MILESTONES IN THE HISTORY OF OZONE
1839
1860
1880
1913
1920
1926
1929
1930
1934
1955
1957
1965
1966
1971
1974
1974
1975
19771981-94
1984
1985
1986
1987
1988
1990
1991
19921992-94
1995
Discovery of the ozone by C.F. Schonbein
Surface ozone started to be measured at hundreds of locations
Strong absorption band of solar radiation between 200 and 320 nm attributed to upper atmosphere ozone by Hartley
Proof from UV measurements that most ozone is located in the stratosphere
First quantitative measurements of the total ozone content
Six Dobson ozone spectrophotometers are distributed around the world for regular total ozone column measurements
The Umkehr method for vertical ozone distribution is discovered and determines the ozone maximum is lower than 25 km
Photochemical theory of stratospheric ozone formation and destruction based on chemistry of pure oxygen
Ozone sonde on balloon shows maximum concentration at about 20 km
Global network of ozone stations proposed for IGY
WMO assumes responsibility for standard procedures for uniform ozone observations and the Global Ozone Observing System (G030S) estab
lished
Photochemical theory of ozone with destruction by HOx radicals
First ozone measurements from satellites
Ozone destruction by NOx mechanism proposedStart of consideration of ClOx chemistry as an ozone-destroying mechanism
Human-produced CFCs recognized as source of stratospheric chlorine
WMO conducts first international assessment of the state of global ozone
Plan of Action on Ozone Layer established by UNEP in collaboration with WMO
Scientific assessments of the state of the ozone layer issued in 1981, 1985, 1988, 1991 and 1994 by WMO in collaboration with UNEP and
national research agenciesUnusually low (-200 m atm cm) total ozone at Syowa, Antarctica, in October 1982, first reported at the Ozone Commission Symposium in
Halkidiki, but its significance was recognized only the next year
Vienna Convention for the Protection of the Ozone Layer concluded and data from Halley station on the existence of an ozone hole during
Antarctic springs since the early 1980s published by the British Antarctic SurveyAnalysis of Montsouris (Paris) surface ozone (1873-1910) indicates levels then were less than half of the present
Montreal Protocol on Substances that Deplete the Ozone Layer concluded under UNEP auspices and basic assessment of the state of the ozone
initiated by the International Ozone Trends Panel
Decrease of ozone concentrations by -10% per decade in the lower stratosphere documented; proof from NASA Antarctic Campaign that activechlorine and bromine byproducts of human activities are the cause of the Antarctic-spring ozone hole
London amendment to strengthen the Montreal Protocol by phasing out all CFC production and consumption by 2000
The WMOjUNEP Ozone Assessment - 1991 reveals ozone is declining not only in winter-spring but all year round and everywhere except over
the tropics; very large concentrations of ClO measured in the Arctic confirms concerns for potential stronger ozone declineCopenhagen amendment further strengthened Montreal Protocol by phasing out CFCs by the end of 1995, adding controls on other compounds
Extremely low ozone values (-100 m atm cm) during Antarctic spring and largest area -24 m. km2 covered; also the lowest ever ozone values
measured during the northern winter-spring seasons all indicating increasing destructive capability by increasing chlorine and bromine concen
trations in the stratosphereRecord low ozone values (exceeding 25% below long-term average) observed January to March over Siberia and a large part of Europe
The Changing Ozone Layer
by
Rumen D. Bojkov
A joint publication of the World Meteorological Organization and the United NationsEnvironment Programme on the occasion of the fiftieth anniversary of the United Nations

2
© 1995,World Meteorological Organization
and United Nations Environment Programme
The material in this publication may be quoted or reproduced without fee on condition that thesource is duly and conspicuously acknowledged in every instance.
ISBN 92-63-10828-5NOTE
The designations employed and the presentation of material in this publication do not imply theexpression of any opinion whatsoever on the part of the Secretariat of the World MeteorologicalOrganization or the United Nations Environment Programme concerning content, the legal statusof any country, territory, city or area, or of its authorities, or concerning the delimitation of itsfrontiers or boundaries.
I
I

FOREWORD
For millions of years the basic atmosphericcomposition is believed not to have changed,although some rare compounds such ascarbon dioxide are known to have varied. Theozone molecules concentrated mainly betweenaltitudes of 15 to 35 km have determined thetemperature structure of the stratosphere andby absorbing the harmful ultraviolet radiationhave safeguarded life on this planet. But overthe past half century, humans have placed theozone layer in jeopardy. U~ittingly we havereleased into the atmosphere chemicals thatare destroying part of the life-protecting ozonelayer and thus upsetting the delicate balanceestablished by nature.
Isolated ozone observations were made inthe 1920s, but systematic measurements beganonly about 40 years ago. At present nearly 60Member countries are contributing to the WorldMeteorological Organization (WMO) GlobalOzone Observing System (G030S) providingdata proven to be essential for understandingthe state and changes of the ozone layer. Thesedata started to be carefully analysed when, inthe early 1970s, scientific findings highlightedthe potential of chlorofluorocarbons (CFCs) andhalons to destroy ozone with serious environmental implications.
It was not until the mid-1980s, however,that we obtained convincing evidence of ozonedestruction as demonstrated by the dramaticozone decline in the Antarctic spring. More than25 years of extensive research by scientistsfrom around the World has shown thatcompounds released into the atmosphere byhumans are depleting ozone.
The atmosphere has no national boundaries,so it was immediately recognized that remedialactions should be part of an international
3
endeavour. WMO has a continuing responsibilityfor working with governments to provide authoritative scientific information and advice on thestate and behaviour of the Earth's atmosphereand climate. In 1975, it issued the first scientificstatement "Modification of the ozone layer due tohuman activities and some possible geophysicalconsequences". Two years later, WMO joinedthe United Nations Environment Programme(UNEP) in preparing for an intergovernmentalmeeting of experts (Washington, DC, March1977) which drew up the first international Planof Action for the Protection of the Ozone Layer.
In the succeeding years WMO in collaboration with UNEP, coordinated preparation of aseries of scientific assessments. They werebased on the achievements of hundreds ofscientists, from both developed and developingcountries and on contributions from manynational agencies. These assessments providedthe basis for the UNEP-Ied negotiations forconclusion of the Convention on the Protectionof the Ozone Layer (Vienna, 1985) and itsMontreal Protocol (1987). Amendments to theProtocol (London 1990, Copenhagen 1992)required drastic cuts in the use of the CFCs,halons and other ozone-depleting substanceswhich were implicated as the main cause ofozone destruction.
These agreements were the first global environmental risk-management treaties concludedunder the United Nations umbrella. They tookaction to prevent an emerging problem. Thestory of these treaties has been both extraordinary and unprecedented, providing a model forfurther international action against global threatsto the environment. The action to defend theozone layer will rank as one of the great international achievements of the century. At the time
4
of the 50th Anniversary of the United Nations,that achievement demonstrates the spread of thespirit of cooperation among governments, industry, environmental organizations and among thepeoples of the planet to ensure a prosperous andsustainable world.
The changing ozone layer briefly tells thestory of atmospheric ozone and of the actionscoordinated and catalysed by WMO and UNEPto safeguard the atmosphere. It is a storystretching over the 50 years of the UnitedNations; a story demonstrating continuouscollaboration between WMO and UNEP whohave issued this booklet jointly as a contributionto the UN's 50th Anniversary commemorations.
There are still some uncertainties regardingthe future of the ozone layer. But certainly itsrecovery depends on the ability of nations to
comply with international agreements and curbemissions of substances containing chlorine andbromine that deplete stratospheric ozone. It isgratifying that the world community has madeprogressive steps by concluding the ViennaConvention and its Montreal Protocol. Thesetreaties provide a dramatic example of sciencein the service of humankind.
This brochure concludes with a look at possible developments as we approach the nextcentury, and considers how the nations of theworld will need to collaborate to prevent futurethreats to the ozone layer as demanded byAgenda 21 adopted by the Earth Summit (Rio deJaneiro, June 1992).
Finally, we wish to express the gratitude ofWMO and UNEP to Dr Rumen D. Bojkov forpreparing this brochure.
-(G. O. P. Obasi)
Secretary-GeneralWorld Meteorological Organization
-(E. Dowdeswell)
Executive DirectorUnited Nations Environment Programme
5
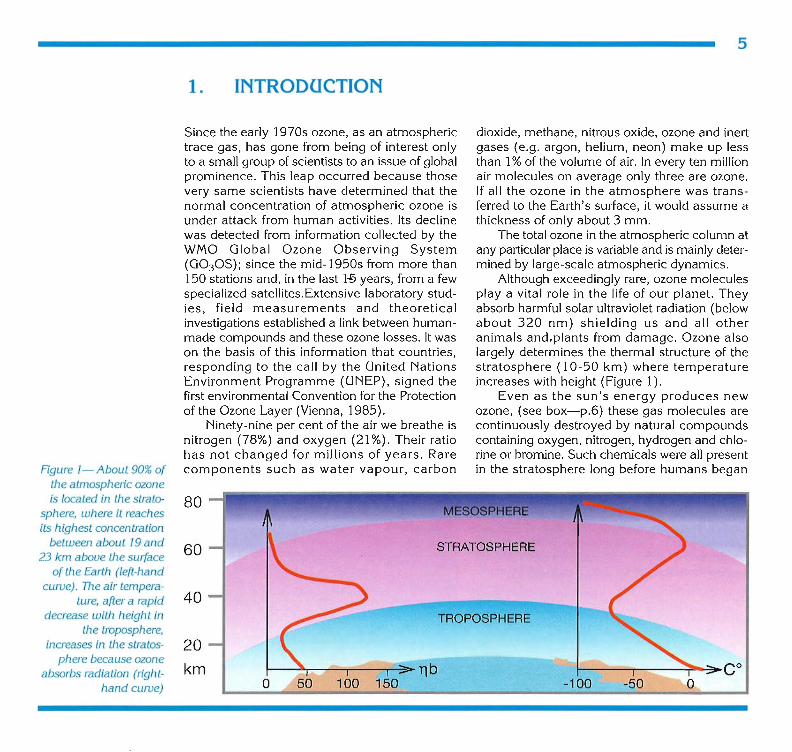
1. INTRODUCTION
Since the early 1970s ozone, as an atmospherictrace gas, has gone from being of interest onlyto a small group of scientists to an issue of globalprominence. This leap occurred because thosevery same scientists have determined that thenormal concentration of atmospheric ozone isunder attack from human activities. Its declinewas detected from information collected by theWMO Global Ozone Observing System(G030S); since the mid-1950s from more than150 stations and, in the last 1~ years, from a fewspecialized satellites.Extensive laboratory studies, field measurements and theoreticalinvestigations established a link between humanmade compounds and these ozone losses. It wason the basis of this information that countries,responding to the call by the United NationsEnvironment Programme (UNEP), signed thefirst environmental Convention for the Protectionof the Ozone Layer (Vienna, 1985).
Ninety-nine per cent of the air we breathe isnitrogen (78%) and oxygen (21 %). Their ratiohas not changed for millions of years. Rarecomponents such as water vapour, carbonFigure 1-About 90% of
the atmospheric ozoneis located in the strato
sphere, where it reachesits highest concentration
between about 19 and23 km aboue the surface
of the Earth (left-handcurue). The air tempera
ture, after a rapiddecrease with height in
the troposphere,increases in the stratos
phere because ozoneabsorbs radiation (right
hand curue)
80
60
40
20
kmo
dioxide, methane, nitrous oxide, ozone and inertgases (e.g. argon, helium, neon) make up lessthan 1% of the volume of air. In every ten millionair molecules on average only three are ozone.If all the ozone in the atmosphere was transferred to the Earth's surface, it would assume athickness of only about 3 mm.
The total ozone in the atmospheric column atany particular place is variable and is mainly determined by large-scale atmospheric dynamics.
Although exceedingly rare, ozone moleculesplay a vital role in the life of our planet. Theyabsorb harmful solar ultraviolet radiation (belowabout 320 nm) shielding us and all otheranimals and,plants from damage. Ozone alsolargely determines the thermal structure of thestratosphere (10-50 km) where temperatureincreases with height (Figure 1).
Even as the sun's energy produces newozone, (see box-p.6) these gas molecules arecontinuously destroyed by natural compoundscontaining oxygen, nitrogen, hydrogen and chlorine or bromine. Such chemicals were all presentin the stratosphere long before humans began
STRATOSPHERE
TROPOSPHERE
-100
6
polluting the air. Nitrogen compounds comefrom soils and the oceans, hydrogen comesmainly from atmospheric water vapour and chlorine comes from the oceans in the form ofmethyl chloride and methyl bromide. Nowhuman beings have upset the delicate balanceof production and destruction. By releasing additional chlorine- and bromine- containingchemicals (e.g. chlorofluorocarbons) into theatmosphere we have enhanced the destructionof ozone leading to lower ozone concentrationsin the stratosphere.
The opposite process is occurring in thelower part of the atmosphere (up to 10-12 km),called the troposphere. Here, mainly as a resultof combustion processes, the local concentrations of ozone in the northern middle latitudeshave more than doubled in the last 100 years.This tropospheric ozone increase cannotcompensate for the stratospheric decline, but thechanges could influence the radiative balance ofthe earth-atmosphere system.
This subject is being raised on the 50thAnniversary of the United Nations because itrepresents an environmental success story.Understanding ozone changes and themeasures necessary for ozone protectionrequire the collaboration of scientists,governments and industry worldwide. It callsfor a common effort by all nations with thecollaboration of specialized agencies of theUnited Nations, such as the United NationsDevelopment Programme and the WorldBank, and of other national and internationalbodies coordinated by WMO and UNEP.
ATMOSPHERIC OZONE
Ozone (03) is a form of the element oxygen (0) whichhas three atoms in each molecule instead of the two of normal oxygen molecules (02)' It is formed in the stratosphere by the action of solar radiation onoxygen molecules in a process called photolysis; 02 molecules are brokendown to yield atomic oxygen, which in turn combines with molecular oxygento produce ozone.
Ozone is destroyed naturally through a series of catalytic cycles involvingoxygen, nitrogen, chlorine,bromine and hydrogen.
The stratosphere (10-50 km above the earth's surface) contains 90% ofall the ozone in the atmosphere. Looking up through the atmosphere, theozone column has its maximum partial pressure in the lower stratosphere at a
.. level of 19-23 km above the Earth ,(Figure 1).
The Sun's output and the observed
ozone decline
Stratospheric ozone is primarily created by ultraviolet (UV)radiation. The Sun's output affects the rate at which it is produced. The Sun'senergy release in the UV part of the spectrum does vary, especially over thewell-known ll-year sunspot cycle. Observations over several solar cyclessince the 1950s show that total global ozone levels decrease by 1 to 2% fromthe maximum to the minimum of a typical solar cycle. The recently-observedlong-term changes in ozone are much greater than this. They cannot beattributed to changes in solar activity.

7
2. OZONE MEASUREMENTS AND DISTRIBUTION
Ozone was discovered by C. F. Sch6nbein whenobserving electrical discharges in 1839 but it wasnot until after 1850 that it was determined to be anatural atmospheric constituent. Its name comesfrom the Greek word meaning "smell", a reference to ozone's distinctively pungent odour whenin large concentrations. Surface ozone measurements have been made regularly since the 1860s.In 1880, experiments showed that ozone strongly
OZONE MEASUREMENT AND UNITSTotal ozone is defined as being equal to the amount of ozone contained in avertical column of base 1 cm2 at standard pressure and temperature. It can beexpressed in units of pressure, typically about 0.3 atmosphere centimetres. Themilli-atmosphere centimetre-m atm. cm (commonly called the Dobson Unit)corresponding to an average atmospheric concentration of approximately onepart per billion by volume (1 ppbv) of ozone, is most frequently used. Ozone isnot distributed uniformly through the vertical column.
The world average is about 300 units, it varies geographically from about230 to 500 Dobson Units. Total column ozone has, on average, its lowestvalues over the equatorial belt and increases with latitude (Figure 2).
The Umkehr effect .LLAn optical effect is observed when the ratio of the measured I
intensities of scattered zenith skylight at two different wavelengths \(311 and 332 nm) is plotted against the increasing zenith angle 0of the Sun between 60° and 90°. The ratio increases with increas-ing zenith angle up to about 86°, then a reversal (Umkehr) zaoccurs.
The combination of absorption and scattering of the wavelengthsproduces an altitude scan from which the vertical ozone distribution in nine5 km-thick layers can be deduced. Such calculations are carried out by auniform method at the WMO World Ozone Data Centre which keeps morethan 40 000 profiles on file.
absorbed radiation in the ultraviolet part of thesunlight spectrum. This led by 1913, to conclusive proof that most of the atmosphere's ozonewas located in the stratosphere. It was later shownthat its maximum concentration occurs between19 and 23 km (Figure 1).
Following the first quantitative total columnozone measurements in 1920, G. M. B. Dobson,an Oxford scientist, perfected an instrument tomonitor total ozone routinely. The instrumentwas a landmark in ozone science. It is still thebackbone of the Global Ozone ObservingSystem and is continuously in use today atalmost 100 observatories around the world.Amounts of-ozone are regularly reported inthickness of the total column ozone, commonlyknown as Dobson Units (see box left).
Since the late 1950s, filter ozonometers at4.4 stations in the former USSR have alsoprovided valuable data. In the last decade, anautomated Brewer ozone-spectrophotometerhas been developed. A number of these instruments are starting to report ozone data.
Ground-based measurements are nowaugmented by specialized equipment on satellites, such as the Total Ozone MappingSpectrometer (TOMS), the StratosphericAerosol and Gas Experiment and the SolarBackscatter Ultra Violet spectrometer.
In 1929, a method, called the Umkehr effect(see box), of determining the vertical profile ofozone concentrations was discovered. It wasfollowed in the 1930s by the development of thephotochemical theory of ozone formation byChapman. Later, balloon ozonesondes providedozone profile data. For more on the history ofozone see inside the front cover.
A global network of ozone observing stationsformed part of the plans for the ambitious
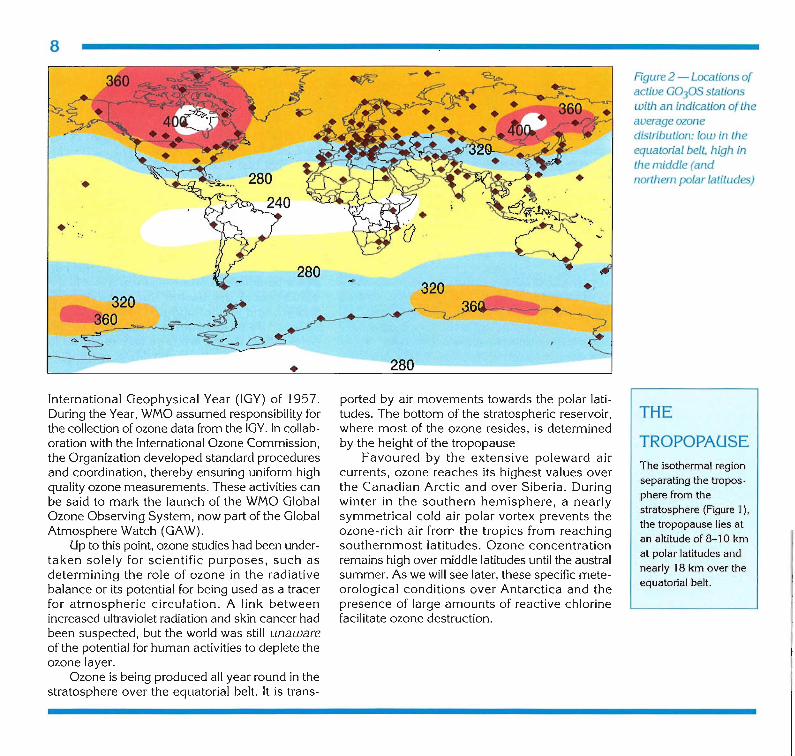
8
Figure 2 - Locations ofactive G0305 stationswith an indication of theaverage ozonedistribution: low in theequatorial belt, high inthe middle (andnorthern polar latitudes)
•International Geophysical Year (IGY) of 1957.During the Year, WMO assumed responsibility forthe collection of ozone data from the IGY. In collaboration with the International Ozone Commission,the Organization developed standard proceduresand coordination, thereby ensuring uniform highquality ozone measurements. These activities canbe said to mark the launch of the WMO GlobalOzone Observing System, now part of the GlobalAtmosphere Watch (GAW).
Up to this point, ozone studies had been undertaken solely for scientific purposes, such asdetermining the role of ozone in the radiativebalance or its potential for being used as a tracerfor atmospheric circulation. A link betweenincreased ultraviolet radiation and skin cancer hadbeen suspected, but the world was still unawareof the potential for human activities to deplete theozone layer.
Ozone is being produced all year round in thestratosphere over the equatorial belt. It is trans-
280
ported by air movements towards the polar latitudes. The bottom of the stratospheric reservoir,where most of the ozone resides, is determinedby the height of the tropopause
Favoured by the extensive poleward aircurrents, ozone reaches its highest values overthe Canadian Arctic and over Siberia. Duringwinter in the southern hemisphere, a nearlysymmetrical cold air polar vortex prevents theozone-rich air frorr the tropics from reachingsouthernmost latitudes. Ozone concentrationremains high over middle latitudes until the australsummer. As we will see later, these specific meteorological conditions over Antarctica and thepresence of large amounts of reactive chlorinefacilitate ozone destruction.
THE
TROPOPAUSEThe isothermal regionseparating the troposphere from thestratosphere (Figure 1),the tropopause lies atan altitude of 8-10 kmat polar latitudes andnearly 18 km over theequatorial belt.

9
3. DEFINING THE THREAT TO THE OZONE LAYER
800
Foam blowing 26 %
Propellents 28 %
Refrigerants 23 %
Figure 4 - Use ofCFCs in per cent of
total release in ] 986
HALOCARBONS
Halocarbon is a generic term covering
a number of human-produced gases
all containing carbon and halogen
(fluorine, chlorine or bromine) atoms.
Halocarbons include chlorofluocarbons (CFCs)
and halons. The first was synthesized in 1928.Since then, they have come to be widely used
for a variety of purp9ses such as propellants in
aerosol cans, in the manufacture of soft and
hard foams, in refrigeration and air conditioning,
and as cleaning solvents (Figure 4).
Consequently, they were increasing rapidly in
the atmosphere (Figure 3).
Halocarbons in the troposphere are inert,non-toxic, non-flammable, odourless and
colourless. However, when they reach the
stratosphere, particularly at and above the layer
of maximum ozone (19-23 km), high-energy
ultraviolet photons from the Sun free chlorine
or bromine atoms. These atoms catalytically
detach one oxygen atom from an ozone molecule, thus convert ozone to molecular oxygen
(Figures 6 and 7).750
650
450
- 550
1990198019701960'----l-_-'-----'-_-'----'-_-'-........Jl..---'-_.l...-......J 350
20001950
CFC-11 &CFC-12
Cl~700 -
<0o
(/)Ql
gj 500Ql
~rooI- 300
Until the early 1970s nobody dreamed that humanactivity could threaten to deplete the ozone layer.Then scientists identified two potential problems:exhausts from supersonic planes (SST) flying inthe lower stratosphere, and chemicals used inrefrigerators and as propellants in spray cans. In1971, H. S. Johnston, at the University of Califomia(Berkeley), pointed out the potential danger of alarge fleet of SSTs emitting considerable amountsof nitric oxide into the lower stratosphere, possiblyaccelerating natural ozone deMruction. Only threeyears later, F. S. Rowland and M. Molina showedthat a widely used class of very inert chemicalsknown as chlorofluorocarbons were transportedto the stratosphere by convective air movements.There, they could absorb high-energy photonsfrom sunlight and release free chlorine; Oncereleased, the chlorine could destroy stratosphericozone through a series of catalytic reactions.
We now know that bromine from the halonsused in some fire extinguishers can also be
Figure 3 - The release ofof the two most widelyused CFCs, CFC] ] and
CFC]2, grew frominsignificant amounts in
the]950s to morethan 700 thousand
tonnes a year in the early1970s. It has declined in
recent years as a result ofmeasures under the
Montreal Protocol. Butthe atmospheric concen
tration is continuing torise (red scale) demon
strating the long lifetimeof these compounds
10
2.50"'0tll
2.00 13"0~
1.50 [o':J
1.00
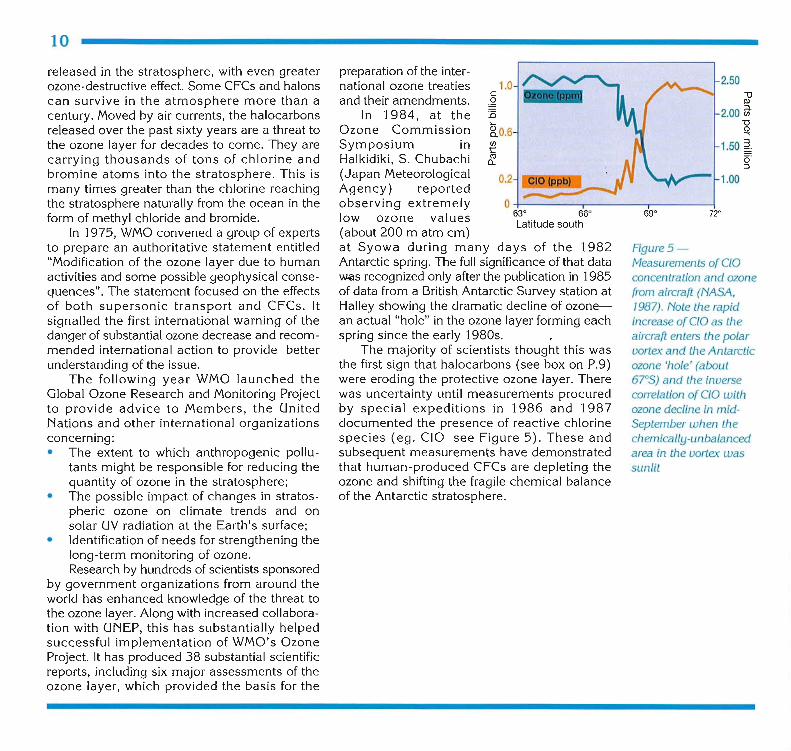
Figure 5Measurements of Ciaconcentration and ozonefrom aircraft (NASA,]987). Note the rapidincrease of Cia as theaircraft enters the polarvortex and the Antarcticozone 'hole' (about67°5) and the inversecorrelation of Cia withozone decline in midSeptember when thechemically-unbalancedarea in the vortex wassunlit
0+----,------,-------\63° 66°Latitude south
0.2
1.0c~:0
~0.6(/)
t::<1la..
preparation of the international ozone treatiesand their amendments.
In 1984, at theOzone CommissionSymposium inHalkidiki, S. Chubachi(Japan MeteorologicalAgency) reportedobserving extremelylow ozone values(about 200 m atm cm)at Syowa during many days of the 1982Antarctic spring. The full significance of that dataWQS recognized only after the publication in 1985of data from a British Antarctic Survey station atHalley showing the dramatic decline of ozonean actual "hole" in the ozone layer forming eachspring since the early 1980s.
The majority of scientists thought this wasthe first sign that halocarbons (see box on P.9)were eroding the protective ozone layer. Therewas uncertainty until measurements procuredby special expeditions in 1986 and 1987documented the presence of reactive chlorinespecies (eg. cia see Figure 5). These andsubsequent measurements have demonstratedthat human-produced CFCs are depleting theozone and shifting the fragile chemical balanceof the Antarctic stratosphere.
released in the stratosphere, with even greaterozone-destructive effect. Some CFCs and haIonscan survive in the atmosphere more than acentury. Moved by air currents, the halocarbonsreleased over the past sixty years are a threat tothe ozone layer for decades to come. They arecarrying thousands of tons of chlorine andbromine atoms into the stratosphere. This ismany times greater than the chlorine reachingthe stratosphere naturally from the ocean in theform of methyl chloride and bromide.
In 1975, WMO convened a group of expertsto prepare an authoritative statement entitled"Modification of the ozone layer due to humanactivities and some possible geophysical consequences". The statement focused on the effectsof both supersonic transport and CFCs. Itsignalled the first international warning of thedanger of substantial ozone decrease and recommended international action to provide betterunderstanding of the issue.
The following year WMO launched theGlobal Ozone Research and Monitoring Projectto provide advice to Members, the UnitedNations and other international organizationsconcerning:• The extent to which anthropogenic pollu
tants might be responsible for reducing thequantity of ozone in the stratosphere;
• The possible impact of changes in stratospheric ozone on climate trends and onsolar UV radiation at the Earth's surface;
• Identification of needs for strengthening thelong-term monitoring of ozone.Research by hundreds of scientists sponsored
by government organizations from around theworld has enhanced knowledge of the threat tothe ozone layer. Along with increased collaboration with UNEP, this has substantially helpedsuccessful implementation of WMO's OzoneProject. It has produced 38 substantial scientificreports, including six major assessments of theozone layer, which provided the basis for the
11
4. OBSERVED OZONE CHANGES
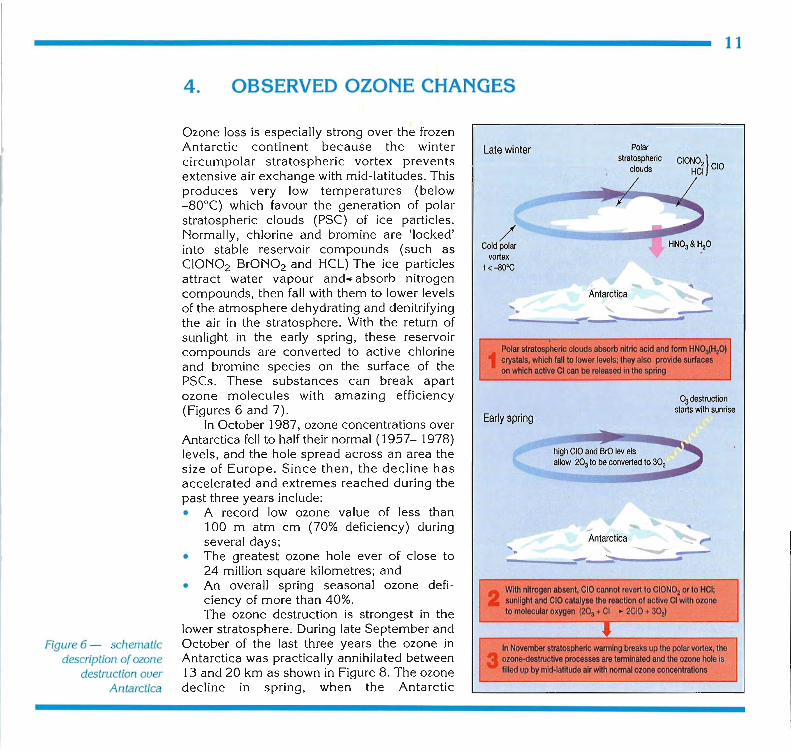
O:J destructionstarts with sunrise
2With nitrogen absent, CIO cannot revert to CION02 or to HCI;sunlight and CIO catalyse the reaction of active Cl with ozoneto molecular oxygen (203 +Cl ~ 2CIO +30:J
CIONO'}CIOHCI
Polarstratospheric
clouds
.... ~-......... .. ,Antarctica ~ ,-..
'. ---------....;:...-:........ .
, .... ~""," ...Antarcti\ia ~
---'- ---------....;:...-:...... .
high CIO and BrO levelsallow 203to be converted to 30,
In November stratospheric warming breaks up the polar vortex, the3 ozone-destructive processes are tenninated and the ozone hole isfilled up by mid-latitude air with nonnaJ ozone concentrations
Polar stratospheric clouds absorb nitric acid and fonn HN03(H20)1ClYstals, which fall to lower levels; they also provide surfaceson which active Cl can be released In the spring
Early spring
Late winter
/Cold polar
vortext <-8GoC
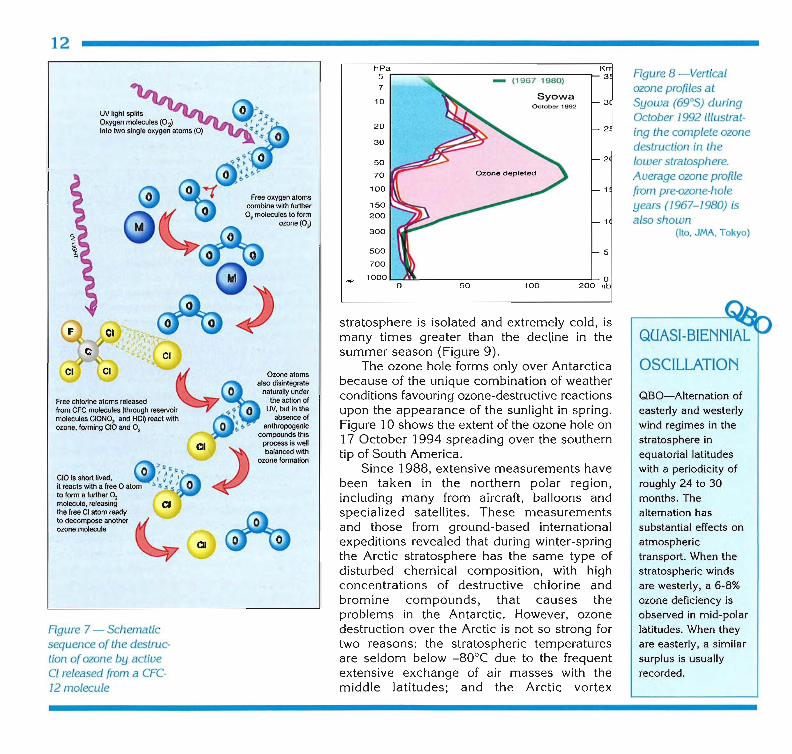
Ozone loss is especially strong over the frozenAntarctic continent because the wintercircumpolar stratospheric vortex preventsextensive air exchange with mid-latitudes. Thisproduces very low temperatures (below-80°C) which favour the generation of polarstratospheric clouds (PSC) of ice particles.Normally, chlorine and bromine are 'locked'into stable reservoir compounds (such asCION02 BrON02 and HCL) The ice particlesattract water vapour and.. absorb nitrogencompounds, then fall with them to lower levelsof the atmosphere dehydrating and denitrifyingthe air in the stratosphere. With the return ofsunlight in the early spring, these reservoircompounds are converted to active chlorineand bromine species on the surface of thePSCs. These substances can break apartozone molecules with amazing efficiency(Figures 6 and 7).
In October 1987, ozone concentrations overAntarctica fell to half their normal (1957- 1978)levels, and the hole spread across an area thesize of Europe. Since then, the decline hasaccelerated and extremes reached during thepast three years include:• A record low ozone value of less than
100 m atm cm (70% deficiency) duringseveral days;
• The greatest ozone hole ever of close to24 million square kilometres; and
• An overall spring seasonal ozone deficiency of more than 40%.The ozone destruction is strongest in the
lower stratosphere. During late September andOctober of the last three years the ozone inAntarctica was practically annihilated between13 and 20 km as shown in Figure 8. The ozonedecline in spring, when the Antarctic
Figure 6 - schematicdescription ofozone
destruction overAntarctica
o
OSCILLATION
QBO-Alternation ofeasterly and westerlywind regimes in thestratosphere inequatorial latitudeswith a periodicity ofroughly 24 to 30months. Thealternation hassubstantial effects onatmospherictransport. When thestratospheric windsare westerly, a 6-8%ozone deficiency isobserved in mid-polarlatitudes. When theyare easterly, a similarsurplus is usuallyrecorded.
stratosphere is isolated and extremely cold, ismany times greater than the decUne in thesummer season (Figure 9).
The ozone hole forms only over Antarcticabecause of the unique combination of weatherconditions favouring ozone-destructive reactionsupon the appearance of the sunlight in spring.Figure 10 shows the extent of the ozone hole on17 October 1994 spreading over the southerntip of South America.
Since 1988, extensive measurements havebeen taken in the northern polar region,including many from aircraft, balloons andspecialized satellites. These measurementsand those from ground-based internationalexpeditions revealed that during winter-springthe Arctic stratosphere has the same type ofdisturbed chemical composition, with highconcentrations of destructive chlorine andbromine compounds, that causes theproblems in the Antarctic. However, ozonedestruction over the Arctic is not so strong fortwo reasons: the stratospheric temperaturesare seldom below -80°C due to the frequentextensive exchange of air masses with themiddle latitudes; and the Arctic vortex
Ozone atomsalso disintegrate
naturally underthe action of
UV, but in theabsence of
anthropogeniccompounds this
process is wellbalanced with
ozone formation
hPa KFigure 8 -Vertical5 (1967-1980) 3
7 ozone profiles at10
Syowa3 Syowa (69°5) duringOctober 1992
October]992 iIIustrat-20 2 ing the complete ozone30 destruction in the50 2 lower stratosphere.70 Average ozone profile
100 from pre-ozone-holefree oxygen atoms
combine with further 150 years (1967-1980) is02 molecules to form 200 also shownOlone(O,)
300 (Ito. JMA, Tokyo)
500 5
700
050 100 200 "b
CID is short lived,it reacts with a free 0 atomto form a further 02molecule, releasingthe free Cl atom readyto decompose anotherozone molecule
Free chlorine atoms releasedfrom eFe molecules (through reselVoirmolecules CIONO, and HCQ react wrthozone, forming CID and 02
12
Figure 7 - Schematicsequence of the destruction ofozone by activeCl released from a CFe12 molecule
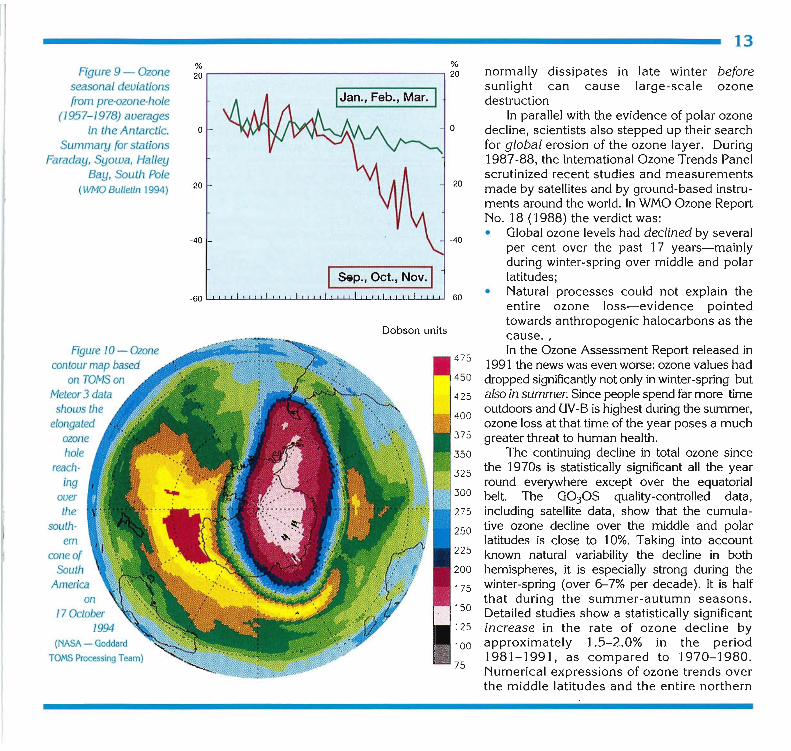
13% %20 r-------------------, 20 normally dissipates in late winter before
sunlight can cause large-scale ozonedestruction
In parallel with the evidence of polar ozonedecline, scientists also stepped up their searchfor global erosion of the ozone layer. During1987-88, the International Ozone Trends Panelscrutinized recent studies and measurementsmade by satellites and by ground-based instruments around the world. In WMO Ozone ReportNo. 18 (1988) the verdict was:• Global ozone levels had declined by several
per cent over the past 17 years-mainlyduring winter-spring over middle and polarlatitudes;
• Natural processes could not explain theentire ozone loss-evidence pointedtowards anthropogenic halocarbons as thecause. ,In the Ozone Assessment Report released in
1991 the news was even worse: ozone values haddropped significantly not only in winter-spring butalso in summer. Since people spend far more timeoutdoors and UV-B is highest during the summer,ozone loss at that time of the year poses a muchgreater threat to human health.
The continuing decline in total ozone sincethe 1970s is statistically significant all the yearround everywhere except over the equatorialbelt. The G030S quality-controlled data,including satellite data, show that the cumulative ozone decline over the middle and polarlatitudes is close to 10%. Taking into accountknown natural variability the decline in bothhemispheres, it is especially strong during thewinter-spring (over 6-7% per decade). It is halfthat during the summer-autumn seasons.Detailed studies show a statistically significantincrease in the rate of ozone decline byapproximately 1.5-2.0% in the period1981-1991, as compared to 1970-1980.Numerical expressions of ozone trends overthe middle latitudes and the entire northern
-20
o
-40
o
-60 -60
Dobson units
475
450
425
400
375
350
325
300
275
250
225
200
175
150
125
100
75
-40
-20
Figure 10 - Ozone
contour map basedon TOMS on
Meteor 3 data
shows the
eLongated
ozone
hoLereach
ingover
thesouth
erncone of
South
America
on]7 October
]994(NASA - Goddard
TOMS Processing Team)
Figure 9 - Ozone
seasonaL deviations
from pre-ozone-hoLe(1957-]978) averages
in the Antarctic.
Summary for stationsFaraday, Syowa, HaLLey
Bay, South PoLe
(WMO Bulletin 1994)

14
ARCTIC OZONE LOSS
The greatest winter ozone declines seen in the northern hemi
sphere occurred in 1992-1993 and in 1995. Ozone levels
between 9 and 20% below normal were recorded in middle and
high latitudes. Natural long-term variability is greatest between
December and March. In that period, a deviation of more than
about 13% (Le twice the standard deviation) is unlikely to occur
more than once every 20 years. The decline of 20% whichoccurred in February and March 1993 and 1995 were, there
fore, extreme cases.
Scientific evidence points to the fact that chlorine and
bromine released by CFCs and haIons are to blame for part of
the ozone decline. For example, the NASA Upper Atrnosph~
Research Satellite measured high concentration of CIO in air
masses moving southward from the Arctic into the sunlit45°-65°N latitudes. Several other factors contributed to the
extremely low ozone levels:
• The lower stratosphere was relatively cold, stimulatingPSC generation and chemical ozone destruction on their
surfaces;
• The quasi-biennial oscillation (see page 12) was in itswesterly phase both in 1993 and in 1995, affecting
stratospheric circulation, reducing ozone by 6 to 8 %;
• In 1993 the upwelling air motions of a 'blocking' anticyclone situated over the North Atlantic and Europe for
several weeks transported ozone-deficient air from the
troposphere in the sub-tropics to the polar region;
• Remnants of volcanic aerosols from the Mount Pinatuboeruption in June 1991 could have been responsible for afurther reduction of 1 to 2 % (mainly on the surface of
sulphates) in 1992-93.
In january-March 1995 the extremely strong ozone
deficiency of 15-25% occurred over mid-latitudes fromeastern Europe to the Far East. It was especially strong over
Siberia «35%) without the presence of any volcanic aerosolsbut with obvious abundance of CIO and a strong westerly
QBO. However, researchers are not yet fully confident that
they know exactly the mechanism behind the ozone drop.
Because of the high natural variability in ozone over the
Figure 11 - In March 1993, total ozone deviations from the longtenn mean show considerable deficiencies over northem middlelatitudes. The deficiency is relatively smaller over the polar cap thanoiJer the sunnier regions. Note that 13% represents a {all ofmore thantwice the standard deviation. Based on near-real-time in{onnationprovided by aopS. (WMO Bulletin, July1993)
-5
Arctic, it is difficult to determine the exact proportion of the
ozone destruction attributable to human action.
15
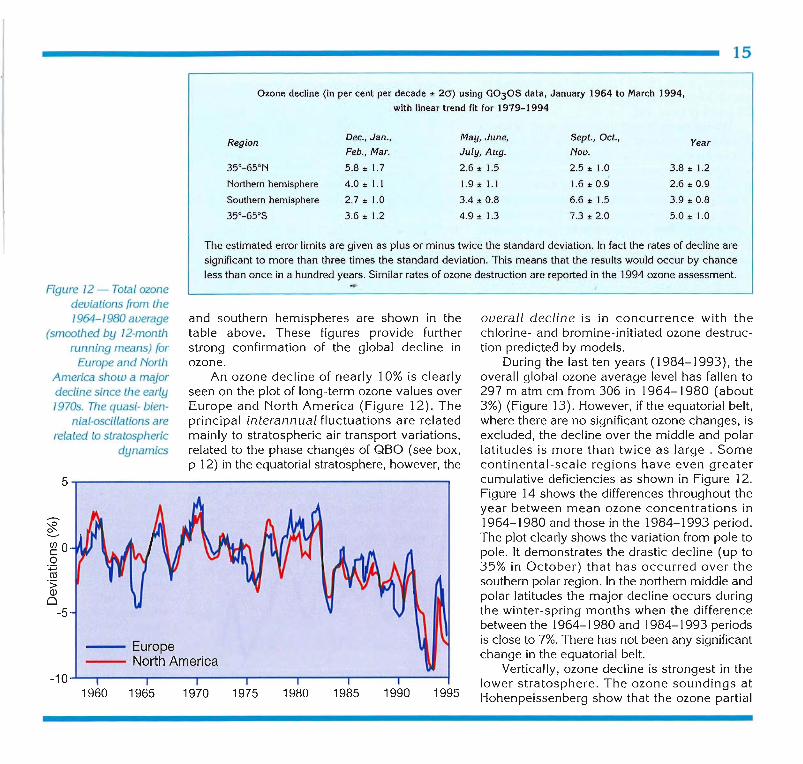
Ozone decline (in per cent per decade ± 2<i) using G030S data, January 1964 to March 1994,
with linear trend fit for 1979-1994
RegionDec., Jan., May, June, Sept.,Oct., YearFeb., Mar. July, Aug. Nov.
35°-65°N 5.8 ± 1.7 2.6 ± 1.5 2.5 ± 1.0 3.8 ± 1.2
Northern hemisphere 4.0 ± 1.1 1.9 ± 1.1 1.6 ± 0.9 2.6 ± 0.9
Southern hemisphere 2.7 ± 1.0 3.4 ± 0.8 6.6 ± 1.5 3.9 ± 0.8
35°_65°S 3.6 ± 1.2 4.9 ± 1.3 7.3 ± 2.0 5.0 ± 1.0
The estimated error limits are given as plus or minus twice the standard deviation. In fact the rates of decline aresignificant to more than three times the standard deviation. This means that the results would occur by chanceless than once in a hundred years. Similar rates of ozone destruction are reported in the 1994 ozone assessment.
overall decline is in concurrence with thechlorine- and bromine-initiated ozone destruction predicted by models.
During the last ten years (1984-1993), theoverall global ozone average level has fallen to297 m atm cm from 306 in 1964-1980 (about3%) (Figure 13). However, if the equatorial belt,where there are no significant ozone changes, isexcluded, the decline over the middle and polarlatitudes is more than twice as large. Somecontinental-scale regions have even greatercumulative deficiencies as shown in Figure 12.Figure 14 shows the differences throughout theyear between mean ozone concentrations in1964-1980 and those in the 1984-1993 period.The plot clearly shows the variation from pole topole. It demonstrates the drastic decline (up to35% in October) that has occurred over thesouthern polar region. In the northern middle andpolar latitudes the major decline occurs duringthe winter-spring months when the differencebetween the 1964-1980 and 1984-1993 periodsis close to 7%. There has not been any significantchange in the equatorial belt.
Vertically, ozone decline is strongest in thelower stratosphere. The ozone soundings atHohenpeissenberg show that the ozone partial19951990198519801975
and southern hemispheres are shown in thetable above. These figures provide furtherstrong confirmation of the global decline inozone.
An ozone decline of nearly 10% is clearlyseen on the plot of long-term ozone values overEurope and North America (Figure 12). Theprincipal interannual fluctuations are relatedmainly to stratospheric air transport variations,related to the phase changes of QBO (see box,p 12) in the equatorial stratosphere, however, the
19701960 1965-10..L---.-----.-----.-----.---....,..---.---.---;
~~O
°~-;;(1)
o-5
5-r------------------------,
Figure ]2 - Total ozonedeviations from the]964-]980 average
(smoothed by ]2-monthrunning means) {or
Europe and NorthAmerica show a majordecline since the early] 970s. The quasi- bien-
nial-oscillations arerelated to stratospheric
dynamics
16
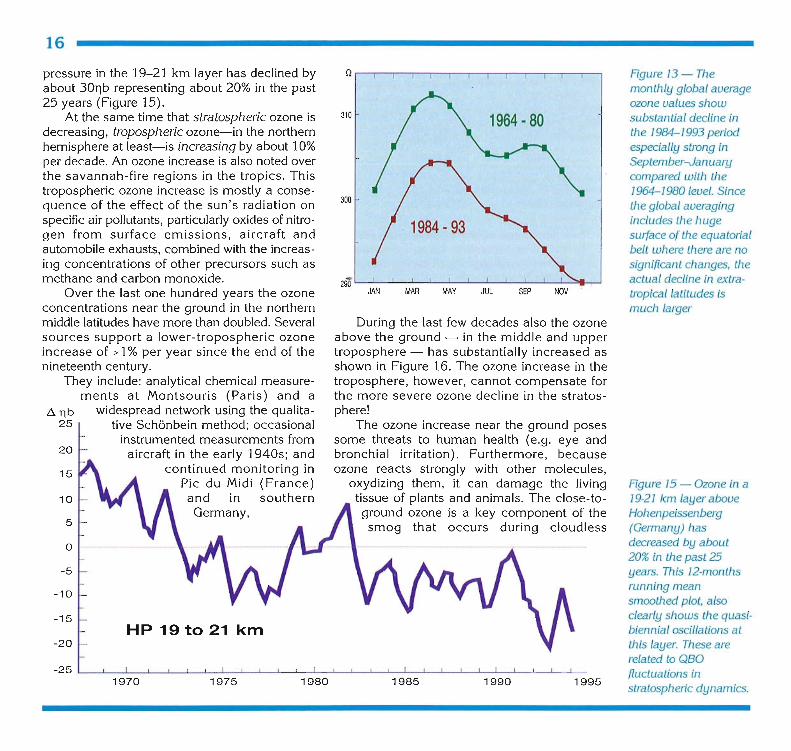
Figure 13 - Themonthly global averageozone values showsubstantial decline inthe 1984-1993 periodespecially strong inSeptember-Januarycompared with the1964-1980 level. Sincethe global averagingincludes the hugesurface of the equatorialbelt where there are nosignificant changes, theactual decline in extratropical latitudes ismuch larger
Figure 15 - Ozone in a19-21 km layer aboveHohenpeissenbelg(Germany) hasdecreased by about20% in the past 25years. This 12-monthsrunning meansmoothed plot, alsoclearly shows the quasibiennial oscillations atthis layer. These arerelated to QBOfluctuations instratospheric dynamics.
1995
NOVSEP
1964 - 80
1990
JULMAY
1984 - 93
MAR
1985
JAN
310
300
During the last few decades also the ozoneabove the ground - in the middle Glnd uppertroposphere - has substantially increased asshown in Figure 16. The ozone increase in thetroposphere, however, cannot compensate forthe more severe ozone decline in the stratosphere!
The ozone increase near the ground posessome threats to human health (e.g. eye andbronchial irritation). Furthermore, becauseozone reacts strongly with other molecules,
oxydizing them, it can damage the livingtissue of plants and animals. The c1ose-toground ozone is a key component of thesmog that occurs during cloudless
198019751970
5
20
10
15
-20
~T\b
25
-10
-15HP 19 to 21 km
o
-5
pressure in the 19-21 km layer has declined byabout 3011b representing about 20% in the past25 years (Figure 15).
At the same time that stratospheric ozone isdecreasing, tropospheric ozone-in the northernhemisphere at least-is increasing by about 10%per decade. An ozone increase is also noted overthe savannah-fire regions in the tropics. Thistropospheric ozone increase is mostly a consequence of the effect of the sun's radiation onspecific air pollutants, particularly oxides of nitrogen from surface emissions, aircraft andautomobile exhausts, combined with the increasing concentrations of other precursors such asmethane and carbon monoxide.
Over the last one hundred years the ozoneconcentrations near the ground in the northernmiddle latitudes have more than doubled. Severalsources support a lower-tropospheric ozoneincrease of > 1% per year since the end of thenineteenth century.
They include: analytical chemical measurements at Montsouris (Paris) and a
widespread network using the qualitative Sch6nbein method; occasional
instrumented measurements fromaircraft in the early 1940s; and
continued monitoring inPic du Midi (France)and in southernGermany,
17
30
summer days over many major cities around theworld. Governments are attempting to decreaseits levels by regulatory measures limiting itsspecific sources. Some success in this directionhas been noted in Europe and North Americaduring the last few years.
o
-30
-60
-90J F M A M J J A s o N o
19881972
TROPOSPHERIC OZONE AT 400 hPa (-7 Km)12-MONTH RUNNING MEANS
19561924 ,1940,
,: ll b40 r--'---,-----r----,----"T"""--~---""T'"--......:,
SURFACE OZONE12-MONTH RUN MEANS
1908
40 ppbv
10
30
20
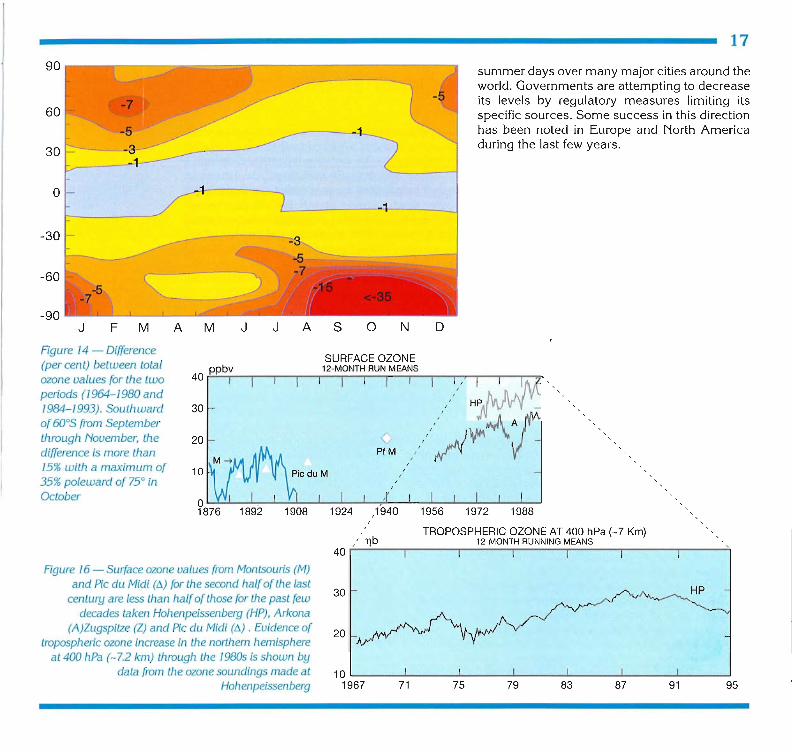
Figure] 4 - Difference(per cent) between totalozone values for the twoperiods (1964-]980 and]984-]993). Southwardof 600S from Septemberthrough November, thedifference is more than15% with a maximum of35% poleward of 75° inOctober
Figure] 6 - Surface ozone values from Montsouris (M)and Pic du Midi (t..) for the second halfof the last
century are less than halfof those for the past fewdecades taken Hohenpeissenberg (HP), Arkona
(A)Zugspitze (Z) and Pic du Midi (t..) . Evidence oftropospheric ozone increase in the northern hemisphere
at 400 hPa (-7.2 km) through the 1980s is shown bydata from the ozone soundings made at
Hohenpeissenberg
30
20
10 '-------'----........-----'----.........--.......---.......----'1967 71 75 79 83 87 91 95

18
5. RADIATIVE AND UV-B EFFECTS OF OZONE CHANGES
January
An example of the major contribution of ozone change to the total radia
tive forcing by all major greenhouse gases (C02, CH4, N20, CFCs, 03)
from 1971-1980 to 1981-1990 over the northern mid-latitudes, using
ozone soundings at Hohenpeissenberg, is shown above. Calculations for
two different modelling assumptions, fixed temperature (FT) and fixed
dynamical heating (FD), . show that ozone changes were responsible for
nearly half of the radiative forcing under the given modelling
treatment.(Wang et al.,GRL 1993)
An accurate assessment of the radiative effectof ozone changes is limited by the lack of detailedinformation on the variation in vertical distributionof ozone with latitude and longitude. However,recent calculations support earlier conclusions thatlower stratospheric ozone depletion in recentdecades has resulted in a negative radiative forcing(Le. a cooling effect on the climate) and has offset,by about 15-20%, the positive greenhouse forcingdue to increases in other gases. The increase oftn~pospheric ozone since pre- industrial times mayhave enhanced the total greenhouse forcing by asmuch as 20%. Such changes could have an impacton the radiative balance of the earth-atmospheresystem and the thermal structure of the atmosphere and thus cause as yet unpredictable changesto atmospheric circulation patterns.
Figure 17 - See textbelow.
1.027Wm-2
-==••••• 1,050 Wm-2
53 % 0 3
FD
July
54 % 03
FT
46%03~:J••~FD . 0,710 Wm-2
52%03 ::J•••~FT _ 0,794 Wm-2
To characterize a potential for climatic effects, "radiative forcing" (in units of
Wm-2) is frequently used. Its estimations are based on net solar and ther
mal infrared radiance at the tropopause, and are not greatly dependent on
uncertainties, such as the combined interactive role of clouds, aerosols or
oceans, in predicting surface climate change. A positive value signifies
increased energy retention, producing warming; a negative value implies
greater energy loss, ie. cooling.
• Tropospheric ozone has increased in the northern hemisphere since pre
industrial times. Models and deductions from observations suggest a
positive radiative forcing of about 0.5 Wm-2.
• Stratospheric ozone has decreased since the 1970s. Studies confirm that
between 1980 and 1990 this has caused negative radiative forcing of
about 0.1 Wm-2 compared with positive 0.45 Wm-2 forcing from an
increase of other greenhouse gases in the same period.
The net global mean radiative forcing arising from ozone changes is
likely to have been positive since pre-industrial time,contributing about 20%
of all the greenhouse-gas-caused increase of radiative forcing in that period.
OZONE AND RADIATIVE FORCING
Greenhouse effectBoth ozone and halocarbons are "greenhousegases". Much like carbon dioxide (C02), they intercept and re-radiate the Earth's outgoing infraredradiation, thereby helping to warm the lower atmosphere. However, neither ozone nor its changes areuniformly distributed, thus its radiative forcing (seebox) is more complicated than those of the otherprincipal greenhouse gases which have a long lifespan permitting even mixing. In general, addingozone in the troposphere especially near the tropopause causes warming; reducing ozone in thestratosphere causes cooling. Some small temperature decline (0.6°_ 0.8°) in the 12-20 km layerduring the past two decades seems to be consistent with expected radiative impacts ofstratospheric ozone decrease.

19
Ultra-violet radiation increase will result in higher photodissociationrates of key trace gases that control the chemicalprocesses in the troposphere.
Given that long-term, precise UV-B measurements are insufficient, and that the intensity of theradiation measured at the ground depends on thecloud cover, albedo, aerosol and the presence ofS02, the inverse correlation between UV-B intensity and the total ozone amount is well established.
Over those parts of the globe where the ozonechanges are most severe, i.e. under the ozone hole,the increase of the UV-B is well documented. Themaximum UV-B levels at the South Pole arereached in October - well before the summersolstice, and DNA-damaging radiation at Palmerstation (64°S) during October can exceed themaximum summer values measured at SanDiego (32°N). At mid-latitudes the UV-B increaseis smaller but well evident during low ozone periods.For example, the ozone decline of about 15%observed at the most southern tip of South Americaduring October of the past 15 years has caused anaverage increase of UV-B reaching the ground of85% at around 300 nm and 35% at around 305 nmwavelengths. During the ozone hole expansion overUshuaia in mid-October 1994 the intensity of theshort UV-B wavelengths, around 300 nm, increasedfive times and the 305nm twice compared to"normal' ozone conditions(Figure18). It was, to agreat extent, the prospects of continuous increaseof UV-B which prompted the intemational community to take regulatory action in the 1980s asdescribed in the next chapter.
20
200
100
10
30
if 300
NOV
The life-protecting role of atmospheric ozonestems from its ability to absorb dangerous ultraviolet radiation with wavelengths shorter than 320nm. The small amount of UV-B that does manageto penetrate through the ozone shield could causeconsiderable harm to human health, including eyecataracts, an increase of non-melanoma skincancers, damage to genetic DNA, and suppression of the efficiency of the immune system.
Under cloudless conditions, each 1% reduction in ozone results in an increase of about 1.3%in the UV-B which affects skin tissue reaching thesurface of the earth. The total ozone decline so farhas resulted in a small increa~ in UV-B (280 to320 nm) reaching the ground except over the tropical belt. Further ozone decline could haveconsiderable harmful consequences, not only tohumans but to other life forms and troposphericchemistry. Crops and the aquatic ecosystem,including ocean plankton, could be damaged with
yet unforeseen consequences. Some effectsare largely a function ofoverall dose, while others
. depend upon reaching agiven cumulative threshold. The ImpactAssessment Panel is estimating that asustained 1%decrease intotal ozone will result inan increase in nonmelanoma skin cancersof approximately 2 %.
In addition, marinephytoplankton are amajor sink for CO2 andany UV-B effect onthem could have a rolein future CO2 trends andconsequently onclimate. The UV-BSEP OCT
Q,..----------r.--------,400
4 300 nm
8
o
Figure]8 - BetweenSeptember and
November] 994, theAntarctic ozone hole
extended to reachUshuaia (5SOS).
Measurements ofUV-Breaching the ground
correlate inversely withozone levels overhead.In mid-October, whenthe ozone hole spread
over Ushuaia producinga 60% deficiency (only
]5] m atm cm) on ]7th,the rise in UV-B at both
300 and 305 nm wasdramatic.

20
6. PLAN OF ACTION ON THE OZONE LAYER
The first WMO intergovernmental scientific statement warning of the danger to the ozone layer,distributed in 1975, prepared the ground for legalaction. In 1976, UNEP called for "an examinationof the need and justification for recommending anynational and international controls over the releaseof man-made chemicals". In the same year theUNEP Governing Council authorized convening ameeting of experts designated by governments,intergovernmental and non-governmental organizations (NGOs). WMO joined UNEP in thepreparation and conduct of the meeting, held inWashington, DC, from 1 to 9 March 1977. WMOprovided an 80-page "Survey of the state of knowledge of the ozone layer" with a series of proposalscovering the monitoring of ozone and relevant rarespecies, data analysis, modelling and laboratoryphotochemistry, and UV-B measurements. UNEPlaid the foundation for international action.
The representatives of 32 countries adoptedthe "World Plan of Action on the Ozone Layer".This 21-point research plan covered the monitoring of ozone and solar radiation, the assessmentof the effect of ozone depletion on human health,ecosystems and climate, and the development ofways of assessing the costs and benefits of controlmeasures. WMO took responsibility for the atmospheric research plan. UNEP was given "a broadcoordinating and catalytic role". By adopting theAction Plan, governmental experts accepted thatthere was a potential problem, though its extenthad yet to be determined, and recommendedactions to get to grips with it. In the same spirit,some countries soon took action to control CFCs;the USA, Canada, Norway and Sweden beganphasing out their use in aerosol cans apart fromessential medical and other uses. In 1980 theCommission of European Community agreed notto increase its capacity to produce CFCs 11 and 12
and called for a 30%cut in their use inspray cans by 1982.
To review imple-mentation of the Action YV0Plan, UNEP set up a q!)
Coordinating Committee onthe Ozone Layer. It comprisedrepresentatives of countries with major scientificprogrammes involved in the Action Plan, WMO,the World Health Organization and NGOs. Thecommittee met regularly until the mid-1980s andbecame the focal point for international action.Hypothesis were debated by scientists and challenged by industry until the requirement for controlof CFCs became accepted.
The Vienna ConventionOver the years, continued concern and andincreased scientific information led to growing international acceptance of the need to take action toprotect the ozone layer. In January 1982, UNEPconvened the first meeting of an Ad hoc Group ofLegal and Technical Experts for the Elaborationof a Global Framework Convention for theProtection of the Ozone Layer. WMO facilitatedpreparation of a detailed scientific review of theissue. The meeting identified the framework for aconvention. After three years of extensive negotiations coordinated by UNEP, it was adopted inVienna, March 1985. The 21 articles of theConvention pledge parties to protect human healthand the environment from the effects of ozonedepletion. Two annexes provide for participatingstates to co-operate in atmospheric ozone research,observations, and data and information exchange.In Vienna it was also agreed to work towards thepreparation of concrete measures in the form of aprotocol to the Convention.
Figure 19 - The contributions to the overallchlorine loading of theatmosphere are mostlyanthropogenic (82%)and only 18% fromnatural sources
21
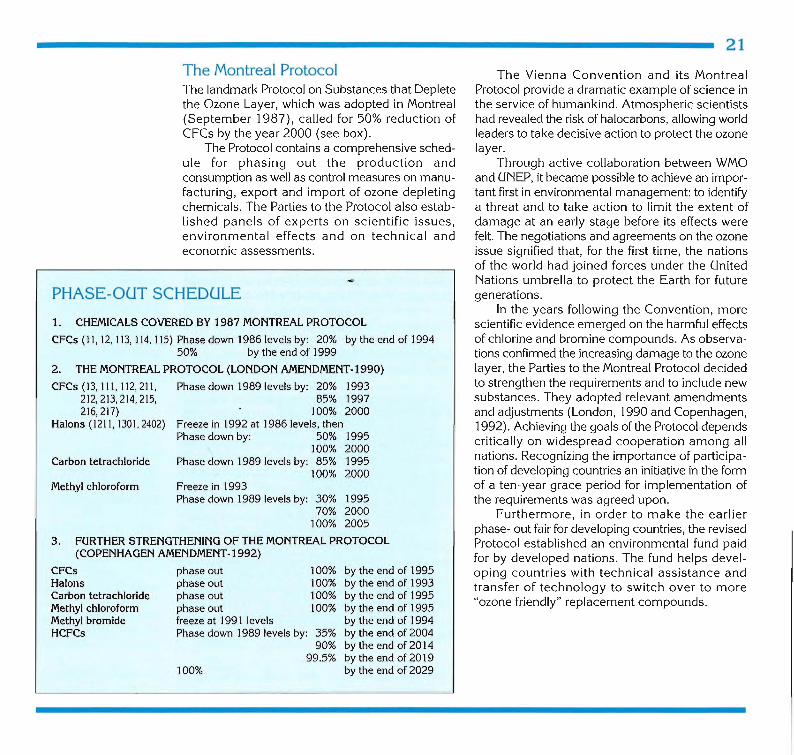
PHASE-OUT SCHEDULE
The Vienna Convention and its MontrealProtocol provide a dramatic example of science inthe service of humankind. Atmospheric scientistshad revealed the risk of halocarbons, allowing worldleaders to take decisive action to protect the ozonelayer.
Through active collaboration between WMOand UNEP, it became possible to achieve an important first in environmental management: to identifya threat and to take action to limit the extent ofdamage at an early stage before its effects werefelt. The negotiations and agreements on the ozoneissue signified that, for the first time, the nationsof the world had joined forces under the UnitedNations umbrella to protect the Earth for futuregenerations.
In the years following the Convention, morescientific evidence emerged on the harmful effectsof chlorine and bromine compounds. As observations confirmed the increasing damage to the ozonelayer, the Parties to the Montreal Protocol decidedto strengthen the requirements and to include newsubstances. They adopted relevant amendmentsand adjustments (London, 1990 and Copenhagen,1992). Achieving the goals of the Protocol dependscritically on widespread cooperation among allnations. Recognizing the importance of participation of developing countries an initiative in the formof a ten-year grace period for implementation ofthe requirements was agreed upon.
Furthermore, in order to make the earlierphase- out fair for developing countries, the revisedProtocol established an environmental fund paidfor by developed nations. The fund helps developing countries with technical assistance andtransfer of technology to switch over to more"ozone friendly" replacement compounds.
by the end of 1995by the end of 1993by the end of 1995by the end of 1995by the end of 1994by the end of 2004by the end of 2014by the end of 2019by the end of 2029
100%100%100%100%
100%
The Montreal ProtocolThe landmark Protocol on Substances that Depletethe Ozone Layer, which was adopted in Montreal(September 1987), called for 50% reduction ofCFCs by the year 2000 (see box).
The Protocol contains a comprehensive schedule for phasing out the production andconsumption as well as control measures on manufacturing, export and import of ozone depletingchemicals. The Parties to the Protocol also established panels of experts on scientific issues,environmental effects and on technical andeconomic assessments.
1. CHEMICALS COVERED BY 1987 MONTREAL PROTOCOL
CFCs (11, 12, 113, 114, 115) Phase down 1986 levels by: 20% by the end of 199450% by the end of 1999
2. THE MONTREAL PROTOCOL (LONDON AMENDMENT-1990)
CFCs (13, 111, 112, 211 , Phase down 1989 levels by: 20% 1993212,213,214,215, 85% 1997216,217) 100% 2000
Halons (1211, 1301,2402) Freeze in 1992 at 1986 levels, thenPhase down by: 50% 1995
100% 2000Carbon tetrachloride Phase down 1989 levels by: 85% 1995
100% 2000Methyl chloroform Freeze in 1993
Phase down 1989 levels by: 30% 199570% 2000
100% 2005
3. FURTHER STRENGTHENING OF THE MONTREAL PROTOCOL(COPENHAGEN AMENDMENT-1992)
CFCs phase outHalons phase outCarbon tetrachloride phase outMethyl chloroform phase outMethyl bromide freeze at 1991 levelsHCFCs Phase down 1989 levels by: 35%
90%99.5%
22
7. THE FUTURE CHLORINE
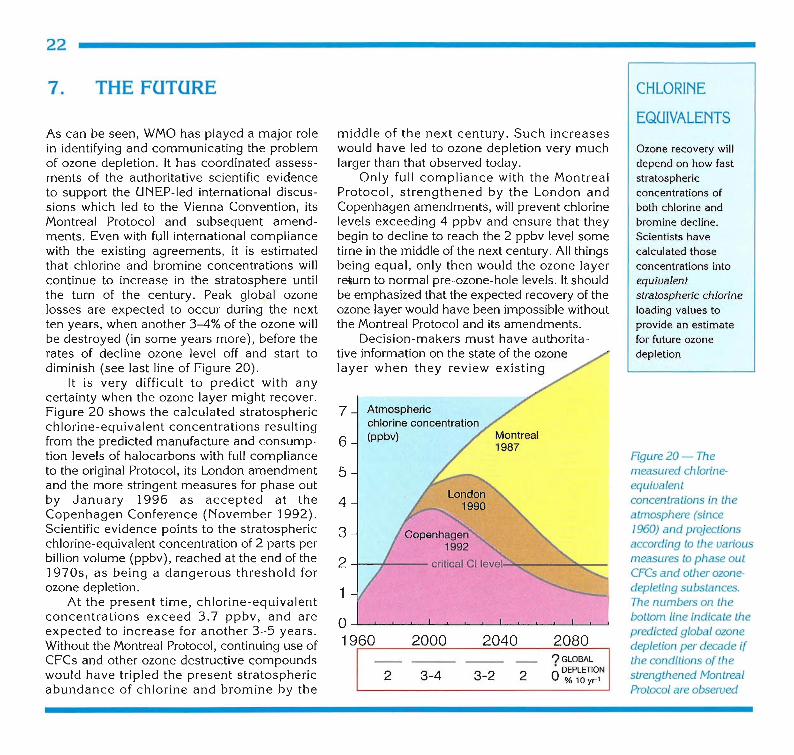
EQUIVALENTSAs can be seen, WMO has played a major rolein identifying and communicating the problemof ozone depletion. It has coordinated assessments of the authoritative scientific evidenceto support the UNEP-led international discussions which led to the Vienna Convention, itsMontreal Protocol and subsequent amendments. Even with full international compliancewith the existing agreements, it is estimatedthat chlorine and bromine concentrations willcontinue to increase in the stratosphere untilthe turn of the century. Peak global ozonelosses are expected to occur during the nextten years, when another 3-4% of the ozone willbe destroyed (in some years more), before therates of decline ozone level off and start todiminish (see last line of Figure 20).
It is very difficult to predict with anycertainty when the ozone layer might recover.Figure 20 shows the calculated stratosphericchlorine-equivalent concentrations resultingfrom the predicted manufacture and consumption levels of halocarbons with full complianceto the original Protocol, its London amendmentand the more stringent measures for phase outby January 1996 as accepted at theCopenhagen Conference (November 1992).Scientific evidence points to the stratosphericchlorine-equivalent concentration of 2 parts perbillion volume (ppbv), reached at the end of the1970s, as being a dangerous threshold forozone depletion.
At the present time, chlorine-equivalentconcentrations exceed 3.7 ppbv, and areexpected to increase for another 3-5 years.Without the Montreal Protocol, continuing use ofCFCs and other ozone destructive compoundswould have tripled the present stratosphericabundance of chlorine and bromine by the
middle of the next century. Such increaseswould have led to ozone depletion very muchlarger than that observed today.
Only full compliance with the MontrealProtocol, strengthened by the London andCopenhagen amendments, will prevent chlorinelevels exceeding 4 ppbv and ensure that theybegin to decline to reach the 2 ppbv level sometime in the middle of the next century. All thingsbeing equal, only then would the ozone layerr~rn to normal pre-ozone-hole levels. It shouldbe emphasized that the expected recovery of theozone layer would have been impossible withoutthe Montreal Protocol and its amendments.
Decision-makers must have authoritative information on the state of the ozonelayer when they review existing
7 Atmosphericchlorine concentration
6 (ppbv)
5
4
3
2+-~--
1
01960 2000 2040 2080
?GLOBAL
2 3-4 3-2 2 6DEPLETION% 10yr1
Ozone recovery willdepend on how fast
stratosphericconcentrations of
both chlorine and
bromine decline.
Scientists have
calculated those
concentrations into
equivalentstratospheric chlorineloading values toprovide an estimate
for future ozonedepletion
Figure 20 - Themeasured chlorineequivalentconcentrations in theatmosphere (since]960) and projectionsaccording to the variousmeasures to phase outCFCs and other ozonedepleting substances.The numbers on thebottom line indicate thepredicted global ozonedepletion per decade ifthe condilions of thestrengthened MontrealProtocol are observed
international agreements. To provide this information, the G030S must be maintained andimproved well into the next century. As mustthe entire Global Atmosphere Watch (GAW)that monitors other chemical constituents of theatmosphere, from both ground and space. Onlythe common efforts of national MeteorologicalServices and environmental authorities, encouraged and coordinated by WMO and UNEP, canprovide scientists with the necessary data. Thenthey can make more accurate assessments andpredictions needed by governments to protectthe global environment for future generations.
As UNEP is called upon to coordinateenvironmental protection trE!'aties, so WMO isbeing called upon to meet increasing obligations regarding the monitoring and study ofozone and other atmospheric pollutants. Tomeet these challenges, WMO and UNEP willhave to collaborate even more closely with oneanother and with their Members and other international and national institutions. Through suchcollaboration it will be possible for WMO andUNEP to fulfil their responsibilities and providethe basis for concentrated international action tosafeguard the atmosphere. By assessing andpredicting the extent of harmful human influences, they will be able to issue warnings ofdanger. As mentioned in the Foreword, a spiritof cooperation among scientists, governmentsand industry has been evident in negotiations toprotect the ozone layer. On the occasion of its50th Anniversary, and in the decades to follow,the United Nations can be proud of this achievement which will help ensure a prosperous andsustainable planet for the peoples of the world.
23
METHYL BROMIDE
Another widely-used chemical which poses athreat to the ozone layer is methyl bromideCH3Br. This can release bromine, which is 30 to60 times as destructive to ozone as is chlorine.
Methyl Bromide is used as a fumigant forsoils and commodities, including the quarantinetreatment of some products for internationaltrade, and as a transport fuel additive. Totalannual anthropogenic release is now estimatedto be more than double the 40 000 tonnesreleased annually in the early 1980s. In addition,natural sources such,as burning biomasscontribute a further 30 000 to 50 000 tonnes ayear. More than half of all the CH3Br producedis released into the atmosphere, where concentrations are <!urrently between 8 and 15 partsper thousand. million by volume. No single alternative chemical is at present available toreplace all methyl bromide applications.

24
OZONE ISSUES AT A GLANCE - 1995
• Ozone decreases continue in all latitudes, except over the
equatorial belt (20°S-200N); the ozone decline during winter
spring in the last 25 years is twice as strong as during the
summer season, both being statistically significant;
• The global average ozone decline during the last 15 years is
estimated at about 5%; however, the overall ozone loss in the
extratropics for the same time was between 6.5% in the northern
and 9.5% in the southern hemisphere; the downward trend during
the 1980s and 1990s was significantly larger than during the
1970s;
• The main ozone decline observed in the vertical plane is in
the lower stratosphere (below 23 km) -10% per decade;
• The change in skin-reddening ultraviolet radiation at ground
level resulting from changes in column ozone has been observed
and quantified for cloudless days as increasing by about 1.3% for
each per cent of total ozon~ decline;
• The Antarctic-spring ozone hole in 1994 was as deep and
extensive in the area covered as were the extremes so far
observed in 1992 and 1993. At the end of September and early
October the ozone loss over Antarctica was about 60% of the
pre-ozone-hole averages and during a few days reached 70%;
• Evidence suggests that the cause for the Antarctic-spring
ozone hole is primarily heterogeneous processes on the surfaces
of polar stratospheric clouds and sulphate aerosols involving
man-made chlorine and bromine;
• Greater ozone losses at polar and mid-latitudes are expected
as long as the atmospheric levels of chlorine and bromine
compounds continue to increase. The concentrations of these
compounds is expected to start declining about the turn of the,
century providing all countries strictly adhere to the requirements
of the strengthened Montreal Protocol;
l
• A frequent meridional exchange of air in the lowerstratosphere of the northern hemisphere precludes the possibilityof an isolated circumpolar vortex with extremely lowstratospheric temperatures as occurs over the Antarctic. Theavailable observations do not indicate an extensive ozonereduction like the Antarctic "ozone hole", althoughanalogous disturbed atmospheric chemistry was found in 1989,and very high CIO concentrations were confirmed during the1991-1992 and the following Arctic winters. These make itincreasingly likely that substantial Arctic ozone losses mayoccur, for short times, during particularly cold stratosphericoutbreaks in sun-lit upper-middle latitudes as in some of theepisodes with extremely low ozone (over 20% deficiency)observed in 1992, 1993 and early 1995;• It is necessary to reduce further stratospheric halogenabundances in order to bring chlorine loading back to 2 ppbv (theabundance in the late 1970s, which is when the Antarctic ozonehole-type of destruction started and when the accelerated trendsin total-column ozone losses in the northern hemisphere began).Full compliance with a strengthened Montreal Protocol by allnations would allow chlorine levels to return to <2 ppbv by2060-2070;• Anything other than modest substitution of HCFCs forCFCs could both increase the peak chlorine loading and sustainfor decades unprecedented levels of stratospheric chlorine(currently phase down by 90% by 2015 was agreed inCopenhagen, 1992);• Although there is some decline in the growth rates of severalmajor ozone-depleting substances, demonstrating the expectedimpact of the strengthened Montreal Protocol, the continuous useof methyl bromide is being viewed as a significant supplement tothe ozone-depleting compounds;• The observed lower-stratospheric ozone depletions havebeen used to calculate the changes in the radiative balanceof the atmosphere and indfeate that, over the last 25 years, they
have tended to cool the lower stratosphere at middle and highlatitudes by close to 1°C with possible effects on the surfacetroposphere system which could be answered only afterinteractive chemical and dynamic calculations for the entireatmosphere;• Model simulations and limited observations suggest thattropospheric ozone has increased in the northern middle latitudessince pre-industrial times. Such changes would augment by about20% the radiative forcing from all other greenhouse gases overthe same time span;• The ozone levels in the troposphere up to 10-12 km above thefew existing balloonsonde stations at northern middle latitudes haveincreased by about 10% per decade from the mid 1960s until theend of the 1980s. Although the database is sparse, some preliminary studies project a significant positive contribution to the globalsurface warming close to that of the other greenhouse gases;• Present models containing only gas-phase chemistrycannot simulate the observed ozone depletion at middle andhigh latitudes, however, if heterogeneous processes on sulphateaerosols are incorporated, the predicted ozone depletion willincrease but still will not explain the entire middle latitudedecline;• It is apparent that strong volcanic eruptions able to inject alarge amount of volcanic-sulphate aerosol in the lowerstratosphere facilitate the occurrence of heterogeneous processeson sulphate aerosols causing some additional ozone destructionwithin the aerosol layer lasting usually a year after the eruption;• A previous assessment of the impact of a projected largefleet of supersonic aircraft on stratospheric ozone estimated thatthe ozone loss increases with the amount of nitrogen oxidesemitted. However, recent studies have shown that reactions onsulphate aerosols can change the partitioning of nitrogen oxidesand thus reduce the intensity of ozone depletion. Nitrogen oxideemissions from aircraft in the 8-11 km corridor could enhance thetropospheric ozone.

o 3m atm-cm
1945 1995