(PDF) Demand forecasting process evaluation: Multiple cases ...
14
Vol. 8(12), pp. 460-473, 28 June, 2014 DOI: 10.5897/AJBM2014.7412 Article Number: CF3506845559 ISSN 1993-8233 Copyright © 2014 Author(s) retain the copyright of this article http://www.academicjournals.org/AJBM African Journal of Business Management Full Length Research Paper Demand forecasting process evaluation: Multiple cases studies at 15 companies in Brazil Ana Julia Dal Forno*, Priscila Buss da Silva, Rodrigo Gabriel de Miranda, Antonio Cezar Bornia and Fernando Antonio Forcellini Department of Production Engineering, Santa Catarina Federal University, Florianópolis/SC, Country: Brazil. Received 26 August, 2013; Accepted 2 June, 2014 The purpose of this article is to evaluate what practices of the demand forecasting process are adopted by companies. The methodology used was multiple case studies. The identification of the practices was conducted by sending a questionnaire with 20 questions to 15 large companies in southern Brazil. The practices were divided into four dimensions of the analysis: functional integration, application, systems and forecasting errors. The results demonstrate that of the 20 practices analyzed, only 35% of them had a satisfactory performance. Because it is a diagnostics tool, the managers can constantly verify the strong points and opportunities for improvement referring to the demand forecasting process. The method allows measuring the four dimensions in a simple manner; evaluating if the demand forecast is conducted with computers; if the administration of the process is conducted in a collaborative manner; if different company areas defined the forecast in conjunction; if the concerns of each department are considered; if awards are granted in the forecasting process; if the forecast is used in a strategic manner by the company, as in the definition of goals; if priorities are established by product for realizing more precise forecasts; the qualitative and quantitative techniques used; if there is training for the staff involved in the forecasting; if there is a connection with the company’s other information systems; if the forecasts are publicized within the company; if the error is evaluated and if there are problems caused by forecasting errors and other factors. Key words: Brazilian companies, demand forecasting, practices, multiple case studies. INTRODUCTION Forecasting demand is of fundamental importance to the competitiveness of a productive system. Answering questions such as “how much,” “when” and “what” to produce or buy, guides professionals from various segments to improve their forecasting techniques and allows organizations to anticipate their positions to protect themselves from future events (Barbosa and Chaves, 2012). Tubino (2009) emphasizes that demand forecasting is the basis for strategic planning of production, sales and finances at any company. Strategic planning uses the forecasted demand to define a company’s market position, determine what equipment to invest in, what labor to seek and other factors. Generally, the sales or marketing department is responsible for conducting a forecast, although it is being extended to Planning and Production Control (PPC). This study will also examine if companies have a specific sector responsible for forecasting and how different areas are *Corresponding author. E-mail: [email protected] Authors agree that this article remain permanently open access under the terms of the Creative Commons Attribution License 4.0 International License
-
Upload
khangminh22 -
Category
Documents
-
view
0 -
download
0
Transcript of (PDF) Demand forecasting process evaluation: Multiple cases ...
Vol. 8(12), pp. 460-473, 28 June, 2014 DOI: 10.5897/AJBM2014.7412 Article Number: CF3506845559 ISSN 1993-8233 Copyright © 2014 Author(s) retain the copyright of this article http://www.academicjournals.org/AJBM
African Journal of Business Management
Full Length Research Paper
Demand forecasting process evaluation: Multiple cases studies at 15 companies in Brazil
Ana Julia Dal Forno*, Priscila Buss da Silva, Rodrigo Gabriel de Miranda, Antonio Cezar
Bornia and Fernando Antonio Forcellini
Department of Production Engineering, Santa Catarina Federal University, Florianópolis/SC, Country: Brazil.
Received 26 August, 2013; Accepted 2 June, 2014
The purpose of this article is to evaluate what practices of the demand forecasting process are adopted by companies. The methodology used was multiple case studies. The identification of the practices was conducted by sending a questionnaire with 20 questions to 15 large companies in southern Brazil. The practices were divided into four dimensions of the analysis: functional integration, application, systems and forecasting errors. The results demonstrate that of the 20 practices analyzed, only 35% of them had a satisfactory performance. Because it is a diagnostics tool, the managers can constantly verify the strong points and opportunities for improvement referring to the demand forecasting process. The method allows measuring the four dimensions in a simple manner; evaluating if the demand forecast is conducted with computers; if the administration of the process is conducted in a collaborative manner; if different company areas defined the forecast in conjunction; if the concerns of each department are considered; if awards are granted in the forecasting process; if the forecast is used in a strategic manner by the company, as in the definition of goals; if priorities are established by product for realizing more precise forecasts; the qualitative and quantitative techniques used; if there is training for the staff involved in the forecasting; if there is a connection with the company’s other information systems; if the forecasts are publicized within the company; if the error is evaluated and if there are problems caused by forecasting errors and other factors. Key words: Brazilian companies, demand forecasting, practices, multiple case studies.
INTRODUCTION Forecasting demand is of fundamental importance to the competitiveness of a productive system. Answering questions such as “how much,” “when” and “what” to produce or buy, guides professionals from various segments to improve their forecasting techniques and allows organizations to anticipate their positions to protect themselves from future events (Barbosa and Chaves, 2012). Tubino (2009) emphasizes that demand forecasting is the basis for strategic planning of
production, sales and finances at any company. Strategic planning uses the forecasted demand to define a company’s market position, determine what equipment to invest in, what labor to seek and other factors. Generally, the sales or marketing department is responsible for conducting a forecast, although it is being extended to Planning and Production Control (PPC). This study will also examine if companies have a specific sector responsible for forecasting and how different areas are
*Corresponding author. E-mail: [email protected] Authors agree that this article remain permanently open access under the terms of the Creative Commons Attribution License 4.0 International License
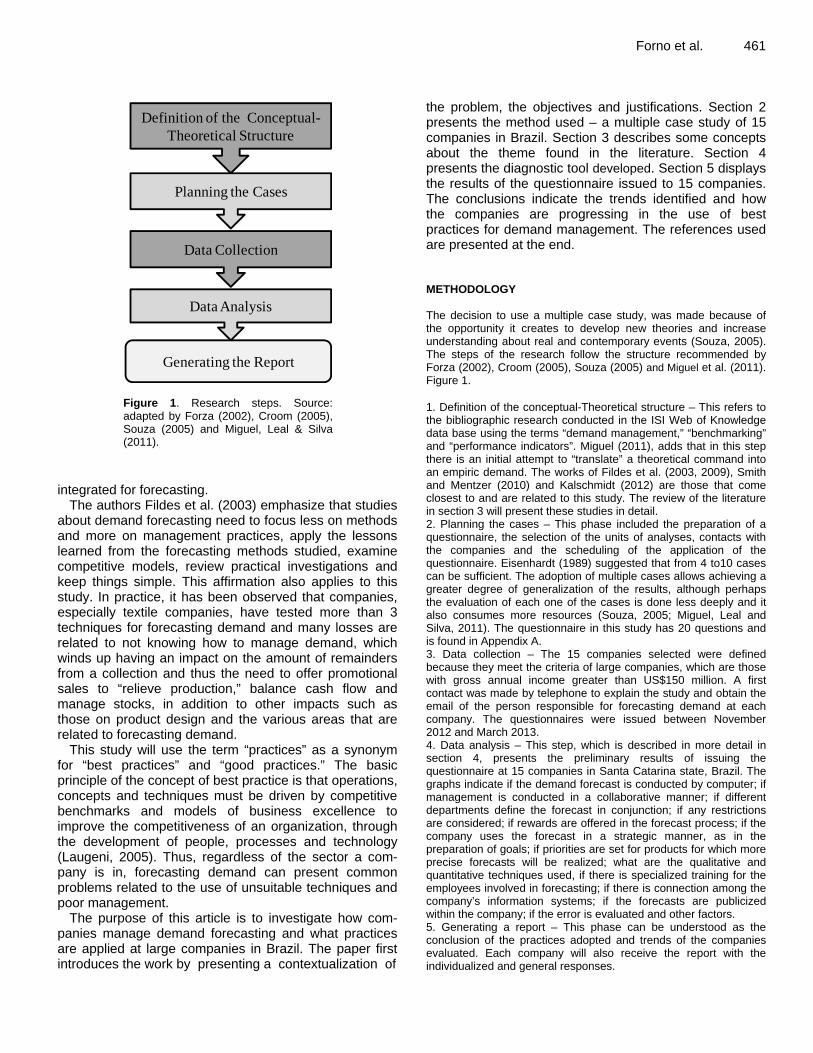
Figure 1. Research steps. Source: adapted by Forza (2002), Croom (2005), Souza (2005) and Miguel, Leal & Silva (2011).
integrated for forecasting.
The authors Fildes et al. (2003) emphasize that studies about demand forecasting need to focus less on methods and more on management practices, apply the lessons learned from the forecasting methods studied, examine competitive models, review practical investigations and keep things simple. This affirmation also applies to this study. In practice, it has been observed that companies, especially textile companies, have tested more than 3 techniques for forecasting demand and many losses are related to not knowing how to manage demand, which winds up having an impact on the amount of remainders from a collection and thus the need to offer promotional sales to “relieve production,” balance cash flow and manage stocks, in addition to other impacts such as those on product design and the various areas that are related to forecasting demand.
This study will use the term “practices” as a synonym for “best practices” and “good practices.” The basic principle of the concept of best practice is that operations, concepts and techniques must be driven by competitive benchmarks and models of business excellence to improve the competitiveness of an organization, through the development of people, processes and technology (Laugeni, 2005). Thus, regardless of the sector a com-pany is in, forecasting demand can present common problems related to the use of unsuitable techniques and poor management.
The purpose of this article is to investigate how com-panies manage demand forecasting and what practices are applied at large companies in Brazil. The paper first introduces the work by presenting a contextualization of
Forno et al. 461 the problem, the objectives and justifications. Section 2 presents the method used – a multiple case study of 15 companies in Brazil. Section 3 describes some concepts about the theme found in the literature. Section 4 presents the diagnostic tool developed. Section 5 displays the results of the questionnaire issued to 15 companies. The conclusions indicate the trends identified and how the companies are progressing in the use of best practices for demand management. The references used are presented at the end. METHODOLOGY The decision to use a multiple case study, was made because of the opportunity it creates to develop new theories and increase understanding about real and contemporary events (Souza, 2005). The steps of the research follow the structure recommended by Forza (2002), Croom (2005), Souza (2005) and Miguel et al. (2011). Figure 1. 1. Definition of the conceptual-Theoretical structure – This refers to the bibliographic research conducted in the ISI Web of Knowledge data base using the terms “demand management,” “benchmarking” and “performance indicators”. Miguel (2011), adds that in this step there is an initial attempt to “translate” a theoretical command into an empiric demand. The works of Fildes et al. (2003, 2009), Smith and Mentzer (2010) and Kalschmidt (2012) are those that come closest to and are related to this study. The review of the literature in section 3 will present these studies in detail. 2. Planning the cases – This phase included the preparation of a questionnaire, the selection of the units of analyses, contacts with the companies and the scheduling of the application of the questionnaire. Eisenhardt (1989) suggested that from 4 to10 cases can be sufficient. The adoption of multiple cases allows achieving a greater degree of generalization of the results, although perhaps the evaluation of each one of the cases is done less deeply and it also consumes more resources (Souza, 2005; Miguel, Leal and Silva, 2011). The questionnaire in this study has 20 questions and is found in Appendix A. 3. Data collection – The 15 companies selected were defined because they meet the criteria of large companies, which are those with gross annual income greater than US$150 million. A first contact was made by telephone to explain the study and obtain the email of the person responsible for forecasting demand at each company. The questionnaires were issued between November 2012 and March 2013. 4. Data analysis – This step, which is described in more detail in section 4, presents the preliminary results of issuing the questionnaire at 15 companies in Santa Catarina state, Brazil. The graphs indicate if the demand forecast is conducted by computer; if management is conducted in a collaborative manner; if different departments define the forecast in conjunction; if any restrictions are considered; if rewards are offered in the forecast process; if the company uses the forecast in a strategic manner, as in the preparation of goals; if priorities are set for products for which more precise forecasts will be realized; what are the qualitative and quantitative techniques used, if there is specialized training for the employees involved in forecasting; if there is connection among the company’s information systems; if the forecasts are publicized within the company; if the error is evaluated and other factors. 5. Generating a report – This phase can be understood as the conclusion of the practices adopted and trends of the companies evaluated. Each company will also receive the report with the individualized and general responses.
Definition of the Conceptual-Theoretical Structure
Planning the Cases
Data Collection
Data Analysis
Generating the Report
462 Afr. J. Bus. Manage.
Figure 2. Quantity of articles referring to demand forecasting
REVIEW OF THE LITERATURE ABOUT DEMAND FORECASTING According to Fildes et al. (2003), there are three main problems in developing valid models to explain the practice of forecasting. The first is the lack of proper training of the researchers, who are highly concerned with the techniques, but do not give proper attention to the integration of information in the forecasting process. The second is related to the data, where two problems are observed: the indicators and the access. Companies are hesitant to provide the necessary information and maintain a very traditional system of performance evaluation, the research can thus become difficult and expensive at many organizations. Finally, the lack of incentives, where the researcher proposes new techniques and methods that need to become public in the academic environment, however, this is not always possible because at times companies do not allow the conclusion of the studies or omit information.
The authors Fildes et al. (2003), attribute a lack of commitment to the forecasting process to a lack of an organizational structure. Some companies believe that the consequences of incorrect forecasts present limitations for their branches of their business. In this study, the section on Functional Integration will examine these questions. There are gaps concerning the understanding of behavioral factors that are associated to the management of demand at corporations. Questioning exists about if forecasting should be conducted by a separate functional department or area and what standards should be applied. In any case, it is important to have a multidisciplinary approach (Fildes et al., 2003).
In 2003, the authors Fildes et al. (2003), noted that there had been few studies about the practice of forecasting, and most of them were surveys and case studies. According to Smith and Mentzer (2010), few studies have presented a theoretical basis to explain how factors and relationships can influence the application and development of forecasts. The structures proposed have considered the influence of the market on the environment, organization, support to management and information systems involved in the performance of demand. Forecasting has been treated as a separate department or an individual unit of analysis. There is a lack of models that have been tested in practice. Figure 2 shows a bibliometric study conducted in the Isi Web of Knowledge and Emerald Insight databases, highlighting that the theme “demand forecast” is prevalent. In the Emerald database,
using only the year filter (2007 to 2012), a total of 174 journal articles about the theme were identified. On the ISI database, beyond the year filter, the search was conducted in the fields of Operations Research Management Science, Management, Engineering Industrial, Engineering Manufacturing, Economics, Business, Planning Development, which resulted in 259 articles.
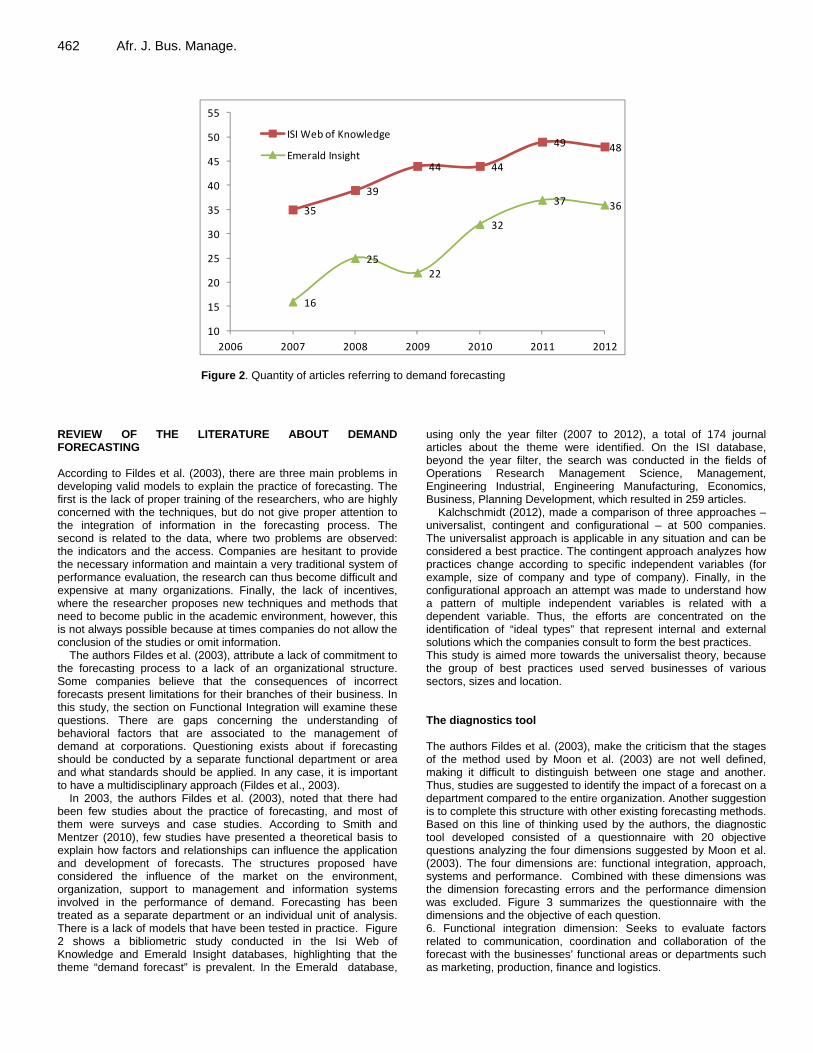
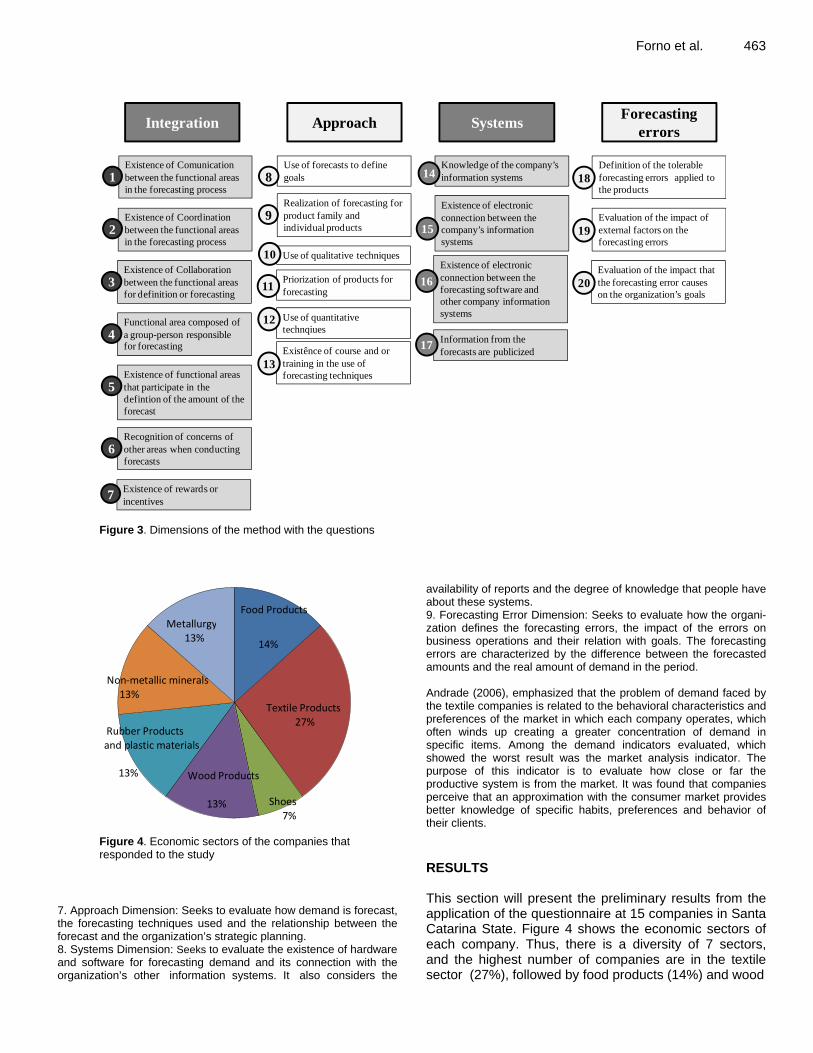
Kalchschmidt (2012), made a comparison of three approaches –universalist, contingent and configurational – at 500 companies. The universalist approach is applicable in any situation and can be considered a best practice. The contingent approach analyzes how practices change according to specific independent variables (for example, size of company and type of company). Finally, in the configurational approach an attempt was made to understand how a pattern of multiple independent variables is related with a dependent variable. Thus, the efforts are concentrated on the identification of “ideal types” that represent internal and external solutions which the companies consult to form the best practices. This study is aimed more towards the universalist theory, because the group of best practices used served businesses of various sectors, sizes and location. The diagnostics tool The authors Fildes et al. (2003), make the criticism that the stages of the method used by Moon et al. (2003) are not well defined, making it difficult to distinguish between one stage and another. Thus, studies are suggested to identify the impact of a forecast on a department compared to the entire organization. Another suggestion is to complete this structure with other existing forecasting methods. Based on this line of thinking used by the authors, the diagnostic tool developed consisted of a questionnaire with 20 objective questions analyzing the four dimensions suggested by Moon et al. (2003). The four dimensions are: functional integration, approach, systems and performance. Combined with these dimensions was the dimension forecasting errors and the performance dimension was excluded. Figure 3 summarizes the questionnaire with the dimensions and the objective of each question. 6. Functional integration dimension: Seeks to evaluate factors related to communication, coordination and collaboration of the forecast with the businesses’ functional areas or departments such as marketing, production, finance and logistics.
35
39
44 44
49 48
16
25
22
32
37 36
10
15
20
25
30
35
40
45
50
55
2006 2007 2008 2009 2010 2011 2012
ISI Web of Knowledge
Emerald Insight
Forno et al. 463
Figure 3. Dimensions of the method with the questions
Figure 4. Economic sectors of the companies that responded to the study
7. Approach Dimension: Seeks to evaluate how demand is forecast, the forecasting techniques used and the relationship between the forecast and the organization’s strategic planning. 8. Systems Dimension: Seeks to evaluate the existence of hardware and software for forecasting demand and its connection with the organization’s other information systems. It also considers the
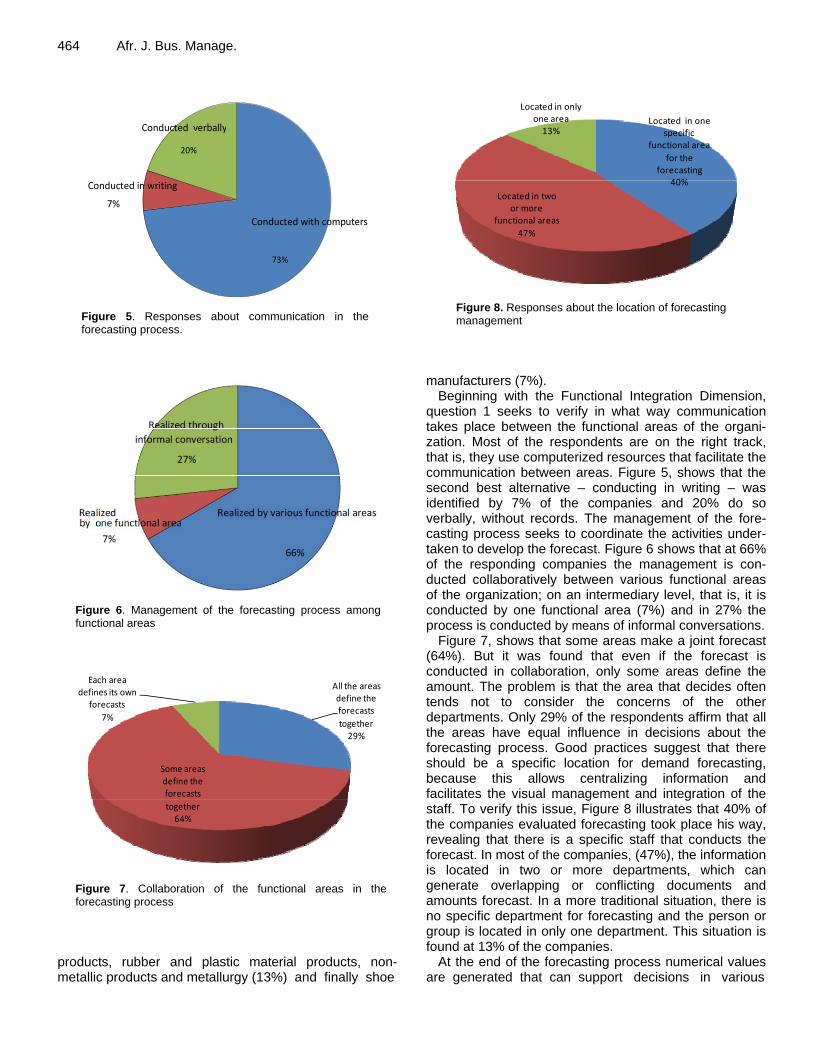
availability of reports and the degree of knowledge that people have about these systems. 9. Forecasting Error Dimension: Seeks to evaluate how the organi-zation defines the forecasting errors, the impact of the errors on business operations and their relation with goals. The forecasting errors are characterized by the difference between the forecasted amounts and the real amount of demand in the period. Andrade (2006), emphasized that the problem of demand faced by the textile companies is related to the behavioral characteristics and preferences of the market in which each company operates, which often winds up creating a greater concentration of demand in specific items. Among the demand indicators evaluated, which showed the worst result was the market analysis indicator. The purpose of this indicator is to evaluate how close or far the productive system is from the market. It was found that companies perceive that an approximation with the consumer market provides better knowledge of specific habits, preferences and behavior of their clients. RESULTS This section will present the preliminary results from the application of the questionnaire at 15 companies in Santa Catarina State. Figure 4 shows the economic sectors of each company. Thus, there is a diversity of 7 sectors, and the highest number of companies are in the textile sector (27%), followed by food products (14%) and wood
Integration Approach
Forecasting errors
Systems
Existence of Comunication between the functional areas in the forecasting process
1
Existence of Coordination between the functional areas in the forecasting process
2
Recognition of concerns of other areas when conductingforecasts
6
Existence of functional areas that participate in the defintion of the amount of the forecast
5
Functional area composed of a group-person responsible for forecasting
4
Existence of Collaboration between the functional areas for definition or forecasting
3
Existence of rewards or incentives
7
Use of forecasts to define goals8
Realization of forecasting for product family and individual products
9
Existênce of course and or training in the use of forecasting techniques
Use of quantitative technqiues
Priorization of products for forecasting
Use of qualitative techniques10
Knowledge of the company’s information systems
Existence of electronic connection between the company’s information systems
Information from the forecasts are publicized
Existence of electronic connection between the forecasting software and other company information systems
Definition of the tolerable forecasting errors applied to the products
Evaluation of the impact of external factors on the forecasting errors
Evaluation of the impact that the forecasting error causes on the organization’s goals
11
14
13
12
16
15
17
18
20
19
14%
Textile Products27%
Shoes7%
Wood Products
13%
Rubber Productsand plastic materials
13%
Non‐metallic minerals13%
Metallurgy13%
Food Products
464 Afr. J. Bus. Manage.
Figure 5. Responses about communication in the forecasting process.
Figure 6. Management of the forecasting process among functional areas
Figure 7. Collaboration of the functional areas in the forecasting process
products, rubber and plastic material products, non- metallic products and metallurgy (13%) and finally shoe
Figure 8. Responses about the location of forecasting management
manufacturers (7%).
Beginning with the Functional Integration Dimension, question 1 seeks to verify in what way communication takes place between the functional areas of the organi-zation. Most of the respondents are on the right track, that is, they use computerized resources that facilitate the communication between areas. Figure 5, shows that the second best alternative – conducting in writing – was identified by 7% of the companies and 20% do so verbally, without records. The management of the fore-casting process seeks to coordinate the activities under-taken to develop the forecast. Figure 6 shows that at 66% of the responding companies the management is con-ducted collaboratively between various functional areas of the organization; on an intermediary level, that is, it is conducted by one functional area (7%) and in 27% the process is conducted by means of informal conversations.
Figure 7, shows that some areas make a joint forecast (64%). But it was found that even if the forecast is conducted in collaboration, only some areas define the amount. The problem is that the area that decides often tends not to consider the concerns of the other departments. Only 29% of the respondents affirm that all the areas have equal influence in decisions about the forecasting process. Good practices suggest that there should be a specific location for demand forecasting, because this allows centralizing information and facilitates the visual management and integration of the staff. To verify this issue, Figure 8 illustrates that 40% of the companies evaluated forecasting took place his way, revealing that there is a specific staff that conducts the forecast. In most of the companies, (47%), the information is located in two or more departments, which can generate overlapping or conflicting documents and amounts forecast. In a more traditional situation, there is no specific department for forecasting and the person or group is located in only one department. This situation is found at 13% of the companies.
At the end of the forecasting process numerical values are generated that can support decisions in various
Conducted with computers
73%
Conducted in writing
7%
Conducted verbally
20%
All the areas define the forecasts
together29%
Some areas define the forecasts
together64%
Each area defines its own
forecasts
7%
Located in one specific
functional area
for the forecasting
40%
Located in two or more
functional areas
47%
Located in only one area13%
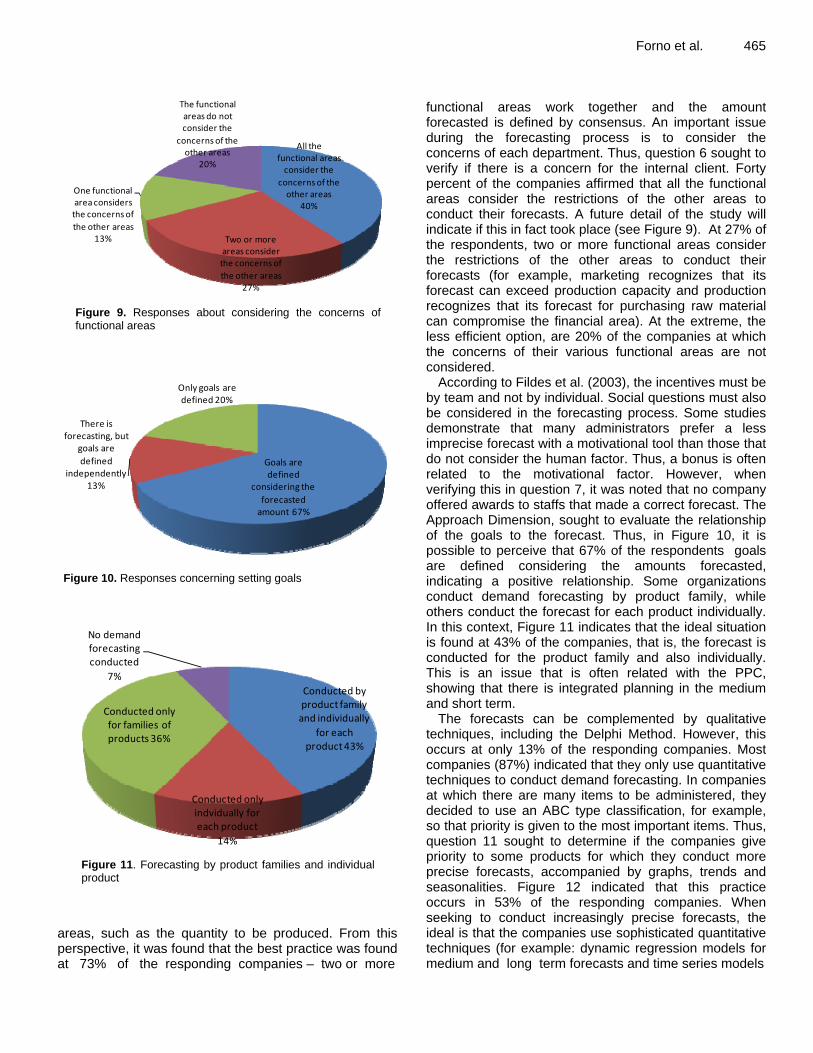
Figure 9. Responses about considering the concerns of functional areas
Figure 10. Responses concerning setting goals
Figure 11. Forecasting by product families and individual product
areas, such as the quantity to be produced. From this perspective, it was found that the best practice was found at 73% of the responding companies – two or more
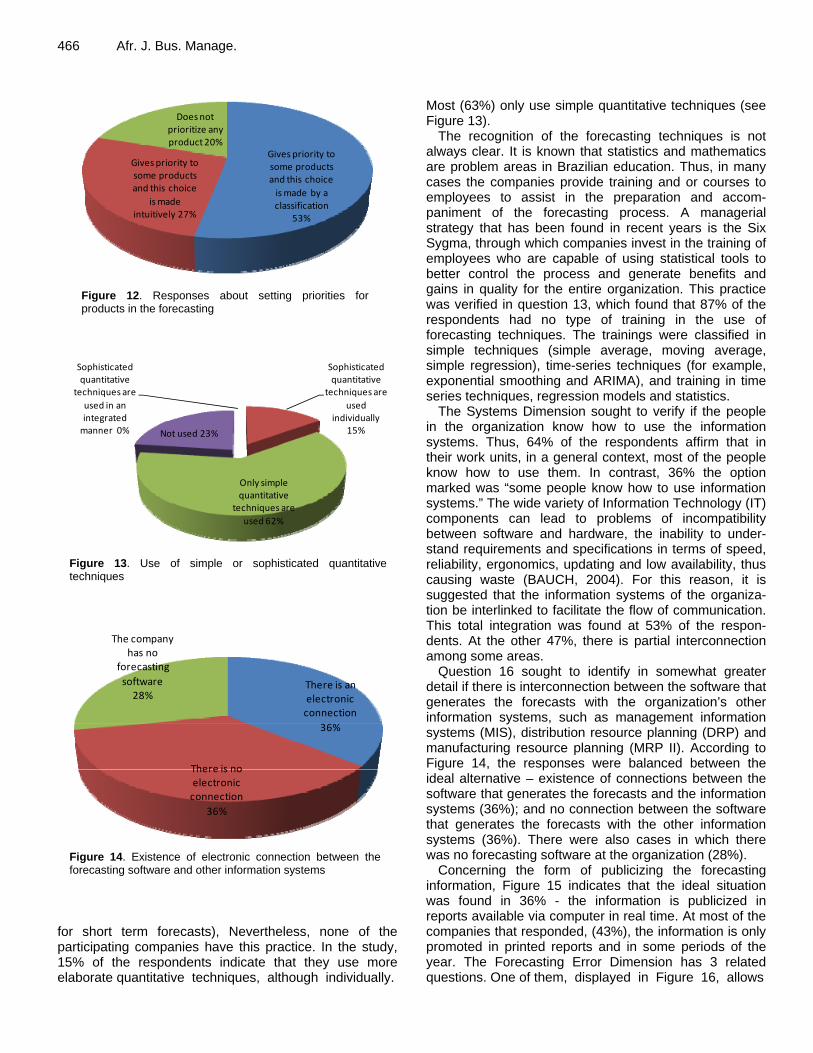
Forno et al. 465 functional areas work together and the amount forecasted is defined by consensus. An important issue during the forecasting process is to consider the concerns of each department. Thus, question 6 sought to verify if there is a concern for the internal client. Forty percent of the companies affirmed that all the functional areas consider the restrictions of the other areas to conduct their forecasts. A future detail of the study will indicate if this in fact took place (see Figure 9). At 27% of the respondents, two or more functional areas consider the restrictions of the other areas to conduct their forecasts (for example, marketing recognizes that its forecast can exceed production capacity and production recognizes that its forecast for purchasing raw material can compromise the financial area). At the extreme, the less efficient option, are 20% of the companies at which the concerns of their various functional areas are not considered.
According to Fildes et al. (2003), the incentives must be by team and not by individual. Social questions must also be considered in the forecasting process. Some studies demonstrate that many administrators prefer a less imprecise forecast with a motivational tool than those that do not consider the human factor. Thus, a bonus is often related to the motivational factor. However, when verifying this in question 7, it was noted that no company offered awards to staffs that made a correct forecast. The Approach Dimension, sought to evaluate the relationship of the goals to the forecast. Thus, in Figure 10, it is possible to perceive that 67% of the respondents goals are defined considering the amounts forecasted, indicating a positive relationship. Some organizations conduct demand forecasting by product family, while others conduct the forecast for each product individually. In this context, Figure 11 indicates that the ideal situation is found at 43% of the companies, that is, the forecast is conducted for the product family and also individually. This is an issue that is often related with the PPC, showing that there is integrated planning in the medium and short term.
The forecasts can be complemented by qualitative techniques, including the Delphi Method. However, this occurs at only 13% of the responding companies. Most companies (87%) indicated that they only use quantitative techniques to conduct demand forecasting. In companies at which there are many items to be administered, they decided to use an ABC type classification, for example, so that priority is given to the most important items. Thus, question 11 sought to determine if the companies give priority to some products for which they conduct more precise forecasts, accompanied by graphs, trends and seasonalities. Figure 12 indicated that this practice occurs in 53% of the responding companies. When seeking to conduct increasingly precise forecasts, the ideal is that the companies use sophisticated quantitative techniques (for example: dynamic regression models for medium and long term forecasts and time series models
All the functional areas consider the
concerns of the other areas
40%
Two or more areas consider the concerns of
the other areas27%
One functional area considers the concerns of
the other areas13%
The functional areas do not consider the
concerns of the other areas
20%
Goals are defined
considering the
forecasted amount 67%
There is forecasting, but
goals are
defined independently
13%
Only goals are defined 20%
Conducted by product family and individually
for each product 43%
Conducted only indvidually for each product
14%
Conducted only for families of products 36%
No demand forecasting conducted
7%
466 Afr. J. Bus. Manage.
Figure 12. Responses about setting priorities for products in the forecasting
Figure 13. Use of simple or sophisticated quantitative techniques
Figure 14. Existence of electronic connection between the forecasting software and other information systems
for short term forecasts), Nevertheless, none of the participating companies have this practice. In the study, 15% of the respondents indicate that they use more elaborate quantitative techniques, although individually.
Most (63%) only use simple quantitative techniques (see Figure 13).
The recognition of the forecasting techniques is not always clear. It is known that statistics and mathematics are problem areas in Brazilian education. Thus, in many cases the companies provide training and or courses to employees to assist in the preparation and accom-paniment of the forecasting process. A managerial strategy that has been found in recent years is the Six Sygma, through which companies invest in the training of employees who are capable of using statistical tools to better control the process and generate benefits and gains in quality for the entire organization. This practice was verified in question 13, which found that 87% of the respondents had no type of training in the use of forecasting techniques. The trainings were classified in simple techniques (simple average, moving average, simple regression), time-series techniques (for example, exponential smoothing and ARIMA), and training in time series techniques, regression models and statistics.
The Systems Dimension sought to verify if the people in the organization know how to use the information systems. Thus, 64% of the respondents affirm that in their work units, in a general context, most of the people know how to use them. In contrast, 36% the option marked was “some people know how to use information systems.” The wide variety of Information Technology (IT) components can lead to problems of incompatibility between software and hardware, the inability to under-stand requirements and specifications in terms of speed, reliability, ergonomics, updating and low availability, thus causing waste (BAUCH, 2004). For this reason, it is suggested that the information systems of the organiza-tion be interlinked to facilitate the flow of communication. This total integration was found at 53% of the respon-dents. At the other 47%, there is partial interconnection among some areas.
Question 16 sought to identify in somewhat greater detail if there is interconnection between the software that generates the forecasts with the organization’s other information systems, such as management information systems (MIS), distribution resource planning (DRP) and manufacturing resource planning (MRP II). According to Figure 14, the responses were balanced between the ideal alternative – existence of connections between the software that generates the forecasts and the information systems (36%); and no connection between the software that generates the forecasts with the other information systems (36%). There were also cases in which there was no forecasting software at the organization (28%).
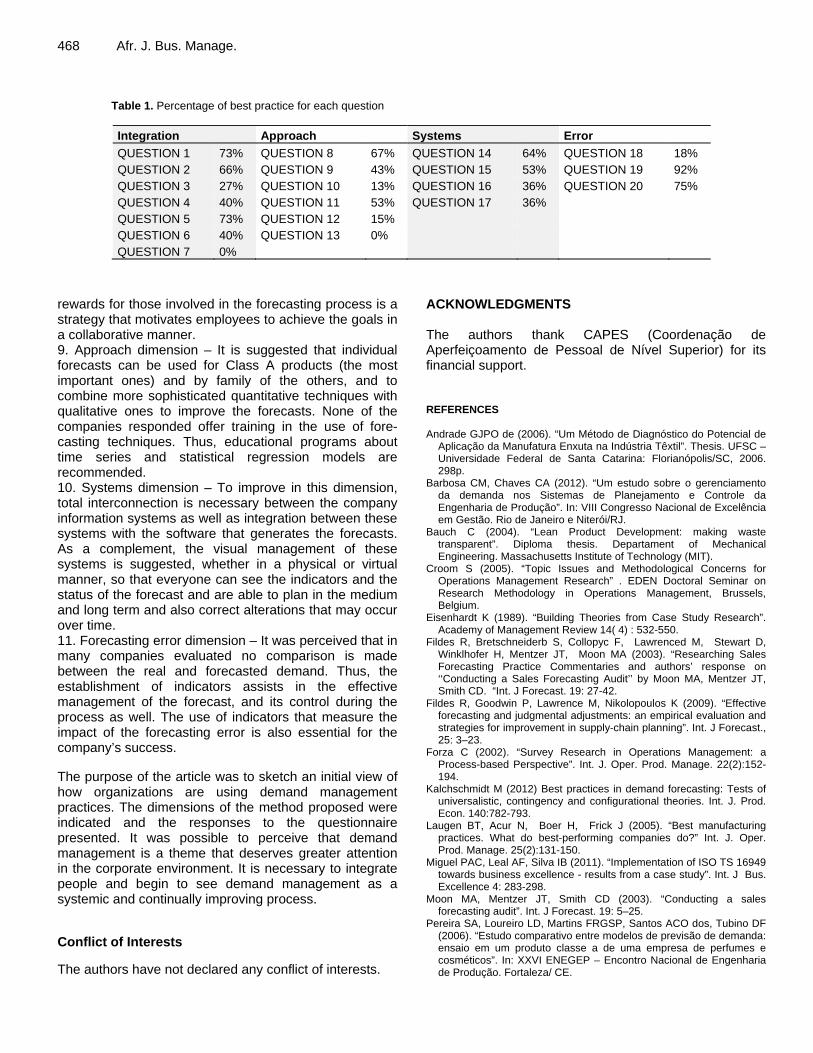
Concerning the form of publicizing the forecasting information, Figure 15 indicates that the ideal situation was found in 36% - the information is publicized in reports available via computer in real time. At most of the companies that responded, (43%), the information is only promoted in printed reports and in some periods of the year. The Forecasting Error Dimension has 3 related questions. One of them, displayed in Figure 16, allows
Gives priority to some products and this choice
is made by a classification
53%
Gives priority to some products and this choice
is made intuitively 27%
Does not prioritize any product 20%
Sophisticated quantitative
techniques are
used in an integrated manner 0%
Sophisticated quantitative
techniques are
used individually
15%
Only simple quantitative
techniques are
used 62%
Not used 23%
There is an electronic connection
36%
There is no electronic connection
36%
The company has no
forecasting
software28%
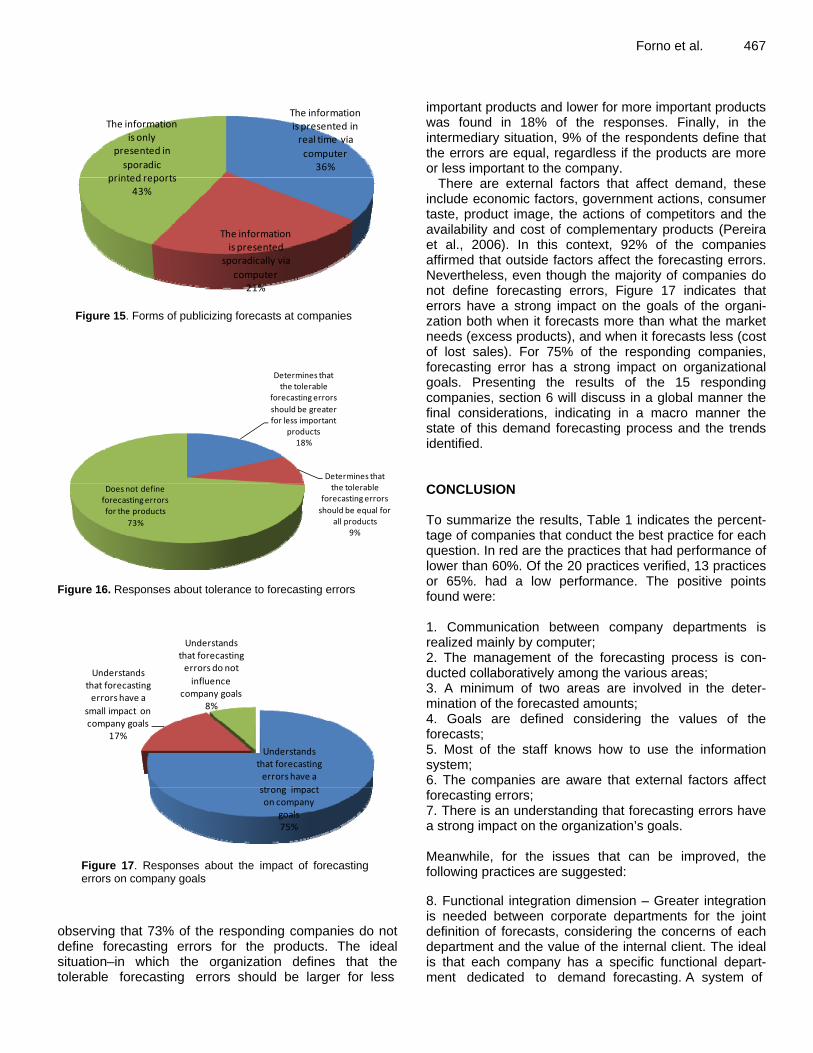
Figure 15. Forms of publicizing forecasts at companies
Figure 16. Responses about tolerance to forecasting errors
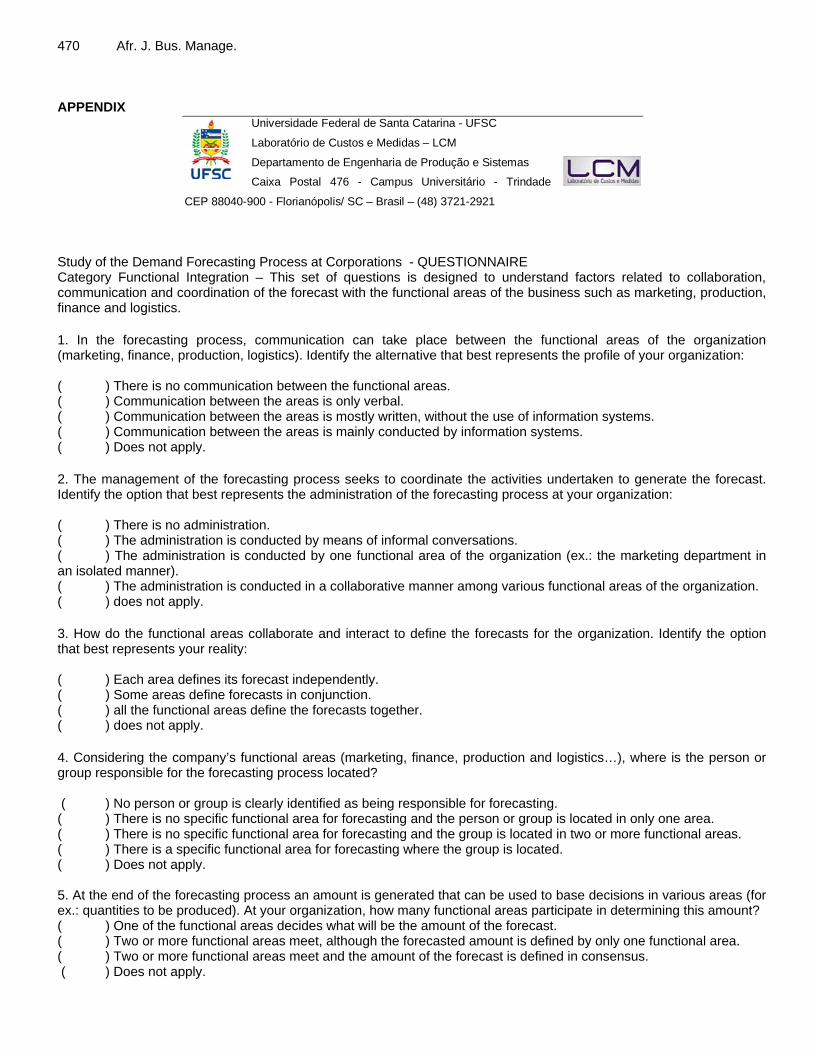
Figure 17. Responses about the impact of forecasting errors on company goals
observing that 73% of the responding companies do not define forecasting errors for the products. The ideal situation–in which the organization defines that the tolerable forecasting errors should be larger for less
Forno et al. 467 important products and lower for more important products was found in 18% of the responses. Finally, in the intermediary situation, 9% of the respondents define that the errors are equal, regardless if the products are more or less important to the company.
There are external factors that affect demand, these include economic factors, government actions, consumer taste, product image, the actions of competitors and the availability and cost of complementary products (Pereira et al., 2006). In this context, 92% of the companies affirmed that outside factors affect the forecasting errors. Nevertheless, even though the majority of companies do not define forecasting errors, Figure 17 indicates that errors have a strong impact on the goals of the organi-zation both when it forecasts more than what the market needs (excess products), and when it forecasts less (cost of lost sales). For 75% of the responding companies, forecasting error has a strong impact on organizational goals. Presenting the results of the 15 responding companies, section 6 will discuss in a global manner the final considerations, indicating in a macro manner the state of this demand forecasting process and the trends identified. CONCLUSION To summarize the results, Table 1 indicates the percent-tage of companies that conduct the best practice for each question. In red are the practices that had performance of lower than 60%. Of the 20 practices verified, 13 practices or 65%. had a low performance. The positive points found were: 1. Communication between company departments is realized mainly by computer; 2. The management of the forecasting process is con-ducted collaboratively among the various areas; 3. A minimum of two areas are involved in the deter-mination of the forecasted amounts; 4. Goals are defined considering the values of the forecasts; 5. Most of the staff knows how to use the information system; 6. The companies are aware that external factors affect forecasting errors; 7. There is an understanding that forecasting errors have a strong impact on the organization’s goals. Meanwhile, for the issues that can be improved, the following practices are suggested: 8. Functional integration dimension – Greater integration is needed between corporate departments for the joint definition of forecasts, considering the concerns of each department and the value of the internal client. The ideal is that each company has a specific functional depart-ment dedicated to demand forecasting. A system of
The information is presented in real time via
computer36%
The information is presented
sporadically via
computer 21%
The information is only
presented in
sporadic printed reports
43%
Determines that the tolerable
forecasting errors
should be greater for less important
products 18%
Determines that the tolerable
forecasting errors
should be equal for all products
9%
Does not define forecasting errors for the products
73%
Understands that forecasting errors have a
strong impact on company
goals75%
Understands that forecasting errors have a
small impact on company goals
17%
Understands that forecasting errors do not
influence company goals
8%
468 Afr. J. Bus. Manage.
Table 1. Percentage of best practice for each question
Integration Approach Systems Error
QUESTION 1 73% QUESTION 8 67% QUESTION 14 64% QUESTION 18 18% QUESTION 2 66% QUESTION 9 43% QUESTION 15 53% QUESTION 19 92% QUESTION 3 27% QUESTION 10 13% QUESTION 16 36% QUESTION 20 75% QUESTION 4 40% QUESTION 11 53% QUESTION 17 36% QUESTION 5 73% QUESTION 12 15% QUESTION 6 40% QUESTION 13 0% QUESTION 7 0%
rewards for those involved in the forecasting process is a strategy that motivates employees to achieve the goals in a collaborative manner. 9. Approach dimension – It is suggested that individual forecasts can be used for Class A products (the most important ones) and by family of the others, and to combine more sophisticated quantitative techniques with qualitative ones to improve the forecasts. None of the companies responded offer training in the use of fore-casting techniques. Thus, educational programs about time series and statistical regression models are recommended. 10. Systems dimension – To improve in this dimension, total interconnection is necessary between the company information systems as well as integration between these systems with the software that generates the forecasts. As a complement, the visual management of these systems is suggested, whether in a physical or virtual manner, so that everyone can see the indicators and the status of the forecast and are able to plan in the medium and long term and also correct alterations that may occur over time. 11. Forecasting error dimension – It was perceived that in many companies evaluated no comparison is made between the real and forecasted demand. Thus, the establishment of indicators assists in the effective management of the forecast, and its control during the process as well. The use of indicators that measure the impact of the forecasting error is also essential for the company’s success. The purpose of the article was to sketch an initial view of how organizations are using demand management practices. The dimensions of the method proposed were indicated and the responses to the questionnaire presented. It was possible to perceive that demand management is a theme that deserves greater attention in the corporate environment. It is necessary to integrate people and begin to see demand management as a systemic and continually improving process. Conflict of Interests The authors have not declared any conflict of interests.
ACKNOWLEDGMENTS The authors thank CAPES (Coordenação de Aperfeiçoamento de Pessoal de Nível Superior) for its financial support. REFERENCES Andrade GJPO de (2006). “Um Método de Diagnóstico do Potencial de
Aplicação da Manufatura Enxuta na Indústria Têxtil”. Thesis. UFSC – Universidade Federal de Santa Catarina: Florianópolis/SC, 2006. 298p.
Barbosa CM, Chaves CA (2012). “Um estudo sobre o gerenciamento da demanda nos Sistemas de Planejamento e Controle da Engenharia de Produção”. In: VIII Congresso Nacional de Excelência em Gestão. Rio de Janeiro e Niterói/RJ.
Bauch C (2004). “Lean Product Development: making waste transparent”. Diploma thesis. Departament of Mechanical Engineering. Massachusetts Institute of Technology (MIT).
Croom S (2005). “Topic Issues and Methodological Concerns for Operations Management Research” . EDEN Doctoral Seminar on Research Methodology in Operations Management, Brussels, Belgium.
Eisenhardt K (1989). “Building Theories from Case Study Research”. Academy of Management Review 14( 4) : 532-550.
Fildes R, Bretschneiderb S, Collopyc F, Lawrenced M, Stewart D, Winklhofer H, Mentzer JT, Moon MA (2003). “Researching Sales Forecasting Practice Commentaries and authors’ response on ‘‘Conducting a Sales Forecasting Audit’’ by Moon MA, Mentzer JT, Smith CD. “Int. J Forecast. 19: 27-42.
Fildes R, Goodwin P, Lawrence M, Nikolopoulos K (2009). “Effective forecasting and judgmental adjustments: an empirical evaluation and strategies for improvement in supply-chain planning”. Int. J Forecast., 25: 3–23.
Forza C (2002). “Survey Research in Operations Management: a Process-based Perspective”. Int. J. Oper. Prod. Manage. 22(2):152-194.
Kalchschmidt M (2012) Best practices in demand forecasting: Tests of universalistic, contingency and configurational theories. Int. J. Prod. Econ. 140:782-793.
Laugen BT, Acur N, Boer H, Frick J (2005). “Best manufacturing practices. What do best-performing companies do?” Int. J. Oper. Prod. Manage. 25(2):131-150.
Miguel PAC, Leal AF, Silva IB (2011). “Implementation of ISO TS 16949 towards business excellence - results from a case study”. Int. J Bus. Excellence 4: 283-298.
Moon MA, Mentzer JT, Smith CD (2003). “Conducting a sales forecasting audit”. Int. J Forecast. 19: 5–25.
Pereira SA, Loureiro LD, Martins FRGSP, Santos ACO dos, Tubino DF (2006). “Estudo comparativo entre modelos de previsão de demanda: ensaio em um produto classe a de uma empresa de perfumes e cosméticos”. In: XXVI ENEGEP – Encontro Nacional de Engenharia de Produção. Fortaleza/ CE.

Smith CD, Mentzer JT (2010). “Forecasting task-technology fit: The
influence of individuals, systems and procedures on forecast performance”. Int. J Forecast. 26:144-161.
Souza R (2005). “Case Research in Operations Management”. EDEN Doctoral Seminar on Research Methodology in Operations Management, Brussels, Belgium.
Forno et al. 469 Tubino DF (2009). “Planejamento e Controle da Produção: teoria e
prática”. 2.ed. São Paulo: Atlas.
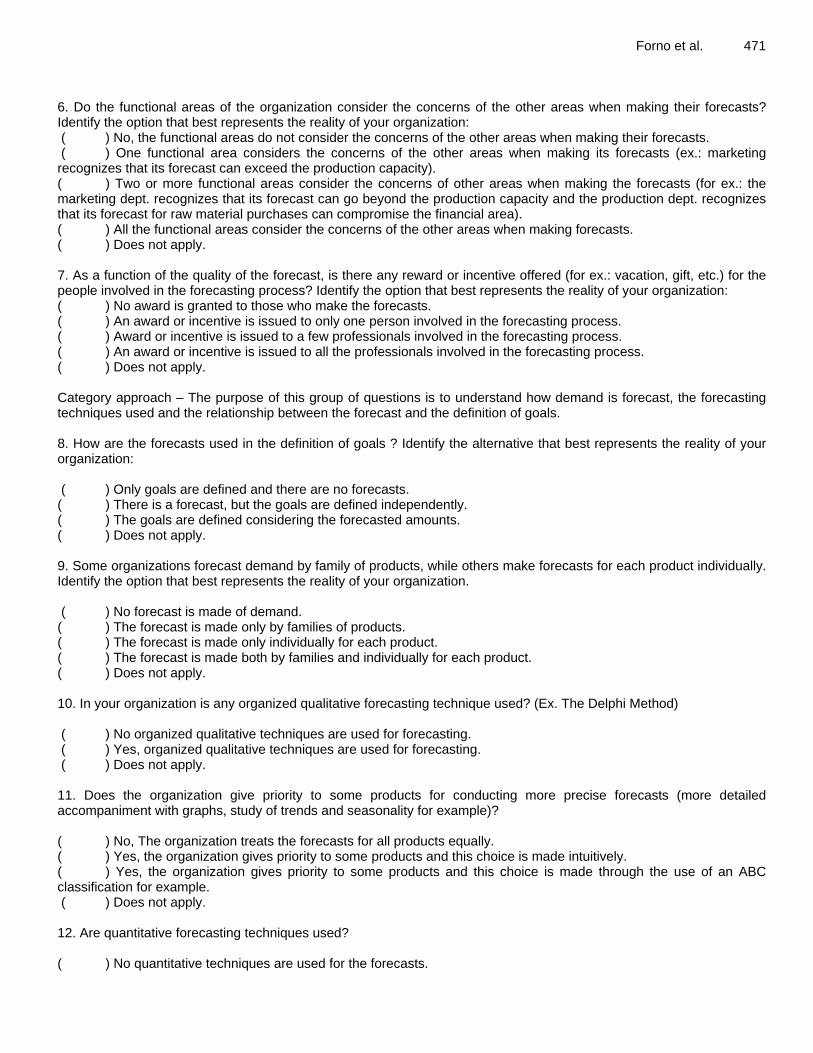
470 Afr. J. Bus. Manage. APPENDIX
Study of the Demand Forecasting Process at Corporations - QUESTIONNAIRE Category Functional Integration – This set of questions is designed to understand factors related to collaboration, communication and coordination of the forecast with the functional areas of the business such as marketing, production, finance and logistics. 1. In the forecasting process, communication can take place between the functional areas of the organization (marketing, finance, production, logistics). Identify the alternative that best represents the profile of your organization: ( ) There is no communication between the functional areas. ( ) Communication between the areas is only verbal. ( ) Communication between the areas is mostly written, without the use of information systems. ( ) Communication between the areas is mainly conducted by information systems. ( ) Does not apply. 2. The management of the forecasting process seeks to coordinate the activities undertaken to generate the forecast. Identify the option that best represents the administration of the forecasting process at your organization: ( ) There is no administration. ( ) The administration is conducted by means of informal conversations. ( ) The administration is conducted by one functional area of the organization (ex.: the marketing department in an isolated manner). ( ) The administration is conducted in a collaborative manner among various functional areas of the organization. ( ) does not apply. 3. How do the functional areas collaborate and interact to define the forecasts for the organization. Identify the option that best represents your reality: ( ) Each area defines its forecast independently. ( ) Some areas define forecasts in conjunction. ( ) all the functional areas define the forecasts together. ( ) does not apply. 4. Considering the company’s functional areas (marketing, finance, production and logistics…), where is the person or group responsible for the forecasting process located? ( ) No person or group is clearly identified as being responsible for forecasting. ( ) There is no specific functional area for forecasting and the person or group is located in only one area. ( ) There is no specific functional area for forecasting and the group is located in two or more functional areas. ( ) There is a specific functional area for forecasting where the group is located. ( ) Does not apply. 5. At the end of the forecasting process an amount is generated that can be used to base decisions in various areas (for ex.: quantities to be produced). At your organization, how many functional areas participate in determining this amount? ( ) One of the functional areas decides what will be the amount of the forecast. ( ) Two or more functional areas meet, although the forecasted amount is defined by only one functional area. ( ) Two or more functional areas meet and the amount of the forecast is defined in consensus. ( ) Does not apply.
Universidade Federal de Santa Catarina - UFSC
Laboratório de Custos e Medidas – LCM
Departamento de Engenharia de Produção e Sistemas
Caixa Postal 476 - Campus Universitário - Trindade
CEP 88040-900 - Florianópolis/ SC – Brasil – (48) 3721-2921
Forno et al. 471 6. Do the functional areas of the organization consider the concerns of the other areas when making their forecasts? Identify the option that best represents the reality of your organization: ( ) No, the functional areas do not consider the concerns of the other areas when making their forecasts. ( ) One functional area considers the concerns of the other areas when making its forecasts (ex.: marketing recognizes that its forecast can exceed the production capacity). ( ) Two or more functional areas consider the concerns of other areas when making the forecasts (for ex.: the marketing dept. recognizes that its forecast can go beyond the production capacity and the production dept. recognizes that its forecast for raw material purchases can compromise the financial area). ( ) All the functional areas consider the concerns of the other areas when making forecasts. ( ) Does not apply. 7. As a function of the quality of the forecast, is there any reward or incentive offered (for ex.: vacation, gift, etc.) for the people involved in the forecasting process? Identify the option that best represents the reality of your organization: ( ) No award is granted to those who make the forecasts. ( ) An award or incentive is issued to only one person involved in the forecasting process. ( ) Award or incentive is issued to a few professionals involved in the forecasting process. ( ) An award or incentive is issued to all the professionals involved in the forecasting process. ( ) Does not apply. Category approach – The purpose of this group of questions is to understand how demand is forecast, the forecasting techniques used and the relationship between the forecast and the definition of goals. 8. How are the forecasts used in the definition of goals ? Identify the alternative that best represents the reality of your organization: ( ) Only goals are defined and there are no forecasts. ( ) There is a forecast, but the goals are defined independently. ( ) The goals are defined considering the forecasted amounts. ( ) Does not apply. 9. Some organizations forecast demand by family of products, while others make forecasts for each product individually. Identify the option that best represents the reality of your organization. ( ) No forecast is made of demand. ( ) The forecast is made only by families of products. ( ) The forecast is made only individually for each product. ( ) The forecast is made both by families and individually for each product. ( ) Does not apply. 10. In your organization is any organized qualitative forecasting technique used? (Ex. The Delphi Method) ( ) No organized qualitative techniques are used for forecasting. ( ) Yes, organized qualitative techniques are used for forecasting. ( ) Does not apply. 11. Does the organization give priority to some products for conducting more precise forecasts (more detailed accompaniment with graphs, study of trends and seasonality for example)? ( ) No, The organization treats the forecasts for all products equally. ( ) Yes, the organization gives priority to some products and this choice is made intuitively. ( ) Yes, the organization gives priority to some products and this choice is made through the use of an ABC classification for example. ( ) Does not apply. 12. Are quantitative forecasting techniques used? ( ) No quantitative techniques are used for the forecasts.
472 Afr. J. Bus. Manage. ( ) Yes, only simple quantitative techniques are used (ex.: simple average of the past 3 months, simple regression). ( ) Yes, more sophisticated quantitative techniques are used individually (ex.: exponential smoothing models, ARIMA, multiple regression). ( ) Yes, sophisticated quantitative techniques are used in an integrated manner (for ex.: dynamic regression models for medium and long term forecasts and time series for short term forecasts). ( ) Does not apply. 13. At your organization, is some type of course and or training offered in the use of forecasting techniques? ( ) There is no training. ( ) There is only training in simple forecasting techniques (simple average, moving average, simple regression etc.). ( ) There is training in time series techniques such as exponential smoothing and ARIMA, for example. ( ) There is training in time series techniques, regression and statistical models. ( ) Does not apply. Category systems – This set of questions is designed to understand the hardware and software combinations used to support forecasting, as well as the integration of forecasting with other corporate planning and management systems. 14. At your organization, do people know how to use information systems? Mark the option that best represents the reality of your organization. ( ) People do not know how to use information systems. ( ) Some people know how to use information systems. ( ) Most people know how to use information systems. ( ) Does not apply. 15. Concerning the connection between the information systems at your organization, can it be said that: ( ) There is no connection between the information systems. ( ) There is a partial connection between the organization’s information systems (ex.: integration of the information systems of the functional areas of production and logistics). ( ) There is a total connection between the information systems at the organization (for ex.: there is an Integrated Management System - ERP). ( ) Does not apply. 16. Is there a connection between the software that generates the forecasts with the information systems of the organization, such as with managerial information systems (SIG), distribution resources planning (DRP) and Manufacturing resources planning (MRP II)? ( ) There is no forecasting software at the organization. ( ) There is no connection between the forecasting software and other information systems. ( ) Yes, there is a connection between the forecasting software and other information systems. ( ) Does not apply. 17. How are the information about forecasts publicized within the organization? Identify the option that best represents the reality of your organization. ( ) The information from the forecasts is not publicized. ( ) The information is publicized only in printed reports, in some periods. ( ) The information is publicized in reports available via computer in some periods. ( ) The information is publicized in reports via computer in real time. ( ) Does not apply. Category forecasting errors – The purpose of this group of questions is to understand how the organization defines the forecasting errors, the impact of the forecasting errors on the business operations and their relationship with goals.
Forno et al. 473 18. How are the tolerable forecasting errors for products defined? ( ) The organization does not define forecasting errors for products. ( ) The organization determines that the tolerable forecasting errors should be equal for all products. ( ) The organization determines that the tolerable forecasting errors must be greater for less important products and smaller for more important products. ( ) Does not apply. 19. How does the organization evaluate the impacts of external factors (ex.: economic situation, actions of competitors, suppliers, etc.) in the forecasting errors? ( ) Understands that external factors do not affect forecasting errors. ( ) Understands that external factors do affect forecasting errors. ( ) Does not apply. 20. Does the organization perceive the impact that a forecasting error can cause in the organizational goals (for ex.: profit, volume of stocks, etc.)? ( ) Understands that a forecasting error does not influence the goals of the organization. ( ) Understands that a forecasting error has little impact on the organization’s goals. ( ) Understands that a forecasting error has a strong impact on the organization’s goals. ( ) Does not apply.