Patients with Multiple Sclerosis with Structural Venous Abnormalities on MR Imaging Exhibit an...
12
CLINICAL STUDY Patients with Multiple Sclerosis with Structural Venous Abnormalities on MR Imaging Exhibit an Abnormal Flow Distribution of the Internal Jugular Veins E. Mark Haacke, PhD, Wei Feng, PhD, David Utriainen, BS, Gabriela Trifan, MD, Zhen Wu, MD, Zahid Latif, RT, Yashwanth Katkuri, MS, Joseph Hewett, MD, and David Hubbard, MD ABSTRACT Purpose: To evaluate extracranial venous structural and flow characteristics in patients with multiple sclerosis (MS). Materials and Methods: Two hundred subjects with MS from two sites (n 100 each) were evaluated with magnetic resonance (MR) imaging at 3 T. Contrast-enhanced time-resolved MR angiography and time-of-flight MR venography were used to assess vascular anatomy. Two-dimensional phase-contrast MR imaging was used to quantify blood flow. The MS population was divided into two groups: those with evident internal jugular vein (IJV) stenoses (stenotic group) and those without (nonstenotic group). Results: Of the 200 patients, 136 (68%) showed IJV structural abnormalities, including unilateral or bilateral stenoses at different levels in the neck (n 101; 50.5%) and atresia (n 35; 17.5%). The total IJV flow normalized to the total arterial flow of the stenotic group (56% 22) was significantly lower than that of the nonstenotic group (77% 14; P .001). The arterial/venous flow mismatch in the stenotic group (12% 15) was significantly greater than that in the nonstenotic group (6% 12; P .001). The ratio of subdominant venous flow rate (Fsd) to dominant venous flow rate (Fd) for the stenotic group (0.38 0.27) was significantly lower than for the nonstenotic group (0.59 0.23; P .001). The majority of the stenotic group (67%) also had an Fsd of less than 3 mL/s, a Fd/Fsd ratio greater than 3:1, and/or a total IJV flow rate of less than 8 mL/s. Conclusions: MR imaging provides a noninvasive means to separate stenotic from nonstenotic MS cases. The former group was more prevalent in the present MS population and carried significantly less flow in the IJVs than the latter. ABBREVIATIONS CCA common carotid artery, CCSVI chronic cerebrospinal venous insufficiency, CE contrast-enhanced, EJV external jugular vein, Fd dominant venous flow rate, Fsd subdominant venous flow rate, FIJV IJV flow, Fta total arterial flow, LIJV left internal jugular vein, IJV internal jugular vein, MIP maximum-intensity projection, MS multiple sclerosis, PC phase-contrast, RIJV right internal jugular vein, 3D three-dimensional, TOF time of flight, 2D two-dimensional, Venc encoding velocity Recent advances in multiple sclerosis (MS) suggest that there may be an association between impaired venous flow and the disease (1–5). Ultrasound (US) imaging (1,6–8) and magnetic resonance (MR) imaging (9 –12) have been used to study these venous abnormalities. Each method has its strengths and weaknesses, but the three-dimensional (3D) information available to MR imaging might provide a more complete, or at least complementary, picture versus From the Departments of Biomedical Engineering (E.M.H., W.F.) and Radiol- ogy (E.M.H., Z.L., Y.K.), Wayne State University; Magnetic Resonance Inno- vations Inc. (E.M.H., D.U., G.T., Z.W.) and Magnetic Resonance Imaging Institute for Biomedical Research (E.M.H.), 440 E. Ferry St., Unit 2, Detroit, MI 48202; Synergy Health (J.H.), Costa Mesa; Applied Functional Magnetic Resonance Imaging Institute (D.H.), San Diego, California; and Department of Electrical and Computer Engineering (E.M.H.), McMaster University, Hamil- ton, Ontario, Canada. Received April 28, 2011; final revision received Sep- tember 15, 2011; accepted September 17, 2011. Address correspondence to E.M.H.; E-mail: [email protected] E.M.H. is the president of Magnetic Resonance Innovations Inc. (Detroit, Michigan). D.U., G.T., and Z.W. are salaried employees of Magnetic Resonance Innovations Inc. None of the other authors have identified a conflict of interest. Appendices I–VII are available online at www.jvir.org. © SIR, 2012 J Vasc Interv Radiol 2012; 23:60 – 68 DOI: 10.1016/j.jvir.2011.09.027
-
Upload
independent -
Category
Documents
-
view
0 -
download
0
Transcript of Patients with Multiple Sclerosis with Structural Venous Abnormalities on MR Imaging Exhibit an...
CLINICAL STUDY
Patients with Multiple Sclerosis with Structural
Venous Abnormalities on MR Imaging Exhibit an
Abnormal Flow Distribution of the Internal
Jugular Veins
E. Mark Haacke, PhD, Wei Feng, PhD, David Utriainen, BS,Gabriela Trifan, MD, Zhen Wu, MD, Zahid Latif, RT,
Yashwanth Katkuri, MS, Joseph Hewett, MD, and David Hubbard, MD
ABSTRACT
Purpose: To evaluate extracranial venous structural and flow characteristics in patients with multiple sclerosis (MS).
Materials and Methods: Two hundred subjects with MS from two sites (n � 100 each) were evaluated with magnetic resonance(MR) imaging at 3 T. Contrast-enhanced time-resolved MR angiography and time-of-flight MR venography were used to assessvascular anatomy. Two-dimensional phase-contrast MR imaging was used to quantify blood flow. The MS population was divided intotwo groups: those with evident internal jugular vein (IJV) stenoses (stenotic group) and those without (nonstenotic group).
Results: Of the 200 patients, 136 (68%) showed IJV structural abnormalities, including unilateral or bilateral stenoses at differentlevels in the neck (n � 101; 50.5%) and atresia (n � 35; 17.5%). The total IJV flow normalized to the total arterial flow of the stenoticgroup (56% � 22) was significantly lower than that of the nonstenotic group (77% � 14; P � .001). The arterial/venous flowmismatch in the stenotic group (12% � 15) was significantly greater than that in the nonstenotic group (6% � 12; P � .001). Theratio of subdominant venous flow rate (Fsd) to dominant venous flow rate (Fd) for the stenotic group (0.38 � 0.27) was significantlylower than for the nonstenotic group (0.59 � 0.23; P � .001). The majority of the stenotic group (67%) also had an Fsd of less than3 mL/s, a Fd/Fsd ratio greater than 3:1, and/or a total IJV flow rate of less than 8 mL/s.
Conclusions: MR imaging provides a noninvasive means to separate stenotic from nonstenotic MS cases. The former group wasmore prevalent in the present MS population and carried significantly less flow in the IJVs than the latter.
ABBREVIATIONS
CCA � common carotid artery, CCSVI � chronic cerebrospinal venous insufficiency, CE � contrast-enhanced, EJV �external jugular vein, Fd � dominant venous flow rate, Fsd � subdominant venous flow rate, FIJV � IJV flow, Fta � totalarterial flow, LIJV � left internal jugular vein, IJV � internal jugular vein, MIP � maximum-intensity projection, MS �multiple sclerosis, PC � phase-contrast, RIJV � right internal jugular vein, 3D � three-dimensional, TOF � time of flight,
2D � two-dimensional, Venc � encoding velocityui(m
EDN
A
©
J
Recent advances in multiple sclerosis (MS) suggest thatthere may be an association between impaired venous flowand the disease (1–5). Ultrasound (US) imaging (1,6–8)and magnetic resonance (MR) imaging (9–12) have been
From the Departments of Biomedical Engineering (E.M.H., W.F.) and Radiol-ogy (E.M.H., Z.L., Y.K.), Wayne State University; Magnetic Resonance Inno-vations Inc. (E.M.H., D.U., G.T., Z.W.) and Magnetic Resonance ImagingInstitute for Biomedical Research (E.M.H.), 440 E. Ferry St., Unit 2, Detroit, MI48202; Synergy Health (J.H.), Costa Mesa; Applied Functional MagneticResonance Imaging Institute (D.H.), San Diego, California; and Department ofElectrical and Computer Engineering (E.M.H.), McMaster University, Hamil-ton, Ontario, Canada. Received April 28, 2011; final revision received Sep-tember 15, 2011; accepted September 17, 2011. Address correspondence
to E.M.H.; E-mail: [email protected] Dsed to study these venous abnormalities. Each method hasts strengths and weaknesses, but the three-dimensional3D) information available to MR imaging might provide aore complete, or at least complementary, picture versus
.M.H. is the president of Magnetic Resonance Innovations Inc. (Detroit, Michigan)..U., G.T., and Z.W. are salaried employees of Magnetic Resonance Innovations Inc.one of the other authors have identified a conflict of interest.
ppendices I–VII are available online at www.jvir.org.
SIR, 2012
Vasc Interv Radiol 2012; 23:60–68
OI: 10.1016/j.jvir.2011.09.027
sCq(fl(d
gM(tmat
DDMmrvciAs
qtvstasccrelImt
tbsrccwostct
iimiouau
Volume 23 � Number 1 � January � 2012 61
that presented with US, and it could also serve as anexcellent means to judge anatomy and flow simultaneously.In the present study, data are presented for 200 patients withMS recruited from two sites (100 subjects from each site)who underwent conventional MR imaging as well as whatis referred to as the chronic cerebrospinal venous insuffi-ciency (CCSVI) protocol. This protocol collects data forvascular anatomy and flow in the major veins in differentparts of the neck and brain. Combining these two pieces ofinformation provides a powerful means to study vascularanomalies in MS. The goal of this study is to highlight themajor venous anomalies as seen with MR imaging andreport the flow characteristics, especially flow through theinternal jugular veins (IJVs), in this population. This infor-mation might prove useful in better stratifying patients withabnormal venous flow and perhaps prove useful in treat-ment studies.
MATERIALS AND METHODS
A conventional clinical protocol for MS was combinedwith a specially designed CCSVI protocol. The conven-tional protocol included a T1-weighted scan before andafter contrast agent administration, a two-dimensional(2D) fluid-attenuated inversion recovery scan, and a T2can when cerebrospinal fluid had to be visualized. TheCSVI protocol consisted of the following vascular se-uences: a coronal 3D time-resolved contrast-enhancedCE) MR arteriovenography scan, a transverse 2D time-of-ight (TOF) MR venography scan, and a 2D phase-contrastPC) MR scan for flow quantification (sequence parametersetailed in Appendix I [available online at www.jvir.org]).
Deidentified data from 200 patients with MS (100 fromeach of two sites) who underwent the CCSVI MR imagingprotocol were evaluated. Of the 200 patients, the MS typewas available for 133 patients: primary progressive MS (n �34), secondary progressive MS (n � 31), and relapsing/remitting MS (n � 68). Institutional review board approvalwas obtained to perform the quantitative evaluation pre-sented in this article.
Scanning ProcedureData were collected at site 1 on a 3-T Tim Trio scanner(Siemens, Erlangen, Germany) with a 12-channel head/neck coil arrangement and at site 2 on a 3-T Signa HDxtscanner (GE Healthcare, Milwaukee, Wisconsin) with aneight-channel head/neck coil arrangement. The subject wascentered at the orbital ridge for the brain scans. T1, fluid-attenuated inversion recovery, and, when needed, T2 datawere acquired. After these scans, the subject was moved tothe center at the chin in preparation for contrast mediuminjection. Just before injection, 2D TOF MR venographicdata were collected. Contrast medium was then injected(OptiMARK [Covidien, Hazelwood, Missouri] at site 1 andMagnevist [Bayer, Wayne, New Jersey] at site 2, both with
0.2 mL/kg [0.1 mmol/kg]), and time-resolved MR angio- mraphic data were collected for 20 time points. Then, 2D PCR scans were obtained at three different levels in the neck
C2/C3, C5/C6, and T1/T2). Finally, the subject was recen-ered at the orbital ridge and a postcontrast T1 imageatching the precontrast image was collected. Parallel im-
ging was used to speed up data acquisition by a factor ofwo when possible.
ata Processingata were processed by using Signal Processing in NuclearR software (SPIN, Detroit, Michigan) to evaluate vesselorphology. The time-resolved 3D CE MR arteriovenog-
aphy data were viewed as original and subtracted data (ie,enous phase minus arterial phase) in 3D. Poor flow indi-ated by persistent contrast enhancement was cross-exam-ned with 2D TOF MR venography and PC MR imaging.natomic assessment of data involved the identification of
tenosis, aplasia, and atresia of the IJVs.The 2D TOF MR venographic images were used to
uantify any narrowings perceived in the coronal views ofhe 3D CE MR arteriovenography images because it pro-ided higher in-plane resolution for cross-sectional mea-urements. IJVs that showed a cross-sectional area of lesshan 25 mm2 (ie, one third of the cross-sectional area for anverage IJV diameter of 1 cm [13,14] assuming a circularhape) in the lower-level C5/C6 or T1/T2 levels wereonsidered stenotic. For upper-level narrowing (C2/C3), aross section of less than 12.5 mm2 was considered toepresent a stenotic IJV. Observed stenoses were then cat-gorized into groups according to their location: upper andower neck levels, unilateral on the right IJV (RIJV) or leftJV (LIJV), or bilateral stenosis. At either neck level, anyeasured cross-sectional area greater than the stenosis
hreshold was considered to represent a nonstenotic result.Atresia of an IJV was identified when the vessel came
o a clear and abrupt ending at some point in the IJV bodyetween the sigmoid sinus and its confluence with theubclavian vein. Time-resolved 3D CE MR arteriovenog-aphy data and 2D TOF MR venography were used toonfirm the lack of structural patency of a vessel. Thisould appear in the form of a terminating sigmoid sinusith the IJV being reconstituted from the vertebral systemr as a lower-level truncation with a thin string down oneide. Aplasia, a congenital condition in which an IJV failso develop entirely, could potentially be identified by theomplete lack of ability to image a complete IJV in any ofhe data collected.
The vessel lumen for veins and arteries seen in PC MRmages were delineated by using the magnitude and phasemages as input. A baseline correction was applied to re-ove any phase shift caused by eddy currents and gradient
mperfections (Appendix II, available online at www.jvir.rg). In the case that phase aliasing was present, phasenwrapping was performed (Appendix III, available onlinet www.jvir.org). The corrected and unwrapped phase val-es in the vessels were then mapped to velocity measure-
ents by using the encoding velocity (Venc) value. Subse-
ds
pcadstue
espwtrarvpnhTead
FEfla
AMlCt.tipa1p
62 � Abnormal IJV Flow Distribution in MS with Venous Abnormalities Haacke et al � JVIR
quently, quantitative measurements such as cross-sectionalarea, flow velocity (average, peak positive, and peak neg-ative), volume flow rate (average, positive, and negative),total flow volume per cardiac cycle, and reflux were com-puted (as defined in Appendix IV, available online atwww.jvir.org). Blood flow velocities through all the dis-cernable veins and arteries were measured. These typicallyincluded the following, on the left and right sides: commoncarotid arteries (CCAs), vertebral arteries, IJVs, externaljugular veins (EJVs), vertebral veins, deep cervical veins,anterior jugular veins, and posterior EJVs. Because thevenous system is known to exhibit significant variations,other veins were also included when encountered.
To evaluate the flow differences between differentgroups, paired and unpaired t tests were performed asappropriate. A significance level of P � .05 was used toetermine whether the measurements between groups wereignificantly different.
The data from both sites were processed by trainedrocessors by using in-house software. Inter- and intrapro-essor variability were assessed by using a multiple-waynalysis of variance with a randomized complete blockesign (Appendix V, available online at www.jvir.org). Aignificance level of P � .05 was used to determine whetherhe inter- and intraprocessor variability was significant bysing the null hypotheses that the interprocessor factorffect and the intraprocessor factor effect equal 0 (15).
RESULTS
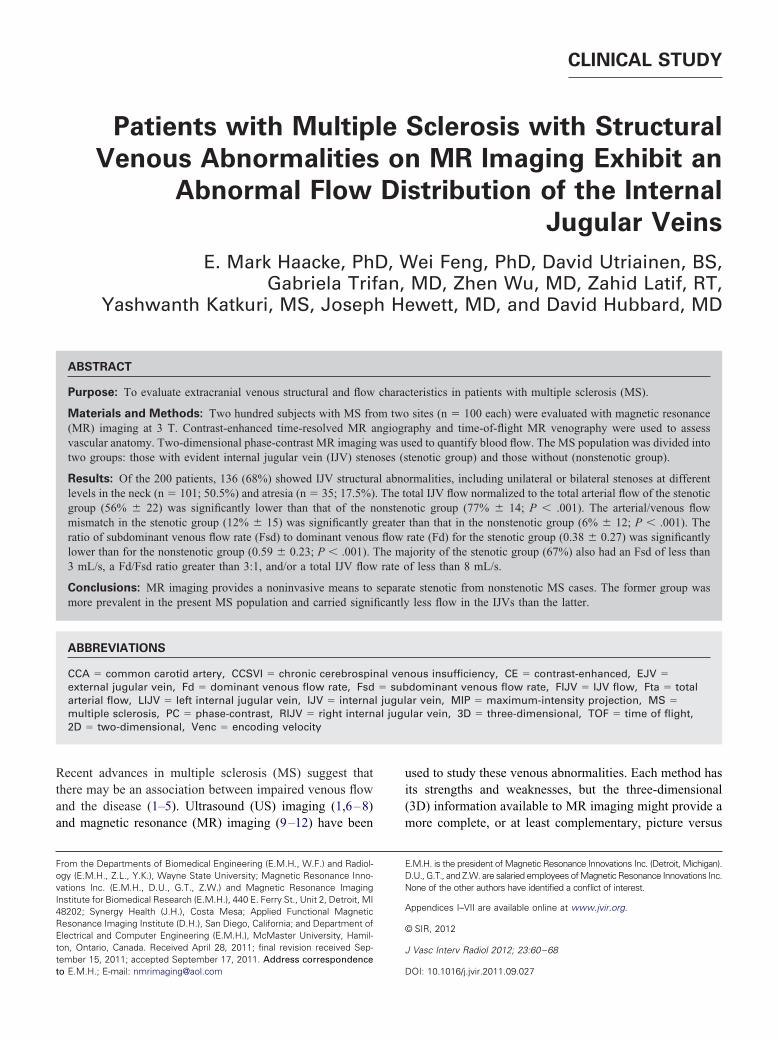
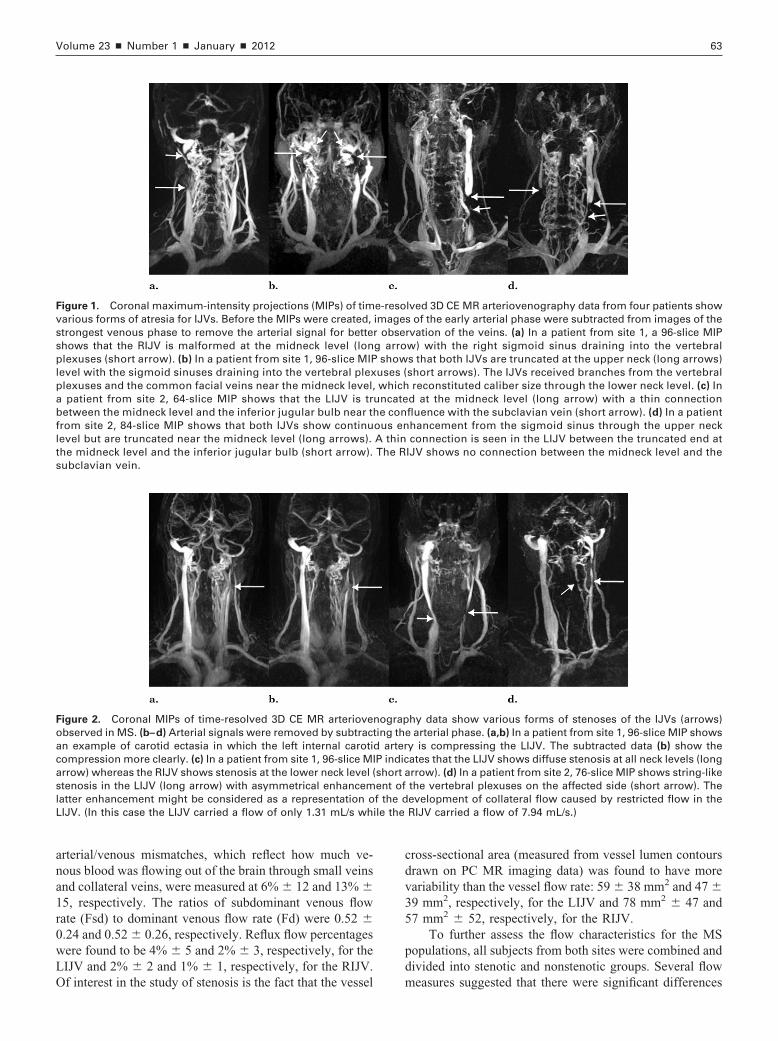
Anatomic InformationSubjects were categorized into two groups: stenotic andnonstenotic. Those subjects who showed one or more of thestructural abnormalities (stenosis, atresia, and aplasia) wereassigned to the stenotic group, whereas those who did notwere assigned to the nonstenotic group. Anatomic assess-ment for all 200 subjects is presented in the Table. Notethat there were more patients from site 2 with stenotic IJVsthan from site 1 (80 vs 56). Of the 200 patients with MS,68% were determined to be in the stenotic group. Examplesof these abnormalities are presented in Figures 1–4.
Atresia was identified in 25 cases at the upper necklevel and in 10 cases at the lower neck level inferior towhere the common facial vein typically joined the IJV,making a total of 35 cases of atresia. Examples of superiorand inferior atresia of the IJVs are shown in Figure 1. Athin strip connected the truncated ends of the atresia in 14of the 35 cases. Atresia in a vessel was sometimes coupledwith stenosis above the atresia or after the vessel hadbecome reconstituted through collateral flow from vesselssuch as connections from the vertebral plexus, facial veins,EJVs, and thyroid veins. Stenosis and atresia were presentin the same IJV in 14 cases. Aplasia was not observed inthis study.
Stenoses were observed as narrowing in caliber in the
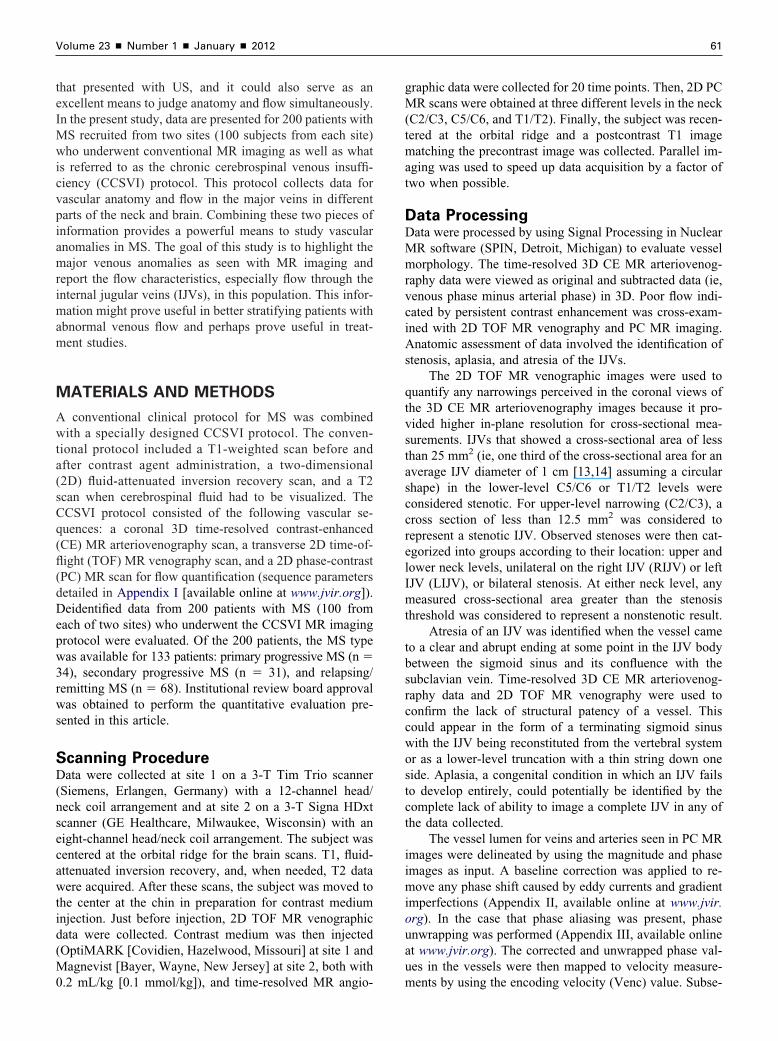
upper and lower neck levels. They could be caused by flctatic carotid arteries or compression by other tissue ashown in Figure 2a and 2b. Although some stenoses ap-eared as region-specific narrowings, others were diffuseith stenotic caliber observed through the entire length of
he IJV (Fig 2c, 2d). Figure 3 shows a 3D CE MR arte-iovenography coronal maximum intensity projection withn apparent stenosis and the transverse 2D TOF MR venog-aphy images from which the cross-sectional areas of theessel lumen were determined. Significant collateral flowathways were observed in some cases with structural ab-ormalities in one or both of the IJVs. Examples of theseighly developed collateral vessels are shown in Figure 4.he high degree of variability in the veins of the neck wasvidenced with vessels such as the deep cervical vein,nterior jugular vein, EJV, and posterior EJV carryingominant outflow.
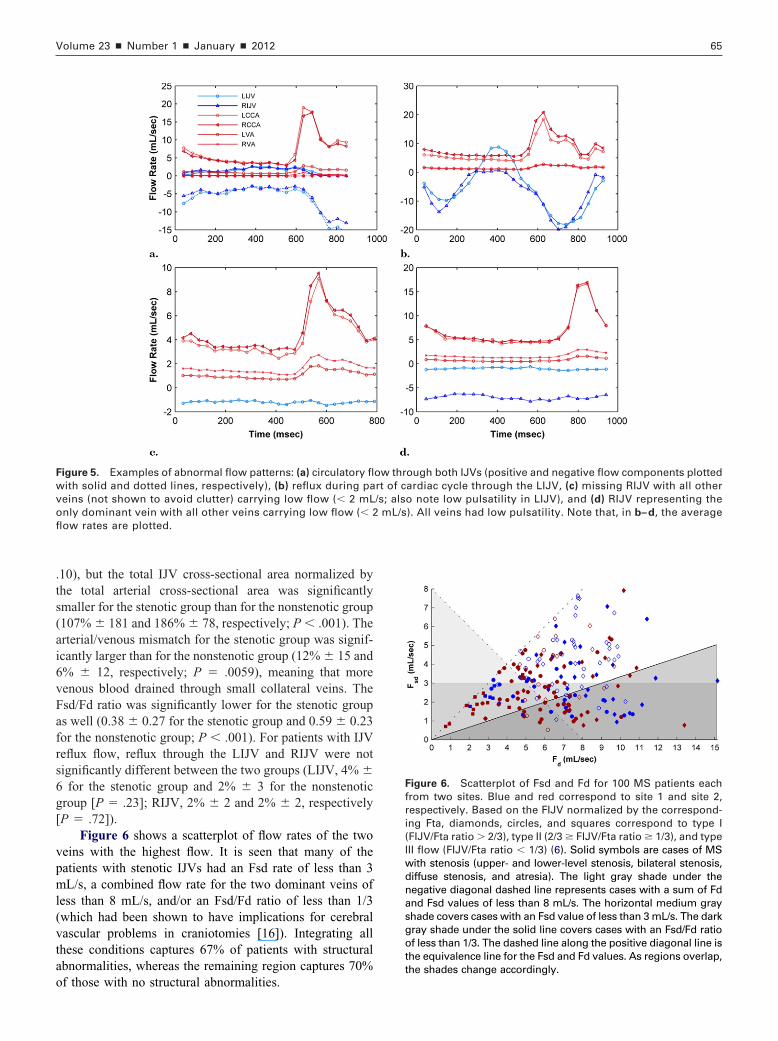
unctional Informationxamples of abnormal flow patterns, including circulatoryow in an IJV, reflux in an IJV, low flow rates in all veins,nd only one dominant vein are shown in Figure 5.
The key quantitative flow measurements are detailed inppendixes VI and VII (available online at www.jvir.org).ajor findings were as follows. The blood flow through the
eft CCA was found to be similar to that through the rightCA for the population of site 1 (P � .44) and greater than
hat through the right CCA for the population of site 2 (P �04). The flow through the RIJV was significantly greaterhan that through the LIJV (P � .001 for both sites), whichs consistent with the findings of others (8). The averageercentages of total IJV blood flow normalized to totalrterial flow (Fta) for the two sites were �67% � 21 at siteand �58% � 23 at site 2. In comparison, the average
ercentages of IJV blood flow normalized to total venous
Table. Anatomic Assessment of Patients with MS(N � 200)
Anatomy
Site
1 (n � 100) 2 (n � 100)
Stenotic 56 80
Unilateral lower neck 9 (16) 29 (36)
Unilateral upper neck 21 (38) 28 (35)
Bilateral lower neck 8 (14) 19 (24)
Bilateral upper neck 7 (13) 9 (11)
Diffuse stenosis 6 (11) 7 (9)
Atresia 18 (32) 17 (21)
Aplasia 0 0
Nonstenotic 44 20
Note.—Values in parentheses are percentages. Patients mayhave multiple forms of stenosis, and therefore the sum ofindividually counted numbers for all subcategories is greaterthan the total number of patients with stenosis.
ow were 70% � 20 at site 1 and 66% � 22 at site 2. The
wLO
cdv35
pd
vssp
acaslL le the
Volume 23 � Number 1 � January � 2012 63
arterial/venous mismatches, which reflect how much ve-nous blood was flowing out of the brain through small veinsand collateral veins, were measured at 6% � 12 and 13% �15, respectively. The ratios of subdominant venous flowrate (Fsd) to dominant venous flow rate (Fd) were 0.52 �0.24 and 0.52 � 0.26, respectively. Reflux flow percentages
ere found to be 4% � 5 and 2% � 3, respectively, for theIJV and 2% � 2 and 1% � 1, respectively, for the RIJV.
Figure 1. Coronal maximum-intensity projections (MIPs) of timarious forms of atresia for IJVs. Before the MIPs were created,trongest venous phase to remove the arterial signal for betterhows that the RIJV is malformed at the midneck level (lonlexuses (short arrow). (b) In a patient from site 1, 96-slice MIP
level with the sigmoid sinuses draining into the vertebral plexplexuses and the common facial veins near the midneck level,a patient from site 2, 64-slice MIP shows that the LIJV is trubetween the midneck level and the inferior jugular bulb near thfrom site 2, 84-slice MIP shows that both IJVs show continulevel but are truncated near the midneck level (long arrows).the midneck level and the inferior jugular bulb (short arrow).subclavian vein.
Figure 2. Coronal MIPs of time-resolved 3D CE MR arteriovenobserved in MS. (b–d) Arterial signals were removed by subtractn example of carotid ectasia in which the left internal carotidompression more clearly. (c) In a patient from site 1, 96-slice MIrrow) whereas the RIJV shows stenosis at the lower neck level (tenosis in the LIJV (long arrow) with asymmetrical enhancematter enhancement might be considered as a representation oIJV. (In this case the LIJV carried a flow of only 1.31 mL/s whi
f interest in the study of stenosis is the fact that the vessel m
ross-sectional area (measured from vessel lumen contoursrawn on PC MR imaging data) was found to have moreariability than the vessel flow rate: 59 � 38 mm2 and 47 �9 mm2, respectively, for the LIJV and 78 mm2 � 47 and7 mm2 � 52, respectively, for the RIJV.
To further assess the flow characteristics for the MSopulations, all subjects from both sites were combined andivided into stenotic and nonstenotic groups. Several flow
lved 3D CE MR arteriovenography data from four patients showof the early arterial phase were subtracted from images of the
vation of the veins. (a) In a patient from site 1, a 96-slice MIPw) with the right sigmoid sinus draining into the vertebrals that both IJVs are truncated at the upper neck (long arrows)short arrows). The IJVs received branches from the vertebralreconstituted caliber size through the lower neck level. (c) In
d at the midneck level (long arrow) with a thin connectionfluence with the subclavian vein (short arrow). (d) In a patienthancement from the sigmoid sinus through the upper neckconnection is seen in the LIJV between the truncated end at
IJV shows no connection between the midneck level and the
hy data show various forms of stenoses of the IJVs (arrows)arterial phase. (a,b) In a patient from site 1, 96-slice MIP shows
y is compressing the LIJV. The subtracted data (b) show theates that the LIJV shows diffuse stenosis at all neck levels (longrrow). (d) In a patient from site 2, 76-slice MIP shows string-likethe vertebral plexuses on the affected side (short arrow). Theevelopment of collateral flow caused by restricted flow in theRIJV carried a flow of 7.94 mL/s.)
e-resoimages
obserg arro
showuses (whichncatee con
ous enA thinThe R
ograping the
arterP indicshort aent off the d
easures suggested that there were significant differences

trab
a
venog
ov
adh
64 � Abnormal IJV Flow Distribution in MS with Venous Abnormalities Haacke et al � JVIR
between the two groups. Although the Fta rates were notsignificantly different (15.00 mL/s � 2.95 for the stenoticgroup and 14.84 mL/s � 2.73 for the non-stenotic group;P � .71), the total IJV flow (FIJV) rates normalized by Fta
Figure 3. Coronal MIP of time-resolved 3D CE MR arteriovenolocalized to show the appearance of tight stenosis on different imwith the arterial signals removed by subtracting the arterial phreveals the cross-sectional area information in the transverse vin a. Arrows indicate the LIJV in each transverse image. The LIJrea of 22 mm2 and a more severe stenosis near the midneck l
vein drains into the LIJV superior to the severe stenosis (d). Tenhancement on 3D CE MR arteriovenography can show a cleardata, in part because of the inherent sensitivity of 2D TOF MR
Figure 4. Coronal MIPs of time-resolved 3D CE MR arterioventher than the IJVs showed large calibers (short arrows). Arterialenous structures. (a) In a patient from site 1, 96-slice MIP indic
a narrow caliber near the confluence with the subclavian vein.with the LIJV. (b) In a patient from site 1, 96-slice MIP indicatessinus draining into the vertebral plexus. The RIJV shows stenosi(short arrows) show large caliber and strong enhancement. (c)
narrow caliber near the confluence with the subclavian vein. Thpatient from site 2, 68-slice MIP indicates that the RIJV show
raining into the vertebral plexus. The right and left EJVs (shortaving a dilated caliber.
rate for the stenotic group were significantly lower than g
hose for the nonstenotic group (56% � 22 and 77% � 14,espectively; P � .001). Similarly, the total cross-sectionalreas of all the arteries were not significantly differentetween the two groups (96 mm2 � 21 for the stenotic
data with corresponding axial 2D TOF MR venography slicesmethods. (a) MIP (96 slices) of 3D MR arteriovenography data
a patient from site 1. (b–e) Axial 2D TOF MR venography datar all major veins in the neck corresponding to the lines shownws a stenosis at the lower neck level (b) with a cross-sectional) with a cross-sectional area of 6 mm2. The left common facialse demonstrates that a tight stenosis that showed little or noand caliber on the high-resolution axial 2D TOF MR venographyraphy to very slow flow.
hy data show collateral venous development whereby vesselsls were removed by subtracting the arterial phase to better viewat the LIJV shows a narrow caliber near the sigmoid sinus andht and left EJVs (short arrows) show large calibers comparede LIJV shows atresia at the upper neck level with the sigmoid
e upper neck level. The left EJV and the right deep cervical veinatient from site 2, 72-slice MIP indicates that the LIJV shows aanterior jugular vein shows a large caliber (short arrow). (d) Inia at the upper neck level (long arrow) with the sigmoid sinus) show large caliber and strong enhancement, with the left EJV
graphyaging
ase iniew foV sho
evel (c
his casignal
ograpsigna
ates thThe rigthat ths at thIn a pe left
s atresarrows
roup and 91 mm2 � 18 for the non-stenotic group; P �
F
fri(Iwdnasgotthe shades change accordingly.
vofl
Volume 23 � Number 1 � January � 2012 65
.10), but the total IJV cross-sectional area normalized bythe total arterial cross-sectional area was significantlysmaller for the stenotic group than for the nonstenotic group(107% � 181 and 186% � 78, respectively; P � .001). Thearterial/venous mismatch for the stenotic group was signif-icantly larger than for the nonstenotic group (12% � 15 and6% � 12, respectively; P � .0059), meaning that morevenous blood drained through small collateral veins. TheFsd/Fd ratio was significantly lower for the stenotic groupas well (0.38 � 0.27 for the stenotic group and 0.59 � 0.23for the nonstenotic group; P � .001). For patients with IJVreflux flow, reflux through the LIJV and RIJV were notsignificantly different between the two groups (LIJV, 4% �6 for the stenotic group and 2% � 3 for the nonstenoticgroup [P � .23]; RIJV, 2% � 2 and 2% � 2, respectively[P � .72]).
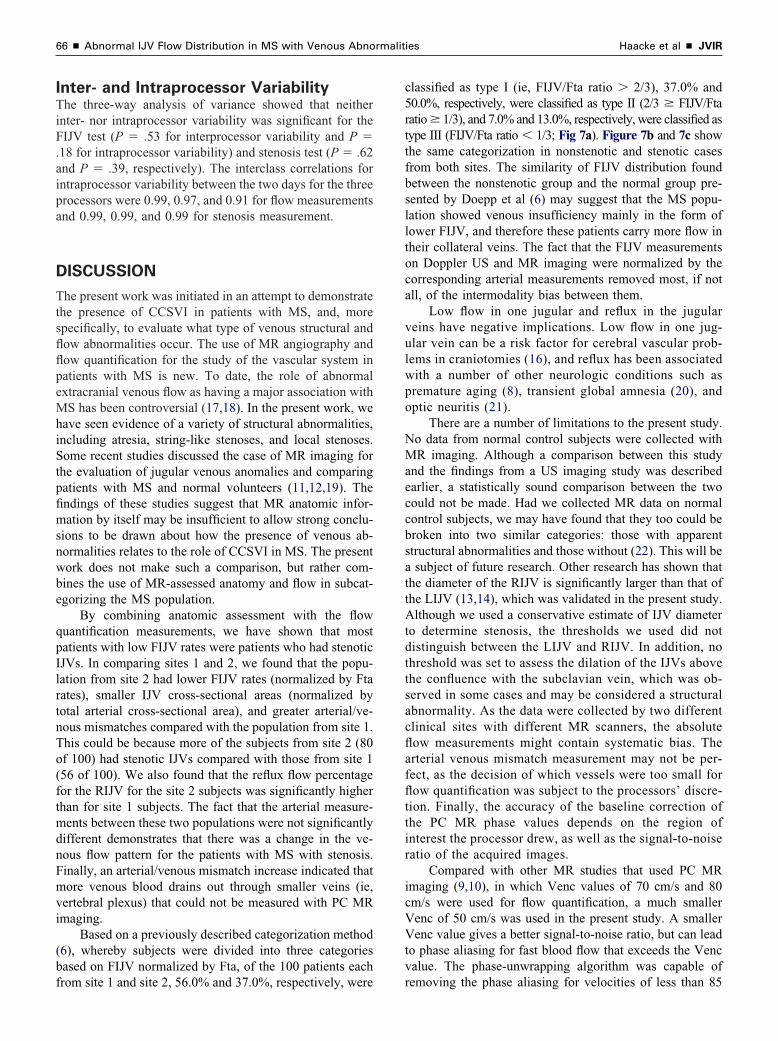
Figure 6 shows a scatterplot of flow rates of the twoveins with the highest flow. It is seen that many of thepatients with stenotic IJVs had an Fsd rate of less than 3mL/s, a combined flow rate for the two dominant veins ofless than 8 mL/s, and/or an Fsd/Fd ratio of less than 1/3(which had been shown to have implications for cerebralvascular problems in craniotomies [16]). Integrating allthese conditions captures 67% of patients with structuralabnormalities, whereas the remaining region captures 70%
Figure 5. Examples of abnormal flow patterns: (a) circulatory flwith solid and dotted lines, respectively), (b) reflux during pa
eins (not shown to avoid clutter) carrying low flow (� 2 mLnly dominant vein with all other veins carrying low flow (� 2ow rates are plotted.
of those with no structural abnormalities.
igure 6. Scatterplot of Fsd and Fd for 100 MS patients eachrom two sites. Blue and red correspond to site 1 and site 2,espectively. Based on the FIJV normalized by the correspond-ng Fta, diamonds, circles, and squares correspond to type IFIJV/Fta ratio � 2/3), type II (2/3 � FIJV/Fta ratio � 1/3), and typeII flow (FIJV/Fta ratio � 1/3) (6). Solid symbols are cases of MSith stenosis (upper- and lower-level stenosis, bilateral stenosis,iffuse stenosis, and atresia). The light gray shade under theegative diagonal dashed line represents cases with a sum of Fdnd Fsd values of less than 8 mL/s. The horizontal medium grayhade covers cases with an Fsd value of less than 3 mL/s. The darkray shade under the solid line covers cases with an Fsd/Fd ratiof less than 1/3. The dashed line along the positive diagonal line ishe equivalence line for the Fsd and Fd values. As regions overlap,
ow through both IJVs (positive and negative flow components plottedrt of cardiac cycle through the LIJV, (c) missing RIJV with all other/s; also note low pulsatility in LIJV), and (d) RIJV representing the
mL/s). All veins had low pulsatility. Note that, in b– d, the average
.a
c5rttfbslltoca
vulwpo
NMaeccbsattAtdttsacflafflttir
icVVtv
66 � Abnormal IJV Flow Distribution in MS with Venous Abnormalities Haacke et al � JVIR
Inter- and Intraprocessor VariabilityThe three-way analysis of variance showed that neitherinter- nor intraprocessor variability was significant for theFIJV test (P � .53 for interprocessor variability and P �18 for intraprocessor variability) and stenosis test (P � .62nd P � .39, respectively). The interclass correlations for
intraprocessor variability between the two days for the threeprocessors were 0.99, 0.97, and 0.91 for flow measurementsand 0.99, 0.99, and 0.99 for stenosis measurement.
DISCUSSION
The present work was initiated in an attempt to demonstratethe presence of CCSVI in patients with MS, and, morespecifically, to evaluate what type of venous structural andflow abnormalities occur. The use of MR angiography andflow quantification for the study of the vascular system inpatients with MS is new. To date, the role of abnormalextracranial venous flow as having a major association withMS has been controversial (17,18). In the present work, wehave seen evidence of a variety of structural abnormalities,including atresia, string-like stenoses, and local stenoses.Some recent studies discussed the case of MR imaging forthe evaluation of jugular venous anomalies and comparingpatients with MS and normal volunteers (11,12,19). Thefindings of these studies suggest that MR anatomic infor-mation by itself may be insufficient to allow strong conclu-sions to be drawn about how the presence of venous ab-normalities relates to the role of CCSVI in MS. The presentwork does not make such a comparison, but rather com-bines the use of MR-assessed anatomy and flow in subcat-egorizing the MS population.
By combining anatomic assessment with the flowquantification measurements, we have shown that mostpatients with low FIJV rates were patients who had stenoticIJVs. In comparing sites 1 and 2, we found that the popu-lation from site 2 had lower FIJV rates (normalized by Ftarates), smaller IJV cross-sectional areas (normalized bytotal arterial cross-sectional area), and greater arterial/ve-nous mismatches compared with the population from site 1.This could be because more of the subjects from site 2 (80of 100) had stenotic IJVs compared with those from site 1(56 of 100). We also found that the reflux flow percentagefor the RIJV for the site 2 subjects was significantly higherthan for site 1 subjects. The fact that the arterial measure-ments between these two populations were not significantlydifferent demonstrates that there was a change in the ve-nous flow pattern for the patients with MS with stenosis.Finally, an arterial/venous mismatch increase indicated thatmore venous blood drains out through smaller veins (ie,vertebral plexus) that could not be measured with PC MRimaging.
Based on a previously described categorization method(6), whereby subjects were divided into three categoriesbased on FIJV normalized by Fta, of the 100 patients each
from site 1 and site 2, 56.0% and 37.0%, respectively, were rlassified as type I (ie, FIJV/Fta ratio � 2/3), 37.0% and0.0%, respectively, were classified as type II (2/3 � FIJV/Ftaatio � 1/3), and 7.0% and 13.0%, respectively, were classified asype III (FIJV/Fta ratio � 1/3; Fig 7a). Figure 7b and 7c showhe same categorization in nonstenotic and stenotic casesrom both sites. The similarity of FIJV distribution foundetween the nonstenotic group and the normal group pre-ented by Doepp et al (6) may suggest that the MS popu-ation showed venous insufficiency mainly in the form ofower FIJV, and therefore these patients carry more flow inheir collateral veins. The fact that the FIJV measurementsn Doppler US and MR imaging were normalized by theorresponding arterial measurements removed most, if notll, of the intermodality bias between them.
Low flow in one jugular and reflux in the jugulareins have negative implications. Low flow in one jug-lar vein can be a risk factor for cerebral vascular prob-ems in craniotomies (16), and reflux has been associatedith a number of other neurologic conditions such asremature aging (8), transient global amnesia (20), andptic neuritis (21).
There are a number of limitations to the present study.o data from normal control subjects were collected withR imaging. Although a comparison between this study
nd the findings from a US imaging study was describedarlier, a statistically sound comparison between the twoould not be made. Had we collected MR data on normalontrol subjects, we may have found that they too could beroken into two similar categories: those with apparenttructural abnormalities and those without (22). This will besubject of future research. Other research has shown that
he diameter of the RIJV is significantly larger than that ofhe LIJV (13,14), which was validated in the present study.lthough we used a conservative estimate of IJV diameter
o determine stenosis, the thresholds we used did notistinguish between the LIJV and RIJV. In addition, nohreshold was set to assess the dilation of the IJVs abovehe confluence with the subclavian vein, which was ob-erved in some cases and may be considered a structuralbnormality. As the data were collected by two differentlinical sites with different MR scanners, the absoluteow measurements might contain systematic bias. Therterial venous mismatch measurement may not be per-ect, as the decision of which vessels were too small forow quantification was subject to the processors’ discre-
ion. Finally, the accuracy of the baseline correction ofhe PC MR phase values depends on the region ofnterest the processor drew, as well as the signal-to-noiseatio of the acquired images.
Compared with other MR studies that used PC MRmaging (9,10), in which Venc values of 70 cm/s and 80m/s were used for flow quantification, a much smallerenc of 50 cm/s was used in the present study. A smallerenc value gives a better signal-to-noise ratio, but can lead
o phase aliasing for fast blood flow that exceeds the Vencalue. The phase-unwrapping algorithm was capable of
emoving the phase aliasing for velocities of less than 85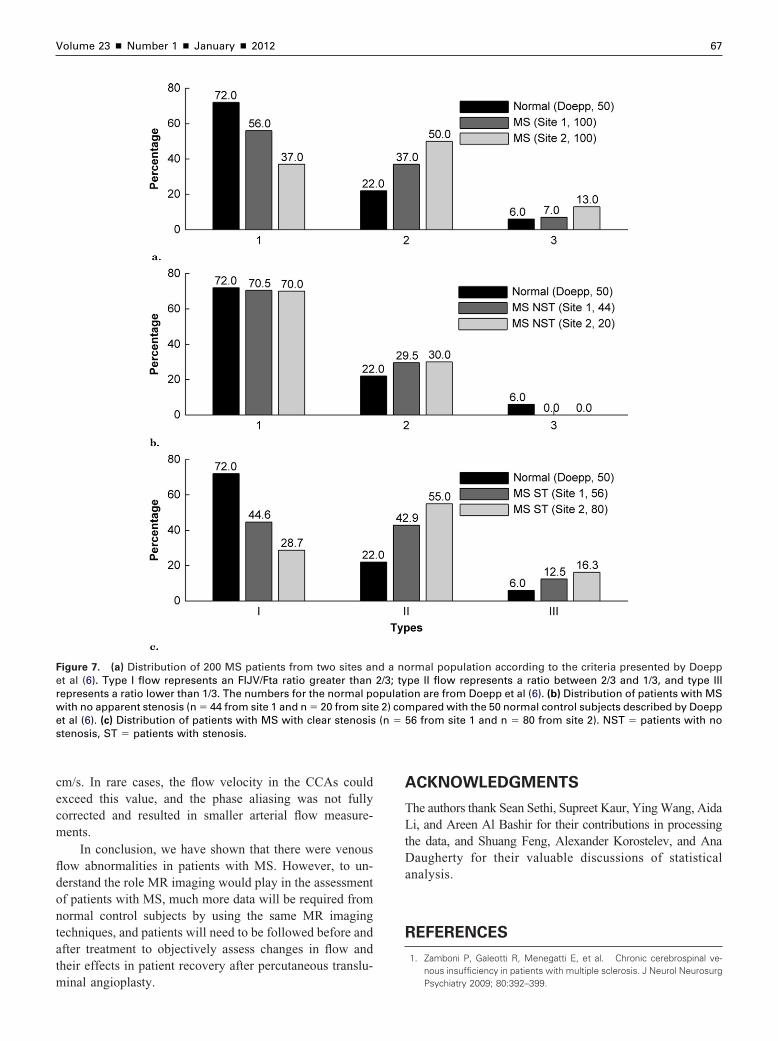
A
TLtDa
R
e
Volume 23 � Number 1 � January � 2012 67
cm/s. In rare cases, the flow velocity in the CCAs couldexceed this value, and the phase aliasing was not fullycorrected and resulted in smaller arterial flow measure-ments.
In conclusion, we have shown that there were venousflow abnormalities in patients with MS. However, to un-derstand the role MR imaging would play in the assessmentof patients with MS, much more data will be required fromnormal control subjects by using the same MR imagingtechniques, and patients will need to be followed before andafter treatment to objectively assess changes in flow andtheir effects in patient recovery after percutaneous translu-
Figure 7. (a) Distribution of 200 MS patients from two sites anet al (6). Type I flow represents an FIJV/Fta ratio greater thanrepresents a ratio lower than 1/3. The numbers for the normal powith no apparent stenosis (n � 44 from site 1 and n � 20 from sitet al (6). (c) Distribution of patients with MS with clear stenosis
stenosis, ST � patients with stenosis.
minal angioplasty.
CKNOWLEDGMENTS
he authors thank Sean Sethi, Supreet Kaur, Ying Wang, Aidai, and Areen Al Bashir for their contributions in processing
he data, and Shuang Feng, Alexander Korostelev, and Anaaugherty for their valuable discussions of statistical
nalysis.
EFERENCES
1. Zamboni P, Galeotti R, Menegatti E, et al. Chronic cerebrospinal ve-nous insufficiency in patients with multiple sclerosis. J Neurol Neurosurg
rmal population according to the criteria presented by Doepppe II flow represents a ratio between 2/3 and 1/3, and type IIIon are from Doepp et al (6). (b) Distribution of patients with MS
pared with the 50 normal control subjects described by Doepp6 from site 1 and n � 80 from site 2). NST � patients with no
d a no2/3; typulati2) com(n � 5
Psychiatry 2009; 80:392–399.
1
1
1
1
1
1
1
1
1
2
2
2
68 � Abnormal IJV Flow Distribution in MS with Venous Abnormalities Haacke et al � JVIR
2. Singh AV, Zamboni P. Anomalous venous blood flow and iron deposi-tion in multiple sclerosis. J Cereb Blood Flow Metab 2009; 29:1867–1878.
3. Zamboni P, Galeotti R, Menegatti E, et al. A prospective open-labelstudy of endovascular treatment of chronic cerebrospinal venous insuf-ficiency. J Vasc Surg 2009; 50:1348–1358.
4. Zamboni P, Menegatti E, Galeotti R, et al. The value of cerebral Dopplervenous haemodynamics in the assessment of multiple sclerosis. J Neu-rol Sci 2009; 282:21–27.
5. Zamboni P, Menegatti E, Weinstock-Guttman B, et al. The severity ofchronic cerebrospinal venous insufficiency in patients with multiple scle-rosis is related to altered cerebrospinal fluid dynamics. Funct Neurol2009; 24:133–138.
6. Doepp F, Schreiber SJ, von Munster T, Rademacher J, Klingebiel R,Valdueza JM. How does the blood leave the brain? A systematicultrasound analysis of cerebral venous drainage patterns. Neuroradiology2004; 46:565–570.
7. Doepp F, Paul F, Valdueza JM, Schmierer K, Schreiber SJ. No cerebro-cervical venous congestion in patients with multiple sclerosis. Ann Neu-rol 2010; 68:173–183.
8. Chung CP, Lin YJ, Chao AC, et al. Jugular venous hemodynamicchanges with aging. Ultras Med Biol 2010; 36:1776–1782.
9. Sundstrom P, Wåhlin A, Ambarki K, Birgander R, Eklund A, Malm J.Venous and cerebrospinal fluid flow in multiple sclerosis: a case-controlstudy. Ann Neurol 2010; 68:255–259.
10. Stoquart-Elsankari S, Lehmann P, Villette A, et al. A phase-contrastMRI study of physiologic cerebral venous flow. J Cereb Blood FlowMetabol 2009; 29:1208–1215.
1. Zivadinov R, Galeotti R, Hojnacki D, et al. Value of MR venography fordetection of internal jugular vein anomalies in multiple sclerosis: a pilotlongitudinal study. AJNR Am J Neuroradiol 2011; 32:938–946.
2. Zivadinov R, Lopez-Soriano A, Weinstock-Guttman B, et al. Use of MRvenography for characterization of the extracranial venous system in
patients with multiple sclerosis and healthy control subjects. Radiology2011; 258:562–570.
3. Furukawa S, Nakagawa T, Sakaguchi I, Nishi K. The diameter of theinternal jugular vein studied by autopsy. Rom J Leg Med 2010; 18:125–128.
4. Tartiere D, Seguin P, Juhel C, Laviolle B, Malledant Y. Estimation of thediameter and cross-sectional area of the internal jugular veins in adultpatients. Crit Care 2009; 13:R197.
5. Montgomery DC. Design and analysis of experiments, 5th edition: NewYork: Wiley, 2000.
6. Seoane E, Rhoton AL Jr. Compression of the internal jugular vein bythe transverse process of the atlas as the cause of cerebellar hemor-rhage after supratentorial craniotomy. Surg Neurol 1999; 51:500–505.
7. Khan O, Filippi M, Freedman MS, et al. Chronic cerebrospinal venousinsufficiency and multiple sclerosis. Ann Neurol 2010; 67:286–290.
8. Siskin GP, Haskal ZJ, McLennan G, et al. Development of a researchagenda for evaluation of interventional therapies for chronic cerebrospi-nal venous insufficiency: proceedings from a multidisciplinary researchconsensus panel. J Vasc Interv Radiol 2011; 22:587–593.
9. Zaharchuk G, Fischbein NJ, Rosenberg J, Herfkens RJ, Dake MD.Comparison of MR and contrast venography of the cervical venoussystem in multiple sclerosis. AJNR Am J Neuroradiol 2011; 32:1482–1489.
0. Chung CP, Hsu HY, Chao AC, Sheng WY, Soong BW, Hu HH. Transientglobal amnesia: cerebral venous outflow impairment--insight from theabnormal flow patterns of the internal jugular vein. Ultras Med Biol 2007;33:1727–1735.
1. Hsu HY, Chao AC, Chen YY, et al. Reflux of jugular and retrobulbarvenous flow in transient monocular blindness. Ann Neurol 2008; 63:247–253.
2. Zivadinov R, Marr K, Cutter G, et al. Prevalence, sensitivity, and spec-
ificity of chronic cerebrospinal venous insufficiency in MS. Neurology2011; 77:138–144.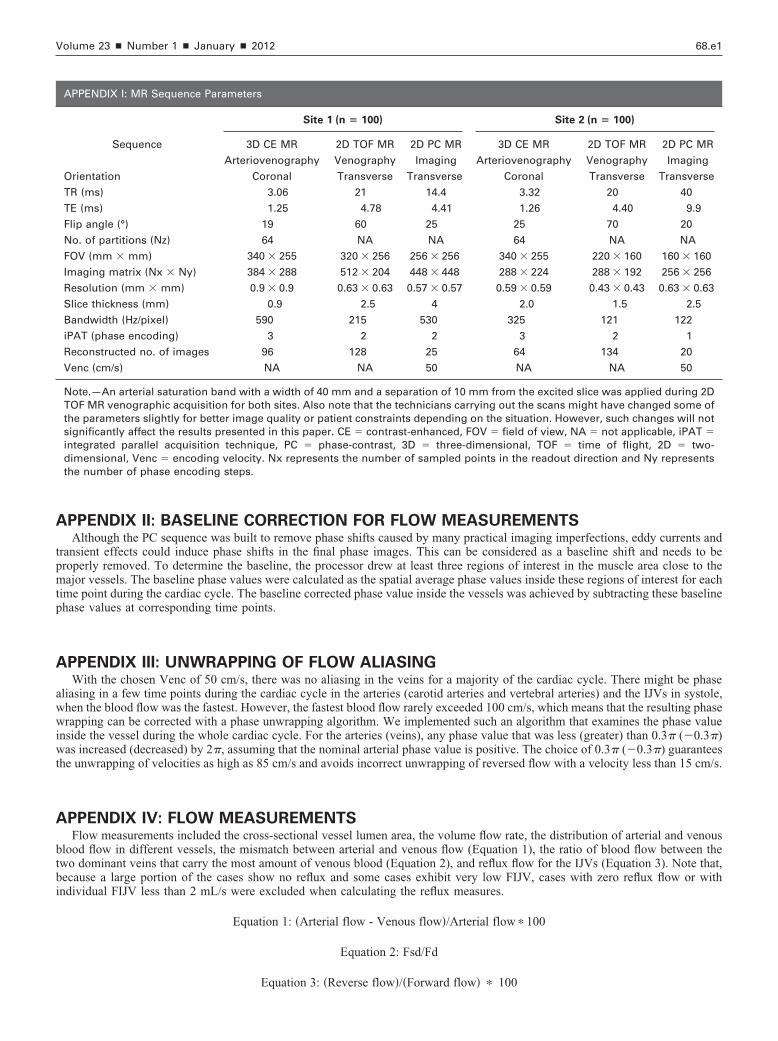
wt
Volume 23 � Number 1 � January � 2012 68.e1
APPENDIX II: BASELINE CORRECTION FOR FLOW MEASUREMENTSAlthough the PC sequence was built to remove phase shifts caused by many practical imaging imperfections, eddy currents and
transient effects could induce phase shifts in the final phase images. This can be considered as a baseline shift and needs to beproperly removed. To determine the baseline, the processor drew at least three regions of interest in the muscle area close to themajor vessels. The baseline phase values were calculated as the spatial average phase values inside these regions of interest for eachtime point during the cardiac cycle. The baseline corrected phase value inside the vessels was achieved by subtracting these baselinephase values at corresponding time points.
APPENDIX III: UNWRAPPING OF FLOW ALIASINGWith the chosen Venc of 50 cm/s, there was no aliasing in the veins for a majority of the cardiac cycle. There might be phase
aliasing in a few time points during the cardiac cycle in the arteries (carotid arteries and vertebral arteries) and the IJVs in systole,when the blood flow was the fastest. However, the fastest blood flow rarely exceeded 100 cm/s, which means that the resulting phasewrapping can be corrected with a phase unwrapping algorithm. We implemented such an algorithm that examines the phase valueinside the vessel during the whole cardiac cycle. For the arteries (veins), any phase value that was less (greater) than 0.3� (�0.3�)
as increased (decreased) by 2�, assuming that the nominal arterial phase value is positive. The choice of 0.3� (�0.3�) guaranteeshe unwrapping of velocities as high as 85 cm/s and avoids incorrect unwrapping of reversed flow with a velocity less than 15 cm/s.
APPENDIX IV: FLOW MEASUREMENTSFlow measurements included the cross-sectional vessel lumen area, the volume flow rate, the distribution of arterial and venous
blood flow in different vessels, the mismatch between arterial and venous flow (Equation 1), the ratio of blood flow between thetwo dominant veins that carry the most amount of venous blood (Equation 2), and reflux flow for the IJVs (Equation 3). Note that,because a large portion of the cases show no reflux and some cases exhibit very low FIJV, cases with zero reflux flow or withindividual FIJV less than 2 mL/s were excluded when calculating the reflux measures.
Equation 1: �Arterial flow - Venous flow�/Arterial flow � 100
Equation 2: Fsd/Fd
APPENDIX I: MR Sequence Parameters
Site 1 (n � 100) Site 2 (n � 100)
Sequence 3D CE MR
Arteriovenography
2D TOF MR
Venography
2D PC MR
Imaging
3D CE MR
Arteriovenography
2D TOF MR
Venography
2D PC MR
Imaging
Orientation Coronal Transverse Transverse Coronal Transverse Transverse
TR (ms) 3.06 21 14.4 3.32 20 40
TE (ms) 1.25 4.78 4.41 1.26 4.40 9.9
Flip angle (°) 19 60 25 25 70 20
No. of partitions (Nz) 64 NA NA 64 NA NA
FOV (mm � mm) 340 � 255 320 � 256 256 � 256 340 � 255 220 � 160 160 � 160
Imaging matrix (Nx � Ny) 384 � 288 512 � 204 448 � 448 288 � 224 288 � 192 256 � 256
Resolution (mm � mm) 0.9 � 0.9 0.63 � 0.63 0.57 � 0.57 0.59 � 0.59 0.43 � 0.43 0.63 � 0.63
Slice thickness (mm) 0.9 2.5 4 2.0 1.5 2.5
Bandwidth (Hz/pixel) 590 215 530 325 121 122
iPAT (phase encoding) 3 2 2 3 2 1
Reconstructed no. of images 96 128 25 64 134 20
Venc (cm/s) NA NA 50 NA NA 50
Note.—An arterial saturation band with a width of 40 mm and a separation of 10 mm from the excited slice was applied during 2DTOF MR venographic acquisition for both sites. Also note that the technicians carrying out the scans might have changed some ofthe parameters slightly for better image quality or patient constraints depending on the situation. However, such changes will notsignificantly affect the results presented in this paper. CE � contrast-enhanced, FOV � field of view, NA � not applicable, iPAT �integrated parallel acquisition technique, PC � phase-contrast, 3D � three-dimensional, TOF � time of flight, 2D � two-dimensional, Venc � encoding velocity. Nx represents the number of sampled points in the readout direction and Ny representsthe number of phase encoding steps.
Equation 3: �Reverse flow�/�Forward flow� � 100

68.e2 � Abnormal IJV Flow Distribution in MS with Venous Abnormalities Haacke et al � JVIR
APPENDIX V: EXPERIMENTAL DESIGN FOR INTER- AND INTRAPROCESSOR
VARIABILITY STUDYTo assess the inter- and intraprocessor variability for both FIJV measurements and IJV cross-sectional area measurements, the
following statistical tests with a randomized complete block design were performed. Four patients were randomly selected from all thepatients (two from site 1 and two from site 2) for variability in FIJV measurement. Another four patients were randomly selected frompatients with apparent stenosis determined from 3D CE MR arteriovenography data for variability in stenosis measurement. In these fourpatients, two had upper-level (ie, C2/C3) stenosis and the other two had lower-level (ie, C5/C6) stenosis. The flow data and the 2D TOFMR venography data were processed by three randomly chosen processors four times independently in 1 day. The same processors thenrepeated the processing on the same cases after 2 weeks. The FIJV rate as a percentage of the Fta rate was calculated for each processingto assess variability in the flow measurements. The cross-sectional area of the RIJV was measured on the 2D TOF MR venography dataat the corresponding C2/C3 or C5/C6 levels. The cross-sectional area was calculated at each stenotic site to assess variability in themeasurements. A three-way analysis of variance was performed with the three factors being processor, patient, and processing day. Theprocessor factor represents interprocessor variability and the processing day factor represents intraprocessor variability.
APPENDIX VI: Flow Measurements Table for 200 MS Patients from 2 Separate Sites (100 Subjects from Each Site)
Measurement Site 1 (n � 100) Site 2 (n � 100)
Age (y) 46.76 � 10.31 48.81 � 10.87
Heart rate (/s) 70.61 � 9.49 71.10 � 12.92
Flow rate (mL/s)
LIJV �3.97 � 2.56 �3.21 � 2.28
RIJV �6.36 � 2.84 �5.05 � 2.93
LCCA 6.22 � 1.36 5.73 � 1.26
RCCA 6.30 � 1.27 5.92 � 1.32
LVA 1.72 � 0.71 1.34 � 0.72
RVA 1.47 � 0.62 1.18 � 0.62
tIJV �10.33 � 3.40 �8.25 � 3.51
tV �14.66 � 2.62 �12.34 � 3.29
tA 15.73 � 2.75 14.17 � 2.81
FD (%)
LIJV/tA �25.56 � 16.21 �23.21 � 17.15
RIJV/tA �40.99 � 18.13 �35.08 � 19.06
LCCA/tA 39.41 � 3.94 40.49 � 4.05
RCCA/tA 40.09 � 4.33 41.76 � 3.97
tLA/tA 50.37 � 4.90 49.91 � 4.76
tRA/tA 49.63 � 4.90 50.09 � 4.76
tIJV/tA �66.54 � 20.94 �58.30 � 22.94
tIJV/tV 70.40 � 19.53 66.15 � 22.21
CSA (mm2)
LIJV 58.78 � 38.08 47.01 � 38.94
RIJV 78.42 � 47.34 57.00 � 51.73
LCCA 32.02 � 7.39 36.02 � 11.40
RCCA 33.98 � 7.72 35.12 � 9.20
LVA 13.15 � 4.32 13.28 � 5.86
RVA 12.26 � 4.38 12.73 � 5.68
tV 221.42 � 81.15 203.00 � 100.40
tA 91.49 � 17.07 97.37 � 22.51
AVM (%) 6.06 � 12.45 13.18 � 14.88
Fsd/Fd 0.52 � 0.24 0.52 � 0.26
Fsdj/Fdj 0.47 � 0.28 0.42 � 0.28
Reflux LIJV (%) 3.61 � 5.28 2.44 � 3.23
Reflux RIJV (%) 1.74 � 1.92 1.27 � 1.30
Note.—Values presented as means � SD. AVM � arterial/venous mismatch, CSA � cross-sectional area, Fd � dominant venousflow rate, FD � flow distribution, Fdj � flow through dominant jugular vein, Fsd � subdominant venous flow rate, Fsdj � flow throughsubdominant jugular vein, LCCA � left common carotid artery, LIJV � left internal jugular vein, LVA � left vertebral artery, MS �multiple sclerosis, RCCA � right common carotid artery, RVA � right vertebral artery, RIJV � right internal jugular vein, tA � total
arteries, tIJV � total internal jugular veins, tLA � total left-sided arteries, tRA � total right-sided arteries, tV � total veins.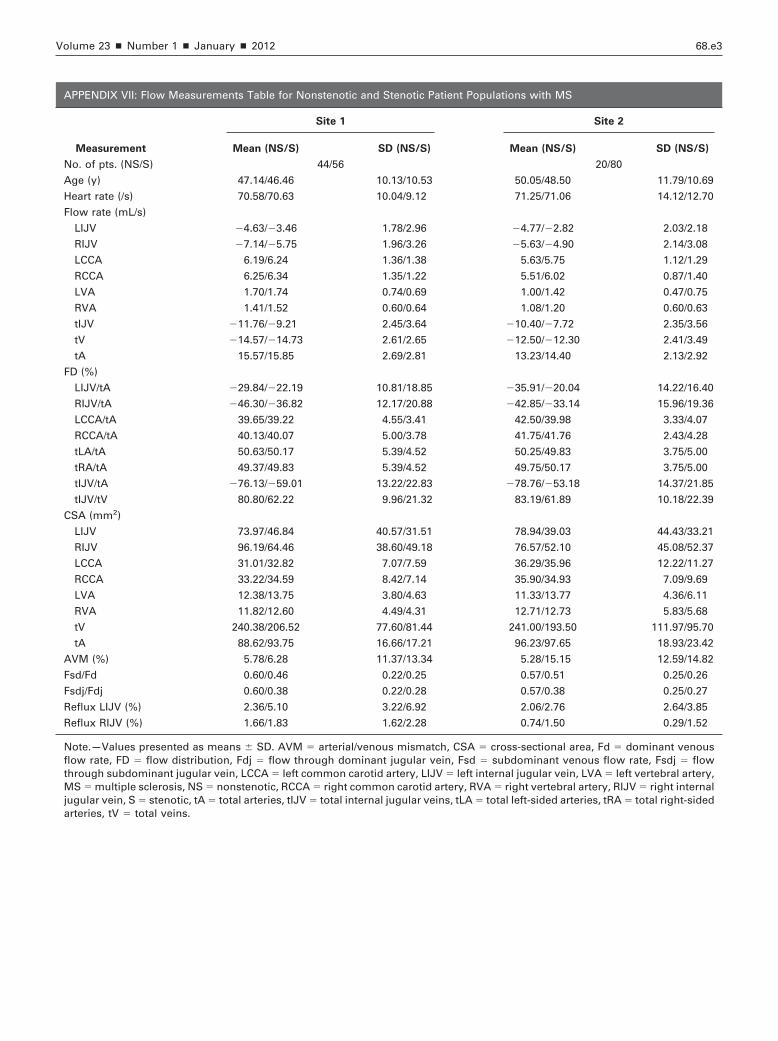
Volume 23 � Number 1 � January � 2012 68.e3
APPENDIX VII: Flow Measurements Table for Nonstenotic and Stenotic Patient Populations with MS
Measurement
Site 1 Site 2
Mean (NS/S) SD (NS/S) Mean (NS/S) SD (NS/S)
No. of pts. (NS/S) 44/56 20/80
Age (y) 47.14/46.46 10.13/10.53 50.05/48.50 11.79/10.69
Heart rate (/s) 70.58/70.63 10.04/9.12 71.25/71.06 14.12/12.70
Flow rate (mL/s)
LIJV �4.63/�3.46 1.78/2.96 �4.77/�2.82 2.03/2.18
RIJV �7.14/�5.75 1.96/3.26 �5.63/�4.90 2.14/3.08
LCCA 6.19/6.24 1.36/1.38 5.63/5.75 1.12/1.29
RCCA 6.25/6.34 1.35/1.22 5.51/6.02 0.87/1.40
LVA 1.70/1.74 0.74/0.69 1.00/1.42 0.47/0.75
RVA 1.41/1.52 0.60/0.64 1.08/1.20 0.60/0.63
tIJV �11.76/�9.21 2.45/3.64 �10.40/�7.72 2.35/3.56
tV �14.57/�14.73 2.61/2.65 �12.50/�12.30 2.41/3.49
tA 15.57/15.85 2.69/2.81 13.23/14.40 2.13/2.92
FD (%)
LIJV/tA �29.84/�22.19 10.81/18.85 �35.91/�20.04 14.22/16.40
RIJV/tA �46.30/�36.82 12.17/20.88 �42.85/�33.14 15.96/19.36
LCCA/tA 39.65/39.22 4.55/3.41 42.50/39.98 3.33/4.07
RCCA/tA 40.13/40.07 5.00/3.78 41.75/41.76 2.43/4.28
tLA/tA 50.63/50.17 5.39/4.52 50.25/49.83 3.75/5.00
tRA/tA 49.37/49.83 5.39/4.52 49.75/50.17 3.75/5.00
tIJV/tA �76.13/�59.01 13.22/22.83 �78.76/�53.18 14.37/21.85
tIJV/tV 80.80/62.22 9.96/21.32 83.19/61.89 10.18/22.39
CSA (mm2)
LIJV 73.97/46.84 40.57/31.51 78.94/39.03 44.43/33.21
RIJV 96.19/64.46 38.60/49.18 76.57/52.10 45.08/52.37
LCCA 31.01/32.82 7.07/7.59 36.29/35.96 12.22/11.27
RCCA 33.22/34.59 8.42/7.14 35.90/34.93 7.09/9.69
LVA 12.38/13.75 3.80/4.63 11.33/13.77 4.36/6.11
RVA 11.82/12.60 4.49/4.31 12.71/12.73 5.83/5.68
tV 240.38/206.52 77.60/81.44 241.00/193.50 111.97/95.70
tA 88.62/93.75 16.66/17.21 96.23/97.65 18.93/23.42
AVM (%) 5.78/6.28 11.37/13.34 5.28/15.15 12.59/14.82
Fsd/Fd 0.60/0.46 0.22/0.25 0.57/0.51 0.25/0.26
Fsdj/Fdj 0.60/0.38 0.22/0.28 0.57/0.38 0.25/0.27
Reflux LIJV (%) 2.36/5.10 3.22/6.92 2.06/2.76 2.64/3.85
Reflux RIJV (%) 1.66/1.83 1.62/2.28 0.74/1.50 0.29/1.52
Note.—Values presented as means � SD. AVM � arterial/venous mismatch, CSA � cross-sectional area, Fd � dominant venousflow rate, FD � flow distribution, Fdj � flow through dominant jugular vein, Fsd � subdominant venous flow rate, Fsdj � flowthrough subdominant jugular vein, LCCA � left common carotid artery, LIJV � left internal jugular vein, LVA � left vertebral artery,MS � multiple sclerosis, NS � nonstenotic, RCCA � right common carotid artery, RVA � right vertebral artery, RIJV � right internaljugular vein, S � stenotic, tA � total arteries, tIJV � total internal jugular veins, tLA � total left-sided arteries, tRA � total right-sided
arteries, tV � total veins.