Patient Characteristics as Predictors of Image Quality and Diagnostic Accuracy of MDCT Compared With...
21
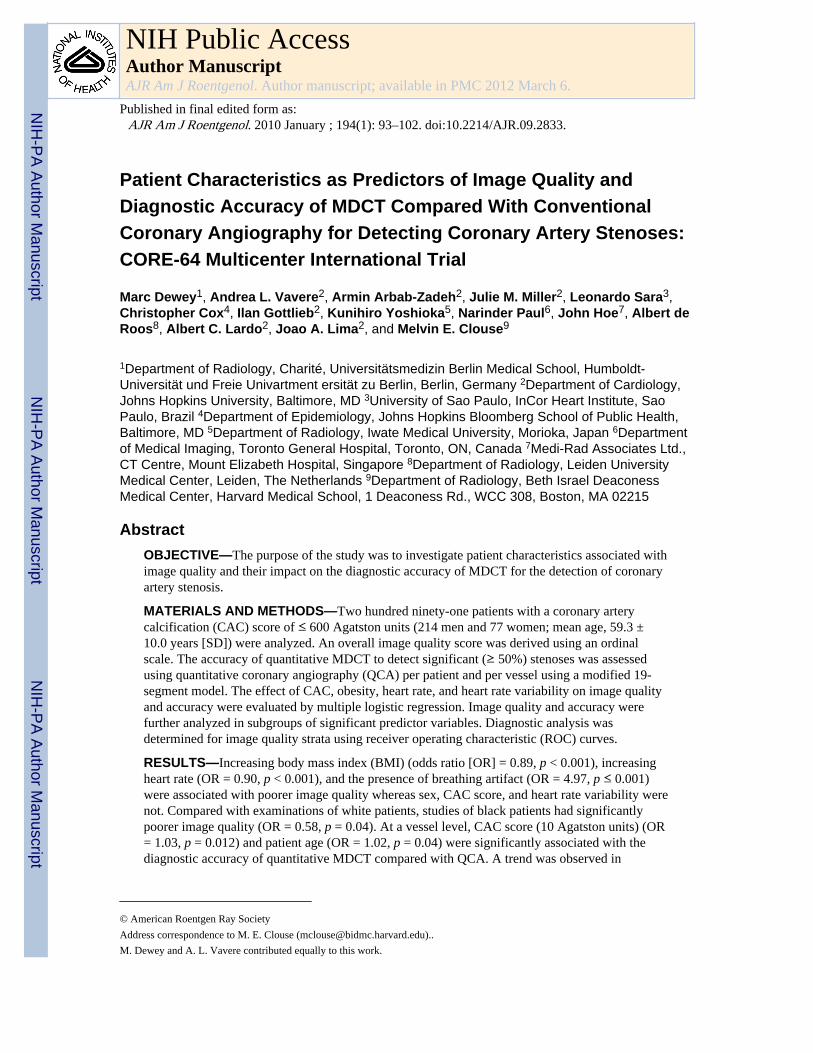
Patient Characteristics as Predictors of Image Quality and Diagnostic Accuracy of MDCT Compared With Conventional Coronary Angiography for Detecting Coronary Artery Stenoses: CORE-64 Multicenter International Trial Marc Dewey 1 , Andrea L. Vavere 2 , Armin Arbab-Zadeh 2 , Julie M. Miller 2 , Leonardo Sara 3 , Christopher Cox 4 , Ilan Gottlieb 2 , Kunihiro Yoshioka 5 , Narinder Paul 6 , John Hoe 7 , Albert de Roos 8 , Albert C. Lardo 2 , Joao A. Lima 2 , and Melvin E. Clouse 9 1 Department of Radiology, Charité, Universitätsmedizin Berlin Medical School, Humboldt- Universität und Freie Univartment ersität zu Berlin, Berlin, Germany 2 Department of Cardiology, Johns Hopkins University, Baltimore, MD 3 University of Sao Paulo, InCor Heart Institute, Sao Paulo, Brazil 4 Department of Epidemiology, Johns Hopkins Bloomberg School of Public Health, Baltimore, MD 5 Department of Radiology, Iwate Medical University, Morioka, Japan 6 Department of Medical Imaging, Toronto General Hospital, Toronto, ON, Canada 7 Medi-Rad Associates Ltd., CT Centre, Mount Elizabeth Hospital, Singapore 8 Department of Radiology, Leiden University Medical Center, Leiden, The Netherlands 9 Department of Radiology, Beth Israel Deaconess Medical Center, Harvard Medical School, 1 Deaconess Rd., WCC 308, Boston, MA 02215 Abstract OBJECTIVE—The purpose of the study was to investigate patient characteristics associated with image quality and their impact on the diagnostic accuracy of MDCT for the detection of coronary artery stenosis. MATERIALS AND METHODS—Two hundred ninety-one patients with a coronary artery calcification (CAC) score of ≤ 600 Agatston units (214 men and 77 women; mean age, 59.3 ± 10.0 years [SD]) were analyzed. An overall image quality score was derived using an ordinal scale. The accuracy of quantitative MDCT to detect significant (≥ 50%) stenoses was assessed using quantitative coronary angiography (QCA) per patient and per vessel using a modified 19- segment model. The effect of CAC, obesity, heart rate, and heart rate variability on image quality and accuracy were evaluated by multiple logistic regression. Image quality and accuracy were further analyzed in subgroups of significant predictor variables. Diagnostic analysis was determined for image quality strata using receiver operating characteristic (ROC) curves. RESULTS—Increasing body mass index (BMI) (odds ratio [OR] = 0.89, p < 0.001), increasing heart rate (OR = 0.90, p < 0.001), and the presence of breathing artifact (OR = 4.97, p ≤ 0.001) were associated with poorer image quality whereas sex, CAC score, and heart rate variability were not. Compared with examinations of white patients, studies of black patients had significantly poorer image quality (OR = 0.58, p = 0.04). At a vessel level, CAC score (10 Agatston units) (OR = 1.03, p = 0.012) and patient age (OR = 1.02, p = 0.04) were significantly associated with the diagnostic accuracy of quantitative MDCT compared with QCA. A trend was observed in © American Roentgen Ray Society Address correspondence to M. E. Clouse ([email protected]).. M. Dewey and A. L. Vavere contributed equally to this work. NIH Public Access Author Manuscript AJR Am J Roentgenol. Author manuscript; available in PMC 2012 March 6. Published in final edited form as: AJR Am J Roentgenol. 2010 January ; 194(1): 93–102. doi:10.2214/AJR.09.2833. NIH-PA Author Manuscript NIH-PA Author Manuscript NIH-PA Author Manuscript
-
Upload
independent -
Category
Documents
-
view
1 -
download
0
Transcript of Patient Characteristics as Predictors of Image Quality and Diagnostic Accuracy of MDCT Compared With...
Patient Characteristics as Predictors of Image Quality andDiagnostic Accuracy of MDCT Compared With ConventionalCoronary Angiography for Detecting Coronary Artery Stenoses:CORE-64 Multicenter International Trial
Marc Dewey1, Andrea L. Vavere2, Armin Arbab-Zadeh2, Julie M. Miller2, Leonardo Sara3,Christopher Cox4, Ilan Gottlieb2, Kunihiro Yoshioka5, Narinder Paul6, John Hoe7, Albert deRoos8, Albert C. Lardo2, Joao A. Lima2, and Melvin E. Clouse9
1Department of Radiology, Charité, Universitätsmedizin Berlin Medical School, Humboldt-Universität und Freie Univartment ersität zu Berlin, Berlin, Germany 2Department of Cardiology,Johns Hopkins University, Baltimore, MD 3University of Sao Paulo, InCor Heart Institute, SaoPaulo, Brazil 4Department of Epidemiology, Johns Hopkins Bloomberg School of Public Health,Baltimore, MD 5Department of Radiology, Iwate Medical University, Morioka, Japan 6Departmentof Medical Imaging, Toronto General Hospital, Toronto, ON, Canada 7Medi-Rad Associates Ltd.,CT Centre, Mount Elizabeth Hospital, Singapore 8Department of Radiology, Leiden UniversityMedical Center, Leiden, The Netherlands 9Department of Radiology, Beth Israel DeaconessMedical Center, Harvard Medical School, 1 Deaconess Rd., WCC 308, Boston, MA 02215
AbstractOBJECTIVE—The purpose of the study was to investigate patient characteristics associated withimage quality and their impact on the diagnostic accuracy of MDCT for the detection of coronaryartery stenosis.
MATERIALS AND METHODS—Two hundred ninety-one patients with a coronary arterycalcification (CAC) score of ≤ 600 Agatston units (214 men and 77 women; mean age, 59.3 ±10.0 years [SD]) were analyzed. An overall image quality score was derived using an ordinalscale. The accuracy of quantitative MDCT to detect significant (≥ 50%) stenoses was assessedusing quantitative coronary angiography (QCA) per patient and per vessel using a modified 19-segment model. The effect of CAC, obesity, heart rate, and heart rate variability on image qualityand accuracy were evaluated by multiple logistic regression. Image quality and accuracy werefurther analyzed in subgroups of significant predictor variables. Diagnostic analysis wasdetermined for image quality strata using receiver operating characteristic (ROC) curves.
RESULTS—Increasing body mass index (BMI) (odds ratio [OR] = 0.89, p < 0.001), increasingheart rate (OR = 0.90, p < 0.001), and the presence of breathing artifact (OR = 4.97, p ≤ 0.001)were associated with poorer image quality whereas sex, CAC score, and heart rate variability werenot. Compared with examinations of white patients, studies of black patients had significantlypoorer image quality (OR = 0.58, p = 0.04). At a vessel level, CAC score (10 Agatston units) (OR= 1.03, p = 0.012) and patient age (OR = 1.02, p = 0.04) were significantly associated with thediagnostic accuracy of quantitative MDCT compared with QCA. A trend was observed in
© American Roentgen Ray SocietyAddress correspondence to M. E. Clouse ([email protected])..M. Dewey and A. L. Vavere contributed equally to this work.
NIH Public AccessAuthor ManuscriptAJR Am J Roentgenol. Author manuscript; available in PMC 2012 March 6.
Published in final edited form as:AJR Am J Roentgenol. 2010 January ; 194(1): 93–102. doi:10.2214/AJR.09.2833.
NIH
-PA Author Manuscript
NIH
-PA Author Manuscript
NIH
-PA Author Manuscript
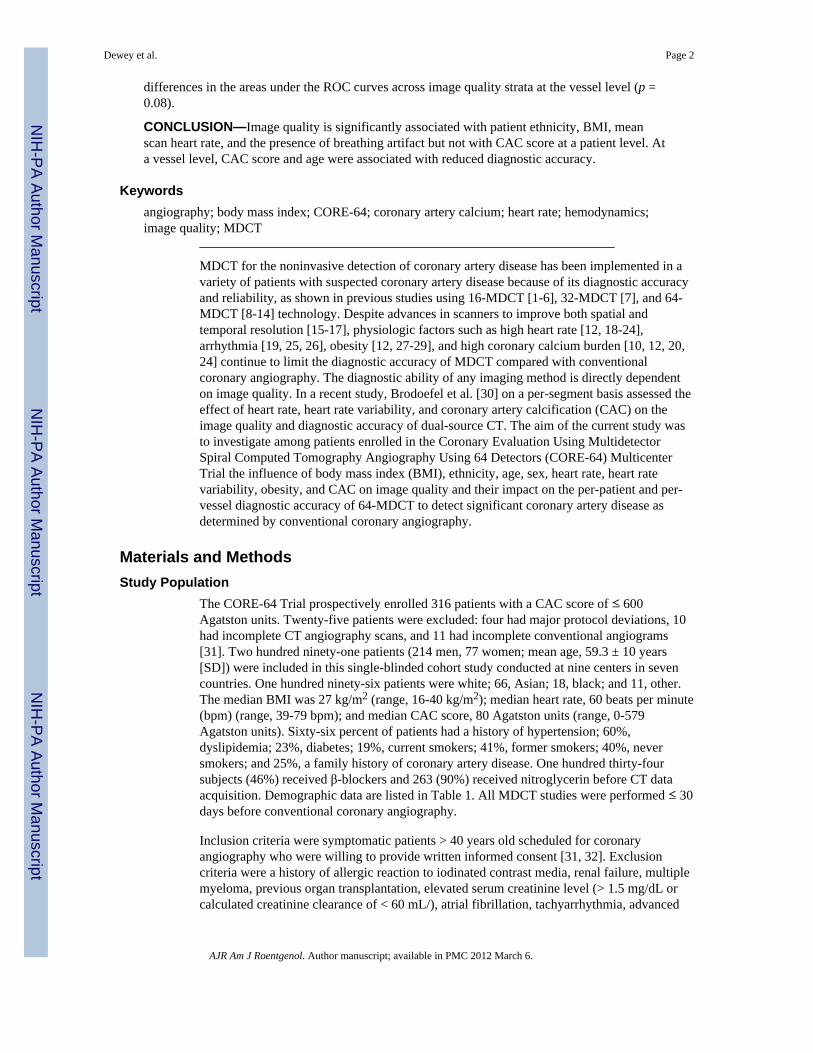
differences in the areas under the ROC curves across image quality strata at the vessel level (p =0.08).
CONCLUSION—Image quality is significantly associated with patient ethnicity, BMI, meanscan heart rate, and the presence of breathing artifact but not with CAC score at a patient level. Ata vessel level, CAC score and age were associated with reduced diagnostic accuracy.
Keywordsangiography; body mass index; CORE-64; coronary artery calcium; heart rate; hemodynamics;image quality; MDCT
MDCT for the noninvasive detection of coronary artery disease has been implemented in avariety of patients with suspected coronary artery disease because of its diagnostic accuracyand reliability, as shown in previous studies using 16-MDCT [1-6], 32-MDCT [7], and 64-MDCT [8-14] technology. Despite advances in scanners to improve both spatial andtemporal resolution [15-17], physiologic factors such as high heart rate [12, 18-24],arrhythmia [19, 25, 26], obesity [12, 27-29], and high coronary calcium burden [10, 12, 20,24] continue to limit the diagnostic accuracy of MDCT compared with conventionalcoronary angiography. The diagnostic ability of any imaging method is directly dependenton image quality. In a recent study, Brodoefel et al. [30] on a per-segment basis assessed theeffect of heart rate, heart rate variability, and coronary artery calcification (CAC) on theimage quality and diagnostic accuracy of dual-source CT. The aim of the current study wasto investigate among patients enrolled in the Coronary Evaluation Using MultidetectorSpiral Computed Tomography Angiography Using 64 Detectors (CORE-64) MulticenterTrial the influence of body mass index (BMI), ethnicity, age, sex, heart rate, heart ratevariability, obesity, and CAC on image quality and their impact on the per-patient and per-vessel diagnostic accuracy of 64-MDCT to detect significant coronary artery disease asdetermined by conventional coronary angiography.
Materials and MethodsStudy Population
The CORE-64 Trial prospectively enrolled 316 patients with a CAC score of ≤ 600Agatston units. Twenty-five patients were excluded: four had major protocol deviations, 10had incomplete CT angiography scans, and 11 had incomplete conventional angiograms[31]. Two hundred ninety-one patients (214 men, 77 women; mean age, 59.3 ± 10 years[SD]) were included in this single-blinded cohort study conducted at nine centers in sevencountries. One hundred ninety-six patients were white; 66, Asian; 18, black; and 11, other.The median BMI was 27 kg/m2 (range, 16-40 kg/m2); median heart rate, 60 beats per minute(bpm) (range, 39-79 bpm); and median CAC score, 80 Agatston units (range, 0-579Agatston units). Sixty-six percent of patients had a history of hypertension; 60%,dyslipidemia; 23%, diabetes; 19%, current smokers; 41%, former smokers; 40%, neversmokers; and 25%, a family history of coronary artery disease. One hundred thirty-foursubjects (46%) received β-blockers and 263 (90%) received nitroglycerin before CT dataacquisition. Demographic data are listed in Table 1. All MDCT studies were performed ≤ 30days before conventional coronary angiography.
Inclusion criteria were symptomatic patients > 40 years old scheduled for coronaryangiography who were willing to provide written informed consent [31, 32]. Exclusioncriteria were a history of allergic reaction to iodinated contrast media, renal failure, multiplemyeloma, previous organ transplantation, elevated serum creatinine level (> 1.5 mg/dL orcalculated creatinine clearance of < 60 mL/), atrial fibrillation, tachyarrhythmia, advanced
Dewey et al. Page 2
AJR Am J Roentgenol. Author manuscript; available in PMC 2012 March 6.
NIH
-PA Author Manuscript
NIH
-PA Author Manuscript
NIH
-PA Author Manuscript
atrioventricular block, evidence of severe symptomatic heart failure (New York HeartAssociation class III or IV), severe aortic stenosis, previous coronary artery bypass or othercardiac surgery, coronary artery intervention within the past 6 months, contraindication to β-blockers, BMI > 40 kg/m2, and presence or history of any condition that the site principalinvestigator considered sufficient for exclusion. The study protocol and informed consentform were approved by the institutional review board of each center as well as a centralizedinstitutional review board at the Johns Hopkins Hospital. The details of the methods of theCORE-64 Trial have been published previously [32]. Here, we present a brief summary ofall methodologic aspects relevant to this analysis of predictors of image quality anddiagnostic accuracy of 64-MDCT angiography (MDCTA).
Calcium Scoring and CT Coronary AngiographyCalcium scanning was performed using prospective ECG gating at 120 kV and 300 mA witha gantry rotation of 0.4 second and detector collimation of 4.0 × 3.0 mm. For the MDCTcoronary angiography, retrospective ECG gating was implemented using gantry rotationtimes of 350-400 milliseconds autoselected to avoid synchrony with the heartbeat to enableefficient adaptive multisegment image reconstruction [33]. On the basis of each patient’sBMI, an acquisition tube current of 240-400 mAs was used with the tube voltage remainingunchanged at 120, as described in detail elsewhere [32], to meet a predetermined sex-specific effective radiation dose of approximately 12-15 mSv not to exceed 20 mSvaccording to the German Federal Department for Radiation Protection. Iopamidol (Isovue370, Bracco Diagnostics) was administered using an 18- or 20-gauge IV line (preferably inthe right brachial veins) with image acquisition triggered automatically at 180 HU in thedescending aorta (bolus-tracking method). The flow of the contrast agent was adjustedaccording to each patient’s weight [32]. The volume in milliliters of contrast agentadministered for the helical CT acquisition was also calculated individually for each patientusing the following formula: volume (in mL) = [(CT data acquisition time in seconds + 10)× flow in mL/s] [32].
Images were acquired during one breath-hold. All images were acquired using a 64 × 0.5mm MDCT scanner (Aquilion 64, Toshiba Medical Systems). Beta-blockers were givenwhen the resting heart rate was > 70 bpm to reduce it to < 65 bpm. If the mean heart ratecould not be reduced to < 80 bpm before or during image acquisition, the patient wasexcluded from the primary analysis. A dose of short-acting nitrates was routinely given ifsystolic blood pressure was above 110 mm Hg.
MDCT Image AnalysisRaw image data sets were transferred to the CT Core Laboratory for analysis andreconstructed at a 0.5-mm slice thickness with an overlap of 0.3 mm to optimize imagequality by an adaptive multisegment reconstruction algorithm [33]. Software (ImageXact,Toshiba Medical Systems) was used to select the systolic and diastolic phases with the leastcardiac motion using both a standard (FC43) and a hard (FC05) convolution kernel. Atemporal window of ± 20 milliseconds was used to optimize reconstruction on per-patientand per-vessel bases in both systolic and diastolic reconstructions. ECG editing was used in26 of the 291 patients to exclude arrhythmias and decrease cardiac motion [34].
An overall assessment of patient- and segment-level image quality was performed in the CTCore Laboratory. To determine the vessel-level image quality score, the average score of allsegments comprising the vessel was used. The following image quality ordinal scale wasimplemented: 1, optimal quality (absence of motion artifact and optimal contrastopacification); 2, adequate quality (minor imaging artifacts); 3, poor (significant motionartifact, calcification artifact, or poor contrast opacification); or 4, nonassessable (absence of
Dewey et al. Page 3
AJR Am J Roentgenol. Author manuscript; available in PMC 2012 March 6.
NIH
-PA Author Manuscript
NIH
-PA Author Manuscript
NIH
-PA Author Manuscript
contrast opacification or incomplete scan), which were considered nondiagnostic for theevaluation of diagnostic accuracy [5, 35] (Fig. 1).
Total coronary calcium burden and regional coronary calcium burden were measured whilecarefully avoiding stents and calcium of the mitral valve using the Agatston method [36] andstandardized software (Vitrea 2, version 3.9.0.1, Vital Images). MDCT data werereconstructed, probed, and segmented by the CT Core Laboratory technician. Reconstructedimages in multiple cardiac phases were sent to the Core Imaging Laboratory for imageinterpretation by two investigators who were blinded to any patient information; they usedindependent workstations with dedicated cardiac MDCT analysis software (Vitrea 2, version3.9.0.1, Vital Images). Quantitative assessment of the degree of diameter stenosis wasperformed in cross-sectional and longitudinal projections after visual identification of ≥30% stenosis using a semiautomatic contour-detection algorithm, electronic calipers, andrulers in cross-sectional and longitudinal projections. Final determinations of reference andlumen diameters were made only after manual contour editing [32]. Segments withsignificant discrepancies underwent a consensus process that incorporated a thirdexperienced observer. In segments in which the difference between the two principal readerswas not significant, a consensus score was derived through averaging. A significantdifference was defined as the maximum percentage diameter stenosis crossing the 50% or70% thresholds. Additionally, if any one reader judged a segment nonassessable, thesegment underwent a consensus interpretation. For the quantitative analysis, segments weredeemed nonassessable only if there were no quantitative measurements made by any of thereaders.
Conventional Coronary AngiographyConventional coronary angiography was performed using standard angiographic techniqueswithin 30 days after MDCT. Intracoronary nitroglycerine was administered (150-200 mcg)before acquisition of the first image of the left and right coronary arteries to standardizecoronary vasomotor tone and reduce the potential for catheter-induced spasm. Coronaryangiographic images were saved in DICOM format and forwarded to the Angiographic CoreLaboratory for analysis.
Quantitative coronary angiography (QCA) was performed using an edge-detection algorithm(CAAS II QCA software, research version 2.0.1, PIE Medical Imaging). The mostsignificant stenosis within each coronary segment was analyzed with quantitativeassessment of the degree of stenosis (QCA). Segments that could not be accuratelyvisualized because of reduced image quality were excluded. Segmental disease wasanalyzed in each vessel using a 19-segment model used by MDCT. Lesions causing ≥ 50%reduction of the lumen were considered significant. After analysis completion, allmeasurements were locked, and an adjudication process was performed to ensure MDCTand QCA measurements were obtained from the same segments. Scores were reassigned tothe appropriate segments in cases of misalignment.
Coronary Artery SegmentationAlthough prior MDCT studies have used a 15-segment model [37], which is a variation ofthe standard American Heart Association (AHA) model for conventional coronaryangiography (AHA/American College of Cardiology, 29 segments) [38, 39], we developed amodified 19-segment model to accommodate a more comprehensive coronary treedescription without placing undue emphasis on very small and very distant territories. Weexcluded the acute marginal, first septal, and third diagonal. Additionally, we groupedtogether the right posterolaterals and the distal circumflex with the left posterolaterals. We
Dewey et al. Page 4
AJR Am J Roentgenol. Author manuscript; available in PMC 2012 March 6.
NIH
-PA Author Manuscript
NIH
-PA Author Manuscript
NIH
-PA Author Manuscript
reported the tightest lesion in the right posterior lateral group and the tightest lesion in thedistal circumflex group [31, 32].
Statistical AnalysisStatistical analysis was performed with standard statistical analysis software (IntercooledStata, version 10, Stata Press). Proportional odds logistic regression was used to investigatepatient characteristics (sex, age, ethnicity, BMI, CAC score, heart rate, heart rate variability,breathing artifact, ectopy) associated with optimal image quality. Multivariate logisticregression was performed between patient predictor characteristics and concordancebetween MDCTA and conventional coronary angiography on a per-patient level and a per-vessel level to test the association between patient characteristics and overall accuracy. Age,BMI, heart rate, heart rate variability, and CAC score were considered continuous variables,ethnicity was considered a categoric variable, and sex, ectopy, and breathing artifact wereconsidered binary.
To take into account the effect of vessels related to individual patients, the effect ofclustering was incorporated. To assess the diagnostic accuracy of MDCT compared withinvasive angiography across image quality, age, sex, coronary calcium, BMI, acquisitionheart rate, and heart rate variability strata, we considered the output from MDCT as acontinuous measure and used the area under the receiver operating characteristic (ROC)curve as the measure of diagnostic accuracy. The reference standard for all ROC analysiswas ≥ 50% diameter stenosis by QCA. All tests were two-tailed, and differences wereconsidered significant when the p value was equal or less than 0.05.
ResultsImage Quality Parameters
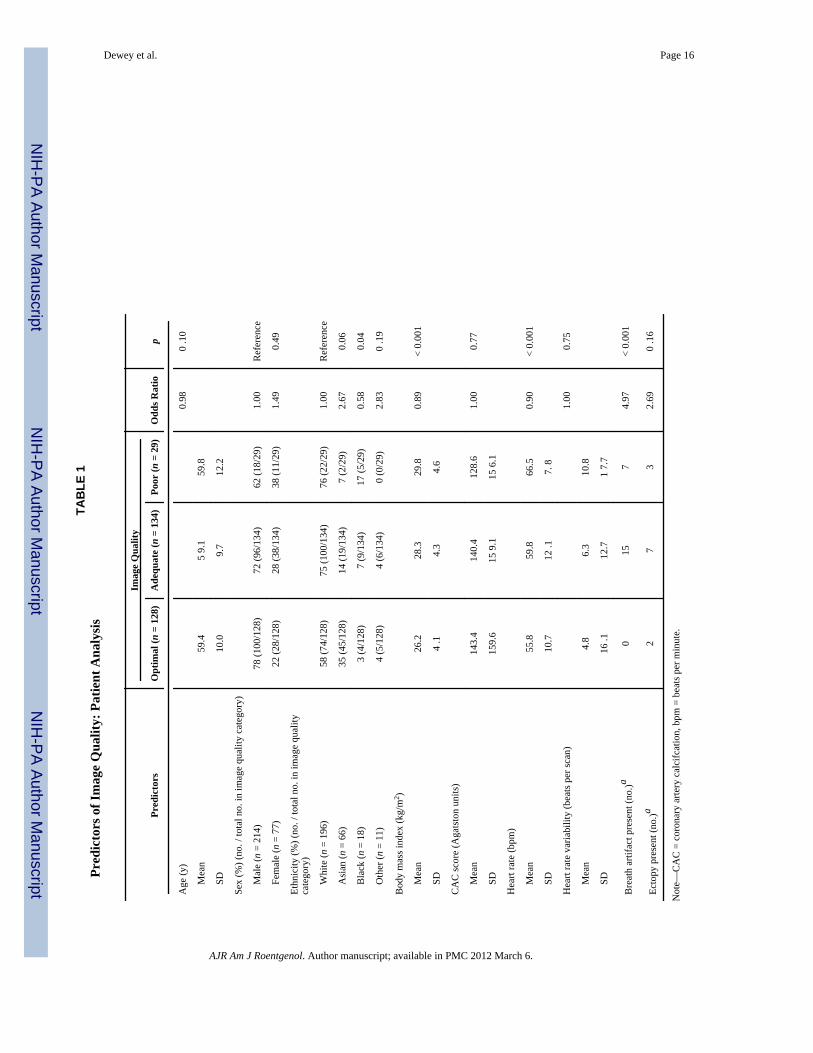
The patient characteristics used to evaluate the influence of optimal image quality includedthe following: age, sex, ethnicity, BMI, CAC score, heart rate, heart rate variability,breathing artifact, and ectopy. A significant relationship for predicting image quality wasdetermined for BMI (odds ratio [OR] = 0.89, p < 0.001), mean scan heart rate (OR = 0.90, p< 0.001), the presence of a breathing artifact (OR = 4.97, p < 0.001), and black ethnicity(OR = 0.58, p = 0.04; Table 1).
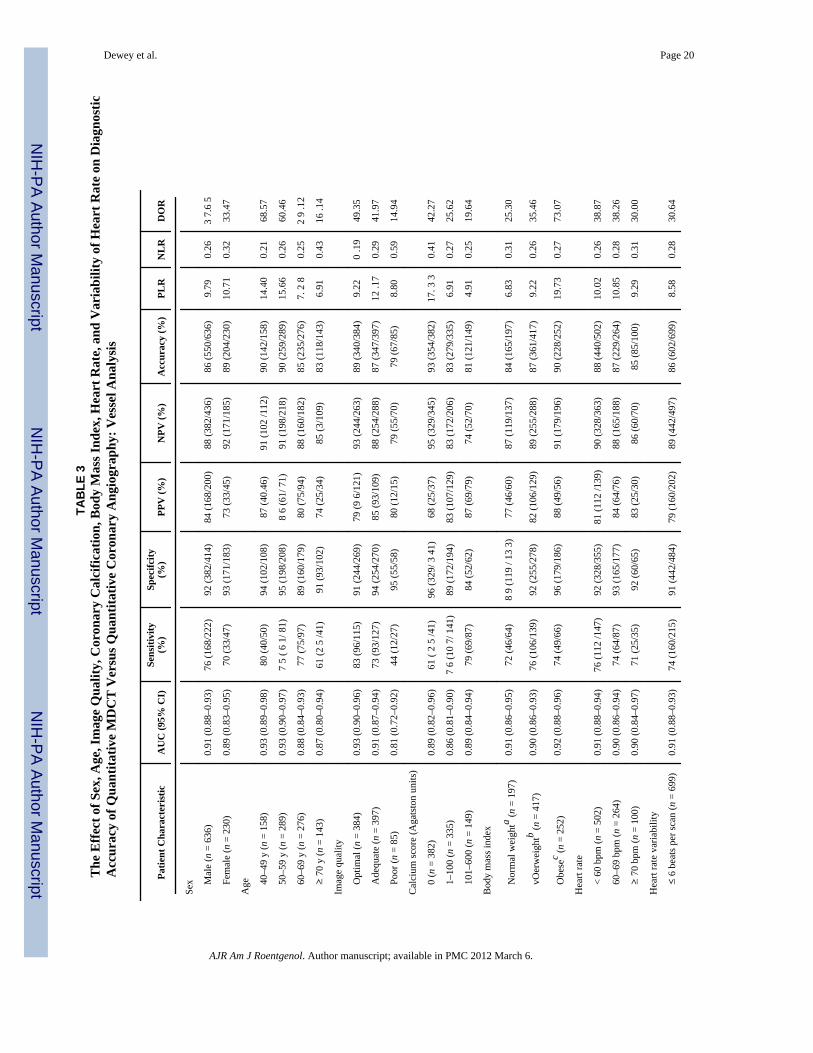
In the patient-based analysis, optimal image quality was achieved in 128 patients (44%),adequate quality in 134 (46%), and poor quality in 29 (10%) (Table 2). In the vessel-basedanalysis, optimal image quality was achieved in 384 vessels (44%), adequate quality in 397(46%), and poor quality in 85 (10%) (Table 3).
Predictors of Diagnostic AccuracyInfluence of image quality—In the patient-based analysis, the area under the ROC curve(AUC) for optimal image quality was 0.95 (95% CI, 0.91-0.99); for adequate quality, 0.92(0.87-0.96); and for poor quality, 0.91 (0.80-1.00) A significant difference was not observedin AUCs between image quality strata (p = 0.56; Fig. 2A).
In a vessel-based analysis, the AUC for optimal quality was 0.93 (95% CI, 0.90-0.96); foradequate quality, 0.91 (0.87-0.94); and for poor quality, 0.81 (0.72-0.92). A trend wasobserved in differences in AUCs across vessel image quality strata (p = 0.08) (Fig. 2B). Theeffect of image quality on the diagnostic accuracy of quantitative MDCTA versus QCA in apatient-based analysis is presented in Table 2 and in a vessel-based analysis in Table 3.
Dewey et al. Page 5
AJR Am J Roentgenol. Author manuscript; available in PMC 2012 March 6.
NIH
-PA Author Manuscript
NIH
-PA Author Manuscript
NIH
-PA Author Manuscript
Influence of age and sex—The influences of age and sex on the diagnostic accuracy ofMDCT were assessed. Age was categorized into the following groups: 40-49 years, 50-59years, 60-69 years, and 70 years or greater. In a patient-based analysis, the AUC forindividuals 40-49 years old was 0.95 (95% CI, 0.89-1.00); for individuals 50-59 years old,0.96 (0.92-0.99); for individuals 60-69 years old, 0.90 (0.84-0.96); and for individuals 70years old or older, 0.91 (0.82-0.99). In a vessel-based analysis, the AUC for individuals40-49 years old was 0.93 (95% CI, 0.89-0.98); for individuals 50-59 years old, 0.93(0.90-0.97); for individuals 60-69 years old, 0.88 (0.84-0.93); and for individuals 70 yearsold or older, 0.87 (0.80-0.94). A significant difference was not observed in the AUCsbetween age strata in the patient-based analysis (p = 0.43) or the vessel-based analysis (p =0.13). The effect of age on the diagnostic accuracy of quantitative MDCTA versus QCA in apatient-based analysis is presented in Table 2 and in a vessel-based analysis in Table 3.
In a patient-based analysis, the AUC for women was 0.89 (95% CI, 0.81-0.98) and for menwas 0.94 (0.90-0.97), whereas in a vessel-based analysis the AUC for women was 0.89(0.83-0.95) and for men was 0.91 (0.88-0.93). A significant difference in the AUC was notobserved between men and women in either the patient-based analysis (p = 0.38) or thevessel-based analysis (p = 0.57). The effect of sex on the diagnostic accuracy of quantitativeMDCTA versus QCA in a patient-based analysis is presented in Table 2 and in a vessel-based analysis in Table 3.
Influence of coronary calcium—Coronary calcification was categorized into thefollowing groups: low calcium (0-100 Agatston units), moderate calcium (101-300 Agatstonunits), and elevated calcium (301-600 Agatston units) for a patient-based analysis and lowcalcium (0 Agatston units), moderate calcium (1-100 Agatston units), and elevated calcium(≥ 101 Agatston units) for vessel-based analysis [40]. In a patient-based analysis the AUCfor individuals in the low calcium category was 0.89 (95% CI, 0.83-0.95); for those withmoderate calcium, 0.95 (0.90-1.00); and for individuals with elevated calcium, 0.93(0.87-1.00). In a vessel-based analysis, the AUC for individuals in the low calcium categorywas 0.89 (95% CI, 0.82-0.96); for those with moderate calcium, 0.86 (0.81-0.90); and forindividuals with elevated calcium, 0.89 (0.84-0.94). A significant difference was notobserved in AUCs between individuals with low, moderate, or elevated calcium scores in apatient-based analysis (p = 0.33) or a vessel-based analysis (p = 0.55). The effect ofcoronary calcification on the diagnostic accuracy of quantitative MDCTA versus QCA in apatient-based analysis is presented in Table 2 and in a vessel-based analysis in Table 3.
The effect of lesion calcification on the event rate of false-negative and false-positivefindings was assessed. Lesion calcification was assessed in a cross-sectional projectionusing an ordinal scale: no calcification, mild calcification (focal, arc < 90°), moderatecalcification (arc = 90-179°), and severe calcification (arc > 179°) [41]. In the patients withfalse-positive findings, there was a total of 11 lesions: 45.5% (5/11) had no calcium, 45.5%(5/11) had mild calcium, and 9% (1/11) had moderate calcification. In the patients withfalse-negative findings, there was a total of 49 lesions: 65% (32/49) had no calcification,20% (10/49) had mild calcification, 12% (6/49) had moderate calcification, and 2% (1/49)had severe calcification.
Influence of obesity—The influence of obesity on the diagnostic accuracy of MDCT wasexamined. BMI was categorized into three groups: normal weight (< 25 kg/m2), overweight(25-29.9 kg/m2), and obese (≥ 30 kg/m2). In a patient-based analysis, the AUC for normal-weight individuals was 0.93 (95% CI, 0.86-1.00); for overweight individuals, 0.92(0.87-0.96); and for individuals who were obese, 0.96 (0.92-1.00). In a per-vessel analysisthe AUC for normal-weight individuals was 0.91 (95% CI, 0.86-0.95); for overweightindividuals, 0.90 (0.86-0.93); and for obese individuals, 0.92 (0.88-0.96). A significant
Dewey et al. Page 6
AJR Am J Roentgenol. Author manuscript; available in PMC 2012 March 6.
NIH
-PA Author Manuscript
NIH
-PA Author Manuscript
NIH
-PA Author Manuscript
difference was not observed in AUCs between BMI strata in either a patient-based analysis(p = 0.39) or a vessel-based analysis (p = 0.86). The effect of obesity on the diagnosticaccuracy of quantitative MDCTA versus QCA in a patient-based analysis is presented inTable 2 and in a vessel-based analysis in Table 3.
Influence of heart rate and heart rate variability—The influence of categoric heartrates on the diagnostic accuracy of MDCTA was assessed. Heart rate was categorized intothree groups: < 60 bpm, 60-69 bpm, and ≥ 70 bpm. In a patient-based analysis, the AUC forheart rates < 60 bpm was 0.93 (95% CI, 0.90-0.97); for heart rates 60-69 bpm, 0.93(0.87-0.98); and for heart rates ≥ 70 bpm, 0.94 (0.85-1.00). In a vessel-based analysis theAUC for heart rates < 60 bpm was 0.91 (95% CI 0.88-0.94); for heart rates 60-69 bpm, 0.90(0.86-0.94); and for heart rates ≥ 70 bpm, 0.90 (0.84-0.97). A significant difference was notobserved in the AUCs between heart rate strata in either a patient-based analysis (p = 0.97)or a vessel-based analysis (p = 0.88). The effect of acquisition heart rate on the diagnosticaccuracy of quantitative MDCTA versus QCA in a patient-based analysis is presented inTable 2 and in a vessel-based analysis in Table 3.
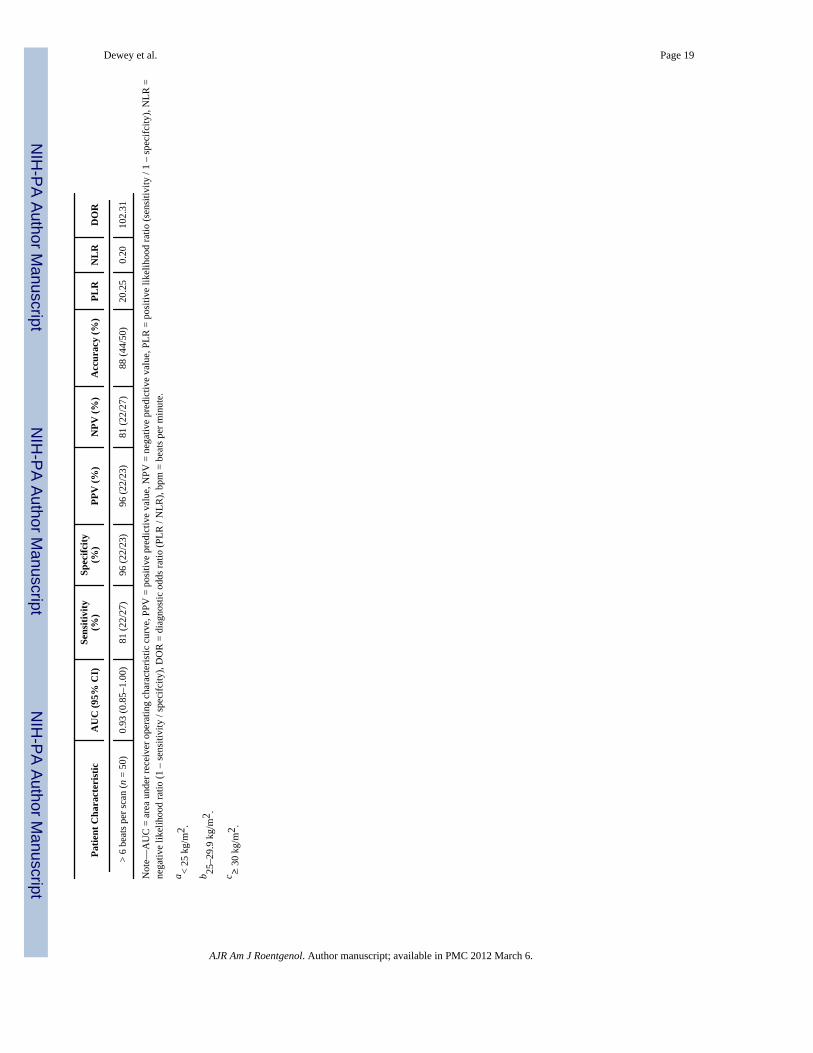
The influence of heart rate variability on the diagnostic accuracy of MDCTA was evaluated.Heart rate variability was defined as the maximum difference in heart rate during scanningbased on the acquisition ECG. Heart rate variability was categorized into two groups: ≤ 6beats per scan and > 6 beats per scan. In a patient-based analysis, the AUC for heart ratevariability of ≤ 6 beats per scan was 0.93 (95% CI, 0.90-0.96), and for heart rate variabilityof > 6 beats per scan the AUC was 0.93 (0.85-1.00). In a vessel-based analysis, the AUC forheart rate variability of ≤ 6 beats per scan was 0.91 (95% CI, 0.88-0.93) and for heart ratevariability of > 6 beats per scan, 0.92 (0.86-0.97). A significant difference was not observedin the AUCs between heart rate variability strata in either a patient-based analysis (p = 0.93)or a vessel-based analysis (p = 0.73). The effect of heart rate variability on the diagnosticaccuracy of quantitative MDCTA versus QCA in a patient-based analysis is presented inTable 2 and in a vessel-based analysis in Table 3.
Multivariate AnalysesUnivariate and multivariate logistic regressions were performed between patientcharacteristics (age, sex, ethnicity, BMI, CAC score in increments of 10 Agatston units,heart rate, heart rate variability, breathing artifact, and ectopy) and diagnostic accuracy on aper-patient level and a per-vessel level to test the association between patient characteristicsand diagnostic accuracy. Diagnostic accuracy was defined as agreement between MDCTand conventional coronary angiography. In the per-patient univariate analysis, nostatistically significant relationship was found between patient characteristics and diagnosticaccuracy (p value range, 0.15-0.98); similarly, in the multivariate per-patient analysis, nostatistically significant relationship was determined (p value range, 0.23-0.99).
In the per-vessel univariate analysis, a statistically significant relationship was determinedbetween age and diagnostic accuracy (OR = 1.03, p = 0.02) and CAC score and diagnosticaccuracy (OR = 1.03, p = 0.002). In the multivariate analysis, a statistically significantrelationship was found between age and diagnostic accuracy (OR = 1.02, p = 0.04) and CACscore and diagnostic accuracy (OR = 1.0019, p = 0.003) when controlling for all otherpatient characteristics (age, sex, ethnicity, BMI, CAC, heart rate, heart rate variability,breathing artifact, and ectopy).
DiscussionThis study is the first, to our knowledge, to report on the influence of different determinatesof image quality of MDCT using 64 simultaneous detector rows and their influence on
Dewey et al. Page 7
AJR Am J Roentgenol. Author manuscript; available in PMC 2012 March 6.
NIH
-PA Author Manuscript
NIH
-PA Author Manuscript
NIH
-PA Author Manuscript
diagnostic accuracy on a per-patient level and a per-vessel level as compared withconventional coronary angiography in a large international multicenter study. We found arelevant influence of BMI, heart rate, and breathing artifact on the degradation of imagequality. A large effect of ethnicity on image quality was found, but was not highlystatistically significant because the analysis was not based on a large number of patients. Wealso examined the influence of subgroups of sex, age, CAC burden, BMI, heart rate, andheart rate variability on the diagnostic accuracy of 64-MDCT and could show an associationwith reduced accuracy only for increasing calcium burden in a vessel, even when onlypatients with a CAC score ≤ 600 were analyzed. The adaptation of tube current to eachpatient’s BMI [32] might explain the independence of the diagnostic accuracy results fromobesity. Finally, our study shows that the patient characteristic predictor variables, althoughstill important as determinates of image quality in 64-MDCT 0.5-mm-slice-thickness CTscanners, are less influential than in previous studies performed with fewer detector rowsand a wider section thickness.
The 64-MDCT scanners have a faster gantry rotation time and faster volume coveragecompared with previous-generation scanners, thus enabling a more robust examination ofthe coronary arteries that is less susceptible to respiratory artifact and patient movement.The improved temporal and spatial resolution of the 64-MDCT scanners has been translatedinto clinical application, and several studies have shown higher image quality and diagnosticaccuracy on 64-MDCT scanners compared with previous-generation scanners [9-12, 16, 17,42]. Despite the advancement of scanners from single-slice to 4 slices to 16-64 slices,motion artifacts have negatively affected image quality and remain a limitation of thetechnology [18, 19, 43]. With each generation of scanners, motion artifacts reappear as amajor cause of image quality degradation during CT coronary angiography [4, 5, 18, 44].Residual cardiac motion artifacts have been reported to be the main cause of image qualitydegradation with 4- and 16-MDCT [5, 18, 19]. The small diameter of the coronary [9-12, 16,17, 42] segments, complex 3D geometry, and rapid movement through the cardiac cyclerepresent major challenges for artifact-free CT angiography [19].
In a recent study, Brodoefel et al. [30] analyzed the influence of heart rate and heart ratevariability on both the image quality and diagnostic accuracy of 64-MDCT. They reportedthat elevated heart rate and heart rate variability have a negative effect on image quality;however, this effect did not deteriorate diagnostic accuracy. These findings contrast with thefindings of Raff et al. [12] and Dewey et al. [16] who reported a significant decline indiagnostic accuracy at heart rates above 70 and 65 bpm using standard halfscanreconstruction [12, 21]. Our data support the finding of Brodoefel et al. [30] in which higherheart rate was a predictor of reduced image quality; however, in both patient and vesselanalyses, heart rate was not associated with significantly reduced diagnostic accuracy. Ofnote, in our trial the mean heart rate was 60 bpm (range, 39-86 bpm); 46% of the patientsreceived β-blockades before scanning. Similarly, heart rate variability was not associatedwith a degradation of image quality or reduced diagnostic accuracy in both the patient andvessel analyses. This finding is likely attributable to ECG editing, which allows theelimination of variable R-R intervals [34], multisegment reconstruction [33], and optimizedreconstruction of each artery per patient.
In recent studies, investigators examining the influence of CAC as related to MDCTAdiagnostic accuracy have concluded that despite a high overall accuracy, patients withcalcium scores over 400 Agatston units remain a challenge to diagnose [12, 30]. In thecurrent study, CAC was not associated with reduced image quality or reduced diagnosticaccuracy in a patient-level analysis. However, in a vessel-level analysis, CAC wasassociated with reduced diagnostic accuracy (p = 0.012) using multivariable logisticregression. For each increase of 10 Agatston units in CAC score in a vessel, the risk of a
Dewey et al. Page 8
AJR Am J Roentgenol. Author manuscript; available in PMC 2012 March 6.
NIH
-PA Author Manuscript
NIH
-PA Author Manuscript
NIH
-PA Author Manuscript
misdiagnosis is increased by 3.0% (p = 0.002). The influence of CAC in our data suggeststhat if a predefined upper limit of CAC is to be determined it will likely occur at a vessellevel rather than a patient level.
The results of our study confirm that certain patient characteristics, such as patient size,must be considered when adjusting scanner settings such as kV and mA to scan individualsundergoing coronary CT angiography. Moreover, training patients with breath-hold testing(e.g., “mock breathing instructions”) [45] before scanning is important to avoid breathingartifacts that limit image quality.
Previous studies have investigated sex differences in the capability of MDCT to detectsignificant coronary artery disease as compared with conventional coronary angiography.Dewey et al. [46] and Meijboom et al. [47] have shown reduced capability of MDCT todetect significant coronary artery disease in women compared with men. They haveattributed these differences to women having smaller coronary arteries and milder stenosisseverity. In a patient-based analysis, Meijboom et al. showed a significant difference inspecificity, positive predictive value, and overall diagnostic accuracy between men andwomen; however, the sensitivity was nearly equal because of few false-negative studies.They noted that the lower disease prevalence of coronary artery disease in women likelycontributed to the differences in specificity [47].
Similarly, Dewey et al. [46] reported that overall diagnostic accuracy, sensitivity, andpositive predictive value were all significantly lower for women than men. Theyacknowledge that the difference in disease prevalence in women and men may havecontributed to the differences in diagnostic performance. Additionally, Halon et al. [48]showed in multivariable analysis that women have a higher incidence of nonassessablesegments (OR = 3.1, p < 0.001) than men. This finding may be because women have smallercoronary arteries; however, the authors acknowledge that they did not routinely measurecoronary artery size in conventional coronary angiography arteries > 2 mm [48]. On theother hand, Pundziute et al. [49] have shown in both patient- and vessel-based analyses highdiagnostic capability of MDCT compared with conventional coronary angiography for bothmen and women. In the current study using 64 × 0.5 mm detector collimation, no significantdifferences in the diagnostic capability of MDCT were shown between men and women ineither a patient-based or a vessel-based analysis.
Our study has some limitations. Individuals with heart rates greater than 80 bpm or a BMI of> 40 kg/m2 were excluded from the study. Additionally, segments with a vessel diameter ofless than 1.5 mm and individuals with a CAC score of ≤ 600 Agatston units were excludedfrom the analysis. These exclusions limit, to a great extent, the applicability of the currentstudy results to a real-world setting in which a relevant portion of patients present withobesity, an elevated heart rate, increased CAC score, or a combination of thesecharacteristics. Thus, additional analyses (ideally multicenter) including those patientswould be of distinct clinical and practical value. We also acknowledge that the image qualityscoring system could have been influenced by subjectivity bias. The 64-MDCT scanner with0.5-mm detector collimation represents state-of-the-art at the time of study conduct. Morerecent scanner configurations, such as dual-source CT (improvements in temporalresolution) [30] and 320-MDCT (single-heartbeat acquisitions) [50, 51], have the potentialto improve image quality of coronary CT angiography, further making the test even moreindependent of patient characteristics.
In summary, observations from this multicenter international study show that 64-MDCTscanner technology provides a high-quality noninvasive coronary arteriogram that accuratelydelineates the presence or absence of significant lesions in a broad spectrum of patients,
Dewey et al. Page 9
AJR Am J Roentgenol. Author manuscript; available in PMC 2012 March 6.
NIH
-PA Author Manuscript
NIH
-PA Author Manuscript
NIH
-PA Author Manuscript
including patients who are obese, have high heart rates or heart rate variability, and haveCAC. Age and CAC in a vessel-based analysis were the only factors associated with reduceddiagnostic accuracy of MDCT for the detection of significant CAD compared withconventional coronary angiography.
AcknowledgmentsM. Dewey has research grants from GE Healthcare (Amersham), Bracco Diagnostics, Guerbet, and ToshibaMedical Systems and is a member of the speaker’s bureau for Toshiba Medical Systems and Bayer-Schering. A.Arbab-Zadeh received grant support from CT Core Laboratory. J. M. Miller, N. Paul, and J. A. Lima received grantsupport from Toshiba Medical Systems. N. Paul, J. Hoe, and J. Lima received speakers’ fees from Toshiba MedicalSystems and N. Paul, advisory fees from Vital Images. J. Hoe served as director of the Cardiac CT Training Coursesponsored by Toshiba Medical Systems, Asia, and received speaker’s fees from GE Biosciences. J. A. Limareceived grant support from GE Healthcare.
References1. Garcia MJ, Lessick J, Hoffmann MH, CATSCAN Study Investigators. Accuracy of 16-row multide-
tector computed tomography for the assessment of coronary artery stenosis. JAMA. 2006; 296:403–411. [PubMed: 16868298]
2. Hoffmann MH, Shi H, Schmitz BL, et al. Noninvasive coronary angiography with multislicecomputed tomography. JAMA. 2005; 293:2471–2478. [PubMed: 15914747]
3. Mollet NR, Cademartiri F, Nieman K, et al. Multislice spiral computed tomography coronaryangiography in patients with stable angina pectoris. J Am Coll Cardiol. 2004; 43:2265–2270.[PubMed: 15193691]
4. Nieman K, Cademartiri F, Lemos PA, Raaijmakers R, Pattynama PM, de Feyter PJ. Reliablenoninvasive coronary angiography with fast submillimeter multislice spiral computed tomography.Circulation. 2002; 106:2051–2054. [PubMed: 12379572]
5. Ropers D, Baum U, Pohle K, et al. Detection of coronary artery stenoses with thin-slice multi-detector row spiral computed tomography and multiplanar reconstruction. Circulation. 2003;107:664–666. [PubMed: 12578863]
6. Dewey M, Teige F, Schnapauff D, et al. Noninvasive detection of coronary artery stenoses withmultislice computed tomography or magnetic resonance imaging. Ann Intern Med. 2006; 145:407–415. [PubMed: 16983128]
7. Cordeiro MA, Miller JM, Schmidt A, et al. Noninvasive half millimetre 32 detector row computedtomography angiography accurately excludes significant stenoses in patients with advancedcoronary artery disease and high calcium scores. Heart. 2006; 92:589–597. [PubMed: 16251224]
8. Hamon M, Biondi-Zoccai GG, Malagutti P, et al. Diagnostic performance of multislice spiralcomputed tomography of coronary arteries as compared with conventional invasive coronaryangiography: a meta-analysis. J Am Coll Cardiol. 2006; 48:1896–1910. [PubMed: 17084268]
9. Hamon M, Morello R, Riddell JW, Hamon M. Coronary arteries: diagnostic performance of 16-versus 64-section spiral CT compared with invasive coronary angiography—meta-analysis.Radiology. 2007; 245:720–731. [PubMed: 17951354]
10. Leschka S, Alkadhi H, Plass A, et al. Accuracy of MSCT coronary angiography with 64-slicetechnology: first experience. Eur Heart J. 2005; 26:1482–1487. [PubMed: 15840624]
11. Nikolaou K, Knez A, Rist C, et al. Accuracy of 64-MDCT in the diagnosis of ischemic heartdisease. AJR. 2006; 187:111–117. [PubMed: 16794164]
12. Raff GL, Gallagher MJ, O’Neill WW, Goldstein JA. Diagnostic accuracy of noninvasive coronaryangiography using 64-slice spiral computed tomography. J Am Coll Cardiol. 2005; 46:552–557.[PubMed: 16053973]
13. Mollet NR, Cademartiri F, van Mieghem CA, et al. High-resolution spiral computed tomographycoronary angiography in patients referred for diagnostic conventional coronary angiography.Circulation. 2005; 112:2318–2323. [PubMed: 16203914]
Dewey et al. Page 10
AJR Am J Roentgenol. Author manuscript; available in PMC 2012 March 6.
NIH
-PA Author Manuscript
NIH
-PA Author Manuscript
NIH
-PA Author Manuscript
14. Pugliese F, Mollet NR, Runza G, et al. Diagnostic accuracy of non-invasive 64-slice CT coronaryangiography in patients with stable angina pectoris. Eur Radiol. 2006; 16:575–582. [PubMed:16292649]
15. Pugliese F, Mollet NR, Hunink MG, et al. Diagnostic performance of coronary CT angiography byusing different generations of multisection scanners: single-center experience. Radiology. 2008;246:384–393. [PubMed: 18180337]
16. Dewey M, Hoffmann H, Hamm B. CT coronary angiography using 16 and 64 simultaneousdetector rows: intraindividual comparison. Rofo. 2007; 179:581–586. [PubMed: 17492543]
17. Hausleiter J, Meyer T, Hadamitzky M, et al. Noninvasive coronary computed tomographicangiography for patients with suspected coronary artery disease: the Coronary Angiography byComputed Tomography with the Use of a Submillimeter Resolution (CACTUS) trial. Eur Heart J.2007; 28:3034–3041. [PubMed: 17540851]
18. Hoffmann MH, Shi H, Manzke R, et al. Noninvasive coronary angiography with 16-detector rowCT: effect of heart rate. Radiology. 2005; 234:86–97. [PubMed: 15550373]
19. Leschka S, Wildermuth S, Boehm T, et al. Noninvasive coronary angiography with 64-section CT:effect of average heart rate and heart rate variability on image quality. Radiology. 2006; 241:378–385. [PubMed: 16966483]
20. Hamoir XL, Flohr T, Hamoir V, et al. Coronary arteries: assessment of image quality and optimalreconstruction window in retrospective ECG-gated multislice CT at 375-ms gantry rotation time.Eur Radiol. 2005; 15:296–304. [PubMed: 15565317]
21. Dewey M, Teige F, Laule M, Hamm B. Influence of heart rate on diagnostic accuracy and imagequality of 16-slice CT coronary angiography: comparison of multisegment and halfscanreconstruction approaches. Eur Radiol. 2007; 17:2829–2837. [PubMed: 17639410]
22. Husmann L, Leschka S, Desbiolles L, et al. Coronary artery motion and cardiac phases:dependency on heart rate—implications for CT image reconstruction. Radiology. 2007; 245:567–576. [PubMed: 17848683]
23. Giesler T, Baum U, Ropers D, et al. Noninvasive visualization of coronary arteries using contrast-enhanced multidetector CT: influence of heart rate on image quality and stenosis detection. AJR.2002; 179:911–916. [PubMed: 12239036]
24. Cademartiri F, Mollet NR, Runza G, et al. Diagnostic accuracy of multislice computed tomographycoronary angiography is improved at low heart rates. Int J Cardiovasc Imaging. 2006; 22:101–105.discussion, 107-109. [PubMed: 16077999]
25. Nieman K, Rensing BJ, van Geuns RJ, et al. Noninvasive coronary angiography with multislicespiral computed tomography: impact of heart rate. Heart. 2002; 88:470–474. [PubMed: 12381635]
26. Oncel D, Oncel G, Tastan A. Effectiveness of dual-source CT coronary angiography for theevaluation of coronary artery disease in patients with atrial fibrillation: initial experience.Radiology. 2007; 245:703–711. [PubMed: 18024451]
27. Stanford W, Burns TL, Thompson BH, Witt JD, Lauer RM, Mahoney LT. Influence of body sizeand section level on calcium phantom measurements at coronary artery calcium CT scanning.Radiology. 2004; 230:198–205. [PubMed: 14695394]
28. Yoshimura N, Sabir A, Kubo T, Lin PJ, Clouse ME, Hatabu H. Correlation between image noiseand body weight in coronary CTA with 16-row MDCT. Acad Radiol. 2006; 13:324–328.[PubMed: 16488844]
29. Husmann L, Leschka S, Boehm T, et al. Influence of body mass index on coronary arteryopacification in 64-slice CT angiography [in German]. Rofo. 2006; 178:1007–1013. [PubMed:16894497]
30. Brodoefel H, Burgstahler C, Tsiflikas I, et al. Dual-source CT: effect of heart rate, heart ratevariability, and calcification on image quality and diagnostic accuracy. Radiology. 2008; 247:346–355. [PubMed: 18372455]
31. Miller JM, Rochitte CE, Dewey M, et al. Diagnostic performance of coronary angiography by 64-row CT. N Engl J Med. 2008; 359:2324–2336. [PubMed: 19038879]
32. Miller JM, Dewey M, Vavere AL, et al. Coronary CT angiography using 64 detector rows:methods and design of the multi-centre trial CORE-64. Eur Radiol. 2009; 19:816–828. [PubMed:18998142]
Dewey et al. Page 11
AJR Am J Roentgenol. Author manuscript; available in PMC 2012 March 6.
NIH
-PA Author Manuscript
NIH
-PA Author Manuscript
NIH
-PA Author Manuscript
33. Dewey M, Laule M, Krug L, et al. Multisegment and halfscan reconstruction of 16-slice computedtomography for detection of coronary artery stenoses. Invest Radiol. 2004; 39:223–229. [PubMed:15021326]
34. Cademartiri F, Mollet NR, Runza G, et al. Improving diagnostic accuracy of MDCT coronaryangiography in patients with mild heart rhythm irregularities using ECG editing. AJR. 2006;186:634–638. [PubMed: 16498089]
35. Kuettner A, Beck T, Drosch T, et al. Diagnostic accuracy of noninvasive coronary imaging using16-detector slice spiral computed tomography with 188 ms temporal resolution. J Am CollCardiol. 2005; 45:123–127. [PubMed: 15629385]
36. Agatston AS, Janowitz WR, Hildner FJ, Zusmer NR, Viamonte M Jr, Detrano R. Quantification ofcoronary artery calcium using ultrafast computed tomography. J Am Coll Cardiol. 1990; 15:827–832. [PubMed: 2407762]
37. Austen WG, Edwards JE, Frye RL, et al. A reporting system on patients evaluated for coronaryartery disease. Report of the Ad Hoc Committee for Grading of Coronary Artery Disease, Councilon Cardiovascular Surgery, American Heart Association. Circulation. 1975; 51(suppl 4):5–40.[PubMed: 1116248]
38. Alderman EL, Stadius M. The angiographic definitions of the Bypass AngioplastyRevascularization Investigation. Cor Art Dis. 1992; 3:1189–1207.
39. Ringqvist I, Fisher LD, Mock M, et al. Prognostic value of angiographic indices of coronary arterydisease from the Coronary Artery Surgery Study (CASS). J Clin Invest. 1983; 71:1854–1866.[PubMed: 6863543]
40. Pletcher MJ, Tice JA, Pignone M, Browner WS. Using the coronary artery calcium score to predictcoronary heart disease events: a systematic review and meta-analysis. Arch Intern Med. 2004;164:1285–1292. [PubMed: 15226161]
41. Mintz GS, Popma JJ, Pichard AD, et al. Patterns of calcification in coronary artery disease: astatistical analysis of intravascular ultrasound and coronary angiography in 1155 lesions.Circulation. 1995; 91:1959–1965. [PubMed: 7895353]
42. Dewey M, Dubel HP, Schink T, Baumann G, Hamm B. Head-to-head comparison of multislicecomputed tomography and exercise electrocardiography for diagnosis of coronary artery disease.Eur Heart J. 2007; 28:2485–2490. [PubMed: 16880194]
43. Matt D, Scheffel H, Leschka S, et al. Dual-source CT coronary angiography: image quality, meanheart rate, and heart rate variability. AJR. 2007; 189:567–573. [PubMed: 17715102]
44. Wintersperger BJ, Nikolaou K, von Ziegler F, et al. Image quality, motion artifacts, andreconstruction timing of 64-slice coronary computed tomography angiography with 0.33-secondrotation speed. Invest Radiol. 2006; 41:436–442. [PubMed: 16625106]
45. Engelken F, Lembcke A, Hamm B, Dewey M. Determining optimal acquisition parameters forcomputed tomography coronary angiography: evaluation of a software-assisted, breathhold examsimulation. Acad Radiol. 200; 16:239–243. [PubMed: 19124110]
46. Dewey M, Rutsch W, Hamm B. Is there a gender difference in noninvasive coronary imaging?Multislice computed tomography for noninvasive detection of coronary stenoses. BMCCardiovasc Disord. 2008; 8:2. [PubMed: 18230167]
47. Meijboom WB, Weustink AC, Pugliese F, et al. Comparison of diagnostic accuracy of 64-slicecomputed tomography coronary angiography in women versus men with angina pectoris. Am JCardiol. 2007; 100:1532–1537. [PubMed: 17996514]
48. Halon DA, Gaspar T, Adawi S, et al. Uses and limitations of 40 slice multi-detector row spiralcomputed tomography for diagnosing coronary lesions in unselected patients referred for routineinvasive coronary angiography. Cardiology. 2007; 108:200–209. [PubMed: 17095866]
49. Pundziute G, Schuijf JD, Jukema JW, et al. Gender influence on the diagnostic accuracy of 64-slice multislice computed tomography coronary angiography for detection of obstructive coronaryartery disease. Heart. 2008; 94:48–52. [PubMed: 17540687]
49. Dewey M, Zimmermann E, Laule M, Rutsch W, Hamm B. Three-vessel coronary artery diseaseexamined with 320-slice computed tomography coronary angiography. Eur Heart J. 2008;29:1669. [PubMed: 18263576]
Dewey et al. Page 12
AJR Am J Roentgenol. Author manuscript; available in PMC 2012 March 6.
NIH
-PA Author Manuscript
NIH
-PA Author Manuscript
NIH
-PA Author Manuscript

50. Dewey M, Zimmermann E, Deissenrieder F, et al. Noninvasive coronary angiography by 320-rowcomputed tomography with lower radiation exposure and maintained diagnostic accuracy:comparison of results with cardiac catheterization in a head-to-head pilot investigation.Circulation. 2009; 120:867–875. [PubMed: 19704093]
51. Rybicki FJ, Otero HJ, Steigner ML, et al. Initial evaluation of coronary images from 320-detectorrow computed tomography. Int J Cardiovasc Imaging. 2008; 24:535–546. [PubMed: 18368512]
Dewey et al. Page 13
AJR Am J Roentgenol. Author manuscript; available in PMC 2012 March 6.
NIH
-PA Author Manuscript
NIH
-PA Author Manuscript
NIH
-PA Author Manuscript
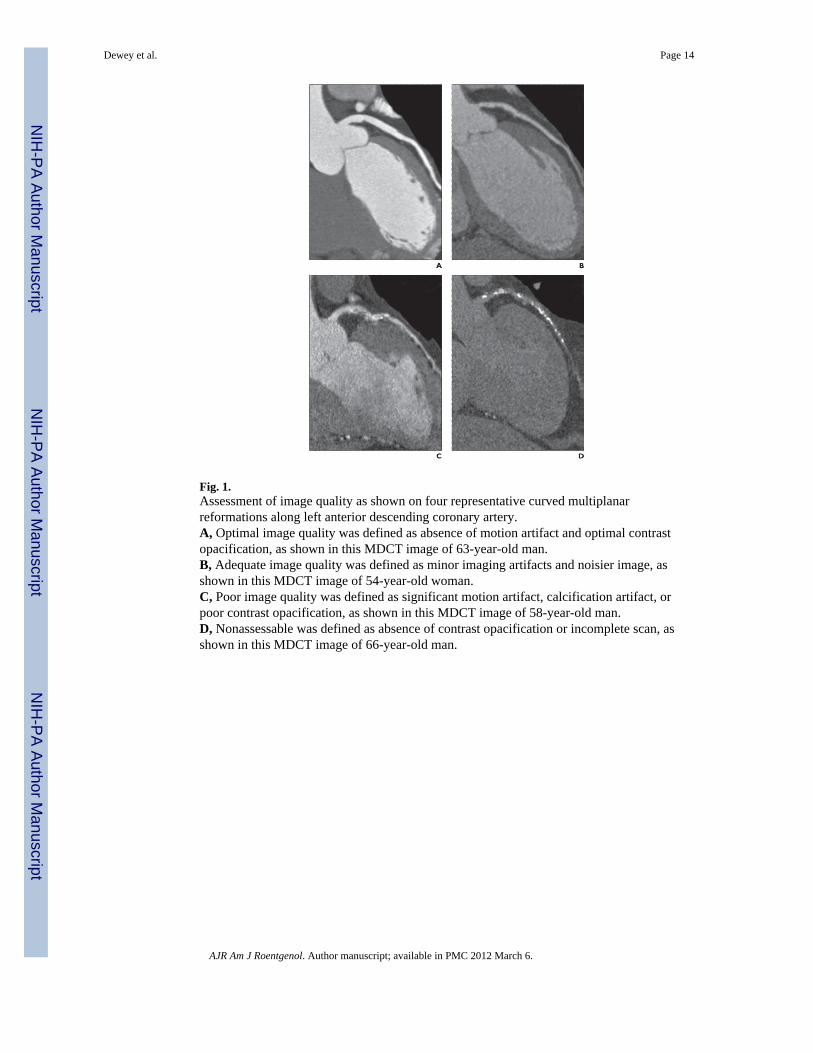
Fig. 1.Assessment of image quality as shown on four representative curved multiplanarreformations along left anterior descending coronary artery.A, Optimal image quality was defined as absence of motion artifact and optimal contrastopacification, as shown in this MDCT image of 63-year-old man.B, Adequate image quality was defined as minor imaging artifacts and noisier image, asshown in this MDCT image of 54-year-old woman.C, Poor image quality was defined as significant motion artifact, calcification artifact, orpoor contrast opacification, as shown in this MDCT image of 58-year-old man.D, Nonassessable was defined as absence of contrast opacification or incomplete scan, asshown in this MDCT image of 66-year-old man.
Dewey et al. Page 14
AJR Am J Roentgenol. Author manuscript; available in PMC 2012 March 6.
NIH
-PA Author Manuscript
NIH
-PA Author Manuscript
NIH
-PA Author Manuscript

Fig. 2.To assess diagnostic accuracy of MDCT compared with invasive angiography stratified byimage quality, we considered output from MDCT as continuous measure and used the areaunder receiver operating characteristic (ROC) curve as a measure of diagnostic accuracy.ROC curve analysis is a method of describing the intrinsic accuracy of a diagnostic test apartfrom decision thresholds. An ROC curve is a plot of a diagnostic test’s sensitivity (plottedon y-axis) versus its false-positive rate (1 – specificity) (plotted on x-axis). An ROC analysisplots the relationship between sensitivity and specificity across all cut points of a test andcalculates the area under the ROC curve (AUC) and its standard error. A diagnostic test withan AUC of 1 is perfectly accurate, whereas one with an AUC of 0.5 is performing no betterthan chance. Use of ROC curve as a measure of accuracy allows the followinginterpretations [50]: first, the average value of sensitivity for all possible values ofspecificity; second, the average value of specificity for all possible values of sensitivity; and,third, the probability that randomly selected patient with the condition of interest hasdiagnostic test result indicating greater suspicion than that of randomly chosen patientwithout the condition of interest.A, ROC curve shows diagnostic ability of coronary MDCT angiography to distinguishpatient with—as opposed to without—at least one ≥ 50% coronary stenosis as defined byquantitative coronary angiography (QCA). Curve has been stratified by image quality.Difference was not observed in AUCs between image quality strata (p = 0.562).B, ROC curve shows diagnostic ability of coronary MDCT angiography to distinguishvessel with—as opposed to without—at least one ≥ 50% coronary stenosis as defined byQCA. Curve has been stratified by image quality. Statistical trend was observed indifferences in AUCs between image quality strata (p = 0.079).
Dewey et al. Page 15
AJR Am J Roentgenol. Author manuscript; available in PMC 2012 March 6.
NIH
-PA Author Manuscript
NIH
-PA Author Manuscript
NIH
-PA Author Manuscript
NIH
-PA Author Manuscript
NIH
-PA Author Manuscript
NIH
-PA Author Manuscript
Dewey et al. Page 16
TAB
LE 1
Pred
icto
rs o
f Im
age
Qua
lity:
Pat
ient
Ana
lysi
s
Imag
e Q
ualit
y
Pred
icto
rsO
ptim
al (n
= 1
28)
Ade
quat
e (n
= 1
34)
Poor
(n =
29)
Odd
s Rat
iop
Age
(y)
0.98
0 .1
0
M
ean
59.4
5 9.
159
.8
SD
10.0
9.7
12.2
Sex
(%) (
no. /
tota
l no.
in im
age
qual
ity c
ateg
ory)
M
ale
(n =
214
)78
(100
/128
)72
(96/
134)
62 (1
8/29
)1.
00R
efer
ence
Fe
mal
e (n
= 7
7)22
(28/
128)
28 (3
8/13
4)38
(11/
29)
1.49
0.49
Ethn
icity
(%) (
no. /
tota
l no.
in im
age
qual
ityca
tego
ry)
W
hite
(n =
196
)58
(74/
128)
75 (1
00/1
34)
76 (2
2/29
)1.
00R
efer
ence
A
sian
(n =
66)
35 (4
5/12
8)14
(19/
134)
7 (2
/29)
2.67
0.06
B
lack
(n =
18)
3 (4
/128
)7
(9/1
34)
17 (5
/29)
0.58
0.04
O
ther
(n =
11)
4 (5
/128
)4
(6/1
34)
0 (0
/29)
2.83
0 .1
9
Bod
y m
ass i
ndex
(kg/
m2 )
M
ean
26.2
28.3
29.8
0.89
< 0.
001
SD
4 .1
4.3
4.6
CA
C sc
ore
(Aga
tsto
n un
its)
M
ean
143.
414
0.4
128.
61.
000.
77
SD
159.
615
9.1
15 6
.1
Hea
rt ra
te (b
pm)
M
ean
55.8
59.8
66.5
0.90
< 0.
001
SD
10.7
12 .1
7. 8
Hea
rt ra
te v
aria
bilit
y (b
eats
per
scan
)1.
000.
75
M
ean
4.8
6.3
10.8
SD
16 .1
12.7
1 7.
7
Bre
ath
artif
act p
rese
nt (n
o.)a
015
74.
97<
0.00
1
Ecto
py p
rese
nt (n
o.)a
27
32.
690
.16
Not
e—C
AC
= c
oron
ary
arte
ry c
alci
fcat
ion,
bpm
= b
eats
per
min
ute.
AJR Am J Roentgenol. Author manuscript; available in PMC 2012 March 6.

NIH
-PA Author Manuscript
NIH
-PA Author Manuscript
NIH
-PA Author Manuscript
Dewey et al. Page 17a Th
ese
resu
lts a
re a
lso
on th
e pe
r-pa
tient
leve
l; fo
r exa
mpl
e, in
two
patie
nts w
ith o
ptim
al im
age
qual
ity a
t lea
st o
ne e
ctop
ic b
eat w
as p
rese
nt.
AJR Am J Roentgenol. Author manuscript; available in PMC 2012 March 6.

NIH
-PA Author Manuscript
NIH
-PA Author Manuscript
NIH
-PA Author Manuscript
Dewey et al. Page 18
TAB
LE 2
The
Effe
ct o
f Sex
, Age
, Im
age
Qua
lity,
Cor
onar
y C
alci
ficat
ion,
Bod
y M
ass I
ndex
, Hea
rt R
ate,
and
Var
iabi
lity
of H
eart
Rat
e on
Dia
gnos
ticA
ccur
acy
of Q
uant
itativ
e M
DC
T V
ersu
s Qua
ntita
tive
Cor
onar
y A
ngio
grap
hy: P
atie
nt A
naly
sis
Patie
nt C
hara
cter
istic
AU
C (9
5% C
I)Se
nsiti
vity
(%)
Spec
ifcity
(%)
PPV
(%)
NPV
(%)
Acc
urac
y (%
)PL
RN
LR
DO
R
Sex
M
ale
(n =
214
)0.
94 (0
.90–
0.97
)86
(114
/133
)91
(74/
81)
9 4
(114
/ 12
1)
80 (7
4/93
)88
(188
/214
)9.
920
.16
62.0
0
Fe
mal
e (n
= 7
7)0.
89 (0
.81–
0.98
)83
(25/
30)
87 (4
1/47
)81
(2 5
/31)
89 (4
1/46
)86
(66/
77)
6.53
0 .1
934
.37
Age
40
–49
y (n
= 5
3)0.
95 (0
.89–
1.00
)9
4 (2
9/ 3
1)91
(20/
22)
9 4
(2 9
/ 31
)91
(20/
22)
92 (4
9/53
)10
.29
0.07
144.
93
50
–59
y (n
= 9
7)0.
96 (0
.92–
0.99
)86
(42/
49)
92 (4
4/48
)91
(42/
46)
86 (4
4/51
)89
(86/
97)
10.2
90
.16
65.9
6
60
–69
y (n
= 9
3)0.
90 (0
.84–
0.96
)87
(48/
55)
82 (3
1/38
)87
(48/
55)
82 (3
1/38
)85
(79/
93)
4.74
0 .1
629
.63
≥
70
y (n
= 4
8)0.
91 (0
.82–
0.99
)71
(20/
28)
100
(20/
20)
100
(20/
20)
71 (1
3/18
)83
(40/
48)
29.7
00.
3098
.90
Imag
e qu
ality
O
ptim
al (n
= 1
28)
0.95
(0.9
1–0.
99)
91 (6
7/74
)87
(47/
54)
91 (6
7/74
)87
(47/
54)
8 9
(114
/128
)7.
0 0
0 .1
067
.67
A
dequ
ate
(n =
134
)0.
92 (0
.87–
0.96
)84
(61/
73)
90 (5
5/61
)91
(61/
67)
82 (5
5/67
)8
7 (1
16 /1
3 4)
8.40
0 .1
846
.67
Po
or (n
= 2
9)0.
91 (0
.80–
1.00
)6
9 (1
1/ 1
6)10
0 (1
3/13
)10
0 (1
3/13
)72
(13/
18)
83 (2
4/29
)69
.00
0.31
222.
58
Cal
cium
scor
e (A
gats
ton
units
)
0–
100
(n =
151
)0.
89 (0
.83–
0.95
)75
(40/
53)
92 (9
0/98
)83
(40/
48)
87 (9
0/10
3)86
(130
/151
)9.
250.
2734
.26
10
1–30
0 (n
= 8
1)0.
95 (0
.90–
1.00
)90
(55/
61)
85 (1
7/20
)95
(55/
58)
74 (1
7/23
)89
(7 2
/ 81
)6.
010
.12
50.0
8
30
1–60
0 (n
= 5
9)0.
93 (0
.87–
1.00
)90
(44/
49)
80 (8
/10)
96 (4
4/46
)62
(8/1
3)88
(52/
59)
4.49
0 .1
334
.54
Bod
y m
ass i
ndex
N
orm
al w
eigh
ta (n =
66)
0.93
(0.8
6–1.
00)
84 (3
2/38
)93
(26/
28)
94 (3
2/34
)81
(26/
32)
88 (5
8/66
)12
.00
0 .1
769
.75
O
verw
eigh
tb (n =
141
)0.
92 (0
.87–
0.96
)86
(72/
84)
88 (5
0/57
)91
(72/
79)
81 (5
0/62
)8
7 (1
2 2
/ 141
)7.
170
.16
45.0
5
O
bese
c (n =
84)
0.96
(0.9
2–1.
00)
8 5
(3 5
/ 41
)91
(39/
43)
90 (3
5/39
)87
(39/
45)
88 (7
4/84
)9.
440
.16
5 7.
3 0
Hea
rt ra
te
<
60 b
pm (n
= 1
68)
0.93
(0.9
0–0.
97)
85 (8
0/94
)92
(68/
74)
93 (8
0/86
)83
(68/
82)
88 (1
48/1
68)
10.5
00
.16
64.7
6
60
–69
bpm
(n =
95)
0.93
(0.8
7–0.
98)
86 (4
4/51
)89
(39/
44)
90 (4
4/49
)85
(39/
46)
87 (8
3/95
)7.
5 9
0 .1
549
.03
≥
70
bpm
(n =
28)
0.94
(0.8
5–1.
00)
83 (1
5/18
)80
(8/1
0)88
(15/
17)
7 3
(8 /1
1)82
(23/
28)
4 .1
70.
2120
.00
Hea
rt ra
te v
aria
bilit
y
≤
6 be
ats p
er sc
an (n
= 2
41)
0.93
(0.9
0–0.
96)
8 6
(117
/ 13
6)89
(93/
105)
91 (1
17/ 1
2 9)
83 (9
3/11
2)87
(210
/241
)7.
82
0 .1
649
.70
AJR Am J Roentgenol. Author manuscript; available in PMC 2012 March 6.
NIH
-PA Author Manuscript
NIH
-PA Author Manuscript
NIH
-PA Author Manuscript
Dewey et al. Page 19
Patie
nt C
hara
cter
istic
AU
C (9
5% C
I)Se
nsiti
vity
(%)
Spec
ifcity
(%)
PPV
(%)
NPV
(%)
Acc
urac
y (%
)PL
RN
LR
DO
R
>
6 be
ats p
er sc
an (n
= 5
0)0.
93 (0
.85–
1.00
)81
(22/
27)
96 (2
2/23
)96
(22/
23)
81 (2
2/27
)88
(44/
50)
20.2
50.
2010
2.31
Not
e—A
UC
= a
rea
unde
r rec
eive
r ope
ratin
g ch
arac
teris
tic c
urve
, PPV
= p
ositi
ve p
redi
ctiv
e va
lue,
NPV
= n
egat
ive
pred
ictiv
e va
lue,
PLR
= p
ositi
ve li
kelih
ood
ratio
(sen
sitiv
ity /
1 –
spec
ifcity
), N
LR =
nega
tive
likel
ihoo
d ra
tio (1
– se
nsiti
vity
/ sp
ecifc
ity),
DO
R =
dia
gnos
tic o
dds r
atio
(PLR
/ N
LR),
bpm
= b
eats
per
min
ute.
a < 25
kg/
m2 .
b 25–2
9.9
kg/m
2 .
c ≥ 3
0 kg
/m2 .
AJR Am J Roentgenol. Author manuscript; available in PMC 2012 March 6.
NIH
-PA Author Manuscript
NIH
-PA Author Manuscript
NIH
-PA Author Manuscript
Dewey et al. Page 20
TAB
LE 3
The
Effe
ct o
f Sex
, Age
, Im
age
Qua
lity,
Cor
onar
y C
alci
ficat
ion,
Bod
y M
ass I
ndex
, Hea
rt R
ate,
and
Var
iabi
lity
of H
eart
Rat
e on
Dia
gnos
ticA
ccur
acy
of Q
uant
itativ
e M
DC
T V
ersu
s Qua
ntita
tive
Cor
onar
y A
ngio
grap
hy: V
esse
l Ana
lysi
s
Patie
nt C
hara
cter
istic
AU
C (9
5% C
I)Se
nsiti
vity
(%)
Spec
ifcity
(%)
PPV
(%)
NPV
(%)
Acc
urac
y (%
)PL
RN
LR
DO
R
Sex
M
ale
(n =
636
)0.
91 (0
.88–
0.93
)76
(168
/222
)92
(382
/414
)84
(168
/200
)88
(382
/436
)86
(550
/636
)9.
790.
263
7.6
5
Fe
mal
e (n
= 2
30)
0.89
(0.8
3–0.
95)
70 (3
3/47
)93
(171
/183
)73
(33/
45)
92 (1
71/1
85)
89 (2
04/2
30)
10.7
10.
3233
.47
Age
40
–49
y (n
= 1
58)
0.93
(0.8
9–0.
98)
80 (4
0/50
)94
(102
/108
)87
(40.
46)
91 (1
02 /1
12)
90 (1
42/1
58)
14.4
00.
2168
.57
50
–59
y (n
= 2
89)
0.93
(0.9
0–0.
97)
7 5
( 6 1
/ 81)
95 (1
98/2
08)
8 6
(61/
71)
91 (1
98/2
18)
90 (2
59/2
89)
15.6
60.
2660
.46
60
–69
y (n
= 2
76)
0.88
(0.8
4–0.
93)
77 (7
5/97
)89
(160
/179
)80
(75/
94)
88 (1
60/1
82)
85 (2
35/2
76)
7. 2
80.
252
9 .1
2
≥
70
y (n
= 1
43)
0.87
(0.8
0–0.
94)
61 (2
5 /4
1)91
(93/
102)
74 (2
5/34
)85
(3/1
09)
83 (1
18/1
43)
6.91
0.43
16 .1
4
Imag
e qu
ality
O
ptim
al (n
= 3
84)
0.93
(0.9
0–0.
96)
83 (9
6/11
5)91
(244
/269
)79
(9 6
/121
)93
(244
/263
)89
(340
/384
)9.
220
.19
49.3
5
A
dequ
ate
(n =
397
)0.
91 (0
.87–
0.94
)73
(93/
127)
94 (2
54/2
70)
85 (9
3/10
9)88
(254
/288
)87
(347
/397
)12
.17
0.29
41.9
7
Po
or (n
= 8
5)0.
81 (0
.72–
0.92
)44
(12/
27)
95 (5
5/58
)80
(12/
15)
79 (5
5/70
)79
(67/
85)
8.80
0.59
14.9
4
Cal
cium
scor
e (A
gats
ton
units
)
0
(n =
382
)0.
89 (0
.82–
0.96
)61
( 2
5 /4
1)96
(329
/ 3 4
1)68
(25/
37)
95 (3
29/3
45)
93 (3
54/3
82)
17. 3
30.
4142
.27
1–
100
(n =
335
)0.
86 (0
.81–
0.90
)7
6 (1
0 7/
141
)89
(172
/194
)83
(107
/129
)83
(172
/206
)83
(279
/335
)6.
910.
2725
.62
10
1–60
0 (n
= 1
49)
0.89
(0.8
4–0.
94)
79 (6
9/87
)84
(52/
62)
87 (6
9/79
)74
(52/
70)
81 (1
21/1
49)
4.91
0.25
19.6
4
Bod
y m
ass i
ndex
N
orm
al w
eigh
ta (n =
197
)0.
91 (0
.86–
0.95
)72
(46/
64)
8 9
(119
/ 13
3)
77 (4
6/60
)87
(119
/137
)84
(165
/197
)6.
830.
3125
.30
vO
erw
eigh
tb (n =
417
)0.
90 (0
.86–
0.93
)76
(106
/139
)92
(255
/278
)82
(106
/129
)89
(255
/288
)87
(361
/417
)9.
220.
2635
.46
O
bese
c (n =
252
)0.
92 (0
.88–
0.96
)74
(49/
66)
96 (1
79/1
86)
88 (4
9/56
)91
(179
/196
)90
(228
/252
)19
.73
0.27
73.0
7
Hea
rt ra
te
<
60 b
pm (n
= 5
02)
0.91
(0.8
8–0.
94)
76 (1
12 /1
47)
92 (3
28/3
55)
81 (1
12 /1
39)
90 (3
28/3
63)
88 (4
40/5
02)
10.0
20.
2638
.87
60
–69
bpm
(n =
264
)0.
90 (0
.86–
0.94
)74
(64/
87)
93 (1
65/1
77)
84 (6
4/76
)88
(165
/188
)87
(229
/264
)10
.85
0.28
38.2
6
≥
70
bpm
(n =
100
)0.
90 (0
.84–
0.97
)71
(25/
35)
92 (6
0/65
)83
(25/
30)
86 (6
0/70
)85
(85/
100)
9.29
0.31
30.0
0
Hea
rt ra
te v
aria
bilit
y
≤
6 be
ats p
er sc
an (n
= 6
99)
0.91
(0.8
8–0.
93)
74 (1
60/2
15)
91 (4
42/4
84)
79 (1
60/2
02)
89 (4
42/4
97)
86 (6
02/6
99)
8.58
0.28
30.6
4
AJR Am J Roentgenol. Author manuscript; available in PMC 2012 March 6.

NIH
-PA Author Manuscript
NIH
-PA Author Manuscript
NIH
-PA Author Manuscript
Dewey et al. Page 21
Patie
nt C
hara
cter
istic
AU
C (9
5% C
I)Se
nsiti
vity
(%)
Spec
ifcity
(%)
PPV
(%)
NPV
(%)
Acc
urac
y (%
)PL
RN
LR
DO
R
>
6 be
ats p
er sc
an (n
= 1
67)
0.92
(0.8
6–0.
97)
76 (4
1/54
)9
8 (1
11/ 1
13 )
95 (4
1/43
)9
0 (1
11 /
12 4
)91
(152
/167
)42
.90
0.25
171.
6
Not
e—A
UC
= a
rea
unde
r rec
eive
r ope
ratin
g ch
arac
teris
tic c
urve
, PPV
= p
ositi
ve p
redi
ctiv
e va
lue,
NPV
= n
egat
ive
pred
ictiv
e va
lue,
PLR
= p
ositi
ve li
kelih
ood
ratio
(sen
sitiv
ity /
1 –
spec
ifcity
), N
LR =
nega
tive
likel
ihoo
d ra
tio (1
– se
nsiti
vity
/ sp
ecifc
ity),
DO
R =
dia
gnos
tic o
dds r
atio
(PLR
/ N
LR),
bpm
= b
eats
per
min
ute.
a < 25
kg/
m2 .
b 25–2
9.9
kg/m
2 .
c ≥ 3
0 kg
/m2 .
AJR Am J Roentgenol. Author manuscript; available in PMC 2012 March 6.