Particle size dependence of magnetization and noncentrosymmetry in nanoscale BiFeO3
22
1 Particle size dependence of magnetization and phase transition near T N in multiferroic BiFeO 3 R. Mazumder, S. Ghosh, P. Mondal, Dipten Bhattacharya, * S. Dasgupta, N. Das, and A. Sen Sensor & Actuator Section, Central Glass and Ceramic Research Institute, Calcutta 700 032, India A.K. Tyagi Solid State and Surface Chemistry Section, Bhabha Atomic Research Center, Trombay, Mumbai 400 085, India M. Sivakumar † Ultrasonic Processing Group, National Institute of Advanced Industrial Science and Technology, Nagoya 463-8560, Japan T. Takami and H. Ikuta Department of Crystalline Materials Science, Nagoya University, Nagoya 464-8603, Japan We report results of a comprehensive study of the phase transition at T N (~643 K) as a function of particle size in multiferroic BiFeO 3 system. We employed electrical, thermal, and temperature dependent X-ray diffraction (XRD) studies in order to characterize the transition in a host of samples. We also carried out detailed magnetic measurements over a temperature regime 2-300 K under a magnetic field 100-10000 Oe both on bulk and nano-crystalline systems. While in the bulk system a sharp endothermic peak at T N together with a broad feature, ranging over nearly ~150 K (DT), could be observed in calorimetry, the nanoscale systems exhibit only the broad feature. The characteristic dielectric anomaly, expected at T N , is found to occur both at T O and T N across DT in the bulk sample. The Maxwell-Wagner component due to interfaces between heterogenous regions with different conductivities is also present. The magnetic properties, measured at lower temperature, corroborate our observations in calorimetry. The metastability increases in the nanoscale BiFeO 3 with divergence between zero-field cooled (ZFC) and field cooled (FC) magnetization below ~100 K and faster magnetic relaxation. Interestingly, in nanoscale BiFeO 3 , one also observes finite coercivity at lower temperature which points out that suitable design of particle size and shape may induce ferromagnetism. The inhomogeneous distribution of Bi/Fe-ions and/or oxygen non- stoichiometry seems to be giving rise to broad features in thermal, magnetic as well as in electrical responses. PACS Nos. 75.80.+q, 64.70.Nd, 75.75.+a _______________________________________________________ *Electronic address: [email protected] † Present address: Bharathidasan University, Tiruchirapalli 620024, Tamil Nadu, India
-
Upload
independent -
Category
Documents
-
view
2 -
download
0
Transcript of Particle size dependence of magnetization and noncentrosymmetry in nanoscale BiFeO3

1
Particle size dependence of magnetization and phase transition near TN in multiferroic BiFeO3 R. Mazumder, S. Ghosh, P. Mondal, Dipten Bhattacharya,* S. Dasgupta, N. Das, and A. Sen Sensor & Actuator Section, Central Glass and Ceramic Research Institute, Calcutta 700 032, India A.K. Tyagi Solid State and Surface Chemistry Section, Bhabha Atomic Research Center, Trombay, Mumbai 400 085, India M. Sivakumar† Ultrasonic Processing Group, National Institute of Advanced Industrial Science and Technology, Nagoya 463-8560, Japan T. Takami and H. Ikuta Department of Crystalline Materials Science, Nagoya University, Nagoya 464-8603, Japan We report results of a comprehensive study of the phase transition at TN (~643 K) as a function of particle size in multiferroic BiFeO3 system. We employed electrical, thermal, and temperature dependent X-ray diffraction (XRD) studies in order to characterize the transition in a host of samples. We also carried out detailed magnetic measurements over a temperature regime 2-300 K under a magnetic field 100-10000 Oe both on bulk and nano-crystalline systems. While in the bulk system a sharp endothermic peak at TN together with a broad feature, ranging over nearly ~150 K (∆T), could be observed in calorimetry, the nanoscale systems exhibit only the broad feature. The characteristic dielectric anomaly, expected at TN, is found to occur both at TO and TN across ∆T in the bulk sample. The Maxwell-Wagner component due to interfaces between heterogenous regions with different conductivities is also present. The magnetic properties, measured at lower temperature, corroborate our observations in calorimetry. The metastability increases in the nanoscale BiFeO3 with divergence between zero-field cooled (ZFC) and field cooled (FC) magnetization below ~100 K and faster magnetic relaxation. Interestingly, in nanoscale BiFeO3, one also observes finite coercivity at lower temperature which points out that suitable design of particle size and shape may induce ferromagnetism. The inhomogeneous distribution of Bi/Fe-ions and/or oxygen non-stoichiometry seems to be giving rise to broad features in thermal, magnetic as well as in electrical responses. PACS Nos. 75.80.+q, 64.70.Nd, 75.75.+a _______________________________________________________ *Electronic address: [email protected] †Present address: Bharathidasan University, Tiruchirapalli 620024, Tamil Nadu, India

2
I. INTRODUCTION The multiferroics, with, at least, two of the three orders or degrees of freedom –
(anti)ferromagnetic, (anti)ferroelectric, and ferroelastic – co-existing and often a coupling
among them, are rare in nature as transition metal ions with active d-electrons often tend
to reduce the off-center distortion necessary for ferroelectricity.1 It has been pointed out
by a recent theoretical work2 that additional electronic mechanism (mainly s2 lone pair at
another site) provides the driving force for ferroelectricity. Since their first observation
by Smolenskii and co-workers3 in 1958, three different classes of multiferroic systems
could be identified - RMnO3 (where R = Dy, Tb, Ho, Y, Lu, etc.), RMn2O5 (where R =
Nd, Sm, Dy, Tb), and BiBO3-type (where B = Mn, Fe). Such systems depict magneto-
electric coupling and, therefore, magnetic polarization can be achieved by electric field
and vice versa. Recently, there has been a renewed interest4 in multiferroic systems due
to the observation of orders of magnitude large magneto-electric coupling and the
application potential of these systems in a range of devices based on ‘spintronics’–
magneto-electric sensors, electrically driven magnetic data storage and recording devices,
magneto-capacitive devices, nonvolatile memories etc. Direct evidence of linear coupling
between electric and magnetic domains could be observed in YMnO3 using non-linear
optics – optical second harmonic generation.5 However, the temperature range over
which the multiferroic behavior is observed varies from system to system. For instance,
RMnO3 (space group P63cm), and RMn2O5 (space group Pbam) systems depict
multiferroic properties at lower temperature (<100 K).6 In BiMnO3 (space group C2) too,
ferromagnetic and ferroelectric order co-exist below ~105 K. The BiFeO3 system (space
group R3c) is interesting, in this respect, as it depicts ferroelectric order below TC ~ 1110
K and antiferromagnetic order below TN ~ 643 K. Therefore below TN, one expects
coupling between electric and magnetic domains.
The multiferroic nature of BiFeO3 is due to stereochemical activity associated
with the 6s2 lone pair of Bi3+. It results in lowering of structural symmetry and hence
ferroelectricity.7 The magnetic order is little complicated with ferromagnetic coupling
within a plane and antiferromagnetic coupling between two adjacent planes. Due to
antisymmetric Dzyaloshinsky-Moriya (DM) exchange interaction, canted

3
antiferromagnetism may develop. However, a spiral spin structure is superimposed on
this antiferromagnetic order in which the antiferromagnetic axis is rotated through the
crystal and develops an incommensurate order.8 The magneto-electric coefficient (dE/dH)
is found to vary within 3V/cm.Oe across a temperature range 77-300 K.9 Weak
magnetization, however, restricts its large scale use in several devices. One needs to
explore whether large magnetization can be induced in these systems by doping and/or
structural manipulation. In other words, one needs a thermodynamically stable system
with both ferromagnetism and ferroelectricity existing above room temperature. BiFeO3
could not be exploited for any novel application for two major problems: (i) weak
magnetization as it is essentially an antiferromagnet below TN and (ii) large loss factor
because of oxygen non-stoichiometry. Therefore, even though magneto-electric coupling
could be observed above room temperature, unlike CdCr2S4 [Ref. 10] complete
ferroelectric polarization flop cannot be achieved in BiFeO3 by magnetic field sweeping.
It has recently been observed11 that in thin film BiFeO3, finite magnetization of the order
of ~1µB/Fe prevails even above room temperature. The origin of such magnetization is a
bit controversial.12 It has been proposed, however, that such finite magnetization could
result from increased canting.13 A suitable doping at Bi- and/or Mn-site, on the other
hand, helps in minimizing the conductivity and hence the loss factor.14 It will be
interesting to explore whether both the problems can be addressed and tackled in
nanoscale BiFeO3.
In this paper, we report the results of a comprehensive study carried out both on
bulk and nanoscale BiFeO3 for exploring the phase transition features near TN as well as
the low temperature magnetic properties. We employed dc resistivity, dielectric
measurements, differential scanning calorimetry (DSC), differential thermal analyses
(DTA), dilatometry, temperature dependent X-ray diffraction, and detailed magnetic
measurements in order to systematically record the behaviors of the bulk and nano-
system below and above the phase transition point. It appears that the local
inhomogeneity as well as oxygen non-stoichiometry across the sample volume has a
major role to play in governing all the properties.

4
II. EXPERIMENTAL DETAILS
Primarily two types of measurements were carried out on phase pure bulk and
nano-particles of BiFeO3 – thermal and magnetic. The electrical measurements were
carried out only on bulk sintered samples. All the samples have been prepared by
different solution chemistry routes. While bulk ~1 µm size particles have been prepared
by conventional co-precipitation technique, finer 4-50 nm size particles have been
prepared by sonochemical and solution evaporation (tartaric acid template or ferrioxalate
precursor) techniques. In the sonochemical technique, powders are prepared in solution
chemistry route under ultrasonic vibration. A mixed aqueous solution of Bi(NO3)3 and
Fe(NO3)2 – taken in proper stoichiometric ratio – is sonicated by using Ti horn (20 kHz,
1500 W, Vibracell, USA) till the precipitation is complete. A small amount of decalin is
used for proper power transfer and SDS surfactant is also used for preventing
agglomeration. The precipitated powder is collected, washed by alcohol, and dried in a
vacuum oven at ~40oC. In the tartaric acid template technique, aqueous solutions of metal
nitrates were mixed with tartaric acid. The mixed solution was boiled at 150-160oC till
the liquid evaporated out. The green fluffy powder was heated for 1h before calcination.
The tartaric acid template helps in forming heterometallic polynuclear polymeric arrays
where metal ions come in close proximity to yield phase-pure BiFeO3 after in-situ
oxidization. If oxalic acid is used as a template, it forms Bi-ferrioxalate precursor which
undergoes decomposition in presence of oxidizing agent like HNO3. In this case too,
heteronuclear polymeric array, with metal ions, forms. Other organic acids like citric acid
do not give rise to such phase pure BiFeO3 as it tends to form dimeric chain instead of
polynuclear polymeric chain. It appears, therefore, that the formation of heteronuclear
polymeric arrangement prior to oxidization is the key to the formation of phase-pure
BiFeO3. The as-prepared powders were calcined at 400-700oC and the bulk samples
were sintered at ~840oC for 10h. Both the bulk and nanoscale samples were characterized
by X-ray diffraction (XRD) and scanning electron microscopy (SEM) studies. In
addition, the nano-particles have been studied by transmission electron microscopy
(TEM). The specific surface area of the nano-particles has also been measured. Further
details of the sample preparation and the results of the characterization are available
5
elsewhere.15,16 The crystallite size of the nanoscale systems could be estimated from X-
ray peak broadening by Debye-Scherrer equation using the full width at half maximum
(FWHM) data. The particles sizes could be estimated from BET specific surface area data
as well as directly from TEM photographs. A representative TEM photograph for
nanoscale BiFeO3 is shown in Fig. 1.
The thermal and magnetic measurements have been carried out on powder
samples while electrical measurements have been carried out on sintered pellets. The
differential scanning calorimetry (DSC) study has been carried out in a Perkin-Elmer
Diamond DSC over a temperature range 300-800 K while the differential thermal
analysis (DTA) measurements were carried out in a Shimadzu DTA-50. The heating rate
was 10oC/min in all the cases. The thermal expansion has been measured in an ORTON
dilatometer (Model 1600). The low-frequency (1 Hz – 1 MHz) dielectric measurements
have been carried out in a LCR meter (Hioki Hi-Tester 3652-50). The electrodes have
been prepared by silver coating and the coating was cured at ~600oC in air.
The magnetic measurements have been carried out in a SQUID magnetometer
(MPMS) of Quantum Design. The zero-field cooled (ZFC) and field-cooled (FC)
magnetization vs. temperature patterns have been studied across a temperature range 2-
300 K while magnetic hysteresis loops over ±10000 Oe have been recorded at several
temperatures. We also carried out magnetic relaxation measurements at ~5 K and ~300 K
under ~100 and ~10,000 Oe for both bulk and nanoscale samples.
III. RESULTS AND DISCUSSION
A. Thermal studies
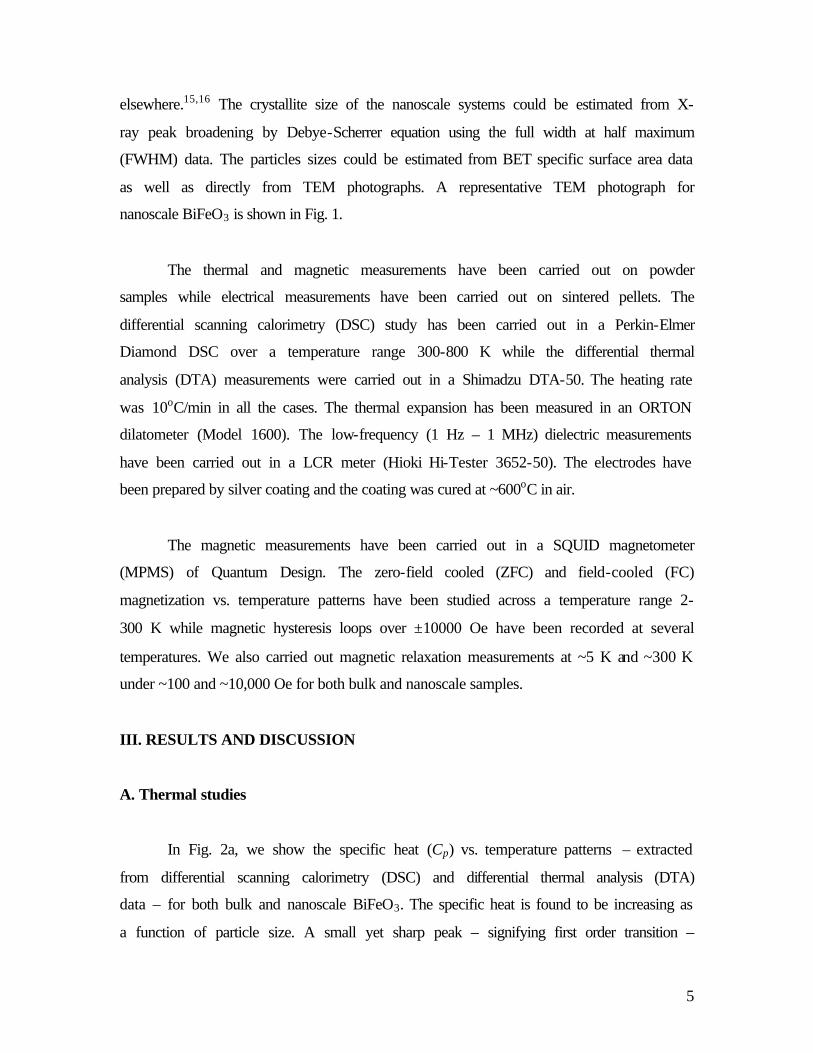
In Fig. 2a, we show the specific heat (Cp) vs. temperature patterns – extracted
from differential scanning calorimetry (DSC) and differential thermal analysis (DTA)
data – for both bulk and nanoscale BiFeO3. The specific heat is found to be increasing as
a function of particle size. A small yet sharp peak – signifying first order transition –

6
could be noticed at ~653 K (TN) in the case of bulk sample. In the inset of Fig. 2a, we
show the (Cp/T) vs. temperature (T) plot of the region around the peak for the bulk
sample. The change in entropy ∆S [= ∫(Cp/T).dT] is estimated to be ~0.0612 J/g.K. In Fig.
2b, we show the thermal expansion data for the bulk sample. The phase transition feature
is clearly evident near TN.
Apart from the rise in specific heat with the increase in particle size, one can also
notice a variation in the phase transition feature with the particle size. For finer particles,
a very broad feature – spanning nearly 150 K – appears while with the increase in particle
size (≥50 nm), the broadness reduces a bit and the feature near TN becomes more
prominent. The absence of a sharp peak clearly points out local inhomogeneity and broad
phase transition across a wide temperature range. Although, such broad feature could be
observed in bulk samples as well, simultaneous presence of sharp peak highlights more
ordering in bulk sample.
The nano-crystalline samples contain primarily inhomogeneous phases where
lattice defects, oxygen non-stoichiometry etc. appear to be sizable. In addition, lattice
strain is also high in nano-crystalline system. The combined effect has given rise to even
smaller scale of homogeneity in nano-system. As a result, at least in global calorimetry,
no clear endothermic peak could be observed. In the absence of a sharp peak in nano-
crystalline samples, it is difficult to identify the phase transition temperature and, hence,
to figure out how the transition point has shifted as a function of particle size. The
absence of a sharp peak in DSC/DTA thermograms is corroborated by the fact that
temperature-dependent XRD patterns (Fig. 3) do not show any clear structural transition
across TN.
B. Electrical studies
In Fig. 4, we show the real part of the dielectric permittivity vs. temperature for
the bulk sample across a temperature range 300-673 K. The impedance (Z*) and modulus
(M*) spectra at different temperatures are shown in Fig. 5. We show here the data

7
corresponding to the frequency range 100 Hz-1MHz. The real dielectric permittivity
[ε’(ω,T)] exhibits two anomalies – at TO and TN – over a temperature span ~150 K (∆T).
The temperature TO marks the onset (~550 K) and TN marks the termination of the
transition process. Along with magnetic transition, BiFeO3 undergoes a structural phase
transition as well, at TN. The structural transition is evident from the peak in DSC
thermogram at TN. Therefore, one expects anomaly in dielectric permittivity due to both
structural transition as well as magneto-electric coupling. Two anomalies across ∆T –
instead of only one at TN – result from broadening of the magnetic and structural
transition due to inhomogeneity. The dielectric permittivity exhibits high value and large
frequency dispersion both below and above the phase transition range ∆T. The loss factor
tanδ varies over a range 0.1-10. These features of the dielectric spectra are characteristic
of Maxwell-Wagner relaxation process. The Maxwell-Wagner component arises from
grain boundary interfaces in these polycrystalline samples as well as from intrinsic
heterogeneity which give rise to broad magnetic transition over a span of ~150 K around
TN. The presence of Maxwell-Wagner relaxation can be further established by the fact
that ε”(ω) tends to a high value as ω tends to zero; in the case of Debye relaxation
process ε”(ω) tends to zero as ω approaches zero. Therefore, the overall dielectric
response appears to be consisting of Maxwell-Wagner component as well as intrinsic
polarization component. We analyzed the impedance spectra and the modulus (M*)
spectra in order to figure out the relaxation time scale (τ) of the intrinsic polarization
component. The extrinsic interface polarization relaxation frequency scale is found to be
within 100-1000 Hz, while the intrinsic polarization relaxation frequency scale turns out
to be 10 kHz – 1 MHz over a temperature range 300-650 K [Fig. 5]. The intrinsic
relaxation time scale (τ) is plotted as a function of temperature (T) in Fig. 6. A broad
anomaly quite akin to that observed in the case of ε’(ω,T) vs. T (Fig. 4) is observed in the
case of τ vs. T pattern. Below the anomaly at TO, the τ vs T pattern turns out be nearly
Arrhenius while above the anomaly too, the pattern appears to be Arrhenius. In the inset
of Figure 6 we show the natural log of four-probe dc resistivity vs 1/T pattern. The
activation energies from both τ-T and resistivity vs. 1/T pattern have been calculated.
While the activation energies, calculated from resistivity data, turn out to be ~0.88 and

8
0.19 eV at below TO and above, they are 0.46 and 0.9 eV over the same temperature
ranges when estimated from relaxation time scale vs. temperature data. The difference in
the values of the activation energies, calculated from resistivity and relaxation time data,
signifies that the mechanism of relaxation of the electric polarization is different from
polaron hopping.
Therefore, the overall dielectric response appears to be consisting of both
Maxwell-Wagner and intrinsic polarization components. Spontaneous ferroelectric order
is expected with no relaxation feature in the case of intrinsic polarization. Yet we observe
a relaxation along with a broad transition. These observations point out that even in the
bulk sample, intrinsic inhomogeneity plays a major role. The inhomogeneity results from
volatility of Bi near the processing temperature 820-850oC and/or oxygen non-
stoichiometry inherent in the complicated crystal chemistry of BiFeO3. In fact, the
polarization (P) vs. field (E) loop in the case of pure BiFeO3 appears to reflect the lossy
nature. The inhomogeneity results in smaller ferroelectric domains with faster relaxation
dynamics. It would have been interesting to study the relaxation dynamics and transition
point in nanoscale system where the scale of inhomogeneity is higher and the
homogeneous cluster size is small. Since sintering leads to growth of nano-grains into
micron size, no electrical measurement could be done on nano-crystalline samples.
C. Magnetic studies
We have measured ZFC, FC magnetization vs. temperature patterns under
different fields as well as hysteresis loops at several temperatures across a range 2-300 K.
The magnetic relaxation pattern has also been observed at different temperatures and
under different fields. In Fig. 7, we show the ZFC and FC magnetization vs. temperature
patterns for both the bulk and nano-crystalline BiFeO3. The bulk system exhibits
antiferromagnetic order below TN ~ 643 K. Therefore, we could not study the
magnetization across the transition point. The magnetization at ~2 K is found to be
~0.016µB/Fe atom under ~100 Oe and ~1.5µB/Fe atom under ~10,000 Oe for the bulk
sample. It drops down to ~0.008µB/Fe atom and 0.7µB/Fe atom, respectively at ~300 K.

9
On the other hand, for nanoscale sample, the low temperature magnetization (at ~2 K) is
found to be nearly equal to what has been observed in the case of bulk sample. But, at
~300 K, the magnetization is higher by a factor of two. For high spin (S = 5/2) Fe3+ ions,
the effective magnetization should be ~5.92µB. Therefore, it appears that the spin
configuration per Fe ion is far from parallel. There are several other important points
worthy of noting in the magnetization vs. temperature data: (i) no divergence between
ZFC and FC data in the case of the bulk sample; (ii) the magnetization changes with
magnetic field; (iii) in the case of nanoscale sample the ZFC and FC magnetization data
diverge below ~100 K; (iv) in all the cases – bulk and nano – the magnetization rises with
decrease in temperature; (v) the temperature below which the magnetization starts rising
is ~50 K for the bulk sample and ~10 K for the nanoscale sample. Interestingly, in the
case of bulk sample an anomaly near ~65 K could be observed in the low-field ZFC data.
The FC as well as high field data, of course, does not depict any such anomaly. This
seems to be because of a metastable secondary antiferromagnetic phase. The origin of
such a phase is still unknown and not previously reported. The nano-particles of the
BiFeO3 do not depict any anomaly around ~65 K.
Because of stable antiferromagnetic order within the temperature range 2-300 K,
no divergence between ZFC and FC magnetization vs. temperature plots could be noticed
in the case of bulk sample. The rise in magnetization below ~50 K could be due to
additional magnetic moment arising out of Bi3+-O2- bonds. The nanoscale sample, on the
other hand, exhibits divergence between ZFC and FC magnetization data below ~100 K
which could be due to the onset of spin glass state. The magnetization at any temperature,
within this regime, depends on history effect – the path followed for reaching the point.
The ZFC data exhibit a broad cusp-like feature below ~100 K which is typical of
nanoscale antiferromagnetic system.19
In Fig. 8, we show the hysteresis loops for bulk and nano-particle systems. For the
bulk BiFeO3 sample, the hysteresis loops at several temperatures exhibit patterns typical
of an antiferromagnetic system with no hysteresis and nearly zero coercivity. The nano-
particle system, on the other hand, exhibits sizable hysteresis and finite coercivity below

10
~100 K. In fact, one can easily notice a deviation from linearity and formation of a
ferromagnetic loop at a lower field. The coercivity at ~5 K is found to be ~450 Oe. An
observation of such high coercivity in nanoscale BiFeO3 is quite significant. This could
be because of lattice strain-induced spin canting or ferromagnetism in nanoscale. It has
been reported earlier, that lattice strain in thin film gives rise to higher magnetism (~1
µB/Fe). The observation of higher coercivity in nanoscale may help in finding a way for
improving magnetization in BiFeO3 which, in turn, will lead to many applications.
In order to find out the stability of the magnetic phases – both at low temperature
(~5 K) and room temperature (~300 K) – in the nano-particle vis-à-vis bulk system, we
measured the magnetic relaxation pattern over a time scale of ~36000s. The relaxation
patterns are shown in Fig. 9. The amount of variation in initial magnetization (M0) with
time (t) varies with temperature, applied field, and sample type - bulk or nano-particle
systems. The initial magnetization decreases with time in the case of low field (~100 Oe)
while it increases with time in the case of higher field (~10000 Oe). In all the cases,
however, the pattern of variation is logarithmic in nature where the magnetization at any
time t follows M(t,T) = M0(T) ± S(T) ln(t/τm) equation; S is magnetic viscosity and is
related to the activation energy, τm is a characteristic time scale. This is a typical flux-
creep pattern. The extent of relaxation in the bulk system is negligible at low temperature
and is very small (~0.53%) at high temperature highlighting the stability of the phase.
The nano-particle system, of course, exhibits large relaxation (~0.61%) at low
temperature and nearly an order of magnitude higher relaxation (~3.7%) than that of the
bulk system at high temperature. The high field relaxation patterns depict a rise in
magnetization. This could be due to metastability in the system. The activation energies
are found to be varying over ~0.08-0.25 eV with field (100 Oe – 10000 Oe) at ~5 K and
over 1.4-10.0 eV at ~300 K. In bulk sample, of course, the variation in the magnetization
is very small both at ~5 and ~300 K. The activation energies for the bulk systems are
found to be enormous – of the order of ~104 eV – reflecting the stability of the magnetic
phases.

11
These results point out that a magnetic state with a higher magnetization and a
finite coercivity develop in the case of nanoscale samples. Of course, the magnetic state
is metastable with lower activation energy and higher relaxation rate. The metastability is
possibly due to spin frustration in nanoscale.
IV. SUMMARY
In summary, we have studied the phase transition near TN as a function of particle
size in multiferroic BiFeO3 system by employing calorimetry, dielectric, and temperature
dependent X-ray diffraction studies. Because of inhomogeneity, the phase transition at TN
is found to become broader – both in bulk and in nanoscale samples. The inhomogeneity
possibly arises from volatility of Bi near the processing temperature as well as
susceptibility of the lattice structure for developing oxygen non-stoichiometry. Such
broader transition gives rise to two anomalies in dielectric permittivity across a range ∆T
in the case of bulk sample. The magnetization vs. temperature data depict a rise in
magnetization at lower temperature for both the cases while an onset of spin glass state in
the case nanoscale sample below ~100 K. The magnetization in the latter case relaxes at a
faster rate and yields lower activation energy. One interesting observation is the
ferromagnetism and finite coercivity at lower temperature (<100 K) in nanoscale which
possibly results from enhanced lattice strain. This result points out that suitable design of
BiFeO3 particles – size and shape – can improve the magnetization of the system.
ACKNOWLEDGEMENT
This work has been carried out under the network program “custom-tailored
special materials” (CMM 0022) of CSIR, Govt. of India. One of the authors (R.M.)
thanks CSIR for a senior research fellowship.

12
REFERENCES 1H. Schmid, Ferroelectrics 162, 317 (1994). 2N.A. Hill, J. Phys. Chem. B 104, 6694 (2000). 3G.A. Smolensky, A.I. Agranovskaya and V.A. Isupov, Sov. Phys. Sol. Stat. 1, 149 (1959). 4See, for example, M. Fiebig, J. Phys. D: Appl. Phys. 38, R123 (2005). 5M. Fiebig, Th. Lottermoser, D. Froelich, A.V. Goltsev, and R.V. Pisarev, Nature (London) 419, 818 (2002). 6T. Kimura, T. Goto, H. Shintani, K. Ishizaka, T. Arima, Y. Tokura, Nature (London) 426, 55 (2003); T. Lottermoser, T. Lonkai, U. Amann, D. Hohlwein, J. Ihringer, and M. Fiebig, Nature (London) 430, 541 (2004); 7P. Baettig, C. Ederer, and N.A. Spaldin, cond-mat/0508362 (2005). 8I. Sosnowska, T. Peterlin-Neumaier, and E. Streichele, J. Phys. C 15, 4835 (1982); C. Ederer and N.A. Spaldin, cond-mat/0407003 (2004). 9M. Mahesh Kumar, A. Srinivas, S.V. Suryanarayana, G.S. Kumar, and T. Bhimasankaram, Bull. Mater. Sc. (India) 21, 251 (1998). 10J. Hemberger, P. Lukenheimer, R. Fichtl, H.-A. Krug von Nidda, V. Tsurkan, A. Loidl, Nature (London) 434, 364 (2005). 11J. Wang et al., Science 299, 1719 (2003). 12W. Eerenstein et al., Science 307, 1203a (2005). 13J. Wang et al., Science 307, 1203b (2005). 14X. Qi, J. Dho, R. Tomov, M.G. Blamire, and J.L. Macmanus-Driscoll, Appl. Phys. Lett. 86, 062903 (2005); Y-K. Jun et al., Solid State Commun. 135, 133 (2005); V.R. Palkar, D.C. Kundaliya, and S.K. Malik, J. Appl. Phys. 93, 4337 (2003). 15S. Ghosh. S. Dasgupta, A. Sen, and H.S. Maiti, J. Am. Ceram. Soc. 88, 1349 (2005). 16S. Ghosh, S. Dasgupta, A. Sen, and H.S. Maiti, Mater. Res. Bull. 40, 2073 (2005). 17See, for example, U.T. Hoechli, K. Knorr, and A. Loidl, Adv. Phys. 39, 405 (1990). 18T. Park et al., Phys. Rev. Lett. 94, 017002 (2005); J.L. Cohn, M. Peterca, and J.J. Neumeier, Phys. Rev. B 70, 214433 (2004); R.S. Freitas, J.F. Mitchell, P. Schiffer, Phys. Rev. B 72, 144429 (2005). 19T.G. Sorop, M. Evangelisti, M. Haase, and L.J. de Jongh, J. Magn. Magn. Mater. 272-276, 1573 (2004).

13
Fig. 1. Typical transmission electron microscopy (TEM) photograph of nanoscale BiFeO3 system. The selected area electron diffraction (SAED) pattern is also shown. The nanoscale particles are crystalline in nature.

14
Fig. 2. (a) The specific heat vs. temperature plots for the bulk and nanoscale BiFeO3; (b) the thermal expansion vs. temperature plot for the bulk BiFeO3 sample. The variation of thermal expansion coefficient (α) with temperature is also shown.
300 400 500 600 700 800 900-0.1
0.0
0.1
0.2
0.3
0.4
0.5
0.6
0.7
0.8
d(∆
L/L)
/dT
(%)
∆L/L
(%)
Temperature (K)
0.0000
0.0002
0.0004
0.0006
0.0008
0.0010
0.0012
0.0014
0.0016
0.0018
(b)
300 400 500 600 700 800 900
-0.1
0.0
0.1
0.2
0.3
0.4
0.5
0.6
0.7
0.8
0.9 TN
(a)
bulk
~50 nm
~22 nm
~11 nm
Cp (
J/g.
K)
Temperature (K)
620 630 640 650 660 670 680
0.00122
0.00124
0.00126
0.00128
0.00130
0.00132
Cp/T
(J/
g.K
2 )
Temperature (K)

15
2θ Fig. 3. X-ray diffraction pattern for nanoscale BiFeO3 at room temperature and above TN.
at ~673 K
at ~300 K

16
Fig. 4. Real part of the dielectric permittivity [ε’(ω,T)] vs. temperature patterns for the bulk BiFeO3 system. Anomalies at TO and TN are quite evident.
300 400 500 600 700 800
102
103
104
105
106
107
108
Temperature (K)
ε'(ω
,T)
10 Hz 100 Hz 1 kHz 10 kHz 1 MHz 100 kHz

17
102 103 104 105 106
0.0000
0.0005
0.0010
0.0015
0.0020
0.0025
0.0030
0.0035(a) 303 K
364 K 433 K 563 K 393 K 478 K
M''(
ω,T
)
Frequency (Hz)

18
Fig. 5. Imaginary modulus (a) and imaginary impedance (b) spectra at different temperatures. The shift of the peak towards higher frequency with rise in temperature signifies dielectric relaxation.
10-1 100 101 102 103 104 105 106 107
10-1
100
101
102
103
104
105 (b)
303 K 343 K 363 K 393 K 423 K 473 K 523 K 573 K
Z''(O
hm)
Frequency (Hz)

19
Fig. 6. The dielectric relaxation time (τ) vs. inverse temperature plot. In the inset the ln(ρdc/T) vs. inverse temperature plot is shown.
0.0016 0.0018 0.0020 0.0022 0.0024 0.0026 0.0028
10-6
10-5
10-4
10-3
10-2
373K
588K
543K
τ(s)
1/T (K-1)
0.0012 0.0016 0.0020 0.0024 0.0028 0.0032
-6
-4
-2
0
2
4
6
8
10
1/T (K-1)
ln(R
/T)
ln(O
hm.K
-1)
800 700 600 500 400
T (K)

20
Fig. 7 (color online). The zero-field cooled and field cooled magnetization vs. temperature plots for the bulk and nanoscale BiFeO3 under the applied fields – 100 Oe and 10000 Oe. The red colored plots are data for ~10000 Oe.
0 50 100 150 200 250 300
0.0006
0.0008
0.0010
0.0012
0.0014
0.0016
Mag
netic
Mom
ent (
emu/
g)
T ~ 65 K
BiFeO3 - bulk
Temperature (K)
Mag
netic
Mom
ent (
emu/
g)
0.05
0.06
0.07
0.08
0.09
0.10
0.11
0.12
0.13
(a)
0 50 100 150 200 250 300 3500.000
0.001
0.002
0.003
0.004
0.005
H ~ 100 Oe
H ~ 1T
Mag
netic
Mom
ent (
emu/
g)
Temperature (K)
Mag
netic
Mom
ent (
emu/
g)
0.00
0.02
0.04
0.06
0.08
0.10
0.12
0.14
0.16
0.18
0.20
BiFeO3-nanoscale (~16 nm)
(b)

21
(a) (b) Fig. 8. The magnetic hysteresis plots for bulk (a) and nanoscale (b) BiFeO3 at different temperatures.

22
( ( Fig. 9. The magnetic relaxation patterns for bulk and nanoscale BiFeO3 under different fields and at different temperatures. BiF-1 and BiF-2 correspond to bulk and nanoscale samples, respectively.