Parametric Optomechanical Oscillations in Two-dimensional Slot-type High-Q Photonic Crystal Cavities
17
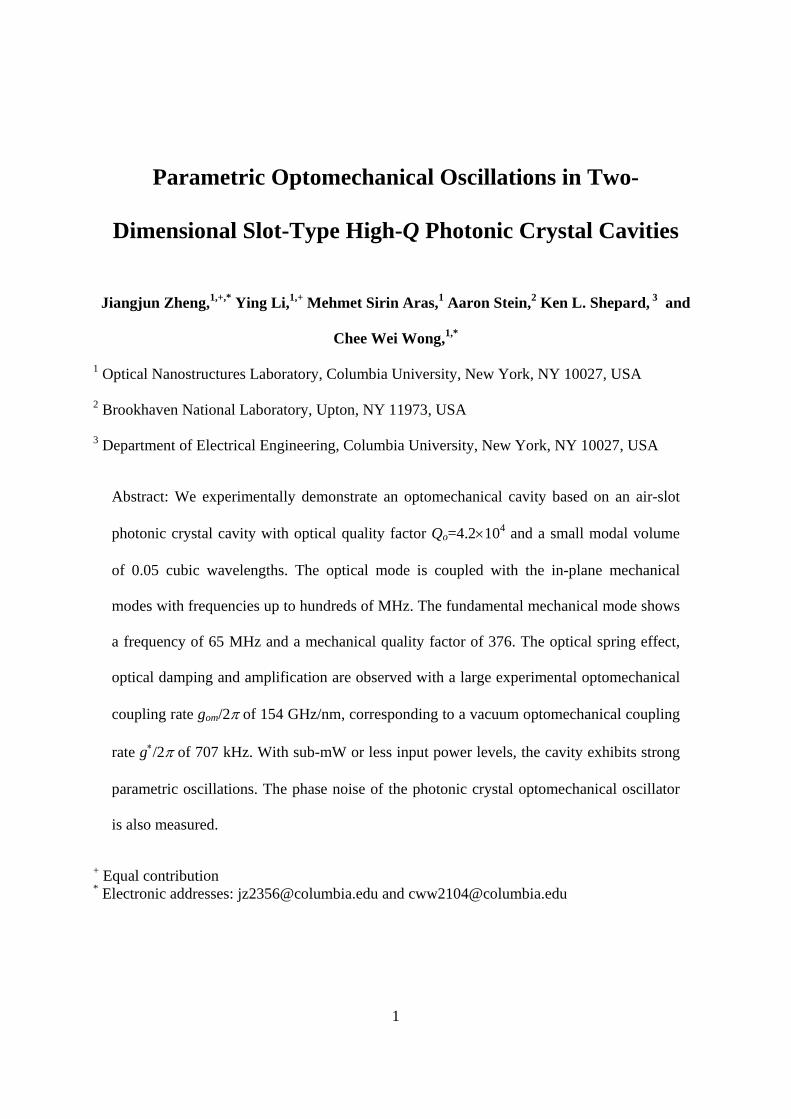
1 Parametric Optomechanical Oscillations in Two- Dimensional Slot-Type High-Q Photonic Crystal Cavities Jiangjun Zheng, 1,+,* Ying Li, 1,+ Mehmet Sirin Aras, 1 Aaron Stein, 2 Ken L. Shepard, 3 and Chee Wei Wong, 1,* 1 Optical Nanostructures Laboratory, Columbia University, New York, NY 10027, USA 2 Brookhaven National Laboratory, Upton, NY 11973, USA 3 Department of Electrical Engineering, Columbia University, New York, NY 10027, USA Abstract: We experimentally demonstrate an optomechanical cavity based on an air-slot photonic crystal cavity with optical quality factor Q o =4.210 4 and a small modal volume of 0.05 cubic wavelengths. The optical mode is coupled with the in-plane mechanical modes with frequencies up to hundreds of MHz. The fundamental mechanical mode shows a frequency of 65 MHz and a mechanical quality factor of 376. The optical spring effect, optical damping and amplification are observed with a large experimental optomechanical coupling rate g om /2 of 154 GHz/nm, corresponding to a vacuum optomechanical coupling rate g /2 of 707 kHz. With sub-mW or less input power levels, the cavity exhibits strong parametric oscillations. The phase noise of the photonic crystal optomechanical oscillator is also measured. + Equal contribution * Electronic addresses: [email protected] and [email protected]
-
Upload
independent -
Category
Documents
-
view
1 -
download
0
Transcript of Parametric Optomechanical Oscillations in Two-dimensional Slot-type High-Q Photonic Crystal Cavities
1
Parametric Optomechanical Oscillations in Two-
Dimensional Slot-Type High-Q Photonic Crystal Cavities
Jiangjun Zheng,1,+,* Ying Li,1,+ Mehmet Sirin Aras,1 Aaron Stein,2 Ken L. Shepard, 3 and
Chee Wei Wong,1,*
1 Optical Nanostructures Laboratory, Columbia University, New York, NY 10027, USA
2 Brookhaven National Laboratory, Upton, NY 11973, USA
3 Department of Electrical Engineering, Columbia University, New York, NY 10027, USA
Abstract: We experimentally demonstrate an optomechanical cavity based on an air-slot
photonic crystal cavity with optical quality factor Qo=4.2104 and a small modal volume
of 0.05 cubic wavelengths. The optical mode is coupled with the in-plane mechanical
modes with frequencies up to hundreds of MHz. The fundamental mechanical mode shows
a frequency of 65 MHz and a mechanical quality factor of 376. The optical spring effect,
optical damping and amplification are observed with a large experimental optomechanical
coupling rate gom/2 of 154 GHz/nm, corresponding to a vacuum optomechanical coupling
rate g/2 of 707 kHz. With sub-mW or less input power levels, the cavity exhibits strong
parametric oscillations. The phase noise of the photonic crystal optomechanical oscillator
is also measured.
+ Equal contribution * Electronic addresses: [email protected] and [email protected]
2
Photonic crystal (PhC) slab is a versatile platform for optical device development and
scientific observations [1]. By adding defects to photonic crystal slab or waveguide, ultra-small-
volume (V) cavities can be engineered to have a ultra-high optical quality factor Q [2]. The large
Q/V ratio indicates a strong internal optical field, which enables strong on-chip light-matter
interactions due to the optical nonlinearities, such as free-carrier dispersion and two-photon
absorption [3]. In recent years, the field of cavity optomechanics has attracted extensive attention
for investigation of light-structure interactions [4-6]. Due to the improvement of micro- and
nano-fabrication techniques, on-chip devices with unique geometries have been successfully
demonstrated with well-coupled optical and mechanical modes, and much work has been done
on actuation and cooling of their mechanical motions using optical pumps [7]. Compared with
device platforms for microtoroid and microsphese etc., PhC slabs are shown to be an attractive,
flexible platform for developing integrated devices that support well-coupled ultrasmall high-Q
optical modes and small resonant mechanical modes [8,9]. The strong internal optical field of
high-Q/V PhC cavities corresponds to a strong optical force with a low input optical power. The
small size of the resonant mechanical device corresponds to a small physical mass or effective
mechanical mass, which typically leads to a high mechanical frequency. The high mechanical
frequency is important for reaching the sideband resolved regime, and is widely tunable by
varying the geometrical parameters of the photonic crystal cavities [10]. The mechanical Q is
another important factor for optomechanical applications which is proportional to the coherence
time of the mechanical vibrations. It is possible to improve the mechanical Q of the PhC
resonators by carefully engineering the anchor geometries to reduce the radiation losses. In
particular, it is suggested that the radiation losses can be eliminated by anchoring the PhC
resonator to artificial materials with complete mechanical band gaps covering the mechanical
3
resonances [11-13]. Furthermore, the optomechanical coupling rates gom of the reported photonic
crystal cavities are high with well-overlapped optical and mechanical fields [9,10,14]. Among
these cavities, the differential in-plane mechanical modes of the air-slot photonic crystal cavities
show relatively higher optomechanical coupling rates since the optical resonant frequencies are
very sensitive to the slot-width variations [15,16]. In our previous work [15], we have
theoretically investigated the dispersive optomechanical coupling in an air-slot mode-gap
photonic crystal cavity. Here, we experimentally demonstrate the optomechanical properties of
fabricated samples. With a large optomechanical coupling rate, the optical induced spring effect,
damping and amplification of the mechanical modes are observed with measurements in air.
Behaviors above the parametric instability threshold are shown. Finally, the phase noise of the
optomechanical oscillator is analyzed.
The air-slot optomechanical cavity used in these experiments is similar in geometry to the
one examined in our former work [15,17]. An air-slot is created along a regular mode-gap cavity
[18] and holes in the cavity center are shifted by a few nanometers. The device is fabricated in
silicon-on-insulator (SOI) substrate with a 250-nm thick silicon layer on top of a 3-m thick
buried oxide layer. Electron-beam lithography is used to define the device in a 300-nm thick
resist (ZEP520A) coating. After developing, the pattern is transferred onto the silicon layer by
using plasma etching. The remaining resist is removed by the PG solvent remover. Finally, the
device is air-bridged by soaking it in a 5:1 buffered oxide etchant for 7 minutes to remove the
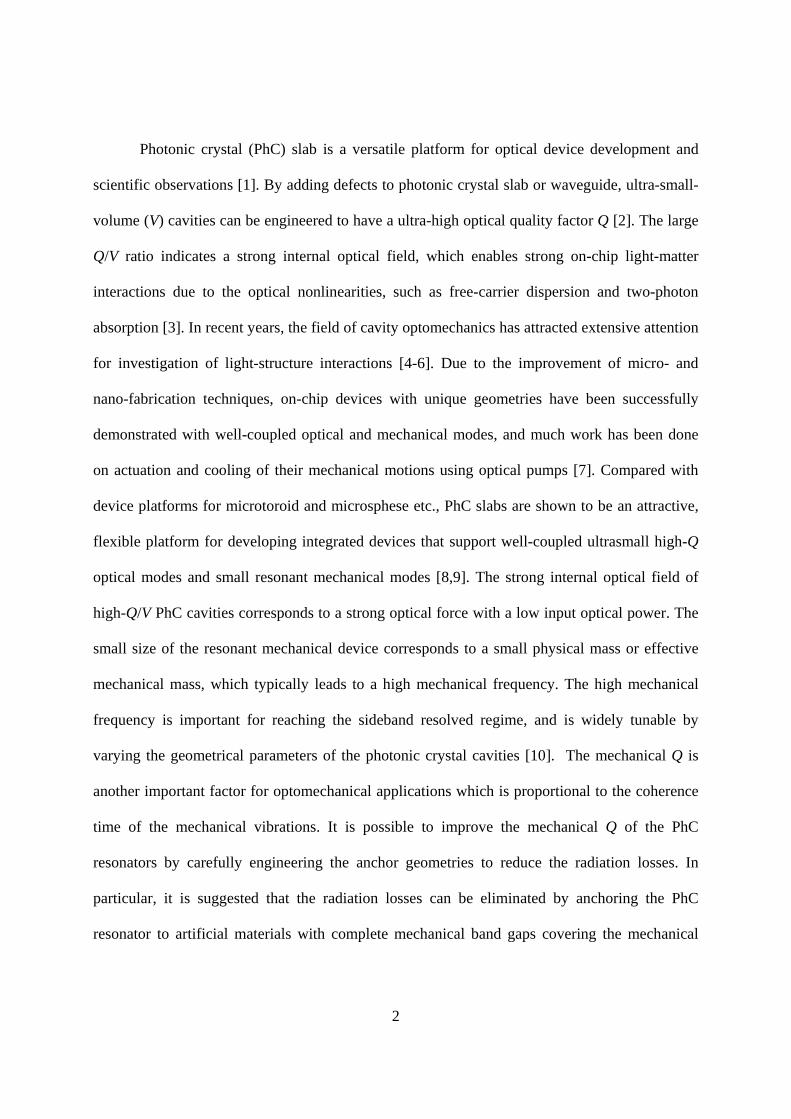
sacrificial oxide under the device. A scanning electron microscope (SEM) image of the
fabricated sample is shown in Fig. 1(a). After calibration, statistical analysis of the SEM image
shows that the measured lattice period a is 525 nm, radius r is 0.375a and slot width s is 105 nm.
The lattice holes at the cavity center are shifted by 15 nm, 10 nm and 5 nm, respectively.
4
The simplified measurement scheme is shown in Fig. 1(c). The light source is a high
performance tunable laser (Santec TSL510 Type C, = 15001630 nm). The polarization state
of the input light is optimized by using a polarization controller (PC). The device under test
(DUT) is probed by a single-mode fiber taper with a single loop created at its thinnest region.
The diameter of the loop is around 70 m. To tune the coupling strength, the lateral taper-cavity
distance is adjusted gradually with a step resolution of 25 nm. The looped fiber taper is then
loaded on one side of the device as shown in Fig. 1(b). It is necessary to anchor the taper to the
device to avoid fiber-taper oscillations due to the optical force when the laser wavelength is
swept across the optical resonances. The optical transmission is monitored by a fast detector
(New Focus Model 1811) and a slow detector simultaneously. The radio-frequency (RF) signal
from another fast detector (New Focus Model 1611-AC) is analyzed by a power spectrum
analyzer (PSA, Agilent E4440A) and an oscilloscope. The phase noise of the optomechanical
oscillator is measured by a phase noise analyzer (Agilent E5052B) which employs the cross-
correlation technique.
Fig. 1(d) shows the optical transmission measurement with two cavity modes examined.
The high-order mode is a relatively delocalized mode at 1575.49 nm. The fundamental mode
with resonant wavelength of 1587.645 nm is the expected high-Q mode based on the mode-gap
effect. The measured loaded quality factor Qtot is 32,900 and the intrinsic quality factor Qint is
42,000. A three-dimensional finite-difference time-domain (FDTD) simulation [19], with the
refractive index of silicon nsi = 3.4, shows that the resonant wavelength for this mode is about
1584.95 nm, which matches our measurement very well. The theoretical intrinsic optical quality
factor is higher than 1.3 106. The measured Qint is much less than the theoretical Q, and is
limited by the fabrication quality and surface-state absorption [16]. The optical mode volume is
5
about 0.051(/nair)3. The electrical field intensity of the cavity mode is also shown in Fig. 1(d).
The maximum field intensity is located at the cavity center in the air slot. Due to its field
distribution feature, the fundamental optical mode is well coupled with the selected differential
in-plane mechanical modes, which will be shown later.
Fig. 1(e) shows the measured RF power spectrum density (PSD) with incident power of
81 W at the blue detuning of the fundamental optical mode. The resolution bandwidth is 10
kHz. Four major peaks are shown with frequencies of 65.68 MHz, 131.22 MHz, 196.93 MHz
and 225.97 MHz. The first peak clearly indicates the fundamental mechanical mode, while the
second and third peaks indicate its second and third harmonics respectively. The high-order
harmonics reflect the nonlinear optomechanical transduction from the Lorentzian optical
lineshape. The mechanical modes are identified by using the finite-element method (FEM). In
the frequency range up to 320 MHz, over sixty mechanical modes are obtained which are
classified into three kinds: in-plane, out-of-plane and twisting modes. Each kind is composed by
mode pairs of differential and common motions. The mechanical modes detected by the optical
method are the modes with relatively large coupling with the optical mode. The optomechanical
coupling rates gom = do/dx are inversely proportional to the optomechanical coupling lengths.
For the Fabry–Pérot cavity, gom is easily determined by the cavity length. For complex cavity
geometries such as the one examined here, gom is derived by using a perturbation theory for
Maxwell’s equations with shifting material boundaries and calculated with the non-perturbed
optical and mechanical fields [20, 21]. For the slot-type cavity here, the resonant optical
frequency is strongly dependent on the slot width. Thus, the differential in-plane mechanical
modes with relatively larger displacements at the cavity center have larger optomechanical
coupling rates. As is expected, two of these modes are founded at frequencies 64.82 MHz and
6
231.41 MHz, which match very well with the experimentally observed major peaks. These two
in-plane mechanical modes exhibit modeled optomechanical coupling rates of gom/2 = 564
GHz/nm and 393 GHz/nm respectively, which are at least fifty times larger than the other
mechanical modes. Their displacement fields are shown in Fig. 1(e). The fundamental
differential in-plane mechanical mode has an effective mass of 6.11 pg and an effective
mechanical volume of 2.62 m3. The vacuum optomechanical coupling rate g*/2 is 2.59 MHz
which is large even for photonic crystal structures. In above simulations, density of silicon is
2.329103 kg/m3, Poisson’s ratio is 0.28, and Young’s modulus is 170 GPa [22].
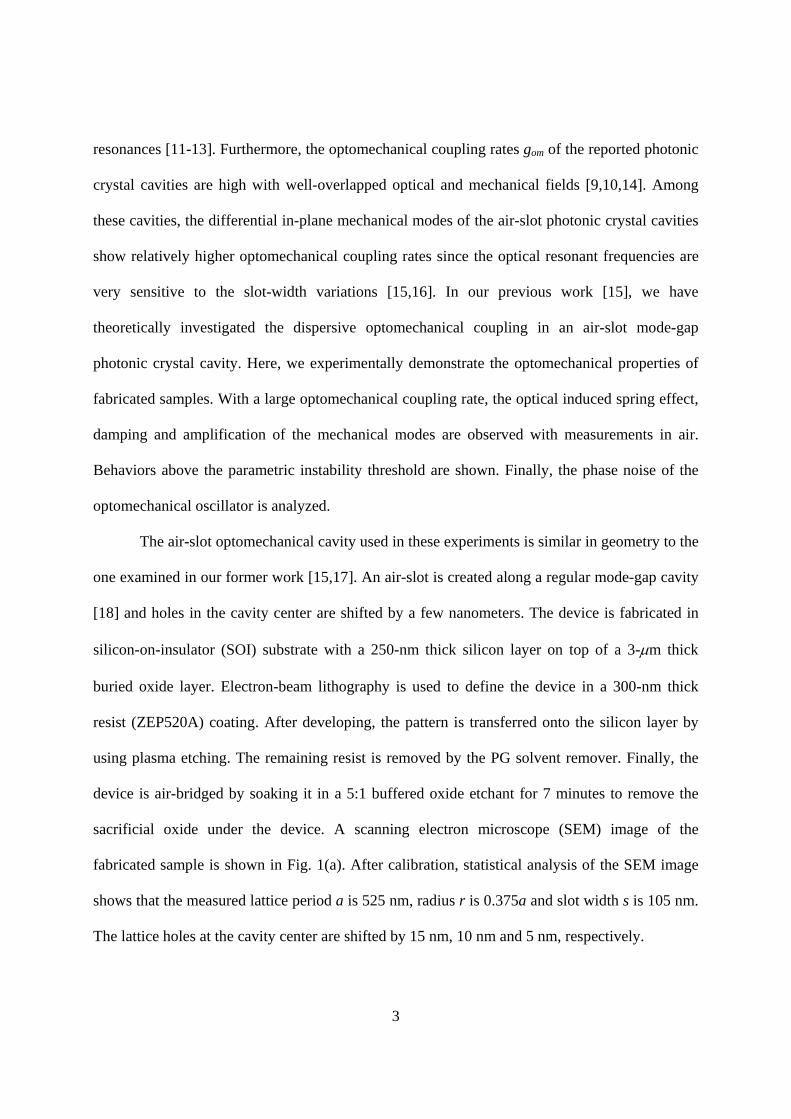
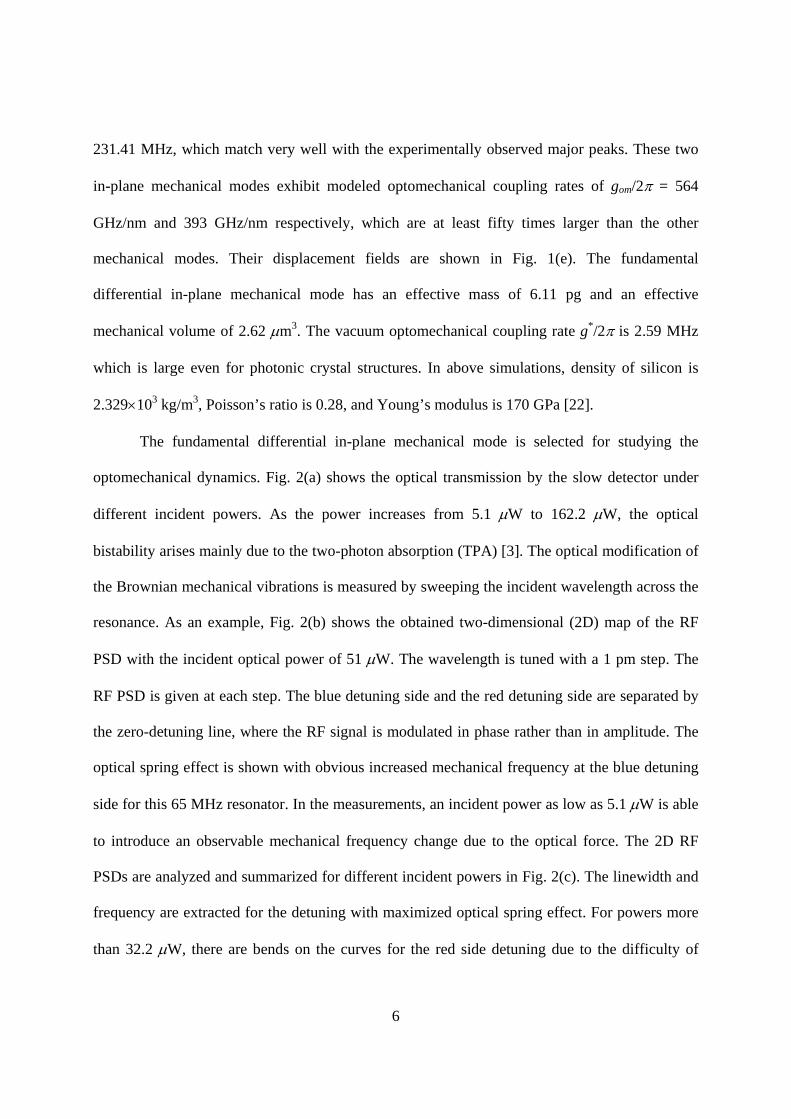
The fundamental differential in-plane mechanical mode is selected for studying the
optomechanical dynamics. Fig. 2(a) shows the optical transmission by the slow detector under
different incident powers. As the power increases from 5.1 W to 162.2 W, the optical
bistability arises mainly due to the two-photon absorption (TPA) [3]. The optical modification of
the Brownian mechanical vibrations is measured by sweeping the incident wavelength across the
resonance. As an example, Fig. 2(b) shows the obtained two-dimensional (2D) map of the RF
PSD with the incident optical power of 51 W. The wavelength is tuned with a 1 pm step. The
RF PSD is given at each step. The blue detuning side and the red detuning side are separated by
the zero-detuning line, where the RF signal is modulated in phase rather than in amplitude. The
optical spring effect is shown with obvious increased mechanical frequency at the blue detuning
side for this 65 MHz resonator. In the measurements, an incident power as low as 5.1 W is able
to introduce an observable mechanical frequency change due to the optical force. The 2D RF
PSDs are analyzed and summarized for different incident powers in Fig. 2(c). The linewidth and
frequency are extracted for the detuning with maximized optical spring effect. For powers more
than 32.2 W, there are bends on the curves for the red side detuning due to the difficulty of
7
setting the laser wavelength to the theoretical optimal detuning. Using a linear fit of the non-
bended parts of the curves, it is obtained that the intrinsic mechanical frequency m/2 is 64.99
MHz and the cold cavity mechanical quality factor Qm is 367. Furthermore, the experimental
optomechanical coupling rate is also obtained with gom/2 = 154.1 GHz/nm, correspond to a
vacuum optomechanical coupling rate of g*/2 = 707.2 kHz. The discrepancy between the
modeled and experimental optomechanical coupling rates is believed to be due to the coupling
with the adjacent flexural mechanical modes [16]. Fig. 2(d) shows the measured and fitted RF
PSDs for a red detuning point (P1) and a blue detuning point (P2) as indicated in Fig. 2(c). For
P1, the mechanical frequency decreases by 345 kHz, and the Brownian motion of this
mechanical mode dampens with an effective Qm of 282.4. On the contrary, for P2 the mechanical
frequency increases by 730 kHz, and the Brownian motion is amplified with a Qm of 1358.3. The
above observations show that the picogram slot-type cavity has a large optomechanical coupling
rate which is of key importance for optomechanical studies. In addition, the mechanical
frequencies for devices with different lengths and PhC lattice constants vary between 50 MHz to
120 MHz in the experiments.
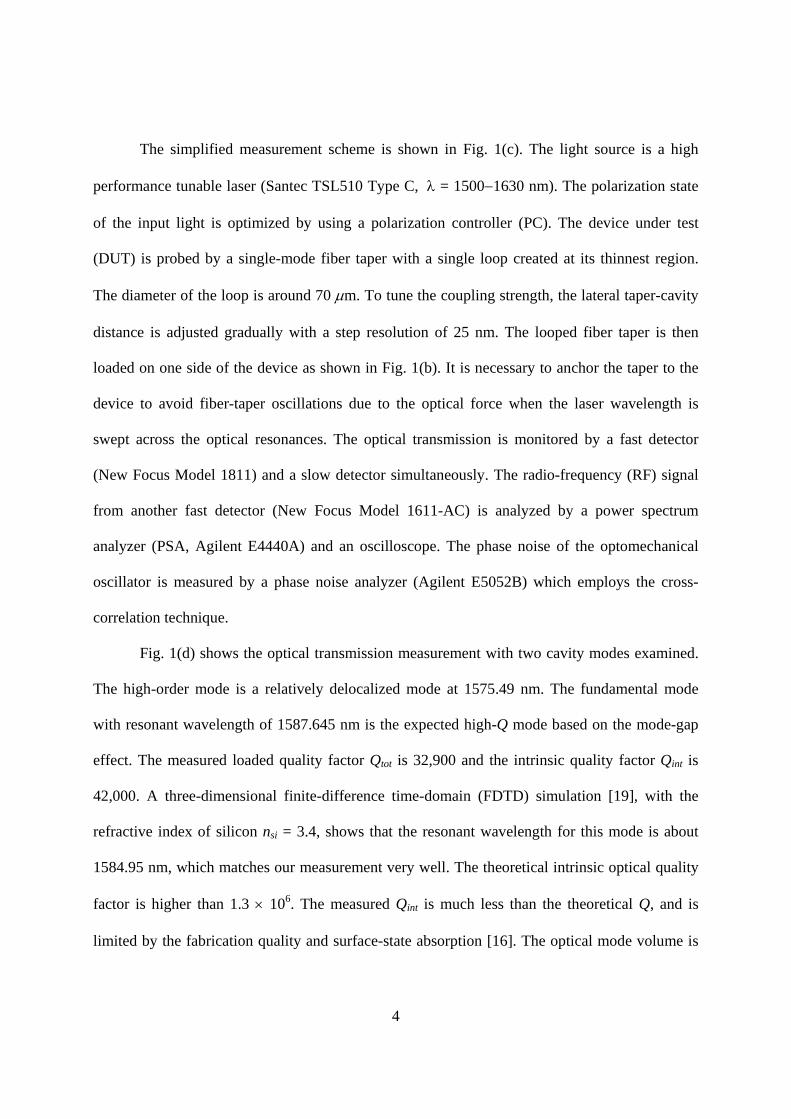
With a proper high input power, the optomechanical cavity starts to oscillate periodically
when the intrinsic mechanical energy dissipation is overcome by the optical amplification. Fig.
3(a) shows the optical transmission for an input power of 520 W by use of an oscilloscope. The
blue line is obtained by the fast detector (New Focus Model 1811), and the red curve is obtained
by using a low-pass filter with a cutoff frequency of 1.9MHz. The optically-driven oscillations
rise suddenly near the wavelength 1587.65 nm which indicates the above-threshold behavior [23].
The filtered signal shows a sudden drop at that wavelength as seen in Fig. 3(a). In Fig. 2(c), the
trend of linewidth for the blue detuning indicates a threshold power slightly higher than 100 W

8
with optimized detuning. This is confirmed by a series of swept-wavelength measurements with
different incident powers. In Fig. 3(b) and (c), the transmission oscillations in frequency and
time domains are given by using a low-noise fast detector with 1 GHz bandwidth (New Focus
Model 1611-AC). It is shown that the detuning gets smaller, the second harmonic get relatively
stronger and a second peak is rising in a single oscillation period. It indicates that the resonant
optical frequency shift induced by optical pump gets comparable to the optical resonance
linewidth. The effective real-time resonant wavelength is smaller than the incident wavelength
for a certain time in a period, which is shown by the normalized real-time detuning in Fig. 3(c).
By using a higher incident power, the nonlinearity of the optical power oscillations will get
stronger due to a larger amplitude of the sinusoidal mechanical vibrations. An example with 1.3-
mW input power is shown in the bottom panel of Fig. 3(b). Harmonics with frequency up to 1
GHz are observed. The lineshape and spectrum show the dynamic interactions of the internal
optical cavity field with the mechanical movement for different detuning and incident power,
which is accurately described by temporal coupled-mode theory [15,24].
With the above-threshold condition satisfied, the optomechanical cavity is viewed as a
self-sustained close-loop oscillator which can be utilized as a photonic clock. The amplitude
noise is suppressed above the threshold due to the inherent amplitude-limiting mechanism
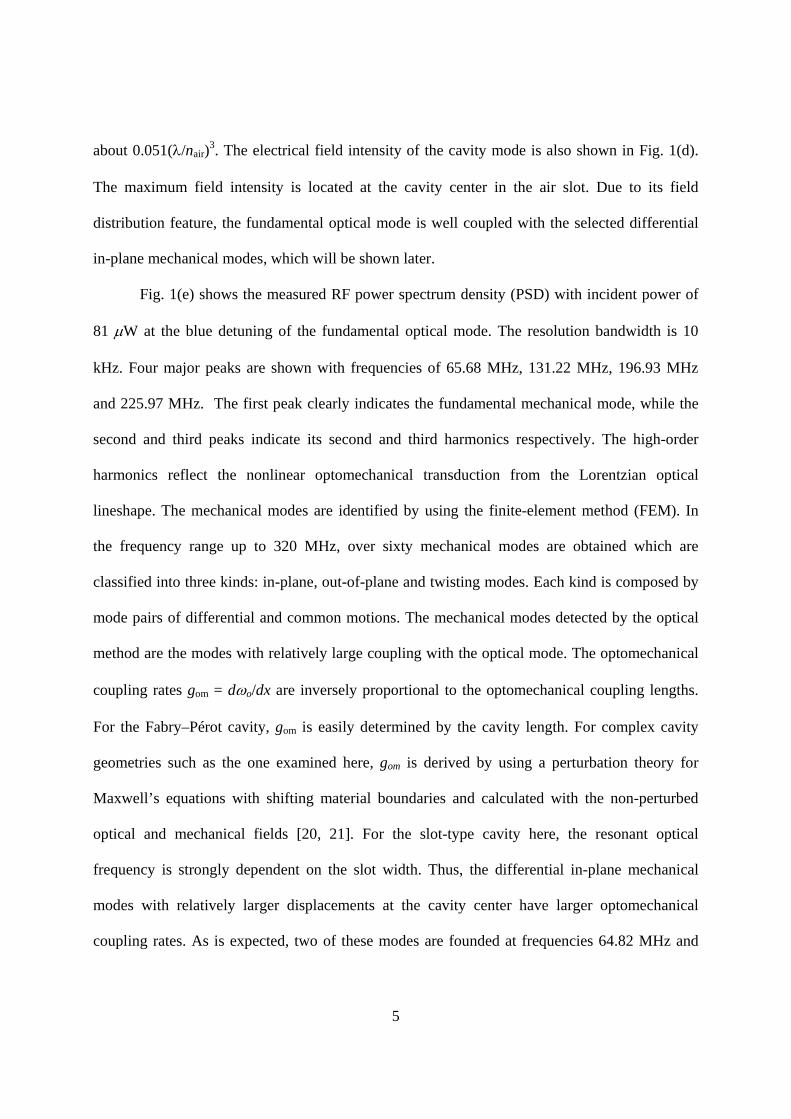
present in harmonic oscillators [25]. The phase noise in the system is measured with phase noise
analyzers for high-precision estimation of the short-term linewidth and can be explained with
Lesson’s model [26]. In this model, there is always a 1/f 3 region at small frequency offsets due
to 1/f noise. After the corner frequency is the 1/f 2 region due to the white frequency noise which
reflects the measurement limitations [27]. Here, the phase noise analyzer (Agilent E5052B)
employs a two-channel cross-correlation technique for accurately analysis of the RF signal
9
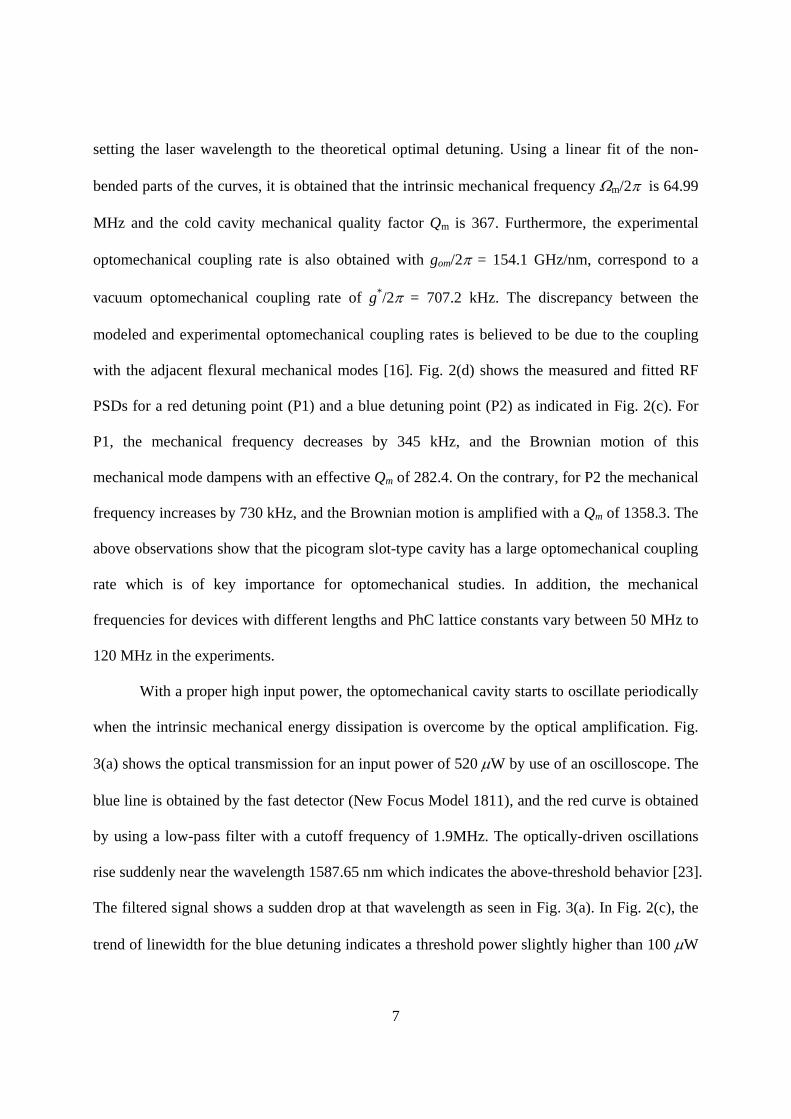
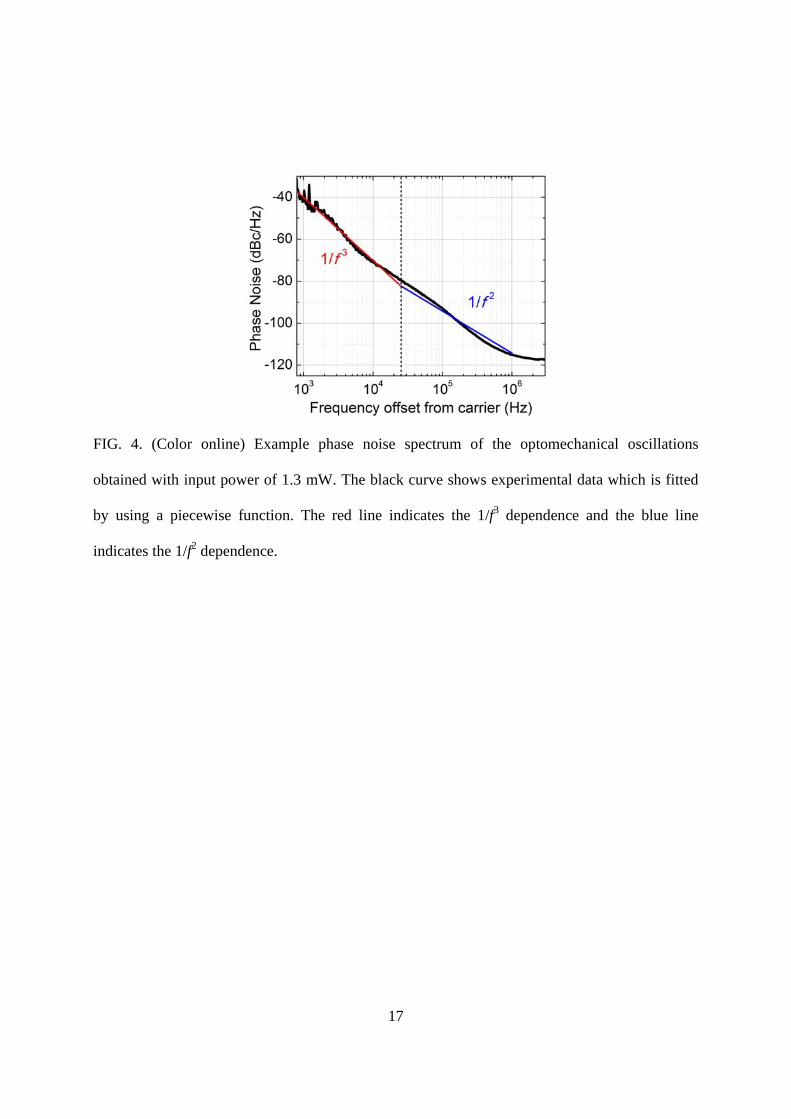
carried by the transmission light. In Fig.4, the typical phase noise versus offset frequency is
obtained with an input laser power of 1.3 mW. By fitting with a piecewise function following
the Lesson’s model, it shows that the corner frequency is 25.4 kHz. For offset frequencies less
than 25.4 kHz, the 1/f3 dependence is predominantly related to relatively slow environmental
vibrations. For offset frequencies larger than 25.4 kHz, the 1/f2 dependence is related to intrinsic
properties of the oscillator. We note that the fitting for the 1/f2 region shows an averaged
dependence rather than a well-matched dependence. The averaged dependence is possibly due to
the noise contamination by coupling to nearby low-Q mechanical modes since the feedback loop
of optomechanical oscillators is inherent. The anchored fiber taper also adds noise to the system
[27]. Assuming a 1MHz offset point in the 1/f2 regime, the phase noise of 117 dBc/Hz there
corresponds to a short-term linewidth of 12.5 Hz. The root-mean-square (RMS) timing jitter
integrated from 1 kHz to 1 MHz offset frequency is 758 ps with major contributions from 1 kHz
to 10 kHz. The RMS timing jitter from 10 kHz to 1 MHz is about 81 ps. In future experiments,
the phase noise performance of the current optomechanical oscillator will be improved by further
engineering the mechanical Q and taking measurements in a more stable environment such as a
vacuum chamber.
In conclusion, we have experimentally demonstrated the optomechanical behaviors of a
slot-type high-optical-Q PhC cavity in air at room temperature. The optical and mechanical
simulations match the experiments well. The optomechanical coupling rate between the selected
mechanical modes and optical modes is quantified at gom/2 = 154 GHz/nm. With the large
optomechanical coupling, the optical spring effect, optical damping and amplification of the
mechanical mode are all clearly exhibited. In the above threshold regime, time-domain
oscillations are observed and the phase noises are analyzed. The device is shown to be a
10
promising candidate for studying optomechanical dynamics and applications. Further
experimental study will focus on improving the optical Q by optimizing the fabrication process
and the mechanical Qm by modifying the anchor geometry [28, 29]. The measured mechanical
frequency is widely tunable by varying geometrical parameters. Additionally, it has the potential
to be improved for more challenging tasks such as side-band resolved cooling of the mechanical
modes and work as a low-power low-noise photon clock.
The authors acknowledge discussions with Hong X. Tang, J. Gao, and J. F. McMillan on
the optomechanical studies, and with Sunil Bhave and Harish Krishnaswamy on the phase noise
measurements. This work is supported by Defense Advanced Research Projects Agency
(DARPA) DSO with program manager Dr. J. R. Abo-Shaeer under contract number C11L10831.
Device fabrication is carried out in part at the Center for Functional Nanomaterials, Brookhaven
National Laboratory, which is supported by the U.S. Department of Energy, Office of Basic
Energy Sciences, under Contract No. DE-AC02-98CH10886.

11
References:
[1]. S. Noda, A. Chutinan, and M. Imada, Nature 407, 608 (2000).
[2]. M. Notomi, E. Kuramochi, and T. Tanabe, Nat. Photonics 2, 741 (2008).
[3]. X. Yang, C. Husko, and C. W. Wong, Appl. Phys. Lett. 91, 051113 (2007); C. Husko, A.
Rossi, S. Combrie, Q. V. Tran, F. Raineri, and C. W Wong, Appl. Phys. Lett. 94, 021111
(2009).
[4]. T. J. Kippenberg, and K. J. Vahala, Opt. Express 15, 17172 (2007).
[5]. M. Li, W. Pernice, C. Xiong, T. Baehr-Jones, M. Hochberg, and H. Tang, Nature 456, 480
(2008).
[6]. D. Van Thourhout, and J. Roels, Nat. Photonics 4, 211 (2010).
[7]. A. Schliesser, R. Rivière, G. Anetsberger, O. Arcizet, and T. J. Kippenberg, Nat. Physics 4,
415 (2008).
[8]. Y.-G. Roh, T. Tanabe, A. Shinya, H. Taniyama, E. Kuramochi, S. Matsuo, T. Sato, and M.
Notomi, Physical Review B 81, 121101R (2010).
[9]. M. Eichenfield, R. Camacho, J. Chan, Kerry J. Vahala, and O. Painter, Nature 459, 550
(2009).
[10]. M. Eichenfield, J. Chan, R. M. Camacho, K. J. Vahala, and O. Painter, Nature 462, 78
(2009).
[11]. S. Mohammadi, A. A. Eftekhar, A. Khelif, and A. Adibi, Opt. Express 18, 9164 (2010).
[12]. Y. Pennec, B. Djafari Rouhani, E. H. EI Boudouti, C. Li, Y. EI Hassouani, J. O. Casseur,
N. Papanikolaou, S. Benchabane, V. Laude, and A. Martinez, Opt. Express 18, 14301 (2010).
[13]. A. H. Safavi-Naeini, and O. Painter, Opt. Express 18, 14926 (2010).
12
[14]. E. Gavartin, R. Braive, I. Sagnes, O. Arcizet, A. Beveratos, T. J. Kippenberg, and I.
Robert-Philip, Phys. Rev. Lett. 106, 203902 (2011).
[15]. Y. Li, J. Zheng, J. Gao, J. Shu, M. S. Aras, and C. W. Wong, Opt. Express 18, 23844
(2010).
[16]. A. H. Safavi-Naeini, T. P. M. Alegre, M. Winger, and O. Painter, Appl. Phys. Lett. 97,
181106 (2010).
[17]. J. Gao, J. F. McMillan, M.-C. Wu, J. Zheng, S. Assefa, and C. W. Wong, Appl. Phys.
Lett. 96, 051123 (2010).
[18]. E. Kuramochi, M. Notomi, S. Mitsugi, A. Shinya, T. Tanabe, and T. Watanabe, Appl.
Phys. Lett. 88, 041112 (2006).
[19]. A. F. Oskooi, D. Roundy, M. Ibanescu, P. Bermel, J. D. Joannopoulos, and S. G. Johnson,
Computer Physics Communications 181, 687-702 (2010).
[20]. S. G. Johnson, M. Ibanescu, M. A. Skorobogatiy, O. Weisberg, J. D. Joannopoulos, Phys.
Rev. E 65, 066611 (2002).
[21]. C. W. Wong, P. T. Rakich, S. G. Johnson, M. Qi, H. I. Smith, E. P. Ippen, L. C.
Kimerling, Y. Jeon, G. Barbastathis, and S.-G. Kim, Appl. Phys. Lett. 84, 1242 (2004)
[22]. M. A. Hopcroft, W. D. Nix, and T. W. Kenny, Journal of Microelectromechanical
systems 19, 229 (2010).
[23]. Q. lin, J. Rosenberg, X. Jiang, K. J. Vahala, and O. Painter, Phys. Rev. Lett. 103, 103601
(2009).
[24]. T. Carmon, H. Rokhsari, L. Yang, T. J. Kippenberg, and K. J. Vahala, Phys. Rev. Lett. 94,
223902 (2005).
13
[25]. M. Hossein-Zadeh, H. Rokhasari, A. Hajimiri, and K. J. Vahala, Phys. Rev. A 74, 023813
(2006). H. Rokhsari, M. Hossein-Zadeh, A. Hajimiri, and K. J. Vahala, Appl. Phys. Lett. 89,
261109 (2006).
[26]. A. Hajimiri, and T. H. Lee, Kluwer Academic Publishers, 2003.
[27]. S.Tallur, S. Sridaran, and S. A. Bhave, Opt. Express 19, 24522 (2011).
[28]. K. Wang, A.-C. Wong, and C. T.-C. Nguyen, J. of Microelectromechanical systems 9,
347 (2000).
[29]. G. Anetsberger, R. Rivière, A. Schliesser, O. Arcizet and T.J. Kippenberg, Nat. Photonics
2, 627 (2008).
14
Figures.
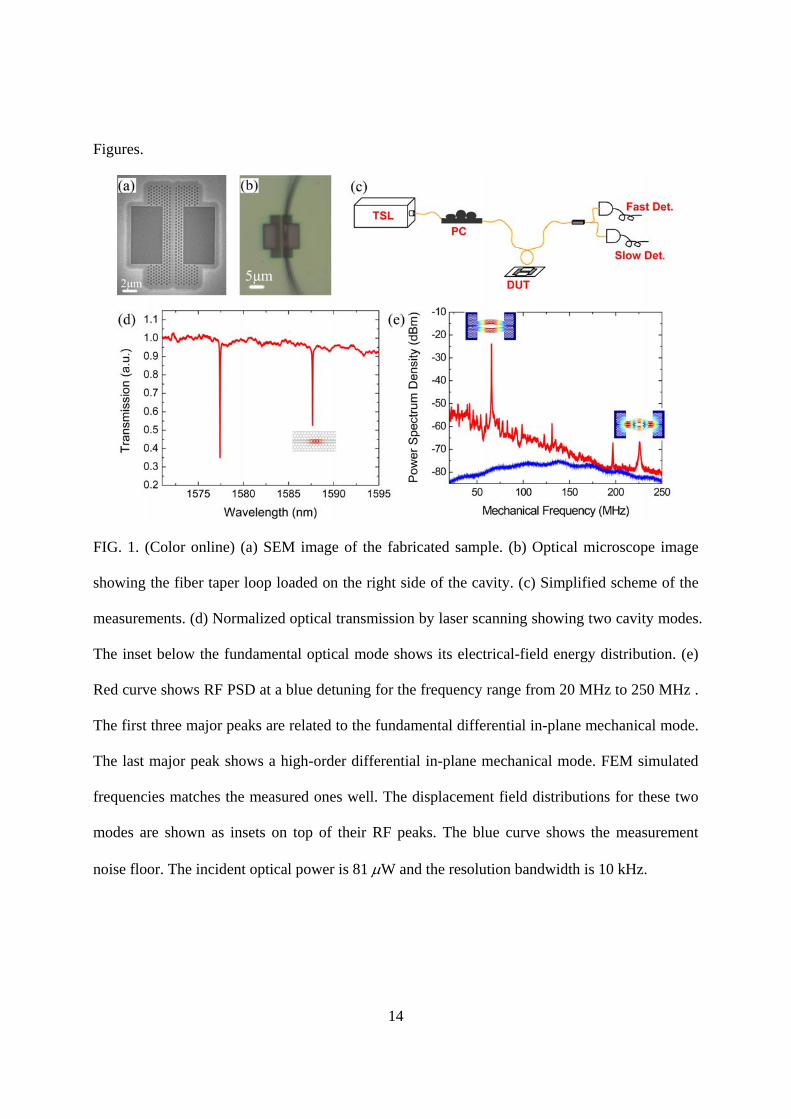
FIG. 1. (Color online) (a) SEM image of the fabricated sample. (b) Optical microscope image
showing the fiber taper loop loaded on the right side of the cavity. (c) Simplified scheme of the
measurements. (d) Normalized optical transmission by laser scanning showing two cavity modes.
The inset below the fundamental optical mode shows its electrical-field energy distribution. (e)
Red curve shows RF PSD at a blue detuning for the frequency range from 20 MHz to 250 MHz .
The first three major peaks are related to the fundamental differential in-plane mechanical mode.
The last major peak shows a high-order differential in-plane mechanical mode. FEM simulated
frequencies matches the measured ones well. The displacement field distributions for these two
modes are shown as insets on top of their RF peaks. The blue curve shows the measurement
noise floor. The incident optical power is 81 W and the resolution bandwidth is 10 kHz.

15
FIG. 2. (Color online) (a) Normalized optical transmission versus wavelength for increasing
incident powers. Black dots for an incident power of 5.1 W, black curves for 32.2 W, 64.9
W, 102.6 W, 128.2 W, and 162.2 W respectively. The red curve is the fitted curve which
gives a total quality factor Qtot = 32,900 and an intrinsic quality factor Qint = 42,000 under a low
incident power. For higher incident powers, the red-shifted sharp edges indicate the thermal
optical bistability. (b) Example RF PSD by sweeping the laser wavelength. (c) Mechanical
frequency and linewidth versus incident power at the optimal detuning for the optical spring
effect. (d) RF PSD for points P1 and P2 indicated in panel (c). The dots are the experimental
values and the solid curves are the fitted.
16
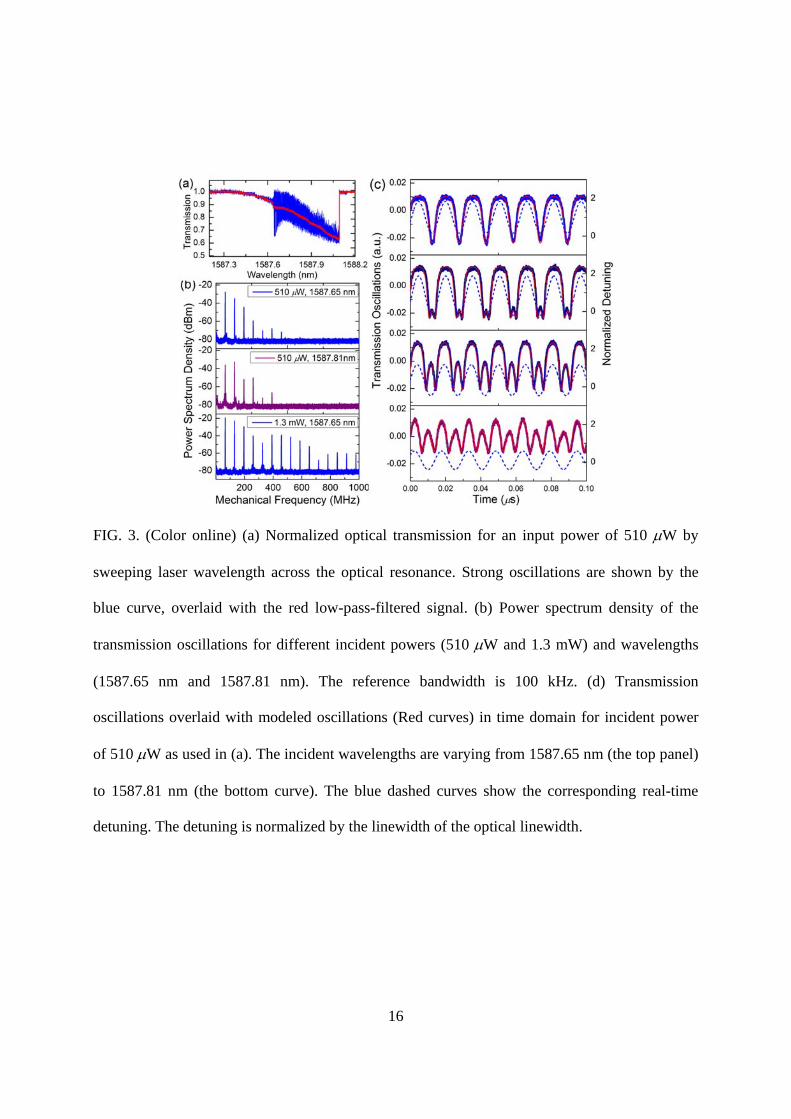
FIG. 3. (Color online) (a) Normalized optical transmission for an input power of 510 W by
sweeping laser wavelength across the optical resonance. Strong oscillations are shown by the
blue curve, overlaid with the red low-pass-filtered signal. (b) Power spectrum density of the
transmission oscillations for different incident powers (510 W and 1.3 mW) and wavelengths
(1587.65 nm and 1587.81 nm). The reference bandwidth is 100 kHz. (d) Transmission
oscillations overlaid with modeled oscillations (Red curves) in time domain for incident power
of 510 W as used in (a). The incident wavelengths are varying from 1587.65 nm (the top panel)
to 1587.81 nm (the bottom curve). The blue dashed curves show the corresponding real-time
detuning. The detuning is normalized by the linewidth of the optical linewidth.
17
FIG. 4. (Color online) Example phase noise spectrum of the optomechanical oscillations
obtained with input power of 1.3 mW. The black curve shows experimental data which is fitted
by using a piecewise function. The red line indicates the 1/f3 dependence and the blue line
indicates the 1/f2 dependence.