‘Oxygen uptake efficiency slope’ in trained and untrained subjects exposed to hypoxia
8
This article appeared in a journal published by Elsevier. The attached copy is furnished to the author for internal non-commercial research and education use, including for instruction at the authors institution and sharing with colleagues. Other uses, including reproduction and distribution, or selling or licensing copies, or posting to personal, institutional or third party websites are prohibited. In most cases authors are permitted to post their version of the article (e.g. in Word or Tex form) to their personal website or institutional repository. Authors requiring further information regarding Elsevier’s archiving and manuscript policies are encouraged to visit: http://www.elsevier.com/copyright
-
Upload
independent -
Category
Documents
-
view
1 -
download
0
Transcript of ‘Oxygen uptake efficiency slope’ in trained and untrained subjects exposed to hypoxia

This article appeared in a journal published by Elsevier. The attachedcopy is furnished to the author for internal non-commercial researchand education use, including for instruction at the authors institution
and sharing with colleagues.
Other uses, including reproduction and distribution, or selling orlicensing copies, or posting to personal, institutional or third party
websites are prohibited.
In most cases authors are permitted to post their version of thearticle (e.g. in Word or Tex form) to their personal website orinstitutional repository. Authors requiring further information
regarding Elsevier’s archiving and manuscript policies areencouraged to visit:
http://www.elsevier.com/copyright
Author's personal copy
Available online at www.sciencedirect.com
Respiratory Physiology & Neurobiology 161 (2008) 167–173
‘Oxygen uptake efficiency slope’ in trained anduntrained subjects exposed to hypoxia
Pascal Mollard a, Xavier Woorons a, Sophie Antoine-Jonville b, Luce Jutand a,Jean Paul Richalet a, Fabrice Favret a, Aurelien Pichon a,∗
a Universite Paris 13, UFR SMBH, STAPS, Laboratoire ‘Reponses Cellulaires et Fonctionnelles a l’hypoxie’,UPRES EA 2363, 74 rue Marcel Cachin, 93017 Bobigny Cedex, France
b Universite Antilles-Guyane, UFR STAPS, Laboratoire ‘Adaptation au Climat Tropical, Exercice et Societe’,UPRES EA 3596, Fouillole, 97100 Pointe A Pitre, France
Accepted 26 January 2008
Abstract
We assessed the ability of the oxygen uptake efficiency slope, whether calculated on 100 and 80% of maximal exercise test duration (OUES100
and OUES80), to identify the change in cardiorespiratory capacities in response to hypoxia in subjects with a broad range of VO2 peak. Four maximalexercise tests were performed in trained (T) and untrained subjects (UT) in normoxia and at 1000, 2500 and 4500 m. The mean reductions inmaximal exercise capacities at 4500 m were the same in T subjects for VO2 peak (−30%), OUES80 (−26%) and OUES100 (−26%) whereas inUT subjects only OUES100 (−14%), but not OUES80 (−20%), was lower compared with VO2 peak (−21%, p < 0.05). OUES100 and OUES80 werecorrelated with VO2 peak and the ventilatory anaerobic threshold in both groups. Multiple regression analyses showed that VO2 peak, OUES100 andOUES80 were significantly linked to O2 arterial-venous difference. The OUES80 could be considered as an interesting sub-maximal index ofcardiorespiratory fitness in normal or hypoxemic subjects unable to reach VO2 peak.© 2008 Elsevier B.V. All rights reserved.
Keywords: Hypoxia; Exercise; Ventilatory response; Testing; OUES; O2 utilisation; Fitness; Training
1. Introduction
The oxygen uptake efficiency slope (OUES) has beenproposed as a useful, objective, non-effort-dependent and sub-maximal index of cardiorespiratory functional reserve (Baba,2000; Baba et al., 1996). The OUES corresponds to the rateof increase in oxygen uptake (VO2 ) in response to ventilation(VE) during an incremental exercise test (VO2 = OUES × log 10VE + b). Derived from the logarithmic relation between VO2 andVE, its dependence towards the duration of the test is limitedand OUES could be used in subjects unable to perform a reallymaximal incremental exercise (Van Laethem et al., 2005). Thisindex has been used to assess aerobic fitness and cardiorespira-tory function in young healthy subjects (Baba, 2000; Baba et al.,1999; Mourot et al., 2004; Pichon et al., 2002), elderly subjects
∗ Corresponding author. Tel.: +33 1 48 38 76 32/6 82 95 19 70;fax: +33 1 48 38 89 24.
E-mail address: [email protected] (A. Pichon).
(Barnes et al., 2003; Hollenberg et al., 2003; Pogliaghi et al.,2007) and in a number of pathologies such as chronic heart fail-ure or ischemia (Baba et al., 1999; Davies et al., 2006; Defoor etal., 2006; Guazzi et al., 2004; Van Laethem et al., 2005, 2006),depression (Hollenberg and Tager, 2000), obesity (Marinov andKostianev, 2003) or renal deficiency (Tsuyuki et al., 2003). TheOUES, even if calculated from only part of the test, is repro-ducible, reliable and highly correlated with the peak oxygenuptake (VO2 peak) or with the ventilatory anaerobic threshold(VAT) (Baba et al., 1999; Defoor et al., 2006; Hollenberg andTager, 2000). However, the interchangeability of OUES withVO2 peak or VAT has been shown to be limited in a large popu-lation of healthy (Pichon et al., 2002) or elderly subjects withischemic heart disease (Van Laethem et al., 2006). Neither theeffects of hypoxemia in patients nor the environmental condi-tions of the test (hypoxia vs. normoxia) on the validity of OUEShave been evaluated yet (Agostoni, 2006).
The OUES, as proposed by Baba et al. (1996), represents howefficiently oxygen is extracted and taken into the body from theair. They proposed that OUES would be linked to the develop-
1569-9048/$ – see front matter © 2008 Elsevier B.V. All rights reserved.doi:10.1016/j.resp.2008.01.006
Author's personal copy
168 P. Mollard et al. / Respiratory Physiology & Neurobiology 161 (2008) 167–173
ment of metabolic acidosis and to the physiologic dead space.However, it seems obvious that OUES would be affected by allparameters acting on both VO2 and VE during incremental exer-cise. Significant decrements in VO2 peak have been reported forsubjects exposed to acute hypoxia when compared to sea level,mainly because of a decrease in oxygen delivery, caused by adrop in arterial oxygen partial pressure (PaO2 ) that cannot befully compensated by an increase in O2 extraction (Ferretti etal., 1997; Mollard et al., 2007a,b). Ventilation is also modifiedin hypoxic conditions at sub-maximal and maximal intensities.Physical training could also enhance the drop in VO2 peak duringhypoxia due to a lower mixed venous O2 pressure and a greaterdiffusion limitation (Woorons et al., 2005). These changes inVO2 peak and VE during hypoxia and training could modify exten-sively the values of OUES. Therefore, hypoxia represents aninteresting stimulus to evaluate the responsiveness of OUES inhypoxemic subjects with a broad range of VO2 peak.
Hence, we assessed if the OUES calculated on 100 and 80%of the test duration (OUES100 and OUES80) is able to identify thechange in cardiorespiratory capacities in response to hypoxia.
2. Methods
2.1. Subjects
In this study we used data obtained in 10 trained (T) and 14untrained (UT) men, without known cardiac, respiratory or otherdisease. The 24 subjects were all sea level natives and residents.None of the subjects were on medication. A physical examina-tion and a 12-lead ECG were performed before the exercise test.The subjects gave their written consent after receiving expla-nations about the aims and risks of maximal exercise test. Thisstudy was approved by Necker’s hospital ethical committee. TheT subjects were runners or triathletes with at least four trainingsessions per week. Subjects were asked to avoid strenuous physi-cal activity 48 h before the tests. Part of the data obtained duringthis study has already been published (Mollard et al., 2007b;Woorons et al., 2006).
2.2. Protocol
Subjects performed four maximal exercise tests on a cycleergometer (Jaeger ER 800, Wurzburg, Germany) in two differ-ent sessions. Each session, composed by two tests and separatedby 3 h of rest with a light lunch, was separated by 7 days.The first test of the first session was always carried out in nor-moxia (inspired oxygen fraction (FIO2
) = 0.209, inspired oxygenpressure (PIO2
) = 150 mmHg). In the other tests, which were ran-domly assigned, we used a FIO2
of 0.187, 0.154, and 0.117(PIO2
of 132, 108, and 81 mmHg, respectively) for the simu-lated altitudes of 1000, 2500 and 4500 m, respectively. Altitudewas simulated using the AltiTrainer200
® (S.M. TEC, Geneva,Switzerland) which produces a normobaric hypoxic mixture(reduced oxygen fraction) by addition of nitrogen in ambientair with a short response time (between 15 and 50 s). The gasmixture passes through a 30 L buffer tank before being inhaledby the subjects. An O2 probe (electrochemical O2 probe MOX3,
City technology, Portsmouth, UK) continuously controls the O2partial pressure of the inhaled gas mixture. The maximal dif-ference between the PO2 measured by the AltiTrainer200
® O2probe and the PO2 calculated from the O2 fraction measuredby an external probe (Servomex 720A, Geneva, Switzerland) isless than 1 mmHg over the whole range of PO2 (150–69 mmHg).This device is reliable for altitudes below 5500 m and ventilationlower than 200 L min−1.
2.3. Incremental exercise test
Before exercise, the subjects breathed the desired gas mixturefor at least 5 min. Then the exercise test began with a 3-minwarm-up at a power output (PO) of 60 W. Thereafter, PO wasincreased by 30 W every 2 min, until the subjects could no longermaintain a pedalling frequency of 70 rpm. The subjects wereverbally encouraged to continue exercising as long as possible.
We used a rigid mouthpiece connected to a “Y” sys-tem fixation with a two-way non-rebreathing valve (Jaeger,Wurzburg, Germany). An inspiratory valve, connected to theAltiTrainer200
® allowed the subject to inhale the hypoxicmixture. Expired gases were collected into a metabograph (Oxy-con, Jaeger, Wurzburg, Germany) to measure expired minutevolume of gas at body temperature and pressure saturated(VEBTPS) and VO2 . Electrocardiogram and heart rate (fH) wererecorded continuously. Transcutaneous arterial O2 saturation(SpO2
) was assessed by an ear pulse oximeter (Ohmeda Biox3740, Louisville, CO, USA) after ear lobe vasodilation with acapsaicin cream (Disalgyl* Monin). The breath-by-breath mea-surements and SpO2
, were averaged over 30 s intervals. Forassessment of VO2 peak, data were averaged over the two high-est 30 s periods, and at least two of the classical criteria weremet. These criteria were (i) stabilization of VO2 despite a fur-ther increase in workload (−150 mL increase over 2 min), (ii)lactate concentration at peak exercise >9 mmol L−1, and (iii) aR > 1.1. The first step reached at VO2 peak was taken as the powerat VO2 peak (PVO2 peak).
2.4. Cardiovascular parameters
We used a bioimpedance method for determination of strokevolume and heart rate (Physioflow, Manatec Type PF05L1,Paris, France). The theoretical basis for this technique andits application and validity for exercise testing have beenpreviously described (Charloux et al., 2000; Richalet et al.,2005). For this experiment, stroke volume (SV) and fH weremeasured continuously during each test with beat-to-beatdata smoothed by a 5 s moving averaging algorithm. Cardiacoutput (Q) calculation by the device is based on the follow-ing formula: Q = fH × SVi × BSA where Q is expressed inL min−1, the stroke volume index (SVi) in mL m−2, and thebody surface area (BSA) in m2. The impedance cardiographyprovides accurate Q measurements during sub-maximal andmaximal exercises (Charloux et al., 2000; Richalet et al.,2005; Richard et al., 2004; Welsman et al., 2005). Parametersof convective O2 transport to the tissue were calculated atmaximal exercise as follows: arterial O2 content (ml L−1):
Author's personal copy
P. Mollard et al. / Respiratory Physiology & Neurobiology 161 (2008) 167–173 169
CaO2max = [Hb] × 1.34 × SaO2/100 (neglecting dissolved O2).Capillary blood from a prewarmed earlobe with a vasodilatingcapsaicin cream (Disalgyl* Monin) was sampled at rest andat maximal exercise to measure hemoglobin concentration andother classical blood gases [Radiometer ABL 700, Copenhagen,Denmark]. When associated with VO2 measurements, it allowsthe estimation of the arterial-venous O2 difference by the Fickequation (D(a-v)O2
= VO2/Q) and the determination of O2extraction (D(a-v)O2
= CaO2 ).
2.5. Determination of sub-maximal indices
The OUES reflects the relationship between oxygen uptake(VO2 in mL min−1) and ventilation (L min−1) and is bestdescribed by a single exponential function in almost all sub-jects. Using the values obtained over the entire test except thefirst 2 min (30 s averaging), the following formula was appliedto the data from each subject: VO2 = a × log 10 VE + b where theconstant ‘a’ was defined as the OUES100 (OUES for 100% ofthe test). The OUES80 was calculated using VO2 and VE valuesobtained up to 80% of the duration of the test before the VO2 peak.
The VAT was determined visually by two independentobservers as the point at which the ventilatory equivalent foroxygen (VE/VO2 ) started to rise nonlinearly while the ven-tilatory equivalent for carbon dioxide (VE/V CO2) remainedunchanged and the respiratory gas exchange ratio did not exceed1.0 (Wasserman et al., 1973). VAT was expressed in ml O2 min−1
and normed by body mass. The power at VAT was also assessed(PVAT).
2.6. Statistical analysis
The results are expressed as mean values ± S.D. Linearregression was used to fit the curve describing the relationbetween VO2 peak and VAT in all the subjects, as well as therelations linking VO2 peak to OUES100 and to OUES80. Pearson’stable was used to assess the significance of these inter-individualrelationships. The parallelism of these relationships (slope andintercepts) between training status and altitudes was assessedusing the Student ‘t’ test. Relationships between VO2 peak,OUES100 or OUES80 with cardiovascular variables (D(a-v)O2
,SV, Q, fH), altitude and training status were assessed by regres-sion analyses. Differences between the two groups of subjects (Tand UT) and the four altitudes were assessed by using MANOVAwith Greenhouse and Geisser adjustments. There is no effect oftest order on any variables. The Newman–Keuls post hoc testwas used to assess significant differences. Student ‘t’ test wasused whenever appropriate. A p value smaller than 0.05 wasconsidered statistically significant.
3. Results
3.1. Maximal indices
The characteristics of the subjects were reported in Table 1.The T subjects showed greater values of VO2 peak, PVO2 peak,
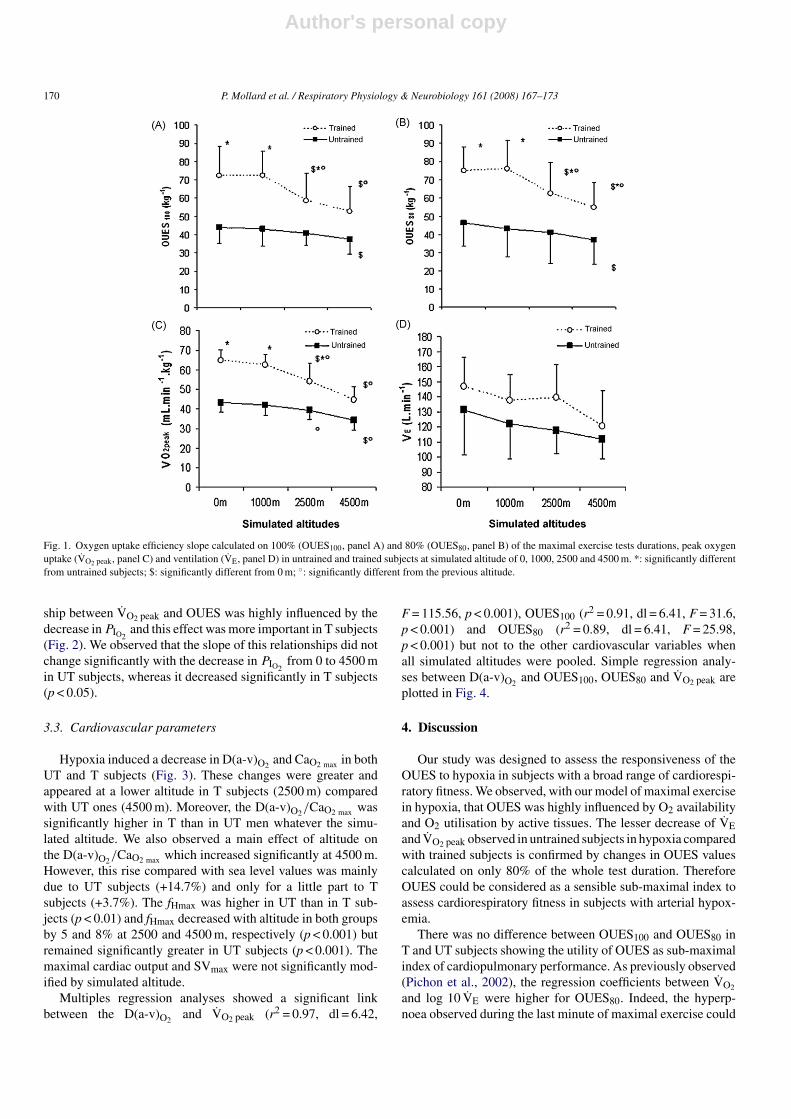
OUES100, OUES80 and PVAT than UT subjects. Hypoxia induceda significant decrease in physical capacities from the simulatedaltitude of 2500 m (Fig. 1) with a greater decrease in T comparedwith UT subjects. The mean reductions in maximal exercisecapacities at 4500 m were the same in T subjects for VO2 peak(−30%), OUES80 (−26%) and OUES100 (−26%) whereas inUT subjects only OUES100 (−14%), but not OUES80 (−20%),was lower compared with VO2 peak (−21%, p < 0.05). VE maxdecreased progressively in T and UT subjects with simulatedaltitude (main effect, p < 0.05) whereas it remained significantlygreater in T subjects (main effect, p < 0.05, Fig. 1).
3.2. Sub-maximal indices
VO2 and log 10 VE were significantly correlated with eachother up to 80% PVO2 peak and 100% PVO2 peak and there wasno effect of altitude or training on the coefficients of correla-tion between these two variables. The OUES80 was similar toOUES100 for all conditions (Fig. 1). We observed significantcorrelations (p < 0.01) between OUES100 or OUES80, VO2 peakand VAT for all conditions (Table 2). However, the relation-
Table 1Anthropometric and physiologic characteristics of the subjects in normoxia
Parameters Untrainedsubjects
Trainedsubjects
p values
Age (years) 27 ± 5 29 ± 5 p = 0.35Height (cm) 178 ± 5 177 ± 9 p = 0.86Weight (kg) 74 ± 9 72 ± 8 p = 0.69OUES100 3233 ± 680 5358 ± 1888* p = 0.0008OUES80 3406 ± 715 5523 ± 1568* p = 0.0021VO2 peak (mL min−1) 3207 ± 531 4718 ± 816* p < 0.0001VO2 peak (mL min−1 kg−1) 43 ± 5 65 ± 6* p < 0.0001P VO2 peak (W) 241 ± 43 344 ± 46* p < 0.0001fHmax (bpm) 191 ± 8 182 ± 9* p = 0.021Rmax 1.2 ± 0.1 1.2 ± 0.1 p = 0.39VE max (L min−1) 131 ± 30 147 ± 20 p = 0.17VAT (mL min−1 kg−1) 23.3 ± 6.2 40.4 ± 8.9* p < 0.0001PVAT (W) 114 ± 43 197 ± 66* p = 0.0008
Values are mean ± S.D. OUES100 and OUES80, oxygen uptake efficiency slopecalculated on 100% and 80% of the maximal exercises tests durations; VO2 peak,peak oxygen uptake; P VO2 peak, power at VO2 peak; fHmax, maximal heart rate;Rmax, maximal respiratory exchange ratio; VE max, maximal minute ventilation;VAT, ventilatory anaerobic threshold; PVAT, power at the ventilatory anaerobicthreshold. *Significantly different from untrained subjects.
Table 2Correlation coefficients between the oxygen uptake efficiency slope calculatedfrom 80% (OUES80) and 100% (OUES100) of the test duration, and the peakoxygen uptake (VO2 peak) or the ventilatory anaerobic threshold (VAT) for allaltitudes
VO2 peak VAT
OUES100
Untrained 0.825◦ 0.759◦Trained 0.890◦ 0.779◦
OUES80
Untrained 0.825◦ 0.834◦Trained 0.854◦ 0.702*
*p < 0.05; ◦p < 0.01.
Author's personal copy
170 P. Mollard et al. / Respiratory Physiology & Neurobiology 161 (2008) 167–173
Fig. 1. Oxygen uptake efficiency slope calculated on 100% (OUES100, panel A) and 80% (OUES80, panel B) of the maximal exercise tests durations, peak oxygenuptake (VO2 peak, panel C) and ventilation (VE, panel D) in untrained and trained subjects at simulated altitude of 0, 1000, 2500 and 4500 m. *: significantly differentfrom untrained subjects; $: significantly different from 0 m; ◦: significantly different from the previous altitude.
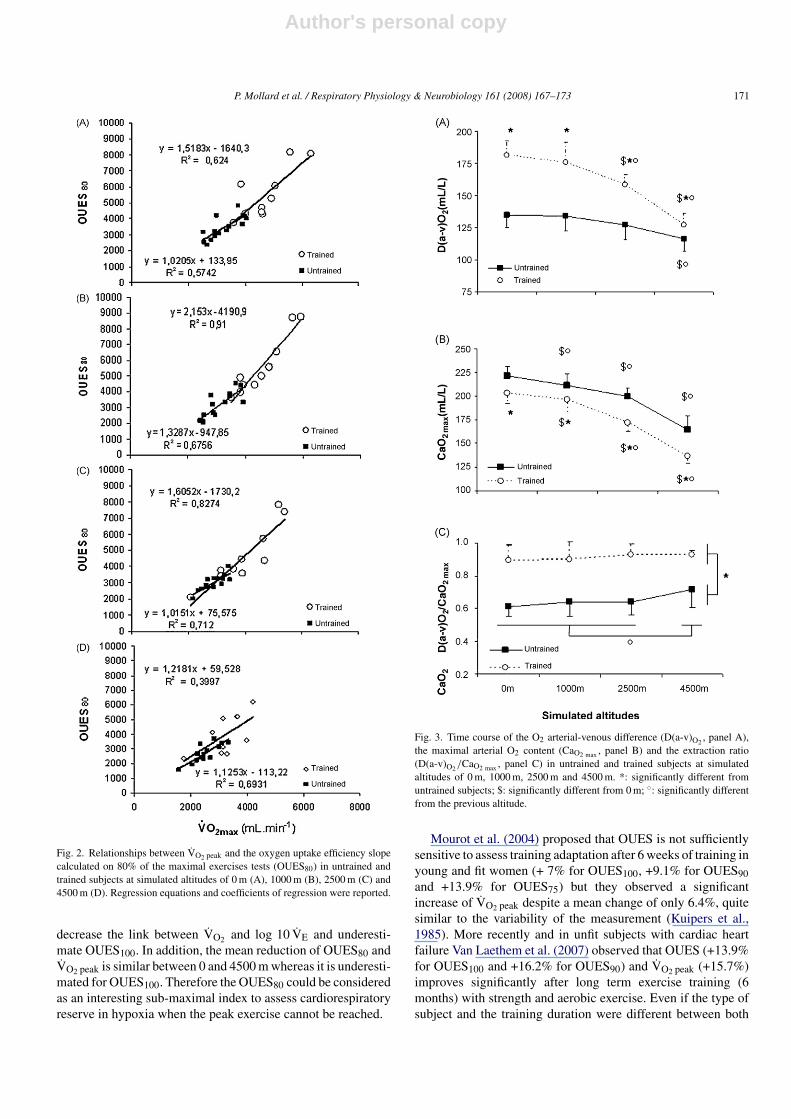
ship between VO2 peak and OUES was highly influenced by thedecrease in PIO2
and this effect was more important in T subjects(Fig. 2). We observed that the slope of this relationships did notchange significantly with the decrease in PIO2
from 0 to 4500 min UT subjects, whereas it decreased significantly in T subjects(p < 0.05).
3.3. Cardiovascular parameters
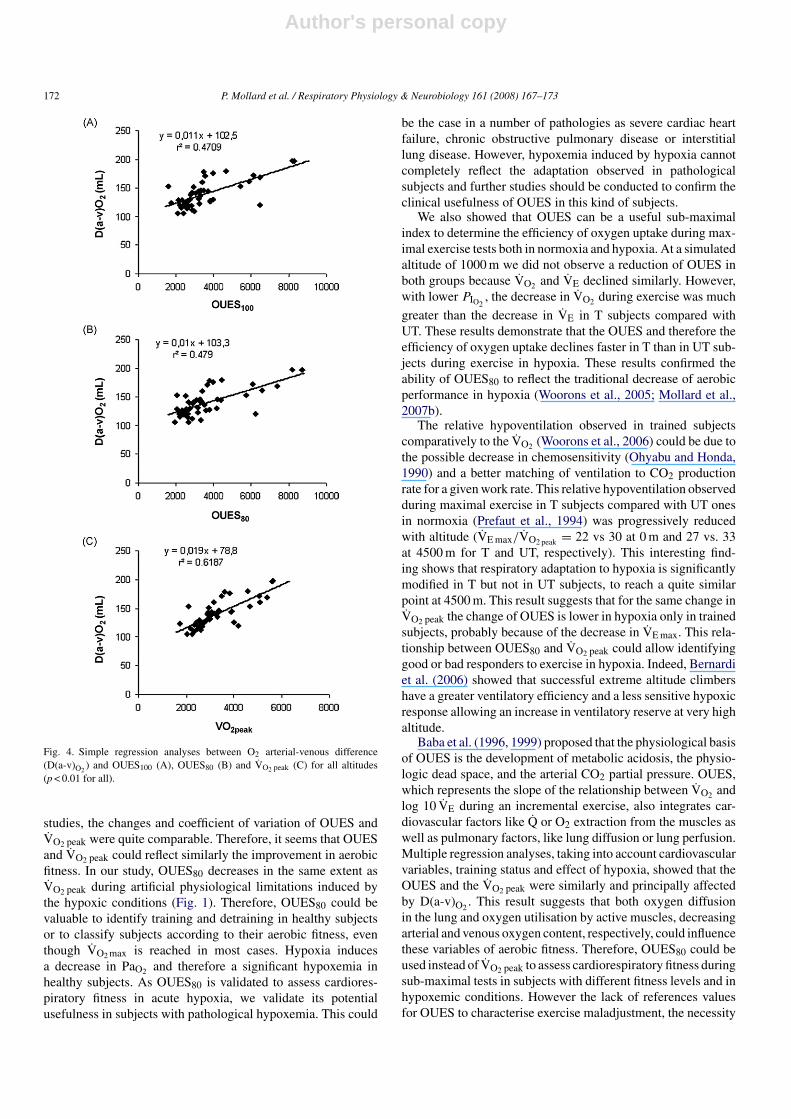
Hypoxia induced a decrease in D(a-v)O2and CaO2 max in both
UT and T subjects (Fig. 3). These changes were greater andappeared at a lower altitude in T subjects (2500 m) comparedwith UT ones (4500 m). Moreover, the D(a-v)O2
/CaO2 max wassignificantly higher in T than in UT men whatever the simu-lated altitude. We also observed a main effect of altitude onthe D(a-v)O2
/CaO2 max which increased significantly at 4500 m.However, this rise compared with sea level values was mainlydue to UT subjects (+14.7%) and only for a little part to Tsubjects (+3.7%). The fHmax was higher in UT than in T sub-jects (p < 0.01) and fHmax decreased with altitude in both groupsby 5 and 8% at 2500 and 4500 m, respectively (p < 0.001) butremained significantly greater in UT subjects (p < 0.001). Themaximal cardiac output and SVmax were not significantly mod-ified by simulated altitude.
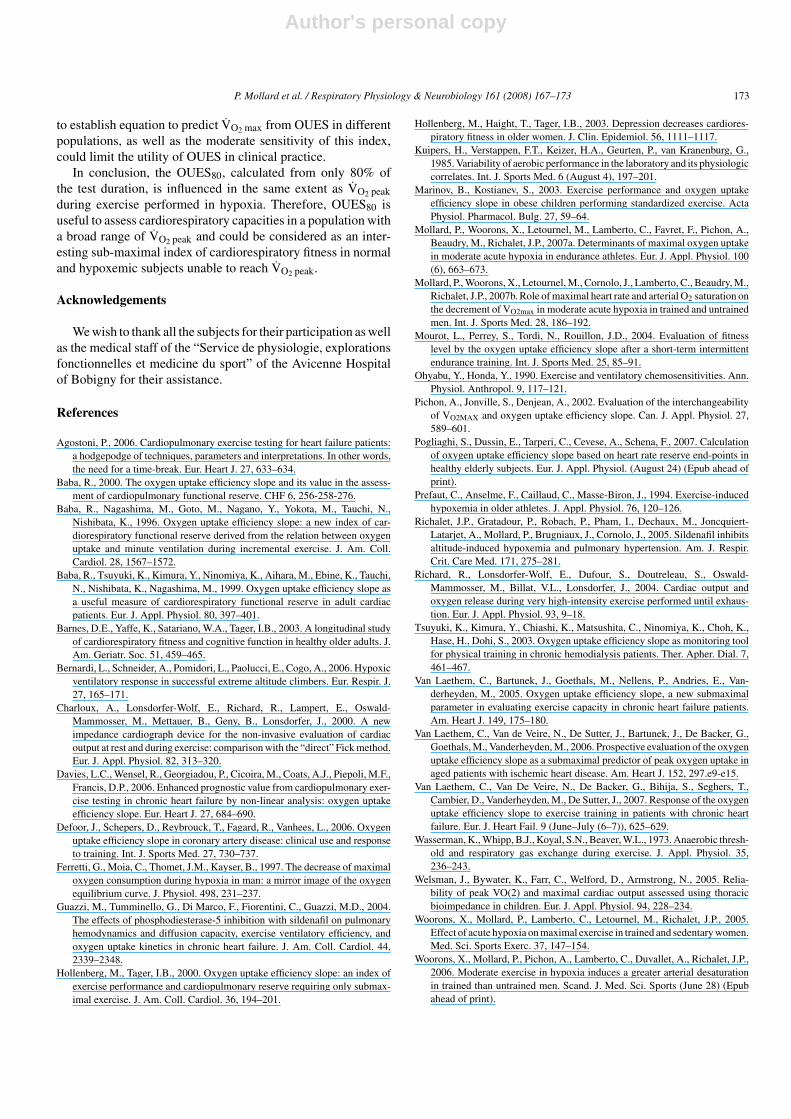
Multiples regression analyses showed a significant linkbetween the D(a-v)O2
and VO2 peak (r2 = 0.97, dl = 6.42,
F = 115.56, p < 0.001), OUES100 (r2 = 0.91, dl = 6.41, F = 31.6,p < 0.001) and OUES80 (r2 = 0.89, dl = 6.41, F = 25.98,p < 0.001) but not to the other cardiovascular variables whenall simulated altitudes were pooled. Simple regression analy-ses between D(a-v)O2
and OUES100, OUES80 and VO2 peak areplotted in Fig. 4.
4. Discussion
Our study was designed to assess the responsiveness of theOUES to hypoxia in subjects with a broad range of cardiorespi-ratory fitness. We observed, with our model of maximal exercisein hypoxia, that OUES was highly influenced by O2 availabilityand O2 utilisation by active tissues. The lesser decrease of VEand VO2 peak observed in untrained subjects in hypoxia comparedwith trained subjects is confirmed by changes in OUES valuescalculated on only 80% of the whole test duration. ThereforeOUES could be considered as a sensible sub-maximal index toassess cardiorespiratory fitness in subjects with arterial hypox-emia.
There was no difference between OUES100 and OUES80 inT and UT subjects showing the utility of OUES as sub-maximalindex of cardiopulmonary performance. As previously observed(Pichon et al., 2002), the regression coefficients between VO2
and log 10 VE were higher for OUES80. Indeed, the hyperp-noea observed during the last minute of maximal exercise could
Author's personal copy
P. Mollard et al. / Respiratory Physiology & Neurobiology 161 (2008) 167–173 171
Fig. 2. Relationships between VO2 peak and the oxygen uptake efficiency slopecalculated on 80% of the maximal exercises tests (OUES80) in untrained andtrained subjects at simulated altitudes of 0 m (A), 1000 m (B), 2500 m (C) and4500 m (D). Regression equations and coefficients of regression were reported.
decrease the link between VO2 and log 10 VE and underesti-mate OUES100. In addition, the mean reduction of OUES80 andVO2 peak is similar between 0 and 4500 m whereas it is underesti-mated for OUES100. Therefore the OUES80 could be consideredas an interesting sub-maximal index to assess cardiorespiratoryreserve in hypoxia when the peak exercise cannot be reached.
Fig. 3. Time course of the O2 arterial-venous difference (D(a-v)O2, panel A),
the maximal arterial O2 content (CaO2 max , panel B) and the extraction ratio(D(a-v)O2
/CaO2 max , panel C) in untrained and trained subjects at simulatedaltitudes of 0 m, 1000 m, 2500 m and 4500 m. *: significantly different fromuntrained subjects; $: significantly different from 0 m; ◦: significantly differentfrom the previous altitude.
Mourot et al. (2004) proposed that OUES is not sufficientlysensitive to assess training adaptation after 6 weeks of training inyoung and fit women (+ 7% for OUES100, +9.1% for OUES90and +13.9% for OUES75) but they observed a significantincrease of VO2 peak despite a mean change of only 6.4%, quitesimilar to the variability of the measurement (Kuipers et al.,1985). More recently and in unfit subjects with cardiac heartfailure Van Laethem et al. (2007) observed that OUES (+13.9%for OUES100 and +16.2% for OUES90) and VO2 peak (+15.7%)improves significantly after long term exercise training (6months) with strength and aerobic exercise. Even if the type ofsubject and the training duration were different between both
Author's personal copy
172 P. Mollard et al. / Respiratory Physiology & Neurobiology 161 (2008) 167–173
Fig. 4. Simple regression analyses between O2 arterial-venous difference(D(a-v)O2
) and OUES100 (A), OUES80 (B) and VO2 peak (C) for all altitudes(p < 0.01 for all).
studies, the changes and coefficient of variation of OUES andVO2 peak were quite comparable. Therefore, it seems that OUESand VO2 peak could reflect similarly the improvement in aerobicfitness. In our study, OUES80 decreases in the same extent asVO2 peak during artificial physiological limitations induced bythe hypoxic conditions (Fig. 1). Therefore, OUES80 could bevaluable to identify training and detraining in healthy subjectsor to classify subjects according to their aerobic fitness, eventhough VO2 max is reached in most cases. Hypoxia inducesa decrease in PaO2 and therefore a significant hypoxemia inhealthy subjects. As OUES80 is validated to assess cardiores-piratory fitness in acute hypoxia, we validate its potentialusefulness in subjects with pathological hypoxemia. This could
be the case in a number of pathologies as severe cardiac heartfailure, chronic obstructive pulmonary disease or interstitiallung disease. However, hypoxemia induced by hypoxia cannotcompletely reflect the adaptation observed in pathologicalsubjects and further studies should be conducted to confirm theclinical usefulness of OUES in this kind of subjects.
We also showed that OUES can be a useful sub-maximalindex to determine the efficiency of oxygen uptake during max-imal exercise tests both in normoxia and hypoxia. At a simulatedaltitude of 1000 m we did not observe a reduction of OUES inboth groups because VO2 and VE declined similarly. However,with lower PIO2
, the decrease in VO2 during exercise was much
greater than the decrease in VE in T subjects compared withUT. These results demonstrate that the OUES and therefore theefficiency of oxygen uptake declines faster in T than in UT sub-jects during exercise in hypoxia. These results confirmed theability of OUES80 to reflect the traditional decrease of aerobicperformance in hypoxia (Woorons et al., 2005; Mollard et al.,2007b).
The relative hypoventilation observed in trained subjectscomparatively to the VO2 (Woorons et al., 2006) could be due tothe possible decrease in chemosensitivity (Ohyabu and Honda,1990) and a better matching of ventilation to CO2 productionrate for a given work rate. This relative hypoventilation observedduring maximal exercise in T subjects compared with UT onesin normoxia (Prefaut et al., 1994) was progressively reducedwith altitude (VE max/VO2 peak = 22 vs 30 at 0 m and 27 vs. 33at 4500 m for T and UT, respectively). This interesting find-ing shows that respiratory adaptation to hypoxia is significantlymodified in T but not in UT subjects, to reach a quite similarpoint at 4500 m. This result suggests that for the same change inVO2 peak the change of OUES is lower in hypoxia only in trainedsubjects, probably because of the decrease in VE max. This rela-tionship between OUES80 and VO2 peak could allow identifyinggood or bad responders to exercise in hypoxia. Indeed, Bernardiet al. (2006) showed that successful extreme altitude climbershave a greater ventilatory efficiency and a less sensitive hypoxicresponse allowing an increase in ventilatory reserve at very highaltitude.
Baba et al. (1996, 1999) proposed that the physiological basisof OUES is the development of metabolic acidosis, the physio-logic dead space, and the arterial CO2 partial pressure. OUES,which represents the slope of the relationship between VO2 andlog 10 VE during an incremental exercise, also integrates car-diovascular factors like Q or O2 extraction from the muscles aswell as pulmonary factors, like lung diffusion or lung perfusion.Multiple regression analyses, taking into account cardiovascularvariables, training status and effect of hypoxia, showed that theOUES and the VO2 peak were similarly and principally affectedby D(a-v)O2
. This result suggests that both oxygen diffusionin the lung and oxygen utilisation by active muscles, decreasingarterial and venous oxygen content, respectively, could influencethese variables of aerobic fitness. Therefore, OUES80 could beused instead of VO2 peak to assess cardiorespiratory fitness duringsub-maximal tests in subjects with different fitness levels and inhypoxemic conditions. However the lack of references valuesfor OUES to characterise exercise maladjustment, the necessity
Author's personal copy
P. Mollard et al. / Respiratory Physiology & Neurobiology 161 (2008) 167–173 173
to establish equation to predict VO2 max from OUES in differentpopulations, as well as the moderate sensitivity of this index,could limit the utility of OUES in clinical practice.
In conclusion, the OUES80, calculated from only 80% ofthe test duration, is influenced in the same extent as VO2 peakduring exercise performed in hypoxia. Therefore, OUES80 isuseful to assess cardiorespiratory capacities in a population witha broad range of VO2 peak and could be considered as an inter-esting sub-maximal index of cardiorespiratory fitness in normaland hypoxemic subjects unable to reach VO2 peak.
Acknowledgements
We wish to thank all the subjects for their participation as wellas the medical staff of the “Service de physiologie, explorationsfonctionnelles et medicine du sport” of the Avicenne Hospitalof Bobigny for their assistance.
References
Agostoni, P., 2006. Cardiopulmonary exercise testing for heart failure patients:a hodgepodge of techniques, parameters and interpretations. In other words,the need for a time-break. Eur. Heart J. 27, 633–634.
Baba, R., 2000. The oxygen uptake efficiency slope and its value in the assess-ment of cardiopulmonary functional reserve. CHF 6, 256-258-276.
Baba, R., Nagashima, M., Goto, M., Nagano, Y., Yokota, M., Tauchi, N.,Nishibata, K., 1996. Oxygen uptake efficiency slope: a new index of car-diorespiratory functional reserve derived from the relation between oxygenuptake and minute ventilation during incremental exercise. J. Am. Coll.Cardiol. 28, 1567–1572.
Baba, R., Tsuyuki, K., Kimura, Y., Ninomiya, K., Aihara, M., Ebine, K., Tauchi,N., Nishibata, K., Nagashima, M., 1999. Oxygen uptake efficiency slope asa useful measure of cardiorespiratory functional reserve in adult cardiacpatients. Eur. J. Appl. Physiol. 80, 397–401.
Barnes, D.E., Yaffe, K., Satariano, W.A., Tager, I.B., 2003. A longitudinal studyof cardiorespiratory fitness and cognitive function in healthy older adults. J.Am. Geriatr. Soc. 51, 459–465.
Bernardi, L., Schneider, A., Pomidori, L., Paolucci, E., Cogo, A., 2006. Hypoxicventilatory response in successful extreme altitude climbers. Eur. Respir. J.27, 165–171.
Charloux, A., Lonsdorfer-Wolf, E., Richard, R., Lampert, E., Oswald-Mammosser, M., Mettauer, B., Geny, B., Lonsdorfer, J., 2000. A newimpedance cardiograph device for the non-invasive evaluation of cardiacoutput at rest and during exercise: comparison with the “direct” Fick method.Eur. J. Appl. Physiol. 82, 313–320.
Davies, L.C., Wensel, R., Georgiadou, P., Cicoira, M., Coats, A.J., Piepoli, M.F.,Francis, D.P., 2006. Enhanced prognostic value from cardiopulmonary exer-cise testing in chronic heart failure by non-linear analysis: oxygen uptakeefficiency slope. Eur. Heart J. 27, 684–690.
Defoor, J., Schepers, D., Reybrouck, T., Fagard, R., Vanhees, L., 2006. Oxygenuptake efficiency slope in coronary artery disease: clinical use and responseto training. Int. J. Sports Med. 27, 730–737.
Ferretti, G., Moia, C., Thomet, J.M., Kayser, B., 1997. The decrease of maximaloxygen consumption during hypoxia in man: a mirror image of the oxygenequilibrium curve. J. Physiol. 498, 231–237.
Guazzi, M., Tumminello, G., Di Marco, F., Fiorentini, C., Guazzi, M.D., 2004.The effects of phosphodiesterase-5 inhibition with sildenafil on pulmonaryhemodynamics and diffusion capacity, exercise ventilatory efficiency, andoxygen uptake kinetics in chronic heart failure. J. Am. Coll. Cardiol. 44,2339–2348.
Hollenberg, M., Tager, I.B., 2000. Oxygen uptake efficiency slope: an index ofexercise performance and cardiopulmonary reserve requiring only submax-imal exercise. J. Am. Coll. Cardiol. 36, 194–201.
Hollenberg, M., Haight, T., Tager, I.B., 2003. Depression decreases cardiores-piratory fitness in older women. J. Clin. Epidemiol. 56, 1111–1117.
Kuipers, H., Verstappen, F.T., Keizer, H.A., Geurten, P., van Kranenburg, G.,1985. Variability of aerobic performance in the laboratory and its physiologiccorrelates. Int. J. Sports Med. 6 (August 4), 197–201.
Marinov, B., Kostianev, S., 2003. Exercise performance and oxygen uptakeefficiency slope in obese children performing standardized exercise. ActaPhysiol. Pharmacol. Bulg. 27, 59–64.
Mollard, P., Woorons, X., Letournel, M., Lamberto, C., Favret, F., Pichon, A.,Beaudry, M., Richalet, J.P., 2007a. Determinants of maximal oxygen uptakein moderate acute hypoxia in endurance athletes. Eur. J. Appl. Physiol. 100(6), 663–673.
Mollard, P., Woorons, X., Letournel, M., Cornolo, J., Lamberto, C., Beaudry, M.,Richalet, J.P., 2007b. Role of maximal heart rate and arterial O2 saturation onthe decrement of VO2max in moderate acute hypoxia in trained and untrainedmen. Int. J. Sports Med. 28, 186–192.
Mourot, L., Perrey, S., Tordi, N., Rouillon, J.D., 2004. Evaluation of fitnesslevel by the oxygen uptake efficiency slope after a short-term intermittentendurance training. Int. J. Sports Med. 25, 85–91.
Ohyabu, Y., Honda, Y., 1990. Exercise and ventilatory chemosensitivities. Ann.Physiol. Anthropol. 9, 117–121.
Pichon, A., Jonville, S., Denjean, A., 2002. Evaluation of the interchangeabilityof VO2MAX and oxygen uptake efficiency slope. Can. J. Appl. Physiol. 27,589–601.
Pogliaghi, S., Dussin, E., Tarperi, C., Cevese, A., Schena, F., 2007. Calculationof oxygen uptake efficiency slope based on heart rate reserve end-points inhealthy elderly subjects. Eur. J. Appl. Physiol. (August 24) (Epub ahead ofprint).
Prefaut, C., Anselme, F., Caillaud, C., Masse-Biron, J., 1994. Exercise-inducedhypoxemia in older athletes. J. Appl. Physiol. 76, 120–126.
Richalet, J.P., Gratadour, P., Robach, P., Pham, I., Dechaux, M., Joncquiert-Latarjet, A., Mollard, P., Brugniaux, J., Cornolo, J., 2005. Sildenafil inhibitsaltitude-induced hypoxemia and pulmonary hypertension. Am. J. Respir.Crit. Care Med. 171, 275–281.
Richard, R., Lonsdorfer-Wolf, E., Dufour, S., Doutreleau, S., Oswald-Mammosser, M., Billat, V.L., Lonsdorfer, J., 2004. Cardiac output andoxygen release during very high-intensity exercise performed until exhaus-tion. Eur. J. Appl. Physiol. 93, 9–18.
Tsuyuki, K., Kimura, Y., Chiashi, K., Matsushita, C., Ninomiya, K., Choh, K.,Hase, H., Dohi, S., 2003. Oxygen uptake efficiency slope as monitoring toolfor physical training in chronic hemodialysis patients. Ther. Apher. Dial. 7,461–467.
Van Laethem, C., Bartunek, J., Goethals, M., Nellens, P., Andries, E., Van-derheyden, M., 2005. Oxygen uptake efficiency slope, a new submaximalparameter in evaluating exercise capacity in chronic heart failure patients.Am. Heart J. 149, 175–180.
Van Laethem, C., Van de Veire, N., De Sutter, J., Bartunek, J., De Backer, G.,Goethals, M., Vanderheyden, M., 2006. Prospective evaluation of the oxygenuptake efficiency slope as a submaximal predictor of peak oxygen uptake inaged patients with ischemic heart disease. Am. Heart J. 152, 297.e9-e15.
Van Laethem, C., Van De Veire, N., De Backer, G., Bihija, S., Seghers, T.,Cambier, D., Vanderheyden, M., De Sutter, J., 2007. Response of the oxygenuptake efficiency slope to exercise training in patients with chronic heartfailure. Eur. J. Heart Fail. 9 (June–July (6–7)), 625–629.
Wasserman, K., Whipp, B.J., Koyal, S.N., Beaver, W.L., 1973. Anaerobic thresh-old and respiratory gas exchange during exercise. J. Appl. Physiol. 35,236–243.
Welsman, J., Bywater, K., Farr, C., Welford, D., Armstrong, N., 2005. Relia-bility of peak VO(2) and maximal cardiac output assessed using thoracicbioimpedance in children. Eur. J. Appl. Physiol. 94, 228–234.
Woorons, X., Mollard, P., Lamberto, C., Letournel, M., Richalet, J.P., 2005.Effect of acute hypoxia on maximal exercise in trained and sedentary women.Med. Sci. Sports Exerc. 37, 147–154.
Woorons, X., Mollard, P., Pichon, A., Lamberto, C., Duvallet, A., Richalet, J.P.,2006. Moderate exercise in hypoxia induces a greater arterial desaturationin trained than untrained men. Scand. J. Med. Sci. Sports (June 28) (Epubahead of print).