Strategies to Improve Running Economy in Trained Distance ...
225
Strategies to Improve Running Economy in Trained Distance Runners Kyle Barnes Doctor of Philosophy 2014 Sports Performance Research Institute New Zealand Auckland University of Technology Primary supervisor: Associate Professor Andrew Kilding
-
Upload
khangminh22 -
Category
Documents
-
view
3 -
download
0
Transcript of Strategies to Improve Running Economy in Trained Distance ...
Strategies to Improve
Running Economy in Trained Distance Runners
Kyle Barnes Doctor of Philosophy
2014
Sports Performance Research Institute New Zealand
Auckland University of Technology
Primary supervisor: Associate Professor Andrew Kilding
2
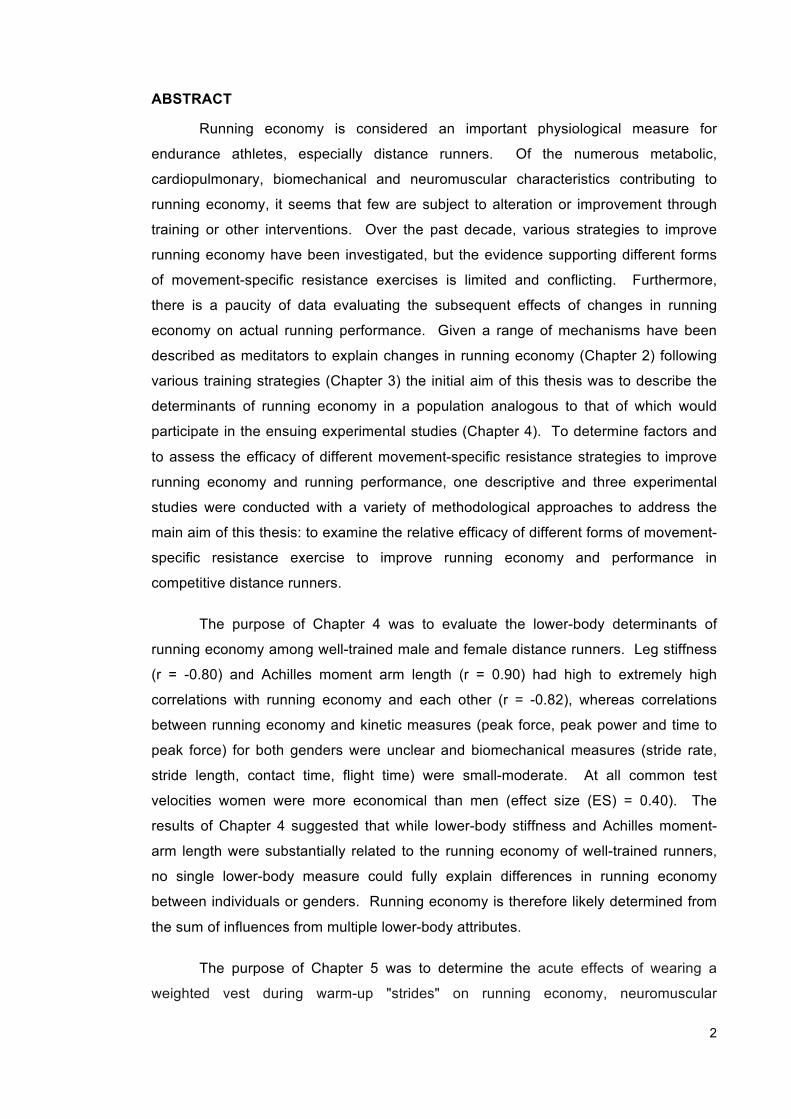
ABSTRACT
Running economy is considered an important physiological measure for
endurance athletes, especially distance runners. Of the numerous metabolic,
cardiopulmonary, biomechanical and neuromuscular characteristics contributing to
running economy, it seems that few are subject to alteration or improvement through
training or other interventions. Over the past decade, various strategies to improve
running economy have been investigated, but the evidence supporting different forms
of movement-specific resistance exercises is limited and conflicting. Furthermore,
there is a paucity of data evaluating the subsequent effects of changes in running
economy on actual running performance. Given a range of mechanisms have been
described as meditators to explain changes in running economy (Chapter 2) following
various training strategies (Chapter 3) the initial aim of this thesis was to describe the
determinants of running economy in a population analogous to that of which would
participate in the ensuing experimental studies (Chapter 4). To determine factors and
to assess the efficacy of different movement-specific resistance strategies to improve
running economy and running performance, one descriptive and three experimental
studies were conducted with a variety of methodological approaches to address the
main aim of this thesis: to examine the relative efficacy of different forms of movement-
specific resistance exercise to improve running economy and performance in
competitive distance runners.
The purpose of Chapter 4 was to evaluate the lower-body determinants of
running economy among well-trained male and female distance runners. Leg stiffness
(r = -0.80) and Achilles moment arm length (r = 0.90) had high to extremely high
correlations with running economy and each other (r = -0.82), whereas correlations
between running economy and kinetic measures (peak force, peak power and time to
peak force) for both genders were unclear and biomechanical measures (stride rate,
stride length, contact time, flight time) were small-moderate. At all common test
velocities women were more economical than men (effect size (ES) = 0.40). The
results of Chapter 4 suggested that while lower-body stiffness and Achilles moment-
arm length were substantially related to the running economy of well-trained runners,
no single lower-body measure could fully explain differences in running economy
between individuals or genders. Running economy is therefore likely determined from
the sum of influences from multiple lower-body attributes.
The purpose of Chapter 5 was to determine the acute effects of wearing a
weighted vest during warm-up "strides" on running economy, neuromuscular
3
measures, and running performance. The weighted-vest condition resulted in a 6.0%
improvement in running economy along with a 20% increase in leg stiffness, which
resulted in a 2.9% enhancement in peak running speed. Relationships between
change scores showed that changes in leg stiffness could explain all the improvements
in performance and running economy. Results from study two showed that running
economy and performance could be improved following a movement-specific form of
resistance exercise.
Another common way runners obtain resistance to movement is various forms
of uphill running. Consequently, Chapter 6 examined the optimum loading parameters
to five different uphill interval-training programs. There was no clear optimum for time-
trial performance, and the mean improvement across each training intensity was
~2.0%, however, the highest intensity was clearly optimal for running economy
(improvement of 2.4%), and for all neuromuscular measures, whereas other aerobic
measures were optimal near the middle intensities. These findings supported
anecdotal reports for incorporating uphill interval training in the training programs of
distance runners to improve running economy and other physiological parameters
relevant to running performance.
The final part of this thesis focused on two forms of resistance training (heavy-
resistance training and plyometric training), which each offer distinct physiological and
neuromuscular adaptations that previously have been shown to enhance running
economy on their own. Therefore the last experimental study (Chapter 7) examined
the effects of combining these two modes of resistance training on running economy
and competition performance in male and female cross-country runners. Results
showed that heavy-resistance training produced small to moderate improvements in
peak speed (male 3.4%, female 2.2%), running economy (male 1.5%, female 2.5%)
and neuromuscular characteristics relative to plyometric resistance training, whereas
changes in biomechanical measures favored plyometric resistance training. Overall,
males made less absolute gains than females in most tests. Both treatments had
possibly harmful effects on competition times in males (0.5% ±1.2%), but there may
have been benefit for some individuals, whereas both treatments were likely beneficial
for all females (-1.2%; ±1.3%), but heavy-resistance was possibly better than
plyometric resistance training.
Overall, the findings from this thesis have demonstrated for the first time that
well-trained distance runners can substantially (2 to 6%) improve their running
economy through acute and chronic bouts of movement-specific resistance exercise,
either by performing strides with a weighted vest or short-duration near-maximal uphill

4
sprints. Furthermore, it appears that heavy resistance-training is a superior training
modality to the combination of heavy-resistance and plyometric training at enhancing
running economy. Regardless of the exercise mode, improvements in running
economy appear to be modulated through enhancements in lower-body stiffness, but
other trainable and non-trainable factors may be related to and affect running economy.
Moreover, it appears that the improvements in running economy following various
training strategies presented in the thesis contribute to improved running performance.
5
TABLE OF CONTENTS
ABSTRACT ....................................................................................................................... 2!TABLE OF CONTENTS .................................................................................................... 5!LIST OF FIGURES ........................................................................................................... 9!LIST OF TABLES ............................................................................................................ 11!ETHICAL APPROVAL .................................................................................................... 12!ATTESTATION OF AUTHORSHIP ................................................................................. 13!
Supervisor Signatures ................................................................................................. 13!PUBLICATIONS AND CONFERENCE PRESENTATIONS ARISING FROM THIS
THESIS ........................................................................................................................... 14!Conference presentations ........................................................................................... 14!Published peer-reviewed articles ................................................................................ 14!Peer-reviewed articles currently under review ............................................................ 15!
DEDICATION .................................................................................................................. 16!ACKNOWLEDGEMENTS ............................................................................................... 17!CHAPTER 1: INTRODUCTION ...................................................................................... 18!
1.1 Thesis Rationale ................................................................................................... 18!1.2 Overall thesis aim and questions addressed in this thesis ................................... 23!1.3 Structure ................................................................................................................ 26!
CHAPTER 2: RUNNING ECONOMY: MEASUREMENT, NORMS AND DETERMINING
FACTORS ....................................................................................................................... 28!2.1 Abstract ................................................................................................................. 28!2..2 Introduction to Measurement, Norms and Determining Factors .......................... 29!2.3 Defining and Measuring Running Economy .......................................................... 31!
2.3.1 Normative Data ............................................................................................... 32!2.3.2 Treadmill and Overground Running ................................................................ 35!2.3.3 Reliability of Running Economy ...................................................................... 36!
2.4 Metabolic and Cardiorespiratory Efficiency ........................................................... 37!2.4.1 Cardiorespiratory Measures ........................................................................... 37!2.4.2 Body Temperature .......................................................................................... 38!2.4.3 Muscle Fiber Type .......................................................................................... 39!
2.5 Biomechanical Efficiency ...................................................................................... 40!2.5.1 Anthropometric Characteristics ....................................................................... 41!2.5.2 Running Style / Gait Patterns ......................................................................... 44!2.5.3 Kinematics and Kinetics .................................................................................. 47!
2.6 Neuromuscular Efficiency ..................................................................................... 51!
6
2.6.1 Neural Signaling and Motor Programming ...................................................... 52!2.6.2 Muscle Force Production and Stiffness .......................................................... 53!
2.7 Conclusions and Future Directions ....................................................................... 56!CHAPTER 3: STRATEGIES TO IMPROVE RUNNING ECONOMY .............................. 57!
3.1 Abstract ................................................................................................................. 57!3.2 Introduction to Strategies to Improve Running Economy ...................................... 58!3.3 Endurance Training in Runners ............................................................................ 59!
3.3.1 Training History ............................................................................................... 60!3.3.2 Training Volume .............................................................................................. 60!3.3.3 High-Intensity Interval Training (HIIT) ............................................................. 61!
3.4 Resistance Training .............................................................................................. 65!3.4.1 Heavy and Strength-Endurance Training ....................................................... 65!3.4.2 Plyometric and Explosive Resistance Training ............................................... 70!3.4.3 Resistance Training versus Plyometric or Explosive Resistance Training ..... 73!
3.5 Environmental Strategies ...................................................................................... 75!3.5.1 Altitude Exposure ............................................................................................ 75!3.5.2 Heat ................................................................................................................ 81!3.5.3 Cold ................................................................................................................ 82!
3.6 Stretching .............................................................................................................. 82!3.7 Nutritional Interventions ........................................................................................ 84!
3.7.1 Dietary Nitrate ................................................................................................. 84!3.8 Conclusions and Future Directions ....................................................................... 86!
CHAPTER 4: LOWER BODY DETERMINANTS OF RUNNING ECONOMY IN MALE
AND FEMALE DISTANCE RUNNERS ........................................................................... 87!4.1 Abstract ................................................................................................................. 87!4.2 Introduction ........................................................................................................... 88!4.3 Methods ................................................................................................................ 89!
4.3.1 Experimental Approach to the Problem .......................................................... 89!4.3.2 Subjects .......................................................................................................... 89!4.3.3 Procedures ..................................................................................................... 90!4.3.3.2 Neuromuscular Measures ............................................................................ 91!4.3.3.3 Moment Arm of the Achilles tendon ............................................................. 91!4.3.3.4 Statistical Analyses ...................................................................................... 92!
4.4 Results .................................................................................................................. 93!4.5 Discussion ............................................................................................................. 98!
4.5.1 Leg Stiffness ................................................................................................... 98!4.5.2 Moment Arm ................................................................................................... 98!4.5.3 Neuromuscular Characteristics ....................................................................... 99!

7
4.5.4 Biomechanical Characteristics ...................................................................... 100!4.5.5 Men vs. Women ............................................................................................ 101!
4.6 Practical Applications .......................................................................................... 102!4.7 Acknowledgements ............................................................................................. 102!
CHAPTER 5: WARM-UP WITH A WEIGHTED VEST IMPROVES RUNNING
PERFORMANCE VIA LEG STIFFNESS AND RUNNING ECONOMY ........................ 103!5.1 Abstract ............................................................................................................... 103!5.2 Introduction ......................................................................................................... 104!
5.3 Methods ........................................................................................................... 105!5.4 Results ................................................................................................................ 109!5.5 Discussion ........................................................................................................... 112!5.6 Conclusion .......................................................................................................... 114!5.7 Practical Implications .......................................................................................... 114!
CHAPTER 6: EFFECTS OF DIFFERENT UPHILL INTERVAL-TRAINING PROGRAMS
ON RUNNING ECONOMY AND PERFORMANCE ...................................................... 115!6.1 Abstract ............................................................................................................... 115!6.2 Introduction ......................................................................................................... 116!6.3 Methods .............................................................................................................. 117!
6.3.1 Design ........................................................................................................... 117!6.3.2 Subjects ........................................................................................................ 117!6.3.3 Treadmill Testing .......................................................................................... 117!6.3.4 Neuromuscular Measures on a Force Plate ................................................. 118!6.3.5 Running Performance ................................................................................... 119!6.3.6 Training Interventions ................................................................................... 119!6.3.7 Statistical Analyses ....................................................................................... 119!
6.4 Results ................................................................................................................ 121!6.5 Discussion ........................................................................................................... 125!6.6 Practical Applications and Conclusion ................................................................ 127!
CHAPTER 7: EFFECTS OF RESISTANCE TRAINING ON RUNNING ECONOMY
AND CROSS-COUNTRY PERFORMANCE ................................................................. 129!7.1 Abstract ............................................................................................................... 129!7.2 Introduction ......................................................................................................... 130!7.3 Methods .............................................................................................................. 131!
7.3.1 Subjects ........................................................................................................ 133!7.3.2 Testing Procedures ....................................................................................... 134!7.3.3 Performance During the Competitive Season .............................................. 138!7.3.4 Analyses ....................................................................................................... 138!
7.4 Results ................................................................................................................ 140!
8
7.4.1 Performance and Aerobic Measures ............................................................ 144!7.4.2 Biomechanical Measures .............................................................................. 144!7.4.3 Neuromuscular Measures ............................................................................. 144!7.4.4 Competition Measures .................................................................................. 144!
7.5 Discussion ........................................................................................................... 146!7.6 Acknowledgements ............................................................................................. 151!
CHAPTER 8: OVERALL DISCUSSION & CONCLUSION ........................................... 152!8.1 Research Questions ............................................................................................ 155!
8.1.1 What are the lower-body determinants of running economy among male and
female trained distance runners? .......................................................................... 155!8.1.2 What is the efficacy of augmenting running economy and performance
acutely? ................................................................................................................. 156!8.1.3 What is the most effective uphill interval-training protocol to enhance running
economy and performance? .................................................................................. 157!8.1.4 Does the addition of plyometric training to traditional heavy-resistance
training enhance running economy and performance more than heavy resistance-
training alone? ....................................................................................................... 159!8.2 Practical Applications .......................................................................................... 161!8.3 Thesis limitations ................................................................................................. 165!8.4 Recommendations for future research ................................................................ 167!8.5 Conclusions ......................................................................................................... 168!
REFERENCES ............................................................................................................. 170!APPENDICES ............................................................................................................... 195!
Appendix 1: Auckland University of Technology Ethics Committee Approval Memos195!Appendix 2: Hope College Human Subjects Review Board Ethics Approval Memo 197!Appendix 3: Subject Information Packs (chapters 4-7) ............................................. 198!Appendix 4: Subject Consent Forms ......................................................................... 212!Appendix 5: Transfer of Copyright Letters ................................................................ 216!
9
LIST OF FIGURES
Figure 1: ! Overview of doctoral thesis chapter flow. .............................................................. 27!Figure 2: ! Running economy profiles of two runners of equal VO2max. Adapted from Daniels
and Daniels (Daniels & Daniels, 1992). ...................................................................................... 29!Figure 3: ! Factors affecting running economy (adapted from Saunders et al. (2006)). .......... 30!Figure 4: ! Relationship between race duration and relative intensity. Adapted from Daniels et
al. (1978) (Daniels, Fitts, & Sheehan, 1978). ............................................................................. 35!Figure 5: ! Relationship between moment arm length and running economy at 16 km.hr-1 (r =
0.77). Adapted from Scholz et al (2008) (Scholz et al., 2008). ................................................... 44!Figure 6: ! Schematic of strategies to improve running economy. .......................................... 59!Figure 7: ! Standardized picture of the medial and lateral sides of the right foot, placed on, and
aligned with a reference block. The horizontal distance from the medial and lateral malleolus to
the Achilles tendon was determined (while lines). Moment arm was calculated as the mean of
these two distances. ................................................................................................................... 92!Figure 8: ! Aerobic profiles of male (n = 39) and female (n = 24) runners expressed in terms of
relative O2 consumption (VO2submax) and relative intensity. Bold × and ! indicate velocity at
VO2max (vVO2max). ................................................................................................................... 94!Figure 9: ! Correlation between running economy at 14 km.hr-1 and Achilles moment arm
length (r = 0.90), running economy at 14 km.hr-1 and leg stiffness (r = -0.80), and leg stiffness
and Achilles moment arm length (r = -0.82) for all runners. ....................................................... 97!Figure 10: ! Schematic representation of crossover experimental design, indicating the control
and weighted vest conditions. Two submaximal runs were included to assess differences in
running economy and other submaximal measures within and between conditions. The 6 × 10 s
strides and recovery period were completed in a cross-over manner. The 10-min recovery
period was included to simulate the “holding‟ procedures that athletes often experience prior to
major competitions. All other running and jump tests were completed at normal body weight.
Jump tests were included to assess neuromuscular characteristics, and the incremental test
assessed peak running speed and VO2max. ........................................................................... 106!Figure 11: ! Individual values and mean for peak speed, submaximal VO2 and leg stiffness in
the control and weight-vest conditions. .................................................................................... 111!Figure 12: ! Percentage change in performance and selected physiological measures after the
five uphill interval-training programs. ! represents individual changes in runners. Solid curved
line represents mean from quadratic modeling and dashed curved lines are the associated
confidence limits generated from bootstrapping. × represents the predicted group optimum. 122!Figure 13: ! Schematic representation of experimental design, indicating pre- and post-testing,
competition and intervention periods. ....................................................................................... 132!Figure 14: ! Least-squares mean of male and female performance times. .......................... 146!Figure 15: ! Factors affecting running economy following contribution from this thesis (red
indicates contribution from this thesis). .................................................................................... 163!
10
Figure 16: ! Schematic of strategies to improve running economy following contribution from
this thesis (red indicates contribution from this thesis). ............................................................ 165!
11
LIST OF TABLES
Table 1:! Overview of the chapters included as part of the thesis. .......................................... 24!Table 2:! Normative running economy data for male and female runners of varying ability
levels ……………………………………………………………………………………………………. 34!Table 3:! Comparison of effects on running economy and performance following adaptation to
various high intensity interval-training (HIIT) interventions. ........................................................ 62!Table 4:! Comparison of effects on running economy and performance following adaptation to
various resistance training, plyometric and explosive resistance training interventions. ............ 65!Table 5:! Comparison of effects on running economy and performance following adaptation to
hypoxia experienced in studies with various protocols of natural and artificial altitude. ............. 77!Table 6:! Subject and training characteristics* ........................................................................ 90!Table 7:! Mean male and female biomechanical and neuromuscular outcome measures and
statistics for effects and inferences between genders. ............................................................... 95!Table 8:! Correlations between running economy (ml.kg-1.min-1) and lower body characteristics
in male and female distance runners. ......................................................................................... 96!Table 9:! Mean and SD of performance and other measures following control and weighted-
vest treatments, and inferences for percent change of the means. .......................................... 110!Table 10:! Details and progression of five different 6-week uphill interval-training programs (2
interval-training sessions per week). ........................................................................................ 119!Table 11:! Outcome measures at baseline and statistics from the bootstrap analyses for
inferences about the effects at the predicted group optimum. .................................................. 124!Table 12:! Subject and training characteristics with effects and inferences about differences
between groups. ....................................................................................................................... 133!Table 13:! Nine-week resistance training program ................................................................ 137!Table 14:! Male outcome measures at baseline and statistics for effects and inferences about
the interventions within and between groups. .......................................................................... 142!Table 15:! Female outcome measures at baseline and statistics for effects and inferences
about the interventions within and between groups. ................................................................ 143!Table 16:! Summary of the chapters included as part of the thesis. ...................................... 153!
12
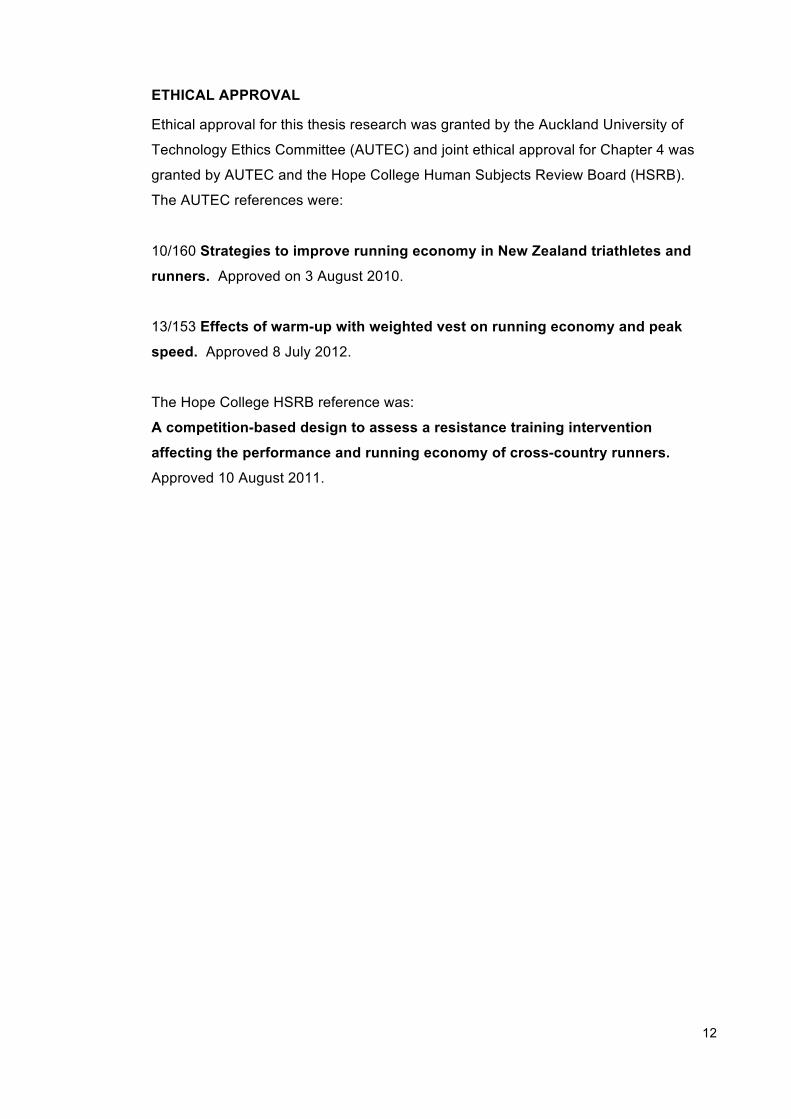
ETHICAL APPROVAL
Ethical approval for this thesis research was granted by the Auckland University of
Technology Ethics Committee (AUTEC) and joint ethical approval for Chapter 4 was
granted by AUTEC and the Hope College Human Subjects Review Board (HSRB).
The AUTEC references were:
10/160 Strategies to improve running economy in New Zealand triathletes and
runners. Approved on 3 August 2010.
13/153 Effects of warm-up with weighted vest on running economy and peak
speed. Approved 8 July 2012.
The Hope College HSRB reference was:
A competition-based design to assess a resistance training intervention
affecting the performance and running economy of cross-country runners.
Approved 10 August 2011.
13
ATTESTATION OF AUTHORSHIP
I hereby declare that this submission is my own work and that, to the best of my
knowledge and belief, it contains no material previously published or written by another
person (except where explicitly defined in the acknowledgements), nor material which
to a substantial extent has been submitted for the award of any other degree or
diploma of a university or other institution of higher learning.
Kyle Barnes
March 2014
Supervisor Signatures
Andrew Kilding
March 2014
Will Hopkins
March 2014
Mike McGuigan
March 2014

14
PUBLICATIONS AND CONFERENCE PRESENTATIONS ARISING FROM THIS THESIS
Chapters 2-7 of this thesis represent six separate papers that have been published or
submitted to peer-reviewed journals for consideration for publication. These papers
were prepared in collaboration with my supervisors Associate Professor Andrew
Kilding, Professor Will Hopkins and Professor Mike McGuigan. Chapter 4 was also
prepared in collaboration with Professor Mark Northuis of Hope College in Holland,
Michigan USA. The percentage of work from each other is noted in brackets.
Conference presentations
Barnes, K. R., Hopkins, W. G., McGuigan, M. R., & Kilding, A. E. (2012). Effects of
different uphill interval-training programs on running economy and performance.
Proceedings of Sports Medicine Australia conference 2012, 31 October – 3 November
p 19.
(Kyle Barnes 80%, Andrew Kilding 10%, Will Hopkins 8%, Michael McGuigan 2%)
Published peer-reviewed articles
Barnes, K. R., Hopkins, W. G., McGuigan, M. R., & Kilding, A. E. (2013). Effects of
different uphill interval-training programs on running economy and performance.
International Journal of Sports Physiology and Performance; 8(6), 639-647.
(Kyle Barnes 80%, Andrew Kilding 10%, Will Hopkins 8%, Michael McGuigan 2%)
Barnes, K. R., Hopkins, W. G., McGuigan, M. R., Northuis, M. E., & Kilding, A. E. (in
press). Effects of resistance training on running economy and cross-country
performance. Medicine and Science in Sports and Exercise.
(Kyle Barnes 80%, Will Hopkins 10%, Andrew Kilding 5%, Michael McGuigan 3%, Mark
Northuis 2%)
Barnes, K. R., Hopkins, W. G., McGuigan, M. R., & Kilding, A. E. (in press). Lower
Limb Determinants of Running Economy in Male and Female Distance Runners.
Journal of Strength and Conditioning Research.
(Kyle Barnes 80%, Andrew Kilding 15%, Michael McGuigan 5%)
Barnes, K. R., Hopkins, W. G., McGuigan, M. R., & Kilding, A. E. (in review). Warm-up
with a weighted vest improves running performance via leg stiffness and running
economy. Journal of Science and Medicine in Sport.
(Kyle Barnes 80%, Andrew Kilding 10%, Will Hopkins 5%, Michael McGuigan 5%)
15
Peer-reviewed articles currently under review
Barnes, K. R., Kilding, A. E. (in review at Sports Medicine). Running Economy:
Measurement, Norms and Determining Factors.
(Kyle Barnes 85%, Andrew Kilding 15%)
Barnes, K. R., Kilding, A. E. (in preparation for submission to Sports Medicine).
Strategies to Improve Running Economy.
(Kyle Barnes 85%, Andrew Kilding 15%)

16
DEDICATION
I wish to dedicate this thesis to the people who have always been there for me,
my parents Rusty and Sandy Barnes, brother Casey, sister-in-law Jennifer, niece
Kendall, and compass Danielle Tauro, for your support to pursue my dream and do it
12,000 km (~8,000 mi) from home. The completion of this thesis would not have been
possible without your patience, understanding, love and support throughout the
duration of this thesis. Thank you so much, I love you all.
17
ACKNOWLEDGEMENTS
I would like to thank many people who have helped me through the completion
of this Doctoral thesis. The first is my advisor, Dr. Andrew Kilding, whose teaching,
guidance, patience, honesty, and willingness to share many hundreds of kilometers of
running is the true embodiment of a mentor and friend. In combination with the
mentorship of my advisor, I am blessed to work with two other dynamic and intelligent
advisors Dr. Will Hopkins and Dr. Mike McGuigan. Thank you Will for the many hours
of working one-on-one with me on my writing, statistics and novel analysis techniques.
And thank you Mike for always being available to review documents, advise, and
motivate me whenever I needed it. I would also like to thank the Sport Performance
Research Institute New Zealand, Athletics New Zealand, Triathlon New Zealand, and
High Performance Sport New Zealand for funding my time at Auckland University of
Technology as well as providing me with the professional development opportunities
that have helped shape the path I now pursue.
I am thankful for and would like to acknowledge many others who helped me
along the way: my father and mother, whose love selflessly took me on this journey
8,000 miles from home and continually provided me with the support and
encouragement to get where I am now; my brother, sister-in law and niece for their love
(and sometimes tough love), encouragement, and helping shape who I am today;
Danielle Tauro, my partner, thank you for reorienting my life, faithfully going through the
latter part of the process with me, and making so many sacrifices for me; the Kilding
family for being my home away from home, my friends for the many hours of Skype
calls which allowed us to grow closer despite the distance; and my roommates and
colleagues for many good times, adventures and bouncing ideas with me. This
includes, but is not limited to Scott Brown, Erin Feldman, Sarah Manson, Cesar
Meylan, Travis McMaster and Albert Chang.
I am beyond grateful to all of my participants who were not paid to participate in
the project. The people who participated in my study were generous with their time in a
way that I can never repay.
The path to becoming a Doctor is littered with distractions. I’d like to thank those
distractions for making me the person I am.
Once a runner…
18
CHAPTER 1: INTRODUCTION
1.1 Thesis Rationale
In highly-trained runners, a number of physiological factors determine running
performance, which include an athlete’s maximal oxygen uptake (VO2max), lactate
threshold, fractional utilization of VO2max and running economy (Costill, 1967; Costill,
Thomason, & Roberts, 1973; Daniels, 1974a). Running economy is represented by the
energy demand for a given velocity of submaximal running and expressed as the
submaximal VO2 at a given running speed (Conley & Krahenbuhl, 1980; Daniels, 1985;
Saunders, Pyne, Telford, & Hawley, 2004a). Runners with good running economy use
less oxygen than runners with poor running economy at the same steady-state speed
(Daniels, 1985). A strong relationship has been demonstrated between running
economy and endurance running performance in moderate to highly trained runners
with a similar VO2max (Costill et al., 1973; Morgan, Baldini, Martin, & Kohrt, 1989).
Coincidentally, at the onset of my doctoral program Triathlon New Zealand
hired world-renowned running coach and physiologist Jack Daniels (Daniels, 1974a,
1974b, 1985, 1998; Daniels & Daniels, 1992; Daniels, Foster, Daniels, & Krahenbuhl,
1977; Daniels, Krahenbuhl, Foster, Gilbert, & Daniels, 1977; Daniels & Oldridge, 1970,
1971; Daniels, Oldridge, Nagle, & White, 1978; Daniels & Scardina, 1984; Daniels,
Yarbrough, & Foster, 1978), to lead a run focus workshop aimed at uncovering ways of
optimizing running performance. Interestingly, enhancing running economy arose as
one of the main concluding action points generated from this workshop. This inspired
me to consider novel ways of improving running economy in triathletes and runners
alike. It is apparent within the literature that training can induce positive changes in
running economy via a range of physiological and biomechanical adaptations
(Bransford & Howley, 1977; Dolgener, 1982). However, during my examination of the
literature I realized that evidence supporting different forms of movement-specific
resistance training were limited and incomplete. Furthermore, there is a paucity of data
evaluating the subsequent effects of changes in running economy on running
performance. This led me to consider various resistance training methods to enhance
running economy and performance; particularly movement-specific modes of
resistance training that can be applied to runners in non-laboratory based training
scenarios and the underlying mechanisms associated with the improvements. Training
programs can potentially improve running economy through metabolic,
cardiorespiratory, biomechanical and/or neuromuscular adaptations. Ultimately, any
intervention that can reduce oxygen demand at a range of speeds would allow a runner
to run faster over a given distance or to run longer at a constant speed because of the
19
reduced oxygen consumption. It follows any strategy to improve running economy
could facilitate improved performance in distance runners. Accordingly, in response to
the call for more research from Jack Daniels and in accordance with limitations in the
literature, I proposed to conduct research that has the potential to guide coaching
practice, by examining various movement specific strategies to improve running
economy and performance in well-trained runners.
The primary focus of this thesis was to examine running economy as a
multifactorial concept through various reviews, descriptive, acute and training studies,
while employing a variety of methodological approaches with the aim of improving
running economy and running performance. In part one (Chapter 2) of a two-part
review a comprehensive examination of the current scientific knowledge regarding the
ambiguity in the literature regarding how we define running economy was undertaken.
To the layperson this measure is perceived as a simple concept, however this value
reflects the metabolic, biomechanical, and neuromuscular components of running
economy, without consideration for what portion of that VO2 is a function of good or bad
mechanics as opposed to being related to differences in metabolism or force
production which may exist in different athletes or under different conditions (Anderson,
1996; Bonacci, Chapman, Blanch, & Vicenzino, 2009; Daniels, 1985; Saunders, Pyne,
et al., 2004a). Additionally, it often gets overlooked that it is possible to become more
economical in one area yet have running economy be negatively affected because of a
larger decrease in another aspect of efficiency. Many of these factors affecting running
economy represent specific or independent qualities of running economy and these
qualities can be assessed and trained independently. It is apparent within the literature
that trained runners have superior running economy to lesser-trained or untrained
runners (Bransford & Howley, 1977; Daniels, Oldridge, et al., 1978; Dolgener, 1982),
indicating positive adaptations in response to training programs (Beneke & Hutler,
2005). Therefore, in part two (Chapter 3) of our review series we examined various
strategies to improve running economy and the mechanisms associated with these
adaptations in response to training. Training programs can potentially improve running
economy through metabolic, biomechanical and/or neuromuscular adaptations. Any
intervention that can reduce oxygen demand at a range of speeds could also facilitate
improved performance in distance runners and would certainly be welcomed by
coaches, athletes and sports scientists.
Running economy has been identified as a critical factor contributing to distance
running performance (Conley & Krahenbuhl, 1980; Conley, Krahenbuhl, Burkett, &
Millar, 1984; Costill, 1967; Costill et al., 1973; Daniels, 1974a; Daniels & Daniels, 1992;
20
di Prampero et al., 1993; Jones, 2006; Pollock, 1977). Information in the literature
suggests running economy can vary among runners with similar VO2max by as much
as 30% (Daniels, 1985). Runners with good running economy tend to run faster at a
given distance or longer at a constant velocity than runners with poor running
economy, assuming their VO2max is the same. However, despite the performance
benefits of being an economical runner, researchers have yet to resolve why some
runners demonstrate markedly better economy when compared to counterparts
exhibiting similar fitness, training history and performance backgrounds (Conley &
Krahenbuhl, 1980; Daniels & Daniels, 1992; Daniels, Krahenbuhl, et al., 1977; Williams
& Cavanagh, 1987). Recent research has focused on various biomechanical,
anthropometric and/or neuromuscular characteristics as mechanisms to explain
improvements in running economy (Paavolainen, Hakkinen, Hamalainen, Nummela, &
Rusko, 1999; Paavolainen, Nummela, Rusko, & Hakkinen, 1999; Paavolainen,
Nummela, & Rusko, 1999; Spurrs, Murphy, & Watsford, 2003). Therefore the focus of
Chapter 4 was to evaluate the lower-body determinants of running economy among
well-trained male and female distance runners. It was decided to use male and female
runners as subjects since previous data has shown mixed findings concerning
differences in running economy that exist between genders (Bransford & Howley, 1977;
Daniels, Krahenbuhl, et al., 1977; Davies & Thompson, 1979; Maughan & Leiper, 1983;
Morgan et al., 1995; Morgan & Craib, 1992). As a secondary focus, this study explored
whether many of these lower-body characteristics can explain differences in running
economy between male and female trained distance runners.
Prior warm-up activities are a widely accepted practice preceding nearly every
athletic event to prepare the body for optimal competition performance (Bishop, 2003).
An active warm up is probably the most widely used warm-up technique for distance
runners because it is likely to induce specific metabolic and cardiovascular changes
conducive to distance-running performance (Bishop, 2003). Recent research has
focused on various warm-up or priming exercises that can alter oxygen uptake (VO2)
kinetic responses to subsequent high-intensity exercise and enhance performance
(Bishop, Bonetti, & Dawson, 2001; Hajoglou et al., 2005; Ingham, Fudge, Pringle, &
Jones, 2013). While different training regimens have demonstrated concomitant
improvements in neuromuscular measures, running economy and distance running
performance (Paavolainen, Hakkinen, et al., 1999; Spurrs et al., 2003), to date no
research has examined modifying these parameters acutely to improve distance-
running performance. Therefore, for Study 4 we chose to examine the efficacy of
acutely modifying various neuromuscular parameters and running economy to enhance
running performance. To do this, we realized that we needed to precondition the
21
muscles in some way to enhance metabolic and neuromuscular efficiency. Post-
activation potentiation is a well-recognized phenomenon that involves the
preconditioning of muscle through heavy exercise and has previously demonstrated
acute improvements in performance during sprinting and weightlifting activities
(Hodgson, Docherty, & Robbins, 2005; Tillin & Bishop, 2009). A common method used
by athletes to facilitate a post-activation potentiation response is performing sport
specific movement patterns while wearing a weighted vest that provides additional
resistance to movement. In track and field running events, athletes typically employ a
warm-up procedure that includes low intensity jogging, mobilization exercises and short
duration fast-running ‘strides’ (Ingham et al., 2013). By combining these two modes of
training I realized that much like when baseball players add a weighted donut to the
end of their bats during their warm-up swings in order to increase swing speed when
the donut is removed, perhaps if runners add artificial weight to their torso during
warm-up exercises (strides), when the weight is removed it may enhance running
performance as well.
The final two investigations of this thesis are training studies aimed at
chronically enhancing running economy in well-trained runners. For Chapter 5 we
adopted a dose-response design to investigate the effects of various uphill interval-
training programs on physiological and performance measures. Previous research has
shown interval training at 93–120% velocity at VO2max (vVO2max) (Billat, Flechet,
Petit, Muriaux, & Koralsztein, 1999; Franch, Madsen, Djurhuus, & Pedersen, 1998;
Laffite, Mille-Hamard, Koralsztein, & Billat, 2003; Sjodin, Jacobs, & Svedenhag, 1982;
Slawinski, Demarle, Koralsztein, & Billat, 2001) and continuous running at velocity at
the onset of blood lactate accumulation (vOBLA) (Billat et al., 1999; Denadai, Ortiz,
Greco, & de Mello, 2006; Sjodin et al., 1982) on level ground substantially improves
running economy. However, despite coaches often utilizing various forms of hill
training in periodized training programs for distance runners, only anecdotal reports
(Kurz, Berg, Latin, & Degraw, 2000; Midgley, McNaughton, & Jones, 2007; Saunders,
Pyne, et al., 2004a) and two research investigations (Ferley, Osborn, & Vukovich,
2012; Houston & Thomson, 1977) exist concerning the physiological responses and
potential improvements in performance to such training. Therefore, in view of the
uncertainty about the physiological effects of uphill training on distance running
performance we adopted this modeling approach in an attempt to determine the most
effective uphill interval-training protocol on running economy and performance.
Resistance training and plyometric training are two interventions that have been
shown to improve running economy in recreational (Hickson, Dvorak, Gorostiaga,
22
Kurowski, & Foster, 1988; Taipale et al., 2009; Taipale, Mikkola, Vesterinen, Nummela,
& Hakkinen, 2013; Turner, Owings, & Schwane, 2003), moderately trained (Albracht &
Arampatzis, 2013; Barnes, Hopkins, McGuigan, Northuis, & Kilding, 2013; Berryman,
Maurel, & Bosquet, 2010; Francesca et al., 2012; Guglielmo, Greco, & Denadai, 2009;
Hamilton, Paton, & Hopkins, 2006; Johnston, Quinn, Kertzer, & Vroman, 1997; Mikkola,
Rusko, Nummela, Pollari, & Hakkinen, 2007; Paavolainen, Hakkinen, et al., 1999;
Spurrs et al., 2003; Storen, Helgerud, Stoa, & Hoff, 2008) and highly trained (Millet,
Jaouen, Borrani, & Candau, 2002; Saunders et al., 2006; Sedano, Marin, Cuadrado, &
Redondo, 2013) runners through respective mechanisms that affect metabolic,
biomechanical and/or neuromuscular efficiency. Performance gains following
traditional heavy-resistance training are a result of predominantly neuromuscular rather
than within muscle adaptations (Kraemer, Fleck, & Evans, 1996). These adaptations
may include increases in strength, increased motor unit recruitment, improved
mechanical efficiency and muscle coordination (Kraemer et al., 1996; Kyrolainen, Belli,
& Komi, 2001; Sale, 1988). Whereas proposed explanations for the improvement
following plyometric training include increased lower body muscle-tendon stiffness,
degree of neural input to the muscle, enhanced muscle power development and elastic
return, and improved motor unit synchronization (Paavolainen, Hakkinen, et al., 1999;
Paavolainen, Nummela, Rusko, et al., 1999; Spurrs et al., 2003). The combination of
resistance training and plyometric training may facilitate additional improvements in
running economy via accumulation of adaptations previously observed when either
type of training is performed alone. However, no studies have examined the efficacy of
combining these two modes of training to elicit further improvements in running
economy. Additionally, a review of the literature produced no studies examining the
effects of a resistance-training intervention on running economy or performance during
the competition phase of a running season, likely because coaches are often unwilling
to do time trials or other performance tests that would interfere with preparations for
actual competitions. In order to perform this study, I had to travel to Hope College in
Holland, Michigan USA where my former cross country and track coach (who also
served as the Department Chair of Kinesiology at Hope College) agreed to allow me to
use his nationally competitive men’s and women’s cross country teams as subjects and
Kinesiology Department laboratory equipment for testing. By performing the study with
these teams, we were able to compare the effects of heavy resistance training versus
the combination of heavy resistance- and plyometric-training on running economy in
male and female runners. Additionally, performance data was collected from other
cross country teams competing against Hope College throughout the NCAA cross
country season in order to investigate the effects of the resistance training interventions
on competition performance, using a design similar to Vandenbogaerde, Hopkins and
23
Pyne (2012) in which changes in performance between competitions before and after
an intervention with a team of athletes can be compared with changes in performance
in other team over the same time frame (Vandenbogaerde, Hopkins, & Pyne, 2012).
1.2 Overall thesis aim and questions addressed in this thesis
The overall aim of this thesis was to determine the relative efficacy of different
forms of movement-specific resistance exercise to improve running economy and
performance in training distance runners. An overview of the chapters included in this
thesis is presented in Table 1, while the individual research questions underpinning this
aim were:
• What are the lower-body determinants of running economy among male and
female trained distance runners?
• What is the efficacy of augmenting running economy and performance acutely?
• What is the most effective uphill interval-training protocol to enhance running
economy and performance?
• Does the addition of plyometric training to traditional heavy-resistance training
enhance running economy and performance more than heavy resistance-
training alone?
24
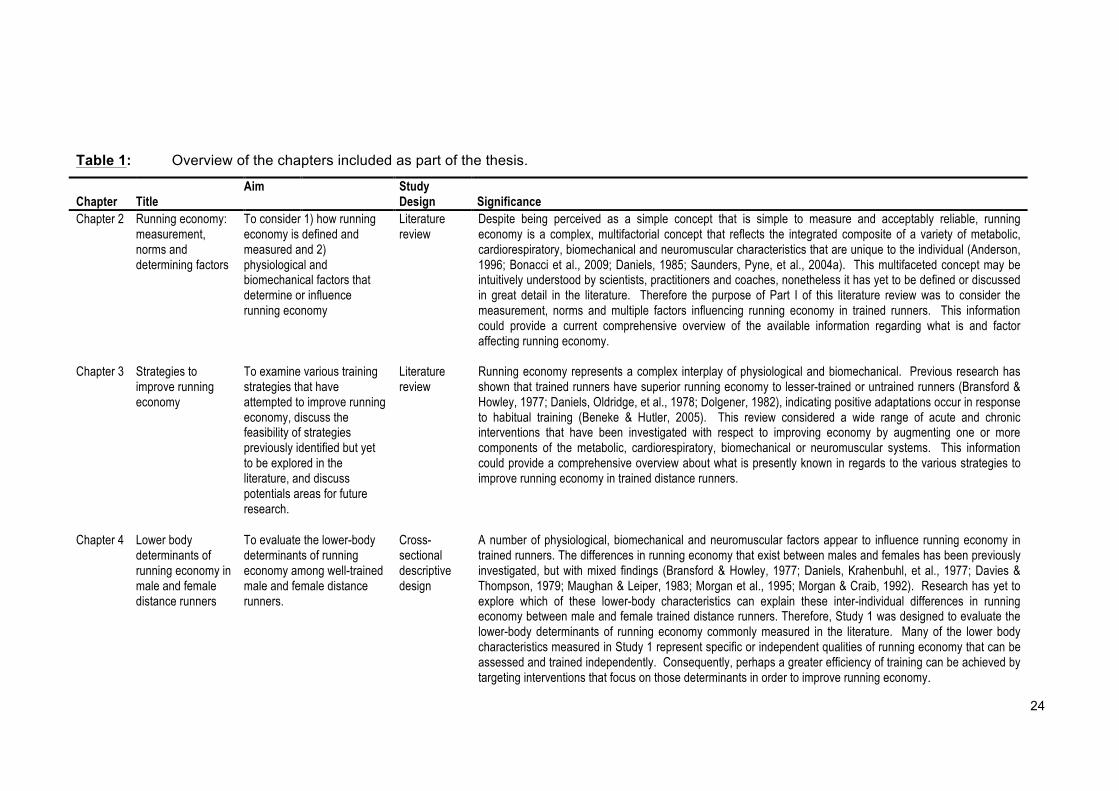
Table 1: Overview of the chapters included as part of the thesis.
Chapter Title Aim
Study Design Significance
Chapter 2 Running economy: measurement, norms and determining factors
To consider 1) how running economy is defined and measured and 2) physiological and biomechanical factors that determine or influence running economy
Literature review
Despite being perceived as a simple concept that is simple to measure and acceptably reliable, running economy is a complex, multifactorial concept that reflects the integrated composite of a variety of metabolic, cardiorespiratory, biomechanical and neuromuscular characteristics that are unique to the individual (Anderson, 1996; Bonacci et al., 2009; Daniels, 1985; Saunders, Pyne, et al., 2004a). This multifaceted concept may be intuitively understood by scientists, practitioners and coaches, nonetheless it has yet to be defined or discussed in great detail in the literature. Therefore the purpose of Part I of this literature review was to consider the measurement, norms and multiple factors influencing running economy in trained runners. This information could provide a current comprehensive overview of the available information regarding what is and factor affecting running economy.
Chapter 3 Strategies to improve running economy
To examine various training strategies that have attempted to improve running economy, discuss the feasibility of strategies previously identified but yet to be explored in the literature, and discuss potentials areas for future research.
Literature review
Running economy represents a complex interplay of physiological and biomechanical. Previous research has shown that trained runners have superior running economy to lesser-trained or untrained runners (Bransford & Howley, 1977; Daniels, Oldridge, et al., 1978; Dolgener, 1982), indicating positive adaptations occur in response to habitual training (Beneke & Hutler, 2005). This review considered a wide range of acute and chronic interventions that have been investigated with respect to improving economy by augmenting one or more components of the metabolic, cardiorespiratory, biomechanical or neuromuscular systems. This information could provide a comprehensive overview about what is presently known in regards to the various strategies to improve running economy in trained distance runners.
Chapter 4 Lower body determinants of running economy in male and female distance runners
To evaluate the lower-body determinants of running economy among well-trained male and female distance runners.
Cross-sectional descriptive design
A number of physiological, biomechanical and neuromuscular factors appear to influence running economy in trained runners. The differences in running economy that exist between males and females has been previously investigated, but with mixed findings (Bransford & Howley, 1977; Daniels, Krahenbuhl, et al., 1977; Davies & Thompson, 1979; Maughan & Leiper, 1983; Morgan et al., 1995; Morgan & Craib, 1992). Research has yet to explore which of these lower-body characteristics can explain these inter-individual differences in running economy between male and female trained distance runners. Therefore, Study 1 was designed to evaluate the lower-body determinants of running economy commonly measured in the literature. Many of the lower body characteristics measured in Study 1 represent specific or independent qualities of running economy that can be assessed and trained independently. Consequently, perhaps a greater efficiency of training can be achieved by targeting interventions that focus on those determinants in order to improve running economy.
25
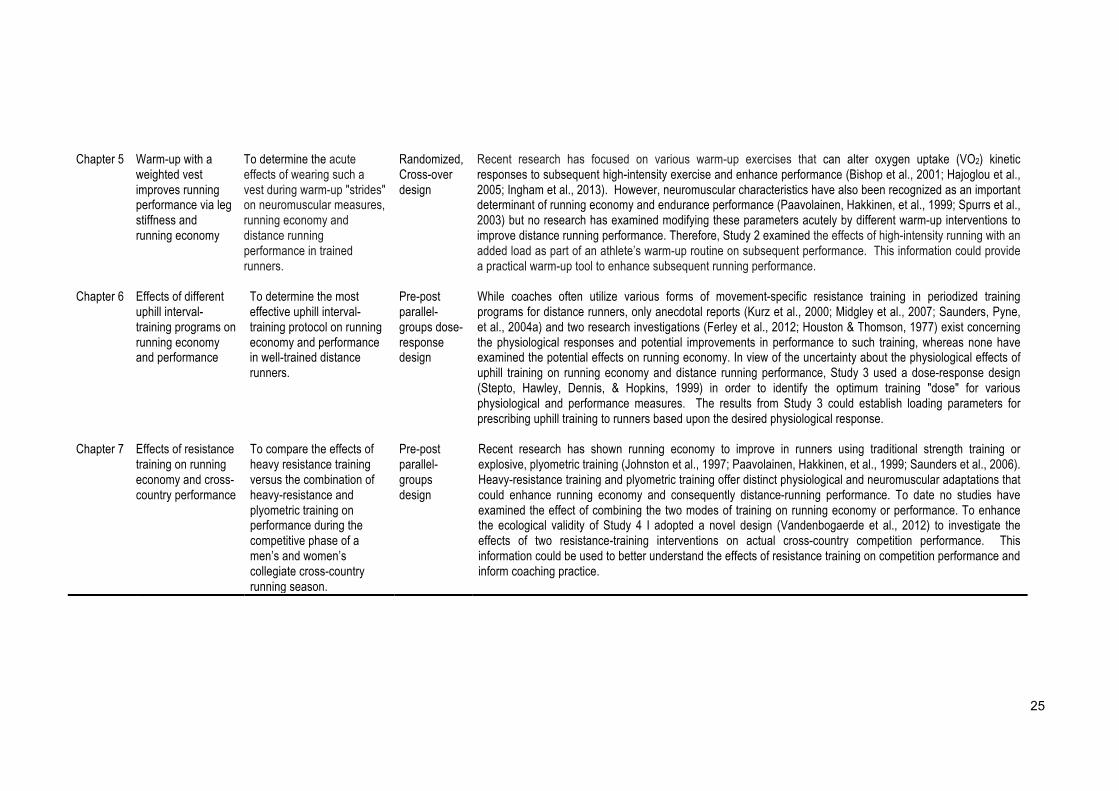
Chapter 5 Warm-up with a weighted vest improves running performance via leg stiffness and running economy
To determine the acute effects of wearing such a vest during warm-up "strides" on neuromuscular measures, running economy and distance running performance in trained runners.
Randomized, Cross-over design
Recent research has focused on various warm-up exercises that can alter oxygen uptake (VO2) kinetic responses to subsequent high-intensity exercise and enhance performance (Bishop et al., 2001; Hajoglou et al., 2005; Ingham et al., 2013). However, neuromuscular characteristics have also been recognized as an important determinant of running economy and endurance performance (Paavolainen, Hakkinen, et al., 1999; Spurrs et al., 2003) but no research has examined modifying these parameters acutely by different warm-up interventions to improve distance running performance. Therefore, Study 2 examined the effects of high-intensity running with an added load as part of an athlete’s warm-up routine on subsequent performance. This information could provide a practical warm-up tool to enhance subsequent running performance.
Chapter 6 Effects of different uphill interval-training programs on running economy and performance
To determine the most effective uphill interval-training protocol on running economy and performance in well-trained distance runners.
Pre-post parallel-groups dose-response design
While coaches often utilize various forms of movement-specific resistance training in periodized training programs for distance runners, only anecdotal reports (Kurz et al., 2000; Midgley et al., 2007; Saunders, Pyne, et al., 2004a) and two research investigations (Ferley et al., 2012; Houston & Thomson, 1977) exist concerning the physiological responses and potential improvements in performance to such training, whereas none have examined the potential effects on running economy. In view of the uncertainty about the physiological effects of uphill training on running economy and distance running performance, Study 3 used a dose-response design (Stepto, Hawley, Dennis, & Hopkins, 1999) in order to identify the optimum training "dose" for various physiological and performance measures. The results from Study 3 could establish loading parameters for prescribing uphill training to runners based upon the desired physiological response.
Chapter 7 Effects of resistance training on running economy and cross-country performance
To compare the effects of heavy resistance training versus the combination of heavy-resistance and plyometric training on performance during the competitive phase of a men’s and women’s collegiate cross-country running season.
Pre-post parallel-groups design
Recent research has shown running economy to improve in runners using traditional strength training or explosive, plyometric training (Johnston et al., 1997; Paavolainen, Hakkinen, et al., 1999; Saunders et al., 2006). Heavy-resistance training and plyometric training offer distinct physiological and neuromuscular adaptations that could enhance running economy and consequently distance-running performance. To date no studies have examined the effect of combining the two modes of training on running economy or performance. To enhance the ecological validity of Study 4 I adopted a novel design (Vandenbogaerde et al., 2012) to investigate the effects of two resistance-training interventions on actual cross-country competition performance. This information could be used to better understand the effects of resistance training on competition performance and inform coaching practice.
26
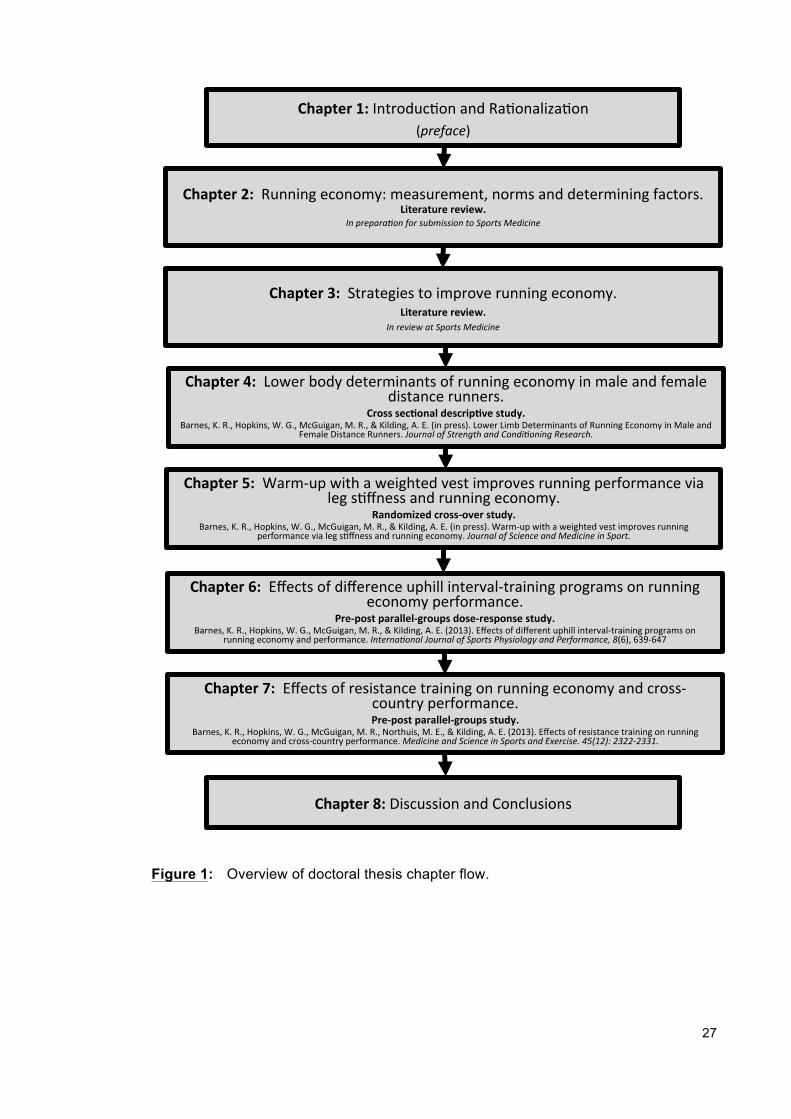
1.3 Structure
The thesis consists of six chapters in addition to an overall introduction and
rationalization (preface) (Chapter 1) and overall discussion and conclusion (Chapter 8)
to the thesis. A thesis structure schematic is presented in Figure 1. All chapters are
presented in the format of the journal for which they were written. The references for
each chapter are collated at the end of the thesis in APA format.
The appendices (Appendix 1-5) contain subject information and ethical approval
for the descriptive, acute and two experimental studies contained in this thesis.
27
Figure 1: Overview of doctoral thesis chapter flow.
Chapter(1:(Introduc)on*and*Ra)onaliza)on*(preface)*
Chapter(4:((Lower*body*determinants*of*running*economy*in*male*and*female*distance*runners.*
Cross(sec/onal(descrip/ve(study.((Barnes,*K.*R.,*Hopkins,*W.*G.,*McGuigan,*M.*R.,*&*Kilding,*A.*E.*(in*press).*Lower*Limb*Determinants*of*Running*Economy*in*Male*and*
Female*Distance*Runners.*Journal,of,Strength,and,Condi4oning,Research.*
Chapter(5:((WarmJup*with*a*weighted*vest*improves*running*performance*via*leg*s)ffness*and*running*economy.*
Randomized(cross<over(study.((Barnes,*K.*R.,*Hopkins,*W.*G.,*McGuigan,*M.*R.,*&*Kilding,*A.*E.*(in*press).*WarmJup*with*a*weighted*vest*improves*running*
performance*via*leg*s)ffness*and*running*economy.*Journal,of,Science,and,Medicine,in,Sport.*
Chapter(6:((Effects*of*difference*uphill*intervalJtraining*programs*on*running*economy*performance.*
Pre<post(parallel<groups(dose<response(study.((Barnes,*K.*R.,*Hopkins,*W.*G.,*McGuigan,*M.*R.,*&*Kilding,*A.*E.*(2013).*Effects*of*different*uphill*intervalJtraining*programs*on*
running*economy*and*performance.*Interna4onal,Journal,of,Sports,Physiology,and,Performance,,8(6),*639J647,
Chapter(7:((Effects*of*resistance*training*on*running*economy*and*crossJcountry*performance.*Pre<post(parallel<groups(study.((
Barnes,*K.*R.,*Hopkins,*W.*G.,*McGuigan,*M.*R.,*Northuis,*M.*E.,*&*Kilding,*A.*E.*(2013).*Effects*of*resistance*training*on*running*economy*and*crossJcountry*performance.*Medicine,and,Science,in,Sports,and,Exercise.,45(12):,2322I2331.*
Chapter(8:(Discussion*and*Conclusions*
Chapter(2:((Running*economy:*measurement,*norms*and*determining*factors.*(Literature(review.((
In,prepara4on,for,submission,to,Sports,Medicine,,
Chapter(3:((Strategies*to*improve*running*economy.(Literature(review.((
In,review,at,Sports,Medicine,,
28
CHAPTER 2: RUNNING ECONOMY: MEASUREMENT, NORMS AND DETERMINING FACTORS
2.1 Abstract
Running economy is considered an important physiological measure for
endurance athletes, especially distance runners. This review considers 1) how running
economy is defined and measured and 2) physiological and biomechanical factors that
determine or influence running economy. From studies conducted to date it is difficult
to accurately ascertain what is good, average, and poor running economy due to
variation in protocols, gas-analysis systems, and data averaging techniques, however,
representative running economy values for different caliber of male and female runners
can be identified from existing literature with mostly clear delineations in oxygen uptake
across a range of speeds in moderately and highly trained and elite runners. Despite
being simple to measure and acceptably reliable, it is evident that running economy is
a complex, multifactorial concept that reflects the integrated composite of a variety of
metabolic, cardiorespiratory, biomechanical and neuromuscular characteristics that are
unique to the individual. Metabolic and cardiorespiratory efficiency refers to processes
that result in better use of oxygen (increased energy production) relative to a given
work output. Fluctuations in cardiorespiratory function, thermoregulation, and substrate
metabolism have been associated with changes in running economy. Likewise,
anthropometric dimensions, select gait patterns, and flexibility have been shown to
affect biomechanical efficiency and relate to better running economy. Neuromuscular
characteristics, including lower body stiffness, force production, neural signaling, and
motor programming are also important aspects of running economy.
29
2..2 Introduction to Measurement, Norms and Determining Factors
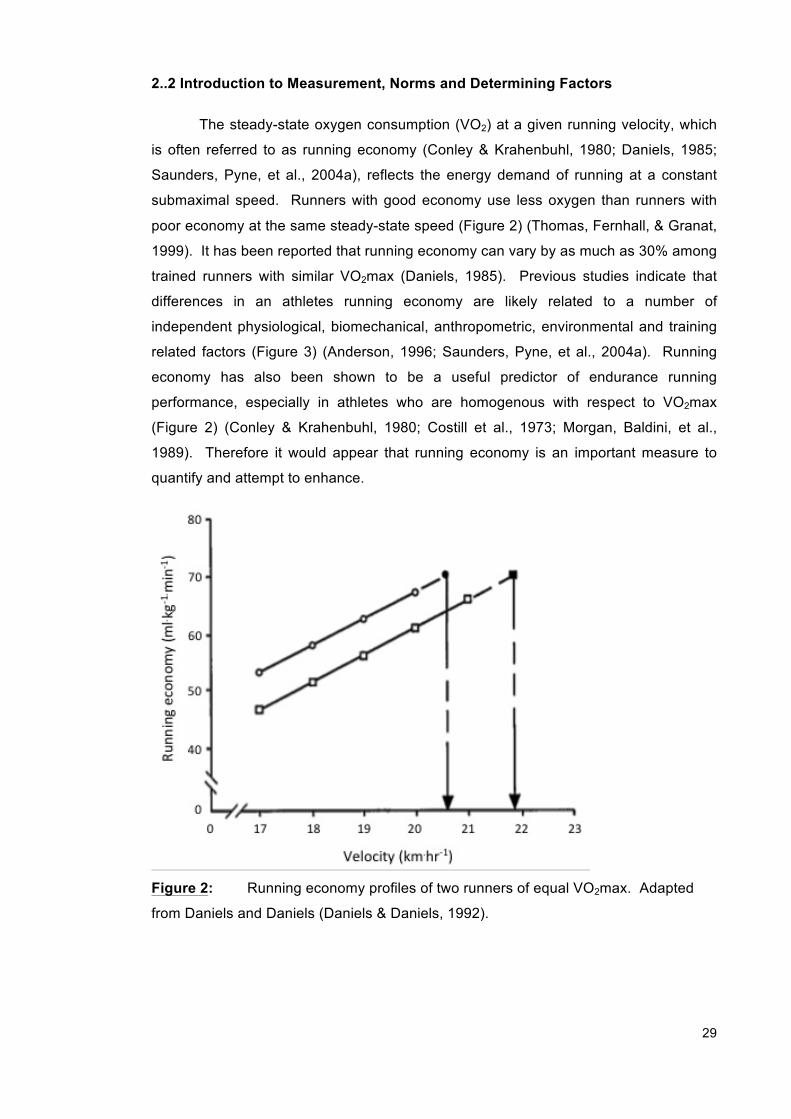
The steady-state oxygen consumption (VO2) at a given running velocity, which
is often referred to as running economy (Conley & Krahenbuhl, 1980; Daniels, 1985;
Saunders, Pyne, et al., 2004a), reflects the energy demand of running at a constant
submaximal speed. Runners with good economy use less oxygen than runners with
poor economy at the same steady-state speed (Figure 2) (Thomas, Fernhall, & Granat,
1999). It has been reported that running economy can vary by as much as 30% among
trained runners with similar VO2max (Daniels, 1985). Previous studies indicate that
differences in an athletes running economy are likely related to a number of
independent physiological, biomechanical, anthropometric, environmental and training
related factors (Figure 3) (Anderson, 1996; Saunders, Pyne, et al., 2004a). Running
economy has also been shown to be a useful predictor of endurance running
performance, especially in athletes who are homogenous with respect to VO2max
(Figure 2) (Conley & Krahenbuhl, 1980; Costill et al., 1973; Morgan, Baldini, et al.,
1989). Therefore it would appear that running economy is an important measure to
quantify and attempt to enhance.
Figure 2: Running economy profiles of two runners of equal VO2max. Adapted
from Daniels and Daniels (Daniels & Daniels, 1992).
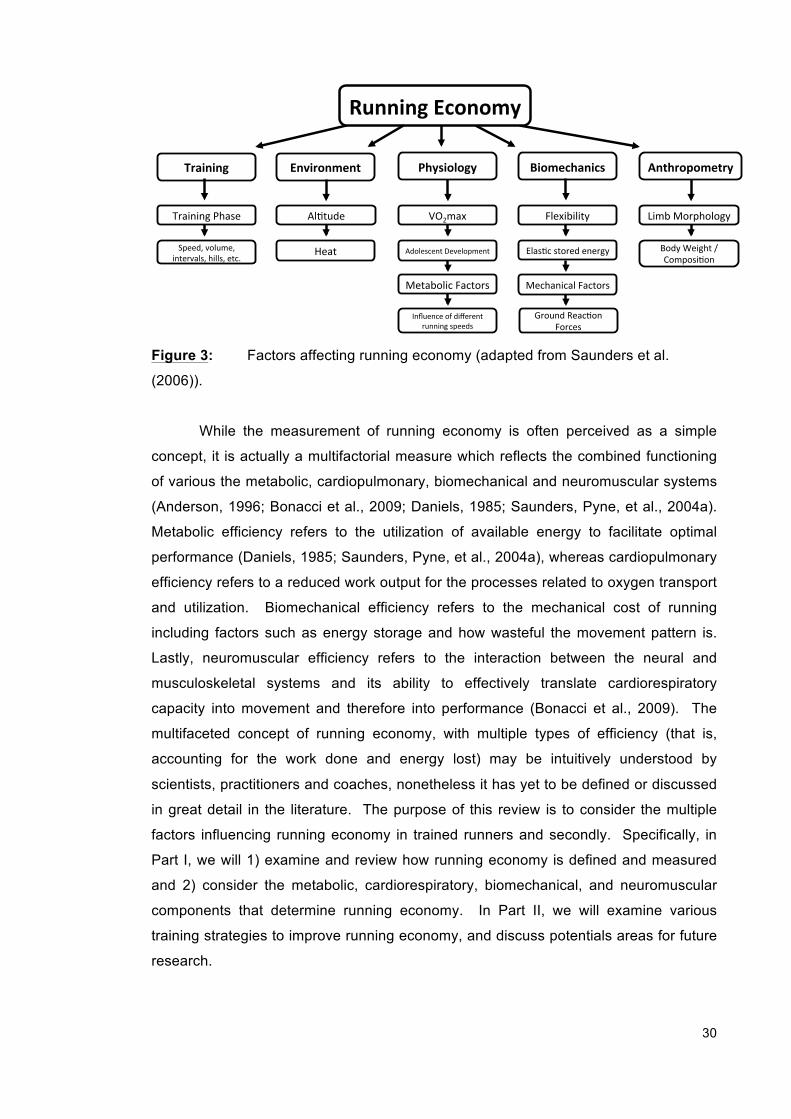
30
Figure 3: Factors affecting running economy (adapted from Saunders et al.
(2006)).
While the measurement of running economy is often perceived as a simple
concept, it is actually a multifactorial measure which reflects the combined functioning
of various the metabolic, cardiopulmonary, biomechanical and neuromuscular systems
(Anderson, 1996; Bonacci et al., 2009; Daniels, 1985; Saunders, Pyne, et al., 2004a).
Metabolic efficiency refers to the utilization of available energy to facilitate optimal
performance (Daniels, 1985; Saunders, Pyne, et al., 2004a), whereas cardiopulmonary
efficiency refers to a reduced work output for the processes related to oxygen transport
and utilization. Biomechanical efficiency refers to the mechanical cost of running
including factors such as energy storage and how wasteful the movement pattern is.
Lastly, neuromuscular efficiency refers to the interaction between the neural and
musculoskeletal systems and its ability to effectively translate cardiorespiratory
capacity into movement and therefore into performance (Bonacci et al., 2009). The
multifaceted concept of running economy, with multiple types of efficiency (that is,
accounting for the work done and energy lost) may be intuitively understood by
scientists, practitioners and coaches, nonetheless it has yet to be defined or discussed
in great detail in the literature. The purpose of this review is to consider the multiple
factors influencing running economy in trained runners and secondly. Specifically, in
Part I, we will 1) examine and review how running economy is defined and measured
and 2) consider the metabolic, cardiorespiratory, biomechanical, and neuromuscular
components that determine running economy. In Part II, we will examine various
training strategies to improve running economy, and discuss potentials areas for future
research.
Running&Economy&
Training& Physiology& Anthropometry&
Figure 2. Factors affecting running economy.
Environment& Biomechanics&
Training'Phase'
Speed,'volume,'intervals,'hills,'etc.''
Al9tude'
Heat'
VO2max'
Adolescent'Development'
Metabolic'Factors'
Influence'of'different'running'speeds''
Flexibility'
Elas9c'stored'energy'
Mechanical'Factors'
Ground'Reac9on'Forces'
Limb'Morphology'
Body'Weight'/'Composi9on'
31
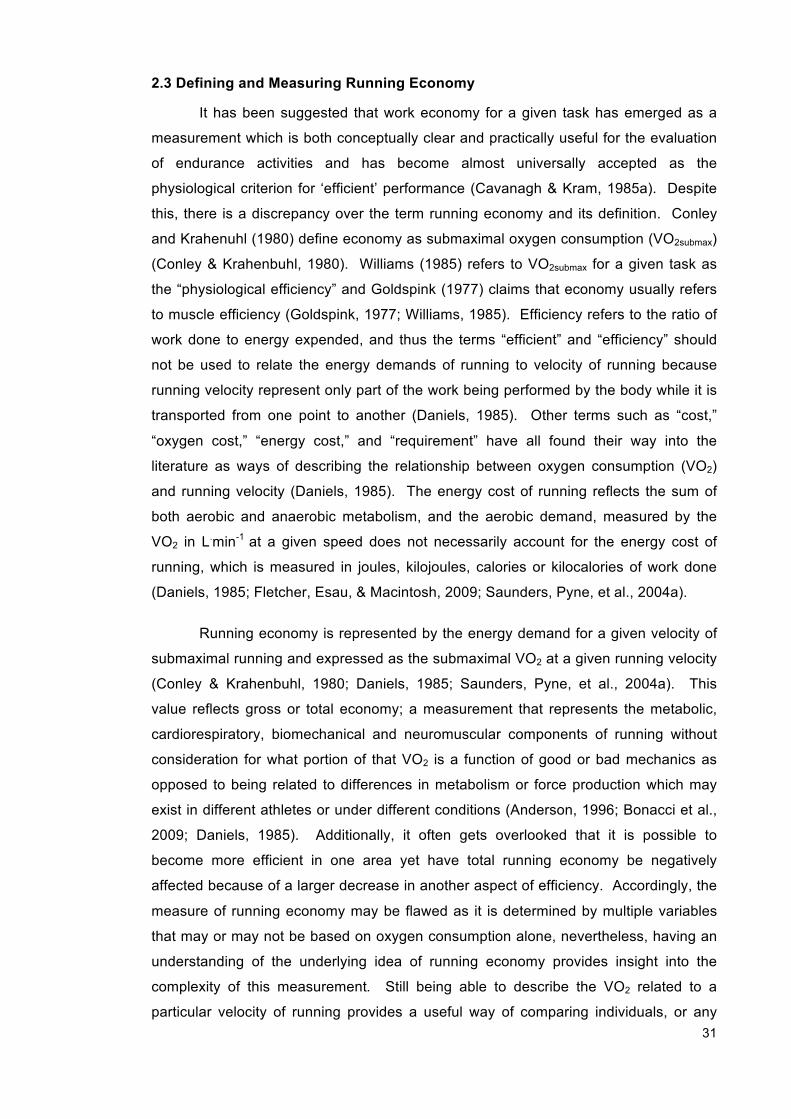
2.3 Defining and Measuring Running Economy
It has been suggested that work economy for a given task has emerged as a
measurement which is both conceptually clear and practically useful for the evaluation
of endurance activities and has become almost universally accepted as the
physiological criterion for ‘efficient’ performance (Cavanagh & Kram, 1985a). Despite
this, there is a discrepancy over the term running economy and its definition. Conley
and Krahenuhl (1980) define economy as submaximal oxygen consumption (VO2submax)
(Conley & Krahenbuhl, 1980). Williams (1985) refers to VO2submax for a given task as
the “physiological efficiency” and Goldspink (1977) claims that economy usually refers
to muscle efficiency (Goldspink, 1977; Williams, 1985). Efficiency refers to the ratio of
work done to energy expended, and thus the terms “efficient” and “efficiency” should
not be used to relate the energy demands of running to velocity of running because
running velocity represent only part of the work being performed by the body while it is
transported from one point to another (Daniels, 1985). Other terms such as “cost,”
“oxygen cost,” “energy cost,” and “requirement” have all found their way into the
literature as ways of describing the relationship between oxygen consumption (VO2)
and running velocity (Daniels, 1985). The energy cost of running reflects the sum of
both aerobic and anaerobic metabolism, and the aerobic demand, measured by the
VO2 in L.min-1 at a given speed does not necessarily account for the energy cost of
running, which is measured in joules, kilojoules, calories or kilocalories of work done
(Daniels, 1985; Fletcher, Esau, & Macintosh, 2009; Saunders, Pyne, et al., 2004a).
Running economy is represented by the energy demand for a given velocity of
submaximal running and expressed as the submaximal VO2 at a given running velocity
(Conley & Krahenbuhl, 1980; Daniels, 1985; Saunders, Pyne, et al., 2004a). This
value reflects gross or total economy; a measurement that represents the metabolic,
cardiorespiratory, biomechanical and neuromuscular components of running without
consideration for what portion of that VO2 is a function of good or bad mechanics as
opposed to being related to differences in metabolism or force production which may
exist in different athletes or under different conditions (Anderson, 1996; Bonacci et al.,
2009; Daniels, 1985). Additionally, it often gets overlooked that it is possible to
become more efficient in one area yet have total running economy be negatively
affected because of a larger decrease in another aspect of efficiency. Accordingly, the
measure of running economy may be flawed as it is determined by multiple variables
that may or may not be based on oxygen consumption alone, nevertheless, having an
understanding of the underlying idea of running economy provides insight into the
complexity of this measurement. Still being able to describe the VO2 related to a
particular velocity of running provides a useful way of comparing individuals, or any
32
individual with him or herself under various conditions and this VO2 gives a measure of
running economy. Despite its apparent shortcomings, such will be the indicator of
running economy used throughout this thesis.
The standard approach to quantifying running economy involves measuring VO2
while running on a treadmill at various constant speeds for a duration long enough to
achieve physiological steady-state. Typically, durations of 3 to 15 min have been used
in studies if the speed is below the ventilatory/lactate threshold (Morgan, Martin, &
Krahenbuhl, 1989), since above this intensity, a slow component of VO2 is evident
(Jones, Koppo, & Burnley, 2003). Often, the steady-state condition is verified by
considering other physiological parameters such as verifying that blood lactate
concentration is similar to baseline levels (MacDougall, 1977) and the respiratory
exchange ratio (RER) is < 1 (Conley & Krahenbuhl, 1980).
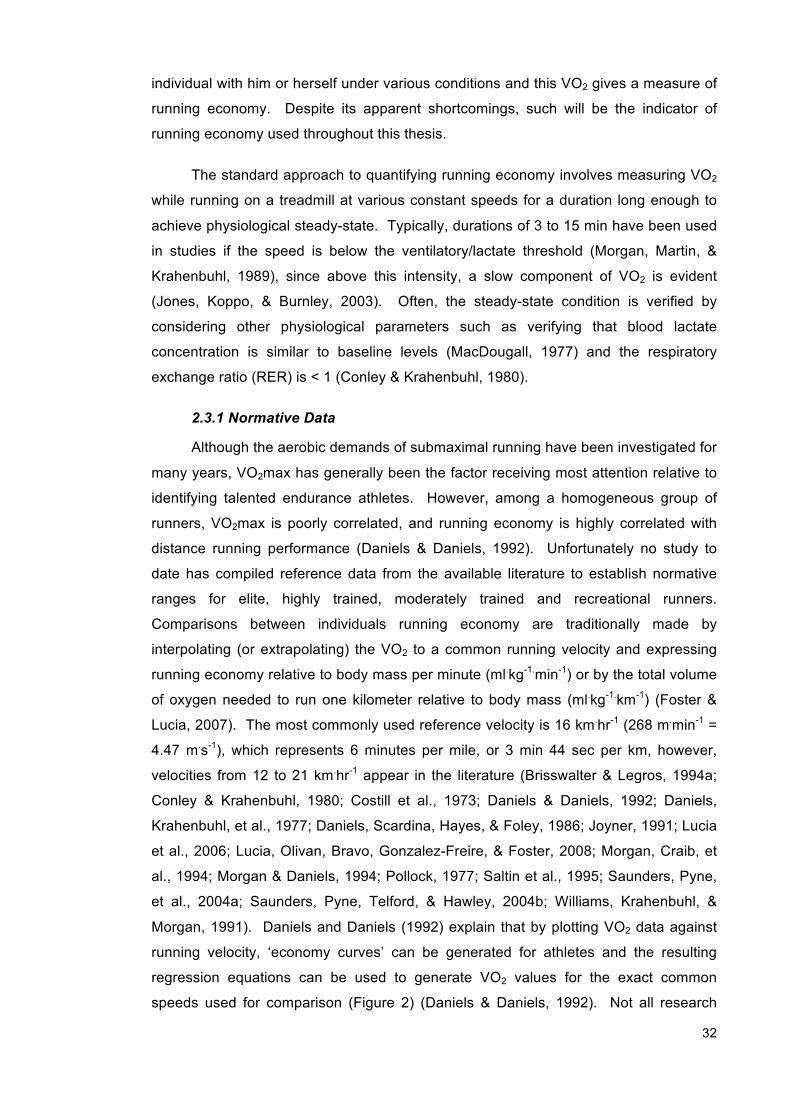
2.3.1 Normative Data
Although the aerobic demands of submaximal running have been investigated for
many years, VO2max has generally been the factor receiving most attention relative to
identifying talented endurance athletes. However, among a homogeneous group of
runners, VO2max is poorly correlated, and running economy is highly correlated with
distance running performance (Daniels & Daniels, 1992). Unfortunately no study to
date has compiled reference data from the available literature to establish normative
ranges for elite, highly trained, moderately trained and recreational runners.
Comparisons between individuals running economy are traditionally made by
interpolating (or extrapolating) the VO2 to a common running velocity and expressing
running economy relative to body mass per minute (ml.kg-1.min-1) or by the total volume
of oxygen needed to run one kilometer relative to body mass (ml.kg-1.km-1) (Foster &
Lucia, 2007). The most commonly used reference velocity is 16 km.hr-1 (268 m.min-1 =
4.47 m.s-1), which represents 6 minutes per mile, or 3 min 44 sec per km, however,
velocities from 12 to 21 km.hr-1 appear in the literature (Brisswalter & Legros, 1994a;
Conley & Krahenbuhl, 1980; Costill et al., 1973; Daniels & Daniels, 1992; Daniels,
Krahenbuhl, et al., 1977; Daniels, Scardina, Hayes, & Foley, 1986; Joyner, 1991; Lucia
et al., 2006; Lucia, Olivan, Bravo, Gonzalez-Freire, & Foster, 2008; Morgan, Craib, et
al., 1994; Morgan & Daniels, 1994; Pollock, 1977; Saltin et al., 1995; Saunders, Pyne,
et al., 2004a; Saunders, Pyne, Telford, & Hawley, 2004b; Williams, Krahenbuhl, &
Morgan, 1991). Daniels and Daniels (1992) explain that by plotting VO2 data against
running velocity, ‘economy curves’ can be generated for athletes and the resulting
regression equations can be used to generate VO2 values for the exact common
speeds used for comparison (Figure 2) (Daniels & Daniels, 1992). Not all research
33
available provides these equations; therefore in the future more researchers should
provide the regression equations for their sample when measuring running economy
across a range of running speeds.
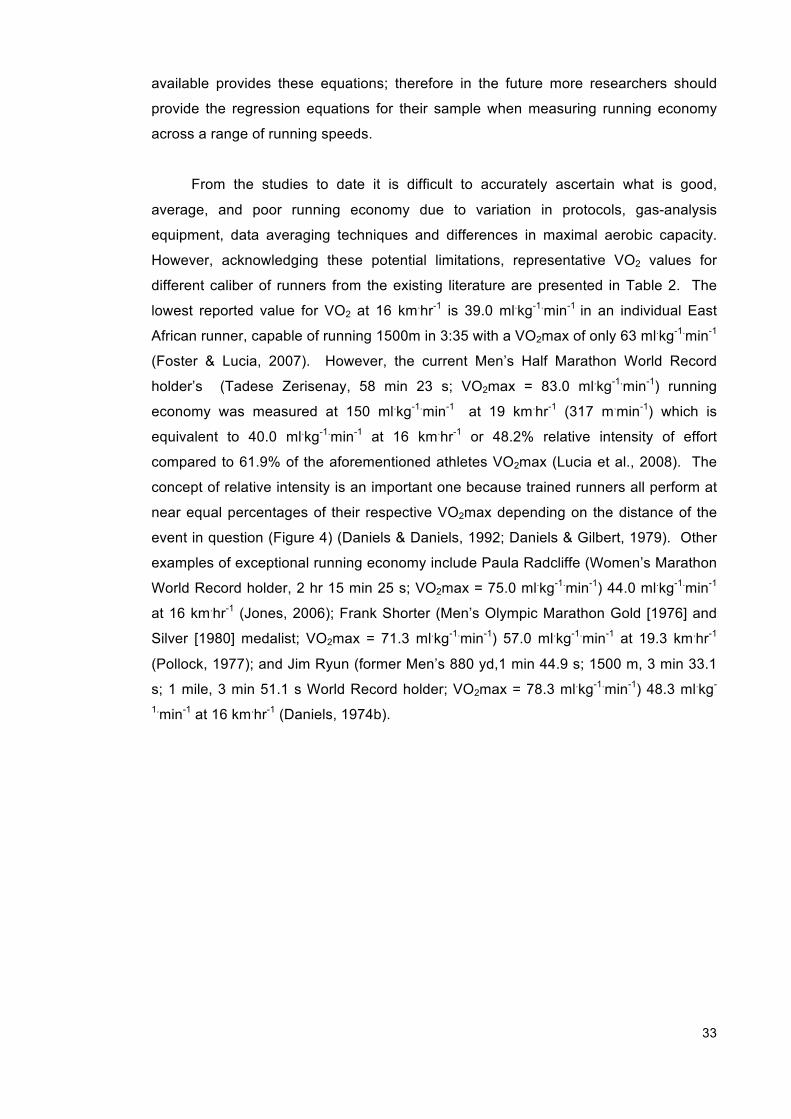
From the studies to date it is difficult to accurately ascertain what is good,
average, and poor running economy due to variation in protocols, gas-analysis
equipment, data averaging techniques and differences in maximal aerobic capacity.
However, acknowledging these potential limitations, representative VO2 values for
different caliber of runners from the existing literature are presented in Table 2. The
lowest reported value for VO2 at 16 km.hr-1 is 39.0 ml.kg-1.min-1 in an individual East
African runner, capable of running 1500m in 3:35 with a VO2max of only 63 ml.kg-1.min-1
(Foster & Lucia, 2007). However, the current Men’s Half Marathon World Record
holder’s (Tadese Zerisenay, 58 min 23 s; VO2max = 83.0 ml.kg-1.min-1) running
economy was measured at 150 ml.kg-1.min-1 at 19 km.hr-1 (317 m.min-1) which is
equivalent to 40.0 ml.kg-1.min-1 at 16 km.hr-1 or 48.2% relative intensity of effort
compared to 61.9% of the aforementioned athletes VO2max (Lucia et al., 2008). The
concept of relative intensity is an important one because trained runners all perform at
near equal percentages of their respective VO2max depending on the distance of the
event in question (Figure 4) (Daniels & Daniels, 1992; Daniels & Gilbert, 1979). Other
examples of exceptional running economy include Paula Radcliffe (Women’s Marathon
World Record holder, 2 hr 15 min 25 s; VO2max = 75.0 ml.kg-1.min-1) 44.0 ml.kg-1.min-1
at 16 km.hr-1 (Jones, 2006); Frank Shorter (Men’s Olympic Marathon Gold [1976] and
Silver [1980] medalist; VO2max = 71.3 ml.kg-1.min-1) 57.0 ml.kg-1.min-1 at 19.3 km.hr-1
(Pollock, 1977); and Jim Ryun (former Men’s 880 yd,1 min 44.9 s; 1500 m, 3 min 33.1
s; 1 mile, 3 min 51.1 s World Record holder; VO2max = 78.3 ml.kg-1.min-1) 48.3 ml.kg-
1.min-1 at 16 km.hr-1 (Daniels, 1974b).
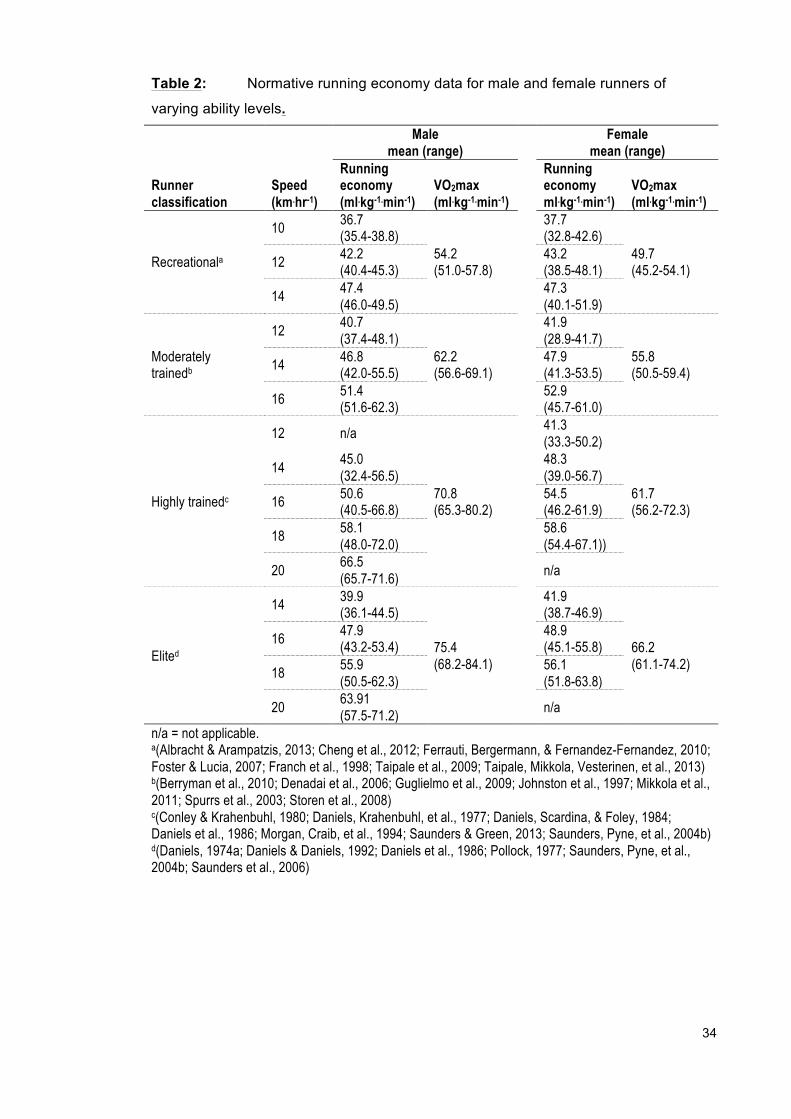
34
Table 2: Normative running economy data for male and female runners of
varying ability levels.
Male mean (range)
Female mean (range)
Runner classification
Speed (km.hr-1)
Running economy (ml.kg-1.min-1)
VO2max (ml.kg-1.min-1)
Running economy ml.kg-1.min-1)
VO2max (ml.kg-1.min-1)
Recreationala
10 36.7 (35.4-38.8)
54.2 (51.0-57.8)
37.7 (32.8-42.6)
49.7 (45.2-54.1) 12 42.2
(40.4-45.3) 43.2 (38.5-48.1)
14 47.4 (46.0-49.5) 47.3
(40.1-51.9)
Moderately trainedb
12 40.7 (37.4-48.1)
62.2 (56.6-69.1)
41.9 (28.9-41.7)
55.8 (50.5-59.4) 14 46.8
(42.0-55.5) 47.9 (41.3-53.5)
16 51.4 (51.6-62.3) 52.9
(45.7-61.0)
Highly trainedc
12 n/a
70.8 (65.3-80.2)
41.3 (33.3-50.2)
61.7 (56.2-72.3)
14 45.0 (32.4-56.5) 48.3
(39.0-56.7)
16 50.6 (40.5-66.8) 54.5
(46.2-61.9)
18 58.1 (48.0-72.0) 58.6
(54.4-67.1))
20 66.5 (65.7-71.6) n/a
Elited
14 39.9 (36.1-44.5)
75.4 (68.2-84.1)
41.9 (38.7-46.9)
66.2 (61.1-74.2)
16 47.9 (43.2-53.4) 48.9
(45.1-55.8)
18 55.9 (50.5-62.3) 56.1
(51.8-63.8)
20 63.91 (57.5-71.2) n/a
n/a = not applicable. a(Albracht & Arampatzis, 2013; Cheng et al., 2012; Ferrauti, Bergermann, & Fernandez-Fernandez, 2010; Foster & Lucia, 2007; Franch et al., 1998; Taipale et al., 2009; Taipale, Mikkola, Vesterinen, et al., 2013) b(Berryman et al., 2010; Denadai et al., 2006; Guglielmo et al., 2009; Johnston et al., 1997; Mikkola et al., 2011; Spurrs et al., 2003; Storen et al., 2008) c(Conley & Krahenbuhl, 1980; Daniels, Krahenbuhl, et al., 1977; Daniels, Scardina, & Foley, 1984; Daniels et al., 1986; Morgan, Craib, et al., 1994; Saunders & Green, 2013; Saunders, Pyne, et al., 2004b) d(Daniels, 1974a; Daniels & Daniels, 1992; Daniels et al., 1986; Pollock, 1977; Saunders, Pyne, et al., 2004b; Saunders et al., 2006)
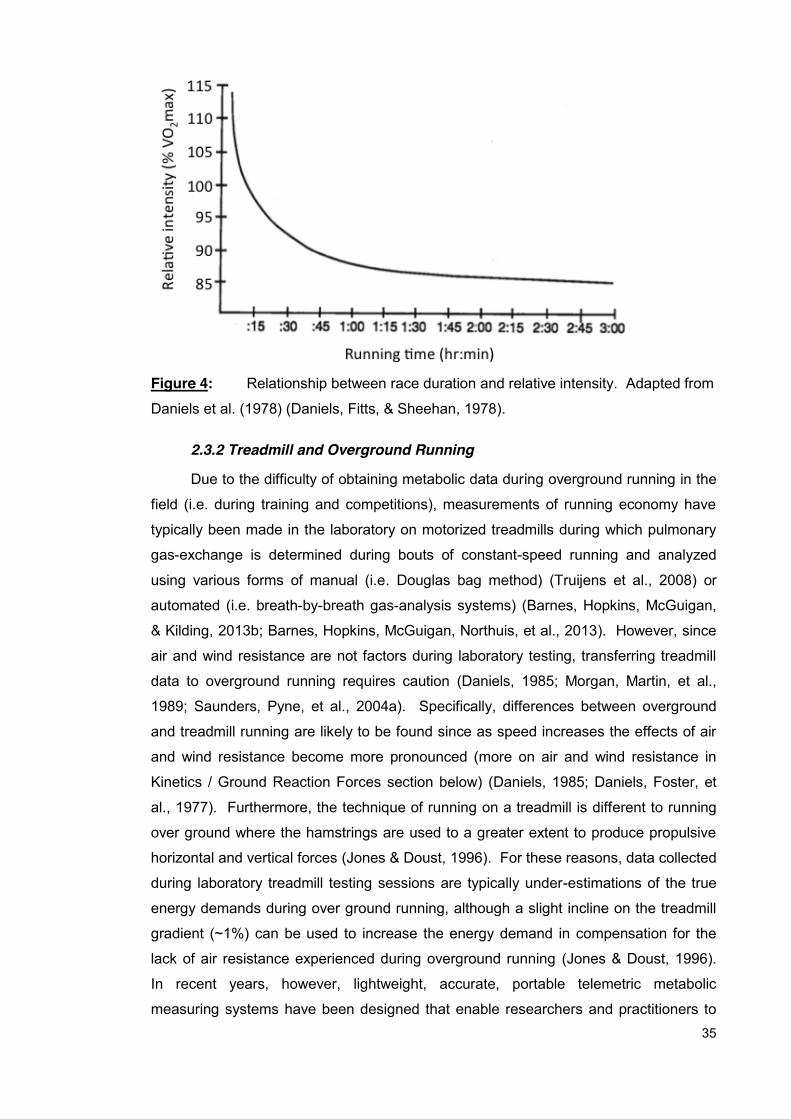
35
Figure 4: Relationship between race duration and relative intensity. Adapted from
Daniels et al. (1978) (Daniels, Fitts, & Sheehan, 1978).
2.3.2 Treadmill and Overground Running
Due to the difficulty of obtaining metabolic data during overground running in the
field (i.e. during training and competitions), measurements of running economy have
typically been made in the laboratory on motorized treadmills during which pulmonary
gas-exchange is determined during bouts of constant-speed running and analyzed
using various forms of manual (i.e. Douglas bag method) (Truijens et al., 2008) or
automated (i.e. breath-by-breath gas-analysis systems) (Barnes, Hopkins, McGuigan,
& Kilding, 2013b; Barnes, Hopkins, McGuigan, Northuis, et al., 2013). However, since
air and wind resistance are not factors during laboratory testing, transferring treadmill
data to overground running requires caution (Daniels, 1985; Morgan, Martin, et al.,
1989; Saunders, Pyne, et al., 2004a). Specifically, differences between overground
and treadmill running are likely to be found since as speed increases the effects of air
and wind resistance become more pronounced (more on air and wind resistance in
Kinetics / Ground Reaction Forces section below) (Daniels, 1985; Daniels, Foster, et
al., 1977). Furthermore, the technique of running on a treadmill is different to running
over ground where the hamstrings are used to a greater extent to produce propulsive
horizontal and vertical forces (Jones & Doust, 1996). For these reasons, data collected
during laboratory treadmill testing sessions are typically under-estimations of the true
energy demands during over ground running, although a slight incline on the treadmill
gradient (~1%) can be used to increase the energy demand in compensation for the
lack of air resistance experienced during overground running (Jones & Doust, 1996).
In recent years, however, lightweight, accurate, portable telemetric metabolic
measuring systems have been designed that enable researchers and practitioners to
36
obtain measurements during running outside of a laboratory environment. Although,
Saunders et al. (2004) note that careful attention must be made to ensure post- or
repeated-measure results are not influenced by changes in environmental conditions
(Saunders, Pyne, et al., 2004a).
2.3.3 Reliability of Running Economy
In order to evaluate the effectiveness of running training throughout the season
or the effect of specific interventions aimed at improving running economy, the
intraindividual variation (typical error) of running economy should be considered.
Factors such as treadmill running experience (Morgan, Martin, Krahenbuhl, & Baldini,
1991), training level (Pereira & Freedson, 1997), footwear (Morgan, Martin, Baldini, &
Krahenbuhl, 1990; Morgan et al., 1991; Pereira & Freedson, 1997; Pereira, Freedson,
& Maliszewski, 1994; Saunders, Pyne, et al., 2004b), time of day of testing (Morgan et
al., 1990; Morgan et al., 1991; Pereira & Freedson, 1997; Pereira et al., 1994;
Saunders, Pyne, et al., 2004b), prior training activity (Morgan et al., 1991; Pereira et
al., 1994), nutritional status (Pereira & Freedson, 1997; Pereira et al., 1994), testing
equipment (Saunders, Pyne, et al., 2004b) and laboratory environment (Saunders,
Pyne, et al., 2004b) may affect the test-retest reliability of running economy measures.
Well-controlled studies using moderately trained to elite caliber subjects report
intraindividual variation in running economy between 1.3% and 5% at speeds between
12 and 18 km.hr-1 (Barnes, Hopkins, McGuigan, Northuis, et al., 2013; Brisswalter &
Legros, 1994a; Morgan, Craib, et al., 1994; Morgan et al., 1990; Morgan et al., 1991;
Pereira & Freedson, 1997; Pereira et al., 1994; Saunders, Pyne, et al., 2004b; Williams
et al., 1991) indicating that within-subject results are relatively stable. While no
patterns emerge between the training status or gender of the athlete and reliability of
running economy, it does appear that the typical error is less at running velocities at
which the athletes typically train (Morgan et al., 1991; Pereira & Freedson, 1997;
Saunders, Pyne, et al., 2004b). While durations of up to 15 min have been used in the
assessment of running economy (Pereira & Freedson, 1997), multiple ~4 min stages at
progressively faster running speeds (e.g. 12, 14, 16, 18 km.hr-1) have been used in
moderate to highly trained runners familiar with treadmill running because steady-state
VO2 can be reached within 2-3 min at each running speed (Saunders, Pyne, et al.,
2004b).
Additionally, Hopkins (2000) has proposed the concept of the smallest
worthwhile change (SWC) to determine the practical significance of interventions
(Hopkins, 2000). The SWC identifies the magnitude of change required to elicit a
meaningful or significant improvement in running economy. The SWC, calculated as a
37
proportion of the effect size, represents the magnitude of improvement in a variable as
a function of the between-athlete standard deviation of the particular cohort (Hopkins,
Marshall, Batterham, & Hanin, 2009; Hopkins, Schabort, & Hawley, 2001). Saunders
et al. (2004) estimated a SWC of 2.6%, 2.4%, and 2.2% for running economy at 14, 16,
and 18 km·h-1 respectively in 70 highly trained distance runners (Saunders, Pyne, et
al., 2004b). Therefore, a distance runner must improve their running economy by ~2.2-
2.6% before a coach or practitioner can be reasonably confident that a real change
(improvement) has occurred.
2.4 Metabolic and Cardiorespiratory Efficiency
In the context of improving running economy, metabolic and cardiorespiratory
efficiency refers to processes that result in better use of oxygen (increased energy
production) relative to a given work output. Fluctuations in cardiorespiratory measures
[heart rate (HR), minute ventilation (VE)], thermoregulation [core temperature (CTemp)],
and substrate metabolism [muscle contractile efficiency, mitochondrial efficiency] have
been associated with changes in running economy (Bailey & Pate, 1991; Jones, 2013;
Morgan & Craib, 1992; Pate, Macera, Bailey, Bartoli, & Powell, 1992; Saunders, Pyne,
et al., 2004a; Svedenhag, 2000).
2.4.1 Cardiorespiratory Measures
Bailey and Pate (1991) and Pate et al. (1989) have suggested that changes in
cardiorespiratory measures (HR and VE) are partly responsible for changes in running
economy during submaximal and maximal exercise (Bailey & Pate, 1991; Pate, 1989).
Thomas et al. (1995) found a correlation of r = 0.79 (p < 0.05) between changes in VE
and changes in running economy during a 5-km race in trained female runners
(Thomas, Fernhall, & Blanpied, 1995). The decreased running economy was
postulated to be caused by the increased O2 demand of breathing (Hagberg, Mullin, &
Nagle, 1978). Franch et al. (1998) also reported a correlation (r = 0.77; p < 0.0001)
between improvements in running economy and reductions in pulmonary ventilation
which may account for 25-70% of the decrease in aerobic demand after an intense run
training program in recreational runners (Franch et al., 1998). Another study attempted
to determine the impact of a simulated 5-km race on running economy, VE, HR, and
CTemp (Thomas et al., 1999). Consistent with other findings (Bailey & Pate, 1991;
Thomas et al., 1995), running economy decreased significantly and VE, HR, and CTemp
all increased significantly from the beginning to the end of the 5-km run. Similar to
previous studies (Franch et al., 1998; Thomas et al., 1995), the increase in VE was the
only measure related to the increased running economy (r = 0.64; p < 0.05). The fact
that the two variables were correlated in several studies does in itself imply cause and

38
effect; however, quantitative estimates of the reduced cost of breathing with the
training-induced decrement in VE suggest that ventilatory adaptation may indeed play a
role in improving running economy (Franch et al., 1998).
Interindividual variation in running economy has been linked to differences in HR
and VE. In a report by Pate et al. (1989) involving 167 habitual runners, both HR and
VE were significantly and positively correlated with VO2 (Pate, 1989), indicating that
better running economy was associated with lower HR and VE. Myocardial VO2 also
constitutes a significant fraction (1-2%) of whole body VO2 during exercise (Kitamura,
Jorgensen, Gobel, Taylor, & Wang, 1972). Reductions in myocardial VO2 would result
in improved running economy from a more efficient combination of HR and stroke
volume (i.e. a reduction in HR and increase in stroke volume) (Pate, 1989). However,
according to Bailey and Pate (Bailey & Pate, 1991) it is unlikely changes in HR make a
significant contribution to changes in running economy. A 20-bpm change in HR only
increased VO2 by 8 ml.min-1, which increased running economy from 41.8 to 41.9 ml.kg-
1.min-1. Voluntary hyperpnoea at rest, which increased VE from 70 to 100 ml.min-1, has
been found to increase VO2 by 122 ml.min-1 (Coast & Krause, 1993). If training is able
to decrease the work of breathing at a specific running velocity, this could contribute to
an improved running economy (Bailey & Pate, 1991). Using recent cost estimates of
exercise VE, the cost of VE increased O2 consumption by 31-50 ml (0.4-0.6 ml.kg-1.min-1)
in men and 19-31 ml (0.3-0.5 ml.kg-1.min-1) in women. This explains 12-19% of the
increase in VO2 in men and 16-26% for the women (Aaron, Seow, Johnson, &
Dempsey, 1992; Poole, 1994). Other estimates have found the work of ventilation to
constitute up to 6-7% of the total oxygen cost of exercise (Milic-Emili, Petit, &
Deroanne, 1962). Thus variables other than VE are also responsible for the changes in
running economy.
2.4.2 Body Temperature
There is conflicting evidence regarding the relationship between CTemp and
running economy (Bailey & Pate, 1991; Morgan et al., 1990). In some studies, a higher
CTemp has resulted in an increase in VO2 at a given speed under hyperthermic
conditions (MacDougall, Reddan, Layton, & Dempsey, 1974; Saltin, 1964), likely due to
increases in metabolic demand from augmented circulation, sweating, VE, and a
decrease in efficiency of oxidative phosphorylation (Brooks, Hittelman, Faulkner, &
Beyer, 1971a, 1971b; MacDougall et al., 1974). In this regard, Grimby (1962) found
that a 1.3° C increase in CTemp increased VO2 by 5.5% (Grimby, 1962) and Thomas
(1999) found a slightly greater change in VO2 (6.2%) after a 1.0° C increase in CTemp
(Thomas et al., 1999). In contrast, results from other studies (Maron, Horvath,
39
Wilkerson, & Gliner, 1976; Rowell, Brengelmann, Murray, Kraning, & Kusumi, 1969)
indicate no change or a reduction in VO2 occurred during hyperthermic exercise,
suggesting a higher CTemp enhanced mechanical efficiency of muscle to a degree equal
to or greater than the increase caused by changes in circulation, sweating, and VE.
Additionally, Bailey and Pate (1991) suggest that training-induced adaptations to
repeated bouts of exercise in the heat (Bailey & Pate, 1991), such as increased plasma
volume, may attenuate the thermoregulatory response and reduce attendant energy
requirements (See Training in the Heat in Part II), potentially resulting in improved
running economy.
2.4.3 Muscle Fiber Type
It is now accepted that a range of muscle fiber types exist in humans (Bosco et
al., 1987; Williams & Cavanagh, 1987) and that each exhibit their own metabolic
characteristics (Morgan & Craib, 1992). Indeed, the structure and composition of
muscle fibers seems to influence running economy (Kaneko, 1990; Kyrolainen et al.,
2003; Morgan & Craib, 1992). Type IIA fibers are more oxidative than type IIX fibers
and have functional characteristics more similar to type I fibers (Johnston et al., 1997).
Type-II specific myosin ATPase isoforms require 1.6- to 2.1-fold more ATP per unit
force production than type I and therefore require a proportionately higher oxidative
phosphorylation (Rowlands, Graham, Fink, Wadsworth, & Hughes, 2013). Therefore
an increase in type IIA fibers should increase the oxidative capacity of muscle and
should contribute to improved running economy. Although no research has examined
the genetic link between muscle fiber type and running economy, athletes may be
predisposed to better or worse economy based on their composition of type I and type
II muscle fibers (Tucker, Santos-Concejero, & Collins, 2013). Several studies have
found a correlation between the percentages of type I muscle fibers and running
economy (Bosco et al., 1987; Kaneko, 1990; Williams & Cavanagh, 1987), indicating
that metabolic activity or actual speed of contraction of the muscle fibers may influence
running economy. Although, Williams and Cavanagh (1987) observed no difference in
muscle fiber composition among 31 trained male runners who exhibited good, medium
and poor running economy (Williams & Cavanagh, 1987), Bosco et al. (1987) reported
a significant positive relationship (r = 0.60; p < 0.01) between percent type II fibers and
running economy in 17 athletes (Bosco et al., 1987). In further support, Kyrolainen et
al. (2003) found a difference in running economy at six different running speeds among
a group of homogeneous middle-distance runners, which was partly explained by
differences in muscle fiber distribution, myosin heavy chain isoform composition, and
titin isoforms (Kyrolainen et al., 2003). Specifically, at a speed of 7 m.s-1, VO2 was
inversely correlated with the amount of myosin heavy chain II isoforms and with

40
percent Type II fibers, which is in contrast to the findings of Bosco et al. (1987) (Bosco
et al., 1987). Additionally, the percentage of type II fibers as fast myosin heavy chain
isoforms correlated positively with the maximal force and with the rate of force
production (Kyrolainen et al., 2003). Titin is a large elastic protein acting as anchor
between the Z-lines and myosin within the sarcomere, which may play a significant role
in running economy (Kyrolainen et al., 2003). Whereas myosin is directly involved in
the force production processes of muscle contraction, titin is thought to have effects on
the elastic characteristics of the muscle fibers (Wang, McCarter, Wright, Beverly, &
Ramirez-Mitchell, 1993). Because force production is an important determinant of
muscle-tendon performance (stiffness and storage and return of elastic energy) during
running, myosin heavy chain isoforms and titan may affect neuromuscular efficiency
and therefore running economy.
In summary, a number of metabolic and cardiorespiratory measures appear to
influence running economy. Heart rate and VE make a substantial contribution to
overall VO2 and are associated with interindividual differences and improvements in
running economy. Muscle structure also seems to play an important role in explaining
differences between athletes and perhaps changes in running economy following
training, which can be partly explained by muscle fiber distribution, myosin heavy chain
composition, and titin isoforms. The effects of CTemp on running economy are
inconsistent, however; training-induced adaptations as a result of prolonged exposure
to the heat may provide a means of improving running economy.
2.5 Biomechanical Efficiency
Running involves the conversion of muscular forces translocated through
complex movement patters that utilize all the major muscles and joints in the body
(Anderson, 1996). Current evidence suggests that a variety of biomechanical
characteristics are likely to contribute to running economy; these include a variety of
anthropometric dimensions (Bourdin, Pastene, Germain, & Lacour, 1993; Cavanagh &
Kram, 1985b, 1989; Pate et al., 1992; Scholz, Bobbert, van Soest, Clark, & van
Heerden, 2008; Taylor, Heglund, & Maloiy, 1982; Williams & Cavanagh, 1986; Williams
& Cavanagh, 1987), select gait patterns (Cavagna, Heglund, & Willems, 2005;
Cavanagh & Williams, 1982; Di Michele & Merni, 2013; Morgan, Martin, et al., 1994;
Morgan & Martin, 1986; Nilsson & Thorstensson, 1987; Svedenhag & Sjodin, 1984;
Tartaruga et al., 2012), and kinematic and kinetic factors (Anderson & Tseh, 1994;
Cavanagh, Pollock, & Landa, 1977; Chang & Kram, 1999; Farley & McMahon, 1992;
Heise & Martin, 2001; Kram & Taylor, 1990; Tartaruga et al., 2012; Williams &
Cavanagh, 1986; Williams & Cavanagh, 1987; Williams, Cavanagh, & Ziff, 1987) that
41
have been shown to affect biomechanical efficiency and relate to better running
economy.
2.5.1 Anthropometric Characteristics
2.5.1.1 Body Mass and Mass Distribution
A variety of anthropometric characteristics such as height, body mass, physique,
and segmental mass distribution may help explain interindividual and group differences
as well as potential influences on running economy. It is well-known that the oxygen
cost of running does not increase proportional to body mass (Taylor, 1994; Taylor et
al., 1982), and the VO2 per kilogram of body mass is higher in children than adults
(Daniels, 1985; Daniels & Oldridge, 1971; Daniels, Oldridge, et al., 1978; Krahenbuhl &
Pangrazi, 1983; Krahenbuhl, Pangrazi, & Chomokos, 1979; MacDougall, Roche, Bar-
Or, & Moroz, 1983; Morgan, Martin, et al., 1989; Rowland et al., 1997; Rowland,
Auchinachie, Keenan, & Green, 1987, 1988; Silverman & Anderson, 1972;
Thorstensson, 1986; Unnithan, Timmons, Brogan, Paton, & Rowland, 1996). Indeed,
in running events ranging from 800-m to the marathon, it’s not uncommon to see
individuals range by as much as 25 kg and/or 30 cm in the same race, even at the elite
level. For this reason, it has been suggested that scaling body mass to the 0.67 or
0.75 power (e.g. ml.kg-0.67.min-1 or ml.kg-0.75.min-1) is more appropriate when comparing
groups or individuals (Åstrand, 2003; Bergh, Sjodin, Forsberg, & Svedenhag, 1991;
Daniels & Daniels, 1992; Heil, 1997; Rogers, Olson, & Wilmore, 1995; Svedenhag &
Sjodin, 1994; Welsman, Armstrong, Nevill, Winter, & Kirby, 1996). For example,
several studies (Davies & Thompson, 1979; Skinner, Hutsler, Bergsteinova, & Buskirk,
1973) have shown lightweight men to be no more or less economical than their heavier
counterparts. Other research has demonstrated that when body mass is artificially
increased by adding weight to the trunk, the VO2 per kilogram of body mass has been
found to decrease in children (Cooke, McDonagh, Nevill, & Davies, 1991; Davies,
1980b; Thorstensson, 1986) and adults (Abe et al., 2011; Cooke et al., 1991;
Thorstensson, 1986) during running. Consequently, several authors have suggested
that the lower submaximal VO2 in adults compared with children is a function of
differences in body mass and not merely growth and maturation (Bergh et al., 1991;
Sjodin & Svedenhag, 1992). In support, several studies (Bourdin et al., 1993; Pate et
al., 1992; Williams & Cavanagh, 1986; Williams & Cavanagh, 1987) have shown small
to moderate inverse relationship between body mass and running economy.
The relationship between body mass and running economy has been proposed
to be a result of individual differences in mass distribution within the body, particularly
42
in the limb segments (Cavanagh & Kram, 1985b). For example, subtle differences in
physique, particularly a low body mass index (BMI) and long slender legs where the
majority of mass is distributed higher on the thigh, have been suggested to be the
primary reason for the extraordinary running economy of African runners (Foster &
Lucia, 2007; Larsen, 2003; Lucia et al., 2006; Wilber & Pitsiladis, 2012). Although it is
difficult to obtain a direct measure of the relationship between segmental mass
distribution and running economy, indirect support comes from experimental studies in
which mass has been added to the lower limb segments of runners (Catlin, 1979;
Cureton et al., 1978; Jones, Toner, Daniels, & Knapik, 1984; Keren, Epstein,
Magazanik, & Sohar, 1981; Martin, 1985; Myers & Steudel, 1985; Soule & Goldman,
1969). In general, the results from these studies indicate that the aerobic demand of
carrying an extra load becomes more significant when the mass is located more
distally. Myers (1985) found that the aerobic demand of carrying an extra kilogram on
the trunk is increased by 1% whereas when an equal mass is carried in the shoes,
aerobic demand is increased by 10% (Myers & Steudel, 1985). Other studies have
found an increased VO2 of 4.5% (Jones, Knapik, Daniels, & Toner, 1986) and 14%
(Martin, 1985) per kilogram carried on the feet and 7% increase when carried on the
thigh (Martin, 1985). Given the distal location of the feet, foot size or foot size relative
to body size would also suggest it influences running economy (Anderson, 1996). If
one considers that a typical standard shoe weighs about 350 g, about 200 g more than
most minimal shoes, and that the aerobic demand for every 100 g added to the trunk
increases by about 0.1% and added to the foot increases by 1.0% (Frederick, 1984;
Myers & Steudel, 1985), then the results from Perl et al. (2012) suggest the net savings
to minimal-shoe running is between 4.4% and 6.8% (Perl, Daoud, & Lieberman, 2012).
These results support previous studies (Burkett, Kohrt, & Buchbinder, 1985; Catlin,
1979; Divert et al., 2008; Hanson, Berg, Deka, Meendering, & Ryan, 2011; Lussiana,
Fabre, Hebert-Losier, & Mourot, 2013; Sobhani et al., 2013; Soule & Goldman, 1969;
Squadrone & Gallozzi, 2009; Warne & Warrington, 2012) reporting running barefoot or
in minimal shoes to be more economical than running in standard shoes. However,
cushioning and other features of shoe design besides weight have been shown to have
significant effect on running economy (Frederick, 1984). For example, the aerobic
demand during treadmill running was about 2.8% less when running in well cushioned
shoes compared with poorly cushioned shoes of similar mass (Frederick, 1984).
2.5.1.2 Limb Length
While lower limb mass distribution has been shown to affect running economy,
there is no consensus on whether leg length is a factor in determining running
economy. Leg length contributes to angular inertia and the metabolic cost of moving
43
legs during running (Anderson, 1996), and while there has been some research
focusing on the relationship between leg length and stride length (Cavanagh & Kram,
1989; Elliott & Blanksby, 1979), the influence of leg length on economy has only been
investigated indirectly. Research examining the physiques of male and female
sprinters, middle-distance and long-distance runners have characterized sprinters as
short-legged and middle- and long-distance runners as long-legged (Malina, Harper,
Avent, & Campbell, 1971). In general middle- and long-distance runners have been
found to exhibit better economy than sprinters (Bourdin et al., 1993; Daniels & Daniels,
1992; Kaneko, 1990; Pollock, 1977), however the influence of leg length on these
differences is unknown. Myers and Steudel (1985) suggest that for a given body mass,
speed and gait pattern, runners that are smaller and have proportionately greater
amount of body mass distributed proximally in the legs perform less work to accelerate
and decelerate the limbs (Myers & Steudel, 1985). However, despite Williams and
Cavanagh (1987) finding a large variation in running economy among 31 male distance
runners (Williams & Cavanagh, 1987), there were no differences associated with
segmental leg lengths and masses.
2.5.1.3 Achilles Moment Arm
The amount of energy stored in a tendon depends on the mechanical properties
of the tendon and on the forces that stretch the tendon. Thus, for a given kinematic
pattern, and hence kinetic pattern, tendon force is inversely related to the moment arm
of the Achilles tendon (Scholz et al., 2008). Since it is generally accepted that storage
and reutilization of elastic energy in tendons substantially reduces energy demands in
running (Cavagna & Kaneko, 1977) previous research has been able to establish a
moderate (Raichlen, Armstrong, & Lieberman, 2011) to large (Scholz et al., 2008)
(Figure 5) relationship between the variation in running economy and the moment arm
of the Achilles tendon, albeit in small sample sizes of 8 to 15 (Raichlen et al., 2011;
Scholz et al., 2008). Achilles tendon length and less flexible lower limb joints are
associated with improved running economy (Hunter et al., 2011).
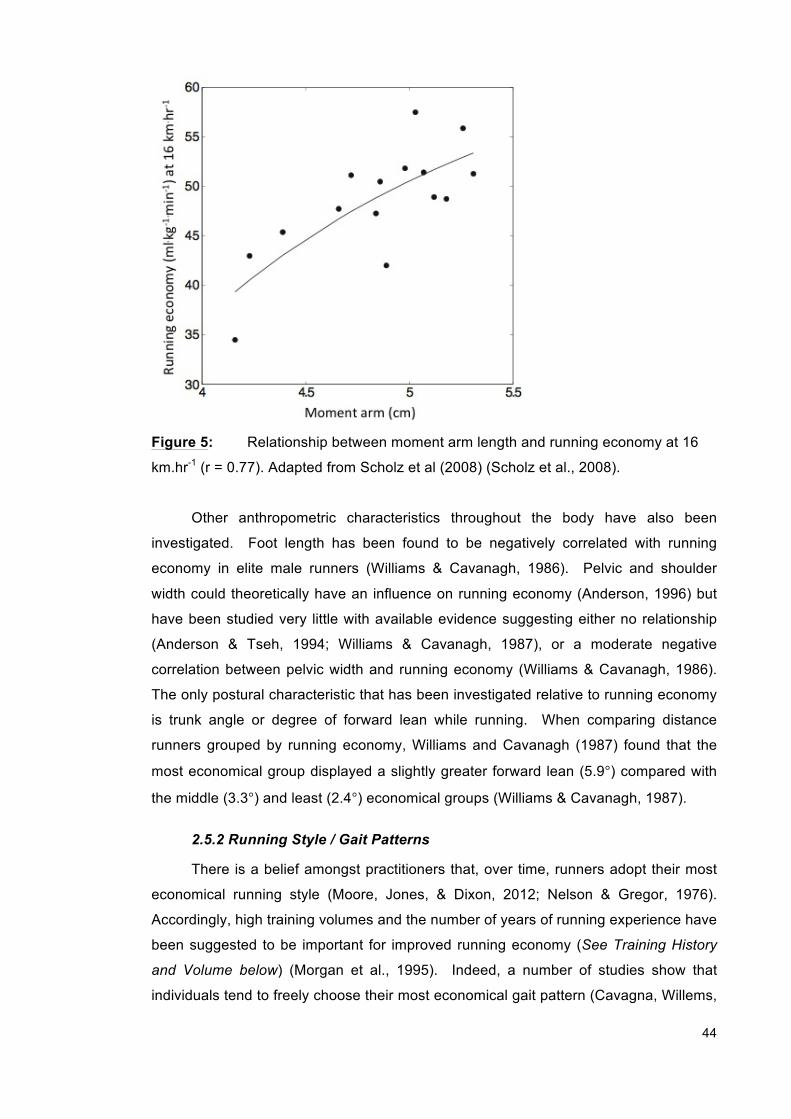
44
Figure 5: Relationship between moment arm length and running economy at 16
km.hr-1 (r = 0.77). Adapted from Scholz et al (2008) (Scholz et al., 2008).
Other anthropometric characteristics throughout the body have also been
investigated. Foot length has been found to be negatively correlated with running
economy in elite male runners (Williams & Cavanagh, 1986). Pelvic and shoulder
width could theoretically have an influence on running economy (Anderson, 1996) but
have been studied very little with available evidence suggesting either no relationship
(Anderson & Tseh, 1994; Williams & Cavanagh, 1987), or a moderate negative
correlation between pelvic width and running economy (Williams & Cavanagh, 1986).
The only postural characteristic that has been investigated relative to running economy
is trunk angle or degree of forward lean while running. When comparing distance
runners grouped by running economy, Williams and Cavanagh (1987) found that the
most economical group displayed a slightly greater forward lean (5.9°) compared with
the middle (3.3°) and least (2.4°) economical groups (Williams & Cavanagh, 1987).
2.5.2 Running Style / Gait Patterns
There is a belief amongst practitioners that, over time, runners adopt their most
economical running style (Moore, Jones, & Dixon, 2012; Nelson & Gregor, 1976).
Accordingly, high training volumes and the number of years of running experience have
been suggested to be important for improved running economy (See Training History
and Volume below) (Morgan et al., 1995). Indeed, a number of studies show that
individuals tend to freely choose their most economical gait pattern (Cavagna, Willems,
45
Franzetti, & Detrembleur, 1991; Cavanagh & Kram, 1985a; Cavanagh & Williams,
1982; Kaneko, Matsumoto, Ito, & Fuchimoto, 1987; Knuttgen, 1961). While studies
have identified small to moderate relationships between biomechanical characteristics
and running economy (Cavanagh & Williams, 1982; Kaneko et al., 1987; McCann &
Higginson, 2008; Nummela, Keranen, & Mikkelsson, 2007; Nummela, Rusko, & Mero,
1994; Tartaruga et al., 2012; Williams & Cavanagh, 1987), stride length is one of the
few gait variables that has been shown by direct experimental evidence to affect
economy (Cavanagh & Williams, 1982; Hogberg, 1952; Morgan, Martin, et al., 1994;
Morgan & Martin, 1986).
2.5.2.1 Stride Length
Results from a number of studies (Cavanagh & Williams, 1982; Hogberg, 1952;
Kaneko et al., 1987; Knuttgen, 1961; Powers, Hopkins, & Ragsdale, 1982) have
indicated that submaximal VO2 increases curvilinearly as stride length is either
lengthened or shortened from that self-selected by the runner. This basic curvilinear
relationship between stride length and economy has also been shown for walking
(Dicharry, 2010) and racewalking (Morgan & Martin, 1986). The basic assumption
behind this research appears to be that strides which are too long will require
considerable power during propulsion, excessive vertical oscillation of the center of
mass, produce a foot strike position which creates large breaking forces and require
joint ranges of motion which invoke increased internal friction and stiffness (Anderson,
1996). Conversely, strides that are too short would increase internal work through
increased frequency and reciprocal movements (Anderson, 1996).
Hogberg (1952) was the first to indicate that well-trained runners at 14 and 16
km.h-1 are most economical at their own self-selected stride length versus running at
stride lengths short and longer than the self-selected value (Hogberg, 1952). A
comparison of the aerobic demands associated with these various stride length
conditions revealed that VO2 while running with a stride length ~13% longer than
optimal was ~12% higher, while in contrast, a nearly equal decrease in stride length
from optimal resulted in a 6% increase in VO2. More recent work has confirmed that
VO2 was lowest at stride lengths close to the self-selected condition and that a
curvilinear relationship between stride length and VO2 when evaluating seven stride
length conditions at 13.8 km.h-1 for 10 well-trained runners (Cavanagh & Williams,
1982). Based on these results, Cavanagh and Williams (1982) concluded that there is
little need to dictate stride length for most runners since they already tend to display
near optimal stride lengths (Cavanagh & Williams, 1982). They proposed two
mechanisms for this phenomenon. First, runners naturally acquire an optimal stride
46
length and stride rate over time, based on perceived exertion (Williams & Cavanagh,
1987), which supports the premises put forth previously (Morgan et al., 1995; Nelson &
Gregor, 1976; Williams & Cavanagh, 1987). Second, runners may adapt
physiologically through repeated training at a particular stride length/stride rate for a
given running speed (Cavanagh & Williams, 1982).
Stride length and running economy have been shown to differ between
experienced and novice runners, with experienced runners tending to possess longer
stride lengths and better running economy (Chen, Nosaka, Lin, Chen, & Wu, 2009;
Dallam, Wilber, Jadelis, Fletcher, & Romanov, 2005; Dillman, 1975), although Bailey
and Messier (1991) found that neither stride length or running economy changed
significantly over a seven-week training period in novice runners (Bailey & Messier,
1991). It has previously been suggested that it may take several months, if not years
for changes in stride length and running economy to occur (Bailey & Pate, 1991).
Relationships between stride length and a variety of anthropometric dimensions
have been low to moderate, but do show a tendency for people who are taller, longer
legged, heavier and heavier legged and have limbs with greater moments of inertia to
take longer strides (Williams & Cavanagh, 1987). Relationships between stride length
and anthropometric characteristics expressed relative to height or leg length have also
been low to moderate (Cavanagh & Williams, 1982; Kaneko et al., 1987; Williams &
Cavanagh, 1987).
2.5.2.2 Stride Rate
Kaneko et al. (1987) suggested that the link between stride rate and economy
may be associated with muscle fiber recruitment (Kaneko et al., 1987). At slower stride
rates (and longer stride lengths), the muscles need to develop relatively high external
power during propulsion to overcome large braking forces. Conversely at fast strides
rates (short stride lengths), the mechanical power associated with moving the limbs
increases due to increased frequency of reciprocal movements. They indicated that
these extreme conditions may require a greater reliance on less economical Type II
fibers than more intermediate stride rate/stride length combinations (Kaneko et al.,
1987). Consequently, efforts to improve running economy via stride rate manipulation
would be ineffective, unless the runner’s freely chosen stride rate is not economically
optimal (Bailey & Pate, 1991). However, Morgan et al. (1994) demonstrated that it was
possible to train runners who self-selected an uneconomical over-striding rate to run at
a stride rate closer to one predicted to be optimal, with a concomitant improvement in
running economy (Morgan, Martin, et al., 1994).
47
2.5.2.3 Vertical Oscillations
Studies comparing the biomechanical characteristics of elite and good runners,
found that elite distance runners have slightly less vertical oscillation and had better
running economy than good runners (Cavagna et al., 2005; Cavanagh et al., 1977;
Svedenhag & Sjodin, 1984; Tartaruga et al., 2012). Similarly, Williams and Cavanagh
(1987) showed a trend, although nonsignificant, towards less vertical oscillation and
better running economy (Williams & Cavanagh, 1987). The intuitive perception is that
vertical oscillation is adversely related to economy; however, Cavagna et al. (2005)
reported that less vertical oscillation results in high stride frequency and higher internal
work to accelerate lower limb segments, thus increasing oxygen demand and reducing
running economy (Cavagna et al., 2005). Conversely, Halvorsen et al. (2012) showed
that reducing vertical oscillation has a positive effect on running economy (Halvorsen,
Eriksson, & Gullstrand, 2012). These results suggest there is likely an optimal degree
of vertical lift in order for stride length and other stride characteristics to not adversely
affect running economy. To our knowledge, no research has investigated this
possibility.
2.5.2.4 Footstrike Patterns
It continues to be argued that a forefoot strike pattern during running is more
economical than a rearfoot pattern; however, previous studies using one habitual
footstrike group have found no difference in running economy between footstrike
patterns (Di Michele & Merni, 2013; Nilsson & Thorstensson, 1987; Williams &
Cavanagh, 1986). In fact, Gruber et al. (2013) found no differences in VO2 between 19
habitual forefoot runners and 18 habitual rearfoot runners (Gruber, Umberger, Braun, &
Hamill, 2013). However, when subjects ran with the alternative footstrike pattern, VO2
increased significantly (5.5%, p < 0.001) with the forefoot pattern but not the rearfoot
pattern. Contrary to popular belief, these results suggest that the forefoot pattern is not
more economical than the rearfoot pattern. There have also been no consistent
findings between contact times and flight times, with some studies indicating longer
contact times were associated with poorer economy (Tartaruga et al., 2012; Williams &
Cavanagh, 1986; Williams & Cavanagh, 1987), shorter contact times were associated
with worse economy (Chapman et al., 2012) and others finding no relationship
(Cavanagh et al., 1977; Williams et al., 1987). Di Michelle and Merni (2013) suggest
that with the aim of maximizing running economy, a trade-off between a midfoot strike
pattern and a long contact time must be pursued (Di Michele & Merni, 2013).
2.5.3 Kinematics and Kinetics
While stride length, stride rate and other gait related characteristics have been
48
associated with running economy, other kinematic and kinetic factors such as angular
velocities of limb segments and joints (Anderson & Tseh, 1994; Cavanagh et al., 1977;
Tartaruga et al., 2012; Williams & Cavanagh, 1986; Williams & Cavanagh, 1987;
Williams et al., 1987) and ground reaction forces (Chang & Kram, 1999; Farley &
McMahon, 1992; Heise & Martin, 2001; Kram & Taylor, 1990) have also demonstrated
a relationship with running economy.
2.5.3.1 Lower Body Kinematics
Comparisons of elite and good distance runners indicate that better economy in
elite runners was associated with greater maximal angle of the thigh during hip
extension, more extended lower leg at foot strike, more acute knee angles during swing
and toe-off and that good runners plantar flexed an average of 10° more during toe-off
than elite runners (Cavanagh et al., 1977; Williams & Cavanagh, 1986; Williams et al.,
1987). Whereas running with experimentally increased knee flexion (‘Groucho
running’) has been shown to increase the oxygen demand of running by as much as
50% (McMahon, Valiant, & Frederick, 1987). Williams and Cavanagh (1986) found that
greater maximal plantar flexion velocity and greater horizontal heel velocity at foot
strike were associated with better running economy in elite male distance runners
(Williams & Cavanagh, 1986). These authors also reported that a lower velocity of the
knee joint during the first half of foot contact was the only kinematic variable of 14
tested to be related to better economy (Williams & Cavanagh, 1987). However, in a
study of elite female distance runners, better economy was associated with slower
thigh extension velocity and lower knee flexion velocity during swing (Williams et al.,
1987), suggesting that there is a gender specific optimal kinematic patterns. All of
these relationships between economy and joint angles and velocities were trivial to
moderate in strength.
In a study comparing three groups of runners grouped by varying levels of
economy, Williams and Cavanagh (1987) reported that better economy was associated
with shank angles of greater deviation from vertical at heel strike, less plantar flexion at
toe off and more acute knee angle during mid-support (Williams & Cavanagh, 1987).
Whereas, Paulson et al. (2013) and Kyrolainen et al. (2001) reported that angular
velocities of the ankle, knee and hip joints were not good predictors of running
economy (Kyrolainen et al., 2001; Paulson & Braun, 2013).
2.5.3.2 Upper Body Kinematics
Most investigations of running economy and running mechanics have focused on
the kinematics of lower limbs with only a few studies (Anderson & Tseh, 1994;
49
Tartaruga et al., 2012; Williams & Cavanagh, 1986) considering the upper body limbs.
Anderson and Tseh (1994) found no relationship between running economy and
shoulder width, hip width, or ratio of shoulder to hip width (Anderson & Tseh, 1994).
Whereas Williams and Cavanagh (1986) found a moderate negative correlation
between shoulder to pelvic width and running economy in elite male runners (Williams
& Cavanagh, 1986), indicating that the moments and forces generated by counter-
rotations of the shoulders and hips and movements of the arms may affect running
economy (Cappozzo, 1983a, 1983b; Hinrichs, 1990). Accordingly, a positive
correlation between economy and angular velocity of shoulder rotation and angular
displacement of the hips and shoulders about the polar axis of the trunk (Anderson &
Tseh, 1994), as well as a negative correlation between economy and angular
displacement of the shoulder in the sagittal plane has previously been described
(Anderson & Tseh, 1994). However, Tartaruga et al. (2012) found no relationship
between velocity changes of the wrists and shoulders or rotation of the hips and
shoulders relative to the polar axis of the trunk and economy (Tartaruga et al., 2012).
Some results have shown less arm movement, as measured by wrist excursion during
the gait cycle, tended to reduce total upper body excursion from the body center of
mass both laterally and horizontally and be associated with better running economy
(Anderson & Tseh, 1994; Hinrichs, 1990; Tartaruga et al., 2012; Williams & Cavanagh,
1987).
2.5.3.3 Kinetics / Ground Reaction Forces
Investigations related to kinetics and running economy are limited and most work
has focused on vertical ground reaction forces. Kram and Taylor (1990) presented a
simple inverse relationship between the aerobic demand during running and the time
the foot applies force to the ground during each stride, independent of body mass,
indicating that the energy demand during running is determined by the cost of
supporting one’s body mass and the time course of generating force (Kram & Taylor,
1990). Williams and Cavanagh (1987) surmised that more economical runners have
identifiable kinetic patterns in their running style, which are identifiable by lower first
peaks for the vertical component of ground reaction forces, smaller antero-posterior
and vertical peak forces, and greater energy transfer between upper and lower body
segments (Williams & Cavanagh, 1987). They observed moderate and large
correlations between ground-support time and peak medial forces with running
economy, respectively (Williams & Cavanagh, 1986). Similarly, Heise and Martin
(2001) also observed large correlations between ground reaction forces (total vertical
impulse and net vertical impulse) and submaximal VO2 (Heise & Martin, 2001),
indicating less economical runners exhibit greater wasteful vertical motion. However,
50
similar data collected from elite male and female distance runners showed relatively
low correlations between ground reaction forces and running economy (Williams &
Cavanagh, 1986; Williams et al., 1987) suggesting that ground reaction forces are not
likely to be the determining factor that makes one runner more economical than
another, and that in fact some elite runners are economical despite poor ground
reaction forces.
While vertical ground reaction forces have been shown to affect the metabolic
demand during running in recreational and moderately trained runners due to the
requirement to support body mass (Chang & Kram, 1999; Farley & McMahon, 1992;
Heise & Martin, 2001; Kram & Taylor, 1990), horizontal forces can also substantially
affect running economy. For example, in 25 well-trained endurance athletes, Nuumela
et al. (2007) reported mass-specific horizontal forces were substantially related to
running economy at five different running speeds (Nummela et al., 2007). Similarly,
Storen et al. (2011) found that the sum of horizontal and vertical peak forces were
inversely correlated with running economy (r = 0.66) (Storen, Helgerud, & Hoff, 2011).
Although only indirect links between horizontal (and vertical) kinetic forces and running
economy can be made, the effects of air and wind resistance also affect running
economy. Air resistance accounts for between 2-8% of the total energy demand of
running during events ranging from 5,000 m to the marathon (Davies, 1980a; Pugh,
1970), while energy savings associated with drafting 1-2 m behind another runner have
been estimated to be 3-6% (Kyle, 1979; Pugh, 1971). In general the detrimental
effects of running into a head wind outweigh the benefits of running with a tail wind.
For example, when horizontal force was altered to both impede and assist runners
using an elastic rope systems, a 30% increase in aerobic demand was observed with a
6% impeding force and a 33% reduction with a 15% assisting force (Chang & Kram,
1999). Other studies have also observed an increase in aerobic demand of running
proportional with the increase in external work (Cooke et al., 1991; Lloyd & Zacks,
1972; Zacks, 1973). Using a wind tunnel to apply horizontal impeding force, Pugh
(1971) showed the aerobic demand of running increased with the square of the head
wind velocity (Pugh, 1971). According to previous data, generating horizontal
propulsive forces constitutes more than one-third of the total metabolic demand of
running (Chang & Kram, 1999), therefore the horizontal and vertical kinetic forces
related to running economy should be considered for future research. There has also
been no research related to the moments and forces generated by counter-rotations of
the hips and shoulders and running economy.
In summary, while some studies have identified small to large relationships
51
between biomechanical factors and running economy, overall the data are mostly
conflicting preventing any clear conclusions. It does appear that runners with a high
ponderal index, narrow pelvis, long slender legs with mass distribution closer to the
torso, short Achilles moment arm, and shorter than average feet have better running
economy. However, there does not appear to be any easily identifiable and universally
applicable patterns of ‘efficient’ movement that will apply to all runners. Rather, it is
likely that adjusting a given biomechanical characteristic may result in an economy
enhancement in one athlete but the same adjustment in another might be
uneconomical because of differences in anthropometric dimensions, running style, or
other factors (Williams, 2007; Williams & Cavanagh, 1987). Perhaps a more promising
avenue of research may be to concentrate on the individual runner in an effort to best
identify how that athlete’s structure and functional abilities influence running economy,
subsequent performance as well as injury susceptibility.
2.6 Neuromuscular Efficiency
In addition to metabolic, cardiorespiratory, and biomechanical factors,
neuromuscular characteristics are also important aspects of running economy. The
interaction between the neural and muscle systems (i.e. neuromuscular system) is
fundamental to all movement, and effectively translates cardiorespiratory capacity into
efficient mechanics and therefore into performance. It is becoming more evident that
aerobic factors are not the only variables that affect endurance performance (Bonacci
et al., 2009). In fact, Green and Patla (1992) suggest that any failure of the contractile
machinery could prevent full utilization of available oxygen (Green & Patla, 1992),
suggesting that in some cases, the ability to use available oxygen might not be the
limiting factor in endurance performance. For example, in ultra-endurance events,
runners often experience neuromuscular fatigue causing them to slow before oxygen
utilization is compromised (Davies & Thompson, 1979).
Neuromuscular characteristics are related to the activation, recruitment and
excitation properties, of the motor unit or muscle group as a whole. These
characteristics may include neural activation, motor unit synchronization, muscle force,
stored elastic energy, stiffness, power, ground contact time, and/or the
excitation/contraction coupling sequence (Green & Patla, 1992; Hakkinen, 1994;
Hakkinen, Komi, & Alen, 1985; Nummela et al., 2006; Paavolainen, Nummela, Rusko,
et al., 1999; Paavolainen, Nummela, & Rusko, 1999; Sale, 1988). Essentially
neuromuscular efficiency can be divided into two categories: 1) factors that improve the
neural signaling and motor programming of the running motion and 2) those that
improve the muscle force production itself.
52
2.6.1 Neural Signaling and Motor Programming
High performance running is a skill, much like hitting a golf ball or shooting a
basketball, that requires precise timing of nearly all the major muscles and joints in the
body to convert muscular force in translocation (Anderson, 1996). Similar to those
skills, practice is needed to improve the efficiency at the activity. Motor learning
studies have shown that continued practice of a task results in more skilled control of
movement, characterized by decreased amplitude and duration of muscle activity,
decreased muscle co-activation and less variability of movement (Osu et al., 2002;
Thoroughman & Shadmehr, 1999; Wang et al., 1993). Recent evidence has shown
that recreational runners (3.4 ± 2.8 km.wk-1) exhibited greater individual variance (i.e.
variability between strides), greater population variance (i.e. variability of muscle
recruitment between athletes), more extensive and more variable muscle co-activation
and longer durations of muscle activity than moderately trained runners (6.6 ± 1.4
years of running experience, who ran 61.4 ± 8.8 km.wk-1) (Chapman, Vicenzino,
Blanch, & Hodges, 2008a). These findings are consistent with previous short-term
training studies of arm, hand and leg (pedaling) movements (Chapman, Vicenzino,
Blanch, & Hodges, 2009; Chapman, Vicenzino, Blanch, & Hodges, 2007, 2008b; Osu
et al., 2002), suggesting that ongoing neuromuscular adaptations occur as a result of
continued training. It is apparent within the literature that run training can induce
positive changes in running economy (Bransford & Howley, 1977; Daniels & Oldridge,
1971; Dolgener, 1982). Running also appears to induce adaptations in motor
programing and recruitment (Osu et al., 2002; Thoroughman & Shadmehr, 1999). It
has recently been hypothesized that improvements in running economy following
various training modalities such as resistance training and plyometric or explosive
resistance-training were due to neuromuscular adaptations (Barnes, Hopkins,
McGuigan, Northuis, et al., 2013; Johnston et al., 1997; Jung, 2003; Paavolainen,
Hakkinen, et al., 1999). Inferences have also been made that optimal lower-limb
muscle recruitment is critical for superior running economy (Anderson, 1996). If
neuromuscular adaptations are responsible for the changes in running economy then it
would be reasonable to suggest that there would be alterations in neural signaling
during running following training. Bonacci et al. (2009) advocate that adaptations to
motor recruitment as a result of training represent a learning effect (Bonacci et al.,
2009). Positive adaptations infer that an individual learns to produce specific patterns
of muscle recruitment that are associated with improved efficiency of the task (e.g.
improved biomechanical and neuromuscular efficiency) resulting in enhanced
performance (Bonacci et al., 2009).
53
2.6.2 Muscle Force Production and Stiffness
There are two muscle contraction-related issues that potentially influence energy
demand and running economy; velocity of contraction and balance between concentric
and eccentric contractions. With regards to velocity contraction, Taylor (1994) has
observed that it is less costly for muscles to generate force at low velocities, that force
is highest and metabolic rate lowest during isometric contraction, and that the energy
cost of generating force increases dramatically with greater shorting velocity (Taylor,
1994). Based on this finding, it has been hypothesized that muscles produce economic
force rather than efficient work during running. The proposed mechanism for this is
that muscle contractions are primarily isometric, adjusting the stiffness of the muscle-
tendon unit during the eccentric phase to produce simultaneous deceleration and
elastic stretch, then producing a nearly isometric impulse that initiates ballistic
concentric acceleration. This proposed mechanism would promote optimization by
exploitation ‘free’ elastic energy, and minimizing metabolic requirements. Such
optimization would obviously demand precise timing, and integration and refinement of
the temporal, kinetic and kinematic patterns, which would require considerable practice
and training.
2.6.2.1 Muscle Power
It has been suggested that endurance performance may be limited not only by
aerobic power but also by ‘muscle power’ factors related to the force and velocity
characteristics of the neuromuscular system (Noakes, 1988). Indeed, performance
during a 5-km and 10-km run has been shown to be partially determined by
neuromuscular characteristics and muscle power, suggesting that skeletal muscle
contractility differs between fast and slow runners (Noakes, 1988; Paavolainen,
Hakkinen, et al., 1999; Paavolainen, Nummela, & Rusko, 1999). Similarly, in a
homogenous group of highly trained endurance runners with similar VO2max values,
those athletes with faster 10-km and 5-km run times displayed higher relative muscle
pre-activation (prior to touchdown), accompanied with lower relative integrated
electromyographic (iEMG) activity during the propulsion phase, along with shorter
stance phase contact times than those athletes with slower run times (Paavolainen,
Nummela, Rusko, et al., 1999; Paavolainen, Nummela, & Rusko, 1999). Furthermore,
there was a significant correlation between running economy and mean stance phase
contact times during constant velocity running, suggesting muscle power
characteristics play an important role in determining distance running performance in
highly trained runners (Paavolainen, Nummela, & Rusko, 1999).
54
2.6.2.2 Stiffness
It is possible that shorter stance phase contact times and greater muscle pre-
activation may represent enhanced leg muscle stiffness, leading to faster transition
from the braking to propulsive phase of ground contact (Nummela et al., 2008;
Paavolainen, Nummela, Rusko, et al., 1999). Dalleau et al. (1998) highlighted the
importance of neuromuscular factors by demonstrating that running economy was
related to the stiffness of the propulsive leg, with greater stiffness eliciting the best
running economy (Dalleau, Belli, Bourdin, & Lacour, 1998). Arampatzis et al. (2006)
corroborate this finding such that in a group of 28 long-distance runners separated into
three groups by economy, the most economical runners had highest tendon stiffness
(Arampatzis et al., 2006). Kubo et al. (2010) however the lower tendon stiffness was
associated with better 5000-m running performance in long distance runners (Kubo,
Tabata, Ikebukuro, Igarashi, Yata, et al., 2010). Leg stiffness is modulated by
neuromuscular activation, and changes in stiffness have been shown to occur as a
result of neuromuscular adaptation to training (e.g. learning of more efficient or more
skilled patterns of motor recruitment) (Franklin, Burdet, Osu, Kawato, & Milner, 2003).
In support of the association between motor recruitment and leg stiffness, a reduction
in EMG pre-activation was shown to be significantly related to a decrease in post-
landing leg stiffness following fatiguing exercise (Avela & Komi, 1998). Greater
duration of muscle co-activation of bi-articular leg muscles during stance has also been
significantly associated with better running economy (Heise, Shinohara, & Binks,
2008). Muscle co-activation modulates leg stiffness during running and may alter
running economy through utilization of stored elastic energy, which has no additional
metabolic cost. Albracht and Arampatzis (2013) indicated that increased tendon
stiffness is indicative of greater energy storage and return and a redistribution of
muscular output within the lower extremities while running (Albracht & Arampatzis,
2013), which might result in improved running economy. Running economy and
stiffness have been shown to change together with training (Fletcher, Esau, &
MacIntosh, 2010; Kubo, Tabata, Ikebukuro, Igarashi, & Tsunoda, 2010). It has also
been shown that stiffness of the muscle-tendon unit increases with running speed
(Cavagna & Kaneko, 1977; Morgan, Martin, et al., 1994; Saibene, 1990).
2.6.2.3 Stretch Shortening Cycle
Kyrolainen et al. (2001) found that as running speed increased so did EMG
preactivation and ground reaction forces, along with their rate of force production
(Kyrolainen et al., 2001). Preparatory muscle function is an important function of the
stretch shortening cycle (SSC). The SCC is a combination of a high velocity eccentric
contraction followed immediately with a concentric contraction. Stretch shortening

55
cycle muscle function enhances performance during the final phase (concentric action)
(Nicol, Avela, & Komi, 2006), and the increase in preparatory muscle activity with
higher running speeds was suggested to be a mechanism to tolerate higher impact
loads, regulate landing stiffness (Gollhofer & Kyrolainen, 1991) and improve running
economy (Kyrolainen et al., 2001). A recent study showed that a greater ratio of
eccentric to concentric vastus lateralis muscle activity was associated with a lower
metabolic demand during running (i.e. better running economy) (Abe, Muraki,
Yanagawa, Fukuoka, & Niihata, 2007).
2.6.2.4 Elastic Energy Storage
The balance between eccentric and concentric contractions could potentially
influence running economy, since the eccentric contractions during which elastic
energy is stored are less costly than the concentric contractions in which the energy is
released (Williams, 1985). There is clear evidence that the mechanical efficiency of
running exceeds the efficiency of conversion of chemical energy to kinetic energy by
muscles (Cavagna & Kaneko, 1977; Cavanagh & Kram, 1985a; Williams, 1985).
Elastic energy stored during the eccentric contractions of running makes a substantial
contribution to propulsion as it is released during subsequent concentric contractions
(Aruin, Prilutskii, Raitsin, & Savel'ev, 1979; Cavagna & Kaneko, 1977). Unfortunately,
there currently are no data available from which to quantify the relative energy cost of
the two types of contractions nor has there been a method devised to differentiate true
eccentric contractions from tendon stretching or to quantify the storage and release of
elastic energy (Asmussen & Bonde-Petersen, 1974; Cavanagh & Kram, 1985a; Leger
& Mercier, 1984; Luhtanen & Komi, 1978; Williams, 1985; Winter, 1978). There is
however, consensus that this phenomenon contributes to both efficiency and economy
of movement.
Both actomyosin cross-bridges and tendons have been implicated as important
sites of energy storage (Cavagna & Citterio, 1974; Ker, Bennett, Bibby, Kester, &
Alexander, 1987). Ker et al. (1987) have estimated that the Achilles tendon and
tendons in the arch of the foot can store 35% and 17%, respectively, of the kinetic and
potential energy gained and lost in a step while running at moderate speed (Ker et al.,
1987). Alexander (1988) has shown that in a 70 kg human running at ~16 km.hr-1,
more than half of the elastic energy can be stored in just two springs, the Achilles
tendon and the arch of the foot (Alexander, 1988). Cavagna et al. (1964) have
estimated that VO2 during running might be 30 to 40% higher without contributions from
elastic storage and return of energy (Cavagna, Saibene, & Margaria, 1964). At higher
running speeds, elastic recovery of energy prevails over the contractile machinery and
56
accounts for most of the work (Cavagna & Kaneko, 1977; Taylor, 1994). Elastic
capacitance is influenced by the rate and magnitude of stretch, the level of activation
and resulting stiffness of the muscle-tendon unit, muscle length at completion of the
stretch and initiation of the succeeding concentric contraction (Aruin & Prilutskii, 1985;
Aruin et al., 1979; Cavagna & Kaneko, 1977). The available evidence indicates that
there may be substantial interindividual differences in ability to store and release elastic
energy (Aura & Komi, 1986a; Ito, Komi, Sjodin, Bosco, & Karlsson, 1983; Williams &
Cavanagh, 1983) and it has been suggested that fiber composition, gender and
maturity are likely contributors to these differences (Aura & Komi, 1986b). It is obvious
from the foregoing that the storage and release of elastic energy in muscles makes
important contributions to running economy and may have potential to explain a
considerable portion of the interindividual differences in economy.
Taken together, the findings from these studies suggest that neuromuscular
efficiency may play an important role in determining running economy, especially in
athletes with similar physiological attributes. Specifically, the timing and amplitude of
muscle activity has been shown to have the most consistent association with running
economy. Greater muscle activity prior to and in the initial phase of ground contact
may enhance running economy by increasing leg stiffness and maximizing exploitation
of stored elastic energy.
2.7 Conclusions and Future Directions
It is clear that running economy is a complex, multifactorial concept that
represents the sum of metabolic, cardiorespiratory, biomechanical and neuromuscular
efficiency during running. Therefore, the measure of running economy may inherently
flawed as it may or may not be based on oxygen consumption alone. While running
economy has traditionally been measured in the laboratory, recent technological
advances allow the possibility to obtain measurements during over-ground running
using portable oxygen analyzers. Well-controlled reliability studies indicate the test-
retest reliability of running economy is fairly stable suggesting researchers can be
relatively confident in their measurements. A number of factors appear to effect
running economy. However it seems likely that the running economy exhibited by a
particular athlete reflects the integrated composite of a variety of metabolic,
cardiorespiratory, biomechanical and neuromuscular characteristics that are unique to
the individual. Of these factors, it seems that a few are subject to alteration or
improvement through training or other interventions (Part II).
57
CHAPTER 3: STRATEGIES TO IMPROVE RUNNING ECONOMY
3.1 Abstract
Running economy represents a complex interplay of physiological and
biomechanical factors (refer to Part I) that is represented by the energy demand for a
given velocity of submaximal running and expressed as the submaximal VO2 at a given
running velocity. This review considered a wide range of acute and chronic
interventions that have been investigated with respect to improving economy by
augmenting one or more components of the metabolic, cardiorespiratory,
biomechanical or neuromuscular systems. Improvements in running economy have
traditionally been achieved through endurance training. Endurance training in runners
leads to a wide range of physiological responses and it is very likely that running
training characteristics influence running economy. Training history and training
volume have been suggested to be important factors in improving running economy,
while uphill and level-ground high-intensity interval training represent frequently
prescribed forms of training that may elicit further enhancements in economy. More
recently, research has demonstrated short-term resistance and plyometric training has
resulted in enhanced running economy. This improvement in running economy has
been hypothesized to be a result of enhanced neuromuscular characteristics. Altitude
acclimatization results in both central and peripheral adaptations that improve oxygen
delivery and utilization, mechanisms that potentially could improve running economy.
Other strategies, such as stretching should not be discounted as a training modality in
order to prevent injuries, however, it appears that there is an optimal degree of
flexibility and stiffness required to maximize running economy. Several nutritional
interventions have also received attention for their effects on reducing oxygen demand
during exercise, most notably dietary nitrates and caffeine. It is clear that a range of
training and passive interventions may improve running economy and researchers
should concentrate their investigative efforts on more fully understanding the types and
mechanisms which affect running economy and the practicality and extent to which
running economy can be improved outside the laboratory.
58
3.2 Introduction to Strategies to Improve Running Economy
The goal in competitive distance running is to run a given distance in the least
time, or at least faster than the next best competitor. A number of physiological
attributes contribute to successful distance running performance, including (i) both a
high cardiac output and a high rate of oxygen delivery to working muscles, which leads
to a large capacity for aerobic adenosine triphosphate (ATP) regeneration [(i.e. high
maximal oxygen uptake VO2max)] (Foster & Lucia, 2007; Pollock, 1977); (ii) the ability
to sustain a high percentage of VO2max for long periods of time (i.e. fractional
utilization of VO2max, relative intensity) (Costill et al., 1973); and (iii) the ability to move
efficiently (running economy) (Bailey & Pate, 1991; Daniels, 1974a, 1985). Maximal
aerobic capacity and fractional utilization of VO2max have been widely studied as
determinants of running performance, however, running economy has been relatively
ignored until the past decade or so despite being aware of its importance since at least
the 1970’s (Foster & Lucia, 2007).
Trained runners have superior running economy to lesser-trained or untrained
runners (Bransford & Howley, 1977; Daniels, Oldridge, et al., 1978; Dolgener, 1982),
indicating positive adaptations occur in response to habitual training (Beneke & Hutler,
2005). While a given athlete may be genetically predisposed to having ‘good’ running
economy (see Part I), various strategies can potentially further improve an individual’s
running economy through augmenting metabolic, cardiorespiratory, biomechanical
and/or neuromuscular responses and adaptations. Given running economy has been
identified as a critical factor contributing to distance running performance (Conley &
Krahenbuhl, 1980; Conley et al., 1984; Costill, 1967; Costill et al., 1973; Daniels,
1974a; Daniels & Daniels, 1992; di Prampero et al., 1993; Jones, 2006; Pollock, 1977)
effective legal and practical strategies to improve running economy are sought after by
coaches, athletes and sports scientists. To date, a wide range of acute and chronic
interventions have been investigated with respect to improving economy including
various forms of resistance training (Guglielmo et al., 2009; Johnston et al., 1997;
Paavolainen, Hakkinen, et al., 1999; Saunders et al., 2006; Sedano et al., 2013; Spurrs
et al., 2003; Storen et al., 2008; Taipale et al., 2009; Taipale, Mikkola, Salo, et al.,
2013; Turner et al., 2003), high-intensity interval training (Billat et al., 1999; Denadai et
al., 2006; Enoksen, Shalfawi, & Tonnessen, 2011; Franch et al., 1998; Sjodin et al.,
1982), altitude exposure (Burtscher, Gatterer, Faulhaber, Gerstgrasser, & Schenk,
2010; Katayama, Matsuo, Ishida, Mori, & Miyamura, 2003; Katayama et al., 2004;
Levine & Stray-Gundersen, 1997; Neya, Enoki, Kumai, Sugoh, & Kawahara, 2007;
Saunders, Telford, et al., 2004; Saunders, Telford, Pyne, Hahn, & Gore, 2009; Schmitt
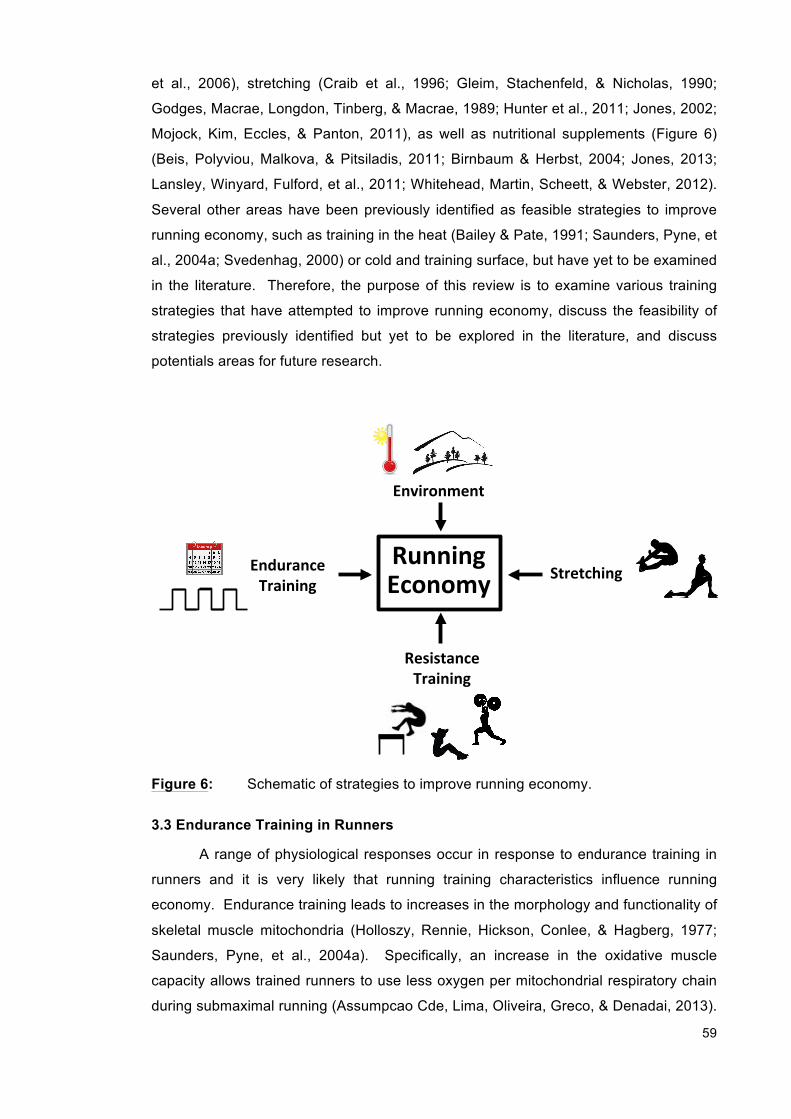
59
et al., 2006), stretching (Craib et al., 1996; Gleim, Stachenfeld, & Nicholas, 1990;
Godges, Macrae, Longdon, Tinberg, & Macrae, 1989; Hunter et al., 2011; Jones, 2002;
Mojock, Kim, Eccles, & Panton, 2011), as well as nutritional supplements (Figure 6)
(Beis, Polyviou, Malkova, & Pitsiladis, 2011; Birnbaum & Herbst, 2004; Jones, 2013;
Lansley, Winyard, Fulford, et al., 2011; Whitehead, Martin, Scheett, & Webster, 2012).
Several other areas have been previously identified as feasible strategies to improve
running economy, such as training in the heat (Bailey & Pate, 1991; Saunders, Pyne, et
al., 2004a; Svedenhag, 2000) or cold and training surface, but have yet to be examined
in the literature. Therefore, the purpose of this review is to examine various training
strategies that have attempted to improve running economy, discuss the feasibility of
strategies previously identified but yet to be explored in the literature, and discuss
potentials areas for future research.
Figure 6: Schematic of strategies to improve running economy.
3.3 Endurance Training in Runners
A range of physiological responses occur in response to endurance training in
runners and it is very likely that running training characteristics influence running
economy. Endurance training leads to increases in the morphology and functionality of
skeletal muscle mitochondria (Holloszy, Rennie, Hickson, Conlee, & Hagberg, 1977;
Saunders, Pyne, et al., 2004a). Specifically, an increase in the oxidative muscle
capacity allows trained runners to use less oxygen per mitochondrial respiratory chain
during submaximal running (Assumpcao Cde, Lima, Oliveira, Greco, & Denadai, 2013).
Running&&Economy&
Environment&
Endurance&Training&
Resistance&Training&
Stretching&
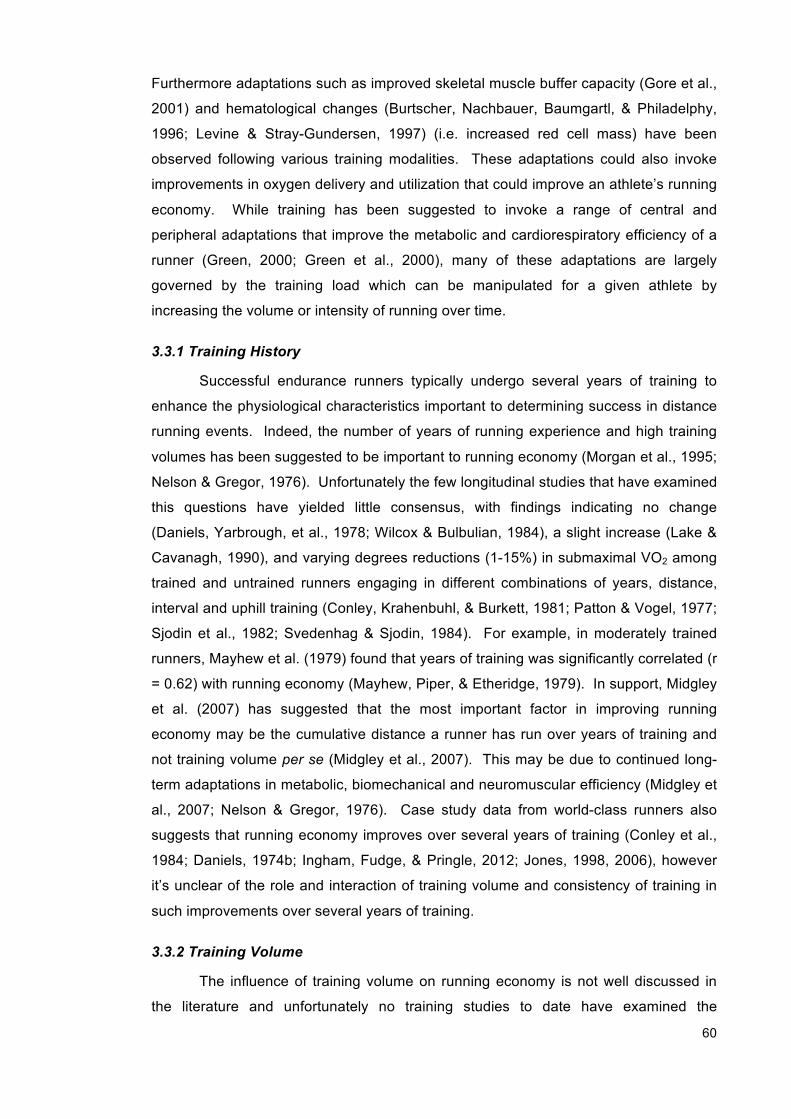
60
Furthermore adaptations such as improved skeletal muscle buffer capacity (Gore et al.,
2001) and hematological changes (Burtscher, Nachbauer, Baumgartl, & Philadelphy,
1996; Levine & Stray-Gundersen, 1997) (i.e. increased red cell mass) have been
observed following various training modalities. These adaptations could also invoke
improvements in oxygen delivery and utilization that could improve an athlete’s running
economy. While training has been suggested to invoke a range of central and
peripheral adaptations that improve the metabolic and cardiorespiratory efficiency of a
runner (Green, 2000; Green et al., 2000), many of these adaptations are largely
governed by the training load which can be manipulated for a given athlete by
increasing the volume or intensity of running over time.
3.3.1 Training History
Successful endurance runners typically undergo several years of training to
enhance the physiological characteristics important to determining success in distance
running events. Indeed, the number of years of running experience and high training
volumes has been suggested to be important to running economy (Morgan et al., 1995;
Nelson & Gregor, 1976). Unfortunately the few longitudinal studies that have examined
this questions have yielded little consensus, with findings indicating no change
(Daniels, Yarbrough, et al., 1978; Wilcox & Bulbulian, 1984), a slight increase (Lake &
Cavanagh, 1990), and varying degrees reductions (1-15%) in submaximal VO2 among
trained and untrained runners engaging in different combinations of years, distance,
interval and uphill training (Conley, Krahenbuhl, & Burkett, 1981; Patton & Vogel, 1977;
Sjodin et al., 1982; Svedenhag & Sjodin, 1984). For example, in moderately trained
runners, Mayhew et al. (1979) found that years of training was significantly correlated (r
= 0.62) with running economy (Mayhew, Piper, & Etheridge, 1979). In support, Midgley
et al. (2007) has suggested that the most important factor in improving running
economy may be the cumulative distance a runner has run over years of training and
not training volume per se (Midgley et al., 2007). This may be due to continued long-
term adaptations in metabolic, biomechanical and neuromuscular efficiency (Midgley et
al., 2007; Nelson & Gregor, 1976). Case study data from world-class runners also
suggests that running economy improves over several years of training (Conley et al.,
1984; Daniels, 1974b; Ingham, Fudge, & Pringle, 2012; Jones, 1998, 2006), however
it’s unclear of the role and interaction of training volume and consistency of training in
such improvements over several years of training.
3.3.2 Training Volume
The influence of training volume on running economy is not well discussed in
the literature and unfortunately no training studies to date have examined the

61
implications of increased training volume while controlling for potential confounding
variables like training intensity. This makes it difficult to ascertain the effects of
manipulating training volume (Midgley et al., 2007). However, in a cross-sectional
investigation, Pate et al. (1992) reported that training volume was not associated with
better running economy (Pate et al., 1992). Nevertheless, the importance of training
volume should not be downplayed, as high-volume training is important to inducing
adaptations important to distance running success (Laursen, 2010). Clearly, there is a
need for longitudinal examinations of the relationship between running economy and
training history, including how subtle changes in volume, intensity, cumulative volume
before conclusions about the cumulative effects of training volume can be made.
3.3.3 High-Intensity Interval Training (HIIT)
Studies that have incorporated flat overground high-intensity interval training
(HIIT) into the training programs of distance runners have reported equivocal results in
relation to improving running economy (Table 3). Jones and Carter (2000) suggested
that runners are typically most economical at the running velocities at which they
habitually train (Jones & Carter, 2000), however, no training study to date has
investigated the specificity of training velocity on running economy. High-intensity
interval training at 93–120% velocity at VO2max (vVO2max) (Barnes, Hopkins, et al.,
2013b; Billat et al., 1999; Franch et al., 1998; Laffite et al., 2003; Sjodin et al., 1982;
Slawinski et al., 2001) and continuous running at velocity at the onset of blood lactate
accumulation (vOBLA) (Barnes, Hopkins, et al., 2013b; Billat et al., 1999; Denadai et
al., 2006; Sjodin et al., 1982) have both been shown to improve running economy by
~1-7% (Table 3). Other studies using similar training intensities have reported no
significant improvement (Barnes, Hopkins, et al., 2013b; Franch et al., 1998; Smith,
McNaughton, & Marshall, 1999; Yoshida et al., 1990). Morgan et al. (1989) suggested
that the type of run training exerts a negligible effect on improving running economy,
based on the observation that several studies reported no differences in changes in
running economy despite the runners engaging in different interval training programs
(Morgan, Martin, et al., 1989).
Whereas VO2max has been shown to increase significantly during the transition
between the off-season and pre-competitive period, during which training intensity is
increased (Brisswalter & Legros, 1994b; Conley et al., 1984; Svedenhag & Sjodin,
1985; Wilcox & Bulbulian, 1984), the same studies reported either a significant
improvement (Conley et al., 1984; Svedenhag & Sjodin, 1985) or no change
(Brisswalter & Legros, 1994b; Wilcox & Bulbulian, 1984) in running economy. Franch
et al. (1998) compared interval training at 94%, 106% and 132% vVO2max and found
62
that running economy significantly improved in the 94% and 106% groups, but not in
the group that trained at 132% vVO2max (Franch et al., 1998). This suggests that very
high-intensity running is not effective in improving running economy, possibly due to a
loss of running form at very high running velocities, or an inability to complete a
sufficient training volume to elicit a training effect (Midgley et al., 2007).
Biomechanical changes could improve exercise efficiency following HIIT.
However, Lake and Cavanagh (1996) investigated the effects of six weeks of high-
intensity interval training on various biomechanical variables in a group of moderately
trained runners and found no relationship between changes in performance, VO2max,
running economy and biomechanical variables (Lake & Cavanagh, 1996). The authors
concluded that improvements in performance following HIIT were more likely to be
caused by physiological rather than biomechanical factors.
Table 3: Comparison of effects on running economy and performance following
adaptation to various high intensity interval-training (HIIT) interventions.
Results (%)
Study (year) Subjects Volume
Frequency and duration Control
Running economy
Performance (distance)
Interval training Sjodin et al. (1982) (Sjodin et al., 1982)
8 highly trained male runners
20 min at vOBLA (vOBLA = 85% vVO2max)
1 d/wk for 14 wk
No control ! 2.8
n/a
Yoshida et al. (1990) (Yoshida et al., 1990)
6 recreation female runners
20 min at vOBLA (vOBLA = 91% vVO2max)
6 d/wk for 8 wk
Endurance training
! 2.8
n/a
Franch et al. (1998) (Franch et al., 1998)
12 recreational male runners
Continuous at 94% vVO2max
3 d/wk for 6 wk
No control ! 3.1
! 94 (time to exhaustion at 87% VO2max)
Franch et al. (1998) (Franch et al., 1998)
12 recreational male runners
4-6× 4min at 106% vVO2max
3 d/wk for 6 wk
No control ! 3.0
! 67 (time to exhaustion at 87% VO2max)
Franch et al. (1998) (Franch et al., 1998)
12 recreational male runners
30-40× 15 s at 132% vVO2max
3 d/wk for 6 wk
No control ! 0.9
! 65 (time to exhaustion at 87% VO2max)
Billat et al. (1999) (Billat et al., 1999)
8 highly trained male runners
4 wk: 5× 3 min at 100% vVO2max; 2× 20 min vOBLA (vOBLA = 85% vVO2max) 4 wk: 3× (5× 3 min at 100% vVO2max); 2× 20 min vOBLA (vOBLA = 85% vVO2max)
2 d/wk for 4 wk + 4 d/wk for 4 wk
No control ! 6.1 ! 7.7
" (time to exhaustion at MAS)
Slawinski et al. (2001) (Slawinski et al., 2001)
6 moderately trained runners
2× vΔ50 intervals); 3× continuous at 60-70% vVO2max (vΔ50 = 93% vVO2max)
2 d/wk for 8 wk
No control ! 3.6 ! 17.3 (time to exhaustion at 17 km.h-1)
Laffite et al. 7 moderately 2× vΔ50 intervals 2 d/wk for 8 No control ! 5.4 n/a
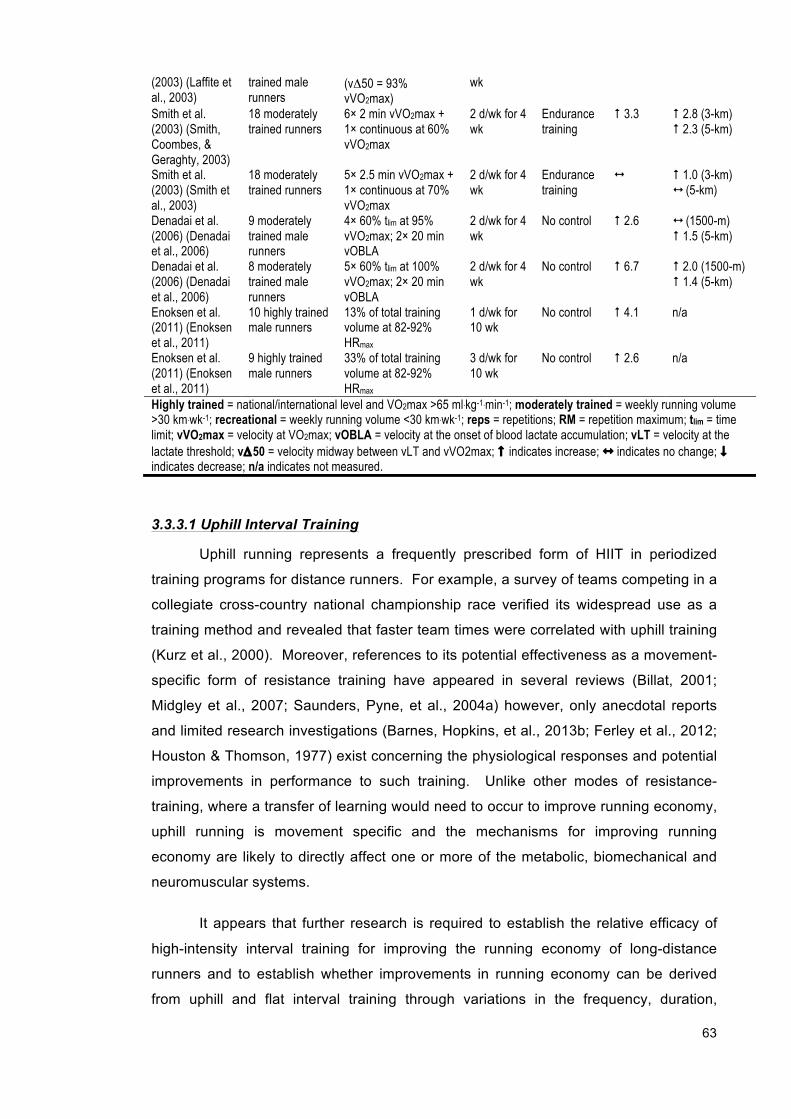
63
(2003) (Laffite et al., 2003)
trained male runners
(vΔ50 = 93% vVO2max)
wk
Smith et al. (2003) (Smith, Coombes, & Geraghty, 2003)
18 moderately trained runners
6× 2 min vVO2max + 1× continuous at 60% vVO2max
2 d/wk for 4 wk
Endurance training
! 3.3 ! 2.8 (3-km) ! 2.3 (5-km)
Smith et al. (2003) (Smith et al., 2003)
18 moderately trained runners
5× 2.5 min vVO2max + 1× continuous at 70% vVO2max
2 d/wk for 4 wk
Endurance training
" ! 1.0 (3-km) " (5-km)
Denadai et al. (2006) (Denadai et al., 2006)
9 moderately trained male runners
4× 60% tlim at 95% vVO2max; 2× 20 min vOBLA
2 d/wk for 4 wk
No control ! 2.6 " (1500-m) ! 1.5 (5-km)
Denadai et al. (2006) (Denadai et al., 2006)
8 moderately trained male runners
5× 60% tlim at 100% vVO2max; 2× 20 min vOBLA
2 d/wk for 4 wk
No control ! 6.7 ! 2.0 (1500-m) ! 1.4 (5-km)
Enoksen et al. (2011) (Enoksen et al., 2011)
10 highly trained male runners
13% of total training volume at 82-92% HRmax
1 d/wk for 10 wk
No control ! 4.1 n/a
Enoksen et al. (2011) (Enoksen et al., 2011)
9 highly trained male runners
33% of total training volume at 82-92% HRmax
3 d/wk for 10 wk
No control ! 2.6 n/a
Highly trained = national/international level and VO2max >65 ml.kg-1.min-1; moderately trained = weekly running volume >30 km.wk-1; recreational = weekly running volume <30 km.wk-1; reps = repetitions; RM = repetition maximum; tlim = time limit; vVO2max = velocity at VO2max; vOBLA = velocity at the onset of blood lactate accumulation; vLT = velocity at the lactate threshold; vΔ50 = velocity midway between vLT and vVO2max; ! indicates increase; " indicates no change; # indicates decrease; n/a indicates not measured.
3.3.3.1 Uphill Interval Training
Uphill running represents a frequently prescribed form of HIIT in periodized
training programs for distance runners. For example, a survey of teams competing in a
collegiate cross-country national championship race verified its widespread use as a
training method and revealed that faster team times were correlated with uphill training
(Kurz et al., 2000). Moreover, references to its potential effectiveness as a movement-
specific form of resistance training have appeared in several reviews (Billat, 2001;
Midgley et al., 2007; Saunders, Pyne, et al., 2004a) however, only anecdotal reports
and limited research investigations (Barnes, Hopkins, et al., 2013b; Ferley et al., 2012;
Houston & Thomson, 1977) exist concerning the physiological responses and potential
improvements in performance to such training. Unlike other modes of resistance-
training, where a transfer of learning would need to occur to improve running economy,
uphill running is movement specific and the mechanisms for improving running
economy are likely to directly affect one or more of the metabolic, biomechanical and
neuromuscular systems.
It appears that further research is required to establish the relative efficacy of
high-intensity interval training for improving the running economy of long-distance
runners and to establish whether improvements in running economy can be derived
from uphill and flat interval training through variations in the frequency, duration,
64
volume and periodization of training.
3.3.3.2 Training Surface
Running on grass, sand and other surfaces of varying compliance have been
used by coaches and athletes as a supplemental training stimulus to HIIT on track or
concrete surfaces for many years (McMahon & Greene, 1978, 1979; Pinnington &
Dawson, 2001a). However despite the potential training benefits, no training studies
have investigated the use of various surfaces such as sand running as a means to
enhance running economy. Previous studies (Lejeune, Willems, & Heglund, 1998;
Pinnington & Dawson, 2001a, 2001b; Zamparo, Perini, Orizio, Sacher, & Ferretti, 1992)
have quantified the energy demand of running on sand to be 1.2-1.6 times the firm
surface values at comparable running speeds. Pinnington and Dawson (2001) found
that recreational runners running at 8 km.hr-1 on grass recorded a relative VO2 of 32.2
ml.kg-1.min-1 or approximately 56% of VO2max compared to 47.0 ml.kg-1.min-1 or
approximately 82% of VO2max while running on soft, dry, beach sand at the same
speed (Pinnington & Dawson, 2001a). Similarly, elite surf ironmen, who regularly train
and perform in sand recorded VO2 of 32.5 ml.kg-1.min-1 (50.6% of VO2max) on grass
compared to 43.3 ml.kg-1.min-1 (82% of VO2max) on sand at 8 km.hr-1 (Pinnington &
Dawson, 2001b). Lejeune et al. (1998) attributed the increased energy demand of
running on sand to a decrease in muscle-tendon efficiency (Lejeune et al., 1998), while
Zamparo et al. (1992) credited the increased energy demand to a reduced recovery of
potential and kinetic energy at each stride (approximately 45% to be compared to
approximately 65% on a firm surface) and to a reduced recovery of elastic energy
(Zamparo et al., 1992). In support, Impellizzeri et al. (2008) found that 4 weeks of
plyometric training on sand improved both jumping and sprinting ability and induced
less muscle soreness compared to on grass (Impellizzeri et al., 2008). Several other
studies (Binnie, Dawson, Pinnington, Landers, & Peeling, 2013a, 2013b; Binnie,
Peeling, Pinnington, Landers, & Dawson, 2013; Yigit & Tuncel, 1998) have
demonstrated that acute and chronic training programs on sand result in a greater
physiological responses than training on harder surfaces (e.g. grass, concrete)
however, no direct measurements of running economy were made.
Taken together, despite the absence of data on the training effects of running
surface on running economy, the available evidence suggests running in sand does
elicit a greater metabolic response than running on hard surfaces perhaps due to a
decrease in muscle tendon elasticity and stiffness and an impairment in SSC efficiency.
It appears that training in sand may induce different neuromuscular and biomechanical
adaptations as well (Pinnington, Lloyd, Besier, & Dawson, 2005), however the
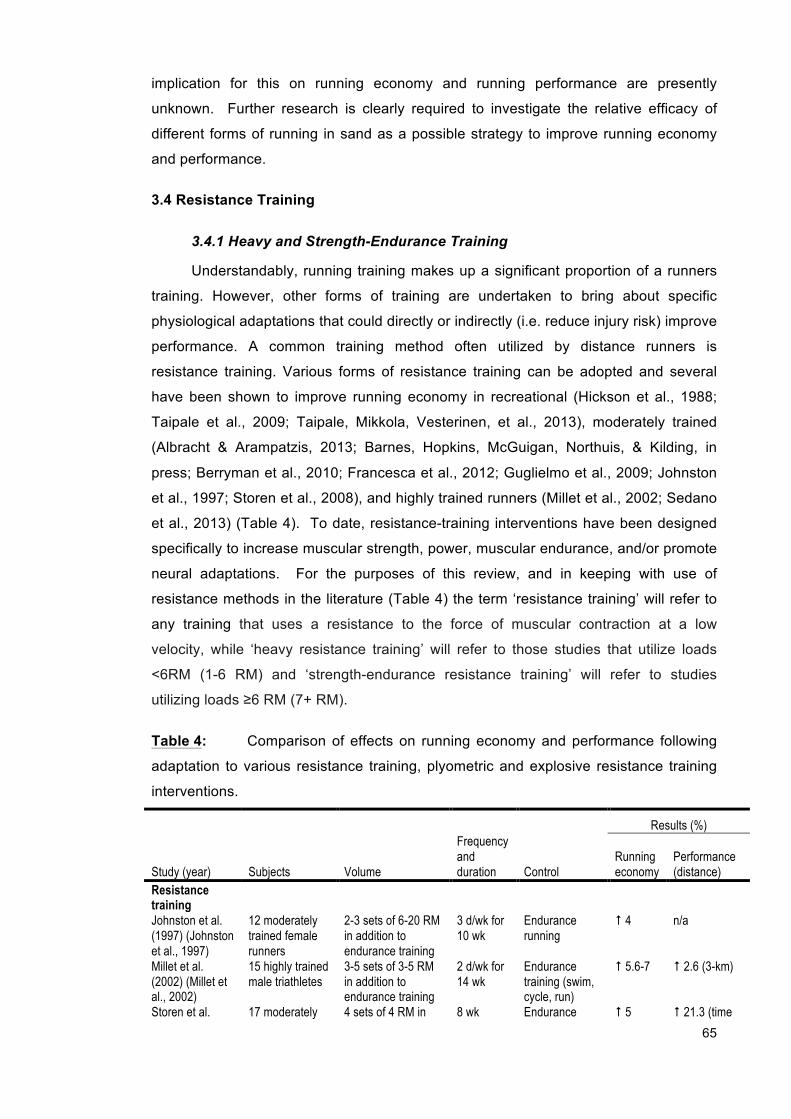
65
implication for this on running economy and running performance are presently
unknown. Further research is clearly required to investigate the relative efficacy of
different forms of running in sand as a possible strategy to improve running economy
and performance.
3.4 Resistance Training
3.4.1 Heavy and Strength-Endurance Training
Understandably, running training makes up a significant proportion of a runners
training. However, other forms of training are undertaken to bring about specific
physiological adaptations that could directly or indirectly (i.e. reduce injury risk) improve
performance. A common training method often utilized by distance runners is
resistance training. Various forms of resistance training can be adopted and several
have been shown to improve running economy in recreational (Hickson et al., 1988;
Taipale et al., 2009; Taipale, Mikkola, Vesterinen, et al., 2013), moderately trained
(Albracht & Arampatzis, 2013; Barnes, Hopkins, McGuigan, Northuis, & Kilding, in
press; Berryman et al., 2010; Francesca et al., 2012; Guglielmo et al., 2009; Johnston
et al., 1997; Storen et al., 2008), and highly trained runners (Millet et al., 2002; Sedano
et al., 2013) (Table 4). To date, resistance-training interventions have been designed
specifically to increase muscular strength, power, muscular endurance, and/or promote
neural adaptations. For the purposes of this review, and in keeping with use of
resistance methods in the literature (Table 4) the term ‘resistance training’ will refer to
any training that uses a resistance to the force of muscular contraction at a low
velocity, while ‘heavy resistance training’ will refer to those studies that utilize loads
<6RM (1-6 RM) and ‘strength-endurance resistance training’ will refer to studies
utilizing loads ≥6 RM (7+ RM).
Table 4: Comparison of effects on running economy and performance following
adaptation to various resistance training, plyometric and explosive resistance training
interventions.
Results (%)
Study (year) Subjects Volume
Frequency and duration Control
Running economy
Performance (distance)
Resistance training
Johnston et al. (1997) (Johnston et al., 1997)
12 moderately trained female runners
2-3 sets of 6-20 RM in addition to endurance training
3 d/wk for 10 wk
Endurance running
! 4 n/a
Millet et al. (2002) (Millet et al., 2002)
15 highly trained male triathletes
3-5 sets of 3-5 RM in addition to endurance training
2 d/wk for 14 wk
Endurance training (swim, cycle, run)
! 5.6-7 ! 2.6 (3-km)
Storen et al. 17 moderately 4 sets of 4 RM in 8 wk Endurance ! 5 ! 21.3 (time
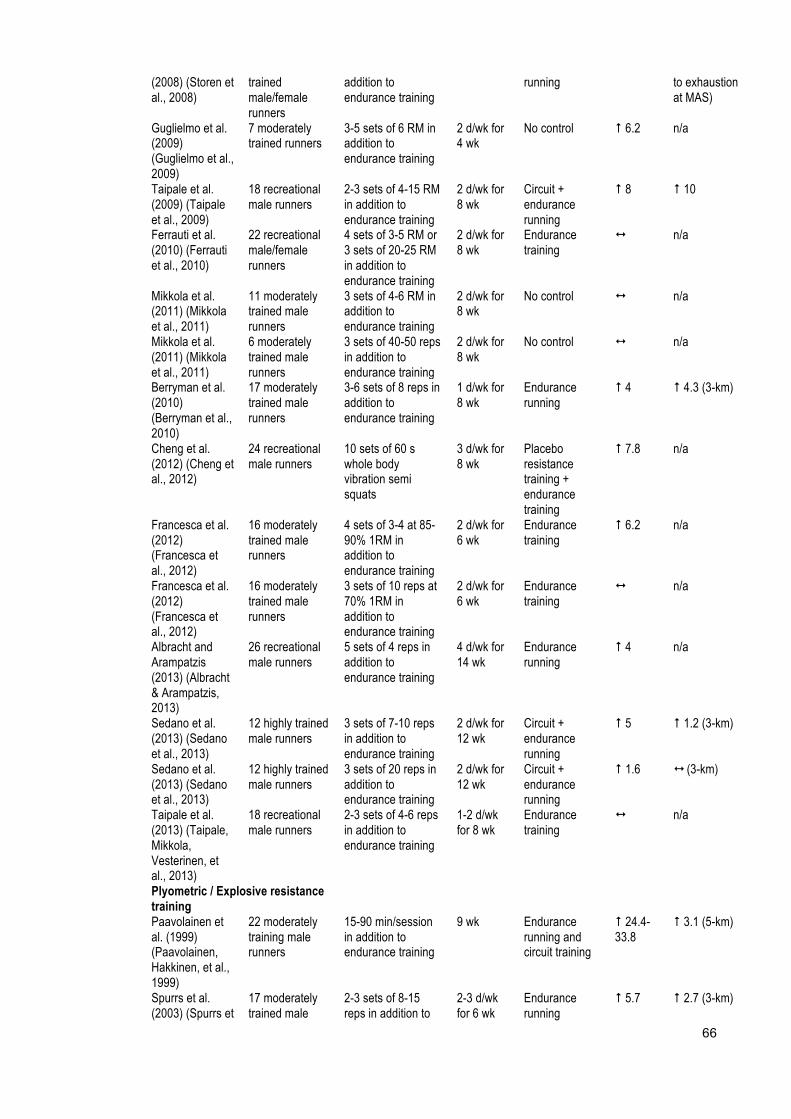
66
(2008) (Storen et al., 2008)
trained male/female runners
addition to endurance training
running to exhaustion at MAS)
Guglielmo et al. (2009) (Guglielmo et al., 2009)
7 moderately trained runners
3-5 sets of 6 RM in addition to endurance training
2 d/wk for 4 wk
No control ! 6.2 n/a
Taipale et al. (2009) (Taipale et al., 2009)
18 recreational male runners
2-3 sets of 4-15 RM in addition to endurance training
2 d/wk for 8 wk
Circuit + endurance running
! 8 ! 10
Ferrauti et al. (2010) (Ferrauti et al., 2010)
22 recreational male/female runners
4 sets of 3-5 RM or 3 sets of 20-25 RM in addition to endurance training
2 d/wk for 8 wk
Endurance training
" n/a
Mikkola et al. (2011) (Mikkola et al., 2011)
11 moderately trained male runners
3 sets of 4-6 RM in addition to endurance training
2 d/wk for 8 wk
No control " n/a
Mikkola et al. (2011) (Mikkola et al., 2011)
6 moderately trained male runners
3 sets of 40-50 reps in addition to endurance training
2 d/wk for 8 wk
No control " n/a
Berryman et al. (2010) (Berryman et al., 2010)
17 moderately trained male runners
3-6 sets of 8 reps in addition to endurance training
1 d/wk for 8 wk
Endurance running
! 4 ! 4.3 (3-km)
Cheng et al. (2012) (Cheng et al., 2012)
24 recreational male runners
10 sets of 60 s whole body vibration semi squats
3 d/wk for 8 wk
Placebo resistance training + endurance training
! 7.8 n/a
Francesca et al. (2012) (Francesca et al., 2012)
16 moderately trained male runners
4 sets of 3-4 at 85-90% 1RM in addition to endurance training
2 d/wk for 6 wk
Endurance training
! 6.2 n/a
Francesca et al. (2012) (Francesca et al., 2012)
16 moderately trained male runners
3 sets of 10 reps at 70% 1RM in addition to endurance training
2 d/wk for 6 wk
Endurance training
" n/a
Albracht and Arampatzis (2013) (Albracht & Arampatzis, 2013)
26 recreational male runners
5 sets of 4 reps in addition to endurance training
4 d/wk for 14 wk
Endurance running
! 4 n/a
Sedano et al. (2013) (Sedano et al., 2013)
12 highly trained male runners
3 sets of 7-10 reps in addition to endurance training
2 d/wk for 12 wk
Circuit + endurance running
! 5 ! 1.2 (3-km)
Sedano et al. (2013) (Sedano et al., 2013)
12 highly trained male runners
3 sets of 20 reps in addition to endurance training
2 d/wk for 12 wk
Circuit + endurance running
! 1.6 " (3-km)
Taipale et al. (2013) (Taipale, Mikkola, Vesterinen, et al., 2013)
18 recreational male runners
2-3 sets of 4-6 reps in addition to endurance training
1-2 d/wk for 8 wk
Endurance training
" n/a
Plyometric / Explosive resistance training
Paavolainen et al. (1999) (Paavolainen, Hakkinen, et al., 1999)
22 moderately training male runners
15-90 min/session in addition to endurance training
9 wk Endurance running and circuit training
! 24.4-33.8
! 3.1 (5-km)
Spurrs et al. (2003) (Spurrs et
17 moderately trained male
2-3 sets of 8-15 reps in addition to
2-3 d/wk for 6 wk
Endurance running
! 5.7 ! 2.7 (3-km)
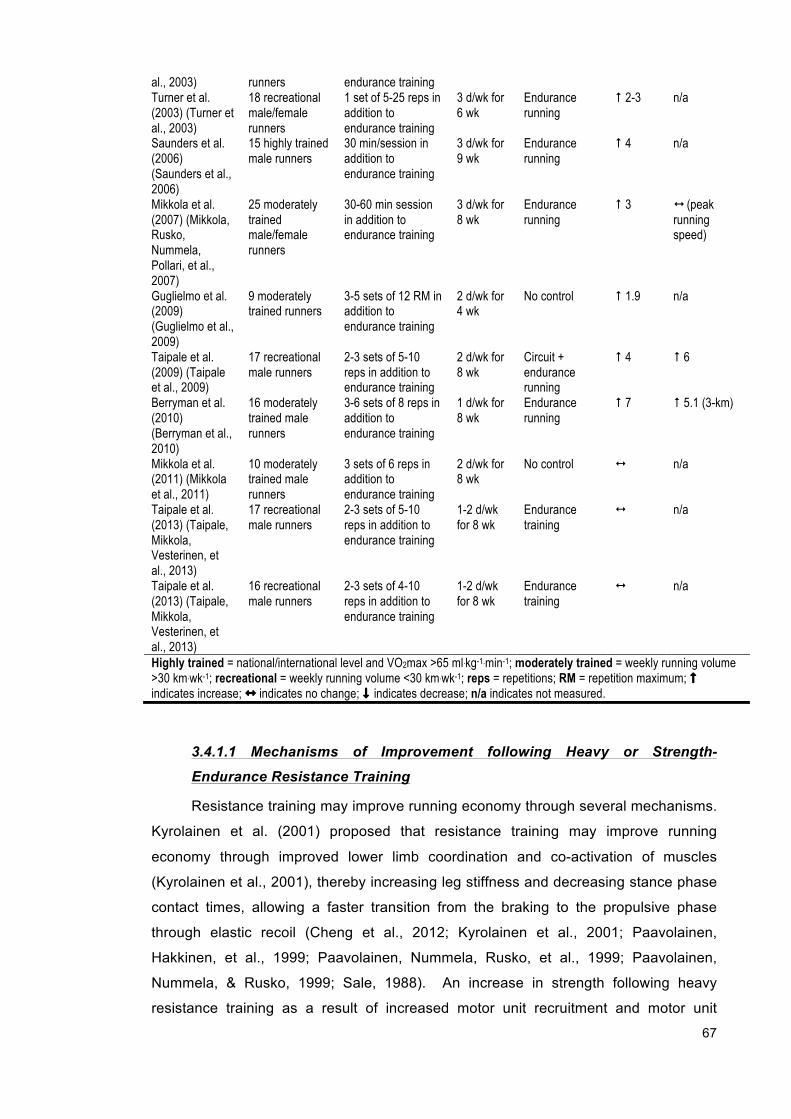
67
al., 2003) runners endurance training Turner et al. (2003) (Turner et al., 2003)
18 recreational male/female runners
1 set of 5-25 reps in addition to endurance training
3 d/wk for 6 wk
Endurance running
! 2-3 n/a
Saunders et al. (2006) (Saunders et al., 2006)
15 highly trained male runners
30 min/session in addition to endurance training
3 d/wk for 9 wk
Endurance running
! 4 n/a
Mikkola et al. (2007) (Mikkola, Rusko, Nummela, Pollari, et al., 2007)
25 moderately trained male/female runners
30-60 min session in addition to endurance training
3 d/wk for 8 wk
Endurance running
! 3 " (peak running speed)
Guglielmo et al. (2009) (Guglielmo et al., 2009)
9 moderately trained runners
3-5 sets of 12 RM in addition to endurance training
2 d/wk for 4 wk
No control ! 1.9 n/a
Taipale et al. (2009) (Taipale et al., 2009)
17 recreational male runners
2-3 sets of 5-10 reps in addition to endurance training
2 d/wk for 8 wk
Circuit + endurance running
! 4 ! 6
Berryman et al. (2010) (Berryman et al., 2010)
16 moderately trained male runners
3-6 sets of 8 reps in addition to endurance training
1 d/wk for 8 wk
Endurance running
! 7 ! 5.1 (3-km)
Mikkola et al. (2011) (Mikkola et al., 2011)
10 moderately trained male runners
3 sets of 6 reps in addition to endurance training
2 d/wk for 8 wk
No control " n/a
Taipale et al. (2013) (Taipale, Mikkola, Vesterinen, et al., 2013)
17 recreational male runners
2-3 sets of 5-10 reps in addition to endurance training
1-2 d/wk for 8 wk
Endurance training
" n/a
Taipale et al. (2013) (Taipale, Mikkola, Vesterinen, et al., 2013)
16 recreational male runners
2-3 sets of 4-10 reps in addition to endurance training
1-2 d/wk for 8 wk
Endurance training
" n/a
Highly trained = national/international level and VO2max >65 ml.kg-1.min-1; moderately trained = weekly running volume >30 km.wk-1; recreational = weekly running volume <30 km.wk-1; reps = repetitions; RM = repetition maximum; ! indicates increase; " indicates no change; # indicates decrease; n/a indicates not measured.
3.4.1.1 Mechanisms of Improvement following Heavy or Strength-
Endurance Resistance Training
Resistance training may improve running economy through several mechanisms.
Kyrolainen et al. (2001) proposed that resistance training may improve running
economy through improved lower limb coordination and co-activation of muscles
(Kyrolainen et al., 2001), thereby increasing leg stiffness and decreasing stance phase
contact times, allowing a faster transition from the braking to the propulsive phase
through elastic recoil (Cheng et al., 2012; Kyrolainen et al., 2001; Paavolainen,
Hakkinen, et al., 1999; Paavolainen, Nummela, Rusko, et al., 1999; Paavolainen,
Nummela, & Rusko, 1999; Sale, 1988). An increase in strength following heavy
resistance training as a result of increased motor unit recruitment and motor unit
68
synchronization may improve mechanical efficiency and motor recruitment patterns
(Kraemer et al., 1996; Sale, 1988). Greater muscular strength following heavy or
strength-endurance resistance training has previously been shown to have a fatigue
resistant effect, resulting in a smaller increase in running economy during sustained
endurance exercise (Hayes, French, & Thomas, 2011). Storen et al. (2008) suggested
that the main training response to 8 weeks of heavy resistance training in 17 male and
female distance runners was a change in muscle recruitment patterns, yet no direct
measurement of muscle recruitment (i.e. EMG) was provided to support this notion
(Storen et al., 2008). The authors did report a 33% increase in strength in addition to
a 5% improvement in running economy (Storen et al., 2008). Several other studies
(Guglielmo et al., 2009; Millet et al., 2002; Storen et al., 2008; Taipale et al., 2009)
have reported concomitant improvements in running economy and maximal strength
following heavy resistance training, indicating positive neuromuscular adaptations
occurred.
Other studies (Berryman et al., 2010; Cheng et al., 2012; Francesca et al., 2012;
Mikkola et al., 2011; Sedano et al., 2013) however, demonstrate convincing evidence
that the combination of strength-endurance resistance training and endurance training
improves running performance and enhances running economy in moderate or highly
trained runners (Table 4). Heavy resistance training may primarily cause hypertrophy
of type IIA and IIB (fast twitch) fibers, but also type I (slow twitch) fibers (Staron et al.,
1994; Staron et al., 1991), resulting in less motor unit activation to produce a given
force (Moritani & deVries, 1979). Unfortunately, increases in body mass are an
undesirable side effect to increases in muscle strength from resistance training that
could be counter-productive to distance running performance. However, increased
muscular strength might primarily come from neural adaptations without observable
muscle hypertrophy (Hakkinen, 1994) since most studies reported little or no changes
in body mass, fat free mass, percent body fat or girth measurements following heavy
resistance training. Sale (1998) states that heavy resistance training induces changes
in the nervous system which allow an athlete to increase the activation of the working
muscles, thus producing a greater net force with each stride (Sale, 1988). It is well
documented that initial performance gains following heavy resistance training are a
result of neuromuscular adaptations rather than within muscle adaptations (e.g.
hypertrophy) (Kraemer et al., 1996; Sale, 1988). Regardless of whether strength gains
occur at the muscular level, neural level, or both, if a more efficient recruitment pattern
is induced, decreases in oxygen consumption at a given speed are likely to occur
(Bransford & Howley, 1977; Patton & Vogel, 1977).
69
Improved running economy may also be due to increases in strength that causes
positive changes in mechanical aspects of running style (i.e. improved biomechanical
efficiency) (Johnston et al., 1997), thus allowing a runner to do less work at a given
running speed. A number of biomechanical variables have been identified that relate to
running economy (see Part I), thereby providing support for the hypothesis that
mechanical aspects of running style have an influence on running economy (Anderson,
1996). Another possible explanation for improved running economy following heavy
resistance training could involve muscle fiber-type conversion, though existing data in
athletes are conflicting (Coyle, Martin, Bloomfield, Lowry, & Holloszy, 1985; Staron et
al., 1994; Staron et al., 1991; Staron et al., 1990). For example, Staron et al. (1990,
1991, 1994) found a decrease in the percent of fast glycolytic type IIX fibers, with a
simultaneous increase in the percent of fast oxidative glycolytic type IIA fibers,
following a heavy-resistance low-velocity lower body resistance training program in
untrained men (Staron et al., 1994) and women (Staron et al., 1994; Staron et al.,
1991; Staron et al., 1990). Conversely, Coyle et al. (1985) reported that VO2 remained
unchanged for the same absolute submaximal intensity throughout the detraining
period, despite a large shift from type IIA to IIX fibers when studying 7 endurance-
trained subjects 12, 21, 56, and 84 days after cessation of training suggesting that
muscle fiber conversion has little or no impact on running economy (Coyle et al., 1985).
3.4.1.2 Heavy versus Strength-Endurance Resistance Training
Several studies have attempted to determine which form of concurrent
endurance and resistance training might be the most effective at improving running
performance in highly trained runners. Sedano et al. (2013) prescribed 18 well-trained
male runners with 12 weeks of either heavy resistance training or strength-endurance
resistance training in addition to their normal running training (Sedano et al., 2013).
The heavy-resistance group elicited substantially greater improvements in running
economy (5% vs 1.6%) and 3-km run performance (1.2% vs. no change) compared to
the strength-endurance resistance training group (Sedano et al., 2013). Similarly,
Berryman et al. (2010) found that 8 weeks of strength-endurance resistance training
(purely concentric semi-squats on a guided squat rack allowing only vertical
movements) improved running economy by 4% in 17 moderately trained male runners
(Berryman et al., 2010). The improvement in economy, along with a substantial
increase in peak power, resulted in a 4.3% improvement in 3-km running time, without
an increase in VO2max, with gains attributed to changes in neuromuscular
characteristics (Berryman et al., 2010). Taipale et al. (2009) also reported significant
improvements in running economy (8%) and velocity at VO2max (vVO2max) (10%)
along with improvements in neuromuscular performance (1RM maximal strength and

70
EMG vastus lateralis activity) after 8 weeks of heavy resistance training in recreation
runners (Taipale et al., 2009). However, heavy resistance training was performed in
addition to a significant increase in endurance training volume, therefore the
improvements in running economy may be related to the increased volume of training
rather than the resistance training itself since the subjects in this study were
recreational runners (Taipale et al., 2009). The only study (Johnston et al., 1997) to
examine any form of resistance training in females found that in 10 weeks of strength-
endurance resistance training combined with endurance training significantly improved
running economy (4%) without any changes in VO2max.
The available data involving athletes suggests running economy can be
improved with simultaneous resistance and endurance training, with no chronic
deleterious effect to VO2max or running performance (Saunders, Pyne, et al., 2004a).
Examination of the acute effects of resistance and endurance training sequence on
running economy show that running performance is impaired to a greater degree the
day following the resistance train then run sequence compared with the run then
resistance train sequence (Doma & Deakin, 2013). The combination of improved
biomechanical efficiency along with greater motor unit recruitment and muscle
coordination may allow for a reduction in relative workload (Hoff, Helgerud, & Wisloff,
1999). Additionally, the improved running mechanics and neuromuscular efficiency
may result in a decrease in oxygen consumption, thereby improving running economy.
Most of the studies discussed here showed improvements in running economy in 10
weeks or less, however more studies are needed to determine if improvements can be
made in shorter periods or what the time course of changes in running economy are.
Most studies demonstrating improvement in running economy following resistance
training cite enhancements in neuromuscular characteristics as the mechanism for
improvement, however most studies only make indirect measures of neuromuscular
activity. Therefore more direct measures such as EMG analysis may allow
researchers to identify if a transfer of learning from resistance training to running
performance occurs. Additionally, each of these studies employed different modes of
resistance training; therefore more research is required to determine which mode of
resistance training might be most effective at improving running economy and
performance in well-trained athletes.
3.4.2 Plyometric and Explosive Resistance Training
The concept of movement specificity suggests that the type of resistance training
used by runners should closely simulate the movement that will be performed during
training and competition (Jung, 2003). Plyometrics or explosive resistance training is a
71
specific form of strength training that aims to enhance the ability of muscles to generate
power by exaggerating the SSC, using explosive exercises such as jumping, hopping
and bounding (Turner et al., 2003).
3.4.2.1 Mechanisms of Improvement Following Plyometric or Explosive
Resistance Training
Plyometric training has the potential to increase the stiffness of the muscle-
tendon system, which allows the body to store and utilize elastic energy more
efficiently, resulting in decreased ground contact time and reduced energy expenditure
(Anderson, 1996; Cavagna et al., 1964; Cavanagh & Kram, 1985b; Hakkinen et al.,
1985; Spurrs et al., 2003). Paavolainen et al. (1999) indicated that 9 weeks of
explosive resistance training improved 5-km run performance (3.1%) and running
economy (8.1%) with no changes in VO2max in 22 moderately trained male runners
(Paavolainen, Hakkinen, et al., 1999). Furthermore, significant improvements in
velocity over a 20-m sprint (3.4%), distance jumped (4.6%), along with a concurrent
decrease in stance phase contact times were observed (Paavolainen, Hakkinen, et al.,
1999). These variables are thought to represent indirect measures of the
neuromuscular system’s ability to repeatedly produce rapid force during intense
exercise, and the capability to store and utilize elastic energy (Paavolainen, Hakkinen,
et al., 1999; Paavolainen, Nummela, Rusko, et al., 1999; Paavolainen, Nummela, &
Rusko, 1999). The authors suggested that the improved performance was a result of
enhanced neuromuscular characteristics and biomechanical efficiency that were
transferred into improved muscle power and running economy (Paavolainen, Hakkinen,
et al., 1999).
The importance of the neuromuscular characteristics in determining running
economy and thereby running performance has also been pointed out by Dalleau et al.
(Dalleau et al., 1998). They showed that the energy demand during running is
significantly related to the stiffness of the propulsive leg, which was also demonstrated
by Spurrs et al. (Spurrs et al., 2003). They showed six weeks of plyometric training
significantly improved running economy, muscle-tendon stiffness, maximal isometric
force, rate of force development, jump height, five jump distance and 3-km time trial
performance. Plyometric training consisted of two to three session per week of various
unloaded jumps, bounds, and hops. Several other studies (Table 4) have provided
support that simultaneous plyometric or explosive resistance training and endurance
training improves running economy in recreational (Taipale et al., 2009; Taipale,
Mikkola, Vesterinen, et al., 2013; Turner et al., 2003), moderately trained (Barnes,
Hopkins, et al., in press; Berryman et al., 2010; Guglielmo et al., 2009; Hamilton et al.,
72
2006; Mikkola, Rusko, Nummela, Pollari, et al., 2007; Paavolainen, Hakkinen, et al.,
1999; Spurrs et al., 2003), and highly trained runners (Saunders et al., 2006).
Saunders et al. (2006) examined the effects of 9 weeks of plyometric training on
running economy in highly trained runners using loaded and unloaded exercises three
times per week (Saunders et al., 2006). The subjects were tested for running economy
at 14, 16, and 18 km.h-1 at weeks 5 and 9, however, significant improvements were
only found at week 9 for the 18 km.h-1 test. Other studies have shown improvements in
running economy after 8 weeks of plyometric training in moderately trained runners
with no change in VO2max (Berryman et al., 2010; Mikkola, Rusko, Nummela, Pollari,
et al., 2007), with the former study showing a 7% improvement in running economy and
5.1% in 3-km run performance. Proposed explanations for the improvements include
increased lower limb stiffness and elastic energy return, enhanced muscle strength and
power or alternatively enhance running mechanics. Turner et al. (2003), however,
reported no change in four indirect measures of the ability of the muscles to store and
return elastic energy despite a 3% improvement in running economy following 6 weeks
of plyometric training in recreational runners (Turner et al., 2003) suggesting that either
more direct measures of potential mechanisms that could improve running economy
need to be made in future research or other factors have yet to be elucidated as
potential mechanisms for enhancing running economy following plyometric training.
3.4.2.2. Lessons from Cross-Country Skiers
It has also been suggested that increases in muscle force and rate of force
development, rather than increased maximal strength might be the mechanisms which
alter neuromuscular and perhaps biomechanical efficiency. This is in line with Mikkola
et al. (2007) showing significant improvements in sport-specific rapid force production
(maximal speed over 30 meters) and activation of the leg extensors following 8 weeks
of concurrent endurance and explosive movement-specific strength training in 19
moderately trained male cross-country skiers (Mikkola, Rusko, Nummela, Paavolainen,
& Hakkinen, 2007). It was also reported that the sport-specific work economy
improved by 7%, which is in line with previous studies (Hoff, Gran, & Helgerud, 2002;
Hoff et al., 1999; Osteras, Helgerud, & Hoff, 2002) that reported improvements in
economy after concurrent endurance and sport-specific resistance training that
mimicked the double poling action used in cross country skiing.
It has been proposed that more efficient motor recruitment patterns as a result of
training, whether at the neural or muscular level, may decrease the oxygen demand at
a given submaximal work rate (Johnston et al., 1997). The increased maximal force of
trained muscles might affect the recruitment of muscles so that athletes are able to use
73
relatively more type I motor units, leading to more economical endurance performance
(Hoff et al., 1999). Osteras et al. (2002) and Hoff et al. (1999) proposed that increased
rate of force development and increased peak force due to explosive resistance
training can give a longer recovery period between the muscle contractions, leading to
better blood perfusion and thereby enhancing work economy in endurance-trained
athletes (Hoff et al., 1999; Osteras et al., 2002). In support, the latter study (Hoff et al.,
1999) reported a 22% improvement in work economy and improved time to exhaustion
(9.1%), strength (14.5%) and peak force (27%) following 9 weeks of resisted double
poling in which subjects performed 3 sets of 6 RM, 3 days per week without an
increase in VO2max. These improvements were reported due to decreases in relative
workload (reduced percentage of maximal force) and time to peak force measured
during the double poling action. Despite the different modes of testing, the weight
bearing nature of the double-poling cross-country ski test could indicate these results
may be applicable to running economy.
3.4.3 Resistance Training versus Plyometric or Explosive Resistance
Training
The concept of movement specificity suggests that the type of resistance training
used should closely model the movement that will be performed in competition (Jung,
2003). Consequently, Paavolainen et al. (1999) stated that explosive training,
mimicking the eccentric phase of running, is most likely to improve the use of stored
elastic energy and motor unit synchronization which increases the ability of the lower-
limb joints to act stiffer on ground contact (Paavolainen, Hakkinen, et al., 1999).
Moreover, Millet et al. (2002) stated that explosive-strength training leads to different
muscular adaptations than does typical heavy weight training (Millet et al., 2002); for
example, a greater increase in the rate of activation of the motor units. The available
data (Table 4), however, suggests that of the studies (Barnes, Hopkins, et al., in press;
Berryman et al., 2010; Guglielmo et al., 2009; Taipale et al., 2009; Taipale, Mikkola,
Vesterinen, et al., 2013) that included a resistance training and plyometric or explosive
resistance training group, three of the five studies (Barnes, Hopkins, et al., in press;
Guglielmo et al., 2009; Taipale et al., 2009; Taipale, Mikkola, Vesterinen, et al., 2013)
demonstrated greater improvements in running economy following traditional
resistance training, while one (Taipale, Mikkola, Vesterinen, et al., 2013) showed no
changes in economy in either type of training.
According to Guglielmo et al. (2009) when comparing heavy resistance training
to explosive resistance training performed on the same equipment, heavy weight
training seems to be more efficient for the improvement of running economy (Guglielmo
74
et al., 2009). Paton and Hopkins (2004) came to the same conclusion when reviewing
the effects of high-intensity training on performance and physiology in endurance
athletes (Paton & Hopkins, 2004). Similarly, when comparing various modes of
traditional resistance training, Sedano et al. (2013) found that a low-repetition high-
resistance program was superior to a high-repetition low-resistance program at
improving running economy (Sedano et al., 2013). This is assuming that each of these
studies resistance training programs were matched for volume load and the subjects in
each group were matched for training history and ability level. It is reasonable to
assume that there are individual responses to various modes of resistance training.
However, until more data is collected to describe subject or training characteristics that
may identify responders and non-responders to these different modes of resistance
training the current data suggest that traditional resistance training may be superior to
plyometric training, but any type of resistance may have a positive effect on running
economy (Jung, 2003).
While the exact mechanisms responsible for the improved running economy
following plyometric or explosive resistance training are unclear, the findings to date
indicate that improved neuromuscular function likely plays a role in the enhancement in
running economy and performance. However, this premise is based on indirect
measures of neuromuscular function and elastic energy return such as contact times
and vertical jump height. Enhancements in strength and power development during
isolate tasks (e.g. vertical and forward jumps) may reflect neuromuscular adaptations
but this has not been confirmed by more direct measurements of muscle recruitment,
such as EMG activity. Thus is it not possible to infer that these adaptations translate
into more efficient muscle recruitment patterns during running or that they are
responsible for the enhanced running economy following plyometric training.
Alternatively, changes in running style that result in more efficient gait patterns,
kinematics and kinetics may also improve the economy of runners following plyometric
or explosive resistance training. However, the majority of research into kinetics and
kinematics of running has been descriptive and changes in biomechanical efficiency
may be a result of improved neuromuscular efficiency. Finally, significant
improvements in work economy found in cross-country skiers (Hoff et al., 2002; Hoff et
al., 1999; Mikkola, Rusko, Nummela, Paavolainen, et al., 2007; Osteras et al., 2002)
and cyclist (Bastiaans, van Diemen, Veneberg, & Jeukendrup, 2001; Paton, 2009)
performing movement specific modes of resistance training may provide evidence that
these forms of training may be most beneficial to improving running economy and
performance; therefore future studies should examine running specific forms of
resistance training such as hill running, hypergravity running or running through sand.

75
3.5 Environmental Strategies
Interventions to improve running economy besides endurance and resistance
training are constantly sought after by athletes, coaches and sports scientists, however
there is a paucity of data regarding environmental strategies. Training at altitude, in the
heat or in the cold offer three potential strategies for improving economy. Despite
altitude exposure being reasonably well-researched over the past few decades, there is
still limited data in regards to improving running economy; while heat and cold
exposure have yet to be examined. Therefore the following section discusses the
feasibility of improving running economy via the increased physiologic stress from
training in hypoxic environments, warm to hot conditions or cold conditions.
3.5.1 Altitude Exposure
Many athletes undertake some form of altitude training to gain small
improvements in physiology and performance. Results from a recent meta-analysis
indicate ~1-4% performance enhancements following various protocols using natural
and artificial altitude exposure in highly and moderately trained athletes (Bonetti &
Hopkins, 2009). Improvements in performance have been primarily attributed to
increased hematological parameters leading to an increase in maximal aerobic
capacity (Levine & Stray-Gundersen, 1997; Robertson, Saunders, Pyne, Aughey, et al.,
2010; Saunders, Telford, Pyne, Gore, & Hahn, 2009; Stray-Gundersen, Chapman, &
Levine, 2001), however hypoxia-induced enhancements in muscle buffering capacity
(Gore et al., 2001) and running economy (Saunders, Telford, et al., 2004; Saunders,
Telford, Pyne, Hahn, et al., 2009) have also been suggested.
3.5.1.1 Altitude vs. Sea-level Natives
Several descriptive, cross-sectional and intervention studies have been
conducted highlighting differences in running economy between altitude natives and
individuals residing at sea level with equivocal results. While reporting the
physiological characteristics of Kenyan runners living and training at altitude and the
Scandinavian runners at sea level, Saltin et al. (1995) found that Kenyan runners had
5-15% lower VO2 at submaximal running speeds ranging from 10 to 16 km.h-1 and did
not accumulate lactate during running until near peak training intensities (Saltin et al.,
1995). Similarly, Weston et al. (1999) reported Kenyan runners had better economy
and higher resistance to fatigue while running at the same percentage of VO2max than
Caucasian runners (Weston, Karamizrak, Smith, Noakes, & Myburgh, 1999). It was
reported that Kenyan runners who live and train at altitude have higher oxidative
enzyme activities than their Caucasian counterparts of a similar VO2max (Weston et
al., 1999), which could be the reason for the improved running economy.
76
Data examining 46 weeks of training at 2210 m altitude in sea level and altitude
natives suggest that changes in physiological and performance parameters by former
sea level residents may result in difference changes or require longer periods at
altitude to result in similar changes compared to altitude natives (Brothers et al., 2010).
Sea level natives had significantly poorer running economy (+6.6%), lower VO2max (-
5.9%), and slower 1.5 mile run time (+5.4%) compared to altitude natives following
similar training at altitude. Similarly, Lundby et al. (2007) reported that there were no
significant changes in running economy of sea level natives after 8 weeks of exposure
to 4100 m compared to altitude natives who had a 15% lower submaximal VO2 than
sea-level residents (Lundby et al., 2007), consistent with the observations of others
(Hochachka et al., 1991; Marconi, Marzorati, Sciuto, Ferri, & Cerretelli, 2005; Saltin et
al., 1995; Weston et al., 1999; Weston, Mbambo, & Myburgh, 2000).
3.5.1.2 Adaptation to Different Hypoxic Environments
In sea-level natives, several studies (Bailey et al., 1998; Burtscher et al., 2010;
Katayama et al., 2003; Katayama et al., 2004; Levine & Stray-Gundersen, 1997; Neya
et al., 2007; Richalet & Gore, 2008; Saunders, Telford, et al., 2004; Saunders, Telford,
Pyne, Hahn, et al., 2009; Schmitt et al., 2006) have demonstrated improvements (2-
7%) in running economy following different types, ascents and durations of altitude
exposure (Table 5). Conversely, an equivocal number of studies have demonstrated
that submaximal VO2 at sea level remains largely unchanged following exposure to
different hypoxic environments (Table 5) (Julian et al., 2004; Lundby et al., 2007;
Robertson, Saunders, Pyne, Aughey, et al., 2010; Robertson, Saunders, Pyne, Gore, &
Anson, 2010; Stray-Gundersen et al., 2001; Telford, Graham, & Sutton, 1996; Truijens
et al., 2008).
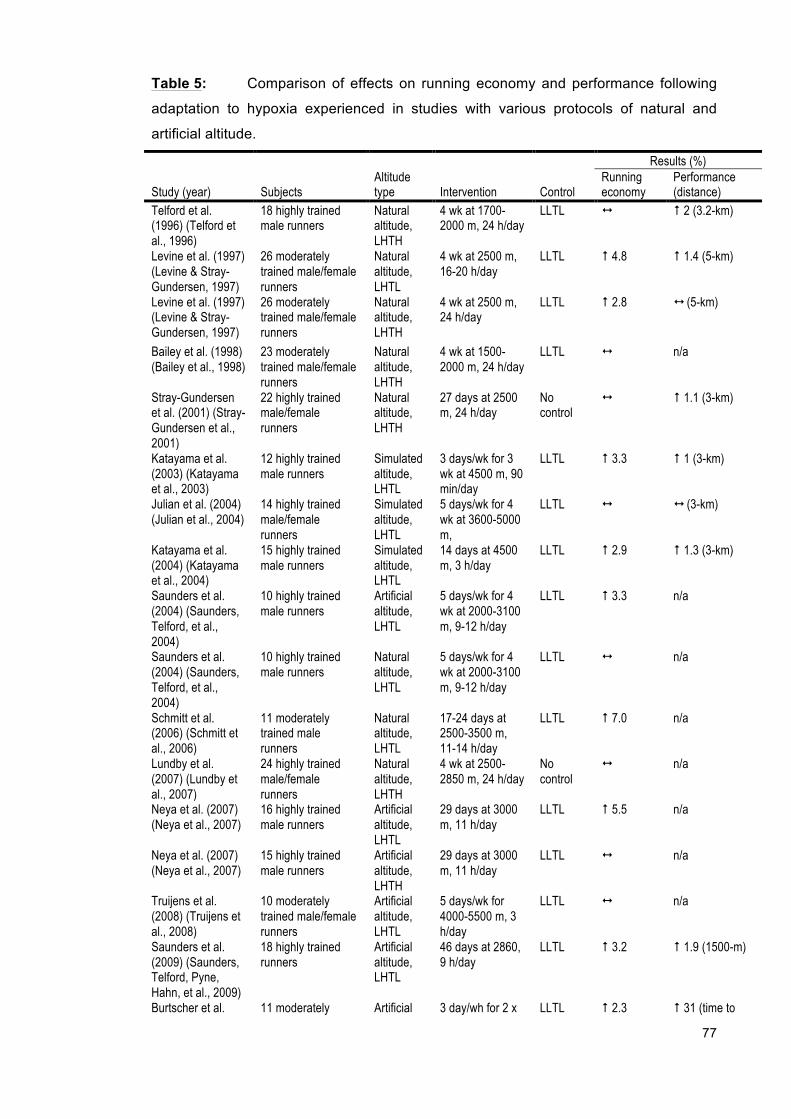
77
Table 5: Comparison of effects on running economy and performance following
adaptation to hypoxia experienced in studies with various protocols of natural and
artificial altitude.
Results (%)
Study (year) Subjects Altitude type Intervention Control
Running economy
Performance (distance)
Telford et al. (1996) (Telford et al., 1996)
18 highly trained male runners
Natural altitude, LHTH
4 wk at 1700-2000 m, 24 h/day
LLTL " ! 2 (3.2-km)
Levine et al. (1997) (Levine & Stray-Gundersen, 1997)
26 moderately trained male/female runners
Natural altitude, LHTL
4 wk at 2500 m, 16-20 h/day
LLTL ! 4.8 ! 1.4 (5-km)
Levine et al. (1997) (Levine & Stray-Gundersen, 1997)
26 moderately trained male/female runners
Natural altitude, LHTH
4 wk at 2500 m, 24 h/day
LLTL ! 2.8 " (5-km)
Bailey et al. (1998) (Bailey et al., 1998)
23 moderately trained male/female runners
Natural altitude, LHTH
4 wk at 1500-2000 m, 24 h/day
LLTL " n/a
Stray-Gundersen et al. (2001) (Stray-Gundersen et al., 2001)
22 highly trained male/female runners
Natural altitude, LHTH
27 days at 2500 m, 24 h/day
No control
" ! 1.1 (3-km)
Katayama et al. (2003) (Katayama et al., 2003)
12 highly trained male runners
Simulated altitude, LHTL
3 days/wk for 3 wk at 4500 m, 90 min/day
LLTL ! 3.3 ! 1 (3-km)
Julian et al. (2004) (Julian et al., 2004)
14 highly trained male/female runners
Simulated altitude, LHTL
5 days/wk for 4 wk at 3600-5000 m,
LLTL " " (3-km)
Katayama et al. (2004) (Katayama et al., 2004)
15 highly trained male runners
Simulated altitude, LHTL
14 days at 4500 m, 3 h/day
LLTL ! 2.9 ! 1.3 (3-km)
Saunders et al. (2004) (Saunders, Telford, et al., 2004)
10 highly trained male runners
Artificial altitude, LHTL
5 days/wk for 4 wk at 2000-3100 m, 9-12 h/day
LLTL ! 3.3 n/a
Saunders et al. (2004) (Saunders, Telford, et al., 2004)
10 highly trained male runners
Natural altitude, LHTL
5 days/wk for 4 wk at 2000-3100 m, 9-12 h/day
LLTL " n/a
Schmitt et al. (2006) (Schmitt et al., 2006)
11 moderately trained male runners
Natural altitude, LHTL
17-24 days at 2500-3500 m, 11-14 h/day
LLTL ! 7.0 n/a
Lundby et al. (2007) (Lundby et al., 2007)
24 highly trained male/female runners
Natural altitude, LHTH
4 wk at 2500-2850 m, 24 h/day
No control
" n/a
Neya et al. (2007) (Neya et al., 2007)
16 highly trained male runners
Artificial altitude, LHTL
29 days at 3000 m, 11 h/day
LLTL ! 5.5 n/a
Neya et al. (2007) (Neya et al., 2007)
15 highly trained male runners
Artificial altitude, LHTH
29 days at 3000 m, 11 h/day
LLTL " n/a
Truijens et al. (2008) (Truijens et al., 2008)
10 moderately trained male/female runners
Artificial altitude, LHTL
5 days/wk for 4000-5500 m, 3 h/day
LLTL " n/a
Saunders et al. (2009) (Saunders, Telford, Pyne, Hahn, et al., 2009)
18 highly trained runners
Artificial altitude, LHTL
46 days at 2860, 9 h/day
LLTL ! 3.2 ! 1.9 (1500-m)
Burtscher et al. 11 moderately Artificial 3 day/wh for 2 x LLTL ! 2.3 ! 31 (time to

78
(2010) (Burtscher et al., 2010)
trained male/female runners
altitude, LHTL
5 wk at 3200-5500 m, 2 h/day
exhaustion at MAS)
Robertson et al. (2010) (Robertson, Saunders, Pyne, Gore, et al., 2010)
8 highly trained male/female runners
Artificial altitude, LHTL+TH
3 wk at 3000 m, 14 h/day + 4 day/wk training at 2200 m
No control
" ! 1.1 (3-km)
Robertson et al. (2010) (Robertson, Saunders, Pyne, Gore, et al., 2010)
9 highly trained male/female runners
Artificial altitude, LLTH
4 day/wk for 3 wk training at 2200 m
No control
" " (3-km)
Roberson et al. (2010) (Robertson, Saunders, Pyne, Gore, et al., 2010)
16 highly trained male/female runners
Artificial altitude, LHTL
3 wk training at 3000 m, 14 h/day
LLTL " ! 1.9 (3-km)
Highly trained = national/international level and VO2max >65 ml.kg-1.min-1; moderately trained = weekly running volume >30 km.wk-1; recreational = weekly running volume <30 km.wk-1; LTHT = live high train high; LLTL = live low train low; LHTL = live high train low; low altitude = <1000 m, high altitude = >1500 m (Bonetti & Hopkins, 2009); ! indicates increase; " indicates no change; # indicates decrease; n/a indicates not measured;
3.5.1.2.1 Blood Parameters
Mechanisms that have been suggested to explain the discrepancy in
improvements in economy after altitude exposure have been related to differences in
changes in hemoglobin mass and concentration, following hypoxic exposure. While
the dosing of hypoxia for the enhancement of the total hemoglobin mass currently is
well defined this does not apply to running economy. About 400 hours of hypoxia
corresponding to an altitude >2100m seem to be necessary to increase total
hemoglobin mass (Saunders, Telford, Pyne, Hahn, et al., 2009). In a study by
Burtscher et al. (2010), the duration of hypoxic exposure was only 30 h during one 5
week period which unsurprisingly was insufficient to significantly increase total
hemoglobin mass, but was adequate to elicit an improvement (2.3%) in running
economy (Burtscher et al., 2010). The authors did report small increases in
hemoglobin concentration and hematocrit, which were closely related to the
improvement in running economy. An increase in hematocrit results in a linear
increase of the oxygen carrying capacity and an exponential increase in blood viscosity
(Burtscher et al., 2010). Because blood viscosity is not highly dependent on hematocrit
at high cardiac outputs (Burtscher et al., 2010) the enhanced oxygen carrying capacity
could contribute to the improved running economy and performance after hypoxia.
Levine et al. (1997) reported that moderately trained runners living at moderate altitude
(2500 m) and training at low altitude (1250 m) increased red cell mass (9%) as well as
improved VO2max (5%) and running economy (2-5%) after return to sea level (Levine &
Stray-Gundersen, 1997). The authors suggested the enhanced hematological
properties and oxygen-carrying capacity of the blood improvements translated into
improved 5-km time-trial performance.
79
3.5.1.2.2 Cardiorespiratory Adaptations
The findings from a number of studies suggests that enhancements in running
economy following hypoxic exposure may the result of decreased cardiorespiratory
costs (decreased VE, lower HR) (Green et al., 2000; Katayama et al., 2004; Saunders,
Telford, Pyne, Hahn, et al., 2009), a shift toward a greater glycolytic involvement in
ATP regeneration (Green et al., 2000), greater carbohydrate utilization during oxidative
phosphorylation (Gore et al., 2001; Roberts et al., 1996), increased ability of the
excitation and contraction processes to perform work at lower energy costs (Gore,
Clark, & Saunders, 2007; Green et al., 2000), and/or acclimatization-induced
transformation of muscle fiber types (Green et al., 2000). One study examining the
effects of ~46 nights at 2860 m simulated altitude on running economy and
performance prior to the competitive track season found altitude improved running
economy by 1.0-5.2%, increased hemoglobin mass by 4.9%, and decreased
submaximal heart rate by 3.1% (Saunders, Telford, Pyne, Hahn, et al., 2009). The
authors suggest plausible mechanisms for improved running economy include an
increase in ATP production per mole of O2 used, a decrease in the ATP cost of muscle
contraction, and a decrease in the cardiorespiratory cost of O2 transport. Another
recent study demonstrated that 11 to 14 hours a day for 17-24 days of normobaric
hypoxia (2500-3500 m) improved running economy by 7% (Schmitt et al., 2006). The
authors suggested that changes in substrate utilization and lower cardiorespiratory
costs contributed to the improved running economy, which is supported by the
increased submaximal RER and the decreased minute ventilation and heart rate values
within the experimental groups. More recently, it was demonstrated that 3 hours per
day for 2 weeks of intermittent exposure to normobaric hypoxia (equivalent of 4500 m)
improved running economy by 2.6% (14 km.h-1) and 2.9% (16 km.h-1). The improved
running economy was accompanied by a decreased HR (3.3% and 3.9% at 14 and 16
km.h-1, respectively) and a trend towards improved 3000 m run time (1.3%) (Katayama
et al., 2004).
3.5.1.2.3 Substrate Metabolism
The findings from other studies indicate that a small shift in substrate metabolism
towards increase in carbohydrate use and lower cardiorespiratory costs, such as
decreased minute ventilation and heart rate contributed to the improved running
economy after a period of altitude exposure (Burtscher et al., 2010; Schmitt et al.,
2006). Both studies reported an improvement in running economy (2.3% (Burtscher et
al., 2010) and 7.7% (Schmitt et al., 2006)) with an accompanying shift towards
carbohydrate metabolism. The former study, reported that two 5-week periods of
intermittent hypoxia (3200-5500 m) 3 days per week for 2 hours each day improved
80
running economy only during the first 5-week period of intermittent hypoxia when
compared to training alone. Although running economy continuously improved during
the 13-week study period, no further differences changes occurred after the first 5-
week period. These findings suggest that mainly intermittent hypoxia must have been
responsible for the improvement in running economy during the first 5 weeks and
running training during the following 8 weeks. These results emphasizes the
importance of the training phase on the effectiveness of altitude exposure on running
economy.
3.5.1.2.4 Metabolic Efficiency
Results from other studies (Gore et al., 2007; Saunders, Telford, et al., 2004)
suggest the physiological mechanisms eliciting an improved running economy in highly
trained runners after hypoxic exposure appear unrelated to decreased ventilation or a
substantial shift in substrate use. Therefore, it is possible that the main mechanisms
responsible for improved running economy at sea level after a period of altitude
exposure are either an increase in the ATP production per mole of oxygen used and/or
a decrease in the ATP cost of muscle contraction. Katayama et al. (2003, 2007) have
demonstrated on several occasions that intermittent hypoxic exposure improves
running economy in highly trained runners without changes in ventilation or substrate
use (Katayama et al., 2003; Katayama et al., 2007). The first study reported that
simulated hypoxic exposure using intermittent hypobaria of 4500 m 3 hours per day for
14 consecutive days improved running economy by 2.6% (14 km.h-1) and 3.3% (16
km.h-1), improved 3000 m run time by 1% and time to exhaustion on the treadmill by
2.7% (Katayama et al., 2003). Another recent study demonstrated that 20 days of live
high (simulated altitude 2000-3100 m) train low improved running economy (3.3%, p =
0.005) in the absence of any changes in VE, RER, HR or hemaglobin mass (Saunders,
Telford, et al., 2004). There was also no evidence of an increase in lactate
concentration after the live high train low intervention, suggesting that the lower aerobic
demand of running was not attributable to an increased anaerobic energy contribution.
Hochachka (1988) was the first to describe the processes that ameliorate
energetic efficiency following hypoxic exposure (Hochachka, 1988), and more recently
by Gore et al. (2007) (Gore et al., 2007). The high ATP use required for endurance
exercise can only be supported by mitochondrial oxidative phosphorylation, and,
consequently, mitochondrial efficiency has a direct influence on whole-body efficiency
(Ponsot et al., 2006). At the cellular level mitochondrial efficiency is defined by the
coupling between ATP formation and substrate oxidation; either an increase in ATP per
mol of oxygen used or decrease in the amount of substrate to support ATP demand
81
improves metabolic efficiency and theoretically running economy. Neya et al. (2007)
suggested that it is possible that hypoxic exposure resulted in tighter coupling of
muscular intracellular bioenergetics, which improved mitochondrial efficiency and
subsequently running economy (Neya et al., 2007). A reduced energy requirement of
one or more processes involved in excitation and contraction of the working muscles
has been previously postulated by Green et al. (2000), possibly as a result of a
reduction in by-product accumulation, such as ADP, inorganic phosphate and H+, that
occurs after altitude acclimatization, which increases the amount of free energy
released from ATP hydrolysis and depresses the need to maintain hydrolysis rates at
pre-acclimatized levels (Green et al., 2000).
3.5.1.2.5 Muscle Fiber Type
It has been shown that the type I muscle fibers are considerably more efficient
than type II muscle fibers (see section on Muscle Fiber Type – Part I). Acclimatization-
induced transformation of fiber types could conceivably underlie changes in
neuromuscular efficiency; however, this has yet to be studied runners.
In summary, the literature indicates that altitude exposure for runners has no
detrimental effects on running economy and that there is good evidence to suggest that
it may lead to worthwhile improvements in running economy at sea-level. Altitude
acclimatization results in both central and peripheral adaptations that improve oxygen
delivery and utilization and enhance metabolic efficiency, mechanisms that potentially
could improve an athletes running economy. Many of the studies that did not find
improved running economy (Table 5) after altitude exposure were performed close to
the competition season emphasizing the importance of training phase on the
effectiveness of altitude exposure on running economy. However, it cannot be
excluded that more severe hypoxia and longer durations of exposure would affect
running economy even close to competition season.
3.5.2 Heat
Adaptations associated with acute and chronic training bouts in warm to hot
conditions may attenuate the magnitude of the thermoregulatory response (increase
VE, sweating and circulation) and reduce the energy requirements (improved efficiency)
associated with heat stress (Bailey & Pate, 1991; Svedenhag, 2000). The elevated
CTemp resulting from training in hyperthermic conditions may improve running economy
by increasing the mechanical efficiency and/or metabolic efficiency in the working
musculature (Maron et al., 1976; Morgan, Martin, et al., 1989; Rowell et al., 1969). It is
also conceivable that running economy may improve with heat acclimatization due to
82
the corresponding increase in plasma volume. Plasma volume can increase by up to
12% following training in the heat (Bailey & Pate, 1991). The increase in plasma
volume assists in the maintenance of stroke volume by preventing reductions in mean
arterial pressure, central venous pressure, and cardiac filling (Laursen & Jenkins,
2002), which in turn reduces myocardial work (Bailey & Pate, 1991; Coyle, Hopper, &
Coggan, 1990). While theoretically training in the heat should improve running
economy, currently no data exists regarding the effectiveness of this training modality.
However, the acute effects of temperature on running economy and stride parameters
has shown that leg temperature manipulation did not influence running economy
despite changes in stride parameters that might indicate restricted muscle-tendon
elasticity after pre-cooling (Folland, Rowlands, Thorp, & Walmsley, 2006).
3.5.3 Cold
Several recent studies (Ito, Nakano, Yamane, Amano, & Matsumoto, 2013;
Sandsund et al., 2012) have found that training in cold conditions induced similar
metabolic responses to running in heat, which may enhance running economy. Ito et
al. (2013) found in 7 male athletes running at 70% VO2max for 30 min in a climate
chamber at an ambient temperature of 5°C and in the presence of man-made rain (40
mm.hr-1 of precipitation), esophageal and mean skin temperature were significantly
lower in rain than in control, presumably due to circulation forced away from the skin to
warm and protect vital organs (Ito et al., 2013). Minute ventilation, HR, VO2 and
plasma lactate levels were also significantly higher in rain than in control (Ito et al.,
2013).
Training in the heat or cold may also improve running economy and performance
at normal temperatures, by allowing runners to compete at any given speed with a
lower HR, CTemp, and VE, all factors associated with improved running economy
(Thomas et al., 1995; Thomas et al., 1999). Therefore future research should examine
plausibility of using heat and/or cold exposure as a strategy to improve running
economy.
3.6 Stretching
There appears to be equivocal results in regards to the effects of stretching or
flexibility on running economy. Some researchers have identified an inverse
relationship between flexibility and running economy; that is, less flexibility is
associated with greater running economy (lower VO2) (Craib et al., 1996; Gleim et al.,
1990; Hunter et al., 2011; Jones, 2002; Trehearn & Buresh, 2009). Gleim et al. (1990)
tested 100 male and female subjects over a range of speeds from 3 to 12 km·hr-1 and
83
found that those who exhibited less flexibility in a battery of 11 trunk and lower limb
flexibility tests were most economical (Gleim et al., 1990). These results and others
suggest that the inflexibility of the lower limbs and trunk musculature as well as limited
range of motion allow for greater elastic energy storage and use in the muscles and
tendons during the running gait (Gleim et al., 1990; Jones, 2002). Specifically, it was
suggested that inflexibility in the transverse and frontal planes of the trunk and hip
regions of the body may stabilize the pelvis at the time of foot impact with the ground,
reducing excessive range of motion and metabolically expensive stabilizing muscular
activity (Gleim et al., 1990). Furthermore, research has demonstrated runners with
tighter or stiffer musculotendinous structures demand less work from the exercising
muscles (i.e. a lower VO2) at any submaximal running velocity because they use more
stored elastic energy while running (Craib et al., 1996; Gleim et al., 1990; Jones, 2002).
In contrast, other research fails to support the existence of an inverse
relationship, countering that flexibility is an essential component of distance running
performance (Beaudoin & Whatley Blum, 2005; Godges et al., 1989; Godges, MacRae,
& Engelke, 1993; Nelson, Kokkonen, Eldredge, Cornwell, & Glickman-Weiss, 2001).
Godges et al. (1989) found improved running economy at 40%, 60%, and 80% VO2max
in response to static stretching procedures in 7 moderately trained athletic male college
students when flexibility increased (Godges et al., 1989). They reported a reduced
aerobic demand of running at all speeds when hip flexion and extension were
increased (Godges et al., 1989). Improved hip flexibility, myofascial balance, and
pelvic symmetry due to stretching are thought to enhance neuromuscular balance and
contraction, thus leading to a lower submaximal VO2 and improved running economy.
These results corroborate general beliefs that improved flexibility is desirable for
optimal running performance.
Conflicting results among studies may be associated with limitations in
methodological design. Several studies (Gleim et al., 1990; Godges et al., 1989;
Godges et al., 1993) did not employ an adequate treadmill acclimatization period;
therefore improvements in running economy may have been associated with
familiarization with treadmill running (Craib et al., 1996). Furthermore, subjects were
not described as runners of any caliber in several studies (Gleim et al., 1990; Godges
et al., 1989; Godges et al., 1993; Nelson et al., 2001). Therefore lack of familiarity with
treadmill running mechanics may have made economy measures invalid in these
studies. Additionally, some studies (Gleim et al., 1990; Nelson et al., 2001; Trehearn &
Buresh, 2009) have combined males and females results in the analyses; because
females are generally more flexible (Trehearn & Buresh, 2009) and less economical
84
than males (Daniels & Daniels, 1992); the true association between economy and
flexibility may be difficult to discern if genders are not studied separately. Finally, a
recent systematic review concluded that an acute bout of stretching may improve
running economy, but regular stretching prior to running over time has no effect on
economy (Shrier, 2004). Overall these findings suggest stretching should not be
discounted as a training modality, because stretching exercises are commonly
prescribed for runners to facilitate injury prevention and maximize stride length
(Bonacci et al., 2009; Saunders, Pyne, et al., 2004a). However, it appears that there
could be an optimal degree of flexibility and stiffness or tightness required to maximize
running economy.
3.7 Nutritional Interventions
Beyond the typical endurance athlete preparation, which features large amounts
of aerobic training, high-intensity interval training, resistance and/or plyometric training,
and various environmental exposures during a periodized season (Stellingwerff, 2013),
several nutritional interventions have received attention for their effects on reducing
oxygen demand during exercise, most notably dietary nitrates.
3.7.1 Dietary Nitrate
Nitric oxide (NO) is an important physiological signaling molecule that can
modulate skeletal muscle function through its role in the regulation of blood flow,
muscle contractility, glucose and calcium homeostasis, and mitochondrial respiration
and biogenesis (Jones, 2013). It is now known that tissue concentrations of nitrate
(NO3-) and nitrite (NO2
-) can be increased by dietary means. Green leafy vegetables
such as lettuce, spinach, rocket, celery and beetroot are particularly rich in nitrate.
Therefore dietary nitrate supplementation represents a practical method to increase
circulating plasma nitrite and thus nitric oxide to lower the oxygen demand of
submaximal exercise (i.e. enhances metabolic efficiency and subsequently running
economy) and potentially enhance running performance (Bailey, Fulford, et al., 2010;
Bailey et al., 2009; Bailey, Winyard, et al., 2010; Jones, 2013; Jones, Bailey, &
Vanhatalo, 2012; Jones, Vanhatalo, & Bailey, 2013; Larsen et al., 2011; Larsen,
Weitzberg, Lundberg, & Ekblom, 2007). The physiological mechanisms responsible for
the reduced oxygen demand following nitrate supplementation at the same running
velocity could result from either a lower ATP cost of muscle contraction for the same
force production (i.e., improved muscle contractile efficiency via effects or sarcoplasmic
reticulum calcium handling or actin-myosin interaction) and/or a lower oxygen
consumption for the same rate of oxidative ATP resynthesis (i.e., enhanced
mitochondrial efficiency via improved oxidative phosphorylation) (Jones, 2013; Jones et
85
al., 2012; Jones et al., 2013).
While only one study to date has demonstrated an improved running economy
(Lansley, Winyard, Fulford, et al., 2011) following nitrate supplementation, a reduced
oxygen demand and improved work efficiency has been reported for several other
types of exercise including cycling (Bailey et al., 2009; Larsen et al., 2007; Larsen,
Weitzberg, Lundberg, & Ekblom, 2010; Vanhatalo et al., 2010), walking (Lansley,
Winyard, Fulford, et al., 2011), and knee extension exercise (Bailey, Fulford, et al.,
2010; Fulford et al., 2013). Larsen et al. (2007) reported that three days of sodium
nitrate supplementation increased plasma nitrite and reduced the oxygen demand of
submaximal cycling exercise (Larsen et al., 2007). These findings were corroborated
by Bailey et al. (2009) in which nitrate was administered in the form of beetroot juice
(Bailey et al., 2009). The reduction in VO2 after nitrate supplementation was of the
order of 5% in the studies of Larsen et al. (2007) and Bailey et al. (2009) in which
supplementation was continued for 3-6 days (Bailey et al., 2009; Larsen et al., 2007).
A similar reduction in steady-state VO2 has been reported following acute nitrate
supplementation. Vanhatalo et al. (2010) reported a significant reduction in steady-
state VO2 just 2.5 h following beetroot juice ingestion (Vanhatalo et al., 2010). Dietary
nitrate supplementation has been reported to extend the time to exhaustion during
high-intensity constant work rate exercise by 15-25% during cycle ergometry (Bailey et
al., 2009; Vanhatalo et al., 2010), treadmill running (Lansley, Winyard, Fulford, et al.,
2011), and two-legged knee extensor exercise (Bailey, Fulford, et al., 2010), and to
enhance cycling performance over 4, 10, and 16.1 km by 1-2% (Lansley, Winyard,
Bailey, et al., 2011) and 5-km time-trial running performance by 2.4% (Lanceley,
Ranchordas, & Ruddock, 2013).
There is a paucity of data examining the effects of other dietary intervention on
running economy. One investigation found four weeks of oral Echinacea
supplementation enhanced running economy by 1.7% (Whitehead et al., 2012).
Results from a study examining caffeine ingestion in cross-country runners suggest
that the ingestion of caffeine at 7 mg.kg-1 of body weight prior to submaximal running
might provide a modest ergogenic effect via improved respiratory efficiency and a
psychological lift (Birnbaum & Herbst, 2004). Combined creatine and glycerol ingestion
has been shown to be an effective means in reducing thermal and cardiovascular strain
during exercise in the heat without negatively impacting on running economy (Beis et
al., 2011). Although dietary nitrate appears to be a promising ergogenic aid, additional
research is required to determine the scope of its effects on well-trained distance
runners and across different competition events. Future research should also examine

86
the efficacy of using other nutritional interventions to enhance running economy.
3.8 Conclusions and Future Directions
A variety of training strategies have been adopted in an attempt to improve
running economy by modifying one or more factors that influence metabolic,
biomechanical and/or neuromuscular efficiency. Resistance training, plyometric and
explosive resistance training have been reported to improve running economy in
recreational, moderately trained, and high trained runners through primarily
neuromuscular mechanisms. Results from high-intensity interval training studies are
unclear, but the best results appear to occur when training at near maximal or
supramaximal intensities. Uphill interval training and running in sand appear to be
worthwhile training approaches as well, however more research is needed in this area.
Adaptations to living and training at natural and artificial altitude have been primarily
attributed to increased hematological parameters that improve running economy.
Training in warm to hot conditions is another strategy to improve running economy,
however interventions examining its efficacy are limited. There appears to be
equivocal results regarding the effects of stretching or flexibility on running economy.
Ingestion of dietary nitrate, especially in the form of beetroot juice, also appears to hold
promise as a natural means to improve running economy. From a practical standpoint,
it’s clear that training and passive interventions affect running economy and
researchers should concentrate their investigative efforts on more fully understanding
the types and mechanisms which affect running economy and the practicality and
extent to which running economy can be improved outside the laboratory.
87
CHAPTER 4: LOWER BODY DETERMINANTS OF RUNNING ECONOMY IN MALE AND FEMALE DISTANCE RUNNERS
4.1 Abstract
A variety of training approaches have been shown to improve running economy
in well-trained athletes. However, there is a paucity of data exploring lower-body
determinants that may affect running economy as well as account for differences that
may exist between genders. Sixty-three male and female distance runners were
assessed in the laboratory for a range of metabolic, biomechanical and neuromuscular
measures potentially related to running economy (ml.kg-1.min-1) at a range of running
speeds. At all common test velocities women were more economical than men (effect
size (ES) = 0.40), however, when compared in terms of relative intensity males had
better running economy (ES = 2.41). Leg stiffness (r = -0.80) and moment arm length
(r = 0.90) were large to extremely largely correlated with running economy and each
other (r = -0.82). Correlations between running economy and kinetic measures (peak
force, peak power and time to peak force) for both genders were unclear. The
relationship in stride rate (r = -0.27 to -0.31) was in the opposite direction to that of
stride length (r = 0.32 to 0.49), and the relationship in contact time (r = -0.21 to -0.54)
was opposite of that of flight time (r = 0.06 to 0.74). While both leg stiffness and
moment arm length are highly related to running economy, it appears that no single
lower-body measure can completely explain differences in running economy between
individuals or genders. Running economy is therefore likely determined from the sum
of influences from multiple lower-body attributes.
88
4.2 Introduction
Running economy is defined as the steady-state oxygen consumption (VO2) at
a given running velocity (Saunders, Pyne, et al., 2004a), therefore, a lower VO2 at a
given velocity would indicate better running economy. Runners with good running
economy tend to run faster at a given distance or longer at a constant velocity than
runners with poor running economy, assuming their VO2max is the same. Despite the
performance benefits of being an economical runner, researchers have yet to resolve
why some runners demonstrate markedly better economy when compared to
counterparts exhibiting similar fitness, training history and performance backgrounds
(Conley & Krahenbuhl, 1980; Daniels & Daniels, 1992; Daniels, Krahenbuhl, et al.,
1977; Williams & Cavanagh, 1987).
A number of physiological, biomechanical and neuromuscular factors appear to
influence running economy in well-trained or elite runners. These include metabolic
adaptations within the muscle such as increased mitochondria and oxidative enzymes
(Holloszy et al., 1977), more efficient mechanics leading to less energy wasted on
breaking forces and excessive vertical oscillation (Cavanagh et al., 1977; Williams &
Cavanagh, 1987), and the ability of muscles to store and release elastic energy by
increasing the lower-body stiffness (Dalleau et al., 1998). Furthermore, a variety of
modifiable (e.g. percent body fat, body mass) (Anderson, 1996; Pate et al., 1992) and
un-modifiable (e.g. Achilles moment arm length, height, skeletal structure) (Anderson,
1996; Raichlen et al., 2011; Scholz et al., 2008) anthropometric measures influence
biomechanical and neuromuscular efficiency and subsequently alter running economy.
For example, the amount of energy stored in a tendon depends on the mechanical
properties of the tendon and on the force that stretch the tendon. Thus, for a given
movement pattern, tendon force is inversely related to the moment arm of the Achilles
tendon (Scholz et al., 2008). Since it is generally accepted that storage and
reutilization of elastic energy in tendons substantially reduces energy demands in
running (Cavagna & Kaneko, 1977) previous research has been able to establish a
relationship between the variation in running economy and the moment arm of the
Achilles tendon (Raichlen et al., 2011; Scholz et al., 2008), albeit in small sample sizes
of 8 to 15.
Recent research has focused on various neuromuscular or biomechanical
characteristics as mechanisms to explain improvements in running economy
(Paavolainen, Hakkinen, et al., 1999; Spurrs et al., 2003). Any lower-body adaptations
which allows for improved muscle power development, enhanced ability of the muscles
to store and release elastic energy by increasing stiffness, or more efficient mechanics
89
characterized by more skilled control of movement and muscle recruitment patterns
(Anderson, 1996; Bonacci et al., 2009; Jung, 2003) could certainly explain differences
in running economy among runners. The differences in running economy that exist
between males and females has been previously investigated, but with mixed findings
(Bransford & Howley, 1977; Daniels, Krahenbuhl, et al., 1977; Davies & Thompson,
1979; Maughan & Leiper, 1983; Morgan et al., 1995; Morgan & Craib, 1992).
Research has yet to explore which of these lower-body characteristics can explain
these inter-individual differences in running economy between male and female trained
distance runners. Therefore, the present study was designed to evaluate the lower-
body determinants of running economy among well-trained male and female distance
runners.
4.3 Methods
4.3.1 Experimental Approach to the Problem
Male and female distance runners physiological, biomechanical and
neuromuscular characteristics were assessed in our laboratory over a 3-year period.
Testing took place during the competition phase of each runner’s track or cross-country
seasons. Most athletes were tested on one or more occasions during this time span.
When more than one set of data was available for any athlete, the mean of all tests
was used to represent that athlete. Obtaining measures during the competition phase
for a range of competitive runners enabled us to characterize the lower body
determinants or running economy at peak fitness levels.
4.3.2 Subjects
Sixty-three runners were assessed in our laboratory over a three-year period.
All runners competed at the collegiate or national level. The athletes were all well-
trained distance runners competing in events ranging from 800-m to 10-km with 27
runners qualifying for national championships in cross-country, track or road races,
winning 13 national titles and 5 competing at the international level over a three-year
testing period. Descriptive characteristics of the runners are presented in Table 6. The
study was approved by the Auckland University of Technology Ethics Committee;
Auckland, New Zealand. All participants provided informed written consent to
participate.
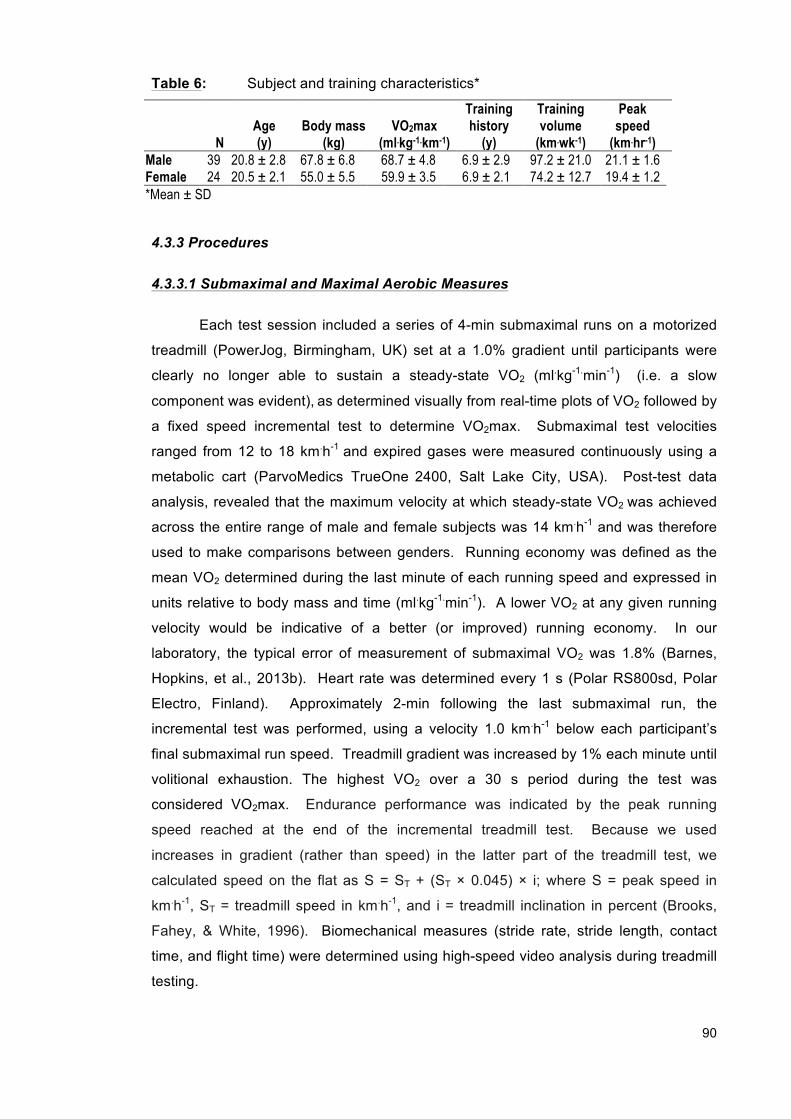
90
Table 6: Subject and training characteristics*
N Age (y)
Body mass (kg)
VO2max (ml.kg-1.km-1)
Training history
(y)
Training volume
(km.wk-1)
Peak speed
(km.hr-1) Male 39 20.8 ± 2.8 67.8 ± 6.8 68.7 ± 4.8 6.9 ± 2.9 97.2 ± 21.0 21.1 ± 1.6 Female 24 20.5 ± 2.1 55.0 ± 5.5 59.9 ± 3.5 6.9 ± 2.1 74.2 ± 12.7 19.4 ± 1.2 *Mean ± SD
4.3.3 Procedures
4.3.3.1 Submaximal and Maximal Aerobic Measures
Each test session included a series of 4-min submaximal runs on a motorized
treadmill (PowerJog, Birmingham, UK) set at a 1.0% gradient until participants were
clearly no longer able to sustain a steady-state VO2 (ml.kg-1.min-1) (i.e. a slow
component was evident), as determined visually from real-time plots of VO2 followed by
a fixed speed incremental test to determine VO2max. Submaximal test velocities
ranged from 12 to 18 km.h-1 and expired gases were measured continuously using a
metabolic cart (ParvoMedics TrueOne 2400, Salt Lake City, USA). Post-test data
analysis, revealed that the maximum velocity at which steady-state VO2 was achieved
across the entire range of male and female subjects was 14 km.h-1 and was therefore
used to make comparisons between genders. Running economy was defined as the
mean VO2 determined during the last minute of each running speed and expressed in
units relative to body mass and time (ml.kg-1.min-1). A lower VO2 at any given running
velocity would be indicative of a better (or improved) running economy. In our
laboratory, the typical error of measurement of submaximal VO2 was 1.8% (Barnes,
Hopkins, et al., 2013b). Heart rate was determined every 1 s (Polar RS800sd, Polar
Electro, Finland). Approximately 2-min following the last submaximal run, the
incremental test was performed, using a velocity 1.0 km.h-1 below each participant’s
final submaximal run speed. Treadmill gradient was increased by 1% each minute until
volitional exhaustion. The highest VO2 over a 30 s period during the test was
considered VO2max. Endurance performance was indicated by the peak running
speed reached at the end of the incremental treadmill test. Because we used
increases in gradient (rather than speed) in the latter part of the treadmill test, we
calculated speed on the flat as S = ST + (ST × 0.045) × i; where S = peak speed in
km.h-1, ST = treadmill speed in km.h-1, and i = treadmill inclination in percent (Brooks,
Fahey, & White, 1996). Biomechanical measures (stride rate, stride length, contact
time, and flight time) were determined using high-speed video analysis during treadmill
testing.
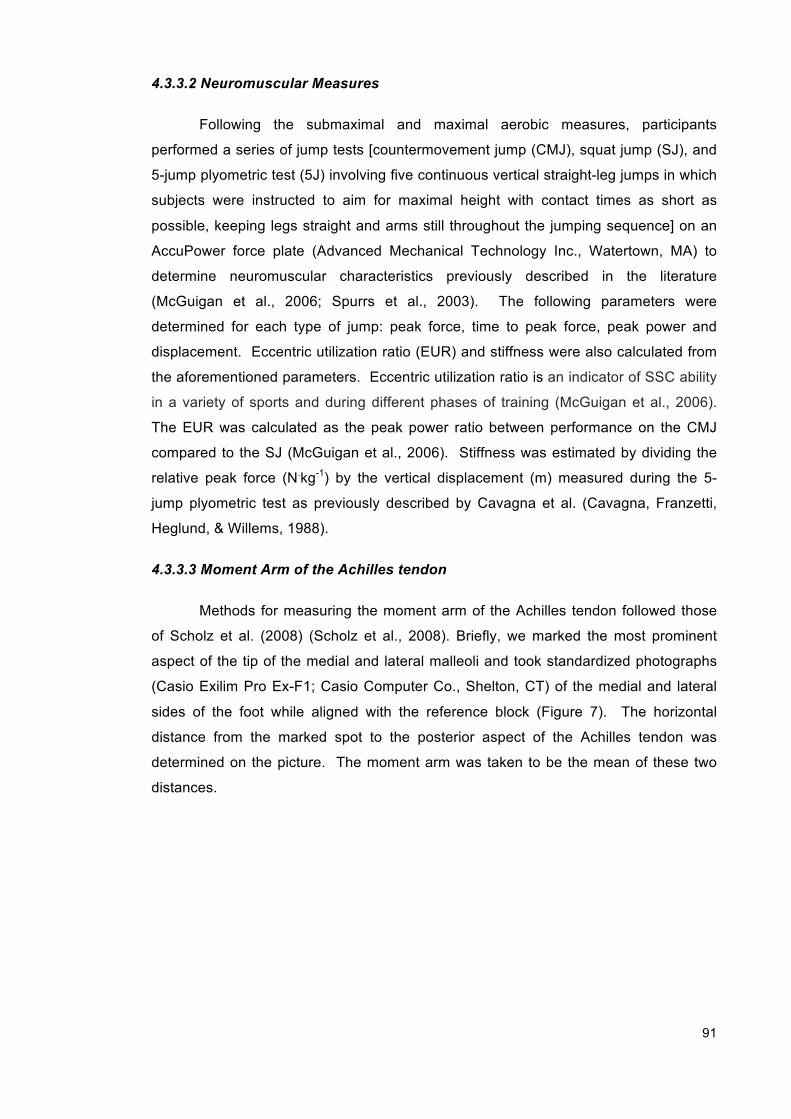
91
4.3.3.2 Neuromuscular Measures
Following the submaximal and maximal aerobic measures, participants
performed a series of jump tests [countermovement jump (CMJ), squat jump (SJ), and
5-jump plyometric test (5J) involving five continuous vertical straight-leg jumps in which
subjects were instructed to aim for maximal height with contact times as short as
possible, keeping legs straight and arms still throughout the jumping sequence] on an
AccuPower force plate (Advanced Mechanical Technology Inc., Watertown, MA) to
determine neuromuscular characteristics previously described in the literature
(McGuigan et al., 2006; Spurrs et al., 2003). The following parameters were
determined for each type of jump: peak force, time to peak force, peak power and
displacement. Eccentric utilization ratio (EUR) and stiffness were also calculated from
the aforementioned parameters. Eccentric utilization ratio is an indicator of SSC ability
in a variety of sports and during different phases of training (McGuigan et al., 2006).
The EUR was calculated as the peak power ratio between performance on the CMJ
compared to the SJ (McGuigan et al., 2006). Stiffness was estimated by dividing the
relative peak force (N.kg-1) by the vertical displacement (m) measured during the 5-
jump plyometric test as previously described by Cavagna et al. (Cavagna, Franzetti,
Heglund, & Willems, 1988).
4.3.3.3 Moment Arm of the Achilles tendon
Methods for measuring the moment arm of the Achilles tendon followed those
of Scholz et al. (2008) (Scholz et al., 2008). Briefly, we marked the most prominent
aspect of the tip of the medial and lateral malleoli and took standardized photographs
(Casio Exilim Pro Ex-F1; Casio Computer Co., Shelton, CT) of the medial and lateral
sides of the foot while aligned with the reference block (Figure 7). The horizontal
distance from the marked spot to the posterior aspect of the Achilles tendon was
determined on the picture. The moment arm was taken to be the mean of these two
distances.

92
Figure 7: Standardized picture of the medial and lateral sides of the right foot,
placed on, and aligned with a reference block. The horizontal distance from the medial
and lateral malleolus to the Achilles tendon was determined (while lines). Moment arm
was calculated as the mean of these two distances.
4.3.3.4 Statistical Analyses
Pearson’s product moment correlation coefficient was used to determine
relationships between running economy and functional lower body measures using
SPSS (IBM SPSS Version 19.0; Chicago Illinois). Resulting correlation coefficients
were converted into 90% confidence limits using a spreadsheet (Hopkins, 2007a). The
threshold values for small, moderate, large, very large and extremely large magnitudes
were 0.1, 0.3, 0.5, 0.7, and 0.9 of the correlation coefficient. The relationship between
running economy and Achilles tendon moment arm was fitted with a non-linear model
of the form y=ax-2+b, following Scholz et al. (2008) which corresponds to the model of
spring mechanics (assuming a linear spring where n = 1) (Scholz et al., 2008)
previously shown to predict running economy in humans (Raichlen et al., 2011; Scholz
et al., 2008). Comparisons of the differences between genders were made using a
spreadsheet to calculate effect size and the magnitude of differences were evaluated
non-clinically (Hopkins et al., 2009): if the confidence interval overlapped thresholds for
substantial positive and negative values (±0.20 standardized units, i.e., 0.20 of the
between-subject SD of the dependent in the pre-test), the effect was deemed unclear;
all other effects were reported as the magnitude of the observed value and were
evaluated probabilistically with threshold values of 0.20, 0.60, 1.2, 2.0 and 4.0 for
small, moderate, large, very large and extremely large respectively (Hopkins, 2007b;
Hopkins et al., 2009). The probabilities were reported qualitatively using the following
scale: 25-75%, possibly; 75-95%, likely; 95-99.5%, very likely; >99.5%, most likely
(Hopkins et al., 2009).
Figure 1. Standardized picture of the medial and lateral sides of the right foot, placed on, and aligned with, a reference block. The horizontal distance from the medial and lateral malleolus to the Achilles tendon was determined (white lines). Moment arm was calculated as the mean of these two distances.

93
4.4 Results
Descriptive characteristics of the runners are presented in Table 6. There was
no difference between males and females in age or training history, a large difference
in training volume and peak speed and very large difference between body mass, and
VO2max.
Aerobic profiles generated from the mean economy curves of male and female
runners are shown in Figure 8. At all common test velocities women were more
economical (lower VO2) than men (p = 0.13, ES = 0.40). However, the combination of
a very large difference in VO2max (p < 0.001, ES = 2.95) and similar economy slopes
resulted in a large difference (p < 0.001, ES = 1.91) in vVO2max. When men and
women were compared in terms of relative intensity at common running velocities
(Figure 8), males ran at a significantly lower percentage of their respective VO2maxes
(p < 0.001, ES = 2.41).
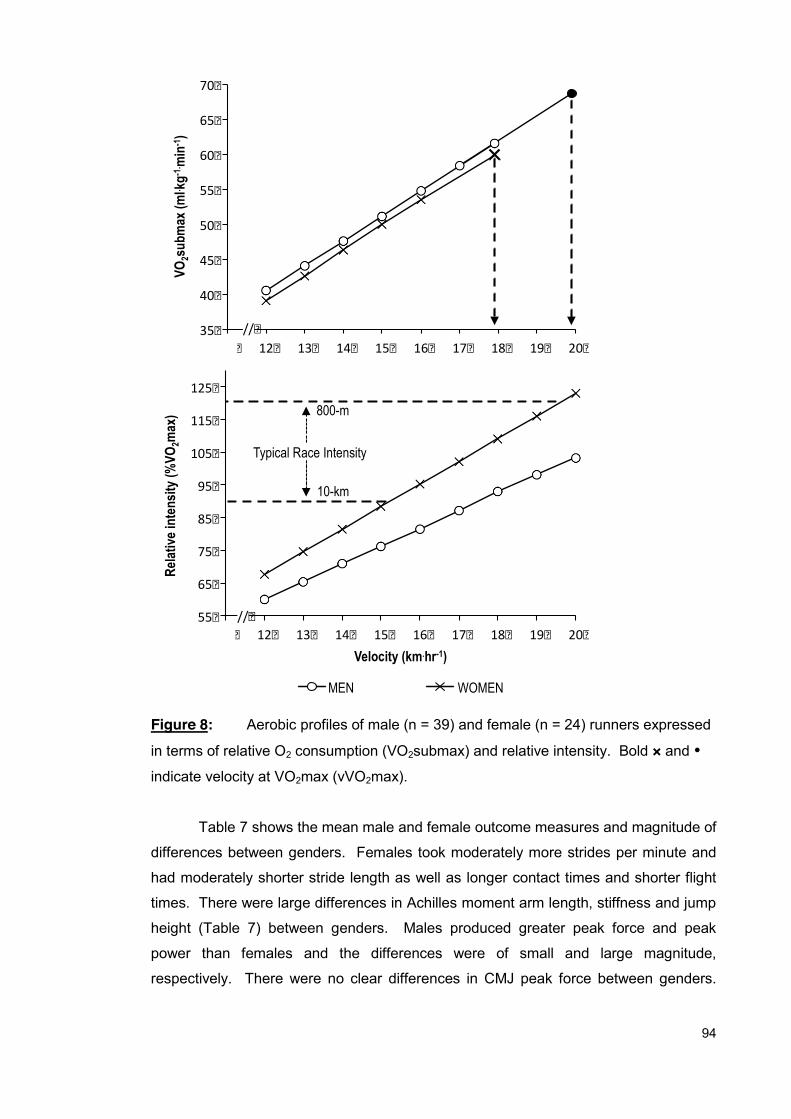
94
Figure 8: Aerobic profiles of male (n = 39) and female (n = 24) runners expressed
in terms of relative O2 consumption (VO2submax) and relative intensity. Bold × and y
indicate velocity at VO2max (vVO2max).
Table 7 shows the mean male and female outcome measures and magnitude of
differences between genders. Females took moderately more strides per minute and
had moderately shorter stride length as well as longer contact times and shorter flight
times. There were large differences in Achilles moment arm length, stiffness and jump
height (Table 7) between genders. Males produced greater peak force and peak
power than females and the differences were of small and large magnitude,
respectively. There were no clear differences in CMJ peak force between genders.
35�
40�
45�
50�
55�
60�
65�
70�
11� 12� 13� 14� 15� 16� 17� 18� 19� 20�
VO2s
ubm
ax (m
l. kg-1
. min
-1)
55�
65�
75�
85�
95�
105�
115�
125�
11� 12� 13� 14� 15� 16� 17� 18� 19� 20�
Relat
ive in
tens
ity (%
VO2m
ax)
Velocity (km.hr-1)
MEN WOMEN
//�
//�
Typical Race Intensity
10-km
800-m
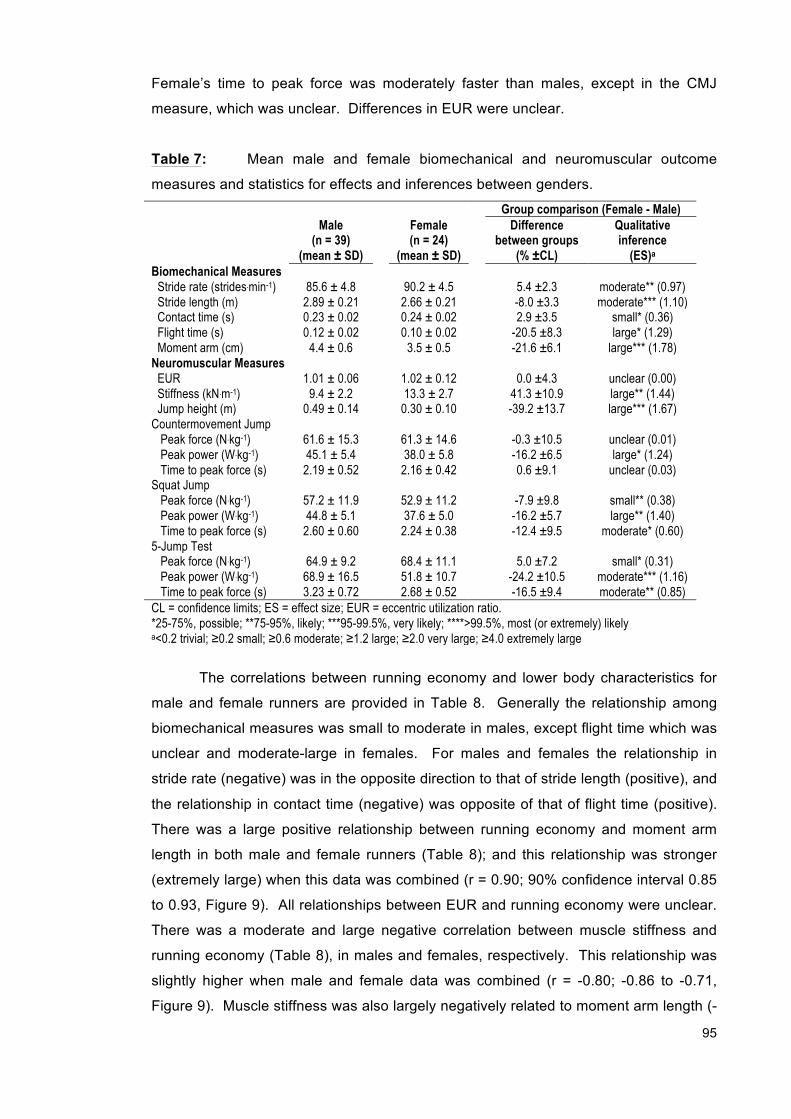
95
Female’s time to peak force was moderately faster than males, except in the CMJ
measure, which was unclear. Differences in EUR were unclear.
Table 7: Mean male and female biomechanical and neuromuscular outcome
measures and statistics for effects and inferences between genders.
Group comparison (Female - Male)
Male (n = 39)
(mean ± SD)
Female (n = 24)
(mean ± SD)
Difference between groups
(% ±CL)
Qualitative inference
(ES)a Biomechanical Measures Stride rate (strides.min-1) 85.6 ± 4.8 90.2 ± 4.5 5.4 ±2.3 moderate** (0.97) Stride length (m) 2.89 ± 0.21 2.66 ± 0.21 -8.0 ±3.3 moderate*** (1.10) Contact time (s) 0.23 ± 0.02 0.24 ± 0.02 2.9 ±3.5 small* (0.36) Flight time (s) 0.12 ± 0.02 0.10 ± 0.02 -20.5 ±8.3 large* (1.29) Moment arm (cm) 4.4 ± 0.6 3.5 ± 0.5 -21.6 ±6.1 large*** (1.78) Neuromuscular Measures EUR 1.01 ± 0.06 1.02 ± 0.12 0.0 ±4.3 unclear (0.00) Stiffness (kN.m-1) 9.4 ± 2.2 13.3 ± 2.7 41.3 ±10.9 large** (1.44) Jump height (m) 0.49 ± 0.14 0.30 ± 0.10 -39.2 ±13.7 large*** (1.67) Countermovement Jump Peak force (N.kg-1) 61.6 ± 15.3 61.3 ± 14.6 -0.3 ±10.5 unclear (0.01) Peak power (W.kg-1) 45.1 ± 5.4 38.0 ± 5.8 -16.2 ±6.5 large* (1.24) Time to peak force (s) 2.19 ± 0.52 2.16 ± 0.42 0.6 ±9.1 unclear (0.03) Squat Jump Peak force (N.kg-1) 57.2 ± 11.9 52.9 ± 11.2 -7.9 ±9.8 small** (0.38) Peak power (W.kg-1) 44.8 ± 5.1 37.6 ± 5.0 -16.2 ±5.7 large** (1.40) Time to peak force (s) 2.60 ± 0.60 2.24 ± 0.38 -12.4 ±9.5 moderate* (0.60) 5-Jump Test Peak force (N.kg-1) 64.9 ± 9.2 68.4 ± 11.1 5.0 ±7.2 small* (0.31) Peak power (W.kg-1) 68.9 ± 16.5 51.8 ± 10.7 -24.2 ±10.5 moderate*** (1.16) Time to peak force (s) 3.23 ± 0.72 2.68 ± 0.52 -16.5 ±9.4 moderate** (0.85) CL = confidence limits; ES = effect size; EUR = eccentric utilization ratio. *25-75%, possible; **75-95%, likely; ***95-99.5%, very likely; ****>99.5%, most (or extremely) likely
a<0.2 trivial; ≥0.2 small; ≥0.6 moderate; ≥1.2 large; ≥2.0 very large; ≥4.0 extremely large
The correlations between running economy and lower body characteristics for
male and female runners are provided in Table 8. Generally the relationship among
biomechanical measures was small to moderate in males, except flight time which was
unclear and moderate-large in females. For males and females the relationship in
stride rate (negative) was in the opposite direction to that of stride length (positive), and
the relationship in contact time (negative) was opposite of that of flight time (positive).
There was a large positive relationship between running economy and moment arm
length in both male and female runners (Table 8); and this relationship was stronger
(extremely large) when this data was combined (r = 0.90; 90% confidence interval 0.85
to 0.93, Figure 9). All relationships between EUR and running economy were unclear.
There was a moderate and large negative correlation between muscle stiffness and
running economy (Table 8), in males and females, respectively. This relationship was
slightly higher when male and female data was combined (r = -0.80; -0.86 to -0.71,
Figure 9). Muscle stiffness was also largely negatively related to moment arm length (-

96
0.82; -0.88 to -0.74, Figure 9). There were moderate and large correlations between
running economy and jump height in males and females respectively. Most other
correlations between running economy and jump related measures (peak force, peak
power and time to peak force) for males and females were unclear (Table 8).
Table 8: Correlations between running economy (ml.kg-1.min-1) and lower body
characteristics in male and female distance runners. Male
(n = 39) Female
(n = 24)
Correlationa with 90% ±CL
Qualitative inference
Correlationa with 90% ±CL
Qualitative inference
Biomechanical Measures Stride rate (strides.min-1) -0.27 ±0.25 -ive** -0.31 ±0.31 -ive** Stride length (m) 0.32 ±0.24 +ive** 0.49 ±0.19 +ive**** Contact time (s) -0.21 ±0.26 -ive* -0.54 ±0.25 -ive** Flight time (s) 0.06 ±0.27 unclear 0.74 ±0.17 +ive**** Moment arm (cm) 0.82 ±0.09 +ive**** 0.81 ±0.13 +ive**** Neuromuscular Measures EUR 0.04 ±0.27 unclear -0.02 ±0.34 unclear Stiffness (kN.m-1) -0.57 ±0.19 -ive**** -0.76 ±0.16 -ive**** Jump height (m) 0.39 ±0.23 +ive*** 0.66 ±0.21 +ive**** Countermovement Jump Peak force (N.kg-1) -0.14 ±0.37 unclear 0.05 ±0.34 unclear Peak power (W.kg-1) -0.14 ±0.37 unclear 0.28 ±0.32 +ive** Time to peak force 0.21 ±0.26 +ive* 0.20 ±0.33 unclear Squat Jump Peak force (N.kg-1) 0.28 ±0.25 +ive** 0.03 ±0.34 unclear Peak power (W.kg-1) -0.04 ±0.27 unclear 0.38 ±0.30 +ive** Time to peak force 0.17 ±0.26 unclear 0.16 ±0.34 unclear 5-Jump Test Peak force (N.kg-1) -0.19 ±0.26 -ive* -0.03 ±0.34 unclear Peak power (W.kg-1) -0.06 ±0.27 unclear 0.59 ±0.24 +ive**** Time to peak force 0.05 ±0.27 unclear 0.16 ±0.34 unclear *25-75%, possible; **75-95%, likely; ***95-99.5%, very likely; ****>99.5%, most (or extremely) likely a<0.0 trivial; ≥0.1 small; ≥0.3 moderate; ≥0.5 large; ≥0.7 very large; ≥0.9 extremely large; 1.0 perfect
97
Figure 9: Correlation between running economy at 14 km.hr-1 and Achilles moment arm length (r = 0.90), running economy at 14 km.hr-1 and leg
stiffness (r = -0.80), and leg stiffness and Achilles moment arm length (r = -0.82) for all runners.
.
40
42
44
46
48
50
52
54
56
58
60
2.5 3 3.5 4 4.5 5 5.5
VO2s
ubm
ax (m
l. kg-1
. min
-1)
Moment Arm (cm)
40
42
44
46
48
50
52
54
56
58
60
5 6 7 8 9 10 11 12 13 14 15 16 17
VO2s
ubm
ax (m
l. kg-1
. min
-1)
Stiffness (kN.m-1)
Male Female
5 6 7 8 9
10 11 12 13 14 15 16 17
2.5 3 3.5 4 4.5 5 5.5
Stiff
ness
(kN. m
-1)
Moment Arm (cm)
Figure 3. Correlation between running economy at 14 km.hr-1 and moment arm (r = 0.90), running economy 14 km.hr-1 and leg stiffness (r = -0.80), and leg stiffness and moment arm length (r = -0.82) for all runners.
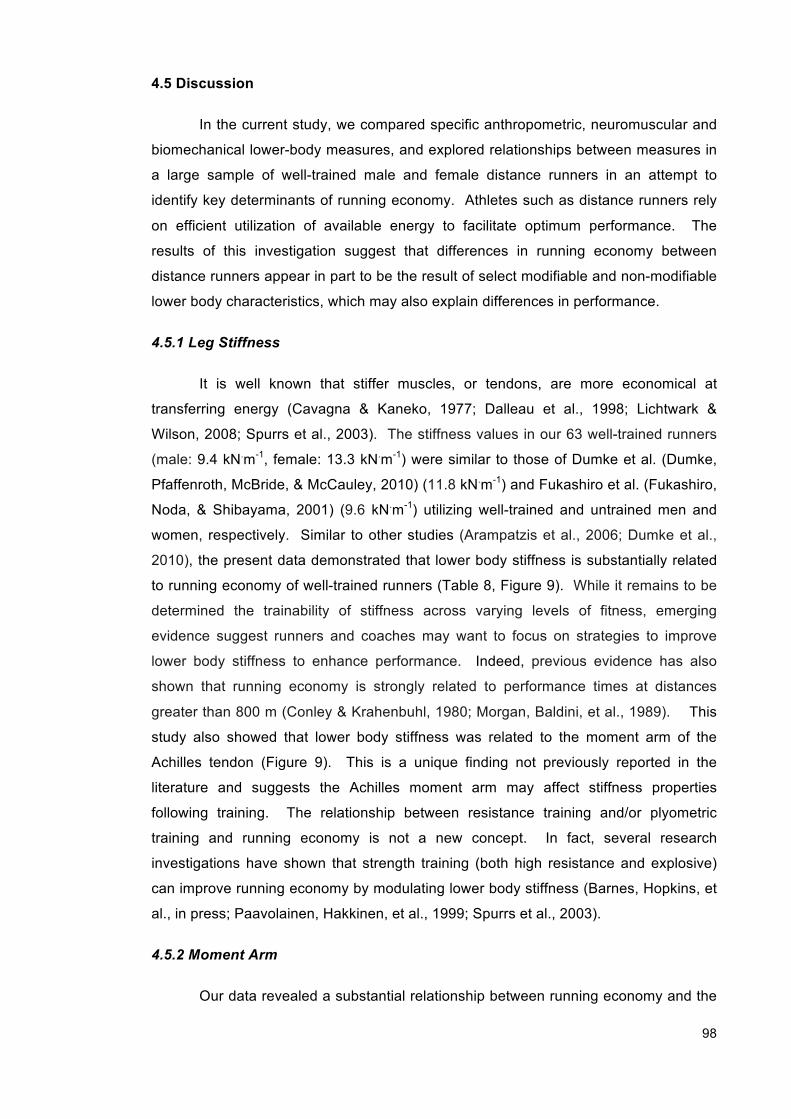
98
4.5 Discussion
In the current study, we compared specific anthropometric, neuromuscular and
biomechanical lower-body measures, and explored relationships between measures in
a large sample of well-trained male and female distance runners in an attempt to
identify key determinants of running economy. Athletes such as distance runners rely
on efficient utilization of available energy to facilitate optimum performance. The
results of this investigation suggest that differences in running economy between
distance runners appear in part to be the result of select modifiable and non-modifiable
lower body characteristics, which may also explain differences in performance.
4.5.1 Leg Stiffness
It is well known that stiffer muscles, or tendons, are more economical at
transferring energy (Cavagna & Kaneko, 1977; Dalleau et al., 1998; Lichtwark &
Wilson, 2008; Spurrs et al., 2003). The stiffness values in our 63 well-trained runners
(male: 9.4 kN.m-1, female: 13.3 kN.m-1) were similar to those of Dumke et al. (Dumke,
Pfaffenroth, McBride, & McCauley, 2010) (11.8 kN.m-1) and Fukashiro et al. (Fukashiro,
Noda, & Shibayama, 2001) (9.6 kN.m-1) utilizing well-trained and untrained men and
women, respectively. Similar to other studies (Arampatzis et al., 2006; Dumke et al.,
2010), the present data demonstrated that lower body stiffness is substantially related
to running economy of well-trained runners (Table 8, Figure 9). While it remains to be
determined the trainability of stiffness across varying levels of fitness, emerging
evidence suggest runners and coaches may want to focus on strategies to improve
lower body stiffness to enhance performance. Indeed, previous evidence has also
shown that running economy is strongly related to performance times at distances
greater than 800 m (Conley & Krahenbuhl, 1980; Morgan, Baldini, et al., 1989). This
study also showed that lower body stiffness was related to the moment arm of the
Achilles tendon (Figure 9). This is a unique finding not previously reported in the
literature and suggests the Achilles moment arm may affect stiffness properties
following training. The relationship between resistance training and/or plyometric
training and running economy is not a new concept. In fact, several research
investigations have shown that strength training (both high resistance and explosive)
can improve running economy by modulating lower body stiffness (Barnes, Hopkins, et
al., in press; Paavolainen, Hakkinen, et al., 1999; Spurrs et al., 2003).
4.5.2 Moment Arm
Our data revealed a substantial relationship between running economy and the
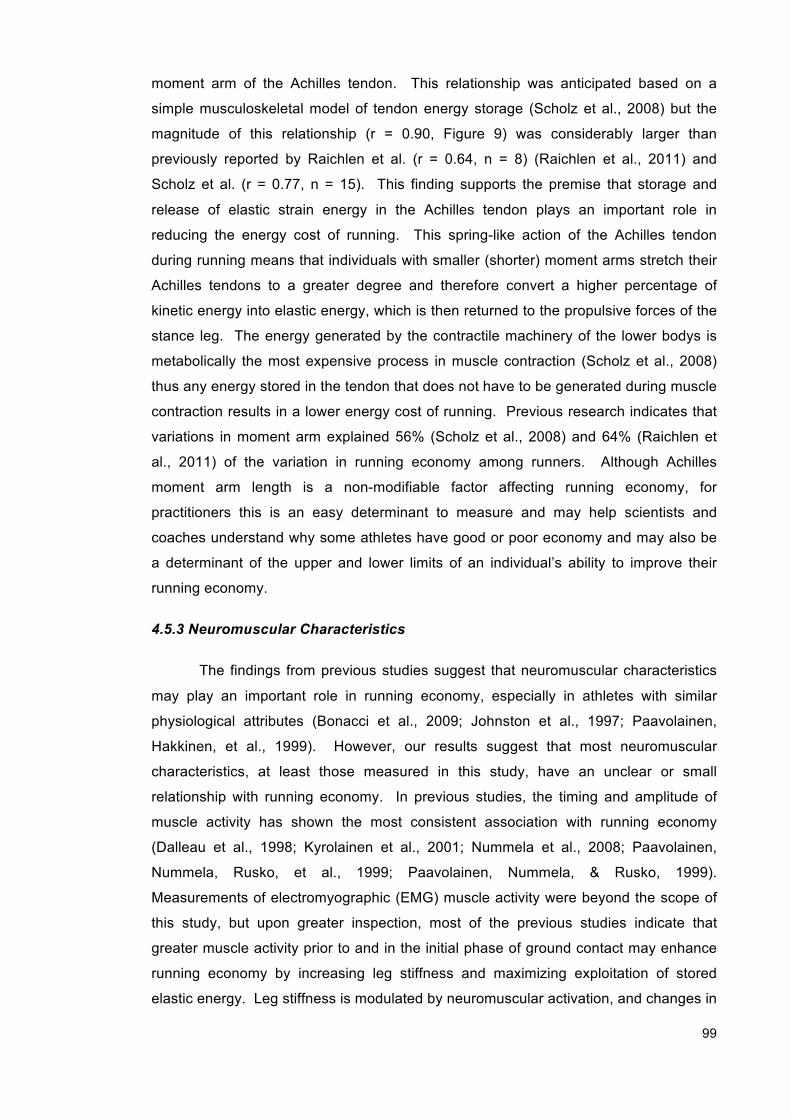
99
moment arm of the Achilles tendon. This relationship was anticipated based on a
simple musculoskeletal model of tendon energy storage (Scholz et al., 2008) but the
magnitude of this relationship (r = 0.90, Figure 9) was considerably larger than
previously reported by Raichlen et al. (r = 0.64, n = 8) (Raichlen et al., 2011) and
Scholz et al. (r = 0.77, n = 15). This finding supports the premise that storage and
release of elastic strain energy in the Achilles tendon plays an important role in
reducing the energy cost of running. This spring-like action of the Achilles tendon
during running means that individuals with smaller (shorter) moment arms stretch their
Achilles tendons to a greater degree and therefore convert a higher percentage of
kinetic energy into elastic energy, which is then returned to the propulsive forces of the
stance leg. The energy generated by the contractile machinery of the lower bodys is
metabolically the most expensive process in muscle contraction (Scholz et al., 2008)
thus any energy stored in the tendon that does not have to be generated during muscle
contraction results in a lower energy cost of running. Previous research indicates that
variations in moment arm explained 56% (Scholz et al., 2008) and 64% (Raichlen et
al., 2011) of the variation in running economy among runners. Although Achilles
moment arm length is a non-modifiable factor affecting running economy, for
practitioners this is an easy determinant to measure and may help scientists and
coaches understand why some athletes have good or poor economy and may also be
a determinant of the upper and lower limits of an individual’s ability to improve their
running economy.
4.5.3 Neuromuscular Characteristics
The findings from previous studies suggest that neuromuscular characteristics
may play an important role in running economy, especially in athletes with similar
physiological attributes (Bonacci et al., 2009; Johnston et al., 1997; Paavolainen,
Hakkinen, et al., 1999). However, our results suggest that most neuromuscular
characteristics, at least those measured in this study, have an unclear or small
relationship with running economy. In previous studies, the timing and amplitude of
muscle activity has shown the most consistent association with running economy
(Dalleau et al., 1998; Kyrolainen et al., 2001; Nummela et al., 2008; Paavolainen,
Nummela, Rusko, et al., 1999; Paavolainen, Nummela, & Rusko, 1999).
Measurements of electromyographic (EMG) muscle activity were beyond the scope of
this study, but upon greater inspection, most of the previous studies indicate that
greater muscle activity prior to and in the initial phase of ground contact may enhance
running economy by increasing leg stiffness and maximizing exploitation of stored
elastic energy. Leg stiffness is modulated by neuromuscular activation, and changes in
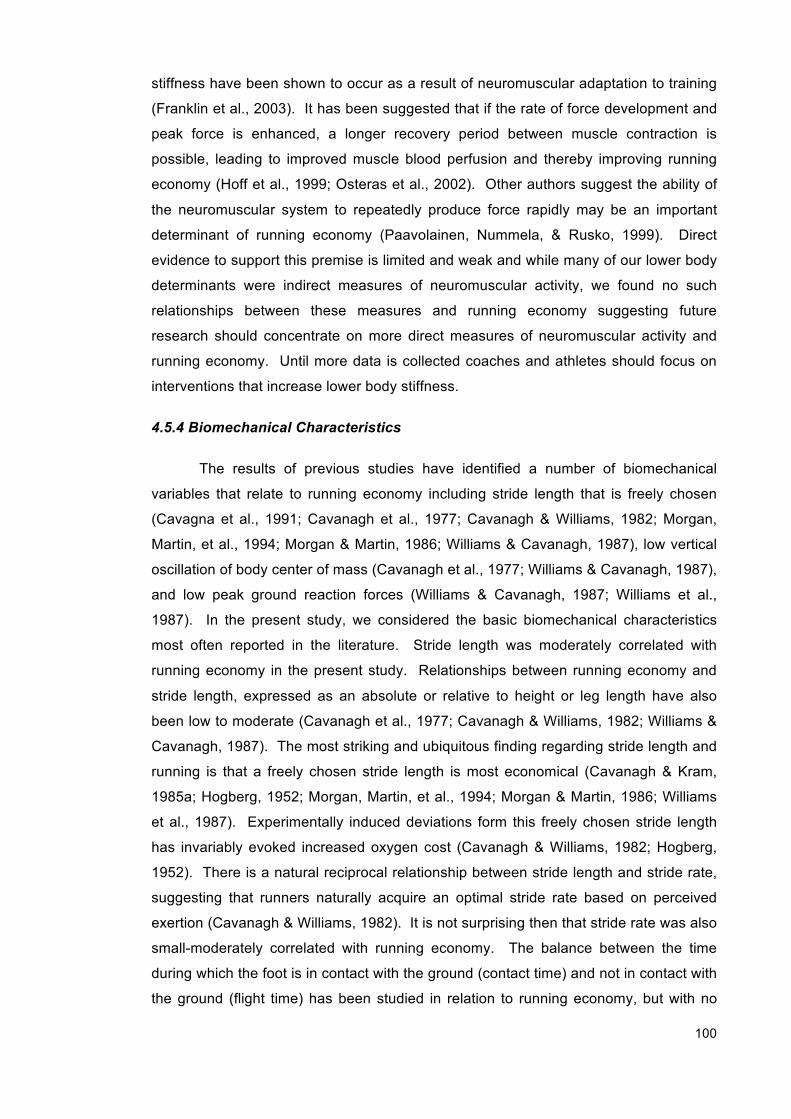
100
stiffness have been shown to occur as a result of neuromuscular adaptation to training
(Franklin et al., 2003). It has been suggested that if the rate of force development and
peak force is enhanced, a longer recovery period between muscle contraction is
possible, leading to improved muscle blood perfusion and thereby improving running
economy (Hoff et al., 1999; Osteras et al., 2002). Other authors suggest the ability of
the neuromuscular system to repeatedly produce force rapidly may be an important
determinant of running economy (Paavolainen, Nummela, & Rusko, 1999). Direct
evidence to support this premise is limited and weak and while many of our lower body
determinants were indirect measures of neuromuscular activity, we found no such
relationships between these measures and running economy suggesting future
research should concentrate on more direct measures of neuromuscular activity and
running economy. Until more data is collected coaches and athletes should focus on
interventions that increase lower body stiffness.
4.5.4 Biomechanical Characteristics
The results of previous studies have identified a number of biomechanical
variables that relate to running economy including stride length that is freely chosen
(Cavagna et al., 1991; Cavanagh et al., 1977; Cavanagh & Williams, 1982; Morgan,
Martin, et al., 1994; Morgan & Martin, 1986; Williams & Cavanagh, 1987), low vertical
oscillation of body center of mass (Cavanagh et al., 1977; Williams & Cavanagh, 1987),
and low peak ground reaction forces (Williams & Cavanagh, 1987; Williams et al.,
1987). In the present study, we considered the basic biomechanical characteristics
most often reported in the literature. Stride length was moderately correlated with
running economy in the present study. Relationships between running economy and
stride length, expressed as an absolute or relative to height or leg length have also
been low to moderate (Cavanagh et al., 1977; Cavanagh & Williams, 1982; Williams &
Cavanagh, 1987). The most striking and ubiquitous finding regarding stride length and
running is that a freely chosen stride length is most economical (Cavanagh & Kram,
1985a; Hogberg, 1952; Morgan, Martin, et al., 1994; Morgan & Martin, 1986; Williams
et al., 1987). Experimentally induced deviations form this freely chosen stride length
has invariably evoked increased oxygen cost (Cavanagh & Williams, 1982; Hogberg,
1952). There is a natural reciprocal relationship between stride length and stride rate,
suggesting that runners naturally acquire an optimal stride rate based on perceived
exertion (Cavanagh & Williams, 1982). It is not surprising then that stride rate was also
small-moderately correlated with running economy. The balance between the time
during which the foot is in contact with the ground (contact time) and not in contact with
the ground (flight time) has been studied in relation to running economy, but with no
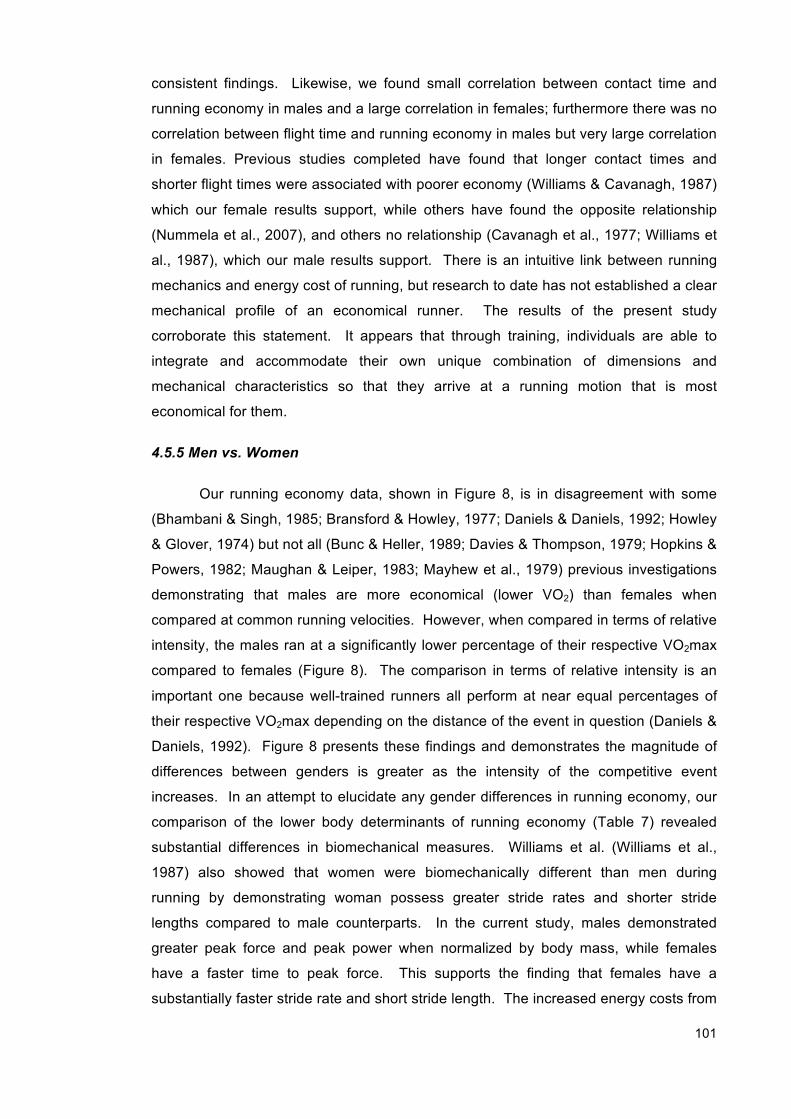
101
consistent findings. Likewise, we found small correlation between contact time and
running economy in males and a large correlation in females; furthermore there was no
correlation between flight time and running economy in males but very large correlation
in females. Previous studies completed have found that longer contact times and
shorter flight times were associated with poorer economy (Williams & Cavanagh, 1987)
which our female results support, while others have found the opposite relationship
(Nummela et al., 2007), and others no relationship (Cavanagh et al., 1977; Williams et
al., 1987), which our male results support. There is an intuitive link between running
mechanics and energy cost of running, but research to date has not established a clear
mechanical profile of an economical runner. The results of the present study
corroborate this statement. It appears that through training, individuals are able to
integrate and accommodate their own unique combination of dimensions and
mechanical characteristics so that they arrive at a running motion that is most
economical for them.
4.5.5 Men vs. Women
Our running economy data, shown in Figure 8, is in disagreement with some
(Bhambani & Singh, 1985; Bransford & Howley, 1977; Daniels & Daniels, 1992; Howley
& Glover, 1974) but not all (Bunc & Heller, 1989; Davies & Thompson, 1979; Hopkins &
Powers, 1982; Maughan & Leiper, 1983; Mayhew et al., 1979) previous investigations
demonstrating that males are more economical (lower VO2) than females when
compared at common running velocities. However, when compared in terms of relative
intensity, the males ran at a significantly lower percentage of their respective VO2max
compared to females (Figure 8). The comparison in terms of relative intensity is an
important one because well-trained runners all perform at near equal percentages of
their respective VO2max depending on the distance of the event in question (Daniels &
Daniels, 1992). Figure 8 presents these findings and demonstrates the magnitude of
differences between genders is greater as the intensity of the competitive event
increases. In an attempt to elucidate any gender differences in running economy, our
comparison of the lower body determinants of running economy (Table 7) revealed
substantial differences in biomechanical measures. Williams et al. (Williams et al.,
1987) also showed that women were biomechanically different than men during
running by demonstrating woman possess greater stride rates and shorter stride
lengths compared to male counterparts. In the current study, males demonstrated
greater peak force and peak power when normalized by body mass, while females
have a faster time to peak force. This supports the finding that females have a
substantially faster stride rate and short stride length. The increased energy costs from
102
a higher stride rate due to various kinetic and kinematic patterns involved in a faster
gait cycle may be an explanation for why in some studies females are less economical
than male runners.
In summary, despite some substantial correlations between some lower body
measures and running economy, it appears that no single lower body measure can
completely explain differences in running economy within and between genders. Other
factors such as body lengths, mass distribution, fiber type, vertical oscillation, footstrike
patterns, and other kinetic and kinematics are also likely to affect running economy.
Running economy is therefore likely determined from the sum of influences from
multiple lower-body attributes.
4.6 Practical Applications
Many of the lower body characteristics measured in this study represent
specific or independent qualities of running economy that can be assessed and trained
independently. Given the strong relationship between running economy and stiffness
as indicated by our results, perhaps a greater efficiency of training can be achieved by
targeting interventions that increase leg stiffness to improve running economy. The
Achilles moment arm length is a non-modifiable determinant related to running
economy and appears to provide the practitioner with information about the stiffness of
the lower body which may elucidate an athlete’s potential to improve their running
economy, however more data is needed to validate this. The data we have presented
here for a variety of lower body measures commonly measured in athletes gives an
indication of normative ranges for well-trained male and female runners.
4.7 Acknowledgements
The authors would like to thank the subjects for their participation. The authors
have no professional relationship with a for-profit organization that would benefit from
this study and no financial assistance with the project was received.
103
CHAPTER 5: WARM-UP WITH A WEIGHTED VEST IMPROVES RUNNING PERFORMANCE VIA LEG STIFFNESS AND RUNNING ECONOMY
5.1 Abstract
A bout of resistance exercise can enhance subsequent high-intensity
performance, but little is known about such priming exercise for endurance
performance. Objectives To determine the effects of "strides" with a weighted-vest
during a warm-up on endurance performance and its potential neuromuscular and
metabolic mediators. Design A crossover with 5-7 days between an experimental and
control trial was performed by 11 well-trained distance runners. Methods Each trial
was preceded by a warm-up consisting of a 10-min self-paced jog, a 5-min submaximal
run to determine running economy, and six 10-s strides with or without a weighted-vest
(20% of body mass). After a 10-min recovery period, runners performed a series of
jumps to determine leg stiffness and other neuromuscular characteristics, another 5-
min submaximal run, and an incremental treadmill test to determine peak running
speed. Clinical and non-clinical forms of magnitude-based inference were used to
assess outcomes. Correlations and linear regression were used to assess relationships
between performance and underlying measures. Results The weighted-vest condition
resulted in a very-large enhancement of peak running speed (2.9%; 90% confidence
limits ±0.8%), a moderate increase in leg stiffness (20.4%; ±4.2%) and a large
improvement in running economy (6.0%; ±1.6%); there were also small-moderate clear
reductions in cardiorespiratory measures. Relationships between change scores
showed that changes in leg stiffness could explain all the improvements in performance
and economy. Conclusions Strides with a weighted-vest have a priming effect on leg
stiffness and running economy. It is postulated the associated major effect on peak
treadmill running speed will translate into enhancement of competitive endurance
performance.
104
5.2 Introduction
Prior warm-up activities are a widely accepted practice preceding nearly every
athletic event to prepare the body for optimal competition performance (Bishop, 2003).
An active warm up is arguably the most widely used warm-up technique for distance
runners because it is likely to induce specific metabolic and cardiovascular changes
conducive to distance-running performance (Bishop, 2003). Recent research has
focused on various warm-up exercises that can alter oxygen uptake (VO2) kinetic
responses to subsequent high-intensity exercise and enhance performance (Bishop et
al., 2001; Hajoglou et al., 2005; Ingham et al., 2013). However, neuromuscular
characteristics have also been recognized as an important determinant of endurance
performance (Paavolainen, Hakkinen, et al., 1999). Indeed, different training regimens
have demonstrated concomitant improvements in neuromuscular measures, running
economy and distance running performance (Paavolainen, Hakkinen, et al., 1999;
Spurrs et al., 2003). Subsequently, the evaluation of neuromuscular characteristics
has become an important consideration for running economy and performance, but no
research has examined modifying these parameters acutely by different warm-up
interventions to improve distance running performance.
Post-activation potentiation is a well-recognized phenomenon that involves the
preconditioning of muscle through heavy exercise to induce acute improvements in
performance during sprinting, running and weightlifting activities (Hodgson et al., 2005;
Tillin & Bishop, 2009). A common method used by athletes to facilitate post-activation
potentiation response is performing sport specific movement patterns while wearing a
weighted vest that provides additional resistance to movement. Several studies have
examined the long-term influence of training with such additional loads on various
metabolic and lower-extremity parameters in various athletes with positive results
(Bosco, Rusko, & Hirvonen, 1986; Bosco et al., 1984; Rusko & Bosco, 1987).
Specifically in endurance runners, Rusco and Bosco (Rusko & Bosco, 1987) observed
an improvement in running performance and peak speed in addition to a reduction in
oxygen uptake during submaximal running after four weeks of wearing a weighted vest
in 12 well-trained endurance athletes. The authors credited the increase in muscle
activation as the principal explanation for the observed changes (Rusko & Bosco,
1987). It is unknown whether other short-term changes in muscle conditioning can be
achieved acutely with bouts of high-intensity exercise while wearing a weighted vest for
the purpose of performance enhancement. Therefore, the purpose of the present
study was to determine the acute effects of wearing such a vest during warm-up
"strides" (short-duration near-maximal sprints) on neuromuscular measures, running
economy and distance running performance in trained runners.
105
5.3 Methods
Eleven well-trained male distance runners took part in the study. The mean ±
SD body mass: 67.4 ± 10.5 kg, height: 177.6 ± 10.4 cm, and age of subjects was 29.8
± 4.3 y with an average training history of 8.4 ± 4.4 y and 5-km personal best of 16.0
±1.0 min. Subjects undertook 105.6 ± 30.9 km of running per week in the six weeks
leading up to the study. The study was approved by the Auckland University of
Technology Ethics Committee; Auckland, New Zealand, and all participants provided
informed written consent to participate.
Athletes reported to the laboratory 2 hours post-prandial and having avoided
strenuous exercise in the 24 hours preceding a test session. All running tests were
performed in controlled laboratory conditions (19-21°C; 65%rH) run on a motorized
treadmill (HP Cosmos Saturn, Traunstein, Germany). Participants initial visit involved a
familiarization session with all testing procedures and equipment. Thereafter,
participants completed two incremental peak running speed performance trials (in a
crossover experimental design), preceded by two different warm-up conditions, in
random order, at the same time of day, separated by at least 5 days (Figure 10).

106
Figure 10: Schematic representation of crossover experimental design, indicating the control and weighted vest conditions. Two submaximal runs
were included to assess differences in running economy and other submaximal measures within and between conditions. The 6 × 10 s strides and
recovery period were completed in a cross-over manner. The 10-min recovery period was included to simulate the “holding‟ procedures that athletes
often experience prior to major competitions. All other running and jump tests were completed at normal body weight. Jump tests were included to
assess neuromuscular characteristics, and the incremental test assessed peak running speed and VO2max.
107
Each performance trial was preceded by a 10 min self-paced jog followed by 5
min bout of submaximal running at 14 km.h−1 (1.0% gradient) during which expired gas
samples were measured continuously using a metabolic cart (ParvoMedics TrueOne
2400, Salt Lake City, USA) for determination of VO2, carbon dioxide production, minute
ventilation and respiratory exchange ratio. Running economy, minute ventilation,
respiratory exchange ratio and heart rate were determined from mean data during the
last two minutes of each submaximal steady-state run. At the end of the submaximal
steady-state run each subjects rating of perceived exertion (RPE) was assessed using
a standardized Borg RPE scale (Borg, 1970).
Subsequently, in the control condition, participants performed 6 × 10-s strides,
with a walk-back recovery (~60 s). This warm-up procedure was similar to that which
athletes would ordinarily complete prior to a competition. In the intervention trial,
participants completed the same 6 × 10-s strides while wearing a weighted vest that
was equivalent to 20% of the subjects body mass. Runners understood that the speed
of strides in the control and weighted-vest conditions were to be completed at each
subject’s ~1500 m race pace. The respective warm-up procedures were followed by
10 min of recovery, which was included to simulate the "holding" procedures that
athletes often experience prior to major track competitions, followed by a series of jump
tests to determine neuromuscular characteristics, then the peak-speed performance
trial which commenced 15 min following the warm-up. Prior to the performance trial the
participants ‟perceived race readiness‟ was assessed using the 1-10 scale of Ingham
et al (Ingham et al., 2013).
The performance test involved a 5-min submaximal run at 14 km.h−1 (1.0%
gradient) followed immediately by an incremental test. During the incremental portion of
the performance test, the speed increasing by 1 km.h−1 every minute until a speed of 18
km.h−1 was reached, thereafter, the gradient increased by 1% every minute until
volitional exhaustion. Each subjects RPE was reassessed at the end of the 5-min
steady-state run. Heart rate and pulmonary gas-exchange were measured
continuously. The peak speed reached at the end of the test was determined as: S =
ST + (ST × 0.045) × i; where S = peak speed in km.h-1, ST = treadmill speed in km.h-1,
and i = treadmill inclination in percent (Brooks et al., 1996).
Subjects performed a series of jump tests [2 × countermovement jump (CMJ),
squat jump (SJ), and 5-jump plyometric test (5J)] on an AccuPower force plate
(Advanced Mechanical Technology Inc., Watertown, MA) to determine neuromuscular
characteristics previously described in the literature (McGuigan et al., 2006; Spurrs et
al., 2003). The best result from the following parameters was determined for each type

108
of jump: peak force, time to peak force, peak power and displacement. Eccentric
utilization ratio (EUR) and stiffness were also calculated from the aforementioned
parameters. The eccentric utilization ratio was calculated as the peak power ratio
between performance on the CMJ compared to the SJ (McGuigan et al., 2006).
Stiffness was estimated by dividing the relative peak force (N.kg-1) by the vertical
displacement (m) measured during the 5-jump test (Cavagna et al., 1988).
The effects of warm-up condition on performance, physiological and
neuromuscular measures were analyzed with a spreadsheet for post-only crossovers
(Hopkins, 2006). The pre-test value of the dependent variable was included as a
covariate to improve precision of the estimate of the effects. Submaximal running
measures obtained during the 5-min submaximal run both pre and post warm-up
(Figure 10) were also analyzed with a pre-post crossover spreadsheet (Hopkins, 2006).
Effects were estimated in percent units via log transformation, and uncertainty in the
estimate was expressed as 90% confidence limits. The effect size (ES), which
represents the magnitude of the difference between the two conditions in terms of SD,
was calculated from the log-transformed data by dividing the change in the mean by
the average SD of the two conditions. The outcome for performance (peak speed) was
evaluated with the clinical version of magnitude-based inference: the effect was
deemed unclear if the chance of benefit was sufficiently high (>25%) to warrant its use
with athletes but the risk of harm was unacceptable (>0.5%); the effect was otherwise
deemed clear and reported as the magnitude of the observed effect and the qualitative
probability that the true magnitude was at least as large as the observed magnitude.
The threshold values for assessing the magnitude of small, moderate and large, very
large and extremely large effects were respectively 0.3, 0.9, 1.6, 2.5 and 4.0 times the
within-subject standard deviation a top athlete would show between competitions
(Hopkins et al., 2009). For distance runners this standard deviation was
0.8%,(Hopkins, 2005) so the thresholds were 0.24%, 0.72%, 1.3%, 2.0% and 3.2%.
Probabilities were reported using the following scale: 25-75%, possibly; 75-95%, likely;
95-99.5%, very likely; >99.5%, most likely. Magnitudes of effects on measures other
than performance were evaluated non-clinically: if the confidence interval overlapped
thresholds for small positive and negative values, the effect was deemed unclear; all
other effects were reported as the magnitude of the observed value and were
evaluated probabilistically as described above, except that threshold values for small,
moderate, large, very large and extremely large effects were 0.2, 0.6, 1.2, 2.0 and 4.0
of the between-subject standard deviation in the control condition (Hopkins et al.,
2009).
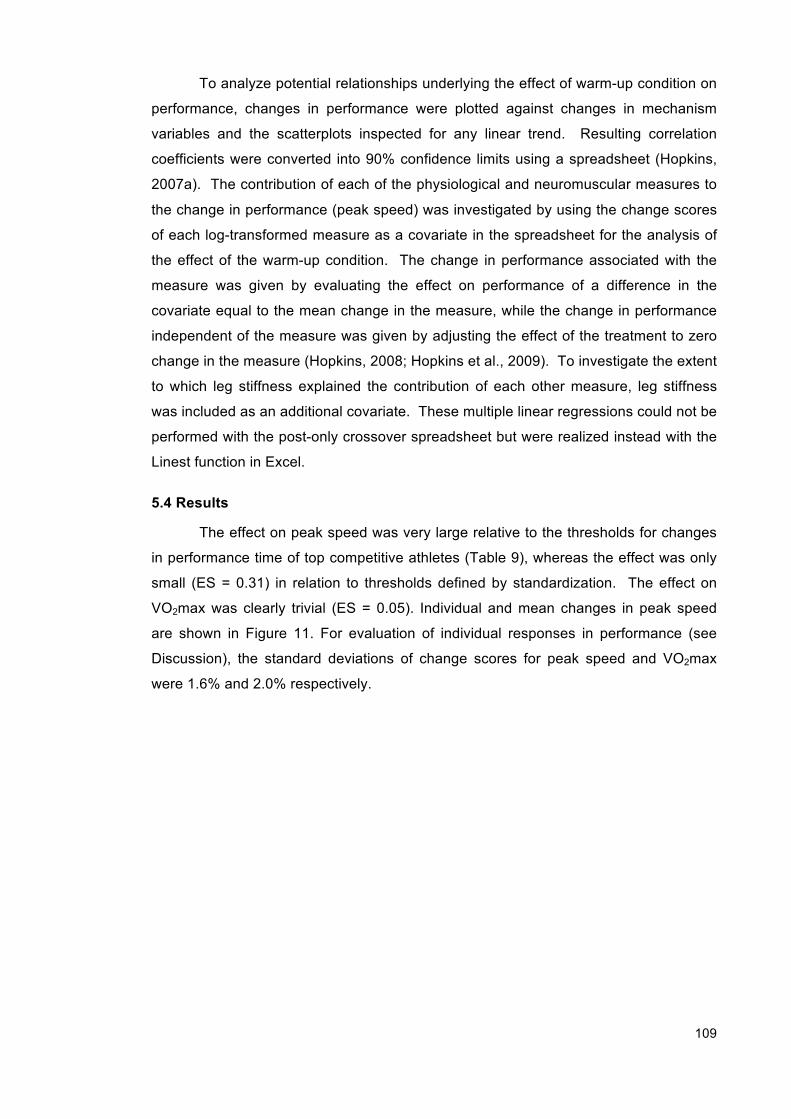
109
To analyze potential relationships underlying the effect of warm-up condition on
performance, changes in performance were plotted against changes in mechanism
variables and the scatterplots inspected for any linear trend. Resulting correlation
coefficients were converted into 90% confidence limits using a spreadsheet (Hopkins,
2007a). The contribution of each of the physiological and neuromuscular measures to
the change in performance (peak speed) was investigated by using the change scores
of each log-transformed measure as a covariate in the spreadsheet for the analysis of
the effect of the warm-up condition. The change in performance associated with the
measure was given by evaluating the effect on performance of a difference in the
covariate equal to the mean change in the measure, while the change in performance
independent of the measure was given by adjusting the effect of the treatment to zero
change in the measure (Hopkins, 2008; Hopkins et al., 2009). To investigate the extent
to which leg stiffness explained the contribution of each other measure, leg stiffness
was included as an additional covariate. These multiple linear regressions could not be
performed with the post-only crossover spreadsheet but were realized instead with the
Linest function in Excel.
5.4 Results
The effect on peak speed was very large relative to the thresholds for changes
in performance time of top competitive athletes (Table 9), whereas the effect was only
small (ES = 0.31) in relation to thresholds defined by standardization. The effect on
VO2max was clearly trivial (ES = 0.05). Individual and mean changes in peak speed
are shown in Figure 11. For evaluation of individual responses in performance (see
Discussion), the standard deviations of change scores for peak speed and VO2max
were 1.6% and 2.0% respectively.
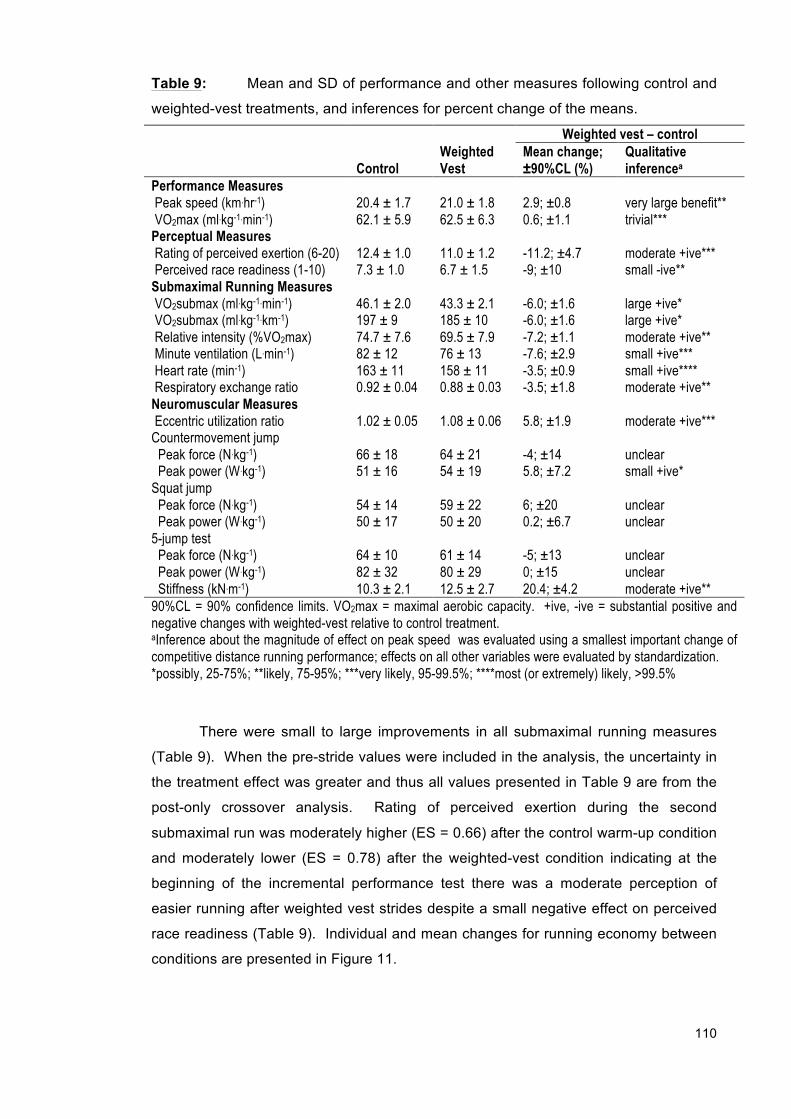
110
Table 9: Mean and SD of performance and other measures following control and
weighted-vest treatments, and inferences for percent change of the means.
Weighted vest – control
Control Weighted Vest
Mean change; ±90%CL (%)
Qualitative inferencea
Performance Measures Peak speed (km.hr-1) 20.4 ± 1.7 21.0 ± 1.8 2.9; ±0.8 very large benefit** VO2max (ml.kg-1.min-1) 62.1 ± 5.9 62.5 ± 6.3 0.6; ±1.1 trivial*** Perceptual Measures Rating of perceived exertion (6-20) 12.4 ± 1.0 11.0 ± 1.2 -11.2; ±4.7 moderate +ive*** Perceived race readiness (1-10) 7.3 ± 1.0 6.7 ± 1.5 -9; ±10 small -ive** Submaximal Running Measures VO2submax (ml.kg-1.min-1) 46.1 ± 2.0 43.3 ± 2.1 -6.0; ±1.6 large +ive* VO2submax (ml.kg-1.km-1) 197 ± 9 185 ± 10 -6.0; ±1.6 large +ive* Relative intensity (%VO2max) 74.7 ± 7.6 69.5 ± 7.9 -7.2; ±1.1 moderate +ive** Minute ventilation (L.min-1) 82 ± 12 76 ± 13 -7.6; ±2.9 small +ive*** Heart rate (min-1) 163 ± 11 158 ± 11 -3.5; ±0.9 small +ive**** Respiratory exchange ratio 0.92 ± 0.04 0.88 ± 0.03 -3.5; ±1.8 moderate +ive** Neuromuscular Measures Eccentric utilization ratio 1.02 ± 0.05 1.08 ± 0.06 5.8; ±1.9 moderate +ive*** Countermovement jump Peak force (N.kg-1) 66 ± 18 64 ± 21 -4; ±14 unclear Peak power (W.kg-1) 51 ± 16 54 ± 19 5.8; ±7.2 small +ive* Squat jump Peak force (N.kg-1) 54 ± 14 59 ± 22 6; ±20 unclear Peak power (W.kg-1) 50 ± 17 50 ± 20 0.2; ±6.7 unclear 5-jump test Peak force (N.kg-1) 64 ± 10 61 ± 14 -5; ±13 unclear Peak power (W.kg-1) 82 ± 32 80 ± 29 0; ±15 unclear Stiffness (kN.m-1) 10.3 ± 2.1 12.5 ± 2.7 20.4; ±4.2 moderate +ive** 90%CL = 90% confidence limits. VO2max = maximal aerobic capacity. +ive, -ive = substantial positive and negative changes with weighted-vest relative to control treatment. aInference about the magnitude of effect on peak speed was evaluated using a smallest important change of competitive distance running performance; effects on all other variables were evaluated by standardization. *possibly, 25-75%; **likely, 75-95%; ***very likely, 95-99.5%; ****most (or extremely) likely, >99.5%
There were small to large improvements in all submaximal running measures
(Table 9). When the pre-stride values were included in the analysis, the uncertainty in
the treatment effect was greater and thus all values presented in Table 9 are from the
post-only crossover analysis. Rating of perceived exertion during the second
submaximal run was moderately higher (ES = 0.66) after the control warm-up condition
and moderately lower (ES = 0.78) after the weighted-vest condition indicating at the
beginning of the incremental performance test there was a moderate perception of
easier running after weighted vest strides despite a small negative effect on perceived
race readiness (Table 9). Individual and mean changes for running economy between
conditions are presented in Figure 11.

111
Figure 11: Individual values and mean for peak speed, submaximal VO2 and leg
stiffness in the control and weight-vest conditions.
Leg stiffness and EUR were moderately higher after weighted-vest strides
compared with those of control strides (ES = 0.76 and 0.96 respectively). Individual
and mean changes in leg stiffness between conditions are presented in Figure 11.
Effects of the weighted vest condition on all other jump measures were unclear, except
for peak power (ES = 0.20) (Table 9).
There was a very high correlation (r = 0.88, 90% confidence interval 0.66 to
0.96) between changes in performance and changes in leg stiffness. Changes in
performance were also strongly related to changes in running economy (r = 0.64, 0.17
to 0.87) and minute ventilation (r = 0.62, 0.14 to 0.86). All other correlations were trivial
or small. Using a linear regression model for the change scores in performance and
change scores in respective mechanism variables, we determined that of the 2.9%
improvement in performance, 3.4% (±90% confidence limits, ±1.1) was associated with
changes in stiffness, while the change not associated with improvements in leg
stiffness was -0.5% (±1.2%), indicating the change in performance independent of
changes in stiffness following weighted-vest condition was actually a 0.5% impairment,
although this result was unclear. The only other variable that had a clear association
between its change scores and the change scores in performance was minute
ventilation, which explained a 1.5% (±1.1%) change in performance, leaving a 1.4%
(±1.3%) change independent of the changes in minute ventilation. Running economy
explained a change of only 0.8% (±2.1%). While the effect of running economy on
performance was unclear, we also investigated the joint effects of economy and
stiffness on performance using a multiple linear regression model. The results from
8
9
10
11
12
13
14
15
16
17
CON$ WV$17
18
19
20
21
22
23
24
CON$ WV$
Peak speed (km.hr-1)
Figure 2. Individual values and mean for peak speed, submaximal VO2 and leg stiffness in the control and weight-vest conditions.
Individual change Mean change
39 40 41 42 43 44 45 46 47 48 49 50
CON$ WV$
Submaximal VO2
(ml.kg-1.min-1)
112
this model showed that the independent effect attributable to running economy was
only a trivial but unclear -0.1% (±1.2%), while the independent effect due to stiffness
was unchanged (3.4%, ±1.3%).
5.5 Discussion
The purpose of this study was to examine the acute effects of an added load to
the strides that occur during a traditional warm-up preceding distance-running
competition. The primary finding indicates beneficial effects on peak running speed
performance and a range of neuromuscular and aerobic measures important to
distance-running performance.
To our knowledge, this is the first study to demonstrate an improvement in
running performance following a weighted-vest warm-up protocol in trained runners.
The 2.9% improvement in performance should result in a similar change in running
competition time (Hopkins et al., 2001). The effect is substantially greater than those in
comparable studies. Ingham et al. (Ingham et al., 2013) reported a 1.2 s (~1%)
improvement in 800-m running performance following a high-intensity warm-up
compared to a traditional warm-up similar to that in this study. Hajoglou et al.
(Hajoglou et al., 2005) reported little difference (a non-significant 0.2%) between 3-km
cycling time-trial performance time following hard and traditional warm-up procedures.
Similarly, Bishop et al. (Bishop et al., 2001) found no significant difference in peak
power output during a 2-min kayak ergometer test following three different warm-up
conditions.
In the current study performance was enhanced despite a small negative effect
on perceived race readiness, which suggests the underlying mechanism of the
enhancement was more than enough to overcome some sense of fatigue induced by
the weighted-vest regimen. The mechanisms analysis supports this premise, in that
we found some evidence (although unclear) of impairment in performance when
changes in leg stiffness were adjusted to zero. The increase in leg stiffness itself
explained all the improvement in performance. Acute changes in leg stiffness have
also been reported in runners as a result of running on surfaces that differ in hardness
(Ferris, Liang, & Farley, 1999) or chronically, following several weeks of strength and
plyometric training (Burgess, Connick, Graham-Smith, & Pearson, 2007; Spurrs et al.,
2003).
The performance of skeletal muscle is affected by its contractile history; thus
the explanation for the changes we observed following the warm-up with the weighted
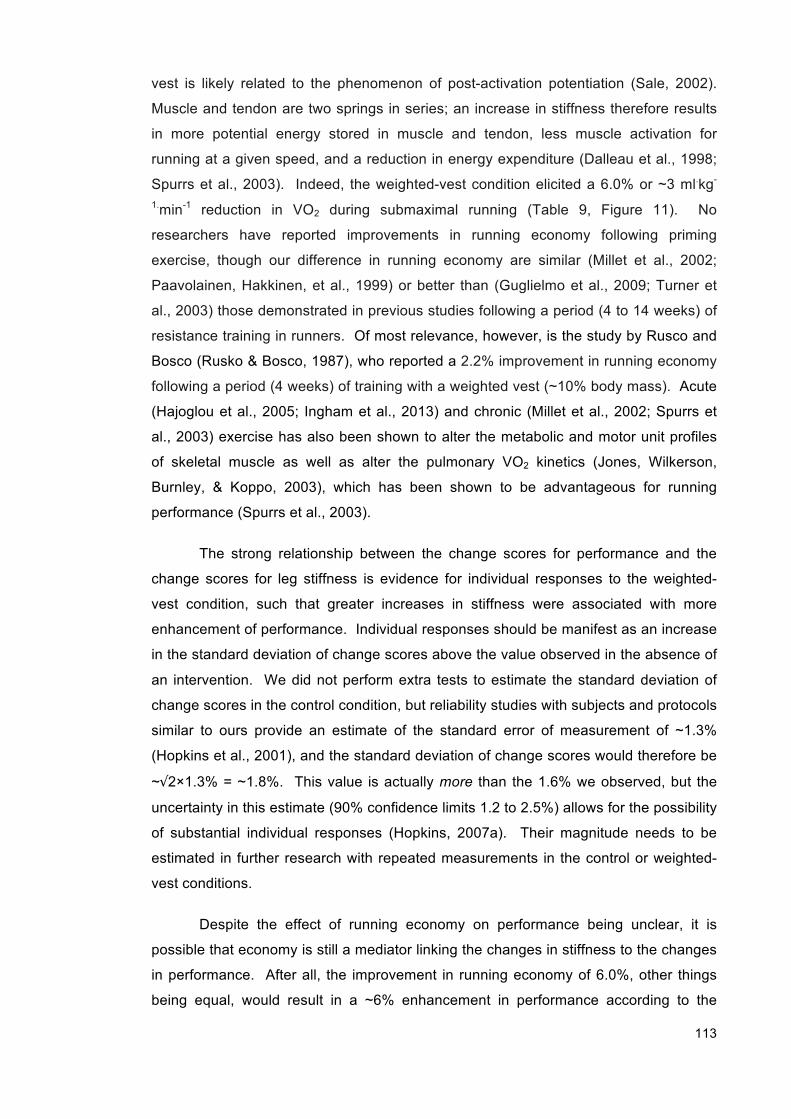
113
vest is likely related to the phenomenon of post-activation potentiation (Sale, 2002).
Muscle and tendon are two springs in series; an increase in stiffness therefore results
in more potential energy stored in muscle and tendon, less muscle activation for
running at a given speed, and a reduction in energy expenditure (Dalleau et al., 1998;
Spurrs et al., 2003). Indeed, the weighted-vest condition elicited a 6.0% or ~3 ml.kg-
1.min-1 reduction in VO2 during submaximal running (Table 9, Figure 11). No
researchers have reported improvements in running economy following priming
exercise, though our difference in running economy are similar (Millet et al., 2002;
Paavolainen, Hakkinen, et al., 1999) or better than (Guglielmo et al., 2009; Turner et
al., 2003) those demonstrated in previous studies following a period (4 to 14 weeks) of
resistance training in runners. Of most relevance, however, is the study by Rusco and
Bosco (Rusko & Bosco, 1987), who reported a 2.2% improvement in running economy
following a period (4 weeks) of training with a weighted vest (~10% body mass). Acute
(Hajoglou et al., 2005; Ingham et al., 2013) and chronic (Millet et al., 2002; Spurrs et
al., 2003) exercise has also been shown to alter the metabolic and motor unit profiles
of skeletal muscle as well as alter the pulmonary VO2 kinetics (Jones, Wilkerson,
Burnley, & Koppo, 2003), which has been shown to be advantageous for running
performance (Spurrs et al., 2003).
The strong relationship between the change scores for performance and the
change scores for leg stiffness is evidence for individual responses to the weighted-
vest condition, such that greater increases in stiffness were associated with more
enhancement of performance. Individual responses should be manifest as an increase
in the standard deviation of change scores above the value observed in the absence of
an intervention. We did not perform extra tests to estimate the standard deviation of
change scores in the control condition, but reliability studies with subjects and protocols
similar to ours provide an estimate of the standard error of measurement of ~1.3%
(Hopkins et al., 2001), and the standard deviation of change scores would therefore be
~√2×1.3% = ~1.8%. This value is actually more than the 1.6% we observed, but the
uncertainty in this estimate (90% confidence limits 1.2 to 2.5%) allows for the possibility
of substantial individual responses (Hopkins, 2007a). Their magnitude needs to be
estimated in further research with repeated measurements in the control or weighted-
vest conditions.
Despite the effect of running economy on performance being unclear, it is
possible that economy is still a mediator linking the changes in stiffness to the changes
in performance. After all, the improvement in running economy of 6.0%, other things
being equal, would result in a ~6% enhancement in performance according to the
114
model of di Prampero et al. (di Prampero et al., 1993) However, the typical error of
measurement of submaximal VO2 in our laboratory was 1.8% (Barnes, Hopkins, et al.,
2013b), which is probably considerably larger than the individual responses in
submaximal VO2. Random error in a measure does not attenuate its mean change,
but it does attenuate its slope as a predictor (Hopkins et al., 2009). Therefore the
magnitude of the effect of running economy on performance was likely greater than
estimated in our mechanisms analysis.
5.6 Conclusion
This is the first study to show that high-intensity running with an added load as
part of an athlete’s warm-up routine enhances subsequent performance in well-trained
runners. The regression analysis suggests increases in leg stiffness following
weighted vest strides are responsible for the improved performance. Future research
should focus on optimizing the use of weighted vests in warm-up procedures to further
enhance subsequent running performance.
5.7 Practical Implications
• The addition of a weighted vest to pre-competition strides improves peak-speed
running performance.
• Running economy and lower-limb stiffness can be acutely augmented following
priming exercise with an added load.
• Strides with a weighted vest offer a practical warm-up tool to enhance subsequent
running performance.
5.8 Acknowledgements
The authors would like to thank the subjects for their participation. No funding
was received for this study and the authors have no professional relationship with a for-
profit organization that would benefit from this study. Publication does not constitute
endorsement by the American College of Sports Medicine.

115
CHAPTER 6: EFFECTS OF DIFFERENT UPHILL INTERVAL-TRAINING PROGRAMS ON RUNNING ECONOMY AND PERFORMANCE
6.1 Abstract
Purpose Runners use uphill running as a movement-specific form of resistance
training to enhance performance. However, the optimum parameters for prescribing
intervals are unknown. We adopted a dose-response design to investigate the effects
of various uphill interval-training programs on physiological and performance
measures. Methods Twenty well-trained runners performed an incremental treadmill
test to determine aerobic and biomechanical measures, a series of jumps on a force
plate to determine neuromuscular measures, and a 5-km time-trial. Runners were then
randomly assigned to one of five uphill interval-training programs. After 6 wk all tests
were repeated. To identify the optimum training program for each measure, each
runner's percent change was modeled as a quadratic function of the rank order of the
intensity of training. Uncertainty in the optimum training and in the corresponding effect
on the given measure was estimated as 90% confidence limits using bootstrapping.
Results There was no clear optimum for time-trial performance, and the mean
improvement over all intensities was 2.0% (confidence limits ±0.6%). The highest
intensity was clearly optimal for running economy (improvement of 2.4%, ±1.4%) and
for all neuromuscular measures, whereas other aerobic measures were optimal near
the middle intensity. There were no consistent optima for biomechanical measures.
Conclusions These findings support anecdotal reports for incorporating uphill interval
training in the training programs of distance runners to improve physiological
parameters relevant to running performance. Until more data are obtained, runners can
assume that any form of high-intensity uphill interval training will benefit 5-km time-trial
performance.
116
6.2 Introduction
Differences in sub-maximal oxygen uptake exist between athletes running at
the same speeds, and these differences in "running economy" are a major factor
explaining differences in running performance of endurance athletes (Conley &
Krahenbuhl, 1980; Conley et al., 1984; Daniels & Daniels, 1992). Various strategies,
such as altitude exposure (Saunders, Telford, et al., 2004), training in the heat
(Saunders, Pyne, et al., 2004a), dynamic stretching (Craib et al., 1996), and high-
intensity interval training (Conley & Krahenbuhl, 1980; Conley et al., 1984; Paton &
Hopkins, 2004), have been proposed as methods to improve running economy via their
effect on one or more of the metabolic, cardiorespiratory, neuromuscular and
musculoskeletal systems. Most recent research has focused on the effects of
supplementing endurance training with different forms of heavy-resistance or
plyometric training to further improve running economy and running performance
(Johnston et al., 1997; Millet et al., 2002; Paavolainen, Hakkinen, et al., 1999;
Paavolainen, Nummela, & Rusko, 1999; Paton & Hopkins, 2004; Saunders et al., 2006;
Spurrs et al., 2003; Storen et al., 2008; Turner et al., 2003). While coaches often utilize
various forms of movement-specific resistance training in periodized training programs
for distance runners, only anecdotal reports (Kurz et al., 2000; Midgley et al., 2007;
Saunders, Pyne, et al., 2004a) and two research investigations (Ferley et al., 2012;
Houston & Thomson, 1977) exist concerning the physiological responses and potential
improvements in performance to such training. In one study, Ferley et al. (2012)
compared effects of uphill interval-training and control (level-grade) interval training on
various measures of performance in well-trained distance runners (Ferley et al., 2012).
Although performance in both groups improved substantially, the only significant
difference favored control training. In the other study, Houston and Thomson (1977)
used a combination of uphill gradients and durations in addition to traditional resistance
training in each training session (Houston & Thomson, 1977). Despite no changes in
VO2max, the authors found significant improvements in a time-to-exhaustion test as
well as increased distance run in 60 and 90 s timed runs. The authors did not report
running economy in either study.
In view of the uncertainty about the physiological effects of uphill training and
other movement-specific form of resistance training on distance running performance,
there is a clear need for more research in this area to identify optimal training (Paton &
Hopkins, 2004). The conventional approach to investigating an optimum treatment is
to perform a repeated-measures crossover study, with each subject receiving all
treatments. However, this approach is often impractical in training studies, because

117
the long-lasting effects of training prevent subjects from receiving more than one type
of training. To address this problem, Stepto et al. (1999) reported a novel and
potentially more powerful dose-response design, in which individual cyclists received
only a single form of training, and the optimum training "dose" was identified by
modeling the effect of training as a polynomial function of the rank-ordered training
intensity (Stepto et al., 1999). In the present study, we adopted the same modeling
approach in an attempt to determine the most effective uphill interval-training protocol
on running economy and performance in well-trained distance runners.
6.3 Methods
6.3.1 Design
We adopted a pre-post parallel groups design with measures conducted prior to
and after a six-week intervention period. Subjects reported to the laboratory at least 2
hours post-prandial and having avoided strenuous exercise in the 24 hours preceding
all test sessions. Prior to the intervention subjects performed baseline measures of the
dependent variables on two occasions separated by three days. The first testing
session included an incremental treadmill test to determine aerobic and biomechanical
characteristics followed by a series of jumps to determine muscle power
characteristics. The second testing session took place three days later and involved a
5-km outdoor time-trial. Four days after completing the final training session, each
runner repeated the same set of tests in the same order as pre-intervention testing.
6.3.2 Subjects
Twenty distance runners (mean ± SD) (age: 21 ± 4, body mass: 65 ± 8 kg,
height: 178 ± 9 cm) with an average 5-km race personal best time of 16.5 ± 1.2 min,
average weekly training volume of 95 ± 25 km.wk-1and training history of 6.3 ± 2.9
years, were randomly assigned to one of five uphill interval programs. The intervention
training adherence rate for participants was 100%. As running volume was not
manipulated in the current study, subjects in all groups continued with their normal
running over the course of the study with the addition of the intervention substituting
some of their normal running for interval training. Training logs for all subjects were
monitored prior to and during the training. It was a requirement of the study that
participants had not previously undertaken any structured interval training or resistance
training in the previous six weeks. The study was approved by the institutional ethics
committee and all participants provided informed written consent.
6.3.3 Treadmill Testing
All running tests were performed in a temperature controlled laboratory (19-

118
21°C; 65%rH) on a motorized treadmill (PowerJog, Birmingham, UK) set at a 1.0%
gradient (Daniels & Daniels, 1992). After a standardized warm-up, subjects completed
an incremental test to determine running economy involving repeated, progressively
faster (increments of 1.0 km.h-1) 4 min stages at four to six fixed running speeds
ranging from 12 to 18 km.h-1 until subjects were unable to sustain steady-state VO2. A
90 s recovery period occurred between each stage for blood lactate sampling (Lactate
Pro, Arkray, Japan) for later determination of the lactate threshold (D-max method)
(Cheng et al., 1992). Expired gases were measured continuously using a metabolic
cart (ParvoMedics TrueOne 2400, Salt Lake City, USA) for determination of VO2,
VCO2, VE, and RER. Heart rate was determined every 1 s (Polar RS800sd, Polar
Electro, Finland). Running economy was defined as the mean VO2 determined during
the last minute of each running speed. Approximately 90 s after completion of the final
submaximal running stage, VO2max was determined during an incremental test to
volitional exhaustion. Subjects commenced running at 1.0 km.h-1 (1.5% gradient)
below the final submaximal speed for 1 min. Thereafter, treadmill gradient was
increased by 1% each minute until volitional exhaustion. The highest VO2 over a 30 s
period during the test was considered VO2max. Changes in endurance performance
were indicated by the peak running speed reached at the end of the incremental
treadmill test. Because we used increases in gradient (rather than speed) in the latter
part of the treadmill test, we calculated speed on the flat as S = ST + (ST × 0.045) × i;
where S = peak speed in km.h-1, ST = treadmill speed in km.h-1, and i = treadmill
inclination in percent (Brooks et al., 1996).
6.3.4 Neuromuscular Measures on a Force Plate
After a 30 min passive recovery period, subjects performed a countermovement
jump (CMJ) and squat jump (SJ) as previously described by McGuigan et al. (2006)
and a five jump plyometric test (5J) described by Saunders et al. (2006) on an
AccuPower force plate (Advanced Mechanical Technology Inc., Watertown, MA) to
determine neuromuscular characteristics (Hopkins et al., 2001; McGuigan et al., 2006;
Saunders et al., 2006). Each jumping test was performed twice. The following
parameters were determined for each type of jump: peak force, time to peak force,
peak power, maximum rate of force development (RFD), displacement, eccentric
utilization ratio (EUR) and stiffness. Eccentric utilization ratio was calculated as the
peak power ratio between performance on the CMJ compared to the SJ (McGuigan et
al., 2006). Stiffness was estimated by dividing the peak force by the vertical
displacement measured during the 5-jump test (Cavagna et al., 1988).

119
6.3.5 Running Performance
Three days after laboratory-based tests, each subject completed a 5-km self-
paced time-trial on a 400-m outdoor tartan track. After the subject’s typical self-
chosen pre-competition warm-up (recorded and repeated post-intervention), subjects
were instructed to run the distance “as fast as possible”.
6.3.6 Training Interventions
Subjects performed two uphill interval-training sessions per week over a 6-wk
period while maintaining their normal running training outside of the weekly interval
training sessions. Specific details of the work:rest ratios, intensity and uphill gradient of
the different training interventions are presented in Table 10. The work:rest ratios were
not consistent with standard interval-training practice (Paton & Hopkins, 2004) but were
designed to accommodate the practicalities of uphill interval training, when runners
have to return to the bottom of a hill to start another repetition. The outcomes are
therefore more likely to reflect what athletes should expect when they add uphill
running to their training program.
Table 10: Details and progression of five different 6-week uphill interval-training
programs (2 interval-training sessions per week).
Group 1 (n = 3)
Group 2 (n = 5)
Group 3 (n = 5)
Group 4 (n = 4)
Group 5 (n = 3)
Gradient 18% 15% 10% 7% 4% %HRmax 100% 100% 98-100% 93-97% 88-92% Velocity (vVO2max) 120% 110% 100% 90% 80%
Work:Rest ratio 1:6 1:3 1:2 1:1.5 1:1 6 wk workout progression Week 1 12× 8 s 8× 30 s 5× 2 min 4× 4 min 2× 10 min Week 2 16× 10 s 10× 35 s 5× 2.5
min 4× 5 min 2× 15 min
Week 3 20× 10 s 12× 40 s 7× 2 min 5× 4.5 min
1× 20 + 1× 15 min Week 4 20× 12 s 12× 45 s 7× 2.5
min 5× 5 min 2× 20 min
Week 5 24× 10 s 16× 40 s 9× 2 min 6× 5 min 3× 15 min Week 6 24× 12 s 16× 45 s 9× 2.5
min 7× 5 min 2× 25 min
6.3.7 Statistical Analyses
We performed simulations to determine the sample size that would give an
acceptable confidence interval for optimum performance predicted with a quadratic
dose-response model. In these simulations, the training protocol was a variable that
ranged from 1 for the highest intensity and shortest duration through 5 for the lowest
intensity and longest duration. Data were generated that had no real polynomial
120
effects, because data without effects need the largest sample sizes to define the
magnitude of the effects with acceptable precision. With 20 subjects, an error of
measurement for an individual’s running economy of 2%, and a quadratic model, the
90% confidence interval was acceptable.
All performance and other outcome measures were analyzed as percentage
changes via the transformation log [(post measurement)/(pre measurement)] (Hopkins,
Hawley, & Burke, 1999). The transformed data were modeled as a quadratic function
of the rank-ordered intensity of the training protocols to determine the optimum training
dose and the value of the change in the outcome measure at this dose (Hopkins,
2006). The standard error of the estimate from the model divided by √2 provided an
estimate of the error of measurement for the outcome measure under conditions of the
experiment (after adjustment for the dose-response relationship). Confidence intervals
for the measures derived from the quadratic model were generated by bootstrapping
using a customized Excel spreadsheet (Hopkins, 2012). For the value of the change in
the outcome measure at the optimum dose, bootstrapping also provided estimates of
the probabilities that the true change was greater or less than the smallest important
beneficial and harmful change.
To make conclusions about the true effects of training on performance and
other outcome measures, we used the clinical form of magnitude-based inference:
unclear effects were those with the possibility (>25% chance) of benefit but an
unacceptable risk of harm (odds ratio of benefit to harm <67) (Hopkins et al., 2009). All
other effects were clear and reported with a qualitative probability for the true
magnitude using the following scale: 25-74%, possibly; 75-94%, likely; ≥95%, very
likely. This approach to inference requires an estimate for smallest important change
in each outcome measure. The smallest enhancement of performance that has a
substantial effect on an athlete’s chance of improvement is 0.3 of the typical within-
athlete variation of performance between competitions (Hopkins et al., 1999). The
variability of performance of high-level competitive distance runners (3-10 km) is 1.1%
(Hopkins, 2005); consequently a smallest important change of 0.3% was used for
measures of performance.
To analyze potential mechanisms underlying the effect of training on
performance, changes in performance were plotted against changes in physiological
and other measures and the scatterplots inspected for any linear trend. A clear linear
trend in the graph would have allowed for estimation of the smallest important change
in the mechanism variable as the change that tracked the smallest important change in
performance. However, there were no such clear linear relationships, presumably
121
because random error of measurement masked any relationship between real
individual differences in changes in performance and the mechanism variable. A
different approach to estimating smallest changes was therefore adopted. The
enhancement in performance turned out to be practically constant across the range of
training intensities (~2%). Therefore, to estimate the smallest important change in
each mechanism variable, we assumed that the tracking of changes in the means of
the mechanism and performance variables reflected the underlying relationship in the
individual change scores. The smallest important change in the mechanism variable
was therefore 0.3% × (Δ mechanism)/(Δ performance), where Δ is the change in the
mean; for example, the smallest important change in VO2max was calculated as 0.3%
× (4.1/2.0) = 0.62%.
6.4 Results
Figure 12 shows the percentage change and quadratic trends for identifying
optimum training intensity with bootstrapped confidence limits for performance and
selected other measures for the individual subjects in the rank order intensity of each
group after the uphill interval-training intervention. Table 11 shows baseline values of
outcome measures and statistics from the bootstrap analyses for inferences about the
optimum intensity and duration of interval training and about the effects on the outcome
measures at the optimum. A well-defined outcome for the effect of dose of training on
outcome measures present in Table 11 was shown if the proportion of successful
bootstrap simulations (bootstrap success rate) was ≥90% and there was a reasonable
confidence interval associated with the dose (Group) or the confidence interval is
limited to one of the dose-extremes (i.e. 1, 1 or 5, 5). Errors of measurement derived
from the modeling are also shown in Table 11 and allow assessment of the precision of
the measures in comparison with those in reliability studies (see Discussion).
Data for the 5-km time-trial showed a weak quadratic trend (Figure 12). The
modeling predicted an optimum near the middle of the range of training intensity and
duration (Group = 2.3, as shown in Table 11) and a likely beneficial effect on
performance (-2.0%). However, the bootstrap success rate (57%) represents
inconsistency in the curvature of the bootstrapped quadratics; that is, only 57%
predicted a minimum in performance time, and the resulting confidence interval for the
optimum treatment extended to both extremes of the treatment range (1 to 5).
Changes in peak speed showed similar results.
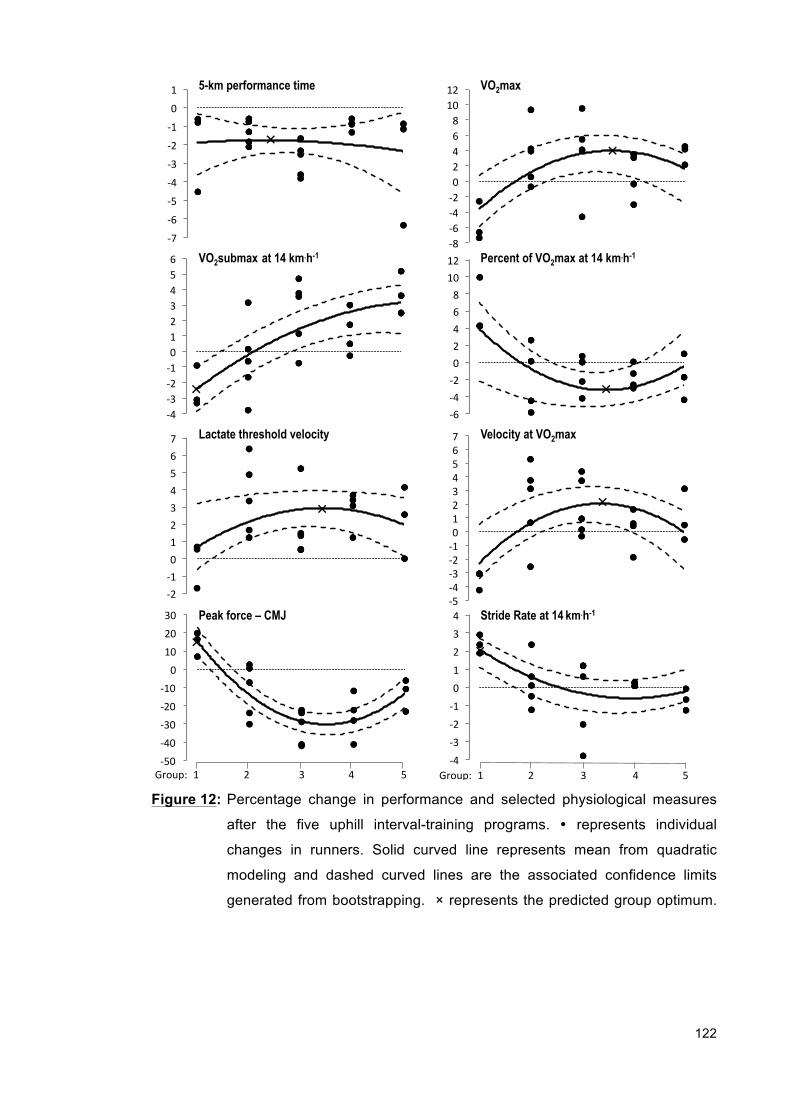
122
Figure 12: Percentage change in performance and selected physiological measures
after the five uphill interval-training programs. ! represents individual
changes in runners. Solid curved line represents mean from quadratic
modeling and dashed curved lines are the associated confidence limits
generated from bootstrapping. × represents the predicted group optimum.
VO2max
Lactate threshold velocity
Peak force – CMJ
5-km performance time
Stride Rate at 14 km.h-1
VO2submax at 14 km.h-1 Percent of VO2max at 14 km.h-1
Velocity at VO2max
Figure 1. Percentage change in performance and selected physiological measures after the five uphill interval-training programs. ! represents individual changes in runners. Solid curved line represents mean from quadratic modeling and dashed curved lines are the associated confidence limits generated from bootstrapping. × represents the predicted group optimum.
!7#
!6#
!5#
!4#
!3#
!2#
!1#
0#
1#
!4#!3#!2#!1#0#1#2#3#4#5#6#
!6#!4#!2#0#2#4#6#8#
10#12#!8#!6#!4#!2#0#2#4#6#8#
10#12#
!5#!4#!3#!2#!1#0#1#2#3#4#5#6#7#
!2#!1#0#1#2#3#4#5#6#7#
!50#
!40#
!30#
!20#
!10#
0#
10#
20#
30#
!4#!3#!2#!1#0#1#2#3#4#
Group:###1##################2###################3##################4##################5# Group:###1##################2##################3###################4#################5#
×#×#
×# ×#
×#×#
×# ×#
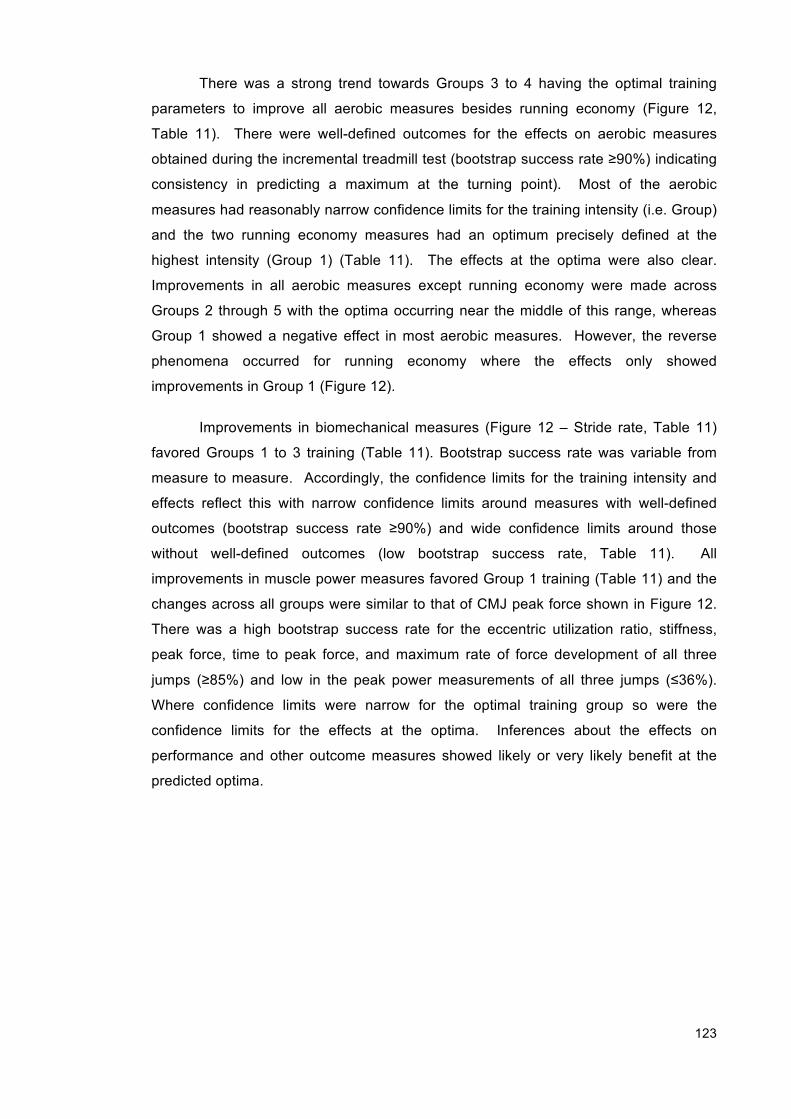
123
There was a strong trend towards Groups 3 to 4 having the optimal training
parameters to improve all aerobic measures besides running economy (Figure 12,
Table 11). There were well-defined outcomes for the effects on aerobic measures
obtained during the incremental treadmill test (bootstrap success rate ≥90%) indicating
consistency in predicting a maximum at the turning point). Most of the aerobic
measures had reasonably narrow confidence limits for the training intensity (i.e. Group)
and the two running economy measures had an optimum precisely defined at the
highest intensity (Group 1) (Table 11). The effects at the optima were also clear.
Improvements in all aerobic measures except running economy were made across
Groups 2 through 5 with the optima occurring near the middle of this range, whereas
Group 1 showed a negative effect in most aerobic measures. However, the reverse
phenomena occurred for running economy where the effects only showed
improvements in Group 1 (Figure 12).
Improvements in biomechanical measures (Figure 12 – Stride rate, Table 11)
favored Groups 1 to 3 training (Table 11). Bootstrap success rate was variable from
measure to measure. Accordingly, the confidence limits for the training intensity and
effects reflect this with narrow confidence limits around measures with well-defined
outcomes (bootstrap success rate ≥90%) and wide confidence limits around those
without well-defined outcomes (low bootstrap success rate, Table 11). All
improvements in muscle power measures favored Group 1 training (Table 11) and the
changes across all groups were similar to that of CMJ peak force shown in Figure 12.
There was a high bootstrap success rate for the eccentric utilization ratio, stiffness,
peak force, time to peak force, and maximum rate of force development of all three
jumps (≥85%) and low in the peak power measurements of all three jumps (≤36%).
Where confidence limits were narrow for the optimal training group so were the
confidence limits for the effects at the optima. Inferences about the effects on
performance and other outcome measures showed likely or very likely benefit at the
predicted optima.
124
Table 11: Outcome measures at baseline and statistics from the bootstrap
analyses for inferences about the effects at the predicted group
optimum.
Baseline values
(mean ± SD) Errora
(%)
Bootstrap success rate (%)
Predicted optimum group and corresponding effect (with
90%CL) Groupb Effect (%) Running Performance
5-km performance time 17.0 ± 1.3 min 1.2 57 2.3 (1, 5) -2.0 (-2.5, -1.3)* Peak speed 21.4 ± 1.9 km.h-1 1.2 54 3.1 (1, 5) 2.0 (1.8, 3.7)**
Aerobic Measures VO2max 63.9 ± 5.9 ml.kg-1.min-1 3.0 96 3.6 (2.9, 4.6) 4.1 (2.2, 6.6)** vVO2max 18.7 ± 1.5 km.h-1 1.7 98 3.4 (2.7, 4.1) 2.0 (1.0, 3.4)** Lactate threshold velocity 15.9 ± 1.6 km.h-1 1.4 91 3.4 (2.2, 5) 2.9 (2.3, 4.2)** VO2submax @ 14 km.h-1 53.7 ± 3.0 ml.kg-1.min-1 1.5 90 1 (1, 1) -2.4 (-3.9, -1.0)** VO2submax @ 14 km.h-1 201 ± 11 ml.kg-1.km-1 1.5 90 1 (1, 1) -2.4 (-3.9, -1.0)** % of VO2max @ 14 km.h-1 84.4 ± 7.6 %VO2max 3.0 96 3.5 (1.9, 4.4) -3.2 (-6.2, -1.9)* Biomechanical Measures Stride rate 87.8 ± 4.5 strides.min-1 1.0 93 1 (1, 1) 2.1 (0.9, 2.7)** Stride length 3.03 ± 0.21 m 1.7 64 2.3 (1, 5) 0.4 (0.0, 2.3)* Contact time 0.22 ± 0.02 s 3.0 88 3.1 (1, 5) -5.2 (-8.0, -3.9)** Flight time 0.12 ± 0.02 s 6.1 91 3.4 (2.8, 5) 10 (6, 18)** Neuromuscular Measures Eccentric Utilization Ratio 1.03 ± 0.06 2.2 98 1 (1, 1) 12 (8, 16)** Stiffness 11.0 ± 2.5 kN.m-1 3.5 85 1 (1, 1.8) 25 (8, 39)** Countermovement Jump Peak force 63 ± 19 N.kg-1 7.7 100 1 (1, 1) 15 (9, 24)** Time to peak force 1.82 ± 0.47 s 13 92 1 (1, 3.2) 7.2 (-2, 29)* Peak power 42.6 ± 6.3 W.kg-1 7.5 36 1 (1, 5) 2.6 (-4.1, 8.8)* Maximum RFD 101 ± 50 kN.s-1 20 100 1 (1, 5) 29 (6, 52)** Squat Jump Peak force 58 ± 14 N.kg-1 7.7 100 1 (1, 1) 12 (7, 22)** Time to peak force 2.04 ± 0.69 s 12 92 1 (1, 1) -7.5 (-16, 4)* Peak power 43.9 ± 6.0 W.kg-1 7.9 12 1 (1, 5) -3.9 (-11, 2)? Maximum RFD 94 ± 34 kN.s-1 12 99 1 (1, 1) 19 (13, 29)** 5-Jump Test Peak force 64.5 ± 5.4 N.kg-1 7.7 96 1 (1, 1) 8.4 (-1, 13)** Time to peak force 2.75 ± 0.71 s 15 99 1 (1, 1) -22 (-33, 0)** Peak power 69 ± 13 W.kg-1 7.6 29 1 (1, 5) 4.5 (-2, 10)* Maximum RFD 105 ± 47 kN.s-1 20 97 1 (1, 3.6) 21 (-5, 48)* CL = confidence limits. VO2max = maximal aerobic capacity. vVO2max = velocity at VO2max. RE = running economy. %VO2max = percent of VO2max. RFD = rate of force development.
aError of measurement derived from the bootstrap analysis (which adjusts for any quadratic effect of group and thereby provides an estimate of error approximating the typical error in a 6-wk reliability study without an intervention).
bGroup range = 1 to 5 (Table 10). For example, 2.3 indicates that the optimum training fell between Groups 2 and 3, and therefore had an intensity of 100-110% (of vVO2max), a duration of 30-120 s and a gradient of 10-15%. *likely beneficial; **very likely beneficial; ?unclear.
125
6.5 Discussion 1
In the present study we used a novel design and analysis approach, previously 2
adopted by Stepto et al. (1999), to determine the effects of different types of uphill 3
interval-training programs on running economy and performance in trained distance 4
runners (Stepto et al., 1999). A major finding was that no specific uphill-training 5
approach was associated with greater gains in 5-km time trial performance, but that 6
curvilinear relationships existed between a continuum of hill training approaches on 7
several performance-related physiological variables, including running economy 8
(Figure 12). Running performance improved across the range of training intensities 9
without a strong curvilinear relationship between uphill training characteristics and a 10
subsequent change in 5-km time-trial performance or peak running speed. The 2% 11
improvement in running performance was similar to other studies demonstrating 12
concurrent improvements in running economy and performance while employing 13
various modes of resistance training (Paavolainen, Hakkinen, et al., 1999; Spurrs et al., 14
2003). Ferley et al. (2012) also demonstrated a ~2% improvement in estimated time-15
trial performance (Hopkins et al., 2001) following 6 wk of uphill-interval training similar 16
to Group 2 training in the present study (Ferley et al., 2012). 17
The error of measurement derived from the bootstrap analysis for 5-km time 18
trial performance was 1.2%, which is comparable to other studies employing true 19
reliability studies with well-trained distance runners (Hopkins, 2005; Hopkins & 20
Hewson, 2001; Laursen, Francis, Abbiss, Newton, & Nosaka, 2007); suggesting to us 21
there is limited evidence for individual responses to training. The correlations between 22
percent changes in 5-km performance and percent changes in each of the aerobic, 23
biomechanical, neuromuscular, and peak speed measures were unclear. A lack of 24
clear correlations provides additional support for no individual responses to explain. 25
However, because every participant demonstrated some sort of improvement in 5-km 26
time-trial performance it can be suggested that running performance enhancements 27
can be made as a result of changes in a variety of mechanistic variables caused by 28
varying the uphill running loading parameters. 29
With regards to effect of uphill interval-training on improvements on selected 30
aerobic, neuromuscular, and biomechanical measures, the various 6 wk uphill interval-31
training programs resulted in curvilinear trends, often with an identified optimum (Figure 32
12). There was a well-defined outcome for the effect of dose of training on all aerobic 33
measures and most biomechanical and neuromuscular measures. A larger sample 34
size would be needed to establish clear optima for the other outcomes. Except for 35

126
improvements in running economy, our model predicted optimal enhancements after 1
work bouts associated with an intensity between Groups 3 and 4 training (Table 10). 2
The enhancements observed for aerobic measures (Table 11) besides running 3
economy is perhaps unsurprising since the intensity of these work bouts occurred at or 4
near VO2max which is in accord with the principle of specificity. It is highly likely these 5
changes were a result of the additional uphill interval training because all subjects were 6
undertaking similar running training outside of the present study (95 ± 25 km.wk-1). In 7
contrast, the two studies utilizing uphill interval-training reported no change (Houston & 8
Thomson, 1977) or a decrement in VO2max (Ferley et al., 2012). 9
We observed that training at the highest intensities (Group 1 and 2) was 10
associated with the greatest improvements in running economy and neuromuscular 11
characteristics as well as increased stride rate. Ours is the first study to demonstrate 12
that a regimen of high-intensity uphill interval training improves running economy. The 13
magnitude of the improvement (2.4%) is consistent with previous studies reporting 14
positive effects of traditional resistance training or plyometric training on running 15
economy in runners with a wide range of ability (Johnston et al., 1997; Millet et al., 16
2002; Paavolainen, Hakkinen, et al., 1999; Paavolainen, Nummela, & Rusko, 1999; 17
Saunders et al., 2006; Spurrs et al., 2003; Storen et al., 2008; Turner et al., 2003) as 18
well as anecdotal reports of the benefits of uphill sprinting (Kurz et al., 2000; Midgley et 19
al., 2007; Saunders, Pyne, et al., 2004a). The observed improvement in running 20
economy was accompanied by similar reduction in VO2max and consequently an 21
increase in %VO2max in Group 1 (Figure 12). This is not surprising given the training 22
imposed on athletes in Group 1 (Table 10) would be unlikely to augment VO2max 23
anyway. It is known a positive relationship exists between maximal and submaximal 24
VO2 indicating that athletes with higher aerobic demands of running (i.e. poorer running 25
economy) tend to have higher VO2max values which may also explain the positive shift 26
in running economy and negative shift in VO2max (Daniels, 1985; Morgan & Daniels, 27
1994; Noakes, 1988; Pate et al., 1992). The theoretical underpinnings of this 28
observation have yet to be fully elucidated, but may relate to various neuromuscular 29
and/or biomechanical characteristics. It should be noted that regardless of the 30
changes in running economy, VO2max and %VO2max, Group 1 training still resulted in 31
an ~2% improvement in 5-km run performance (Figure 12). 32
The fact that the greatest improvements in neuromuscular measures also 33
occurred with the highest intensity of training (Table 11) may support the 34
aforementioned premise that the enhancement of running economy was due to a range 35
of mechanisms relating to recruitment and coordination of muscle fibers, efficiency of 36
127
muscle power development, as well as better use of the muscle-tendon units stored 1
elastic energy. An indirect measure of this storage and return of muscular energy is 2
the EUR in which we found 12% improvements in Group 1 training (Table 11). Another 3
key function of the active skeletal musculature during running is to regulate the 4
stiffness of the muscle-tendon apparatus to maximize the exploitation of elastic energy, 5
which improves running economy (Cavagna et al., 1988). Like other neuromuscular 6
characteristics, leg stiffness measured in this study showed the greatest improvements 7
at the highest training intensity (Table 11). The error of measurement for 8
neuromuscular measures in Table 11 adds some uncertainty to the true relationship 9
between training dose and effect, but is not unreasonable given the measured-error is 10
population specific and is still comparable to other reliability studies (Cormack, Newton, 11
McGuigan, & Doyle, 2008). The improvements in neuromuscular measures are also in 12
agreement with a number of other studies using various forms of explosive resistance 13
training or plyometric type of activities such as hopping, jumping and bounding as ways 14
to directly or indirectly potentiate neuromuscular adaptations (Paavolainen, Hakkinen, 15
et al., 1999; Paavolainen, Nummela, & Rusko, 1999; Saunders et al., 2006; Spurrs et 16
al., 2003; Turner et al., 2003). 17
Finally, another plausible explanation for improved running economy after high 18
intensity uphill interval training is training-induced alteration in stride rate, which was 19
also greatest at the highest intensity of training (Figure 12, Table 11). Paavolainen et 20
al. (1999) observed similar changes in stride characteristics in response to nine weeks 21
of explosive-strength training in well-trained endurance runners along with concurrent 22
~8% improvement in running economy (Paavolainen, Hakkinen, et al., 1999). The 23
changes in biomechanical measures may themselves be explained at least partly by 24
changes in neuromuscular characteristics. 25
6.6 Practical Applications and Conclusion 26
Our findings provide support for incorporating uphill interval running in the 27
training programs of distance runners to improve various physiological, biomechanical 28
and neuromuscular parameters relevant to running performance. Different uphill 29
training approaches appear to induce specific physiological and mechanical 30
adaptations, which suggests that hill training should be carefully matched to the 31
strengths and weaknesses of the athlete, the underlying demands of the event and the 32
training or competitive focus. Until more data are obtained, runners can assume that 33
performance enhancements can be made as a result of changes in a variety of 34
mechanistic variables caused by varying the uphill running loading parameters since 35
every participant demonstrated some sort of improvement in 5-km time-trial 36

128
performance. Further studies are required to establish whether improvements derived 1
from uphill interval training can be established through variations in the frequency, 2
duration, volume and periodization of training. 3
4
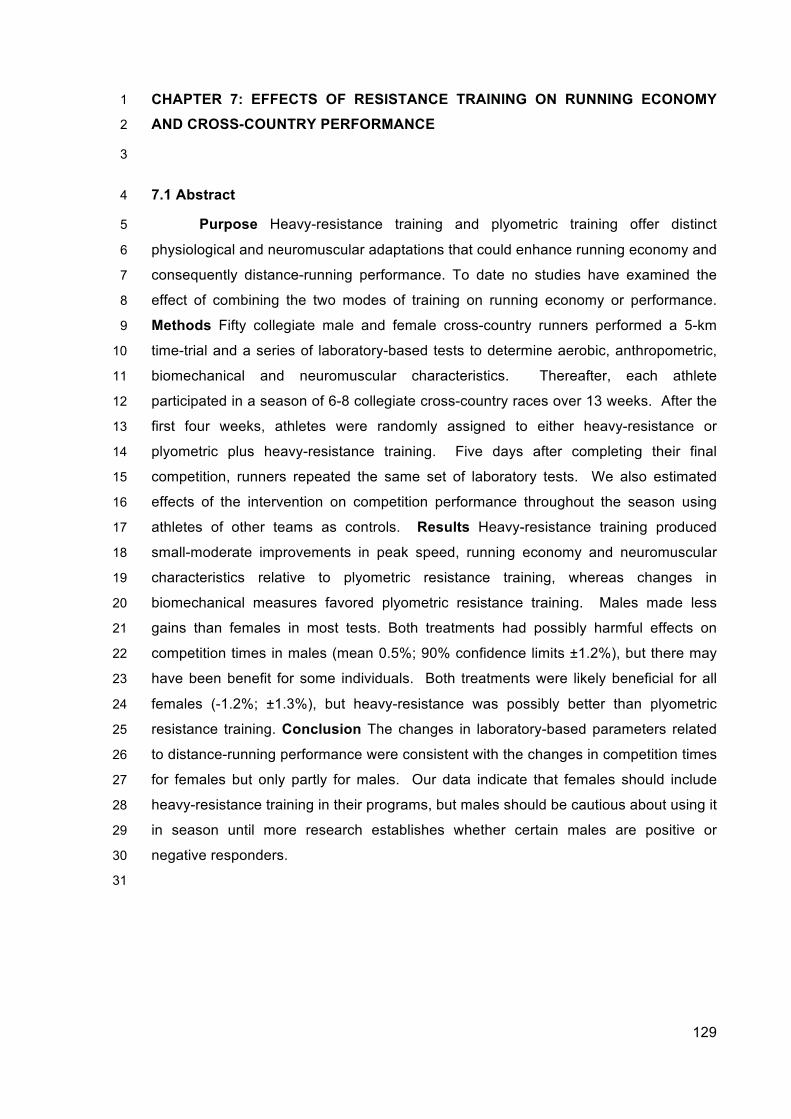
129
CHAPTER 7: EFFECTS OF RESISTANCE TRAINING ON RUNNING ECONOMY 1
AND CROSS-COUNTRY PERFORMANCE 2
3
7.1 Abstract 4
Purpose Heavy-resistance training and plyometric training offer distinct 5
physiological and neuromuscular adaptations that could enhance running economy and 6
consequently distance-running performance. To date no studies have examined the 7
effect of combining the two modes of training on running economy or performance. 8
Methods Fifty collegiate male and female cross-country runners performed a 5-km 9
time-trial and a series of laboratory-based tests to determine aerobic, anthropometric, 10
biomechanical and neuromuscular characteristics. Thereafter, each athlete 11
participated in a season of 6-8 collegiate cross-country races over 13 weeks. After the 12
first four weeks, athletes were randomly assigned to either heavy-resistance or 13
plyometric plus heavy-resistance training. Five days after completing their final 14
competition, runners repeated the same set of laboratory tests. We also estimated 15
effects of the intervention on competition performance throughout the season using 16
athletes of other teams as controls. Results Heavy-resistance training produced 17
small-moderate improvements in peak speed, running economy and neuromuscular 18
characteristics relative to plyometric resistance training, whereas changes in 19
biomechanical measures favored plyometric resistance training. Males made less 20
gains than females in most tests. Both treatments had possibly harmful effects on 21
competition times in males (mean 0.5%; 90% confidence limits ±1.2%), but there may 22
have been benefit for some individuals. Both treatments were likely beneficial for all 23
females (-1.2%; ±1.3%), but heavy-resistance was possibly better than plyometric 24
resistance training. Conclusion The changes in laboratory-based parameters related 25
to distance-running performance were consistent with the changes in competition times 26
for females but only partly for males. Our data indicate that females should include 27
heavy-resistance training in their programs, but males should be cautious about using it 28
in season until more research establishes whether certain males are positive or 29
negative responders. 30
31
130
7.2 Introduction 1
Trained runners have superior running economy compared to lesser-trained or 2
untrained runners (Daniels, 1974b; Daniels & Daniels, 1992; Jones, 1998; Lucia et al., 3
2006; Lucia et al., 2008; Saltin et al., 1995), indicating positive adaptations in response 4
to training programs. Recent research has shown running economy to improve in 5
runners using traditional strength training or explosive, plyometric training (Johnston et 6
al., 1997; Paavolainen, Hakkinen, et al., 1999; Saunders et al., 2006). It is well 7
documented that initial performance gains following traditional heavy resistance 8
training are a result of predominantly neuromuscular rather than within muscle 9
adaptations (i.e. hypertrophy) (Kraemer et al., 1996). These adaptations may include 10
increases in strength, increased motor unit recruitment, improved mechanical efficiency 11
and muscle coordination (Kraemer et al., 1996; Kyrolainen et al., 2001; Sale, 1988). A 12
key component to running economy is the ability to store and recover elastic energy 13
from the eccentric contraction (Cavanagh & Kram, 1985b). Plyometric training is a 14
form of strength training that aims to enhance the ability of the muscles to generate 15
power through the SSC by use of explosive activities such as jumping, hopping and 16
bounding (Turner et al., 2003). Several studies have indicated improvement in running 17
economy from concomitant plyometric and endurance training (Paavolainen, Hakkinen, 18
et al., 1999; Spurrs et al., 2003; Turner et al., 2003). Proposed explanations for the 19
improvement include increased lower body muscle-tendon stiffness, degree of neural 20
input to the muscle, enhanced muscle power development and elastic return, and 21
improved motor unit synchronization (Paavolainen, Hakkinen, et al., 1999; 22
Paavolainen, Nummela, Rusko, et al., 1999; Spurrs et al., 2003). Conversely or in 23
concert improvements from either form of resistance training may enhance running 24
mechanics. Improved biomechanical efficiency and improved leg muscle co-activation 25
and coordination may allow for a reduction in relative workload (Hoff et al., 1999; 26
Johnston et al., 1997; Kyrolainen et al., 2001). The combination of improved running 27
mechanics, neuromuscular efficiency, and strength may result in a decrease in oxygen 28
consumption, thereby improving running economy and ultimately performance. Indeed 29
the combination of heavy-resistance training and plyometric training may facilitate 30
additional improvements in running economy via accumulation of adaptations 31
previously observed when either type of training is performed alone. 32
There is a strong association between running economy and distance running 33
performance (Barnes, Hopkins, et al., 2013b; Conley & Krahenbuhl, 1980; Daniels, 34
1985; Daniels & Daniels, 1992). Accordingly, it is likely that any improvement in 35
running economy as a result of training will be associated with improved distance 36
running performance. A review of the literature, however, produced no studies 37
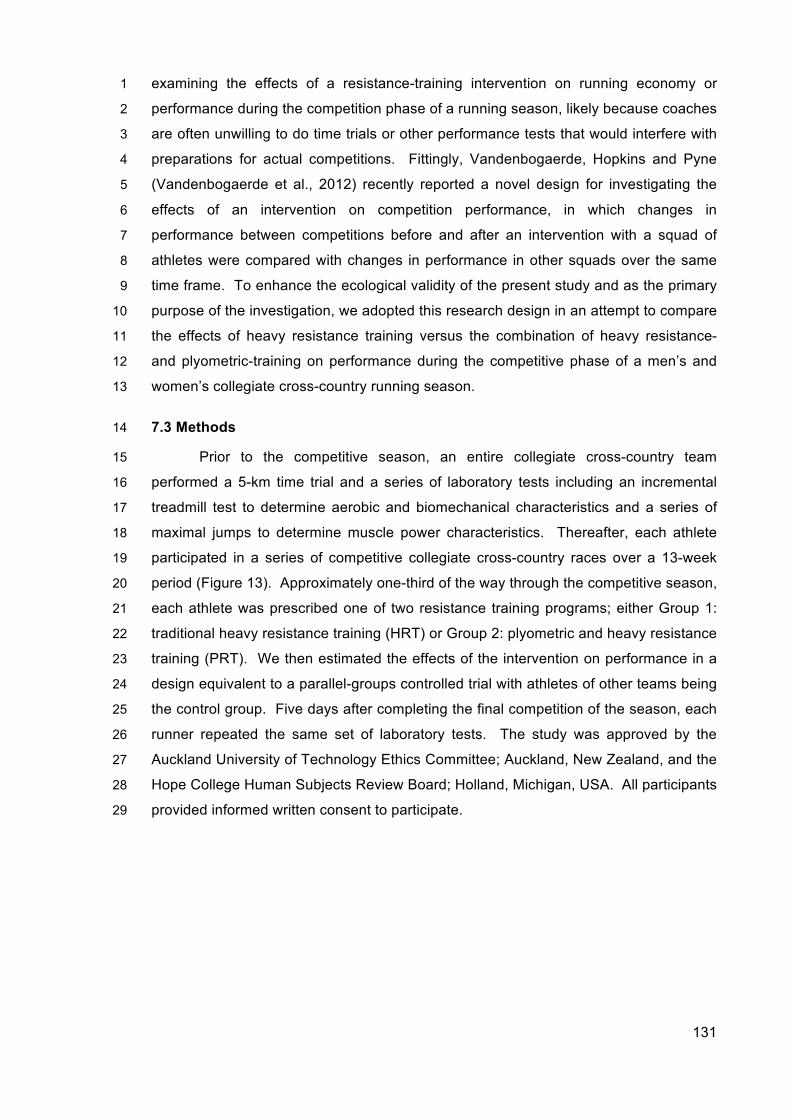
131
examining the effects of a resistance-training intervention on running economy or 1
performance during the competition phase of a running season, likely because coaches 2
are often unwilling to do time trials or other performance tests that would interfere with 3
preparations for actual competitions. Fittingly, Vandenbogaerde, Hopkins and Pyne 4
(Vandenbogaerde et al., 2012) recently reported a novel design for investigating the 5
effects of an intervention on competition performance, in which changes in 6
performance between competitions before and after an intervention with a squad of 7
athletes were compared with changes in performance in other squads over the same 8
time frame. To enhance the ecological validity of the present study and as the primary 9
purpose of the investigation, we adopted this research design in an attempt to compare 10
the effects of heavy resistance training versus the combination of heavy resistance- 11
and plyometric-training on performance during the competitive phase of a men’s and 12
women’s collegiate cross-country running season. 13
7.3 Methods 14
Prior to the competitive season, an entire collegiate cross-country team 15
performed a 5-km time trial and a series of laboratory tests including an incremental 16
treadmill test to determine aerobic and biomechanical characteristics and a series of 17
maximal jumps to determine muscle power characteristics. Thereafter, each athlete 18
participated in a series of competitive collegiate cross-country races over a 13-week 19
period (Figure 13). Approximately one-third of the way through the competitive season, 20
each athlete was prescribed one of two resistance training programs; either Group 1: 21
traditional heavy resistance training (HRT) or Group 2: plyometric and heavy resistance 22
training (PRT). We then estimated the effects of the intervention on performance in a 23
design equivalent to a parallel-groups controlled trial with athletes of other teams being 24
the control group. Five days after completing the final competition of the season, each 25
runner repeated the same set of laboratory tests. The study was approved by the 26
Auckland University of Technology Ethics Committee; Auckland, New Zealand, and the 27
Hope College Human Subjects Review Board; Holland, Michigan, USA. All participants 28
provided informed written consent to participate. 29
132
Figure 13: Schematic representation of experimental design, indicating pre- and post-testing, competition and intervention periods.
aMen did not race in weeks 3 and 13 competitions. bResistance training for all runners. cResistance training for top (fastest 7) male and female runners competing in weeks 12 and/or 13 championship
competitions. dPost testing for runners who did not qualify for weeks 12 or 13 championship competitions. ePost testing for runners competing in weeks 12 and/or 13 championship competitions.
Figure 1. Schematic representation of experimental design, indicating pre- and post-testing, competition and intervention periods. aMen did not race in weeks 3 and 13 competitions. bResistance training for all runners. cResistance training for top (fastest 7) male and female runners competing in weeks 12 and/or 13 championship competitions. dPost testing for runners who did not qualify for weeks 12 or 13 championship competitions. ePost testing for runners competing in weeks 12 and/or 13 championship competitions.
6
Competition Seasona_
Resistance Training Interventionb_
Resistance Training Interventionc
Pre Test_
Post Teste_
Competition Seasona_
5 4 3 2 1 8 7 10 12 13 9 11
Post Testd_
Competition Week
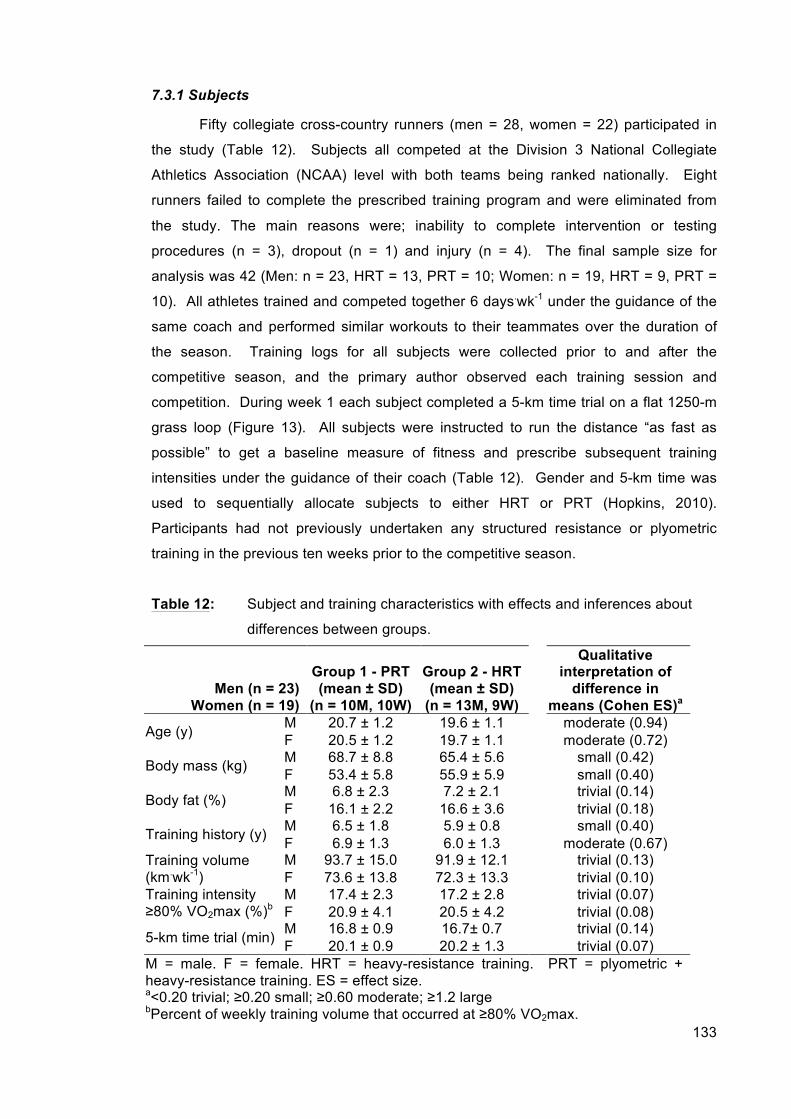
133
7.3.1 Subjects
Fifty collegiate cross-country runners (men = 28, women = 22) participated in
the study (Table 12). Subjects all competed at the Division 3 National Collegiate
Athletics Association (NCAA) level with both teams being ranked nationally. Eight
runners failed to complete the prescribed training program and were eliminated from
the study. The main reasons were; inability to complete intervention or testing
procedures (n = 3), dropout (n = 1) and injury (n = 4). The final sample size for
analysis was 42 (Men: n = 23, HRT = 13, PRT = 10; Women: n = 19, HRT = 9, PRT =
10). All athletes trained and competed together 6 days.wk-1 under the guidance of the
same coach and performed similar workouts to their teammates over the duration of
the season. Training logs for all subjects were collected prior to and after the
competitive season, and the primary author observed each training session and
competition. During week 1 each subject completed a 5-km time trial on a flat 1250-m
grass loop (Figure 13). All subjects were instructed to run the distance “as fast as
possible” to get a baseline measure of fitness and prescribe subsequent training
intensities under the guidance of their coach (Table 12). Gender and 5-km time was
used to sequentially allocate subjects to either HRT or PRT (Hopkins, 2010).
Participants had not previously undertaken any structured resistance or plyometric
training in the previous ten weeks prior to the competitive season.
Table 12: Subject and training characteristics with effects and inferences about
differences between groups.
Men (n = 23) Women (n = 19)
Group 1 - PRT (mean ± SD)
(n = 10M, 10W)
Group 2 - HRT (mean ± SD)
(n = 13M, 9W)
Qualitative interpretation of
difference in means (Cohen ES)a
Age (y) M 20.7 ± 1.2 19.6 ± 1.1 moderate (0.94) F 20.5 ± 1.2 19.7 ± 1.1 moderate (0.72)
Body mass (kg) M 68.7 ± 8.8 65.4 ± 5.6 small (0.42) F 53.4 ± 5.8 55.9 ± 5.9 small (0.40)
Body fat (%) M 6.8 ± 2.3 7.2 ± 2.1 trivial (0.14) F 16.1 ± 2.2 16.6 ± 3.6 trivial (0.18)
Training history (y) M 6.5 ± 1.8 5.9 ± 0.8 small (0.40) F 6.9 ± 1.3 6.0 ± 1.3 moderate (0.67)
Training volume (km.wk-1)
M 93.7 ± 15.0 91.9 ± 12.1 trivial (0.13) F 73.6 ± 13.8 72.3 ± 13.3 trivial (0.10)
Training intensity ≥80% VO2max (%)b
M 17.4 ± 2.3 17.2 ± 2.8 trivial (0.07) F 20.9 ± 4.1 20.5 ± 4.2 trivial (0.08)
5-km time trial (min) M 16.8 ± 0.9 16.7± 0.7 trivial (0.14) F 20.1 ± 0.9 20.2 ± 1.3 trivial (0.07)
M = male. F = female. HRT = heavy-resistance training. PRT = plyometric + heavy-resistance training. ES = effect size. a<0.20 trivial; ≥0.20 small; ≥0.60 moderate; ≥1.2 large bPercent of weekly training volume that occurred at ≥80% VO2max.

134
7.3.2 Testing Procedures
7.3.2.1 Body Composition
On arrival to the laboratory, subjects were weighed (BOD POD CosMed USA,
Inc., Chicago, USA) in their running shorts to the nearest 0.1kg and their body
composition was determined using air-displacement plethysmography (BOD POD GS).
7.3.2.2 Treadmill Testing
All running tests were performed in a temperature-controlled laboratory (19-
21DegC; 65%rH) on a motorized treadmill (TrackMaster TMX425 Full Vision Inc.,
Newton, USA) set at a 1.0% gradient (Daniels, 1998). Before each test, subjects
warmed up at a self-selected exercise intensity for five minutes. The amount of work
performed during the warm-up was recorded and repeated during subsequent exercise
tests. After the warm-up, the subjects completed an incremental treadmill test to
determine running economy involving repeated, progressively faster (increments of 1.0
km.h-1) 4 min stages at fixed running speeds (12 to 18 km.h-1 for men and 11 to 17
km.h-1 for women) until subjects were clearly no longer able to sustain a steady-state
VO2 (i.e. a slow component was evident), as determined visually from real-time plots of
VO2. From further post-test inspections of VO2 data, the maximum velocity at which
steady-state oxygen consumption was achieved across the range of subjects was
determined (14 km.h-1) and used thereafter as our primary measure of running
economy. A 90 s recovery period occurred between each stage. Expired gases were
measured continuously using a metabolic cart (ParvoMedics TrueOne 2400, Salt Lake
City, USA) for determination of VO2, carbon dioxide production, minute ventilation and
respiratory exchange ratio. Running economy was defined as the mean VO2
determined during the last minute of each running stage. In our laboratory, the typical
error of measurement (Hopkins, 2000) of submaximal VO2 was 1.8%. Approximately
90 s after completion of the final submaximal running stage, VO2max was determined
during an incremental test to volitional exhaustion. Subjects commenced running at
1.0 km.h-1 (1.0% gradient) below the final submaximal speed for 1 min. Thereafter,
treadmill gradient was increased by 1% each minute until volitional exhaustion. The
highest VO2 over a 30 s period during the test was considered VO2max. Changes in
endurance performance were indicated by the peak running speed reached at the end
of the incremental treadmill test. Because we used increases in gradient (rather than
speed) in the latter part of the treadmill test, we calculated equivalent speed on the flat
as S = ST + (ST × 0.045) × i; where S = peak speed in km.h-1, ST = treadmill speed in
135
km.h-1, and i = treadmill inclination in percent (Brooks et al., 1996). Heart rate was
determined every 1 s throughout the incremental test using short-range telemetry
(Polar RS800sd, Polar Electro, Finland).
7.3.2.3 Force Plate Measures
Following the incremental test, after a 30 min passive recovery period, subjects
performed a 5-jump plyometric test involving five continuous straight-leg jumps on an
AccuPower force plate (Advanced Mechanical Technology Inc., Watertown, MA) to
determine neuromuscular characteristics. Subjects were instructed to aim for maximal
height with contact times as fast as possible, keeping legs straight throughout the
jumping sequence. All tests were performed twice and care was taken to ensure
subjects maintained erect posture and landed toes first, in the same spot as takeoff.
The following parameters were determined: peak force, time to peak force, peak
power, maximum rate of force development and displacement. Leg stiffness was
estimated by dividing the peak force by the vertical displacement measured during the
5-jump test (Cavagna et al., 1988).
7.3.2.4 Resistance-Training Interventions
The resistance training interventions were implemented during week 4 of the
competitive season. While maintaining their normal endurance running training, each
athlete performed two resistance-training sessions per week over a 7 to 10-wk period,
with the exception of weeks 10, 12 and 13 prior to championship competitions where
athletes performed only one session (Table 13, Session 1). Specific details of each
resistance training session are presented in Table 13. Briefly, a familiarization session
occurred during week 3 and involved a measure of each athletes 3 to 6 repetition max
(RM) for the leg press exercise followed by a familiarization with each of the prescribed
exercises. Each subjects 3 to 6 RM was converted to a 1 RM by the 1RM prediction
equation of Lander (1985) (Lander, 1985). Both HRT and PRT programs were
periodized throughout the competitive season and matched for volume load throughout
the study based on the methods of Stone et al. (1999, 2007) (Stone, Stone, & Sands,
2007). Volume load for HRT and PRT was estimated for each training session using
the number of sets, reps, load and body mass of subjects (Stone et al., 1999; Stone et
al., 2007). Each resistance training session included 4 lower body lifts or 4 complex
set lifts which included the identical lifts of the HRT group immediately followed by a
plyometric exercise of a similar movement pattern (Table 13). Additionally all athletes
performed the same upper body lifts during each session. Resistance training
sessions occurred approximately 30 min after endurance training sessions and athletes
were provided with details of the session (sets, repetitions, and weight) upon arrival to
136
the gym. Weights for each athlete were uncontrolled, but recommendations were given
based on the previous sessions performance and subjects were encouraged to
improve each week. All sessions were monitored and careful attention was given to
each athlete to ensure good technique. Athletes were required to record details of all
training sessions (resistance and endurance) undertaken during the course of the
study. For each resistance training session, the weight (kg) and completed repetitions
for each set was recorded, and for each endurance-training session, the training
distance (km), and duration (min) were recorded.
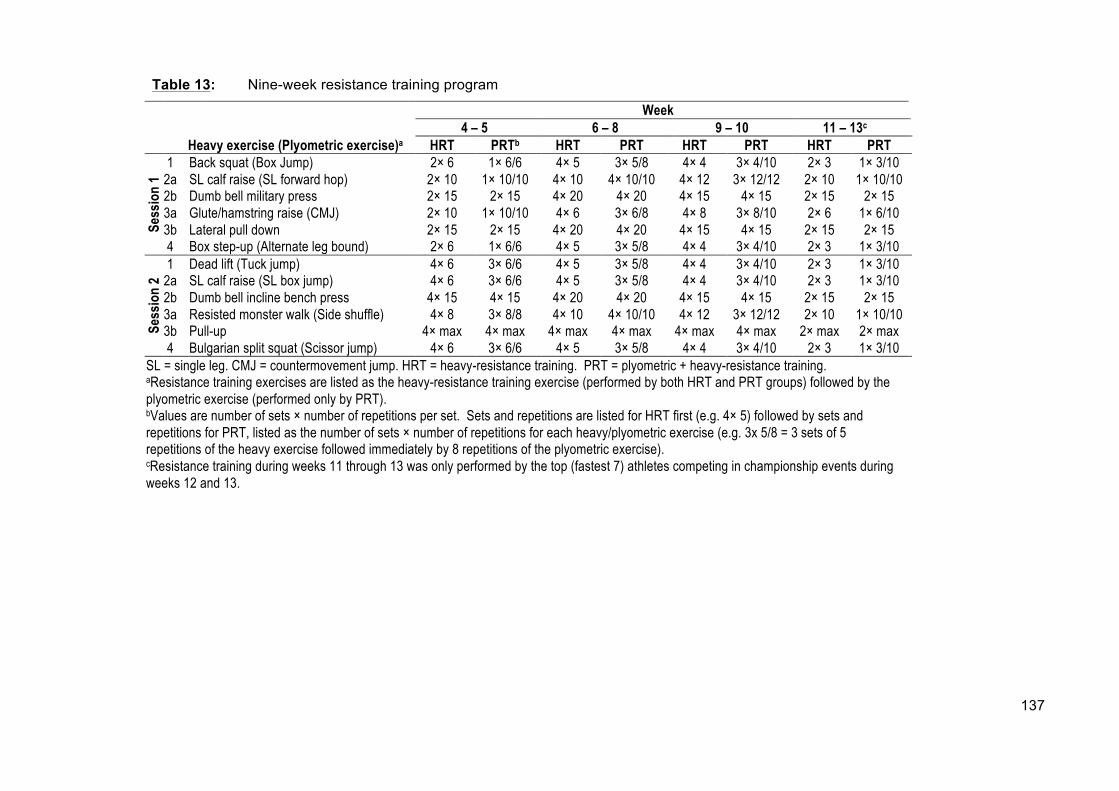
137
Table 13: Nine-week resistance training program
Week 4 – 5 6 – 8 9 – 10 11 – 13c
Heavy exercise (Plyometric exercise)a HRT PRTb HRT PRT HRT PRT HRT PRT Se
ssio
n 1
1 Back squat (Box Jump) 2× 6 1× 6/6 4× 5 3× 5/8 4× 4 3× 4/10 2× 3 1× 3/10 2a SL calf raise (SL forward hop) 2× 10 1× 10/10 4× 10 4× 10/10 4× 12 3× 12/12 2× 10 1× 10/10 2b Dumb bell military press 2× 15 2× 15 4× 20 4× 20 4× 15 4× 15 2× 15 2× 15 3a Glute/hamstring raise (CMJ) 2× 10 1× 10/10 4× 6 3× 6/8 4× 8 3× 8/10 2× 6 1× 6/10 3b Lateral pull down 2× 15 2× 15 4× 20 4× 20 4× 15 4× 15 2× 15 2× 15 4 Box step-up (Alternate leg bound) 2× 6 1× 6/6 4× 5 3× 5/8 4× 4 3× 4/10 2× 3 1× 3/10
Sess
ion
2
1 Dead lift (Tuck jump) 4× 6 3× 6/6 4× 5 3× 5/8 4× 4 3× 4/10 2× 3 1× 3/10 2a SL calf raise (SL box jump) 4× 6 3× 6/6 4× 5 3× 5/8 4× 4 3× 4/10 2× 3 1× 3/10 2b Dumb bell incline bench press 4× 15 4× 15 4× 20 4× 20 4× 15 4× 15 2× 15 2× 15 3a Resisted monster walk (Side shuffle) 4× 8 3× 8/8 4× 10 4× 10/10 4× 12 3× 12/12 2× 10 1× 10/10 3b Pull-up 4× max 4× max 4× max 4× max 4× max 4× max 2× max 2× max 4 Bulgarian split squat (Scissor jump) 4× 6 3× 6/6 4× 5 3× 5/8 4× 4 3× 4/10 2× 3 1× 3/10
SL = single leg. CMJ = countermovement jump. HRT = heavy-resistance training. PRT = plyometric + heavy-resistance training. aResistance training exercises are listed as the heavy-resistance training exercise (performed by both HRT and PRT groups) followed by the plyometric exercise (performed only by PRT). bValues are number of sets × number of repetitions per set. Sets and repetitions are listed for HRT first (e.g. 4× 5) followed by sets and repetitions for PRT, listed as the number of sets × number of repetitions for each heavy/plyometric exercise (e.g. 3x 5/8 = 3 sets of 5 repetitions of the heavy exercise followed immediately by 8 repetitions of the plyometric exercise). cResistance training during weeks 11 through 13 was only performed by the top (fastest 7) athletes competing in championship events during weeks 12 and 13.
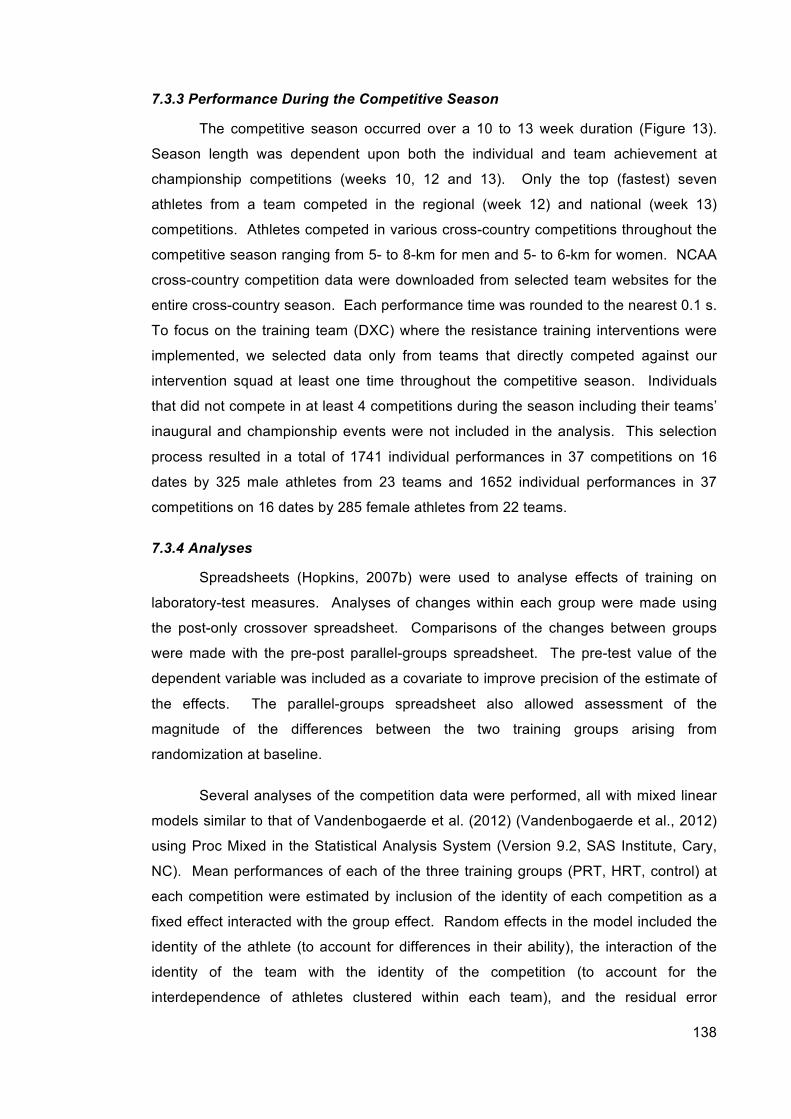
138
7.3.3 Performance During the Competitive Season
The competitive season occurred over a 10 to 13 week duration (Figure 13).
Season length was dependent upon both the individual and team achievement at
championship competitions (weeks 10, 12 and 13). Only the top (fastest) seven
athletes from a team competed in the regional (week 12) and national (week 13)
competitions. Athletes competed in various cross-country competitions throughout the
competitive season ranging from 5- to 8-km for men and 5- to 6-km for women. NCAA
cross-country competition data were downloaded from selected team websites for the
entire cross-country season. Each performance time was rounded to the nearest 0.1 s.
To focus on the training team (DXC) where the resistance training interventions were
implemented, we selected data only from teams that directly competed against our
intervention squad at least one time throughout the competitive season. Individuals
that did not compete in at least 4 competitions during the season including their teams’
inaugural and championship events were not included in the analysis. This selection
process resulted in a total of 1741 individual performances in 37 competitions on 16
dates by 325 male athletes from 23 teams and 1652 individual performances in 37
competitions on 16 dates by 285 female athletes from 22 teams.
7.3.4 Analyses
Spreadsheets (Hopkins, 2007b) were used to analyse effects of training on
laboratory-test measures. Analyses of changes within each group were made using
the post-only crossover spreadsheet. Comparisons of the changes between groups
were made with the pre-post parallel-groups spreadsheet. The pre-test value of the
dependent variable was included as a covariate to improve precision of the estimate of
the effects. The parallel-groups spreadsheet also allowed assessment of the
magnitude of the differences between the two training groups arising from
randomization at baseline.
Several analyses of the competition data were performed, all with mixed linear
models similar to that of Vandenbogaerde et al. (2012) (Vandenbogaerde et al., 2012)
using Proc Mixed in the Statistical Analysis System (Version 9.2, SAS Institute, Cary,
NC). Mean performances of each of the three training groups (PRT, HRT, control) at
each competition were estimated by inclusion of the identity of each competition as a
fixed effect interacted with the group effect. Random effects in the model included the
identity of the athlete (to account for differences in their ability), the interaction of the
identity of the team with the identity of the competition (to account for the
interdependence of athletes clustered within each team), and the residual error
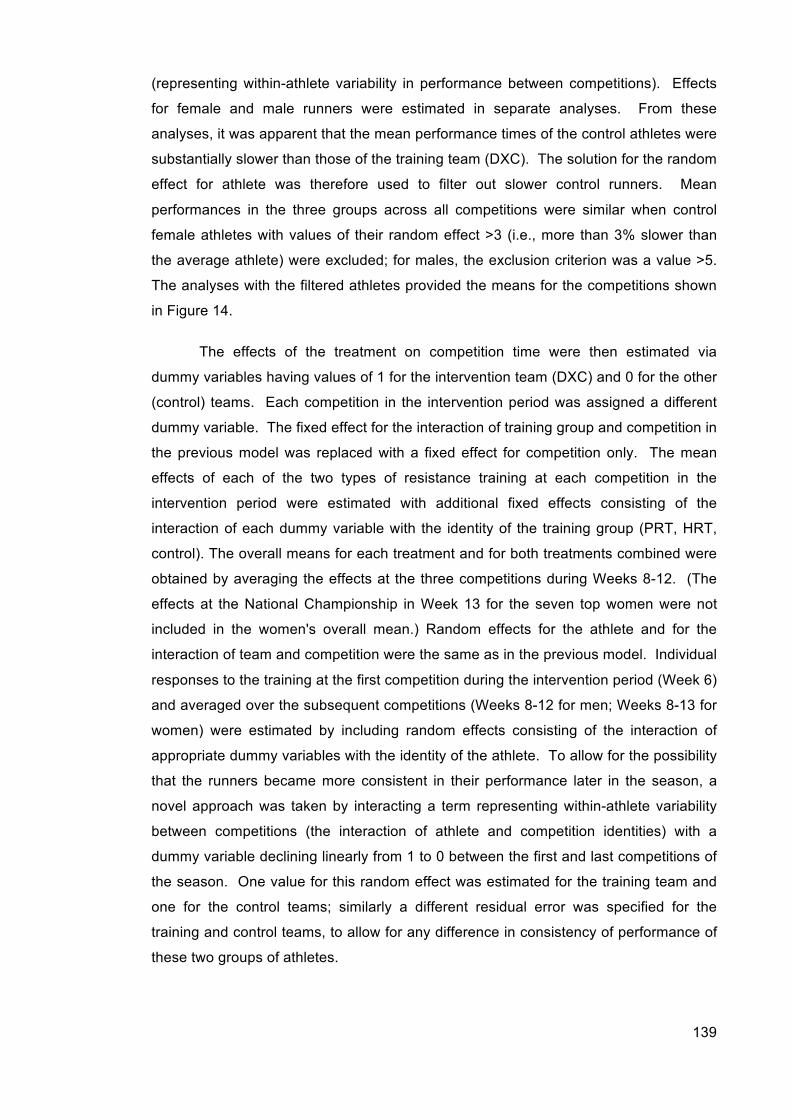
139
(representing within-athlete variability in performance between competitions). Effects
for female and male runners were estimated in separate analyses. From these
analyses, it was apparent that the mean performance times of the control athletes were
substantially slower than those of the training team (DXC). The solution for the random
effect for athlete was therefore used to filter out slower control runners. Mean
performances in the three groups across all competitions were similar when control
female athletes with values of their random effect >3 (i.e., more than 3% slower than
the average athlete) were excluded; for males, the exclusion criterion was a value >5.
The analyses with the filtered athletes provided the means for the competitions shown
in Figure 14.
The effects of the treatment on competition time were then estimated via
dummy variables having values of 1 for the intervention team (DXC) and 0 for the other
(control) teams. Each competition in the intervention period was assigned a different
dummy variable. The fixed effect for the interaction of training group and competition in
the previous model was replaced with a fixed effect for competition only. The mean
effects of each of the two types of resistance training at each competition in the
intervention period were estimated with additional fixed effects consisting of the
interaction of each dummy variable with the identity of the training group (PRT, HRT,
control). The overall means for each treatment and for both treatments combined were
obtained by averaging the effects at the three competitions during Weeks 8-12. (The
effects at the National Championship in Week 13 for the seven top women were not
included in the women's overall mean.) Random effects for the athlete and for the
interaction of team and competition were the same as in the previous model. Individual
responses to the training at the first competition during the intervention period (Week 6)
and averaged over the subsequent competitions (Weeks 8-12 for men; Weeks 8-13 for
women) were estimated by including random effects consisting of the interaction of
appropriate dummy variables with the identity of the athlete. To allow for the possibility
that the runners became more consistent in their performance later in the season, a
novel approach was taken by interacting a term representing within-athlete variability
between competitions (the interaction of athlete and competition identities) with a
dummy variable declining linearly from 1 to 0 between the first and last competitions of
the season. One value for this random effect was estimated for the training team and
one for the control teams; similarly a different residual error was specified for the
training and control teams, to allow for any difference in consistency of performance of
these two groups of athletes.
140
Effects on dependent variables were estimated in percent units via log
transformation. Uncertainty in the estimates of effects on performance (peak speed
and competition time) was expressed as 90% confidence limits and as probabilities that
the true value of the effect was beneficial, trivial or harmful in relation to threshold
values for benefit and harm. These probabilities are not presented quantitatively but
were used to make a qualitative probabilistic clinical inference about the effect
(Hopkins et al., 2009). Briefly, the effect was deemed unclear when the chance of
benefit was sufficiently high to warrant use of the treatment but the risk of harm was
unacceptable. Such unclear effects were identified as those with an odds ratio of
benefit to harm of <66. All other effects were deemed clinically clear and assessed by
estimating the probability that the true magnitude of the effect was at least as large as
the observed magnitude. The threshold values for assessing the magnitude for small,
moderate and large beneficial or harmful effects on performance were ±0.5%, ±1.5%,
±2.7% and ±4.2%, which are approximately 0.3, 0.9, 1.6 and 2.5 of the within-subject
standard deviation a top athlete would show between competitions (Hopkins et al.,
2009). For top cross-country runners this standard deviation was 1.5-1.7% in a
previous study (Hopkins & Hewson, 2001) and 1.3-1.5% by the end of the season in
the current study (see Results). The probabilities were reported qualitatively using the
following scale: 25-75%, possibly; 75-95%, likely; 95-99.5%, very likely; >99.5%, most
likely (Hopkins, 2007a). For the comparison of the effects in the two training groups,
the probabilities of benefit and harm of plyometric resistance training were assessed
relative to heavy resistance training, which was regarded as the reference or best-
practice approach. Magnitudes of effects on measures other than performance were
evaluated non-clinically (mechanistically) (Hopkins et al., 2009): if the confidence
interval overlapped thresholds for substantial positive and negative values (±0.20
standardized units, i.e., 0.20 of the between-subject SD of the dependent in the pre-
test), the effect was deemed unclear; all other effects were reported as the magnitude
of the observed value and were evaluated probabilistically as described above, except
that threshold values for assessing magnitudes of standardized effects were 0.20, 0.60
and 1.2 for small, moderate and large respectively (Hopkins et al., 2009).
7.4 Results
The proportion of training session’s athletes attended during the competition
season was 97 ± 3 % (mean ± SD). Before the competition season PRT and HRT
groups were similar for men and for women in 5-km time-trial performance, training
volume, and body fat, but there were small to moderate differences between groups in
body mass, age, and training history (Table 12). During the competition season men
performed on average 15.7 km.wk-1 of training above 80 percent of VO2max and the
141
women performed 14.6 km.wk-1, which was equivalent to 17.2 ± 2.5 % of men’s and
20.7 ± 4.0 % of women’s weekly training volume (Table 12). There was no substantial
change in body mass from pre to post testing in men or women, and differences
between groups were unclear. Small to moderate reductions in percent body fat were
found within both male PRT (mean change score (%) ± SD; ±CL, -9.7 ± 23.0; ±10.8)
and HRT (-18.5 ± 20.5; ±11.4) and both female PRT (-6.9 ± 9.4; ±6.6) and HRT (-11.8
± 12.6; ±7.9) groups, but PRT had a possibly small negative effect relative to HRT.
Baseline values of other outcome measures, statistics for effects, and inferences about
the interventions within and between groups for men and women are presented in
Tables 14 and 15 respectively.
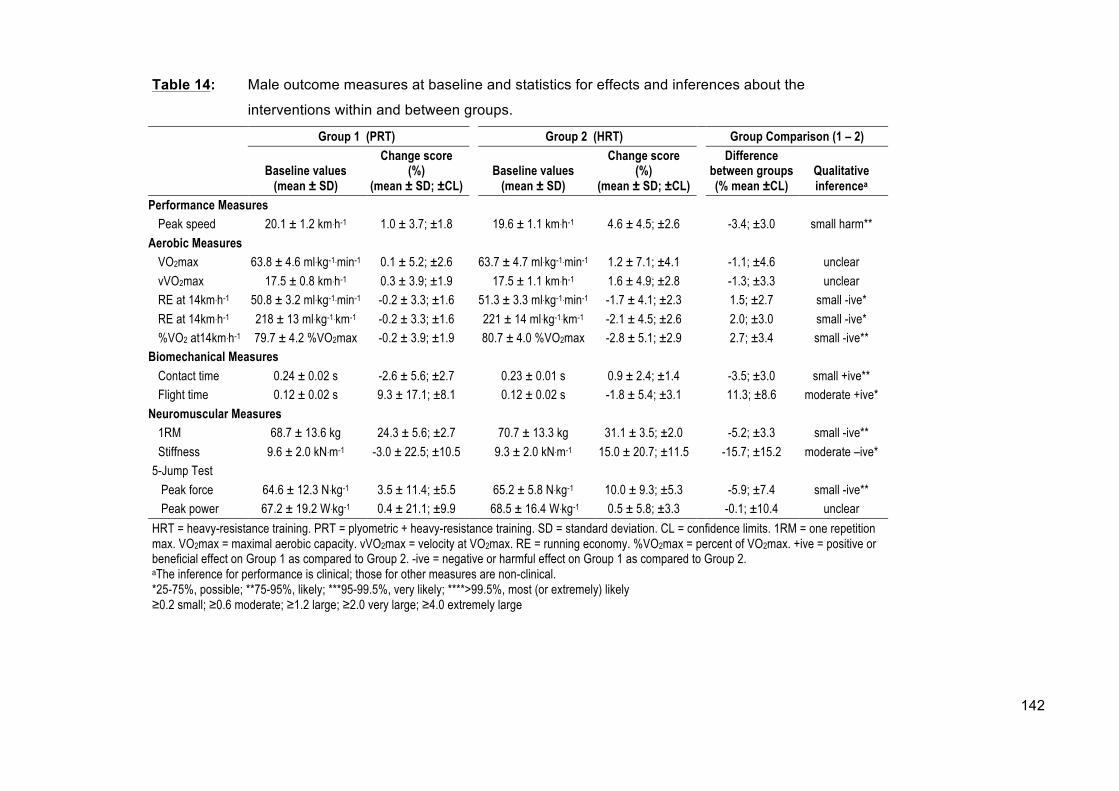
142
Table 14: Male outcome measures at baseline and statistics for effects and inferences about the
interventions within and between groups.
Group 1 (PRT) Group 2 (HRT) Group Comparison (1 – 2)
Baseline values (mean ± SD)
Change score (%)
(mean ± SD; ±CL) Baseline values
(mean ± SD)
Change score (%)
(mean ± SD; ±CL)
Difference between groups (% mean ±CL)
Qualitative inferencea
Performance Measures Peak speed 20.1 ± 1.2 km.h-1 1.0 ± 3.7; ±1.8 19.6 ± 1.1 km.h-1 4.6 ± 4.5; ±2.6 -3.4; ±3.0 small harm**
Aerobic Measures VO2max 63.8 ± 4.6 ml.kg-1.min-1 0.1 ± 5.2; ±2.6 63.7 ± 4.7 ml.kg-1.min-1 1.2 ± 7.1; ±4.1 -1.1; ±4.6 unclear vVO2max 17.5 ± 0.8 km.h-1 0.3 ± 3.9; ±1.9 17.5 ± 1.1 km.h-1 1.6 ± 4.9; ±2.8 -1.3; ±3.3 unclear RE at 14km.h-1 50.8 ± 3.2 ml.kg-1.min-1 -0.2 ± 3.3; ±1.6 51.3 ± 3.3 ml.kg-1.min-1 -1.7 ± 4.1; ±2.3 1.5; ±2.7 small -ive* RE at 14km.h-1 218 ± 13 ml.kg-1.km-1 -0.2 ± 3.3; ±1.6 221 ± 14 ml.kg-1.km-1 -2.1 ± 4.5; ±2.6 2.0; ±3.0 small -ive* %VO2 at14km.h-1 79.7 ± 4.2 %VO2max -0.2 ± 3.9; ±1.9 80.7 ± 4.0 %VO2max -2.8 ± 5.1; ±2.9 2.7; ±3.4 small -ive**
Biomechanical Measures Contact time 0.24 ± 0.02 s -2.6 ± 5.6; ±2.7 0.23 ± 0.01 s 0.9 ± 2.4; ±1.4 -3.5; ±3.0 small +ive** Flight time 0.12 ± 0.02 s 9.3 ± 17.1; ±8.1 0.12 ± 0.02 s -1.8 ± 5.4; ±3.1 11.3; ±8.6 moderate +ive*
Neuromuscular Measures 1RM 68.7 ± 13.6 kg 24.3 ± 5.6; ±2.7 70.7 ± 13.3 kg 31.1 ± 3.5; ±2.0 -5.2; ±3.3 small -ive** Stiffness 9.6 ± 2.0 kN.m-1 -3.0 ± 22.5; ±10.5 9.3 ± 2.0 kN.m-1 15.0 ± 20.7; ±11.5 -15.7; ±15.2 moderate –ive* 5-Jump Test Peak force 64.6 ± 12.3 N.kg-1 3.5 ± 11.4; ±5.5 65.2 ± 5.8 N.kg-1 10.0 ± 9.3; ±5.3 -5.9; ±7.4 small -ive** Peak power 67.2 ± 19.2 W.kg-1 0.4 ± 21.1; ±9.9 68.5 ± 16.4 W.kg-1 0.5 ± 5.8; ±3.3 -0.1; ±10.4 unclear HRT = heavy-resistance training. PRT = plyometric + heavy-resistance training. SD = standard deviation. CL = confidence limits. 1RM = one repetition max. VO2max = maximal aerobic capacity. vVO2max = velocity at VO2max. RE = running economy. %VO2max = percent of VO2max. +ive = positive or beneficial effect on Group 1 as compared to Group 2. -ive = negative or harmful effect on Group 1 as compared to Group 2. aThe inference for performance is clinical; those for other measures are non-clinical. *25-75%, possible; **75-95%, likely; ***95-99.5%, very likely; ****>99.5%, most (or extremely) likely ≥0.2 small; ≥0.6 moderate; ≥1.2 large; ≥2.0 very large; ≥4.0 extremely large

143
Table 15: Female outcome measures at baseline and statistics for effects and inferences about the
interventions within and between groups.
Group 1 (PRT) Group 2 (HRT) Group Comparison (1 – 2)
Baseline values
(mean ± SD)
Change score (%)
(mean ± SD; ±CL) Baseline values
(mean ± SD)
Change score (%)
(mean ± SD; ±CL)
Difference between groups (% mean ±CL)
Qualitative inferencea
Performance Measures Peak speed 17.6 ± 0.7 km.h-1 2.2 ± 3.7; ±2.3 17.2 ± 1.0 km.h-1 4.4 ± 3.9; ±2.2 -2.2; ±3.0 small harm*
Aerobic Measures VO2max 51.3 ± 2.8 ml.kg-1.min-1 4.7 ± 5.2; ±3.2 52.3 ± 3.3 ml.kg-1.min-1 3.4 ± 6.3; ±3.6 1.3; ±4.6 unclear vVO2max 15.3 ± 0.9 km.h-1 2.3 ± 4.5; ±2.8 15.2 ± 0.9 km.h-1 1.6 ± 5.2; ±3.0 0.7; ±3.9 unclear RE at 14km.h-1 43.9 ± 2.3 ml.kg-1.min-1 -1.0 ± 2.2; ±1.3 44.9 ± 1.9 ml.kg-1.min-1 -3.4 ± 4.1; ±2.4 2.5; ±2.6 small -ive** RE at 14km.h-1 203 ± 10 ml.kg-1.km-1 -1.5 ± 3.5; ±2.1 207 ± 9 ml.kg-1.km-1 -3.4 ± 4.1; ±2.4 1.9; ±3.0 small -ive* %VO2 at14km.h-1 84.8 ± 5.5 %VO2max -3.9 ± 4.0; ±2.5 84.6 ± 5.7 %VO2max -3.2 ± 4.0; ±2.3 -0.7; ±3.2 unclear
Biomechanical Measures Contact time 0.24 ± 0.02 s -1.1 ± 3.8; ±2.4 0.24 ± 0.01 s 4.2 ± 2.6; ±1.6 -5.0; ±2.7 moderate +ive** Flight time 0.09 ± 0.01 s 4.2 ± 15.2; ±9.2 0.10 ± 0.02 s -10.2 ± 12.5; ±7.6 16.0; ±11.3 moderate +ive**
Neuromuscular Measures 1RM 41.2 ± 8.0 kg 29.6 ± 8.7; ±5.3 35.9 ± 2.3 kg 44.5 ± 10.3; ± 5.8 -10.3; ±7.5 moderate -ive* Stiffness 13.6 ± 1.5 kN.m-1 4.5 ± 10.4; ±6.3 13.5 ± 1.5 kN.m-1 11.5 ± 12.1; ±6.9 -6.3; ±8.9 moderate -ive* 5-Jump Test Peak force 70.7 ± 14.3 N.kg-1 1.1 ± 14.3; ±8.6 64.9 ± 14.8 N.kg-1 7.5 ± 14.8; ±8.3 -5.9; ±11.5 unclear Peak power 53.4 ± 12.2 W.kg-1 -6.3 ± 20.8; ±12.4 48.2 ± 11.2 W.kg-1 5.3 ± 13.1; ±7.4 -10.9; ±14.0 small -ive**
HRT = heavy-resistance training. PRT = plyometric + heavy-resistance training. SD = standard deviation. CL = confidence limits. 1RM = one repetition max. VO2max = maximal aerobic capacity. vVO2max = velocity at VO2max. RE = running economy. %VO2max = percent of VO2max. +ive = positive or beneficial effect on Group 1 as compared to Group 2. -ive = negative or harmful effect on Group 1 as compared to Group 2. aThe inference for performance is clinical; those for other measures are non-clinical. *25-75%, possible; **75-95%, likely; ***95-99.5%, very likely; ****>99.5%, most (or extremely) likely ≥0.2 small; ≥0.6 moderate; ≥1.2 large; ≥2.0 very large; ≥4.0 extremely large

144
7.4.1 Performance and Aerobic Measures
There were only small differences at baseline between groups for peak speed
and running economy (ml.kg-1.km-1) in men and women, for vVO2max and %VO2max in
men, and for VO2max and running economy (ml.kg-1.min-1) in women. Mean
improvements in peak speed of small to very large magnitude were observed in both
groups for men and women, but PRT was clearly harmful relative to HRT (Table 14 and
Table 15). Following the intervention period male HRT showed small or moderate
improvements in aerobic measures, whereas the effects from PRT on aerobic
measures were trivial (Table 14). Both female groups showed small to moderate
improvements in all aerobic measures (Table 15). Male and female HRT showed
greater improvements in running economy compared with PRT. Differences between
groups on all other aerobic measures were unclear.
7.4.2 Biomechanical Measures
In both training groups and both sexes, changes in contact time were opposite
to those of flight time. The direction of the changes were opposite in the two training
groups, and overall the changes with PRT were clearly positive and small-moderate in
magnitude relative to those with HRT (Table 14 and Table 15).
7.4.3 Neuromuscular Measures
One-repetition max (1RM) improved in all groups, with male athletes improving
by 20-40% (Table 14) and female athletes improving by 30-50% (Table 15).
Improvements were greater with HRT. Changes in neuromuscular related measures
from the 5-jump test were small to moderate improvements with HRT and trivial or
negative with PRT (Table 14 and Table 15). Overall, PRT was associated with either
unclear or negative effects on all neuromuscular measures in men and women. There
was a moderate improvement in leg stiffness after HRT in men and women and unclear
decrease (male) or possibly small improvement (female) after PRT (Table 14 and
Table 15 respectively).
7.4.4 Competition Measures
The residual error in competition times calculated at the beginning of the
season was ~2.0% for the training and control groups and at the end of the season
was 1.3-1.4% in the training groups and 1.5% in the control group. Figure 2 shows the
least-squares mean performance times for men and women in the competitions that
the training groups entered. The mean effects of the training interventions on
performance at each competition were generally consistent from Week 8 through the
145
end of the season for male and female athletes. Overall, PRT resulted in possible
harm to competition times (slower run times) by 0.8% (90% confidence limits ±1.5%)
compared to control male athletes. Heavy-resistance training (HRT) was also possibly
harmful to competition performance (0.1%; ±1.3%). The men’s overall mean
performance was worse (slower) than that of the control teams by 0.5% (±1.2%) after
implementation of the two resistance-training interventions. There was an unclear
difference between PRT and HRT (-0.7 ±1.5%). There was a likely beneficial effect of
PRT training for females, resulting in -1.1% (±1.3%) faster run times (compared to
control female athletes). Heavy-resistance training was also likely beneficial to
competition performance, -1.4% (±1.4%). The women’s overall mean performance
was better (faster) than that of control teams by -1.2% (±1.3%). When compared to
HRT, PRT was possibly harmful (0.3%; ±1.0%). Individual responses expressed as a
standard deviation for both treatments combined was 0.3% (90% confidence interval -
1.2% to 1.3%) for men and -0.6% (-1.0% to 0.5%) for women.

146
Figure 14: Least-squares mean of male and female performance times.
7.5 Discussion
Previous studies (Hickson et al., 1988; Paavolainen, Hakkinen, et al., 1999;
Spurrs et al., 2003) have reported that various forms of resistance training may lead to
improved endurance performance in trained subjects. However, the optimal
prescription of resistance training to improve endurance running performance has yet
to be firmly established. Accordingly, we investigated whether the combination of
plyometric training and heavy-resistance training (PRT) may facilitate additional
23.0
20.0
25.0
26.0
24.0
21.0
22.0
Competition Week
Intervention Period Baseline 19.0
2 3 5 6 8 10 12 13
O = HRT ! = H+P X = Control
Female Performance Time
Intervention Period Baseline
28.5
27.5
29.0
28.0
Male Performance Time
Comp
etitio
n Per
forma
nce T
ime (
min)
// //
// //
147
improvements in neuromuscular efficiency, strength, and running mechanics,
compared to heavy resistance-training (HRT) alone during the competition phase of a
men’s and women’s collegiate cross-country season. Interestingly, our data revealed
distinct differences between the prescribed training regimes in terms of performance
gains and physiological adaptations, and an apparent gender-specific response to
resistance training.
To determine the effects of HRT and PRT on performance from competition
data, the coefficient of variation (CV) representing typical variation in performance time
for the faster male and female runners across the competition season was determined.
The CV sets the benchmark for the smallest worthwhile change in an athlete’s
performance and for the typical (standard) error of measurement of tests used to
assess the smallest important or worthwhile change (Hopkins et al., 2009). Our CV of
~2.0% at the start of the competitions and ~1.5% at the end are in line with the 1.5-
1.7% reported by Hopkins and Hewson (Hopkins & Hewson, 2001) and were the basis
of using a ±0.5% threshold value for beneficial and harmful effects on performance
(approximately 0.3 of the within-subject standard deviation top athletes show between
competitions (Hopkins & Hewson, 2001; Hopkins et al., 2009). Accordingly, there were
substantial beneficial mean effects on competition performance for the female training
groups compared to controls (-1.2 ±1.3%), whereas resistance training for males
proved to be possibly harmful (0.5 ±1.2%). This observation could be an indication that
endurance-trained female athletes may have a greater requirement in terms of
resistance training maintenance (Peterson, Pistilli, Haff, Hoffman, & Gordon, 2011),
whereas this type of training for men might be beneficial in general only during the pre-
season or build-up phase of training when there is less emphasis on competition and
gains can be made in physiological measures without the risk of harm to competition
performance. Further, the resistance training programs may not have been optimal to
elicit a maximal physiological and/or neuromuscular response following training. There
is some evidence to suggest that concurrent resistance and endurance training inhibits
strength development (Leveritt, Abernethy, Barry, & Logan, 2003; Leveritt, Abernethy,
Barry, & Logan, 1999). Other research suggests the order of training (endurance then
strength or strength then endurance) could affect outcomes (Chtara et al., 2005; Chtara
et al., 2008; Leveritt et al., 2003). The changes in this study suggest otherwise given
the large improvements in 1-RM, however this was to be expected in a group novice
lifters. While the enhancements in various neuromuscular parameters were to be
expected given the population of this study, perhaps these changes were not great
enough to improve cross-country running performance to a greater degree. Other
research suggests the order of exercises and recovery between exercises can
148
substantially affect neuromuscular changes (Chtara et al., 2005; Chtara et al., 2008;
Leveritt et al., 2003). Perhaps if changes in the choice, order and recovery between
exercises could elicit greater improvements in performance, however, further research
is required to elucidate these possibilities. Lastly, the differences in effects between
men in women could also be due in part to differences in training intensity and
competition distance. The proportion of training that occurred at ≥80% VO2max for
females was moderately higher than that for males (Table 12), which might have
translated into performance enhancement over the women's shorter race distance (5-6
km vs 8-10 km for the men). Although we observed an overall benefit in competition
performance from either form of resistance training in women and harm in men, HRT
was substantially better for females (0.3%; ±1.0%) while PRT was worse (-0.7 ±1.5%).
In addition to actual competition data, we also observed a substantial increase
in laboratory-derived peak running speed following HRT (4.6% and 4.4% in men and
women respectively) compared to PRT (1.0% and 2.2% in men and women
respectively). Peak running speed has been shown to be a good indicator of
endurance performance in middle- and long-distance running events (Billat &
Koralsztein, 1996; Noakes, 1988; Noakes, Myburgh, & Schall, 1990; Saunders, Cox,
Hopkins, & Pyne, 2010; Stratton et al., 2009) and Noakes (Noakes, 1988; Noakes et
al., 1990) has suggested that peak running speed could be used as a measure of the
‘muscle power’ factor in endurance runners. Muscle power is defined as an ability of
the neuromuscular system to produce power during maximal exercise when glycolytic
and/or oxidative energy production are high and muscle contractility may be limited
(Noakes, 1988). Indeed, in addition to the aerobic processes related to distance
running performance, the neuromuscular and anaerobic characteristics related to peak
running speed are also strongly involved in distance running performance.
In the present study, changes in physiological measures related to distance
running performance were consistent with performance data, indicating greater
improvements following HRT than matched volume-load PRT (Table 14 and Table 15).
Specifically, the addition of HRT improved running economy by 1.7% and 3.4% in
males and females respectively, while PRT only improved running economy by 0.2%
and 1.0% [Table 14 (men), Table 15 (women)]. Although both HRT and PRT results
are in accordance with growing literature demonstrating that heavy resistance-training
or plyometric training improved the running economy of well-trained athletes
((Guglielmo et al., 2009; Johnston et al., 1997; Millet et al., 2002; Paavolainen,
Hakkinen, et al., 1999; Saunders et al., 2006; Spurrs et al., 2003; Storen et al., 2008;
Turner et al., 2003), the magnitude of enhancements were lower in our study
149
compared to previous studies reporting effects following heavy-resistance (Guglielmo
et al., 2009; Johnston et al., 1997; Millet et al., 2002; Storen et al., 2008) or plyometric
training (Paavolainen, Hakkinen, et al., 1999; Saunders et al., 2006; Spurrs et al.,
2003; Turner et al., 2003). This could be due to different phases of season that the
studies were performed. Regardless, in both HRT and PRT, improvements in running
economy occurred in the absence of any substantial change in VO2max suggesting
that improved running economy was a result of neuromuscular characteristics rather
than improved cardiorespiratory fitness. This is a reasonable assertion since both HRT
and PRT groups performed the same endurance training outside of their respective
resistance training programs. In further support, running economy improved in accord
with many of the neuromuscular measures (Table 14 and Table 15) which also aligns
well with previous studies (Dalleau et al., 1998; Millet et al., 2002; Paavolainen,
Hakkinen, et al., 1999; Saunders et al., 2006; Spurrs et al., 2003; Storen et al., 2008)
reporting the importance of the neuromuscular characteristics in determining running
economy and running performance following combined resistance and endurance
training in runners.
With regards to changes in strength and neuromuscular measures that could be
responsible for the greater improvements in running economy and peak running speed
following HRT, it has been purported (3, 26) that the nervous system plays an
important role in regulating muscle stiffness and utilization of muscle elasticity during
stretch-shortening cycle exercises, such as running, in which high contraction velocities
are used. In the present study, small to moderate increases in leg stiffness occurred in
the male and female HRT groups and PRT training was associated with moderate
negative effects on leg stiffness compared to HRT (Table 14 and Table 15).
Interestingly, the group with the smallest improvement in 1RM (male PRT) was the only
group not to elicit a concomitant increase in stiffness. One of the most important roles
of the muscle during running is to modulate leg stiffness and storage-recoil of energy.
The conversion of energy to motion involves recoil of some elastic energy in muscle
and tendon, thus a “stiffer” muscle or tendon would be better at transferring energy
economically or without the need for additional oxygen consumption (Cavagna &
Kaneko, 1977; Dalleau et al., 1998; Spurrs et al., 2003). Indeed, previous evidence
has shown a negative correlation between leg stiffness and cost of running (Albracht &
Arampatzis, 2006; Arampatzis et al., 2006). Kerdok et al. (Kerdok, Biewener,
McMahon, Weyand, & Herr, 2002) have shown changes in both muscle-tendon
stiffness and running economy when manipulating the running surface, indicating that
runners adjust the level of leg stiffness towards the most optimal degree, to maintain
consistent running mechanics on different surfaces. This could be important,
150
particularly in cross-country runners like those in the present study where competitions
often take place on a variety of undulating surfaces in a single competition.
Conversely, the training-induced alterations in biomechanical measures support PRT
training and therefore are not likely related to the changes in running economy, peak
speed or competition performance. Other studies have indicated that these
biomechanical adaptations also occurred in response to plyometric training
(Paavolainen, Hakkinen, et al., 1999; Saunders et al., 2006). Collectively, these
findings suggest that HRT had a positive influence on cross-country running
performance because of the improved running economy, peak speed and
neuromuscular characteristics.
Finally, it was not surprising to observe the magnitude of improvement in
maximal strength (20-40% in the leg press for most athletes) in our sample of distance-
runners with limited resistance-training experience. The enhancements in 1RM
strength from HRT were 30 and 50% percent greater than PRT in men and women
respectively, indicating a positive effect to HRT on strength parameters. The increased
muscular strength due to resistance- and/or plyometric-training might primarily come
from neural adaptations without observable muscle hypertrophy (Hakkinen, 1994; Sale,
1988). The finding that no substantial change in body weight and small to moderate
reductions in percent fat in both PRT and HRT groups, suggesting that little, if no
hypertrophy occurred due to the resistance training interventions supports this
suggestion. Increases in body mass are an undesirable side effect to resistance
training that could be counter-productive to distance running performance.
In conclusion, both HRT and PRT had a likely beneficial effect on competition
times in females while both treatments had possibly harmful effects in males.
However, when comparing the two treatments, the addition of plyometric training to
heavy resistance training was harmful to cross-country competition performance and
most laboratory-based measures when compared to a matched volume-load heavy
resistance-training program. The greater improvements in competition performance
and an enhancement in running economy and peak speed following HRT, compared to
PRT, was probably a result of improvements in lower limb strength, leg stiffness and
utilization of stored elastic energy. Overall, our data indicate that females should
include heavy-resistance training in their programs, but males may want to implement
such training in-season with caution until more research establishes characteristics of
positive or negative responders.
151
7.6 Acknowledgements
The authors thank Hope College for their generosity and use of laboratory
space and equipment, the Men’s and Women’s Cross Country teams at Hope College
for participating in this research study, and Salome Emmanuel and Kate Nelson-Nix for
their assistance during data collection. No funding was received for this study and the
authors have no professional relationship with a for-profit organization that would
benefit from this study. Publication does not constitute endorsement by the American
College of Sports Medicine.

152
CHAPTER 8: OVERALL DISCUSSION & CONCLUSION
A comprehensive review of the literature at the outset of this work, highlighted a
number of limitations in regards to the current understanding of what running economy
represents as well as which specific strategies can improve running economy in trained
distance runners. Of the numerous metabolic, cardiopulmonary, biomechanical and
neuromuscular factors affecting running economy, it appears that a few common
mechanisms were subject to alteration or improvement through purposeful training.
Furthermore, while a variety of strategies to improve running economy had been
investigated (Figure 6), the efficacy of resistance training appeared to be most
promising and practical method. Although a number of studies had examined either
traditional resistance training (Berryman et al., 2010; Guglielmo et al., 2009; Johnston
et al., 1997; Sedano et al., 2013; Storen et al., 2008) or plyometric training
(Paavolainen, Hakkinen, et al., 1999; Saunders et al., 2006; Spurrs et al., 2003; Turner
et al., 2003) independently as a means of improving running economy, the evidence
supporting either form was conflicting. Additionally, while traditional resistance training
and plyometric training are common ancillary training practices for distance runners
who choose to adopt them, other forms of resistance exercise such as running uphill or
with a weighted vest are also performed by distance runners during training, yet there
was limited information in regards to the physiological responses to warrant such
training practices. Principally, there was an apparent dearth of studies that have
examined the effects of movement-specific modes of resistance exercise on running
economy and performance. Accordingly, this thesis attempted to address these
limitations, according to the main paradigm of interest: what is the relatively efficacy of
different forms of movement-specific resistance exercise to improve running economy
and performance in training distance runners? A summary of the chapters included as
part of this thesis is presented in Table 16. Subsequent discussion in this section
articulates the main findings of this thesis in regards to the individual research
questions underpinning the aim of this thesis.
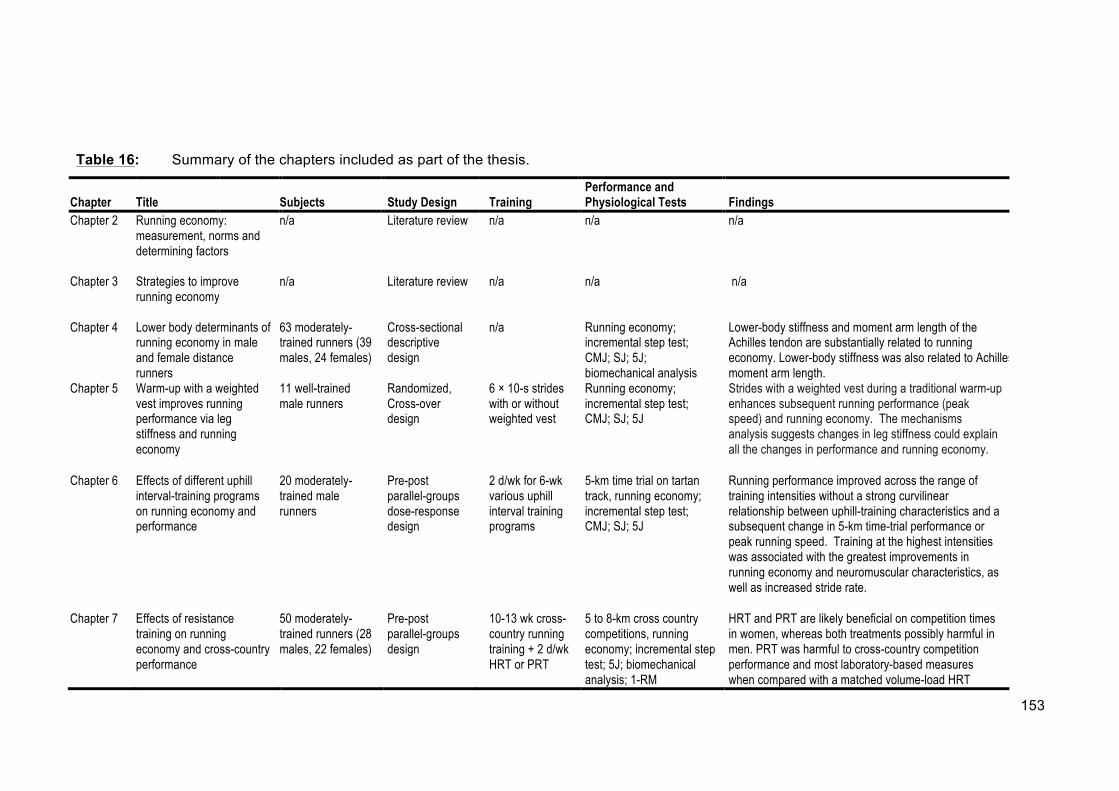
153
Table 16: Summary of the chapters included as part of the thesis.
Chapter Title Subjects Study Design Training Performance and Physiological Tests Findings
Chapter 2 Running economy: measurement, norms and determining factors
n/a Literature review n/a n/a n/a
Chapter 3 Strategies to improve running economy
n/a
Literature review n/a n/a n/a
Chapter 4 Lower body determinants of running economy in male and female distance runners
63 moderately-trained runners (39 males, 24 females)
Cross-sectional descriptive design
n/a Running economy; incremental step test; CMJ; SJ; 5J; biomechanical analysis
Lower-body stiffness and moment arm length of the Achilles tendon are substantially related to running economy. Lower-body stiffness was also related to Achilles moment arm length.
Chapter 5 Warm-up with a weighted vest improves running performance via leg stiffness and running economy
11 well-trained male runners
Randomized, Cross-over design
6 × 10-s strides with or without weighted vest
Running economy; incremental step test; CMJ; SJ; 5J
Strides with a weighted vest during a traditional warm-up enhances subsequent running performance (peak speed) and running economy. The mechanisms analysis suggests changes in leg stiffness could explain all the changes in performance and running economy.
Chapter 6 Effects of different uphill interval-training programs on running economy and performance
20 moderately-trained male runners
Pre-post parallel-groups dose-response design
2 d/wk for 6-wk various uphill interval training programs
5-km time trial on tartan track, running economy; incremental step test; CMJ; SJ; 5J
Running performance improved across the range of training intensities without a strong curvilinear relationship between uphill-training characteristics and a subsequent change in 5-km time-trial performance or peak running speed. Training at the highest intensities was associated with the greatest improvements in running economy and neuromuscular characteristics, as well as increased stride rate.
Chapter 7 Effects of resistance training on running economy and cross-country performance
50 moderately-trained runners (28 males, 22 females)
Pre-post parallel-groups design
10-13 wk cross-country running training + 2 d/wk HRT or PRT
5 to 8-km cross country competitions, running economy; incremental step test; 5J; biomechanical analysis; 1-RM
HRT and PRT are likely beneficial on competition times in women, whereas both treatments possibly harmful in men. PRT was harmful to cross-country competition performance and most laboratory-based measures when compared with a matched volume-load HRT
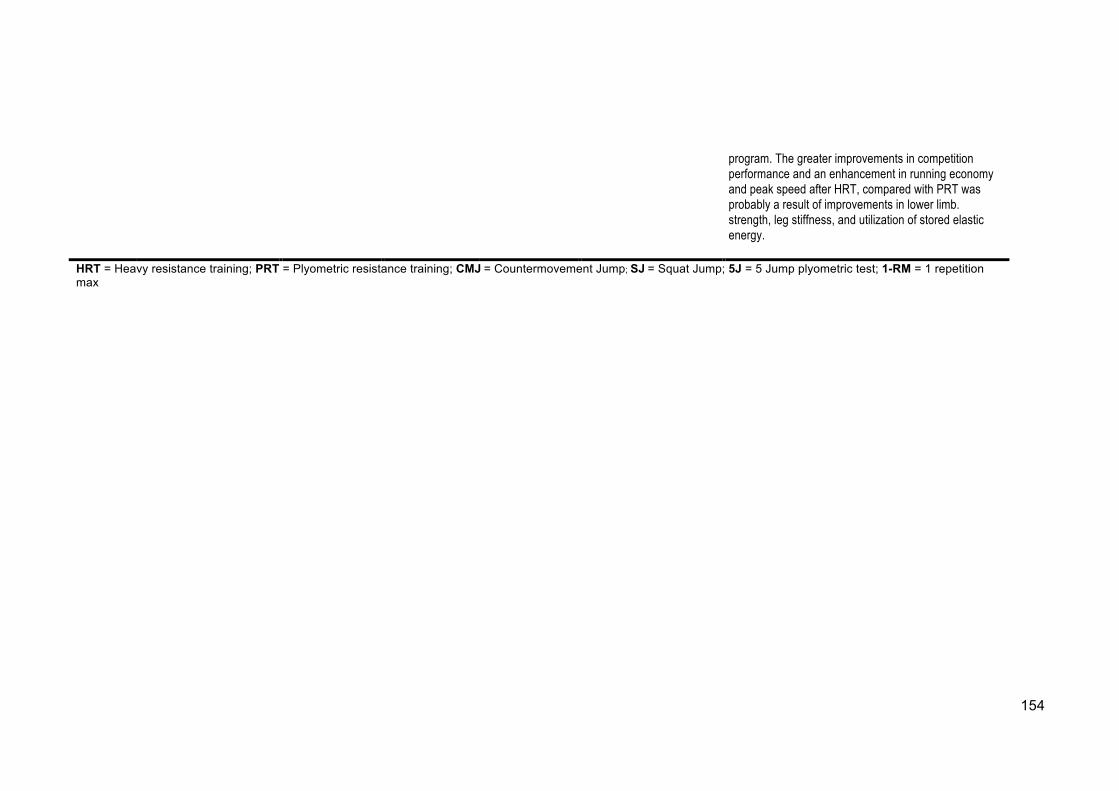
154
program. The greater improvements in competition performance and an enhancement in running economy and peak speed after HRT, compared with PRT was probably a result of improvements in lower limb. strength, leg stiffness, and utilization of stored elastic energy.
HRT = Heavy resistance training; PRT = Plyometric resistance training; CMJ = Countermovement Jump; SJ = Squat Jump; 5J = 5 Jump plyometric test; 1-RM = 1 repetition max
155
8.1 Research Questions
8.1.1 What are the lower-body determinants of running economy among
male and female trained distance runners?
Despite the performance benefits of being an economical runner, researchers
have yet to resolve why some runners demonstrate markedly better economy when
compared to counterparts exhibiting similar fitness, training history and performance
backgrounds (Conley & Krahenbuhl, 1980; Daniels & Daniels, 1992; Daniels,
Krahenbuhl, et al., 1977; Williams & Cavanagh, 1987). While Chapter 2
comprehensively reviewed the metabolic, cardiorespiratory, biomechanical and
neuromuscular factors that may affect the measurement of running economy, and
Chapter 3 discussed the current state of knowledge in regards to improving running
economy, the findings of Chapter 4 begin to elucidate some of the lower-body
determinants of running economy (Barnes, McGuigan, & Kilding, in press), which may
be useful to explain differences between individuals or groups of runners or provide
mechanisms to explain changes following training. A range of trainable and non-
modifiable factors were identified as determinants of running economy. Of interest, leg
stiffness (r = -0.80) and moment arm length (r = 0.90) were large-extremely largely
correlated with running economy. These results were similar to other studies
(Arampatzis et al., 2006; Dumke et al., 2010), which demonstrated that lower body
stiffness is substantially related to running economy of well-trained runners. The
relationship between moment arm length and running economy was expected based
on a simple musculoskeletal model of tendon energy storage (Scholz et al., 2008) but
the magnitude of this relationship (r = 0.90) was considerably larger than previously
reported by Raichlen et al. (2011) (r = 0.64) and Scholz et al. (2008) (r = 0.77) using
small sample sizes of 8 and 15, respectively (Raichlen et al., 2011; Scholz et al., 2008).
This study also showed that lower body stiffness was related to the moment arm of the
Achilles tendon (r = -0.82) (Figure 9). This is a unique finding not previously reported
in the literature and suggests the Achilles moment arm length may affect stiffness
properties following training. Although Achilles moment arm length is a non-modifiable
factor affecting running economy, for practitioners this is an easy determinant to
measure and may help scientists and coaches understand why some athletes have
good, average or poor economy and may also be a determinant of setting the upper
and lower limits of an individual’s ability to improve their running economy following
training.

156
8.1.2 What is the efficacy of augmenting running economy and
performance acutely?
Prior warm-up activities are a widely accepted practice preceding nearly every
athletic event to prepare the body for optimal competition performance (Bishop, 2003).
An active warm-up is arguably the most widely used warm-up technique for distance
runners because it is likely to induce specific metabolic and cardiovascular changes
conducive to distance-running performance (Bishop, 2003). Recent research has
focused on various warm-up exercises that can alter oxygen uptake (VO2) kinetic
responses to subsequent high-intensity exercise and enhance performance (Bishop et
al., 2001; Hajoglou et al., 2005; Ingham et al., 2013). However, neuromuscular
characteristics have also been recognized as an important determinant of endurance
performance (Paavolainen, Hakkinen, et al., 1999). Indeed, different training regimens
over the course of several weeks to months have demonstrated concomitant
improvements in neuromuscular measures, running economy and distance running
performance (Paavolainen, Hakkinen, et al., 1999; Spurrs et al., 2003). In Chapter 5,
the acute effects of a warm-up while wearing a weighted vest on neuromuscular
measures, running economy and distance running performance were examined. The
weighted vest condition resulted in a very-large enhancement of peak running speed
(2.9%; 90% confidence limits ±0.8%), a moderate increase in leg stiffness (20.4%;
±4.2%) and a large improvement in running economy (6.0%; ±1.6%); there were also
small-moderate clear reductions in cardiorespiratory measures. According to Hopkins
(2001) the 2.9% improvement in performance should result in a similar change in
running competition time (Hopkins et al., 2001). The effect was substantially greater
than those in comparable studies. For example, Ingham et al. (2013) reported a 1.2 s
(~1%) improvement in 800-m running performance following a high-intensity warm-up
compared to a traditional warm-up similar to that in this study (Ingham et al., 2013).
Interestingly, performance was enhanced despite a small negative effect on perceived
race readiness, which suggested the underlying mechanism of the enhancement was
more than enough to overcome some sense of fatigue induced by the weighted-vest
regimen. The mechanisms analysis supported this premise, in that using a linear
regression model for the change scores in performance and change scores in
respective mechanism variables, we determined that of the 2.9% improvement in
performance, 3.4% (±90%; ±1.1) was associated with changes in stiffness, while the
change not associated with improvements in leg stiffness was -0.5% (±1.2%),
indicating the change in performance independent of changes in stiffness following
weighted-vest condition would have actually resulted in a 0.5% impairment in
performance.
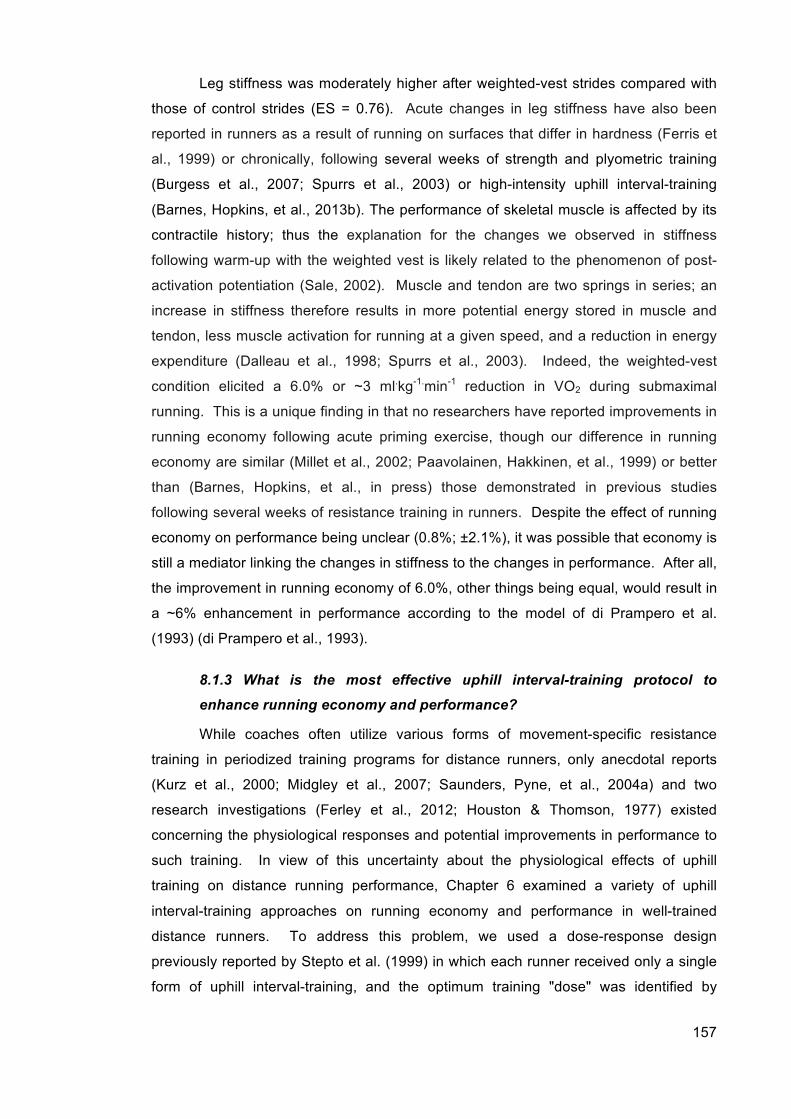
157
Leg stiffness was moderately higher after weighted-vest strides compared with
those of control strides (ES = 0.76). Acute changes in leg stiffness have also been
reported in runners as a result of running on surfaces that differ in hardness (Ferris et
al., 1999) or chronically, following several weeks of strength and plyometric training
(Burgess et al., 2007; Spurrs et al., 2003) or high-intensity uphill interval-training
(Barnes, Hopkins, et al., 2013b). The performance of skeletal muscle is affected by its
contractile history; thus the explanation for the changes we observed in stiffness
following warm-up with the weighted vest is likely related to the phenomenon of post-
activation potentiation (Sale, 2002). Muscle and tendon are two springs in series; an
increase in stiffness therefore results in more potential energy stored in muscle and
tendon, less muscle activation for running at a given speed, and a reduction in energy
expenditure (Dalleau et al., 1998; Spurrs et al., 2003). Indeed, the weighted-vest
condition elicited a 6.0% or ~3 ml.kg-1.min-1 reduction in VO2 during submaximal
running. This is a unique finding in that no researchers have reported improvements in
running economy following acute priming exercise, though our difference in running
economy are similar (Millet et al., 2002; Paavolainen, Hakkinen, et al., 1999) or better
than (Barnes, Hopkins, et al., in press) those demonstrated in previous studies
following several weeks of resistance training in runners. Despite the effect of running
economy on performance being unclear (0.8%; ±2.1%), it was possible that economy is
still a mediator linking the changes in stiffness to the changes in performance. After all,
the improvement in running economy of 6.0%, other things being equal, would result in
a ~6% enhancement in performance according to the model of di Prampero et al.
(1993) (di Prampero et al., 1993).
8.1.3 What is the most effective uphill interval-training protocol to
enhance running economy and performance?
While coaches often utilize various forms of movement-specific resistance
training in periodized training programs for distance runners, only anecdotal reports
(Kurz et al., 2000; Midgley et al., 2007; Saunders, Pyne, et al., 2004a) and two
research investigations (Ferley et al., 2012; Houston & Thomson, 1977) existed
concerning the physiological responses and potential improvements in performance to
such training. In view of this uncertainty about the physiological effects of uphill
training on distance running performance, Chapter 6 examined a variety of uphill
interval-training approaches on running economy and performance in well-trained
distance runners. To address this problem, we used a dose-response design
previously reported by Stepto et al. (1999) in which each runner received only a single
form of uphill interval-training, and the optimum training "dose" was identified by
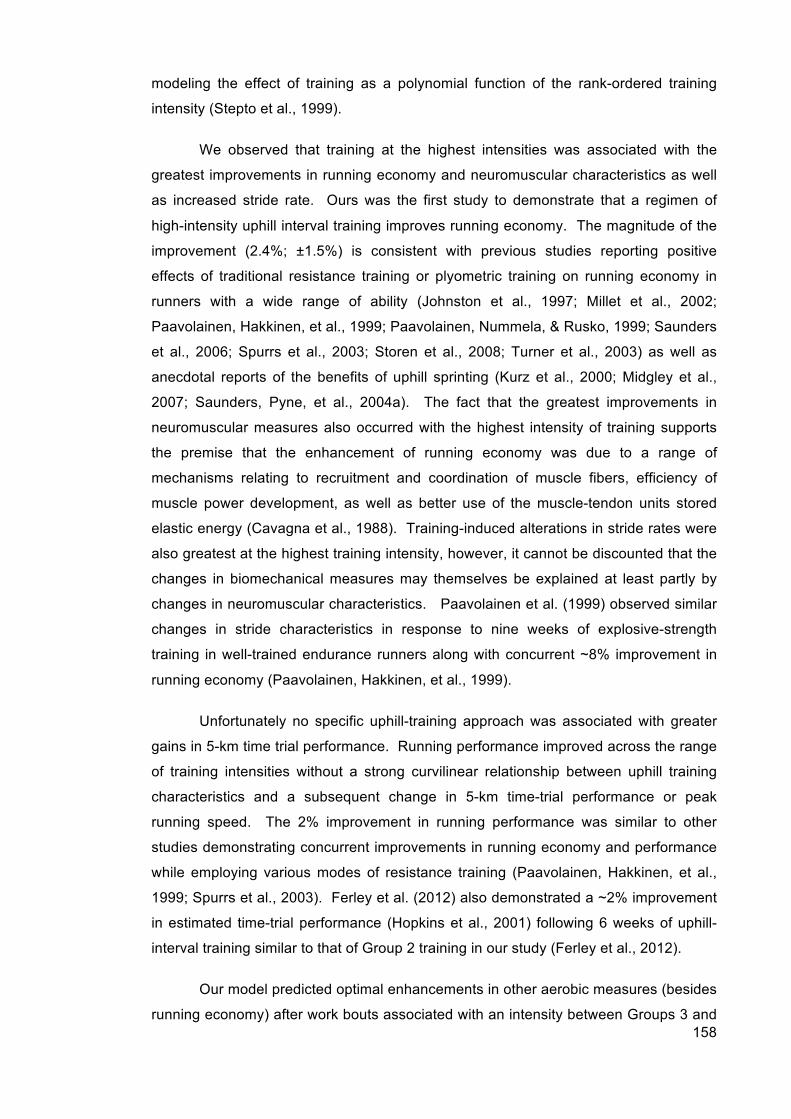
158
modeling the effect of training as a polynomial function of the rank-ordered training
intensity (Stepto et al., 1999).
We observed that training at the highest intensities was associated with the
greatest improvements in running economy and neuromuscular characteristics as well
as increased stride rate. Ours was the first study to demonstrate that a regimen of
high-intensity uphill interval training improves running economy. The magnitude of the
improvement (2.4%; ±1.5%) is consistent with previous studies reporting positive
effects of traditional resistance training or plyometric training on running economy in
runners with a wide range of ability (Johnston et al., 1997; Millet et al., 2002;
Paavolainen, Hakkinen, et al., 1999; Paavolainen, Nummela, & Rusko, 1999; Saunders
et al., 2006; Spurrs et al., 2003; Storen et al., 2008; Turner et al., 2003) as well as
anecdotal reports of the benefits of uphill sprinting (Kurz et al., 2000; Midgley et al.,
2007; Saunders, Pyne, et al., 2004a). The fact that the greatest improvements in
neuromuscular measures also occurred with the highest intensity of training supports
the premise that the enhancement of running economy was due to a range of
mechanisms relating to recruitment and coordination of muscle fibers, efficiency of
muscle power development, as well as better use of the muscle-tendon units stored
elastic energy (Cavagna et al., 1988). Training-induced alterations in stride rates were
also greatest at the highest training intensity, however, it cannot be discounted that the
changes in biomechanical measures may themselves be explained at least partly by
changes in neuromuscular characteristics. Paavolainen et al. (1999) observed similar
changes in stride characteristics in response to nine weeks of explosive-strength
training in well-trained endurance runners along with concurrent ~8% improvement in
running economy (Paavolainen, Hakkinen, et al., 1999).
Unfortunately no specific uphill-training approach was associated with greater
gains in 5-km time trial performance. Running performance improved across the range
of training intensities without a strong curvilinear relationship between uphill training
characteristics and a subsequent change in 5-km time-trial performance or peak
running speed. The 2% improvement in running performance was similar to other
studies demonstrating concurrent improvements in running economy and performance
while employing various modes of resistance training (Paavolainen, Hakkinen, et al.,
1999; Spurrs et al., 2003). Ferley et al. (2012) also demonstrated a ~2% improvement
in estimated time-trial performance (Hopkins et al., 2001) following 6 weeks of uphill-
interval training similar to that of Group 2 training in our study (Ferley et al., 2012).
Our model predicted optimal enhancements in other aerobic measures (besides
running economy) after work bouts associated with an intensity between Groups 3 and

159
4 training. The enhancements observed was unsurprising since the intensity of these
work bouts occurred at or near VO2max, which is in accord with the principle of
specificity. It is highly likely these changes were a result of the additional uphill interval
training because all subjects were undertaking similar running training outside of the
present study (95 ± 25 km.wk-1). In contrast, the two studies utilizing uphill interval-
training reported no change (Houston & Thomson, 1977) or a decrement in VO2max
(Ferley et al., 2012).
8.1.4 Does the addition of plyometric training to traditional heavy-
resistance training enhance running economy and performance more
than heavy resistance-training alone?
Heavy-resistance training and plyometric training offer distinct physiological,
biomechanical and neuromuscular adaptations that could enhance running economy
and consequently distance-running performance. Recent research has shown running
economy to improve in runners using traditional strength training or explosive,
plyometric training (Johnston et al., 1997; Paavolainen, Hakkinen, et al., 1999;
Saunders et al., 2006), however, the optimal prescription of resistance training to
improve endurance running performance had yet to be firmly established. In light of
this limitation, Chapter 7 examined the efficacy of combining both heavy-resistance
training and plyometric training to facilitate additional improvements in running
economy via an accumulation of adaptations previously observed when either type of
training is performed alone. Given there was a strong association between running
economy and distance running performance (Barnes, Hopkins, McGuigan, & Kilding,
2013a; Conley & Krahenbuhl, 1980; Daniels, 1985; Daniels & Daniels, 1992) and to
enhance to ecological validity of the study, we adopted a novel design previously
reported by Vandenbogaerde, Hopkins and Pyne (2012) to investigate the effects of
our intervention on actual competition performance (Vandenbogaerde et al., 2012).
Interestingly, our data revealed distinct differences between the prescribed training
regimes in terms of performance gains and physiological adaptations, and an apparent
gender-specific response to resistance training. For example, there were substantial
beneficial mean effects on competition performance for the female training groups
compared to controls (-1.2 ±1.3%), whereas resistance training for males proved to be
possibly harmful (0.5 ±1.2%). This observation could have been an indication that
endurance-trained female athletes may have a greater requirement in terms of
resistance training maintenance (Peterson et al., 2011), whereas for males this training
might be beneficial only during the pre-season or build-up phase of training when there
is less emphasis on competition and gains can be made in physiological measures
without the risk of harm to competition performance. The differences in effects
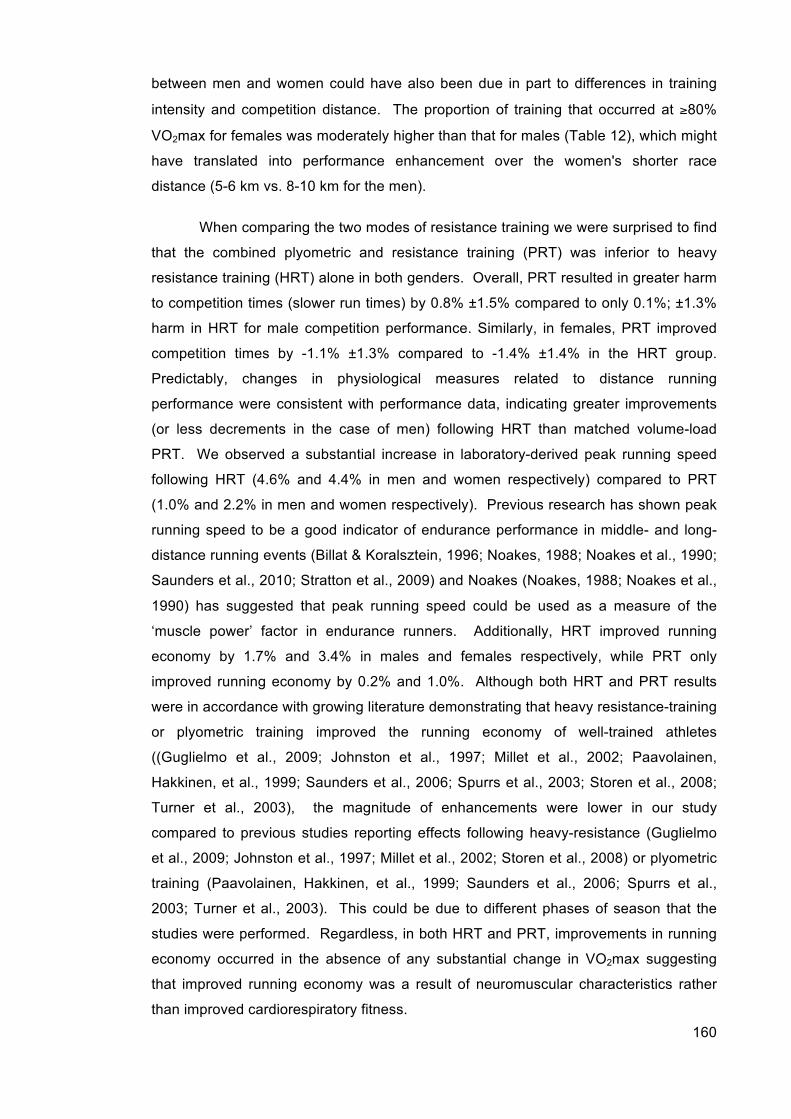
160
between men and women could have also been due in part to differences in training
intensity and competition distance. The proportion of training that occurred at ≥80%
VO2max for females was moderately higher than that for males (Table 12), which might
have translated into performance enhancement over the women's shorter race
distance (5-6 km vs. 8-10 km for the men).
When comparing the two modes of resistance training we were surprised to find
that the combined plyometric and resistance training (PRT) was inferior to heavy
resistance training (HRT) alone in both genders. Overall, PRT resulted in greater harm
to competition times (slower run times) by 0.8% ±1.5% compared to only 0.1%; ±1.3%
harm in HRT for male competition performance. Similarly, in females, PRT improved
competition times by -1.1% ±1.3% compared to -1.4% ±1.4% in the HRT group.
Predictably, changes in physiological measures related to distance running
performance were consistent with performance data, indicating greater improvements
(or less decrements in the case of men) following HRT than matched volume-load
PRT. We observed a substantial increase in laboratory-derived peak running speed
following HRT (4.6% and 4.4% in men and women respectively) compared to PRT
(1.0% and 2.2% in men and women respectively). Previous research has shown peak
running speed to be a good indicator of endurance performance in middle- and long-
distance running events (Billat & Koralsztein, 1996; Noakes, 1988; Noakes et al., 1990;
Saunders et al., 2010; Stratton et al., 2009) and Noakes (Noakes, 1988; Noakes et al.,
1990) has suggested that peak running speed could be used as a measure of the
‘muscle power’ factor in endurance runners. Additionally, HRT improved running
economy by 1.7% and 3.4% in males and females respectively, while PRT only
improved running economy by 0.2% and 1.0%. Although both HRT and PRT results
were in accordance with growing literature demonstrating that heavy resistance-training
or plyometric training improved the running economy of well-trained athletes
((Guglielmo et al., 2009; Johnston et al., 1997; Millet et al., 2002; Paavolainen,
Hakkinen, et al., 1999; Saunders et al., 2006; Spurrs et al., 2003; Storen et al., 2008;
Turner et al., 2003), the magnitude of enhancements were lower in our study
compared to previous studies reporting effects following heavy-resistance (Guglielmo
et al., 2009; Johnston et al., 1997; Millet et al., 2002; Storen et al., 2008) or plyometric
training (Paavolainen, Hakkinen, et al., 1999; Saunders et al., 2006; Spurrs et al.,
2003; Turner et al., 2003). This could be due to different phases of season that the
studies were performed. Regardless, in both HRT and PRT, improvements in running
economy occurred in the absence of any substantial change in VO2max suggesting
that improved running economy was a result of neuromuscular characteristics rather
than improved cardiorespiratory fitness.
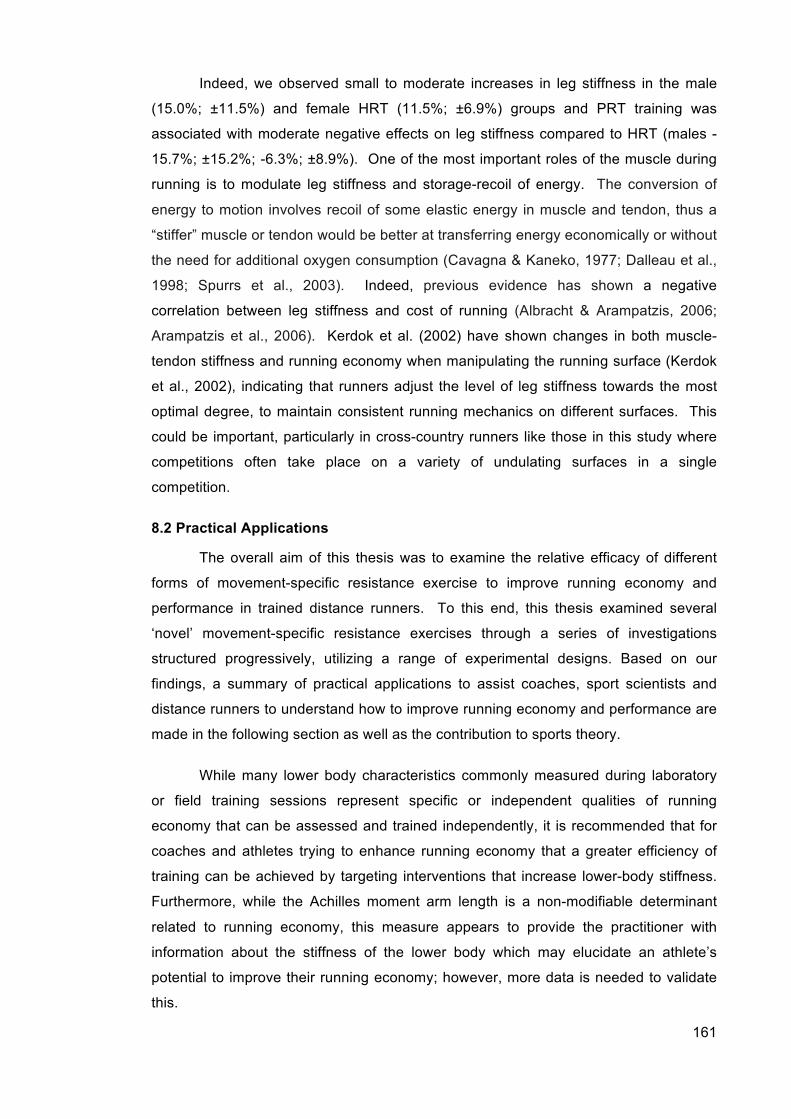
161
Indeed, we observed small to moderate increases in leg stiffness in the male
(15.0%; ±11.5%) and female HRT (11.5%; ±6.9%) groups and PRT training was
associated with moderate negative effects on leg stiffness compared to HRT (males -
15.7%; ±15.2%; -6.3%; ±8.9%). One of the most important roles of the muscle during
running is to modulate leg stiffness and storage-recoil of energy. The conversion of
energy to motion involves recoil of some elastic energy in muscle and tendon, thus a
“stiffer” muscle or tendon would be better at transferring energy economically or without
the need for additional oxygen consumption (Cavagna & Kaneko, 1977; Dalleau et al.,
1998; Spurrs et al., 2003). Indeed, previous evidence has shown a negative
correlation between leg stiffness and cost of running (Albracht & Arampatzis, 2006;
Arampatzis et al., 2006). Kerdok et al. (2002) have shown changes in both muscle-
tendon stiffness and running economy when manipulating the running surface (Kerdok
et al., 2002), indicating that runners adjust the level of leg stiffness towards the most
optimal degree, to maintain consistent running mechanics on different surfaces. This
could be important, particularly in cross-country runners like those in this study where
competitions often take place on a variety of undulating surfaces in a single
competition.
8.2 Practical Applications
The overall aim of this thesis was to examine the relative efficacy of different
forms of movement-specific resistance exercise to improve running economy and
performance in trained distance runners. To this end, this thesis examined several
‘novel’ movement-specific resistance exercises through a series of investigations
structured progressively, utilizing a range of experimental designs. Based on our
findings, a summary of practical applications to assist coaches, sport scientists and
distance runners to understand how to improve running economy and performance are
made in the following section as well as the contribution to sports theory.
While many lower body characteristics commonly measured during laboratory
or field training sessions represent specific or independent qualities of running
economy that can be assessed and trained independently, it is recommended that for
coaches and athletes trying to enhance running economy that a greater efficiency of
training can be achieved by targeting interventions that increase lower-body stiffness.
Furthermore, while the Achilles moment arm length is a non-modifiable determinant
related to running economy, this measure appears to provide the practitioner with
information about the stiffness of the lower body which may elucidate an athlete’s
potential to improve their running economy; however, more data is needed to validate
this.
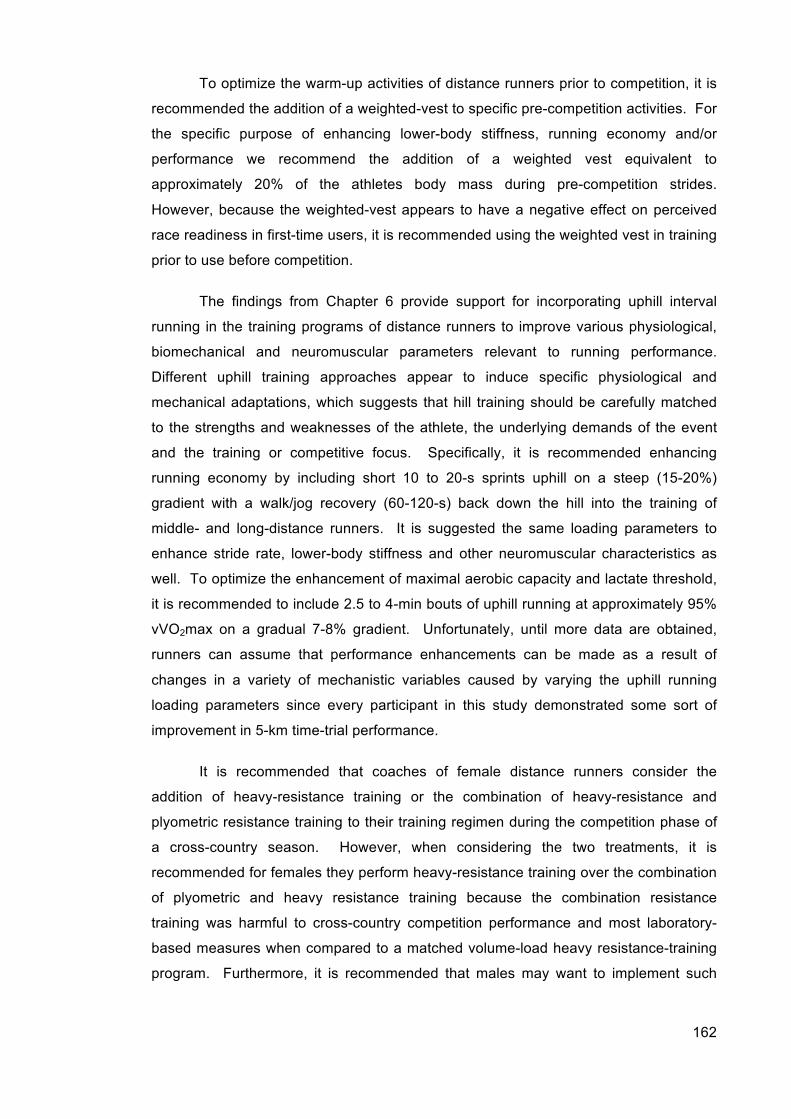
162
To optimize the warm-up activities of distance runners prior to competition, it is
recommended the addition of a weighted-vest to specific pre-competition activities. For
the specific purpose of enhancing lower-body stiffness, running economy and/or
performance we recommend the addition of a weighted vest equivalent to
approximately 20% of the athletes body mass during pre-competition strides.
However, because the weighted-vest appears to have a negative effect on perceived
race readiness in first-time users, it is recommended using the weighted vest in training
prior to use before competition.
The findings from Chapter 6 provide support for incorporating uphill interval
running in the training programs of distance runners to improve various physiological,
biomechanical and neuromuscular parameters relevant to running performance.
Different uphill training approaches appear to induce specific physiological and
mechanical adaptations, which suggests that hill training should be carefully matched
to the strengths and weaknesses of the athlete, the underlying demands of the event
and the training or competitive focus. Specifically, it is recommended enhancing
running economy by including short 10 to 20-s sprints uphill on a steep (15-20%)
gradient with a walk/jog recovery (60-120-s) back down the hill into the training of
middle- and long-distance runners. It is suggested the same loading parameters to
enhance stride rate, lower-body stiffness and other neuromuscular characteristics as
well. To optimize the enhancement of maximal aerobic capacity and lactate threshold,
it is recommended to include 2.5 to 4-min bouts of uphill running at approximately 95%
vVO2max on a gradual 7-8% gradient. Unfortunately, until more data are obtained,
runners can assume that performance enhancements can be made as a result of
changes in a variety of mechanistic variables caused by varying the uphill running
loading parameters since every participant in this study demonstrated some sort of
improvement in 5-km time-trial performance.
It is recommended that coaches of female distance runners consider the
addition of heavy-resistance training or the combination of heavy-resistance and
plyometric resistance training to their training regimen during the competition phase of
a cross-country season. However, when considering the two treatments, it is
recommended for females they perform heavy-resistance training over the combination
of plyometric and heavy resistance training because the combination resistance
training was harmful to cross-country competition performance and most laboratory-
based measures when compared to a matched volume-load heavy resistance-training
program. Furthermore, it is recommended that males may want to implement such
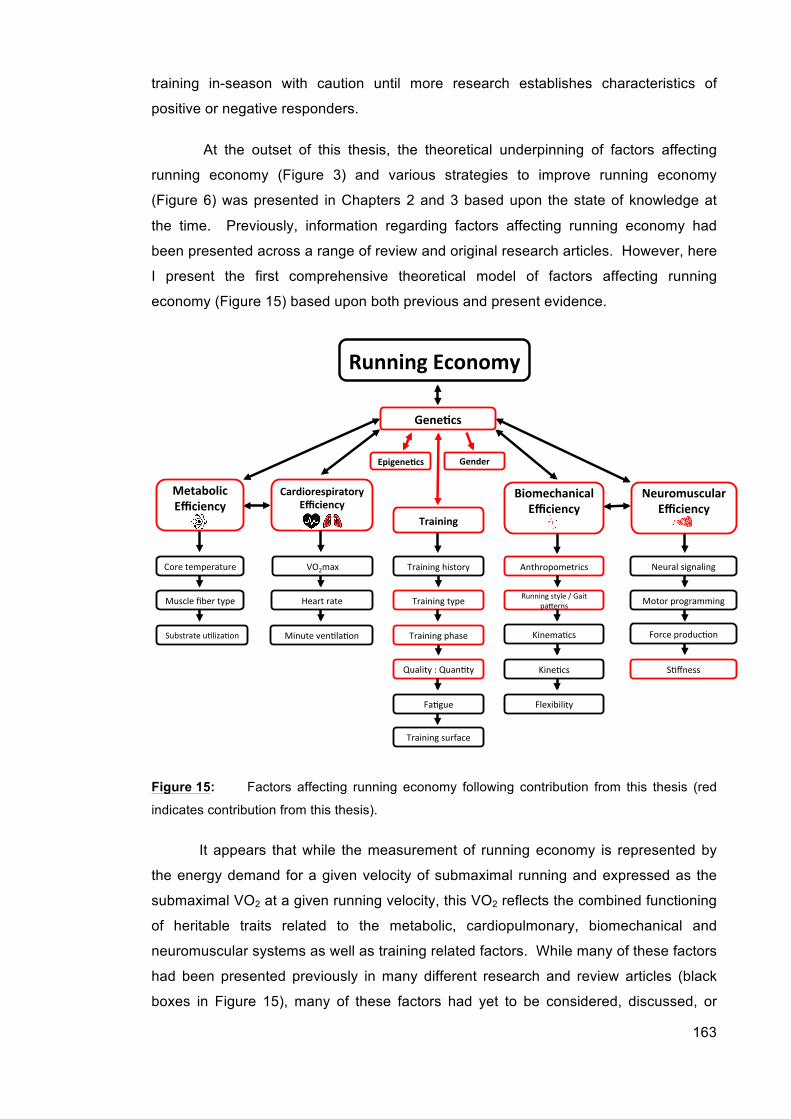
163
training in-season with caution until more research establishes characteristics of
positive or negative responders.
At the outset of this thesis, the theoretical underpinning of factors affecting
running economy (Figure 3) and various strategies to improve running economy
(Figure 6) was presented in Chapters 2 and 3 based upon the state of knowledge at
the time. Previously, information regarding factors affecting running economy had
been presented across a range of review and original research articles. However, here
I present the first comprehensive theoretical model of factors affecting running
economy (Figure 15) based upon both previous and present evidence.
Figure 15: Factors affecting running economy following contribution from this thesis (red
indicates contribution from this thesis).
It appears that while the measurement of running economy is represented by
the energy demand for a given velocity of submaximal running and expressed as the
submaximal VO2 at a given running velocity, this VO2 reflects the combined functioning
of heritable traits related to the metabolic, cardiopulmonary, biomechanical and
neuromuscular systems as well as training related factors. While many of these factors
had been presented previously in many different research and review articles (black
boxes in Figure 15), many of these factors had yet to be considered, discussed, or
Running&Economy&
Metabolic&Efficiency&
&
Biomechanical&Efficiency&
&
Neuromuscular&Efficiency&
&
Figure 2. Factors affecting running economy following Thesis.
Cardiorespiratory&Efficiency&
&
VO2max'
Heart'rate'
Minute'ven9la9on'
Core'temperature'
Muscle'fiber'type'
Substrate'u9liza9on'
Anthropometrics'
Running'style'/'Gait'paRerns'
Kinema9cs'
Kine9cs'
Neural'signaling'
Motor'programming'
Force'produc9on'
S9ffness'
Flexibility'
Gene@cs&
Training'surface'
Training'history'
Training'type'
Epigene@cs&& Gender&
Training&
Fa9gue'
Quality':'Quan9ty'
Training'phase'
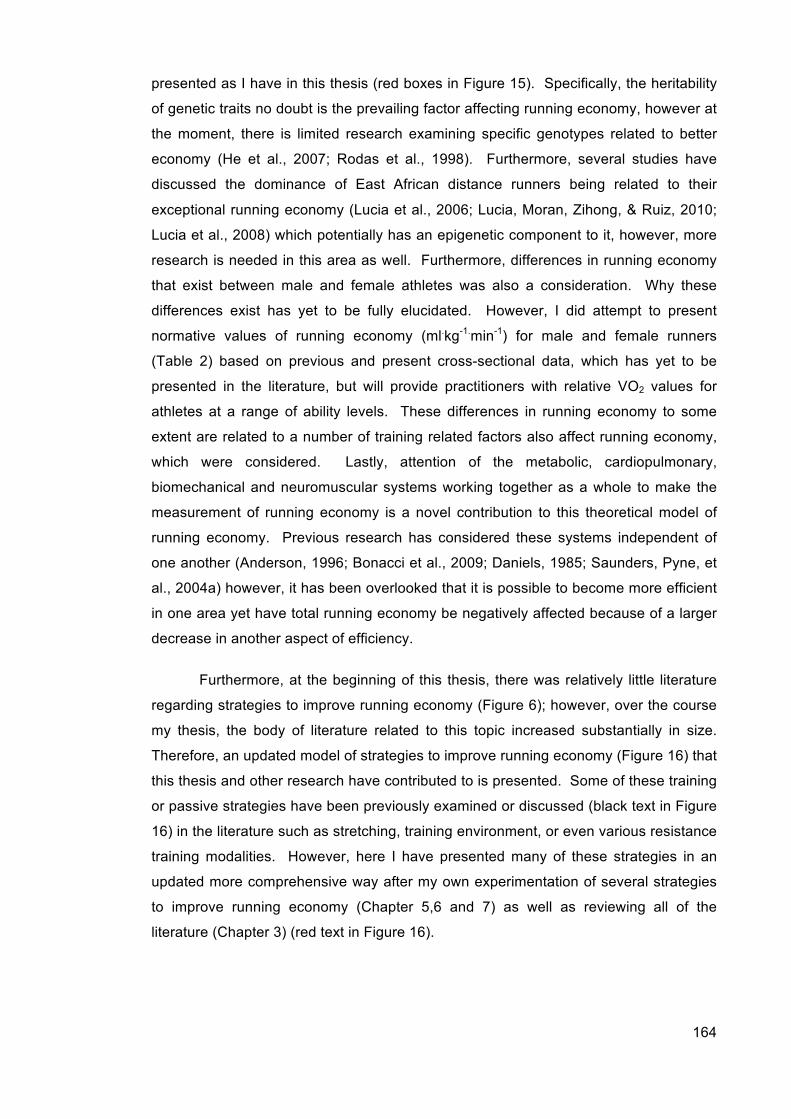
164
presented as I have in this thesis (red boxes in Figure 15). Specifically, the heritability
of genetic traits no doubt is the prevailing factor affecting running economy, however at
the moment, there is limited research examining specific genotypes related to better
economy (He et al., 2007; Rodas et al., 1998). Furthermore, several studies have
discussed the dominance of East African distance runners being related to their
exceptional running economy (Lucia et al., 2006; Lucia, Moran, Zihong, & Ruiz, 2010;
Lucia et al., 2008) which potentially has an epigenetic component to it, however, more
research is needed in this area as well. Furthermore, differences in running economy
that exist between male and female athletes was also a consideration. Why these
differences exist has yet to be fully elucidated. However, I did attempt to present
normative values of running economy (ml.kg-1.min-1) for male and female runners
(Table 2) based on previous and present cross-sectional data, which has yet to be
presented in the literature, but will provide practitioners with relative VO2 values for
athletes at a range of ability levels. These differences in running economy to some
extent are related to a number of training related factors also affect running economy,
which were considered. Lastly, attention of the metabolic, cardiopulmonary,
biomechanical and neuromuscular systems working together as a whole to make the
measurement of running economy is a novel contribution to this theoretical model of
running economy. Previous research has considered these systems independent of
one another (Anderson, 1996; Bonacci et al., 2009; Daniels, 1985; Saunders, Pyne, et
al., 2004a) however, it has been overlooked that it is possible to become more efficient
in one area yet have total running economy be negatively affected because of a larger
decrease in another aspect of efficiency.
Furthermore, at the beginning of this thesis, there was relatively little literature
regarding strategies to improve running economy (Figure 6); however, over the course
my thesis, the body of literature related to this topic increased substantially in size.
Therefore, an updated model of strategies to improve running economy (Figure 16) that
this thesis and other research have contributed to is presented. Some of these training
or passive strategies have been previously examined or discussed (black text in Figure
16) in the literature such as stretching, training environment, or even various resistance
training modalities. However, here I have presented many of these strategies in an
updated more comprehensive way after my own experimentation of several strategies
to improve running economy (Chapter 5,6 and 7) as well as reviewing all of the
literature (Chapter 3) (red text in Figure 16).
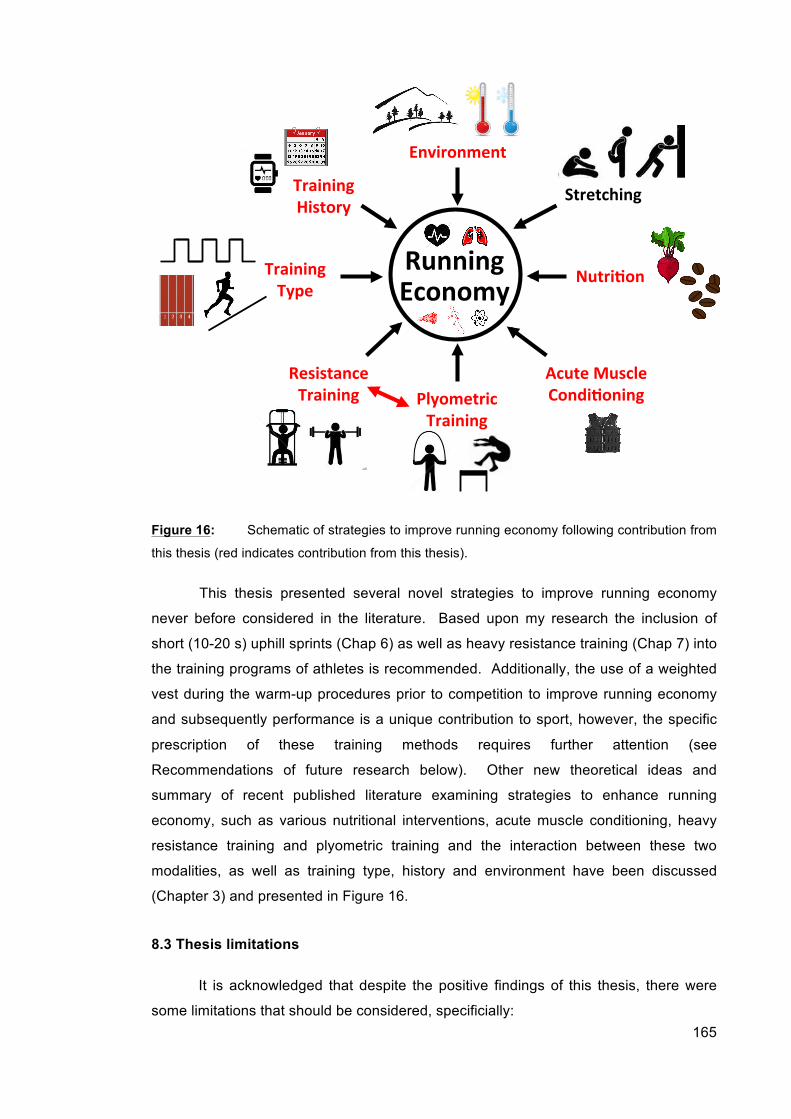
165
Figure 16: Schematic of strategies to improve running economy following contribution from
this thesis (red indicates contribution from this thesis).
This thesis presented several novel strategies to improve running economy
never before considered in the literature. Based upon my research the inclusion of
short (10-20 s) uphill sprints (Chap 6) as well as heavy resistance training (Chap 7) into
the training programs of athletes is recommended. Additionally, the use of a weighted
vest during the warm-up procedures prior to competition to improve running economy
and subsequently performance is a unique contribution to sport, however, the specific
prescription of these training methods requires further attention (see
Recommendations of future research below). Other new theoretical ideas and
summary of recent published literature examining strategies to enhance running
economy, such as various nutritional interventions, acute muscle conditioning, heavy
resistance training and plyometric training and the interaction between these two
modalities, as well as training type, history and environment have been discussed
(Chapter 3) and presented in Figure 16.
8.3 Thesis limitations
It is acknowledged that despite the positive findings of this thesis, there were
some limitations that should be considered, specificially:
Running&&Economy& Nutri@on&
Environment&
Training&History&
Resistance&Training&
Stretching&
Training&Type&
Plyometric&Training&
Acute&Muscle&Condi@oning&
166
• In study 3 (Chapter 6), we adopted a unique experimental design, first adopted
by Stepto et al. (1999) to determine to determine the most effective uphill
interval-training protocol on running economy and performance in well-trained
distance runners (Stepto et al., 1999). While initial modelling suggested 20
subjects would be a sufficient sample size, and confidence intervals were
derived for each measure by boostrapping, it is possible that obtaining more
trained runners would have improved chances of establishing a clear optima for
performance measures.
• The error of measurement for neuromuscular measures estimated in Chapter 6
adds some uncertainty to the true relationship between training interventions
and effect (for Chapter 4-7 because all neuromuscular measures were
evaluated using the same methodology equipment) but is not unreasonable,
given that the measured error is population specific and is still comparable to
other reliability studies (Cormack et al., 2008).
• While, the perceived race readiness scale used in Chapter 5 prior to each
subject’s performance trial has not been validated, it has been used previously
by Ingham et al. (2013) (Ingham et al., 2013).
• Endurance performance in Chapter 5 was measured by peak running speed in
an incremental test, rather than performance time trials. Although changes in
peak power tests such as peak running speed are highly correlated with
changes in endurance performance (Hopkins et al., 2001), the changes in peak
running speed observed may not cause an equal change in real life endurance
performance.
• To analyze potential mechanisms underlying the effect of training on
performance in Chapter 6, changes in performance were plotted against
changes in physiological and other measures and the scatterplots inspected for
any linear trend. A clear linear trend in the graph would have allowed for
estimation of the smallest important change in the mechanism variable as the
change that tracked the smallest important change in performance. However,
there were no such clear linear relationships, presumably because random
error of measurement masked any relationship between real individual
differences in changes in performance and the mechanism variable. Therefore,
a different approach to estimating smallest changes was adopted. The
enhancement in performance turned out to be practically constant across the
range of training intensities (~2%). Therefore, to estimate the smallest
167
important change in each mechanism variable, we assumed that the tracking of
changes in the means of the mechanism and performance variables reflected
the underlying relationship in the individual change scores.
While this thesis has demonstrated substantial outcomes that further broaden
the body of knowledge surrounding the various strategies to improve running economy,
the results need to be interpreted with caution given the aforementioned thesis
limitations.
8.4 Recommendations for future research
This thesis examined the influence of various strategies to improve running
economy and performance. While it has addressed a number of questions specific to
this area, further research addressing the following issues is warranted:
• Wherever possible “elite” athletes should be used for future studies since
previous meta-analyses has clearly shown that performance adaptations
between elites and sub-elite athletes are of a differing magnitude. It is likely
that any intervention that facilitates changes in elite athletes will likely also
affect highly-trained and moderately trained athletes.
• Whenever possible, direct measures of neuromuscular activity should be
examined to determine their relationship and effect on running economy
following training.
• In Study 1 (Chapter 4) it was demonstrated that Achilles moment arm length is
a non-modifiable factor that appears to be very largely correlated with running
economy; future research should aim to elucidate why some athletes have good
or poor economy as well as if this lower-limb characteristic sets upper and lower
limits of an individual’s ability to improve their running economy. This
information may help with talent identification as well as explain why some
athletes may be non-responders to specific training regimens.
• Leg stiffness appears to be highly correlated to running economy; therefore,
future studies should aim to determine the trainability of leg stiffness across
varying interventions and levels of fitness.
• In Study 2 (Chapter 5) it was demonstrated that strides with a weighted-vest
have a priming effect on leg stiffness and running economy, which subsequently
had a major effect on peak treadmill running speed. Enhancing this study to
further investigate how to optimize the use of weighted vests in warm-up
168
procedures (e.g. variations in loading parameters) to enhance subsequent
running performance. Little is known about such priming exercise for
endurance performance therefore this information may aid athletes in
preparation for competitions.
• The results from Study 3 (Chapter 6) showed there was no clear optimum of
uphill interval training for 5-km time-trial performance but the highest intensity
was clearly optimal for running economy. Further studies are required to
establish whether improvements derived from uphill interval training can be
established through variations in the frequency, duration, volume and
periodization of training.
• Study 4 (Chapter 7) was the first to investigate the effects of two resistance-
training interventions on actual competition performance. Further studies are
required to investigate the effects of various resistance training interventions
during the competition phase of cross-country and track & field seasons and the
effects on actual competition performance.
8.5 Conclusions
In summary, the findings from this thesis have demonstrated that runners can
improve their running economy through a variety of resistance exercises. This was
seen following both acute and short-term (6-12 weeks) interventions. Study one
identified several lower-body determinants of running economy that could explain
difference or changes following training. Specifically increased leg stiffness and
shorter Achilles moment arm length were identified as deteriminants of running
economy. For the first time in the literature this study also showed that leg stiffness
was related to the length of the moment arm of the Achilles tendon. Several other
variables were small to moderately related to running economy suggesting that running
economy is likely determined from the sum of influences from multiple lower-body
attributes. Study two for the first time demonstrated that high-intensity running with an
added load as part of an athlete’s warm-up routine enhances subsequent performance
in well-trained runners. The regression analysis suggested that the increases in leg
stiffness following weighted vest strides were responsible for the improved
performance, however, the weighted-vest warm-up routine also elicited a 6.0%
improvement in running economy; which, other things being equal, would result in a
~6% enhancement in performance according to the model of di Prampero et al. (1993)
(di Prampero et al., 1993).

169
The findings of study three support anecdotal reports for incorporating uphill
interval training in the training programs of distance runners to improve physiological
parameters relevant to running performance. Specifically we observed that training at
the highest intensities (shortest duration and highest gradient) was associated with the
greatest improvements in running economy and neuromuscular characteristics as well
as increased stride rate. Overall, it appears that different uphill training approaches
appear to induce specific physiological and mechanical adaptations, which suggests
that hill training should be carefully matched to the strengths and weaknesses of the
athlete, the underlying demands of the event and the training or competitive focus.
Study four revealed that the addition of heavy resistance training or plyometric
resistance training to the in season training of female cross-country runners was
beneficial to competition performance, while both treatments were possibly harmful to
male competition performance. However, when the two resistance training treatments
were compared, the addition of plyometric resistance training to heavy resistance
training was harmful to cross-country competition performance and most laboratory-
based measures. The greater improvements in competition performance were
accompanied by an enhancement in running economy and peak running speed
following heavy resistance training, compared to plyometric resistance training,
probably a result of improvements in lower limb strength, leg stiffness and utilization of
stored elastic energy.
Overall, it can be concluded that a variety of strategies can be implemented into
the training of distance runners to improve running economy. Furthermore,
improvements in running economy appear to be modulated through enhancements in
lower-body stiffness. Moreover, it appears that the improvements in running economy
following various training strategies presented in the thesis contribute to improved
running performance.
170
REFERENCES
Aaron, E. A., Seow, K. C., Johnson, B. D., & Dempsey, J. A. (1992). Oxygen cost of exercise hyperpnea: implications for performance. Journal of Applied Physiology, 72(5), 1818-1825.
Abe, D., Fukuoka, Y., Muraki, S., Yasukouchi, A., Sakaguchi, Y., & Niihata, S. (2011). Effects of load and gradient on energy cost of running. Journal of Physiological Anthropology, 30(4), 153-160.
Abe, D., Muraki, S., Yanagawa, K., Fukuoka, Y., & Niihata, S. (2007). Changes in EMG characteristics and metabolic energy cost during 90-min prolonged running. Gait Posture, 26(4), 607-610.
Albracht, K., & Arampatzis, A. (2006). Influence of the mechanical properties of the muscle-tendon unit on force generation in runners with different running economy. Biological Cybernetics, 95(1), 87-96. doi: 10.1007/s00422-006-0070-z
Albracht, K., & Arampatzis, A. (2013). Exercise-induced changes in triceps surae tendon stiffness and muscle strength affect running economy in humans. European Journal of Applied Physiology, 113(6), 1605-1615. doi: 10.1007/s00421-012-2585-4
Alexander, R. (1988). Elastic mechanisms in animal movement. Cambridge: University Press.
Anderson, T. (1996). Biomechanics and running economy. Sports Medicine, 22(2), 76-89.
Anderson, T., & Tseh, W. (1994). Running economy, anthropometric dimensions and kinematic variables [abstract]. Medicine and Science in Sports and Exercise, 26(5 Suppl.), S170.
Arampatzis, A., De Monte, G., Karamanidis, K., Morey-Klapsing, G., Stafilidis, S., & Bruggemann, G. P. (2006). Influence of the muscle-tendon unit's mechanical and morphological properties on running economy. The Journal of Experimental Biology, 209(Pt 17), 3345-3357. doi: 10.1242/jeb.02340
Aruin, A. S., & Prilutskii, B. I. (1985). Relationship of the biomechanical properties of muscles to their ability to utilize elastic deformation energy. Human Physiology, 11(1), 8-12.
Aruin, A. S., Prilutskii, B. I., Raitsin, L. M., & Savel'ev, I. A. (1979). Biomechanical properties of muscles and efficiency of movement. Human Physiology, 5(4), 426-434.
Asmussen, E., & Bonde-Petersen, F. (1974). Apparent efficiency and storage of elastic energy in human muscles during exercise. Acta Physiologica Scandinavica, 92(4), 537-545.
Assumpcao Cde, O., Lima, L. C., Oliveira, F. B., Greco, C. C., & Denadai, B. S. (2013). Exercise-induced muscle damage and running economy in humans. The Scientific World Journal, 2013, 189149. doi: 10.1155/2013/189149
Åstrand, P.-O. (2003). Textbook of work physiology : physiological bases of exercise (4th ed.). Champaign, IL: Human Kinetics.
Aura, O., & Komi, P. V. (1986a). The mechanical efficiency of locomotion in men and women with special emphasis on stretch-shortening cycle exercises. European Journal of Applied Physiology and Occupational Physiology, 55(1), 37-43.
Aura, O., & Komi, P. V. (1986b). Mechanical efficiency of pure positive and pure negative work with special reference to the work intensity. International Journal of Sports Medicine, 7(1), 44-49.
Avela, J., & Komi, P. V. (1998). Reduced stretch reflex sensitivity and muscle stiffness after long-lasting stretch-shortening cycle exercise in humans. European Journal of Applied Physiology and Occupational Physiology, 78(5), 403-410.
Bailey, D. M., Davies, B., Romer, L., Castell, L., Newsholme, E., & Gandy, G. (1998). Implications of moderate altitude training for sea-level endurance in elite
171
distance runners. European Journal of Applied Physiology and Occupational Physiology, 78(4), 360-368.
Bailey, S. J., Fulford, J., Vanhatalo, A., Winyard, P. G., Blackwell, J. R., DiMenna, F. J., . . . Jones, A. M. (2010). Dietary nitrate supplementation enhances muscle contractile efficiency during knee-extensor exercise in humans. Journal of Applied Physiology, 109(1), 135-148. doi: 10.1152/japplphysiol.00046.2010
Bailey, S. J., Winyard, P., Vanhatalo, A., Blackwell, J. R., Dimenna, F. J., Wilkerson, D. P., . . . Jones, A. M. (2009). Dietary nitrate supplementation reduces the O2 cost of low-intensity exercise and enhances tolerance to high-intensity exercise in humans. Journal of Applied Physiology, 107(4), 1144-1155. doi: 10.1152/japplphysiol.00722.2009
Bailey, S. J., Winyard, P. G., Vanhatalo, A., Blackwell, J. R., DiMenna, F. J., Wilkerson, D. P., & Jones, A. M. (2010). Acute L-arginine supplementation reduces the O2 cost of moderate-intensity exercise and enhances high-intensity exercise tolerance. Journal of Applied Physiology, 109(5), 1394-1403. doi: 10.1152/japplphysiol.00503.2010
Bailey, S. P., & Messier, S. P. (1991). Variations in stride length and running economy in male novice runners subsequent to a seven-week training program. International Journal of Sports Medicine, 12(3), 299-304. doi: 10.1055/s-2007-1024685
Bailey, S. P., & Pate, R. R. (1991). Feasibility of improving running economy. Sports Medicine, 12(4), 228-236.
Barnes, K. R., Hopkins, W. G., McGuigan, M. R., & Kilding, A. E. (2013a). Effects of different uphill interval-training programs on running economy and performance. International Journal of Sports Physiology and Performance, in press.
Barnes, K. R., Hopkins, W. G., McGuigan, M. R., & Kilding, A. E. (2013b). Effects of different uphill interval-training programs on running economy and performance. International Journal of Sports Physiology and Performance, 8(6), 639-647.
Barnes, K. R., Hopkins, W. G., McGuigan, M. R., Northuis, M. E., & Kilding, A. E. (2013). Effects of resistance training on running economy and cross-country performance. Med Sci Sports Exerc, 45(12), 2322-2331. doi: 10.1249/MSS.0b013e31829af603
Barnes, K. R., Hopkins, W. G., McGuigan, M. R., Northuis, M. E., & Kilding, A. E. (in press). Effects of resistance training on running economy and cross-country performance. Medicine and Science in Sports and Exercise.
Barnes, K. R., McGuigan, M. R., & Kilding, A. E. (in press). Lower Body Determinants of Running Economy in Male and Female Distance Runners. Journal of Strength and Conditioning Research.
Bastiaans, J. J., van Diemen, A. B., Veneberg, T., & Jeukendrup, A. E. (2001). The effects of replacing a portion of endurance training by explosive strength training on performance in trained cyclists. European Journal of Applied Physiology, 86(1), 79-84.
Beaudoin, C. M., & Whatley Blum, J. (2005). Flexibility and running economy in female collegiate track athletes. The Journal of Sports Medicine and Physical Fitness, 45(3), 295-300.
Beis, L. Y., Polyviou, T., Malkova, D., & Pitsiladis, Y. P. (2011). The effects of creatine and glycerol hyperhydration on running economy in well trained endurance runners. Journal of the International Society of Sports Nutrition, 8(1), 24. doi: 10.1186/1550-2783-8-24
Beneke, R., & Hutler, M. (2005). The effect of training on running economy and performance in recreational athletes. Medicine and Science in Sports and Exercise, 37(10), 1794-1799.
Bergh, U., Sjodin, B., Forsberg, A., & Svedenhag, J. (1991). The relationship between body mass and oxygen uptake during running in humans. Medicine and Science in Sports and Exercise, 23(2), 205-211.
172
Berryman, N., Maurel, D., & Bosquet, L. (2010). Effect of plyometric vs. dynamic weight training on the energy cost of running. Journal of Strength and Conditioning Research, 24(7), 1818-1825. doi: 10.1519/JSC.0b013e3181def1f5
Bhambani, Y., & Singh, M. (1985). Metabolic and cinematographic analysis of walking and running in men and women. Medicine and Science in Sports and Exercise, 17, 131-137.
Billat, L. V. (2001). Interval training for performance: a scientific and empirical practice. Special recommendations for middle- and long-distance running. Part I: aerobic interval training. Sports Medicine, 31(1), 13-31.
Billat, L. V., & Koralsztein, J. P. (1996). Significance of the velocity at VO2max and time to exhaustion at this velocity. Sports Medicine, 22(2), 90-108.
Billat, V. L., Flechet, B., Petit, B., Muriaux, G., & Koralsztein, J. P. (1999). Interval training at VO2max: effects on aerobic performance and overtraining markers. Medicine and Science in Sports and Exercise, 31(1), 156-163.
Binnie, M. J., Dawson, B., Pinnington, H., Landers, G., & Peeling, P. (2013a). Effect of training surface on acute physiological responses after interval training. Journal of Strength and Conditioning Research, 27(4), 1047-1056. doi: 10.1519/JSC.0b013e3182651fab
Binnie, M. J., Dawson, B., Pinnington, H., Landers, G., & Peeling, P. (2013b). Part 2: effect of training surface on acute physiological responses after sport-specific training. Journal of Strength and Conditioning Research, 27(4), 1057-1066. doi: 10.1519/JSC.0b013e3182651d63
Binnie, M. J., Peeling, P., Pinnington, H., Landers, G., & Dawson, B. (2013). Effect of surface-specific training on 20 m sprint performance on sand and grass surfaces. Journal of Strength and Conditioning Research. doi: 10.1519/JSC.0b013e31828f043f
Birnbaum, L. J., & Herbst, J. D. (2004). Physiologic effects of caffeine on cross-country runners. Journal of Strength and Conditioning Research, 18(3), 463-465. doi: 10.1519/1533-4287(2004)18<463:PEOCOC>2.0.CO;2
Bishop, D. (2003). Warm up II: performance changes following active warm up and how to structure the warm up. Sports Medicine, 33(7), 483-498.
Bishop, D., Bonetti, D., & Dawson, B. (2001). The effect of three different warm-up intensities on kayak ergometer performance. Medicine and Science in Sports and Exercise, 33(6), 1026-1032.
Bonacci, J., Chapman, A., Blanch, P., & Vicenzino, B. (2009). Neuromuscular adaptations to training, injury and passive interventions: implications for running economy. Sports Medicine, 39(11), 903-921. doi: 2 [pii]
10.2165/11317850-000000000-00000 Bonetti, D. L., & Hopkins, W. G. (2009). Sea-level exercise performance following
adaptation to hypoxia: a meta-analysis. Sports Medicine, 39(2), 107-127. doi: 2 [pii]
Borg, G. (1970). Perceived exertion as an indicator of somatic stress. Scandinavian Journal of Rehabilitative Medicine, 2(2), 92-98.
Bosco, C., Montanari, G., Ribacchi, R., Giovenali, P., Latteri, F., Iachelli, G., . . . et al. (1987). Relationship between the efficiency of muscular work during jumping and the energetics of running. European Journal of Applied Physiology and Occupational Physiology, 56(2), 138-143.
Bosco, C., Rusko, H., & Hirvonen, J. (1986). The effect of extra-load conditioning on muscle performance in athletes. Medicine and Science in Sports and Exercise, 18(4), 415-419.
Bosco, C., Zanon, S., Rusko, H., Dal Monte, A., Bellotti, P., Latteri, F., . . . et al. (1984). The influence of extra load on the mechanical behavior of skeletal muscle. European Journal of Applied Physiology and Occupational Physiology, 53(2), 149-154.

173
Bourdin, M., Pastene, J., Germain, M., & Lacour, J. R. (1993). Influence of training, sex, age and body mass on the energy cost of running. European Journal of Applied Physiology and Occupational Physiology, 66(5), 439-444.
Bransford, D. R., & Howley, E. T. (1977). Oxygen cost of running in trained and untrained men and women. Medicine and Science in Sports, 9(1), 41-44.
Brisswalter, J., & Legros, P. (1994a). Daily stability in energy cost of running, respiratory parameters and stride rate among well-trained middle distance runners. International Journal of Sports Medicine, 15(5), 238-241. doi: 10.1055/s-2007-1021053
Brisswalter, J., & Legros, P. (1994b). Variability in energy cost of running during one training season in high level runners. The Journal of Sports Medicine and Physical Fitness, 34(2), 135-140.
Brooks, G. A., Fahey, T. D., & White, T. P. (1996). Exercise physiology: human bioenergetics and its applications (2nd ed.). Mountain View, Calif.: Mayfield Pub. Co.
Brooks, G. A., Hittelman, K. J., Faulkner, J. A., & Beyer, R. E. (1971a). Temperature, liver mitochondrial respiratory functions, and oxygen debt. Medicine and Science in Sports, 3(2), 72-74.
Brooks, G. A., Hittelman, K. J., Faulkner, J. A., & Beyer, R. E. (1971b). Temperature, skeletal muscle mitochondrial functions, and oxygen debt. The American journal of physiology, 220(4), 1053-1059.
Brothers, M. D., Doan, B. K., Zupan, M. F., Wile, A. L., Wilber, R. L., & Byrnes, W. C. (2010). Hematological and physiological adaptations following 46 weeks of moderate altitude residence. High Altitude Medicine & Biology, 11(3), 199-208. doi: 10.1089/ham.2009.1090
Bunc, V., & Heller, J. (1989). Energy cost of running in similarly trained men and women. European Journal of Applied Physiology and Occupational Physiology, 59(3), 178-183.
Burgess, K. E., Connick, M. J., Graham-Smith, P., & Pearson, S. J. (2007). Plyometric vs. isometric training influences on tendon properties and muscle output. Journal of Strength and Conditioning Research, 21(3), 986-989. doi: 10.1519/R-20235.1
Burkett, L. N., Kohrt, W. M., & Buchbinder, R. (1985). Effects of shoes and foot orthotics on VO2 and selected frontal plane knee kinematics. Medicine and Science in Sports and Exercise, 17(1), 158-163.
Burtscher, M., Gatterer, H., Faulhaber, M., Gerstgrasser, W., & Schenk, K. (2010). Effects of intermittent hypoxia on running economy. International Journal of Sports Medicine, 31(9), 644-650. doi: 10.1055/s-0030-1255067
Burtscher, M., Nachbauer, W., Baumgartl, P., & Philadelphy, M. (1996). Benefits of training at moderate altitude versus sea level training in amateur runners. European Journal of Applied Physiology and Occupational Physiology, 74(6), 558-563.
Cappozzo, A. (1983a). Force actions in the human trunk during running. The Journal of Sports Medicine and Physical Fitness, 23(1), 14-22.
Cappozzo, A. (1983b). The forces and couples in the human trunk during level walking. Journal of Biomechanics, 16(4), 265-277.
Catlin, M. (1979). Effect of shoe weight on energy cost of running [abstract]. Medicine and Science in Sports and Exercise, 11, 80.
Cavagna, G. A., & Citterio, G. (1974). Effect of stretching on the elastic characteristics and the contractile component of frog striated muscle. The Journal of Physiology, 239(1), 1-14.
Cavagna, G. A., Franzetti, P., Heglund, N. C., & Willems, P. (1988). The determinants of the step frequency in running, trotting and hopping in man and other vertebrates. The Journal of Physiology, 399, 81-92.
174
Cavagna, G. A., Heglund, N. C., & Willems, P. A. (2005). Effect of an increase in gravity on the power output and the rebound of the body in human running. The Journal of Experimental Biology, 208(Pt 12), 2333-2346. doi: 10.1242/jeb.01661
Cavagna, G. A., & Kaneko, M. (1977). Mechanical work and efficiency in level walking and running. The Journal of Physiology, 268(2), 467--481.
Cavagna, G. A., Saibene, F. P., & Margaria, R. (1964). Mechanical work in running. Journal of Applied Physiology, 19, 249-256.
Cavagna, G. A., Willems, P. A., Franzetti, P., & Detrembleur, C. (1991). The two power limits conditioning step frequency in human running. The Journal of Physiology, 437, 95-108.
Cavanagh, P. R., & Kram, R. (1985a). The efficiency of human movement--a statement of the problem. Medicine and Science in Sports and Exercise, 17(3), 304-308.
Cavanagh, P. R., & Kram, R. (1985b). Mechanical and muscular factors affecting the efficiency of human movement. Medicine and Science in Sports and Exercise, 17(3), 326-331.
Cavanagh, P. R., & Kram, R. (1989). Stride length in distance running: velocity, body dimensions and added mass effects. Champaign: Human Kinetics.
Cavanagh, P. R., Pollock, M. L., & Landa, J. (1977). A biomechanical comparison of elite and good distance runners. Annals of the New York Academy of Sciences, 301, 328-345.
Cavanagh, P. R., & Williams, K. R. (1982). The effect of stride length variation on oxygen uptake during distance running. Medicine and Science in Sports and Exercise, 14(1), 30-35.
Chang, Y. H., & Kram, R. (1999). Metabolic cost of generating horizontal forces during human running. Journal of Applied Physiology, 86(5), 1657-1662.
Chapman, A., Vicenzino, B., Blanch, P., & Hodges, P. (2009). Do differences in muscle recruitment between novice and elite cyclists reflect different movement patterns or less skilled muscle recruitment? Journal of Science and Medicine in Sport, 12(1), 31-34. doi: 10.1016/j.jsams.2007.08.012
Chapman, A. R., Vicenzino, B., Blanch, P., & Hodges, P. W. (2007). Leg muscle recruitment during cycling is less developed in triathletes than cyclists despite matched cycling training loads. Experimental Brain Research, 181(3), 503-518. doi: 10.1007/s00221-007-0949-5
Chapman, A. R., Vicenzino, B., Blanch, P., & Hodges, P. W. (2008a). Is running less skilled in triathletes than runners matched for running training history? Medicine and Science in Sports and Exercise, 40(3), 557-565. doi: 10.1249/MSS.0b013e31815e727a
Chapman, A. R., Vicenzino, B., Blanch, P., & Hodges, P. W. (2008b). Patterns of leg muscle recruitment vary between novice and highly trained cyclists. Journal of Electromyography and Kinesiology, 18(3), 359-371. doi: 10.1016/j.jelekin.2005.12.007
Chapman, R. F., Laymon, A. S., Wilhite, D. P., McKenzie, J. M., Tanner, D. A., & Stager, J. M. (2012). Ground contact time as an indicator of metabolic cost in elite distance runners. Medicine and Science in Sports and Exercise, 44(5), 917-925. doi: 10.1249/MSS.0b013e3182400520
Chen, T. C., Nosaka, K., Lin, M. J., Chen, H. L., & Wu, C. J. (2009). Changes in running economy at different intensities following downhill running. Journal of Sports Sciences, 27(11), 1137-1144. doi: 914237246 [pii]
10.1080/02640410903062027 Cheng, B., Kuipers, H., Snyder, A. C., Keizer, H. A., Jeukendrup, A., & Hesselink, M.
(1992). A new approach for the determination of ventilatory and lactate thresholds. International Journal of Sports Medicine, 13(7), 518-522. doi: 10.1055/s-2007-1021309
Cheng, C. F., Cheng, K. H., Lee, Y. M., Huang, H. W., Kuo, Y. H., & Lee, H. J. (2012). Improvement in running economy after 8 weeks of whole-body vibration
175
training. Journal of Strength and Conditioning Research, 26(12), 3349-3357. doi: 10.1519/JSC.0b013e31824e0eb1
Chtara, M., Chamari, K., Chaouachi, M., Chaouachi, A., Koubaa, D., Feki, Y., . . . Amri, M. (2005). Effects of intra-session concurrent endurance and strength training sequence on aerobic performance and capacity. British Journal of Sports Medicine, 39(8), 555-560. doi: 39/8/555 [pii]
10.1136/bjsm.2004.015248 Chtara, M., Chaouachi, A., Levin, G. T., Chaouachi, M., Chamari, K., Amri, M., &
Laursen, P. B. (2008). Effect of concurrent endurance and circuit resistance training sequence on muscular strength and power development. Journal of Strength and Conditioning Research, 22(4), 1037-1045. doi: 10.1519/JSC.0b013e31816a4419
Coast, J. R., & Krause, K. M. (1993). Relationship of oxygen consumption and cardiac output to work of breathing. Medicine and Science in Sports and Exercise, 25(3), 335-340.
Conley, D. G., Krahenbuhl, G., & Burkett, L. N. (1981). Training for aerobic capacity and running economy. Physician and Sportsmedicine, 9, 107-115.
Conley, D. L., & Krahenbuhl, G. S. (1980). Running economy and distance running performance of highly trained athletes. Medicine and Science in Sports and Exercise, 12(5), 357-360.
Conley, D. L., Krahenbuhl, G. S., Burkett, L. E., & Millar, A. L. (1984). Following Steve Scott: physiological changes accompanying training. Physician and Sportsmedicine, 12(1), 103-106.
Cooke, C. B., McDonagh, M. J., Nevill, A. M., & Davies, C. T. (1991). Effects of load on oxygen intake in trained boys and men during treadmill running. Journal of Applied Physiology, 71(4), 1237-1244.
Cormack, S. J., Newton, R. U., McGuigan, M. R., & Doyle, T. L. (2008). Reliability of measures obtained during single and repeated countermovement jumps. International Journal of Sports Physiology and Performance, 3(2), 131-144.
Costill, D. L. (1967). The relationship between selected physiological variables and distance running performance. The Journal of Sports Medicine and Physical Fitness, 7(2), 61-66.
Costill, D. L., Thomason, H., & Roberts, E. (1973). Fractional utilization of the aerobic capacity during distance running. Medicine and Science in Sports, 5(4), 248-252.
Coyle, E. F., Hopper, M. K., & Coggan, A. R. (1990). Maximal oxygen uptake relative to plasma volume expansion. International Journal of Sports Medicine, 11(2), 116-119. doi: 10.1055/s-2007-1024774
Coyle, E. F., Martin, W. H., 3rd, Bloomfield, S. A., Lowry, O. H., & Holloszy, J. O. (1985). Effects of detraining on responses to submaximal exercise. Journal of Applied Physiology, 59(3), 853-859.
Craib, M. W., Mitchell, V. A., Fields, K. B., Cooper, T. R., Hopewell, R., & Morgan, D. W. (1996). The association between flexibility and running economy in sub-elite male distance runners. Medicine and Science in Sports and Exercise, 28(6), 737-743.
Cureton, K. J., Sparling, P. B., Evans, B. W., Johnson, S. M., Kong, U. D., & Purvis, J. W. (1978). Effect of experimental alterations in excess weight on aerobic capacity and distance running performance. Medicine and Science in Sports, 10(3), 194-199.
Dallam, G. M., Wilber, R. L., Jadelis, K., Fletcher, G., & Romanov, N. (2005). Effect of a global alteration of running technique on kinematics and economy. Journal of Sports Sciences, 23(7), 757-764. doi: 10.1080/02640410400022003
Dalleau, G., Belli, A., Bourdin, M., & Lacour, J. R. (1998). The spring-mass model and the energy cost of treadmill running. European Journal of Applied Physiology and Occupational Physiology, 77(3), 257-263.
176
Daniels, J. T. (1974a). Physiological characteristics of champion male athletes. Research Quarterly, 45(4), 342-348.
Daniels, J. T. (1974b). Running with Jim Ryun: a five-year study. Physician and Sportsmedicine, 2 (September), 62-67.
Daniels, J. T. (1985). A physiologist's view of running economy. Medicine and Science in Sports and Exercise, 17(3), 332-338.
Daniels, J. T. (1998). Daniels' running formula Daniels, J. T., & Daniels, N. (1992). Running economy of elite male and elite female
runners. Medicine and Science in Sports and Exercise, 24(4), 483-489. Daniels, J. T., Fitts, R. H., & Sheehan, G. (1978). Conditioning for distance running: the
scientific aspects. New York: John Wiley and Sons. Daniels, J. T., Foster, C., Daniels, S., & Krahenbuhl, G. (1977). Altitude and human
performance with special consideration of the aerobic demands of running. Paper presented at the Proceedings of the NCPEAM/NAPECW National Conference, Orlando, Florida.
Daniels, J. T., & Gilbert, J. (1979). Oxygen Power: Performance Tables for Distance Runners. Tempe, AZ: Daniels and Gilbert, POB 26287.
Daniels, J. T., Krahenbuhl, G., Foster, C., Gilbert, J., & Daniels, S. (1977). Aerobic responses of female distance runners to submaximal and maximal exercise. Annals of the New York Academy of Sciences, 301, 726-733.
Daniels, J. T., & Oldridge, N. (1970). The effects of alternate exposure to altitude and sea level on world-class middle-distance runners. Medicine and Science in Sports, 2(3), 107-112.
Daniels, J. T., & Oldridge, N. (1971). Changes in oxygen consumption of young boys during growth and running training. Medicine and Science in Sports, 3(4), 161-165.
Daniels, J. T., Oldridge, N., Nagle, F., & White, B. (1978). Differences and changes in VO2 among young runners 10 to 18 years of age. Medicine and Science in Sports, 10(3), 200-203.
Daniels, J. T., & Scardina, N. (1984). Interval training and performance. Sports Medicine, 1(4), 327-334.
Daniels, J. T., Scardina, N., & Foley, P. (1984). VO2max during five modes of exercise. Paper presented at the Proceedings of the World Congress on Sports Medicine, Vienna.
Daniels, J. T., Scardina, N., Hayes, J., & Foley, P. (1986). Elite and subelite female middle- and long-distance runners. Paper presented at the The 1984 Olympic Scientific Conference Proceedings.
Daniels, J. T., Yarbrough, R. A., & Foster, C. (1978). Changes in VO2 max and running performance with training. European Journal of Applied Physiology and Occupational Physiology, 39(4), 249-254.
Davies, C. T. (1980a). Effects of wind assistance and resistance on the forward motion of a runner. Journal of Applied Physiology, 48(4), 702-709.
Davies, C. T. (1980b). Metabolic cost of exercise and physical performance in children with some observations on external loading. European Journal of Applied Physiology and Occupational Physiology, 45(2-3), 95-102.
Davies, C. T., & Thompson, M. W. (1979). Aerobic performance of female marathon and male ultramarathon athletes. European Journal of Applied Physiology and Occupational Physiology, 41(4), 233-245.
Denadai, B. S., Ortiz, M. J., Greco, C. C., & de Mello, M. T. (2006). Interval training at 95% and 100% of the velocity at VO2 max: effects on aerobic physiological indexes and running performance. Applied Physiology, Nutrition, and Metabolism, 31(6), 737-743. doi: 10.1139/h06-080
Di Michele, R., & Merni, F. (2013). The concurrent effects of strike pattern and ground-contact time on running economy. Journal of Science and Medicine in Sport. doi: 10.1016/j.jsams.2013.05.012
177
di Prampero, P. E., Capelli, C., Pagliaro, P., Antonutto, G., Girardis, M., Zamparo, P., & Soule, R. G. (1993). Energetics of best performances in middle-distance running. Journal of Applied Physiology, 74(5), 2318-2324.
Dicharry, J. (2010). Kinematics and kinetics of gait: from lab to clinic. Clinics in Sports Medicine, 29(3), 347-364. doi: 10.1016/j.csm.2010.03.013
Dillman, C. J. (1975). Kinematic analyses of running. Exercise and Sport Sciences Reviews, 3, 193-218.
Divert, C., Mornieux, G., Freychat, P., Baly, L., Mayer, F., & Belli, A. (2008). Barefoot-shod running differences: shoe or mass effect? International Journal of Sports Medicine, 29(6), 512-518. doi: 10.1055/s-2007-989233
Dolgener, F. (1982). Oxygen cost of walking and running in untrained, sprint trained, and endurance trained females. The Journal of Sports Medicine and Physical Fitness, 22(1), 60-65.
Doma, K., & Deakin, G. B. (2013). The effects of strength training and endurance training order on running economy and performance. Applied Physiology, Nutrition, and Metabolism, 38(6), 651-656. doi: 10.1139/apnm-2012-0362
Dumke, C. L., Pfaffenroth, C. M., McBride, J. M., & McCauley, G. O. (2010). Relationship between muscle strength, power and stiffness and running economy in trained male runners. International Journal of Sports Physiology and Performance, 5(2), 249-261.
Elliott, B. C., & Blanksby, B. A. (1979). Optimal stride length considerations for male and female recreational runners. British Journal of Sports Medicine, 13(1), 15-18.
Enoksen, E., Shalfawi, S. A., & Tonnessen, E. (2011). The effect of high- vs. low-intensity training on aerobic capacity in well-trained male middle-distance runners. Journal of Strength and Conditioning Research, 25(3), 812-818. doi: 10.1519/JSC.0b013e3181cc2291
Farley, C. T., & McMahon, T. A. (1992). Energetics of walking and running: insights from simulated reduced-gravity experiments. Journal of Applied Physiology, 73(6), 2709-2712.
Ferley, D. D., Osborn, R. W., & Vukovich, M. D. (2012). The effects of uphill vs. level-grade high-Intensity interval training on VO2max, VMax, VLT and TMax in well-trained distance runners. Journal of Strength and Conditioning Research. doi: 10.1519/JSC.0b013e3182736923
Ferrauti, A., Bergermann, M., & Fernandez-Fernandez, J. (2010). Effects of a concurrent strength and endurance training on running performance and running economy in recreational marathon runners. Journal of Strength and Conditioning Research, 24(10), 2770-2778. doi: 10.1519/JSC.0b013e3181d64e9c
Ferris, D. P., Liang, K., & Farley, C. T. (1999). Runners adjust leg stiffness for their first step on a new running surface. Journal of Biomechanics, 32(8), 787-794. doi: S0021-9290(99)00078-0 [pii]
Fletcher, J. R., Esau, S. P., & Macintosh, B. R. (2009). Economy of running: beyond the measurement of oxygen uptake. Journal of applied physiology, 107(6), 1918-1922. doi: 10.1152/japplphysiol.00307.2009
Fletcher, J. R., Esau, S. P., & MacIntosh, B. R. (2010). Changes in tendon stiffness and running economy in highly trained distance runners. European Journal of Applied Physiology, 110(5), 1037-1046. doi: 10.1007/s00421-010-1582-8
Folland, J. P., Rowlands, D. S., Thorp, R., & Walmsley, A. (2006). Leg heating and cooling influences running stride parameters but not running economy. International Journal of Sports Medicine, 27(10), 771-779. doi: 10.1055/s-2005-872963
Foster, C., & Lucia, A. (2007). Running economy : the forgotten factor in elite performance. Sports Medicine, 37(4-5), 316-319. doi: 37NaN11 [pii]
Francesca, P. M., Giulia, D. I., Stefania, C., Alessandro, S., Gianluca, V., & Antonio, L. T. (2012). Concurrent strength and endurance training effects on running
178
economy in master endurance runners. Journal of Strength and Conditioning Research. doi: 10.1519/JSC.0b013e3182794485
Franch, J., Madsen, K., Djurhuus, M. S., & Pedersen, P. K. (1998). Improved running economy following intensified training correlates with reduced ventilatory demands. Medicine and Science in Sports and Exercise, 30(8), 1250-1256.
Franklin, D. W., Burdet, E., Osu, R., Kawato, M., & Milner, T. E. (2003). Functional significance of stiffness in adaptation of multijoint arm movements to stable and unstable dynamics. Experimental Brain Research, 151(2), 145-157. doi: 10.1007/s00221-003-1443-3
Frederick, E. C. (1984). Physiological and ergonomics factors in running shoe design. Applied Ergonomics, 15(4), 281-287.
Fukashiro, S., Noda, M., & Shibayama, A. (2001). In vivo determination of muscle viscoelasticity in the human leg. Acta Physiologica Scandinavica, 172(4), 241-248.
Fulford, J., Winyard, P. G., Vanhatalo, A., Bailey, S. J., Blackwell, J. R., & Jones, A. M. (2013). Influence of dietary nitrate supplementation on human skeletal muscle metabolism and force production during maximum voluntary contractions. European Journal of Physiology, 465(4), 517-528. doi: 10.1007/s00424-013-1220-5
Gleim, G. W., Stachenfeld, N. S., & Nicholas, J. A. (1990). The influence of flexibility on the economy of walking and jogging. Journal of Orthopaedic Research, 8(6), 814-823. doi: 10.1002/jor.1100080606
Godges, J. J., Macrae, H., Longdon, C., Tinberg, C., & Macrae, P. G. (1989). The effects of two stretching procedures on hip range of motion and gait economy. The Journal of Orthopaedic and Sports Physical Therapy, 10(9), 350-357.
Godges, J. J., MacRae, P. G., & Engelke, K. A. (1993). Effects of exercise on hip range of motion, trunk muscle performance, and gait economy. Physical Therapy, 73(7), 468-477.
Goldspink, G. (1977). Muscle energetics in animal locomotion. In R. M. Alexander & G. Goldspink (Eds.), Mechanics and Energetics of Animal Locomotion. London: Chapman and Hall, Ltd.
Gollhofer, A., & Kyrolainen, H. (1991). Neuromuscular control of the human leg extensor muscles in jump exercises under various stretch-load conditions. International Journal of Sports Medicine, 12(1), 34-40. doi: 10.1055/s-2007-1024652
Gore, C. J., Clark, S. A., & Saunders, P. U. (2007). Nonhematological mechanisms of improved sea-level performance after hypoxic exposure. Medicine and Science in Sports and Exercise, 39(9), 1600-1609. doi: 10.1249/mss.0b013e3180de49d3
00005768-200709000-00023 [pii] Gore, C. J., Hahn, A. G., Aughey, R. J., Martin, D. T., Ashenden, M. J., Clark, S. A., . . .
McKenna, M. J. (2001). Live high:train low increases muscle buffer capacity and submaximal cycling efficiency. Acta Physiologica Scandinavica, 173(3), 275-286.
Green, H. J. (2000). Altitude acclimatization, training and performance. Journal of science and medicine in sport / Sports Medicine Australia, 3(3), 299-312.
Green, H. J., & Patla, A. E. (1992). Maximal aerobic power: neuromuscular and metabolic considerations. Medicine and Science in Sports and Exercise, 24(1), 38-46.
Green, H. J., Roy, B., Grant, S., Hughson, R., Burnett, M., Otto, C., . . . Johnson, M. (2000). Increases in submaximal cycling efficiency mediated by altitude acclimatization. Journal of Applied Physiology, 89(3), 1189-1197.
Grimby, G. (1962). Exercise in man during pyrogen-induced fever. Scandinavian Journal of Clinical and Laboratory Investigation, 14 Suppl 67, 1-112.
Gruber, A. H., Umberger, B. R., Braun, B., & Hamill, J. (2013). Economy and rate of carbohydrate oxidation during running with rearfoot and forefoot strike patterns.

179
Journal of Applied Physiology, 115(2), 194-201. doi: 10.1152/japplphysiol.01437.2012
Guglielmo, L. G., Greco, C. C., & Denadai, B. S. (2009). Effects of strength training on running economy. International Journal of Sports Medicine, 30(1), 27-32. doi: 10.1055/s-2008-1038792
Hagberg, J. M., Mullin, J. P., & Nagle, F. J. (1978). Oxygen consumption during constant-load exercise. Journal of Applied Physiology, 45(3), 381-384.
Hajoglou, A., Foster, C., De Koning, J. J., Lucia, A., Kernozek, T. W., & Porcari, J. P. (2005). Effect of warm-up on cycle time trial performance. Medicine and Science in Sports and Exercise, 37(9), 1608-1614.
Hakkinen, K. (1994). Neuromuscular adaptation during strength-training, aging, detraining, and immobilization. Critical Reviews in Physical and Rehabilitation Medicine, 6, 161-198.
Hakkinen, K., Komi, P. V., & Alen, M. (1985). Effect of explosive type strength training on isometric force- and relaxation-time, electromyographic and muscle fibre characteristics of leg extensor muscles. Acta Physiologica Scandinavica, 125(4), 587-600.
Halvorsen, K., Eriksson, M., & Gullstrand, L. (2012). Acute effects of reducing vertical displacement and step frequency on running economy. Journal of Strength and Conditioning Research, 26(8), 2065-2070. doi: 10.1519/JSC.0b013e318239f87f
Hamilton, R. J., Paton, C. D., & Hopkins, W. G. (2006). Effect of high-intensity resistance training on performance of competitive distance runners. International Journal of Sports Physiology and Performance, 1(1), 40-49.
Hanson, N. J., Berg, K., Deka, P., Meendering, J. R., & Ryan, C. (2011). Oxygen cost of running barefoot vs. running shod. International Journal of Sports Medicine, 32(6), 401-406. doi: 10.1055/s-0030-1265203
Hayes, P. R., French, D. N., & Thomas, K. (2011). The effect of muscular endurance on running economy. Journal of Strength and Conditioning Research, 25(9), 2464-2469. doi: 10.1519/JSC.0b013e3181fb4284
He, Z., Hu, Y., Feng, L., Lu, Y., Liu, G., Xi, Y., . . . McNaughton, L. R. (2007). NRF2 genotype improves endurance capacity in response to training. International Journal of Sports Medicine, 28(9), 717-721. doi: 10.1055/s-2007-964913
Heil, D. P. (1997). Body mass scaling of peak oxygen uptake in 20- to 79-yr-old adults. Medicine and Science in Sports and Exercise, 29(12), 1602-1608.
Heise, G., Shinohara, M., & Binks, L. (2008). Biarticular leg muscles and links to running economy. International Journal of Sports Medicine, 29(8), 688-691. doi: 10.1055/s-2007-989372
Heise, G. D., & Martin, P. E. (2001). Are variations in running economy in humans associated with ground reaction force characteristics? European Journal of Applied Physiology, 84(5), 438-442.
Hickson, R. C., Dvorak, B. A., Gorostiaga, E. M., Kurowski, T. T., & Foster, C. (1988). Potential for strength and endurance training to amplify endurance performance. Journal of Applied Physiology, 65(5), 2285-2290.
Hinrichs, R. (1990). Upper extremity function in distance running Biomechanics of distance running (pp. 107-134). Champaign (IL): Human Kinetics.
Hochachka, P. W. (1988). Patterns of O2-dependence of metabolism. Advances in Experimental Medicine and Biology, 222, 143-151.
Hochachka, P. W., Stanley, C., Matheson, G. O., McKenzie, D. C., Allen, P. S., & Parkhouse, W. S. (1991). Metabolic and work efficiencies during exercise in Andean natives. Journal of Applied Physiology, 70(4), 1720-1730.
Hodgson, M., Docherty, D., & Robbins, D. (2005). Post-activation potentiation: underlying physiology and implications for motor performance. Sports Medicine, 35(7), 585-595.
Hoff, J., Gran, A., & Helgerud, J. (2002). Maximal strength training improves aerobic endurance performance. Scandinavian Journal of Medicine and Science in Sports, 12(5), 288-295.

180
Hoff, J., Helgerud, J., & Wisloff, U. (1999). Maximal strength training improves work economy in trained female cross-country skiers. Medicine and Science in Sports and Exercise, 31(6), 870-877.
Hogberg, P. (1952). How do stride length and stride frequency influence the energy-output during running? Arbeitsphysiologie, 14(6), 437-441.
Holloszy, J. O., Rennie, M. J., Hickson, R. C., Conlee, R. K., & Hagberg, J. M. (1977). Physiological consequences of the biochemical adaptations to endurance exercise. Annals of the New York Academy of Sciences, 301, 440-450.
Hopkins, P., & Powers, S. K. (1982). Oxygen uptake during submaximal running in highly trained men and women. American Corrective Therapy Journal, 36(5), 130-132.
Hopkins, W. G. (2000). Measures of reliability in sports medicine and science. Sports Medicine, 30(1), 1-15.
Hopkins, W. G. (2005). Competitive performance of elite track-and-field athletes: variability and smallest worthwhile enhancements. Sportscience, 9, 17-20.
Hopkins, W. G. (2006). Spreadsheets for analysis of controlled trials, with adjustment for a subject characteristic. Sportscience, 10, 46-50.
Hopkins, W. G. (2007a). A spreadsheet for deriving a confidence interval, mechanistic inference and clinical inference from a p value. Sportscience, 11, 16-20.
Hopkins, W. G. (2007b). A spreadsheet to compare means of two groups. Sportscience, 11, 22-23.
Hopkins, W. G. (2008). Research designs: choosing and fine-tuning a design for your study. Sportscience, 12, 12-21.
Hopkins, W. G. (2010). Assigning aubjects to groups in a controlled trial. Sportscience, 14, 7-12.
Hopkins, W. G. (2012). Bootstrapping inferential statistics with a spreadsheet. Sportscience, 16, 12-15.
Hopkins, W. G., Hawley, J. A., & Burke, L. M. (1999). Design and analysis of research on sport performance enhancement. Medicine and Science in Sports and Exercise, 31(3), 472-485.
Hopkins, W. G., & Hewson, D. J. (2001). Variability of competitive performance of distance runners. Medicine and Science in Sports and Exercise, 33(9), 1588-1592.
Hopkins, W. G., Marshall, S. W., Batterham, A. M., & Hanin, J. (2009). Progressive statistics for studies in sports medicine and exercise science. Medicine and Science in Sports and Exercise, 41(1), 3-13. doi: 10.1249/MSS.0b013e31818cb278
Hopkins, W. G., Schabort, E. J., & Hawley, J. A. (2001). Reliability of power in physical performance tests. Sports Medicine, 31(3), 211-234.
Houston, M. E., & Thomson, J. A. (1977). The response of endurance-adapted adults to intense anaerobic training. European Journal of Applied Physiology and Occupational Physiology, 36(3), 207-213.
Howley, E. T., & Glover, M. E. (1974). The caloric costs of running and walking one mile for men and women. Medicine and Science in Sports, 6(4), 235-237.
Hunter, G. R., Katsoulis, K., McCarthy, J. P., Ogard, W. K., Bamman, M. M., Wood, D. S., . . . Newcomer, B. R. (2011). Tendon length and joint flexibility are related to running economy. Medicine and Science in Sports and Exercise, 43(8), 1492-1499. doi: 10.1249/MSS.0b013e318210464a
Impellizzeri, F. M., Rampinini, E., Castagna, C., Martino, F., Fiorini, S., & Wisloff, U. (2008). Effect of plyometric training on sand versus grass on muscle soreness and jumping and sprinting ability in soccer players. British Journal of Sports Medicine, 42(1), 42-46. doi: 10.1136/bjsm.2007.038497
Ingham, S. A., Fudge, B. W., & Pringle, J. S. (2012). Training distribution, physiological profile, and performance for a male international 1500-m runner. International Journal of Sports Physiology and Performance, 7(2), 193-195.
181
Ingham, S. A., Fudge, B. W., Pringle, J. S., & Jones, A. M. (2013). Improvement of 800-m running performance with prior high-intensity exercise. International Journal of Sports Physiology and Performance, 8(1), 77-83.
Ito, A., Komi, P. V., Sjodin, B., Bosco, C., & Karlsson, J. (1983). Mechanical efficiency of positive work in running at different speeds. Medicine and Science in Sports and Exercise, 15(4), 299-308.
Ito, R., Nakano, M., Yamane, M., Amano, M., & Matsumoto, T. (2013). Effects of Rain on Energy Metabolism while Running in a Cold Environment. International Journal of Sports Medicine. doi: 10.1055/s-0032-1331770
Johnston, R., Quinn, T., Kertzer, R., & Vroman, N. (1997). Strength training in female distance runners: impact on running economy. Journal of Strength and Conditioning Research, 11(4), 224-229.
Jones, A. M. (1998). A five year physiological case study of an Olympic runner. British Journal of Sports Medicine, 32(1), 39-43.
Jones, A. M. (2002). Running economy is negatively related to sit-and-reach test performance in international-standard distance runners. International Journal of Sports Medicine, 23(1), 40-43. doi: 10.1055/s-2002-19271
Jones, A. M. (2006). The Physiology of the Women's World Record Holder for the Women's Marathon. International Journal of Sports Science and Coaching, 1(2), 101-115.
Jones, A. M. (2013). Dietary nitrate: the new magic bullet? Sports Science Exchange, 26(110), 1-5.
Jones, A. M., Bailey, S. J., & Vanhatalo, A. (2012). Dietary nitrate and O(2) consumption during exercise. Medicine and Sport Science, 59, 29-35. doi: 10.1159/000342062
Jones, A. M., & Carter, H. (2000). The effect of endurance training on parameters of aerobic fitness. Sports Medicine, 29(6), 373-386.
Jones, A. M., & Doust, J. H. (1996). A 1% treadmill grade most accurately reflects the energetic cost of outdoor running. Journal of Sports Sciences, 14(4), 321-327. doi: 10.1080/02640419608727717
Jones, A. M., Koppo, K., & Burnley, M. (2003). Effects of prior exercise on metabolic and gas exchange responses to exercise. Sports Medicine, 33(13), 949-971.
Jones, A. M., Vanhatalo, A., & Bailey, S. J. (2013). Influence of dietary nitrate supplementation on exercise tolerance and performance. Nestle Nutrition Institute Workshop Series, 75, 27-40. doi: 10.1159/000345815
Jones, A. M., Wilkerson, D. P., Burnley, M., & Koppo, K. (2003). Prior heavy exercise enhances performance during subsequent perimaximal exercise. Medicine and Science in Sports and Exercise, 35(12), 2085-2092. doi: 10.1249/01.MSS.0000099108.55944.C4
Jones, B. H., Knapik, J. J., Daniels, W. L., & Toner, M. M. (1986). The energy cost of women walking and running in shoes and boots. Ergonomics, 29(3), 439-443.
Jones, B. H., Toner, M. M., Daniels, W. L., & Knapik, J. J. (1984). The energy cost and heart-rate response of trained and untrained subjects walking and running in shoes and boots. Ergonomics, 27(8), 895-902. doi: 10.1080/00140138408963563
Joyner, M. J. (1991). Modeling: optimal marathon performance on the basis of physiological factors. Journal of Applied Physiology, 70(2), 683-687.
Julian, C. G., Gore, C. J., Wilber, R. L., Daniels, J. T., Fredericson, M., Stray-Gundersen, J., . . . Levine, B. D. (2004). Intermittent normobaric hypoxia does not alter performance or erythropoietic markers in highly trained distance runners. Journal of Applied Physiology, 96(5), 1800-1807. doi: 10.1152/japplphysiol.00969.2003
Jung, A. P. (2003). The impact of resistance training on distance running performance. Sports Medicine, 33(7), 539-552. doi: 3375 [pii]
Kaneko, M. (1990). Mechanics and energetics in running with special reference to efficiency. Journal of Biomechanics, 23 Suppl 1, 57-63.
182
Kaneko, M., Matsumoto, M., Ito, A., & Fuchimoto, T. (1987). Optimum step frequency in constant speed running. Champaign: Human Kinetics.
Katayama, K., Matsuo, H., Ishida, K., Mori, S., & Miyamura, M. (2003). Intermittent hypoxia improves endurance performance and submaximal exercise efficiency. High Altitude Medicine & Biology, 4(3), 291-304. doi: 10.1089/152702903769192250
Katayama, K., Sato, K., Hotta, N., Ishida, K., Iwasaki, K., & Miyamura, M. (2007). Intermittent hypoxia does not increase exercise ventilation at simulated moderate altitude. International Journal of Sports Medicine, 28(6), 480-487. doi: 10.1055/s-2006-955895
Katayama, K., Sato, K., Matsuo, H., Ishida, K., Iwasaki, K., & Miyamura, M. (2004). Effect of intermittent hypoxia on oxygen uptake during submaximal exercise in endurance athletes. European Journal of Applied Physiology, 92(1-2), 75-83. doi: 10.1007/s00421-004-1054-0
Ker, R. F., Bennett, M. B., Bibby, S. R., Kester, R. C., & Alexander, R. M. (1987). The spring in the arch of the human foot. Nature, 325(7000), 147-149. doi: 10.1038/325147a0
Kerdok, A. E., Biewener, A. A., McMahon, T. A., Weyand, P. G., & Herr, H. M. (2002). Energetics and mechanics of human running on surfaces of different stiffnesses. Journal of Applied Physiology, 92(2), 469-478. doi: 10.1152/japplphysiol.01164.2000
Keren, G., Epstein, Y., Magazanik, A., & Sohar, E. (1981). The energy cost of walking and running with and without a backpack load. European Journal of Applied Physiology and Occupational Physiology, 46(3), 317-324.
Kitamura, K., Jorgensen, C. R., Gobel, F. L., Taylor, H. L., & Wang, Y. (1972). Hemodynamic correlates of myocardial oxygen consumption during upright exercise. Journal of Applied Physiology, 32(4), 516-522.
Knuttgen, H. G. (1961). Oxygen uptake and pulse rate while running with undetermined and determined stride lengths at different speeds. Acta Physiologica Scandinavica, 52, 366-371.
Kraemer, W. J., Fleck, S. J., & Evans, W. J. (1996). Strength and power training: physiological mechanisms of adaptation. Exercise and Sport Sciences Reviews, 24, 363-397.
Krahenbuhl, G. S., & Pangrazi, R. P. (1983). Characteristics associated with running performance in young boys. Medicine and Science in Sports and Exercise, 15(6), 486-490.
Krahenbuhl, G. S., Pangrazi, R. P., & Chomokos, E. A. (1979). Aerobic responses of young boys to submaximal running. Research Quarterly, 50(3), 413-421.
Kram, R., & Taylor, C. R. (1990). Energetics of running: a new perspective. Nature, 346(6281), 265-267. doi: 10.1038/346265a0
Kubo, K., Tabata, T., Ikebukuro, T., Igarashi, K., & Tsunoda, N. (2010). A longitudinal assessment of running economy and tendon properties in long-distance runners. Journal of Strength and Conditioning Research, 24(7), 1724-1731. doi: 10.1519/JSC.0b013e3181ddf847
Kubo, K., Tabata, T., Ikebukuro, T., Igarashi, K., Yata, H., & Tsunoda, N. (2010). Effects of mechanical properties of muscle and tendon on performance in long distance runners. European Journal of Applied Physiology, 110(3), 507-514. doi: 10.1007/s00421-010-1528-1
Kurz, M. J., Berg, K., Latin, R., & Degraw, W. (2000). The relationship of training methods in NCAA division 1 cross-country runners and 10,000-meter performance. Journal of Strength and Conditioning Research, 14(2), 196-201.
Kyle, C. (1979). Reduction of wind resistance and power output of racing cyclist and runners travelling in groups. Ergonomics, 22, 387-397.
Kyrolainen, H., Belli, A., & Komi, P. V. (2001). Biomechanical factors affecting running economy. Medicine and Science in Sports and Exercise, 33(8), 1330-1337.

183
Kyrolainen, H., Kivela, R., Koskinen, S., McBride, J., Andersen, J. L., Takala, T., . . . Komi, P. V. (2003). Interrelationships between muscle structure, muscle strength, and running economy. Medicine and Science in Sports and Exercise, 35(1), 45-49. doi: 10.1249/01.MSS.0000046149.03322.BB
Laffite, L. P., Mille-Hamard, L., Koralsztein, J. P., & Billat, V. L. (2003). The effects of interval training on oxygen pulse and performance in supra-threshold runs. Archives of Physiology and Biochemistry, 111(3), 202-210. doi: 10.1076/apab.111.3.202.23455
Lake, M. J., & Cavanagh, P. R. (1990). Short-term training effects on running kinematics and running economy. Medicine and Science in Sports and Exercise, 22 (Suppl.), S22.
Lake, M. J., & Cavanagh, P. R. (1996). Six weeks of training does not change running mechanics or improve running economy. Medicine and Science in Sports and Exercise, 28(7), 860-869.
Lanceley, R., Ranchordas, M., & Ruddock, A. (2013). Effects of dietary nitrate supplementation on 5 km running time trial performance in trained female runners. British Journal of Sports Medicine, 47(17), e4. doi: 10.1136/bjsports-2013-093073.8
Lander, J. (1985). Maximums based on reps. National Strength an Conditioning Association Journal, 6(6), 60-61.
Lansley, K. E., Winyard, P. G., Bailey, S. J., Vanhatalo, A., Wilkerson, D. P., Blackwell, J. R., . . . Jones, A. M. (2011). Acute dietary nitrate supplementation improves cycling time trial performance. Medicine and Science in Sports and Exercise, 43(6), 1125-1131. doi: 10.1249/MSS.0b013e31821597b4
Lansley, K. E., Winyard, P. G., Fulford, J., Vanhatalo, A., Bailey, S. J., Blackwell, J. R., . . . Jones, A. M. (2011). Dietary nitrate supplementation reduces the O2 cost of walking and running: a placebo-controlled study. Journal of Applied Physiology, 110(3), 591-600. doi: 10.1152/japplphysiol.01070.2010
Larsen, F. J., Schiffer, T. A., Borniquel, S., Sahlin, K., Ekblom, B., Lundberg, J. O., & Weitzberg, E. (2011). Dietary inorganic nitrate improves mitochondrial efficiency in humans. Cell Metabolism, 13(2), 149-159. doi: 10.1016/j.cmet.2011.01.004
Larsen, F. J., Weitzberg, E., Lundberg, J. O., & Ekblom, B. (2007). Effects of dietary nitrate on oxygen cost during exercise. Acta Physiologica Scandinavica, 191(1), 59-66. doi: 10.1111/j.1748-1716.2007.01713.x
Larsen, F. J., Weitzberg, E., Lundberg, J. O., & Ekblom, B. (2010). Dietary nitrate reduces maximal oxygen consumption while maintaining work performance in maximal exercise. Free Radical Biology & Medicine, 48(2), 342-347. doi: 10.1016/j.freeradbiomed.2009.11.006
Larsen, H. B. (2003). Kenyan dominance in distance running. Comparative Biochemistry and Physiology - Part A: Molecular & Integrative Physiology, 136(1), 161-170. doi: S1095643303002277 [pii]
Laursen, P. B. (2010). Training for intense exercise performance: high-intensity or high-volume training? Scandinavian Journal of Medicine and Science in Sports, 20 Suppl 2, 1-10. doi: 10.1111/j.1600-0838.2010.01184.x
Laursen, P. B., Francis, G. T., Abbiss, C. R., Newton, M. J., & Nosaka, K. (2007). Reliability of time-to-exhaustion versus time-trial running tests in runners. Medicine and Science in Sports and Exercise, 39(8), 1374-1379. doi: 10.1249/mss.0b013e31806010f5
00005768-200708000-00021 [pii] Laursen, P. B., & Jenkins, D. G. (2002). The scientific basis for high-intensity interval
training: optimising training programmes and maximising performance in highly trained endurance athletes. Sports Medicine, 32(1), 53-73.
Leger, L., & Mercier, D. (1984). Gross energy cost of horizontal treadmill and track running. Sports Medicine, 1(4), 270-277.
184
Lejeune, T. M., Willems, P. A., & Heglund, N. C. (1998). Mechanics and energetics of human locomotion on sand. The Journal of Experimental Biology, 201(Pt 13), 2071-2080.
Leveritt, M., Abernethy, P. J., Barry, B., & Logan, P. A. (2003). Concurrent strength and endurance training: the influence of dependent variable selection. J Strength Cond Res, 17(3), 503-508.
Leveritt, M., Abernethy, P. J., Barry, B. K., & Logan, P. A. (1999). Concurrent strength and endurance training. A review. Sports Med, 28(6), 413-427.
Levine, B. D., & Stray-Gundersen, J. (1997). "Living high-training low": effect of moderate-altitude acclimatization with low-altitude training on performance. Journal of Applied Physiology, 83(1), 102-112.
Lichtwark, G. A., & Wilson, A. M. (2008). Optimal muscle fascicle length and tendon stiffness for maximising gastrocnemius efficiency during human walking and running. Journal of Theoretical Biology, 252(4), 662-673. doi: 10.1016/j.jtbi.2008.01.018
Lloyd, B. B., & Zacks, R. M. (1972). The mechanical efficiency of treadmill running against a horizontal impeding force. The Journal of Physiology, 223(2), 355-363.
Lucia, A., Esteve-Lanao, J., Olivan, J., Gomez-Gallego, F., San Juan, A. F., Santiago, C., . . . Foster, C. (2006). Physiological characteristics of the best Eritrean runners-exceptional running economy. Applied Physiology, Nutrition, and Metabolism, 31(5), 530-540. doi: h06-029 [pii]
10.1139/h06-029 Lucia, A., Moran, M., Zihong, H., & Ruiz, J. R. (2010). Elite athletes: are the genes the
champions? International Journal of Sports Physiology and Performance, 5(1), 98-102.
Lucia, A., Olivan, J., Bravo, J., Gonzalez-Freire, M., & Foster, C. (2008). The key to top-level endurance running performance: a unique example. British Journal of Sports Medicine, 42(3), 172-174; discussion 174. doi: bjsm.2007.040725 [pii]
10.1136/bjsm.2007.040725 Luhtanen, P., & Komi, P. V. (1978). Mechanical energy states during running.
European Journal of Applied Physiology and Occupational Physiology, 38(1), 41-48.
Lundby, C., Calbet, J. A., Sander, M., van Hall, G., Mazzeo, R. S., Stray-Gundersen, J., . . . Levine, B. D. (2007). Exercise economy does not change after acclimatization to moderate to very high altitude. Scandinavian Journal of Medicine and Science in Sports, 17(3), 281-291. doi: 10.1111/j.1600-0838.2006.00530.x
Lussiana, T., Fabre, N., Hebert-Losier, K., & Mourot, L. (2013). Effect of slope and footwear on running economy and kinematics. Scandinavian Journal of Medicine and Science in Sports, 23(4), e246-253. doi: 10.1111/sms.12057
MacDougall, J. (1977). The anaerobic threshold: its significance for the endurance athlete. Canadian Journal of Applied Sport Sciences, 2, 137-140.
MacDougall, J. D., Reddan, W. G., Layton, C. R., & Dempsey, J. A. (1974). Effects of metabolic hyperthermia on performance during heavy prolonged exercise. Journal of Applied Physiology, 36(5), 538-544.
MacDougall, J. D., Roche, P. D., Bar-Or, O., & Moroz, J. R. (1983). Maximal aerobic capacity of Canadian schoolchildren: prediction based on age-related oxygen cost of running. International Journal of Sports Medicine, 4(3), 194-198. doi: 10.1055/s-2008-1026034
Malina, R. M., Harper, A. B., Avent, H. H., & Campbell, D. E. (1971). Physique of female track and field athletes. Medicine and Science in Sports, 3(1), 32-38.
Marconi, C., Marzorati, M., Sciuto, D., Ferri, A., & Cerretelli, P. (2005). Economy of locomotion in high-altitude Tibetan migrants exposed to normoxia. The Journal of Physiology, 569(Pt 2), 667-675. doi: 10.1113/jphysiol.2005.094979
185
Maron, M. B., Horvath, S. M., Wilkerson, J. E., & Gliner, J. A. (1976). Oxygen uptake measurements during competitive marathon running. Journal of Applied Physiology, 40(5), 836-838.
Martin, P. E. (1985). Mechanical and physiological responses to lower extremity loading during running. Medicine and Science in Sports and Exercise, 17(4), 427-433.
Maughan, R. J., & Leiper, J. B. (1983). Aerobic capacity and fractional utilisation of aerobic capacity in elite and non-elite male and female marathon runners. European Journal of Applied Physiology and Occupational Physiology, 52(1), 80-87.
Mayhew, J. L., Piper, F. C., & Etheridge, G. L. (1979). Oxygen cost and energy requirement of running in trained and untrained males and females. The Journal of Sports Medicine and Physical Fitness, 19(1), 39-44.
McCann, D. J., & Higginson, B. K. (2008). Training to maximize economy of motion in running gait. Current Sports Medicine Reports, 7(3), 158-162. doi: 10.1097/01.CSMR.0000319711.63793.84
00149619-200805000-00012 [pii] McGuigan, M. R., Doyle, T. L., Newton, M., Edwards, D. J., Nimphius, S., & Newton, R.
U. (2006). Eccentric utilization ratio: effect of sport and phase of training. Journal of Strength and Conditioning Research, 20(4), 992-995. doi: 10.1519/R-19165.1
McMahon, T. A., & Greene, P. R. (1978). Fast running tracks. Scientific American, 239(6), 148-163.
McMahon, T. A., & Greene, P. R. (1979). The influence of track compliance on running. Journal of Biomechanics, 12(12), 893-904. doi: 0021-9290(79)90057-5 [pii]
McMahon, T. A., Valiant, G., & Frederick, E. C. (1987). Groucho running. Journal of Applied Physiology, 62(6), 2326-2337.
Midgley, A. W., McNaughton, L. R., & Jones, A. M. (2007). Training to enhance the physiological determinants of long-distance running performance: can valid recommendations be given to runners and coaches based on current scientific knowledge? Sports Medicine, 37(10), 857-880. doi: 37103 [pii]
Mikkola, J., Rusko, H., Nummela, A., Pollari, T., & Hakkinen, K. (2007). Concurrent endurance and explosive type strength training improves neuromuscular and anaerobic characteristics in young distance runners. International Journal of Sports Medicine, 28(7), 602-611. doi: 10.1055/s-2007-964849
Mikkola, J., Vesterinen, V., Taipale, R., Capostagno, B., Hakkinen, K., & Nummela, A. (2011). Effect of resistance training regimens on treadmill running and neuromuscular performance in recreational endurance runners. Journal of Sports Sciences, 29(13), 1359-1371. doi: 10.1080/02640414.2011.589467
Mikkola, J. S., Rusko, H. K., Nummela, A. T., Paavolainen, L. M., & Hakkinen, K. (2007). Concurrent endurance and explosive type strength training increases activation and fast force production of leg extensor muscles in endurance athletes. Journal of Strength and Conditioning Research, 21(2), 613-620. doi: R-20045 [pii]
10.1519/R-20045.1 Milic-Emili, G., Petit, J. M., & Deroanne, R. (1962). Mechanical work of breathing during
exercise in trained and untrained subjects. Journal of Applied Physiology, 17, 43-46.
Millet, G. P., Jaouen, B., Borrani, F., & Candau, R. (2002). Effects of concurrent endurance and strength training on running economy and VO2 kinetics. Medicine and Science in Sports and Exercise, 34(8), 1351-1359.
Mojock, C. D., Kim, J. S., Eccles, D. W., & Panton, L. B. (2011). The effects of static stretching on running economy and endurance performance in female distance runners during treadmill running. Journal of Strength and Conditioning Research, 25(8), 2170-2176. doi: 10.1519/JSC.0b013e3181e859db
186
Moore, I. S., Jones, A. M., & Dixon, S. J. (2012). Mechanisms for improved running economy in beginner runners. Medicine and Science in Sports and Exercise, 44(9), 1756-1763. doi: 10.1249/MSS.0b013e318255a727
Morgan, D., Martin, P., Craib, M., Caruso, C., Clifton, R., & Hopewell, R. (1994). Effect of step length optimization on the aerobic demand of running. Journal of Applied Physiology, 77(1), 245-251.
Morgan, D. W., Baldini, F. D., Martin, P. E., & Kohrt, W. M. (1989). Ten kilometer performance and predicted velocity at VO2max among well-trained male runners. Medicine and Science in Sports and Exercise, 21(1), 78-83.
Morgan, D. W., Bransford, D. R., Costill, D. L., Daniels, J. T., Howley, E. T., & Krahenbuhl, G. S. (1995). Variation in the aerobic demand of running among trained and untrained subjects. Medicine and Science in Sports and Exercise, 27(3), 404-409.
Morgan, D. W., & Craib, M. (1992). Physiological aspects of running economy. Medicine and Science in Sports and Exercise, 24(4), 456-461.
Morgan, D. W., Craib, M. W., Krahenbuhl, G. S., Woodall, K., Jordan, S., Filarski, K., . . . Williams, T. (1994). Daily variability in running economy among well-trained male and female distance runners. Research Quarterly for Exercise and Sport, 65(1), 72-77.
Morgan, D. W., & Daniels, J. T. (1994). Relationship between VO2max and the aerobic demand of running in elite distance runners. International Journal of Sports Medicine, 15(7), 426-429. doi: 10.1055/s-2007-1021082
Morgan, D. W., & Martin, P. E. (1986). Effects of stride length alteration on racewalking economy. Canadian Journal of Applied Sport Sciences, 11(4), 211-217.
Morgan, D. W., Martin, P. E., Baldini, F. D., & Krahenbuhl, G. S. (1990). Effects of a prolonged maximal run on running economy and running mechanics. Medicine and Science in Sports and Exercise, 22(6), 834-840.
Morgan, D. W., Martin, P. E., & Krahenbuhl, G. S. (1989). Factors affecting running economy. Sports Medicine, 7(5), 310-330.
Morgan, D. W., Martin, P. E., Krahenbuhl, G. S., & Baldini, F. D. (1991). Variability in running economy and mechanics among trained male runners. Medicine and Science in Sports and Exercise, 23(3), 378-383.
Moritani, T., & deVries, H. A. (1979). Neural factors versus hypertrophy in the time course of muscle strength gain. American Journal of Physical Medicine, 58(3), 115-130.
Myers, M. J., & Steudel, K. (1985). Effect of limb mass and its distribution on the energetic cost of running. The Journal of Experimental Biology, 116, 363-373.
Nelson, A. G., Kokkonen, J., Eldredge, C., Cornwell, A., & Glickman-Weiss, E. (2001). Chronic stretching and running economy. Scandinavian Journal of Medicine and Science in Sports, 11(5), 260-265.
Nelson, R. C., & Gregor, R. J. (1976). Biomechanics of distance running: a longitudinal study. Research Quarterly, 47(3), 417-428.
Neya, M., Enoki, T., Kumai, Y., Sugoh, T., & Kawahara, T. (2007). The effects of nightly normobaric hypoxia and high intensity training under intermittent normobaric hypoxia on running economy and hemoglobin mass. Journal of Applied Physiology, 103(3), 828-834. doi: 10.1152/japplphysiol.00265.2007
Nicol, C., Avela, J., & Komi, P. V. (2006). The stretch-shortening cycle : a model to study naturally occurring neuromuscular fatigue. Sports Medicine, 36(11), 977-999. doi: 36114 [pii]
Nilsson, J., & Thorstensson, A. (1987). Adaptability in frequency and amplitude of leg movements during human locomotion at different speeds. Acta Physiologica Scandinavica, 129(1), 107-114.
Noakes, T. D. (1988). Implications of exercise testing for prediction of athletic performance: a contemporary perspective. Medicine and Science in Sports and Exercise, 20(4), 319-330.
187
Noakes, T. D., Myburgh, K. H., & Schall, R. (1990). Peak treadmill running velocity during the VO2 max test predicts running performance. Journal of Sports Sciences, 8(1), 35-45.
Nummela, A., Keranen, T., & Mikkelsson, L. O. (2007). Factors related to top running speed and economy. International Journal of Sports Medicine, 28(8), 655-661. doi: 10.1055/s-2007-964896
Nummela, A., Rusko, H., & Mero, A. (1994). EMG activities and ground reaction forces during fatigued and nonfatigued sprinting. Medicine and Science in Sports and Exercise, 26(5), 605-609.
Nummela, A. T., Heath, K. A., Paavolainen, L. M., Lambert, M. I., St Clair Gibson, A., Rusko, H. K., & Noakes, T. D. (2008). Fatigue during a 5-km running time trial. International Journal of Sports Medicine, 29(9), 738-745. doi: 10.1055/s-2007-989404
Nummela, A. T., Paavolainen, L. M., Sharwood, K. A., Lambert, M. I., Noakes, T. D., & Rusko, H. K. (2006). Neuromuscular factors determining 5 km running performance and running economy in well-trained athletes. European Journal of Applied Physiology, 97(1), 1-8. doi: 10.1007/s00421-006-0147-3
Osteras, H., Helgerud, J., & Hoff, J. (2002). Maximal strength-training effects on force-velocity and force-power relationships explain increases in aerobic performance in humans. European Journal of Applied Physiology, 88(3), 255-263. doi: 10.1007/s00421-002-0717-y
Osu, R., Franklin, D. W., Kato, H., Gomi, H., Domen, K., Yoshioka, T., & Kawato, M. (2002). Short- and long-term changes in joint co-contraction associated with motor learning as revealed from surface EMG. Journal of Neurophysiology, 88(2), 991-1004.
Paavolainen, L. M., Hakkinen, K., Hamalainen, I., Nummela, A., & Rusko, H. (1999). Explosive-strength training improves 5-km running time by improving running economy and muscle power. Journal of Applied Physiology, 86(5), 1527-1533.
Paavolainen, L. M., Nummela, A., Rusko, H., & Hakkinen, K. (1999). Neuromuscular characteristics and fatigue during 10 km running. International Journal of Sports Medicine, 20(8), 516-521.
Paavolainen, L. M., Nummela, A. T., & Rusko, H. K. (1999). Neuromuscular characteristics and muscle power as determinants of 5-km running performance. Medicine and Science in Sports and Exercise, 31(1), 124-130.
Pate, R. R. (1989). Physiological and anatomical correlates of running economy in habitual runners. Medicine and Science in Sports and Exercise, 21 (Suppl. 2), S26.
Pate, R. R., Macera, C. A., Bailey, S. P., Bartoli, W. P., & Powell, K. E. (1992). Physiological, anthropometric, and training correlates of running economy. Medicine and Science in Sports and Exercise, 24(10), 1128-1133.
Paton, C. D. (2009). Effects of shoe cleat position on physiology and performance of competitive cyclists. International Journal of Sports Physiology and Performance, 4(4), 517-523.
Paton, C. D., & Hopkins, W. G. (2004). Effects of high-intensity training on performance and physiology of endurance athletes. Sportscience, 8, 25-40.
Patton, J. F., & Vogel, J. A. (1977). Cross-sectional and longitudinal evaluations of an endurance training program. Medicine and Science in Sports, 9(2), 100-103.
Paulson, S., & Braun, W. A. (2013). Prophylactic ankle taping: Influence on treadmill running kinematics and running economy. Journal of Strength and Conditioning Research. doi: 10.1519/JSC.0b013e3182a1fe6f
Pereira, M. A., & Freedson, P. S. (1997). Intraindividual variation of running economy in highly trained and moderately trained males. International Journal of Sports Medicine, 18(2), 118-124. doi: 10.1055/s-2007-972606
Pereira, M. A., Freedson, P. S., & Maliszewski, A. F. (1994). Intraindividual variation during inclined steady-rate treadmill running. Research Quarterly for Exercise and Sport, 65(2), 184-188.
188
Perl, D. P., Daoud, A. I., & Lieberman, D. E. (2012). Effects of footwear and strike type on running economy. Medicine and Science in Sports and Exercise, 44(7), 1335-1343. doi: 10.1249/MSS.0b013e318247989e
Peterson, M. D., Pistilli, E., Haff, G. G., Hoffman, E. P., & Gordon, P. M. (2011). Progression of volume load and muscular adaptation during resistance exercise. European Journal of Applied Physiology, 111(6), 1063-1071. doi: 10.1007/s00421-010-1735-9
Pinnington, H. C., & Dawson, B. (2001a). The energy cost of running on grass compared to soft dry beach sand. Journal of Science and Medicine in Sport, 4(4), 416-430.
Pinnington, H. C., & Dawson, B. (2001b). Running economy of elite surf iron men and male runners, on soft dry beach sand and grass. European Journal of Applied Physiology, 86(1), 62-70.
Pinnington, H. C., Lloyd, D. G., Besier, T. F., & Dawson, B. (2005). Kinematic and electromyography analysis of submaximal differences running on a firm surface compared with soft, dry sand. European Journal of Applied Physiology, 94(3), 242-253. doi: 10.1007/s00421-005-1323-6
Pollock, M. L. (1977). Submaximal and maximal working capacity of elite distance runners. Part I: Cardiorespiratory aspects. Annals of the New York Academy of Sciences, 301, 310-322.
Ponsot, E., Dufour, S. P., Zoll, J., Doutrelau, S., N'Guessan, B., Geny, B., . . . Richard, R. (2006). Exercise training in normobaric hypoxia in endurance runners. II. Improvement of mitochondrial properties in skeletal muscle. Journal of Applied Physiology, 100(4), 1249-1257. doi: 10.1152/japplphysiol.00361.2005
Poole, D. C. (1994). Role of exercising muscle in slow component of VO2. Medicine and Science in Sports and Exercise, 26(11), 1335-1340.
Powers, S. K., Hopkins, P., & Ragsdale, M. R. (1982). Oxygen uptake and ventilatory responses to various stride lengths in trained women. American Corrective Therapy Journal, 36(1), 5-8.
Pugh, L. G. (1970). Oxygen intake in track and treadmill running with observations on the effect of air resistance. The Journal of Physiology, 207(3), 823-835.
Pugh, L. G. (1971). The influence of wind resistance in running and walking and the mechanical efficiency of work against horizontal or vertical forces. The Journal of Physiology, 213(2), 255-276.
Raichlen, D. A., Armstrong, H., & Lieberman, D. E. (2011). Calcaneus length determines running economy: implications for endurance running performance in modern humans and Neandertals. Journal of Human Evolution, 60(3), 299-308. doi: 10.1016/j.jhevol.2010.11.002
Richalet, J. P., & Gore, C. J. (2008). Live and/or sleep high:train low, using normobaric hypoxia. Scandinavian Journal of Medicine and Science in Sports, 18 Suppl 1, 29-37. doi: 10.1111/j.1600-0838.2008.00830.x
Roberts, A. C., Reeves, J. T., Butterfield, G. E., Mazzeo, R. S., Sutton, J. R., Wolfel, E. E., & Brooks, G. A. (1996). Altitude and beta-blockade augment glucose utilization during submaximal exercise. Journal of Applied Physiology, 80(2), 605-615.
Robertson, E. Y., Saunders, P. U., Pyne, D. B., Aughey, R. J., Anson, J. M., & Gore, C. J. (2010). Reproducibility of performance changes to simulated live high/train low altitude. Medicine and Science in Sports and Exercise, 42(2), 394-401. doi: 10.1249/MSS.0b013e3181b34b57
Robertson, E. Y., Saunders, P. U., Pyne, D. B., Gore, C. J., & Anson, J. M. (2010). Effectiveness of intermittent training in hypoxia combined with live high/train low. European Journal of Applied Physiology, 110(2), 379-387. doi: 10.1007/s00421-010-1516-5
Rodas, G., Calvo, M., Estruch, A., Garrido, E., Ercilla, G., Arcas, A., . . . Ventura, J. L. (1998). Heritability of running economy: a study made on twin brothers.
189
European Journal of Applied Physiology and Occupational Physiology, 77(6), 511-516. doi: 10.1007/s004210050368
Rogers, D. M., Olson, B. L., & Wilmore, J. H. (1995). Scaling for the VO2-to-body size relationship among children and adults. Journal of Applied Physiology, 79(3), 958-967.
Rowell, L. B., Brengelmann, G. L., Murray, J. A., Kraning, K. K., 2nd, & Kusumi, F. (1969). Human metabolic responses to hyperthermia during mild to maximal exercise. Journal of Applied Physiology, 26(4), 395-402.
Rowland, T., Cunningham, L., Martel, L., Vanderburgh, P., Manos, T., & Charkoudian, N. (1997). Gender effects on submaximal energy expenditure in children. International Journal of Sports Medicine, 18(6), 420-425. doi: 10.1055/s-2007-972658
Rowland, T. W., Auchinachie, J. A., Keenan, T. J., & Green, G. M. (1987). Physiologic responses to treadmill running in adult and prepubertal males. International Journal of Sports Medicine, 8(4), 292-297. doi: 10.1055/s-2008-1025672
Rowland, T. W., Auchinachie, J. A., Keenan, T. J., & Green, G. M. (1988). Submaximal aerobic running economy and treadmill performance in prepubertal boys. International Journal of Sports Medicine, 9(3), 201-204. doi: 10.1055/s-2007-1025006
Rowlands, D. S., Graham, D. F., Fink, P. W., Wadsworth, D. P., & Hughes, J. D. (2013). Effect of whole-body microtitanium-treated garments on metabolic cost of exercise following strenuous hill running. Journal of Science and Medicine in Sport. doi: 10.1016/j.jsams.2013.03.003
Rusko, H., & Bosco, C. C. (1987). Metabolic response of endurance athletes to training with added load. European Journal of Applied Physiology and Occupational Physiology, 56(4), 412-418.
Saibene, F. (1990). The mechanisms for minimizing energy expenditure in human locomotion. European Journal of Clinical Nutrition, 44 Suppl 1, 65-71.
Sale, D. G. (1988). Neural adaptation to resistance training. Medicine and Science in Sports and Exercise, 20(5 Suppl), S135-145.
Sale, D. G. (2002). Postactivation potentiation: role in human performance. Exercise and Sport Sciences Reviews, 30(3), 138-143.
Saltin, B. (1964). Circulatory Response to Submaximal and Maximal Exercise after Thermal Dehydration. Journal of Applied Physiology, 19, 1125-1132.
Saltin, B., Larsen, H., Terrados, N., Bangsbo, J., Bak, T., Kim, C. K., . . . Rolf, C. J. (1995). Aerobic exercise capacity at sea level and at altitude in Kenyan boys, junior and senior runners compared with Scandinavian runners. Scandinavian Journal of Medicine and Science in Sports, 5(4), 209-221.
Sandsund, M., Saursaunet, V., Wiggen, O., Renberg, J., Faerevik, H., & van Beekvelt, M. C. (2012). Effect of ambient temperature on endurance performance while wearing cross-country skiing clothing. European Journal of Applied Physiology, 112(12), 3939-3947. doi: 10.1007/s00421-012-2373-1
Saunders, P. U., Cox, A. J., Hopkins, W. G., & Pyne, D. B. (2010). Physiological measures tracking seasonal changes in peak running speed. International Journal of Sports Physiology and Performance, 5(2), 230-238.
Saunders, P. U., & Green, D. J. (2013). Runners and Walkers. In R. Tanner & C. J. Gore (Eds.), Physiological Tests for Elite Athletes (Vol. 2nd, pp. 404). Champaign: Human Kinetics.
Saunders, P. U., Pyne, D. B., Telford, R. D., & Hawley, J. A. (2004a). Factors affecting running economy in trained distance runners. Sports Medicine, 34(7), 465-485. doi: 3475 [pii]
Saunders, P. U., Pyne, D. B., Telford, R. D., & Hawley, J. A. (2004b). Reliability and variability of running economy in elite distance runners. Medicine and Science in Sports and Exercise, 36(11), 1972-1976. doi: 00005768-200411000-00022 [pii]
190
Saunders, P. U., Telford, R. D., Pyne, D. B., Cunningham, R. B., Gore, C. J., Hahn, A. G., & Hawley, J. A. (2004). Improved running economy in elite runners after 20 days of simulated moderate-altitude exposure. Journal of Applied Physiology, 96(3), 931-937. doi: 10.1152/japplphysiol.00725.2003
00725.2003 [pii] Saunders, P. U., Telford, R. D., Pyne, D. B., Hahn, A. G., & Gore, C. J. (2009).
Improved running economy and increased hemoglobin mass in elite runners after extended moderate altitude exposure. Journal of Science and Medicine in Sport, 12(1), 67-72. doi: S1440-2440(07)00200-9 [pii]
10.1016/j.jsams.2007.08.014 Saunders, P. U., Telford, R. D., Pyne, D. B., Peltola, E. M., Cunningham, R. B., Gore,
C. J., & Hawley, J. A. (2006). Short-term plyometric training improves running economy in highly trained middle and long distance runners. Journal of Strength and Conditioning Research, 20(4), 947-954. doi: R-18235 [pii]
10.1519/R-18235.1 Saunders, P. U., Telford, R. D., Pyne, D. D., Gore, C. J., & Hahn, A. G. (2009).
Improved race performance in elite middle-distance runners after cumulative altitude exposure. International Journal of Sports Physiology and Performance, 4(1), 134-138.
Schmitt, L., Millet, G., Robach, P., Nicolet, G., Brugniaux, J. V., Fouillot, J. P., & Richalet, J. P. (2006). Influence of "living high-training low" on aerobic performance and economy of work in elite athletes. European Journal of Applied Physiology, 97(5), 627-636. doi: 10.1007/s00421-006-0228-3
Scholz, M. N., Bobbert, M. F., van Soest, A. J., Clark, J. R., & van Heerden, J. (2008). Running biomechanics: shorter heels, better economy. The Journal of Experimental Biology, 211(Pt 20), 3266-3271. doi: 10.1242/jeb.018812
Sedano, S., Marin, P. J., Cuadrado, G., & Redondo, J. C. (2013). Concurrent training in elite male runners: The influence of strength versus muscular endurance training on performance outcomes. Journal of Strength and Conditioning Research. doi: 10.1519/JSC.0b013e318280cc26
Shrier, I. (2004). Does stretching improve performance? A systematic and critical review of the literature. Clinical Journal of Sport Medicine, 14(5), 267-273.
Silverman, M., & Anderson, S. D. (1972). Metabolic cost of treadmill exercise in children. Journal of Applied Physiology, 33(5), 696-698.
Sjodin, B., Jacobs, I., & Svedenhag, J. (1982). Changes in onset of blood lactate accumulation (OBLA) and muscle enzymes after training at OBLA. European Journal of Applied Physiology and Occupational Physiology, 49(1), 45-57.
Sjodin, B., & Svedenhag, J. (1992). Oxygen uptake during running as related to body mass in circumpubertal boys: a longitudinal study. European Journal of Applied Physiology and Occupational Physiology, 65(2), 150-157.
Skinner, J. S., Hutsler, R., Bergsteinova, V., & Buskirk, E. R. (1973). Perception of effort during different types of exercise and under different environmental conditions. Medicine and Science in Sports, 5(2), 110-115.
Slawinski, J., Demarle, A., Koralsztein, J. P., & Billat, V. (2001). Effect of supra-lactate threshold training on the relationship between mechanical stride descriptors and aerobic energy cost in trained runners. Archives of Physiology and Biochemistry, 109(2), 110-116. doi: 10.1076/apab.109.2.110.4270
Smith, T. P., Coombes, J. S., & Geraghty, D. P. (2003). Optimising high-intensity treadmill training using the running speed at maximal O(2) uptake and the time for which this can be maintained. European Journal of Applied Physiology, 89(3-4), 337-343. doi: 10.1007/s00421-003-0806-6
Smith, T. P., McNaughton, L. R., & Marshall, K. J. (1999). Effects of 4-wk training using Vmax/Tmax on VO2max and performance in athletes. Medicine and Science in Sports and Exercise, 31(6), 892-896.
Sobhani, S., Bredeweg, S., Dekker, R., Kluitenberg, B., van den Heuvel, E., Hijmans, J., & Postema, K. (2013). Rocker shoe, minimalist shoe, and standard running
191
shoe: A comparison of running economy. Journal of Science and Medicine in Sport. doi: 10.1016/j.jsams.2013.04.015
Soule, R. G., & Goldman, R. F. (1969). Energy cost of loads carried on the head, hands, or feet. Journal of Applied Physiology, 27(5), 687-690.
Spurrs, R. W., Murphy, A. J., & Watsford, M. L. (2003). The effect of plyometric training on distance running performance. European Journal of Applied Physiology, 89(1), 1-7. doi: 10.1007/s00421-002-0741-y
Squadrone, R., & Gallozzi, C. (2009). Biomechanical and physiological comparison of barefoot and two shod conditions in experienced barefoot runners. The Journal of Sports Medicine and Physical Fitness, 49(1), 6-13.
Staron, R. S., Karapondo, D. L., Kraemer, W. J., Fry, A. C., Gordon, S. E., Falkel, J. E., . . . Hikida, R. S. (1994). Skeletal muscle adaptations during early phase of heavy-resistance training in men and women. Journal of Applied Physiology, 76(3), 1247-1255.
Staron, R. S., Leonardi, M. J., Karapondo, D. L., Malicky, E. S., Falkel, J. E., Hagerman, F. C., & Hikida, R. S. (1991). Strength and skeletal muscle adaptations in heavy-resistance-trained women after detraining and retraining. Journal of Applied Physiology, 70(2), 631-640.
Staron, R. S., Malicky, E. S., Leonardi, M. J., Falkel, J. E., Hagerman, F. C., & Dudley, G. A. (1990). Muscle hypertrophy and fast fiber type conversions in heavy resistance-trained women. European Journal of Applied Physiology and Occupational Physiology, 60(1), 71-79.
Stellingwerff, T. (2013). Contemporary Nutrition Approaches to Optimize Elite Marathon Performance. International Journal of Sports Physiology and Performance.
Stepto, N. K., Hawley, J. A., Dennis, S. C., & Hopkins, W. G. (1999). Effects of different interval-training programs on cycling time-trial performance. Medicine and Science in Sports and Exercise, 31(5), 736-741.
Stone, M., O'Bryant, H., Pierce, K., Haff, G., Koch, A., Schilling, B., & Johnson, R. (1999). Periodization: effects of manipulating volume and intensity. Part 1. Strength and Conditioning, 21(2), 56-62.
Stone, M. H., Stone, M., & Sands, B. (2007). Principles and practice of resistance training. Champaign, IL: Human Kinetics.
Storen, O., Helgerud, J., & Hoff, J. (2011). Running stride peak forces inversely determine running economy in elite runners. Journal of Strength and Conditioning Research, 25(1), 117-123. doi: 10.1519/JSC.0b013e3181b62c8a
Storen, O., Helgerud, J., Stoa, E. M., & Hoff, J. (2008). Maximal strength training improves running economy in distance runners. Medicine and Science in Sports and Exercise, 40(6), 1087-1092. doi: 10.1249/MSS.0b013e318168da2f
Stratton, E., O'Brien, B. J., Harvey, J., Blitvich, J., McNicol, A. J., Janissen, D., . . . Knez, W. (2009). Treadmill velocity best predicts 5000-m run performance. International Journal of Sports Medicine, 30(1), 40-45.
Stray-Gundersen, J., Chapman, R. F., & Levine, B. D. (2001). "Living high-training low" altitude training improves sea level performance in male and female elite runners. Journal of Applied Physiology, 91(3), 1113-1120.
Svedenhag, J. (2000). Running Economy. In J. Bangsbo & H. Larsen (Eds.), Running and Science (pp. 85-105). Copenhagen: Munksgaard.
Svedenhag, J., & Sjodin, B. (1984). Maximal and submaximal oxygen uptakes and blood lactate levels in elite male middle- and long-distance runners. International Journal of Sports Medicine, 5(5), 255-261. doi: 10.1055/s-2008-1025916
Svedenhag, J., & Sjodin, B. (1985). Physiological characteristics of elite male runners in and off-season. Canadian Journal of Applied Sport Sciences, 10(3), 127-133.
Svedenhag, J., & Sjodin, B. (1994). Body-mass-modified running economy and step length in elite male middle- and long-distance runners. International Journal of Sports Medicine, 15(6), 305-310. doi: 10.1055/s-2007-1021065
192
Taipale, R. S., Mikkola, J., Nummela, A., Vesterinen, V., Capostagno, B., Walker, S., . . . Hakkinen, K. (2009). Strength Training in Endurance Runners. International Journal of Sports Medicine. doi: 10.1055/s-0029-1243639
Taipale, R. S., Mikkola, J., Salo, T., Hokka, L., Vesterinen, V., Kraemer, W. J., . . . Hakkinen, K. (2013). Mixed maximal and explosive strength training in recreational endurance runners. Journal of Strength and Conditioning Research. doi: 10.1519/JSC.0b013e3182a16d73
Taipale, R. S., Mikkola, J., Vesterinen, V., Nummela, A., & Hakkinen, K. (2013). Neuromuscular adaptations during combined strength and endurance training in endurance runners: maximal versus explosive strength training or a mix of both. European Journal of Applied Physiology, 113(2), 325-335. doi: 10.1007/s00421-012-2440-7
Tartaruga, M. P., Brisswalter, J., Peyre-Tartaruga, L. A., Avila, A. O., Alberton, C. L., Coertjens, M., . . . Kruel, L. F. (2012). The relationship between running economy and biomechanical variables in distance runners. Research Quarterly for Exercise and Sport, 83(3), 367-375.
Taylor, C. R. (1994). Relating mechanics and energetics during exercise. Advances in Veterinary Science and Comparative Medicine, 38A, 181-215.
Taylor, C. R., Heglund, N. C., & Maloiy, G. M. (1982). Energetics and mechanics of terrestrial locomotion. I. Metabolic energy consumption as a function of speed and body size in birds and mammals. The Journal of Experimental Biology, 97, 1-21.
Telford, R. D., Graham, K., & Sutton, J. (1996). Medium altitude training and sea level performance (abstract). Medicine and Science in Sports and Exercise, 28(5 Suppl.), S124.
Thomas, D., Fernhall, B., & Blanpied, P. (1995). Changes in running economy and mechanics during a 5 km run. Journal of Strength and Conditioning Research, 9, 170-175.
Thomas, D. Q., Fernhall, B., & Granat, H. (1999). Changes in running economy during a 5-km run in trained men and women runners. Journal of Strength and Conditioning Research, 13(2), 162-167.
Thoroughman, K. A., & Shadmehr, R. (1999). Electromyographic correlates of learning an internal model of reaching movements. The Journal of Neuroscience, 19(19), 8573-8588.
Thorstensson, A. (1986). Effects of moderate external loading on the aerobic demand of submaximal running in men and 10 year-old boys. European Journal of Applied Physiology and Occupational Physiology, 55(6), 569-574.
Tillin, N. A., & Bishop, D. (2009). Factors modulating post-activation potentiation and its effect on performance of subsequent explosive activities. Sports Medicine, 39(2), 147-166. doi: 10.2165/00007256-200939020-00004
Trehearn, T. L., & Buresh, R. J. (2009). Sit-and-reach flexibility and running economy of men and women collegiate distance runners. Journal of Strength and Conditioning Research, 23(1), 158-162. doi: 10.1519/JSC.0b013e31818eaf49
Truijens, M. J., Rodriguez, F. A., Townsend, N. E., Stray-Gundersen, J., Gore, C. J., & Levine, B. D. (2008). The effect of intermittent hypobaric hypoxic exposure and sea level training on submaximal economy in well-trained swimmers and runners. Journal of Applied Physiology, 104(2), 328-337. doi: 10.1152/japplphysiol.01324.2006
Tucker, R., Santos-Concejero, J., & Collins, M. (2013). The genetic basis for elite running performance. British Journal of Sports Medicine, 47(9), 545-549. doi: 10.1136/bjsports-2013-092408
Turner, A. M., Owings, M., & Schwane, J. A. (2003). Improvement in running economy after 6 weeks of plyometric training. Journal of Strength and Conditioning Research, 17(1), 60-67.
193
Unnithan, V. B., Timmons, J. A., Brogan, R. T., Paton, J. Y., & Rowland, T. W. (1996). Submaximal running economy in run-trained pre-pubertal boys. The Journal of Sports Medicine and Physical Fitness, 36(1), 16-23.
Vandenbogaerde, T. J., Hopkins, W. G., & Pyne, D. B. (2012). A competition-based design to assess performance of a squad of elite athletes. Medicine and Science in Sports and Exercise. doi: 10.1249/MSS.0b013e318267c029
Vanhatalo, A., Bailey, S. J., Blackwell, J. R., DiMenna, F. J., Pavey, T. G., Wilkerson, D. P., . . . Jones, A. M. (2010). Acute and chronic effects of dietary nitrate supplementation on blood pressure and the physiological responses to moderate-intensity and incremental exercise. American Journal of Physiology, 299(4), R1121-1131. doi: 10.1152/ajpregu.00206.2010
Wang, K., McCarter, R., Wright, J., Beverly, J., & Ramirez-Mitchell, R. (1993). Viscoelasticity of the sarcomere matrix of skeletal muscles. The titin-myosin composite filament is a dual-stage molecular spring. Biophysical Journal, 64(4), 1161-1177. doi: 10.1016/S0006-3495(93)81482-6
Warne, J. P., & Warrington, G. D. (2012). Four-week habituation to simulated barefoot running improves running economy when compared with shod running. Scandinavian Journal of Medicine and Science in Sports. doi: 10.1111/sms.12032
Welsman, J. R., Armstrong, N., Nevill, A. M., Winter, E. M., & Kirby, B. J. (1996). Scaling peak VO2 for differences in body size. Medicine and Science in Sports and Exercise, 28(2), 259-265.
Weston, A. R., Karamizrak, O., Smith, A., Noakes, T. D., & Myburgh, K. H. (1999). African runners exhibit greater fatigue resistance, lower lactate accumulation, and higher oxidative enzyme activity. Journal of Applied Physiology, 86(3), 915-923.
Weston, A. R., Mbambo, Z., & Myburgh, K. H. (2000). Running economy of African and Caucasian distance runners. Medicine and Science in Sports and Exercise, 32(6), 1130-1134.
Whitehead, M. T., Martin, T. D., Scheett, T. P., & Webster, M. J. (2012). Running economy and maximal oxygen consumption after 4 weeks of oral Echinacea supplementation. Journal of Strength and Conditioning Research, 26(7), 1928-1933. doi: 10.1519/JSC.0b013e318237e779
Wilber, R. L., & Pitsiladis, Y. P. (2012). Kenyan and Ethiopian distance runners: what makes them so good? International Journal of Sports Physiology and Performance, 7(2), 92-102.
Wilcox, A. R., & Bulbulian, R. (1984). Changes in running economy relative to VO2max during a cross-country season. The Journal of Sports Medicine and Physical Fitness, 24(4), 321-326.
Williams, K., & Cavanagh, P. R. (1986, Aug). Biomechanical correlates with running economy in elite distance runners. Paper presented at the Proceedings of the North American Congress on Biomechanics, Montreal
Williams, K. R. (1985). The relationship between mechanical and physiological energy estimates. Medicine and Science in Sports and Exercise, 17(3), 317-325.
Williams, K. R. (2007). Biomechanical factors contributing to marathon race success. Sports Medicine, 37(4-5), 420-423. doi: 37NaN38 [pii]
Williams, K. R., & Cavanagh, P. R. (1983). A model for the calculation of mechanical power during distance running. Journal of Biomechanics, 16(2), 115-128.
Williams, K. R., & Cavanagh, P. R. (1987). Relationship between distance running mechanics, running economy, and performance. Journal of Applied Physiology, 63(3), 1236-1245.
Williams, K. R., Cavanagh, P. R., & Ziff, J. L. (1987). Biomechanical studies of elite female distance runners. International Journal of Sports Medicine, 8 Suppl 2, 107-118.

194
Williams, T. J., Krahenbuhl, G. S., & Morgan, D. W. (1991). Daily variation in running economy of moderately trained male runners. Medicine and Science in Sports and Exercise, 23(8), 944-948.
Winter, D. A. (1978). Calculation and interpretation of mechanical energy of movement. Exercise and Sport Sciences Reviews, 6, 183-201.
Yigit, S., & Tuncel, F. (1998). A comparison of the endurance training responses to road and sand running in high school and college students. Journal of Strength and Conditioning Research, 12(2), 79-81.
Yoshida, T., Udo, M., Chida, M., Ichioka, M., Makiguchi, K., & Yamaguchi, T. (1990). Specificity of physiological adaptation to endurance training in distance runners and competitive walkers. European Journal of Applied Physiology and Occupational Physiology, 61(3-4), 197-201.
Zacks, R. M. (1973). The mechanical efficiencies of running and bicycling against a horizontal impeding force. Internationale Zeitschrift fur angewandte Physiologie, einschliesslich Arbeitsphysiologie, 31(4), 249-258.
Zamparo, P., Perini, R., Orizio, C., Sacher, M., & Ferretti, G. (1992). The energy cost of walking or running on sand. European Journal of Applied Physiology and Occupational Physiology, 65(2), 183-187.
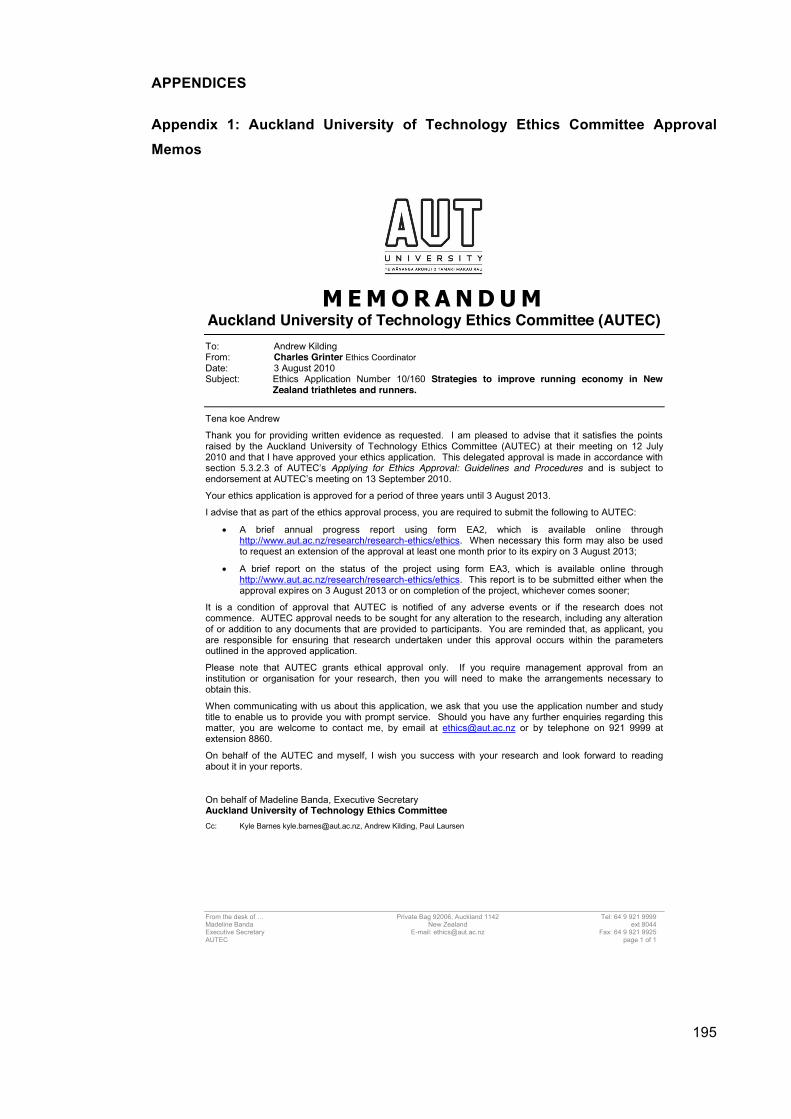
195
APPENDICES
Appendix 1: Auckland University of Technology Ethics Committee Approval
Memos
From the desk of … Private Bag 92006, Auckland 1142 Tel: 64 9 921 9999 Madeline Banda New Zealand ext 8044 Executive Secretary E-mail: [email protected] Fax: 64 9 921 9925 AUTEC page 1 of 1
M E M O R A N D U M Auckland University of Technology Ethics Committee (AUTEC)
To: Andrew Kilding From: Charles Grinter Ethics Coordinator Date: 3 August 2010 Subject: Ethics Application Number 10/160 Strategies to improve running economy in New
Zealand triathletes and runners.
Tena koe Andrew
Thank you for providing written evidence as requested. I am pleased to advise that it satisfies the points raised by the Auckland University of Technology Ethics Committee (AUTEC) at their meeting on 12 July 2010 and that I have approved your ethics application. This delegated approval is made in accordance with section 5.3.2.3 of AUTEC’s Applying for Ethics Approval: Guidelines and Procedures and is subject to endorsement at AUTEC’s meeting on 13 September 2010.
Your ethics application is approved for a period of three years until 3 August 2013.
I advise that as part of the ethics approval process, you are required to submit the following to AUTEC:
x A brief annual progress report using form EA2, which is available online through http://www.aut.ac.nz/research/research-ethics/ethics. When necessary this form may also be used to request an extension of the approval at least one month prior to its expiry on 3 August 2013;
x A brief report on the status of the project using form EA3, which is available online through http://www.aut.ac.nz/research/research-ethics/ethics. This report is to be submitted either when the approval expires on 3 August 2013 or on completion of the project, whichever comes sooner;
It is a condition of approval that AUTEC is notified of any adverse events or if the research does not commence. AUTEC approval needs to be sought for any alteration to the research, including any alteration of or addition to any documents that are provided to participants. You are reminded that, as applicant, you are responsible for ensuring that research undertaken under this approval occurs within the parameters outlined in the approved application.
Please note that AUTEC grants ethical approval only. If you require management approval from an institution or organisation for your research, then you will need to make the arrangements necessary to obtain this.
When communicating with us about this application, we ask that you use the application number and study title to enable us to provide you with prompt service. Should you have any further enquiries regarding this matter, you are welcome to contact me, by email at [email protected] or by telephone on 921 9999 at extension 8860.
On behalf of the AUTEC and myself, I wish you success with your research and look forward to reading about it in your reports.
On behalf of Madeline Banda, Executive Secretary Auckland University of Technology Ethics Committee Cc: Kyle Barnes [email protected], Andrew Kilding, Paul Laursen
196
A U T E C &S E C R E T A R I A T
!
9!July!2013!
!
Andrew!Kilding!
Faculty!of!Health!and!Environmental!Sciences!
!
Dear!Andrew!
Re!Ethics!Application:!13/153&Effects&of&warm&up&with&weighted&vest&on&running&economy&and&peak&speed.!
Thank!you!for!providing!evidence!as!requested,!which!satisfies!the!points!raised!by!the!AUT!University!Ethics!Committee!(AUTEC).!
Your!ethics!application!has!been!approved!for!three!years!until!8!July!2016.!
As!part!of!the!ethics!approval!process,!you!are!required!to!submit!the!following!to!AUTEC:!
• A! brief! annual! progress! report! using! form! EA2,!which! is! available! online! throughhttp://www.aut.ac.nz/researchethics.!!
When!necessary!this!form!may!also!be!used!to!request!an!extension!of!the!approval!at!least!one!month!prior!to!its!expiry!
on!8!July!2016;!
• A! brief! report! on! the! status! of! the! project! using! form! EA3,! which! is! available! online! through!
http://www.aut.ac.nz/researchethics.!!This!report!is!to!be!submitted!either!when!the!approval!expires!on!8!July!2016!or!
on!completion!of!the!project.!
!
It!is!a!condition!of!approval!that!AUTEC!is!notified!of!any!adverse!events!or!if!the!research!does!not!commence.!!AUTEC!approval!
needs!to!be!sought!for!any!alteration!to!the!research,!including!any!alteration!of!or!addition!to!any!documents!that!are!provided!to!
participants.!!You!are!responsible!for!ensuring!that!research!undertaken!under!this!approval!occurs!within!the!parameters!outlined!
in!the!approved!application.!
AUTEC!grants!ethical! approval!only.! ! If! you! require!management!approval! from!an! institution!or!organisation! for! your! research,!
then!you!will!need!to!obtain!this.!!If!your!research!is!undertaken!within!a!jurisdiction!outside!New!Zealand,!you!will!need!to!make!
the!arrangements!necessary!to!meet!the!legal!and!ethical!requirements!that!apply!there.!
To!enable!us!to!provide!you!with!efficient!service,!please!use!the!application!number!and!study!title!in!all!correspondence!with!us.!!
If!you!have!any!enquiries!about!this!application,!or!anything!else,[email protected].!
All!the!very!best!with!your!research,!!
!
!
!
!
Kate!O’Connor!
Executive!Secretary!
Auckland&University&of&Technology&Ethics&Committee&
Cc:! [email protected]!
197
Appendix 2: Hope College Human Subjects Review Board Ethics Approval Memo
MARTHA MILLER CENTER FOR GLOBAL COMMUNICATION / 257 COLUMBIA AVENUE / PO BOX 9000 HOLLAND, MICHIGAN 49422-9000 / 616-395-7595 / FAX 616-395-7937
HOPE COLLEGE DEPARTMENT OF COMMUNICATION
August 10, 2011 Professor Mark Northuis Department of Kinesiology Hope College Kyle Barnes Sport Performance Research Institute School of Sport and Recreation AUT University, Auckland, NZ Dear Mark & Kyle: Your research proposal, “A Competition-Based Research Design to Assess a Resistance Training Intervention Affecting the Performance and Running Economy of Cross Country Runners,” has been approved by the HSRB. Thank you for submitting the revised application that addresses the HSRB concerns or requests for clarification (in response to HSRB letter dated 8/9/11). This approval is for a 12-month period from the date of this letter, and is for Mark Northuis to act as supervisor for this research project for all data collected on Hope College’s campus or with Hope College student participants. If your research should continue beyond this 12-month period, you will need to file a continuation request. Please see the HSRB website (www.hope.edu/admin/hsrb) for the necessary procedures for requesting a continuation of your HSRB approval beyond one year. It is also important that you notify HSRB of any changes to your research protocol, or any unanticipated risks or effects of your project on human participants. Please see the HSRB website for procedures for requesting modifications of this research project. If there are any concerns about participants’ physical or mental wellbeing, the security of participants’ information, or any unanticipated risks experienced by your participants, please contact HSRB immediately by email: [email protected]. Your proposal, all correspondence with HSRB, and this HSRB decision letter will be electronically archived. Please also keep this letter for your records. Thank you for your diligence in providing a safe and secure environment for human participants in research projects at Hope College. Best wishes with your research. Deirdre D. Johnston HSRB Chair [email protected]
198
Appendix 3: Subject Information Packs (chapters 4-7)
Participant Information Sheet
Date Information Sheet Produced:
14th September 2010
Project Title
Lower Limb Determinants of Running Economy in Male and Female Runners An Invitation
Hi, my name is Kyle Barnes and I am a PhD student at AUT University. In affiliation with Triathlon New Zealand and Athletics New Zealand; along with my supervisors Dr. Andrew Kilding, Dr. Will Hopkins, and Dr. Mike McGuigan, I am inviting you to help with a project that is investigating the lower limb determinants of running economy in male and female runners.
Before you decide, please read the information below to find out more of what this project is all about. After which, you need to decide whether or not you would like to be involved. You don’t have to be involved, and you can stop being involved in the study at any time.
What is the purpose of this research?
Even though we've known about its importance for about 80 years, running economy has been largely ignored by researchers, coaches and athletes until recently, when we figured out that RE is a better predictor of performance than other more commonly used measures. For example, we regularly measure the maximum volume of oxygen that can be used (i.e. VO2max), but for running events longer than about 5000 m, runners don't use this "maximum" amount, as such events are sub-maximal. Therefore, a more important measure becomes the volume of oxygen that is used when the athlete is running at a sub-maximal speed.
Despite the performance benefits of being an economical runner, researchers have yet to resolve why some runners demonstrate markedly better economy when compared to counterparts exhibiting similar fitness, training history and performance backgrounds. A number of physiological, biomechanical and neuromuscular factors appear to influence running economy in well-trained or elite runners. These include metabolic adaptations within the muscle such as increased mitochondria and oxidative enzymes, more efficient mechanics leading to less energy wasted on breaking forces and excessive vertical oscillation, and the ability of muscles to store and release elastic energy by increasing the lower-limb stiffness. Furthermore, a variety of modifiable (e.g. percent body fat, body mass) and un-modifiable (e.g. Achilles moment arm length, height, skeletal structure) anthropometric measures influence biomechanical and neuromuscular efficiency and subsequently alter running economy. For example, the amount of energy stored in a tendon depends on the mechanical properties of the tendon and on the force that stretch the tendon. Thus, for a given movement pattern, tendon force is inversely related to the moment arm of the Achilles tendon. Since it is generally accepted that storage and reutilization of elastic energy in tendons substantially reduces energy demands in running previous research has been able to establish a
199
relationship between the variation in running economy and the moment arm of the Achilles tendon. Recent research has focused on various neuromuscular or biomechanical characteristics as mechanisms to explain improvements in running economy. Any lower-limb adaptations which allows for improved muscle power development, enhanced ability of the muscles to store and release elastic energy by increasing stiffness, or more efficient mechanics characterized by more skilled control of movement and muscle recruitment patterns could certainly explain differences in running economy among runners. The differences in running economy that exist between males and females has been previously investigated, but with mixed findings. Research has yet to explore whether many of these lower-limb characteristics can explain these inter-individual differences in running economy between male and female trained distance runners. Such data would allow practitioners to assess and train specific qualities of running economy throughout various training phases. Therefore, the present study was designed to evaluate the lower-limb determinants of running economy among well-trained male and female distance runners.
How was I chosen for this invitation?
You are a competitive senior runner (18+ years of age) in the Auckland region who competes regularly in local and national competitions.
What will happen in this research?
If you decide to participate in this research you will be required to come to the SPRINZ labs at AUT-Millennium on one occasion to participate in a range of laboratory-based physiological and biomechanical assessments. During your visit you will be measured for a variety of anthropometric characteristics (height, weight, and body composition) will be measured using scales, tape measures and skin fold callipers and camera. Following this you will complete a treadmill test to assess your running economy and VO2max. The running ecpnomy test will involve you running at 5 to 7 submaximal speeds for 4 minutes each with 90 seconds recovery followed by a VO2max test which involves you running at the last submaximal speed completed with a progressively increasing gradient until volitional exhaustion. Lastly, you will complete several jumping tests that measure strength and power.
What are the discomforts and risks?
There are several maximal assessments as part of this research. It is expected that you will experience temporary discomfort during maximal exertion during various run assessments. These tests are used to measure your maximal aerobic capacity and performance capabilities. The amount of exertion at the conclusion of the assessments will be similar to what you will feel at the end of a 5 km or 10 km race. You will be able to interrupt any of the tests if you feel uncomfortable at any time.
How will these discomforts and risks be alleviated?
During the maximal assessments there will be lab attendants present who will be able to assist if you are feeling unwell. A medical facility is located on campus with medical doctors and nurses and other qualified medical staff. Additionally, Kyle Barnes is qualified instructor for the American Red Cross in CPR, First Aid and AED emergency care.
What are the benefits?
You will benefit from this research through having a better understanding of your personal physiological and biomechanical characteristics (VO2max, Lactate Threshold, Running Economy, Heart Rate, Training Zones, etc.).
200
What compensation is available for injury or negligence?
In the unlikely event of a physical injury as a result of your participation in this study, rehabilitation and compensation for injury by accident may be available from the Accident Compensation Corporation, providing the incident details satisfy the requirements of the law and the Corporation's regulations.
How will my privacy be protected?
All information related to you will be coded in order to ensure that you cannot be identified. Data will be stored on a memory stick or CD and stored in the SPRINZ secure Ethics and Data facility at AUT Millennium campus and all hard copy and electronic data will be destroyed after six years and will only be accessible to the people of the running economy project. No-one will be able to identify you from any of the summary findings for the report of the project. Information regarding your results will only be passed onto others with your permission. What are the costs of participating in this research?
There are no costs to participating in this research.
What opportunity do I have to consider this invitation?
• You may take the time you need and decide whether or not you would like to be involved. • You can stop being involved in the project at any point.
How do I agree to participate in this research?
If you agree to participate please fill in the attached consent form and return to myself.
Will I receive feedback on the results of this research?
Yes, individual feedback will be provided to you, if you request it. The group results will be used in scientific journal articles and conference presentations. Media articles may be written based on the results of the present study.
What do I do if I have concerns about this research?
Any concerns regarding the nature of this project should be notified in the first instance to the Project Supervisor:
Assoc. Prof. Andrew Kilding, Sport Performance Research Institute New Zealand, School of Sport and Recreation, AUT University, Private Bag 92006, Auckland 1020, Ph 921 9999 ext. 7076, [email protected] Concerns regarding the conduct of the research should be notified to the Executive Secretary of AUTEC, Kate O’Connor, [email protected] , 921 9999 ext 6038.
Whom do I contact for further information about this research?
Researcher Contact Details:
Kyle Barnes, Sport Performance Research Institute New Zealand, School of Sport and Recreation, AUT University, Auckland 0637, Ph 022 655 4685, [email protected]
Project Supervisor Contact Details:

201
Assoc. Prof. Andrew Kilding, Sport Performance Research Institute New Zealand, School of Sport and Recreation, AUT University, Private Bag 92006, Auckland 1020, Ph 921 9999 ext. 7056, [email protected]
202
Participant Information Sheet
Date Information Sheet Produced:
28th May 2013
Project Title
Effects of Warm Up with Weighted Vest on Running Economy and Peak Speed An Invitation
Hi, my name is Kyle Barnes and I am a PhD student at AUT University. In affiliation with Sport Performance Research Institute New Zealand; along with my supervisors Dr. Andrew Kilding, Dr. Will Hopkins and Dr. Mike McGuigan, I am inviting you to help with a project that is investigating the effects of a warm-up with a weighted vest on running economy and peak running speed.
Before you decide, please read the information below to find out more of what this project is all about. After which, you need to decide whether or not you would like to be involved. You don’t have to be involved, and you can stop being involved in the study at any time.
What is the purpose of this research?
Even though we've known about its importance for about 80 years, running economy (RE) has been largely ignored by researchers, coaches and athletes until recently, when we figured out that RE is a better predictor of performance than other more commonly used measures. For example, we regularly measure the maximum volume of oxygen that can be used (i.e. VO2max), but for running events longer than about 5000-m, runners don't use this "maximum" amount, as such events are sub-maximal. Therefore, a more important measure becomes the volume of oxygen that is used when the athlete is running at a sub-maximal speed. Given the importance of RE for endurance performance, successful training interventions that improve RE and ultimately performance would likely be embraced by coaches and athletes. Various resistance-training approaches are currently prescribed by coaches and strength & conditioners. However, little information is available pertaining to the optimal type of resistance exercise that maximizes improvements in RE and performance. To this end, the purpose of this research is twofold:
1. Determine the effects of using sport specific hypergravity warm-up on neuromuscular and metabolic mediators related to endurance performance.
2. To determine efficacy of using a set of !"strides" (sprints) with a weighted vest during a traditional warm-up on endurance performance.
203
How was I chosen for this invitation?
You are a senior member (18+ years of age) of the Takapuna Harriers Athletic Club who competes regularly in local and national competitions contacted through the Takapuna Harriers mailing list or newsletter or personally contacted by the principle researcher.
What will happen in this research?
If you decide to participate in this research you will be required to come to the SPRINZ labs at AUT-Millennium a total of three times for research testing. Following a familiarisation session during which you will be introduced to all equipment and procedures, each subsequent test will involve you performing a standardized warm-up, which will consist of 15-20 minutes of easy running while measuring VO2, followed by a series of ‘strides’ with a weighted vest (at 20% body weight) or at normal body weight. To measure VO2 you will wear a mouthpiece, similar to a swimming snorkel. This will be followed by another 5 min of easy run while measuring VO2 which will continue directly into a peak speed test in which the treadmill speed will increase one kilometre per hour every minute until volitional exhaustion.
What are the discomforts and risks?
There are several maximal assessments as part of this research. It is expected that you will experience temporary discomfort during maximal exertion during various run assessments. These tests are used to measure your maximal aerobic capacity and performance capabilities. The amount of exertion at the conclusion of the assessments will be similar to what you will feel at the end of a 5 km or 10 km race. You will be able to interrupt any of the tests if you feel uncomfortable at any time.
How will these discomforts and risks be alleviated?
During the maximal assessments there will be lab attendants present who will be able to assist if you are feeling unwell. A medical facility is located on campus with medical doctors and nurses and other qualified medical staff. Additionally, Kyle Barnes is qualified instructor for the American Red Cross in CPR, First Aid and AED emergency care.
What are the benefits?
You will benefit from this research through having a better understanding of your personal physiological and biomechanical characteristics (VO2max, Lactate Threshold, Running Economy, Heart Rate, etc.) as well as (hopefully) becoming more economical through the assigned training intervention group which will ultimately lead to better performances.
What compensation is available for injury or negligence?
In the unlikely event of a physical injury as a result of your participation in this study, rehabilitation and compensation for injury by accident may be available from the Accident Compensation Corporation, providing the incident details satisfy the requirements of the law and the Corporation's regulations.
How will my privacy be protected?
All information related to you will be coded in order to ensure that you cannot be identified. Data will be stored on a memory stick or CD and stored in the SPRINZ secure Ethics and Data facility at AUT Millennium campus and all hard copy and electronic data will be destroyed after six years and will only be accessible to the people of the running economy project. No-one will be able to identify you from any of the summary findings for the report of the project. Information regarding your results will only be passed onto others with your permission.

204
What are the costs of participating in this research?
There are no costs to participating in this research.
What opportunity do I have to consider this invitation?
• You may take the time you need and decide whether or not you would like to be involved. • You can stop being involved in the project at any point.
How do I agree to participate in this research?
If you agree to participate please fill in the attached consent form and return to myself.
Will I receive feedback on the results of this research?
Yes, individual feedback will be provided to you, if you request it. The group results will be used in scientific journal articles and conference presentations. Media articles may be written based on the results of the present study.
What do I do if I have concerns about this research?
Any concerns regarding the nature of this project should be notified in the first instance to the Project Supervisor:
Assoc. Prof. Andrew Kilding, Sport Performance Research Institute New Zealand, School of Sport and Recreation, AUT University, Private Bag 92006, Auckland 1020, Ph 921 9999 ext. 7076, [email protected] Concerns regarding the conduct of the research should be notified to the Executive Secretary of AUTEC, Kate O’Connor, [email protected] , 921 9999 ext 6038.
Whom do I contact for further information about this research?
Researcher Contact Details:
Kyle Barnes, Sport Performance Research Institute New Zealand, School of Sport and Recreation, AUT University, Auckland 0637, Ph 022 655 4685, [email protected]
Project Supervisor Contact Details:
Assoc. Prof. Andrew Kilding, Sport Performance Research Institute New Zealand, School of Sport and Recreation, AUT University, Private Bag 92006, Auckland 1020, Ph 921 9999 ext. 7056, [email protected]

205
Participant Information Sheet
Date Information Sheet Produced:
21st June, 2010
Project Title
Uphill Running Training Methods to Enhance Running Economy in New Zealand Triathletes and Runners
An Invitation
Hi, my name is Kyle Barnes and I am a PhD student at AUT University. In affiliation with Triathlon New Zealand and Athletics New Zealand; along with my supervisors Dr. Andrew Kilding, Dr. Paul Laursen, and Dr. Mike McGuigan, I am inviting you to help with a project that is investigating optimal resistance training methods to improve running economy and performance in runners and triathletes.
Before you decide, please read the information below to find out more of what this project is all about. After which, you need to decide whether or not you would like to be involved. You don’t have to be involved, and you can stop being involved in the study at any time.
What is the purpose of this research?
Even though we've known about its importance for about 80 years, running economy (RE) has been largely ignored by researchers, coaches and athletes until recently, when we figured out that RE is a better predictor of performance than other more commonly used measures. For example, we regularly measure the maximum volume of oxygen that can be used (i.e. VO2max), but for running events longer than about 5000 m, runners don't use this "maximum" amount, as such events are sub-maximal. Therefore, a more important measure becomes the volume of oxygen that is used when the athlete is running at a sub-maximal speed. Given the importance of RE for endurance performance, successful training interventions that improve RE and ultimately performance would likely be embraced by coaches and athletes. Many athletes incorporate hill running as a sport-specific/functional form of resistance training. However, there is mixed opinion amongst coaches on whether hills should be ‘short and steep’ or ‘long and gradual’. To our knowledge, no research exists on how various hill training methods affect RE, strength, power, and other performance measures. To this end, the purpose of this research is threefold:
1. Determine the hill training is effective at improving running economy 2. Identify the optimal hill training approach
3. Determine biomechanical and physiological factors affecting RE in well-trained runners and triathletes

206
How was I chosen for this invitation?
You are part of Triathlon New Zealand’s High Performance squad or recognised as a national class triathlete.
What will happen in this research?
If you decide to participate in this research you will be required to come to the University lab at the Millennium Institute for Sport and Health in Mairangi Bay a total of six times for research testing (three before and three after the intervention) as well as an additional 18 times for the intervention group you are assigned to. The first day of pre-intervention testing will take approximately 90 minutes, the second day will take 120 minutes and the third day will involve 90 minutes of your time. You will be asked to participate in a range of laboratory-based physiological and biomechanical assessments over a 7 day period. Two days rest is scheduled between each assessment day. The same time frame should be expected for post-intervention testing. Each training session throughout the training intervention period will last approximately 60 minutes.
On the first day anthropometric variables (height, weight, limb length, circumference and skinfold) will be measured using scales, tape measures and skinfold callipers. Following this you will complete a treadmill test to assess your running economy and VO2max. The RE test will involve you running at 4 to 6 submaximal speeds for 4 minutes each with 90 seconds recovery followed by a VO2max test which involves you running at the last submaximal speed completed with a progressively increasing gradient until volitional exhaustion. The second day of testing involves similar anthropometric measurements followed by a RE test identical to day 1 that will simply be preceded by a 45 minute high intensity cycling bout designed to replicate the cycling portion of a draft legal triathlon. After approximately 20 min of recovery a maximal anaerobic running test (MART) will be completed. The MART consists of a series of 20-s runs on a treadmill at progressively faster speeds until volitional exhaustion. On the third day of testing after a warm-up you will complete two jumping tests that measure strength and power followed by a 5 km time-trial on an outdoor 400 m running track. After the 5 km time-trial you will complete the same jumping tests as before the time-trial as well as a maximal strength test on the squat and bench press. Additionally, during each running tests on each day, you will be video recorded for biomechanical analysis of running form.
During the intervention period will be assigned to one of the various training intervention groups and follow a periodised set of resistance training exercises deemed appropriate by Triathlon New Zealand’s Strength and Condition coach as well as NZASNI strength and power scientists. The intervention period will last 54 days or six 9-day training cycles. Additionally, you will be asked to keep a detailed record of your training which will include details such as load, intensity, and volume of training from swimming, cycling, and running. The same tests performed before the intervention will be performed after in the same order.
What are the discomforts and risks?
There are several maximal assessments as part of this research. It is expected that you will experience temporary discomfort during maximal exertion during various run assessments. These tests are used to measure your maximal aerobic capacity and performance capabilities. The amount of exertion at the conclusion of the assessments will be similar to what you will feel at the end of a 5 km or 10 km race. You will be able to interrupt any of the tests if you feel uncomfortable at any time.

207
How will these discomforts and risks be alleviated?
During the maximal assessments there will be lab attendants present who will be able to assist if you are feeling unwell. A medical facility is located within the facility with medical doctors and other qualified medical staff. Additionally, Kyle Barnes is qualified instructor for the American Red Cross in CPR, First Aid and AED emergency care.
What are the benefits?
You will benefit from this research through having a better understanding of your personal physiological and biomechanical characteristics (VO2max, Lactate Threshold, Running Economy, Heart Rate, etc.) as well as (hopefully) becoming more economical through the assigned training intervention group which will ultimately lead to better performances.
What compensation is available for injury or negligence?
In the unlikely event of a physical injury as a result of your participation in this study, rehabilitation and compensation for injury by accident may be available from the Accident Compensation Corporation, providing the incident details satisfy the requirements of the law and the Corporation's regulations.
How will my privacy be protected?
All information related to you will be coded in order to ensure that you cannot be identified. The information will remain in locked storage and will only be accessible to the people of the running economy project. No-one will be able to identify you from any of the summary findings for the report of the project. Information regarding your results will only be passed onto others with your permission.
What are the costs of participating in this research?
The duration of the first day of testing will last approximately 90 minutes (10 minutes for consent forms and clarification of study protocols, 20 minutes for anthropometry, 60 minutes for the Running Economy and VO2max test). The second day of testing will last approximately 120 minutes (10 minutes for anthropometry, 75 minutes for Running Economy off the Bike test and 15 minutes for the MART test). Day three testing will last approximately 90 minutes in duration (45 minutes for the 5 km time-trial and 45 minutes for power and strength assessments).
Each training session throughout the training intervention period will last approximately 60 minutes. Because the subjects in these studies train in 9 day cycles, each subject will have 3 x 60 min sessions every 9 day cycle (6 total cycles x 3 training sessions per cycle = 18 total training sessions)
We will provide you with a $20 petrol voucher to help cover costs of transport to the testing sessions.
What opportunity do I have to consider this invitation?
• You may take the time you need and decide whether or not you would like to be involved • You can stop being involved in the project at any point.
How do I agree to participate in this research?
If you agree to participate please fill in the attached consent form and return to myself.
208
Will I receive feedback on the results of this research?
Yes, individual feedback will be provided to you, if you request it. The group results will be used in scientific journal articles and conference presentations. Media articles may be written based on the results of the present study.
What do I do if I have concerns about this research?
Any concerns regarding the nature of this project should be notified in the first instance to the Project Supervisor:
Assoc. Prof. Andrew Kilding, Sport Performance Research Institute New Zealand, School of Sport and Recreation, AUT University, Private Bag 92006, Auckland 1020, Ph 921 9999 ext. 7076, [email protected] Concerns regarding the conduct of the research should be notified to the Executive Secretary, AUTEC, Madeline Banda, [email protected], Ph 921 9999 ext 8044.
Whom do I contact for further information about this research?
Researcher Contact Details:
Kyle Barnes, Sport Performance Research Institute New Zealand, School of Sport and Recreation, AUT University, Auckland 0637, Ph 022 655 4685, [email protected]
Project Supervisor Contact Details:
Assoc. Prof. Andrew Kilding, Sport Performance Research Institute New Zealand, School of Sport and Recreation, AUT University, Private Bag 92006, Auckland 1020, Ph 921 9999 ext. 7056, [email protected]
Approved by the Auckland University of Technology Ethics Committee on 13 September, 2010, AUTEC Reference number 10/160
209
Participant Information Sheet
Date Information Sheet Produced:
25th May, 2011
Project Title
A Competition-Based Research Design to Assess a Resistance Training Intervention Affecting the Performance and Running Economy of Cross Country Runners
An Invitation
Hi, my name is Kyle Barnes and I am a PhD student at AUT University. In affiliation with Triathlon New Zealand and Athletics New Zealand; along with my supervisors Dr. Andrew Kilding, Dr. Paul Laursen, Dr. Will Hopkins and Dr. Mike McGuigan, I am inviting you to help with a project that is investigating optimal resistance training methods to improve running economy and performance in runners and triathletes.
Before you decide, please read the information below to find out more of what this project is all about. After which, you need to decide whether or not you would like to be involved. You don’t have to be involved, and you can stop being involved in the study at any time.
What is the purpose of this research?
Even though we've known about its importance for about 80 years, running economy (RE) has been largely ignored by researchers, coaches and athletes until recently, when we figured out that RE is a better predictor of performance than other more commonly used measures. For example, we regularly measure the maximum volume of oxygen that can be used (i.e. VO2max), but for running events longer than about 5000 m, runners don't use this "maximum" amount, as such events are sub-maximal. Therefore, a more important measure becomes the volume of oxygen that is used when the athlete is running at a sub-maximal speed. Given the importance of RE for endurance performance, successful training interventions that improve RE and ultimately performance would likely be embraced by coaches and athletes. Various resistance training approaches are currently prescribed by coaches and strength & conditioners. However, little information is available pertaining to the optimal type of resistance exercise that maximizes improvements in RE and performance. To this end, the purpose of this research is twofold:
1. Determine the optimal resistance load, using traditional weight lifting methods, to improve RE and performance in well-trained distance runners and triathletes.
2. Determine biomechanical and physiological factors affecting RE in well-trained runners.
How was I chosen for this invitation?
You are part of Hope College’s Men’s or Women’s Cross Country team.
210
What will happen in this research?
If you decide to participate in this research you will be required to come to the kinesiology lab at Hope College a total of two times for research testing (one before and one after the intervention). The first day of pre-intervention testing will take approximately 90 minutes. You will be asked to participate in a range of laboratory-based physiological and biomechanical assessments. The same time frame should be expected for post-intervention testing.
On the first day anthropometric variables (height, weight, and body composition) will be measured using scales, tape measures and skinfold callipers and BodPod body compotiion system. Following this you will complete a treadmill test to assess your running economy and VO2max. The RE test will involve you running at 5 to 7 submaximal speeds for 4 minutes each with 90 seconds recovery followed by a VO2max test which involves you running at the last submaximal speed completed with a progressively increasing gradient until volitional exhaustion. Lastly, you will complete several jumping tests that measure strength and power. Later in the cross country season you will be assessed for maximal lower body strength prior to when the resistance training intervention begins.
During the intervention period will be assigned to one of the two resistance training intervention groups and follow a periodized set of resistance training exercises deemed appropriate by strength and power specialists located at the New Zealand Academy of Sport in Auckland, New Zealand. The intervention period will last 6 to 9 weeks. Additionally, you will be asked to keep a detailed record of your training which will include details such as load, intensity, and volume of training from running and resistance training. The same tests performed before the intervention will be performed after in the same order.
What are the discomforts and risks?
There are several maximal assessments as part of this research. It is expected that you will experience temporary discomfort during maximal exertion during various run assessments. These tests are used to measure your maximal aerobic capacity and performance capabilities. The amount of exertion at the conclusion of the assessments will be similar to what you will feel at the end of a 5 km or 10 km race. You will be able to interrupt any of the tests if you feel uncomfortable at any time.
How will these discomforts and risks be alleviated?
During the maximal assessments there will be lab attendants present who will be able to assist if you are feeling unwell. A medical facility is located on campus with medical doctors and nurses and other qualified medical staff. Additionally, Kyle Barnes is qualified instructor for the American Red Cross in CPR, First Aid and AED emergency care.
What are the benefits?
You will benefit from this research through having a better understanding of your personal physiological and biomechanical characteristics (VO2max, Lactate Threshold, Running Economy, Heart Rate, etc.) as well as (hopefully) becoming more economical through the assigned training intervention group which will ultimately lead to better performances.
What compensation is available for injury or negligence?
In the unlikely event of a physical injury as a result of your participation in this study, rehabilitation and compensation for injury by accident may be available from the required student insurance provided through your family health insurer or Hope College.
211
How will my privacy be protected?
All information related to you will be coded in order to ensure that you cannot be identified. The information will remain in locked storage and will only be accessible to the people of the running economy project. No-one will be able to identify you from any of the summary findings for the report of the project. Information regarding your results will only be passed onto others with your permission.
What are the costs of participating in this research?
There are no costs to participating in this research.
What opportunity do I have to consider this invitation?
x You may take the time you need and decide whether or not you would like to be involved. x You can stop being involved in the project at any point.
How do I agree to participate in this research?
If you agree to participate please fill in the attached consent form and return to myself.
Will I receive feedback on the results of this research?
Yes, individual feedback will be provided to you, if you request it. The group results will be used in scientific journal articles and conference presentations. Media articles may be written based on the results of the present study.
What do I do if I have concerns about this research?
Any concerns regarding the nature of this project should be notified in the first instance to the Project Supervisor:
Assoc. Prof. Andrew Kilding, Sport Performance Research Institute New Zealand, School of Sport and Recreation, AUT University, Private Bag 92006, Auckland 1020, Ph 921 9999 ext. 7076, [email protected] Concerns regarding the conduct of the research should be notified to the Executive Secretary, AUTEC, Madeline Banda, [email protected], Ph 921 9999 ext 8044.
Whom do I contact for further information about this research?
Researcher Contact Details:
Kyle Barnes, Sport Performance Research Institute New Zealand, School of Sport and Recreation, AUT University, Auckland 0637, Ph 022 655 4685, [email protected]
Project Supervisor Contact Details:
Assoc. Prof. Andrew Kilding, Sport Performance Research Institute New Zealand, School of Sport and Recreation, AUT University, Private Bag 92006, Auckland 1020, Ph 921 9999 ext. 7056, [email protected]
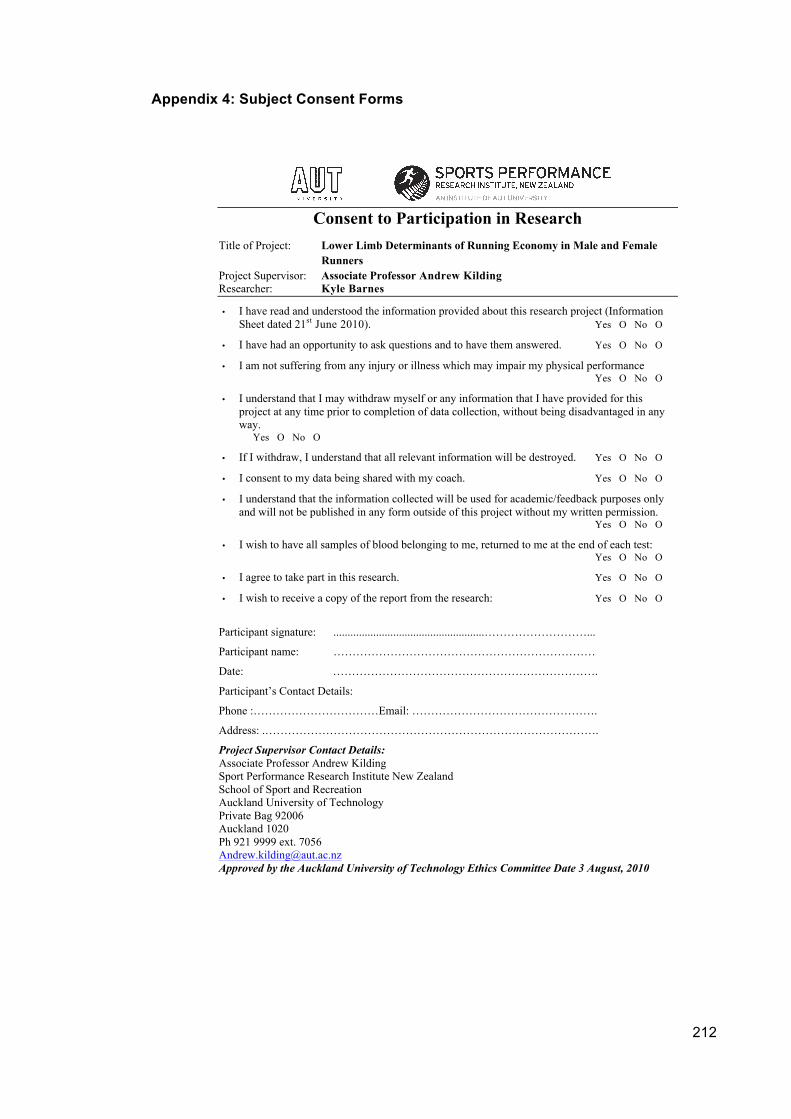
212
Appendix 4: Subject Consent Forms
Consent to Participation in Research
Title of Project: Lower Limb Determinants of Running Economy in Male and Female
Runners Project Supervisor: Associate Professor Andrew Kilding Researcher: Kyle Barnes
• I have read and understood the information provided about this research project (Information Sheet dated 21st June 2010). Yes О No О
• I have had an opportunity to ask questions and to have them answered. Yes О No О
• I am not suffering from any injury or illness which may impair my physical performance Yes О No О
• I understand that I may withdraw myself or any information that I have provided for this project at any time prior to completion of data collection, without being disadvantaged in any way. Yes О No О
• If I withdraw, I understand that all relevant information will be destroyed. Yes О No О
• I consent to my data being shared with my coach. Yes О No О
• I understand that the information collected will be used for academic/feedback purposes only and will not be published in any form outside of this project without my written permission. Yes О No О
• I wish to have all samples of blood belonging to me, returned to me at the end of each test: Yes О No О
• I agree to take part in this research. Yes О No О
• I wish to receive a copy of the report from the research: Yes О No О
Participant signature: .....................................................………………………...
Participant name: ……………………………………………………………
Date: …………………………………………………………….
Participant’s Contact Details:
Phone :……………………………Email: ………………………………………….
Address: .…………………………………………………………………………….
Project Supervisor Contact Details: Associate Professor Andrew Kilding Sport Performance Research Institute New Zealand School of Sport and Recreation Auckland University of Technology Private Bag 92006 Auckland 1020 Ph 921 9999 ext. 7056 [email protected] Approved by the Auckland University of Technology Ethics Committee Date 3 August, 2010
213
Consent to Participation in Research
Title of Project: Effects of Warm Up with Weighted Vest on Running Economy and Peak
Speed Project Supervisor: Associate Professor Andrew Kilding Researcher: Kyle Barnes
• I have read and understood the information provided about this research project (Information Sheet dated 28th February, 2013). Yes О No О
• I have had an opportunity to ask questions and to have them answered. Yes О No О
• I am not suffering from any injury or illness which may impair my physical performance Yes О No О
• I understand that I may withdraw myself or any information that I have provided for this project at any time prior to completion of data collection, without being disadvantaged in any way. Yes О No О
• If I withdraw, I understand that all relevant information will be destroyed. Yes О No О
• I understand that the information collected will be used for academic/feedback purposes only and will not be published in any form outside of this project without my written permission. Yes О No О
• I agree to take part in this research. Yes О No О
• I wish to receive a copy of the report from the research: Yes О No О
Participant signature: .....................................................………………………...
Participant name: ……………………………………………………………
Date: …………………………………………………………….
Participant’s Contact Details:
Phone :……………………………Email: ………………………………………….
Address: .…………………………………………………………………………….
Project Supervisor Contact Details: Associate Professor Andrew Kilding Sport Performance Research Institute New Zealand School of Sport and Recreation Auckland University of Technology Private Bag 92006 Auckland 1020 Ph 921 9999 ext. 7056 [email protected] Approved by the Auckland University of Technology Ethics Committee Date 3 August, 2010
214
Consent to Participation in Research
Title of Project: Effects of Different Hill Training Programmes on Running Economy Project Supervisor: Associate Professor Andrew Kilding Researcher: Kyle Barnes
• I have read and understood the information provided about this research project (Information Sheet dated 21st June 2010). Yes О No О
• I have had an opportunity to ask questions and to have them answered. Yes О No О
• I am not suffering from any injury or illness which may impair my physical performance Yes О No О
• I understand that I may withdraw myself or any information that I have provided for this project at any time prior to completion of data collection, without being disadvantaged in any way. Yes О No О
• If I withdraw, I understand that all relevant information will be destroyed. Yes О No О
• I consent to my data being shared with my coach. Yes О No О
• I understand that the information collected will be used for academic/feedback purposes only and will not be published in any form outside of this project without my written permission. Yes О No О
• I wish to have all samples of blood belonging to me, returned to me at the end of each test: Yes О No О
• I agree to take part in this research. Yes О No О
• I wish to receive a copy of the report from the research: Yes О No О
Participant signature: .....................................................………………………...
Participant name: ……………………………………………………………
Date: …………………………………………………………….
Participant’s Contact Details:
Phone :……………………………Email: ………………………………………….
Address: .…………………………………………………………………………….
Project Supervisor Contact Details: Associate Professor Andrew Kilding Sport Performance Research Institute New Zealand School of Sport and Recreation Auckland University of Technology Private Bag 92006 Auckland 1020 Ph 921 9999 ext. 7056 [email protected] Approved by the Auckland University of Technology Ethics Committee Date 3 August, 2010
215
Consent to Participation in Research
Title of Project: A Competition-Based Research Design to Assess a Resistance Training
Intervention Affecting the Performance and Running Economy of Cross Country Runners
Project Supervisor: Associate Professor Andrew Kilding Researcher: Kyle Barnes, M.S.
x I have read and understood the information provided about this research project (Information Sheet dated 25th May, 2011). Yes О No О
x I have had an opportunity to ask questions and to have them answered. Yes О No О
x I am not suffering from any injury or illness which may impair my physical performance Yes О No О
x I understand that I may withdraw myself or any information that I have provided for this project at any time prior to completion of data collection, without being disadvantaged in any way. Yes О No О
x If I withdraw, I understand that all relevant information will be destroyed. Yes О No О
x I consent to my data being shared with my coach. Yes О No О
x I understand that the information collected will be used for academic/feedback purposes only and will not be published in any form outside of this project without my written permission. Yes О No О
x I wish to have all samples of blood belonging to me, returned to me at the end of each test: Yes О No О
x I agree to take part in this research. Yes О No О
x I wish to receive a copy of the report from the research: Yes О No О
Participant signature: .....................................................………………………...
Participant name: ……………………………………………………………
Date: …………………………………………………………….
Participant’s Contact Details:
Phone :……………………………Email: ………………………………………….
Address: .…………………………………………………………………………….
Project Supervisor Contact Details: Associate Professor Andrew Kilding Sport Performance Research Institute New Zealand School of Sport and Recreation Auckland University of Technology Private Bag 92006 Auckland 1020 Ph 921 9999 ext. 7056 [email protected] Approved by the Auckland University of Technology Ethics Committee Date 3 August, 2010
216
Appendix 5: Transfer of Copyright Letters
The Journal of Strength and Conditioning Research ASSIGNMENT OF COPYRIGHT
The Journal of Strength and Conditioning Research is pleased to consider publication of your manuscript. In consideration of the publication of the Manuscript, the Author(s) SIGNING BELOW convey(s) all copyright ownership to The Journal of Strength and Conditioning Research or its successors including all rights now or hereafter protected by the Copyright Laws of the United States and all foreign countries, all electronic publication rights, well as any renewal, extension or reversion of copyright, now or hereinafter provided, in any country. However, the following rights are reserved for the author(s). 1. All proprietary rights other than copyright, such as patent rights. 2. The right to use all or part of this article in future works of their own. Author warrants that the Manuscript is an original work not published elsewhere in whole or in part except in abstract form, that he has full power to make this grant, and that the Manuscript contains no matter libelous or otherwise unlawful or which invades the right of privacy or which infringes any proprietary right. Where any portion of the Manuscript has been previously published, Author warrants that permission has been obtained for publication in the journal, and author will submit copy of the permission and copy for credit lines with his Manuscript. Preprints: Upon acceptance of the article for publication, each author warrants that he/she will promptly remove any prior versions of this work (normally a preprint) that may have been posted to an electronic server. The Author(s) agree(s) not to submit the Manuscript or subsequent revisions for consideration to any other publication unless the Manuscript is rejected by The Journal of Strength and Conditioning Research. Where only one Co-Author signs below, such Author warrants that he is the duly authorized agent of all other Co-Authors. SECTION A AUTHOR indicates acceptance of the above terms of publication by signing and dating this agreement: _____________________________________________________________________________________ Author's Signature (Print Name CLEARLY) Date _____________________________________________________________________________________ Author's Signature (Print Name CLEARLY) Date _____________________________________________________________________________________ Author's Signature (Print Name CLEARLY) Date _____________________________________________________________________________________ Author's Signature (Print Name CLEARLY) Date SECTION B Exemption for Authors Employed by the United States Government: I attest that the above Manuscript was written as part of the Official duties of the authors as employees of the U.S. Government and that a transfer of copyright cannot be made.
217
_____________________________________________________________________________________ Author's Signature (Print Name CLEARLY) Date _____________________________________________________________________________________ Author's Signature (Print Name CLEARLY) Date _____________________________________________________________________________________ Author's Signature (Print Name CLEARLY) Date _____________________________________________________________________________________ Author's Signature (Print Name CLEARLY) Date SECTION C Where the Article is a "work made for hire," a duly authorized representative of the Author's employer must SIGN BELOW, indicating acceptance of the above. ________________________________________________________________________ AUTHORIZED AGENT SIGNATURE EMPLOYER ___________ DATE SECTION D
AUTHOR(S) POSTING OF ARTICLES TO AN INSTITUTIONAL REPOSITORY The Journal of Strength and Conditioning Research will permit the author(s) to deposit for display a “post-print” (the final manuscript after peer-review and acceptance for publication but prior to the publisher’s copyediting, design, formatting, and other services) 12 months after publication of the final article on his/her personal web site, university’s institutional repository or employer’s intranet, subject to the following:
x You may only deposit the post-print. x You may not update the post-print text or replace it with a proof or with the final
published version. x You may not include the post-print or any other version of the article in any
commercial site or in any repository owned or operated by any third party. For authors of articles based on research funded by NIH, Wellcome Trust, HHMI, or other funding agency, see below for the services that LWW will provide on your behalf to comply with "Public Access Policy" guidelines.
x You may not display the post-print until twelve months after publication of the final article.
x You must attach the following notice to the post-print: “This is a non-final version of an article published in final form in (provide complete journal citation)”.
x You shall provide a link in the post-print to the [name journal]’s website.
“PUBLIC ACCESS POLICY” FUNDING DISCLOSURE Please disclose below if you have received funding for research on which your article is based from any of the following organizations:
� National Institutes of Health (NIH)
218
� Wellcome Trust
� Howard Hughes Medical Institute (HHMI)
� Other: Please List ___________________________________________________________
COMPLIANCE WITH NIH AND OTHER RESEARCH FUNDING AGENCY
ACCESSIBILITY REQUIREMENTS A number of research funding agencies now require or request authors to submit the post-print (the article after peer review and acceptance but not the final published article) to a repository that is accessible online by all without charge. Within medical research, three funding agencies in particular have announced such policies:
x The U.S. National Institutes of Health (NIH) requires authors to deposit post-prints based on NIH-funded research in its repository PubMed Central (PMC) within twelve months after publication of the final article in the journal.
x The Howard Hughes Medical Institute (HHMI) requires as a condition of research grants, deposit in PMC, but in its case within six months after publication of the final article.
x The Wellcome Trust requires, as a condition of research grants, deposit in UK PubMed Central within six months after publication of the final article.
As a service to our authors, LWW will identify to National Library of Medicine (NLM) articles that require deposit. This Copyright Transfer Agreement provides the mechanism for identifying such articles. LWW will transmit the post-print of an article based on research funded in whole or in part by one or more of these three agencies to Pub Med Central. Upon NIH request, it remains the legal responsibility of the author(s) to confirm with NIH the provenance of their manuscript for purposes of deposit. Author(s) will not deposit their articles themselves. Author(s) will not alter the post-print already transmitted to NIH. Author(s) will not authorize the display of the post-print prior to:
(a) 12 months following publication of the final article, in the case of NIH, (b) 6 months following publication of the final article, in the case of Wellcome Trust and
HHMI _____________________________________________________________________________________ Author's Signature (Print Name CLEARLY) Date _____________________________________________________________________________________ Author's Signature (Print Name CLEARLY) Date _____________________________________________________________________________________ Author's Signature (Print Name CLEARLY) Date _____________________________________________________________________________________ Author's Signature (Print Name CLEARLY) Date
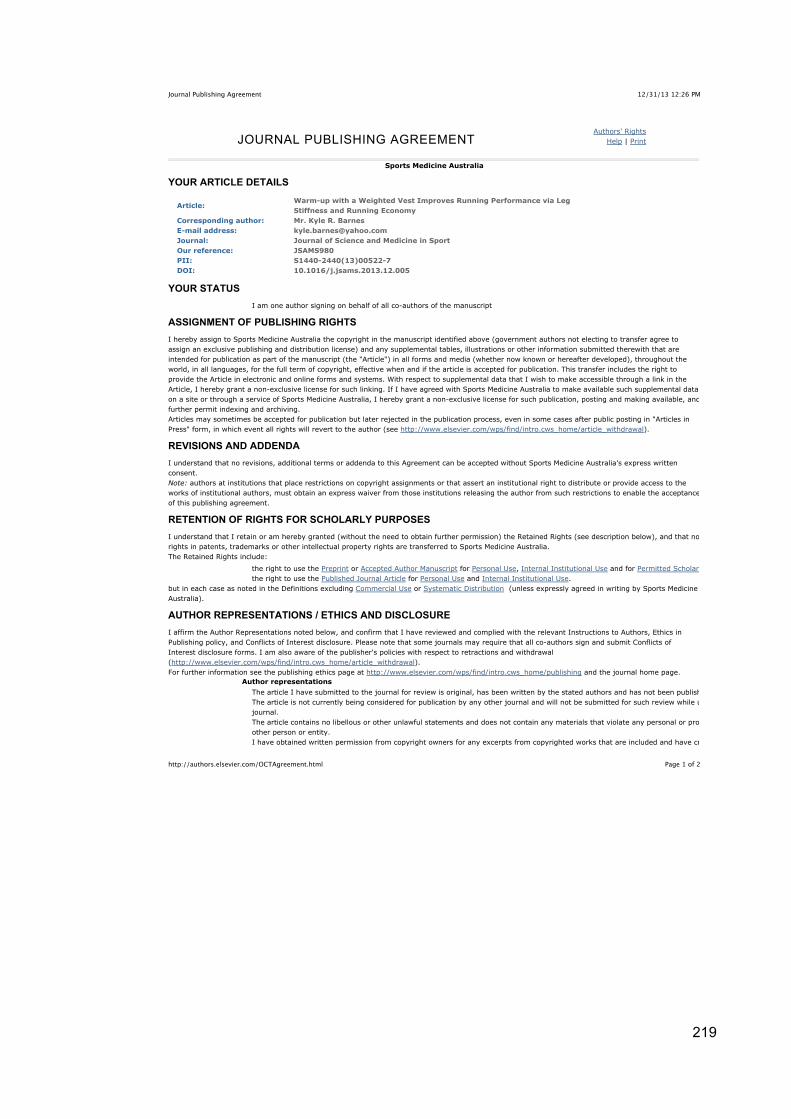
219
12/31/13 12:26 PMJournal Publishing Agreement
Page 1 of 2http://authors.elsevier.com/OCTAgreement.html
JOURNAL PUBLISHING AGREEMENTAuthors' Rights
Help | Print
Sports Medicine Australia
YOUR ARTICLE DETAILS
Article:Warm-up with a Weighted Vest Improves Running Performance via LegStiffness and Running Economy
Corresponding author: Mr. Kyle R. BarnesE-mail address: [email protected]: Journal of Science and Medicine in SportOur reference: JSAMS980PII: S1440-2440(13)00522-7DOI: 10.1016/j.jsams.2013.12.005
YOUR STATUSI am one author signing on behalf of all co-authors of the manuscript
ASSIGNMENT OF PUBLISHING RIGHTSI hereby assign to Sports Medicine Australia the copyright in the manuscript identified above (government authors not electing to transfer agree toassign an exclusive publishing and distribution license) and any supplemental tables, illustrations or other information submitted therewith that areintended for publication as part of the manuscript (the "Article") in all forms and media (whether now known or hereafter developed), throughout theworld, in all languages, for the full term of copyright, effective when and if the article is accepted for publication. This transfer includes the right toprovide the Article in electronic and online forms and systems. With respect to supplemental data that I wish to make accessible through a link in theArticle, I hereby grant a non-exclusive license for such linking. If I have agreed with Sports Medicine Australia to make available such supplemental dataon a site or through a service of Sports Medicine Australia, I hereby grant a non-exclusive license for such publication, posting and making available, andfurther permit indexing and archiving.Articles may sometimes be accepted for publication but later rejected in the publication process, even in some cases after public posting in "Articles inPress" form, in which event all rights will revert to the author (see http://www.elsevier.com/wps/find/intro.cws_home/article_withdrawal).
REVISIONS AND ADDENDAI understand that no revisions, additional terms or addenda to this Agreement can be accepted without Sports Medicine Australia's express writtenconsent.Note: authors at institutions that place restrictions on copyright assignments or that assert an institutional right to distribute or provide access to theworks of institutional authors, must obtain an express waiver from those institutions releasing the author from such restrictions to enable the acceptanceof this publishing agreement.
RETENTION OF RIGHTS FOR SCHOLARLY PURPOSESI understand that I retain or am hereby granted (without the need to obtain further permission) the Retained Rights (see description below), and that norights in patents, trademarks or other intellectual property rights are transferred to Sports Medicine Australia.The Retained Rights include:
the right to use the Preprint or Accepted Author Manuscript for Personal Use, Internal Institutional Use and for Permitted Scholarly Postingthe right to use the Published Journal Article for Personal Use and Internal Institutional Use.
but in each case as noted in the Definitions excluding Commercial Use or Systematic Distribution (unless expressly agreed in writing by Sports MedicineAustralia).
AUTHOR REPRESENTATIONS / ETHICS AND DISCLOSUREI affirm the Author Representations noted below, and confirm that I have reviewed and complied with the relevant Instructions to Authors, Ethics inPublishing policy, and Conflicts of Interest disclosure. Please note that some journals may require that all co-authors sign and submit Conflicts ofInterest disclosure forms. I am also aware of the publisher's policies with respect to retractions and withdrawal(http://www.elsevier.com/wps/find/intro.cws_home/article_withdrawal).For further information see the publishing ethics page at http://www.elsevier.com/wps/find/intro.cws_home/publishing and the journal home page.
Author representationsThe article I have submitted to the journal for review is original, has been written by the stated authors and has not been published elsewhere.The article is not currently being considered for publication by any other journal and will not be submitted for such review while under review by thisjournal.The article contains no libellous or other unlawful statements and does not contain any materials that violate any personal or proprietary rights of anyother person or entity.I have obtained written permission from copyright owners for any excerpts from copyrighted works that are included and have credited the sources in
220
12/31/13 12:26 PMJournal Publishing Agreement
Page 2 of 2http://authors.elsevier.com/OCTAgreement.html
my article.If I am using any personal details or images of patients or research subjects, I have obtained written permission or consent from the patient (or, whereapplicable, the next of kin). See http://www.elsevier.com/wps/find/authorsview.authors/rights?tab=1 for further information.If the article was prepared jointly with other authors, I have informed the co-author(s) of the terms of this publishing agreement and that I am signingon their behalf as their agent, and I am authorized to do so.
FUNDING AGENCY AND SPONSORSHIP OPTIONSThe publisher posts information on funding agencies and arrangements that the publisher has made with such bodies athttp://www.elsevier.com/wps/find/authorsview.authors/fundingbodyagreements. I understand that documents can be downloaded from this site to helpme comply with certain agency requirements. Information can also be found at http://www.elsevier.com/wps/find/authors.authors/sponsoredarticlesconcerning sponsorship options and rights issues concerning publication-fee model journals (information can also be found on the journal home page).
For information on the publisher's copyright and access policies, please see http://www.elsevier.com/journal-authors/author-rights-and-responsibilities.
For more information about the definitions relating to this agreement click here.
I have read and agree to the terms of the Journal Publishing Agreement.
31st December 2013T-copyright-v17/2009
221
Dear Mr. Barnes, The transfer of copyright form authors sign when they submit their work for publication in International Journal of Sports Physiology and Performance includes the following: “The authors explicitly reserve the following rights:
· The right to use all or part of this article in future works of their own, such as lectures, reviews, textbooks, or reprint books.
· The right to post an electronic version of the finalized article on the authors’ own web site or web site(s) or other electronic repositories controlled by the authors’ institution, provided that the electronic version is in PDF or other image capturing format.”
You are free to include the finalized article as submitted for publication in International Journal of Sports Physiology and Performance, titled “Effects of Different Uphill Interval-Training Programs on Running Economy and Performance,” by Kyle R. Barnes, Will G. Hopkins, Michael R. McGuigan, and Andrew E. Kilding, in your doctoral thesis at Auckland University of Technology. A print copy of your thesis when completed may be deposited in the Auckland University of Technology Library, and a digital copy, in PDF or other image capturing format, may also be made available online via the University’s digital repository, ScholarlyCommons@AUT, http://autresearchgateway.ac.nz/. Please use the following citation adjacent to the material. Prepublication version, International Journal of Sports Physiology and Performance, 2013, 8(6): 639-647. © Human Kinetics, Inc. If there is anything else I can help you with, please don’t hesitate to ask. Best regards, Martha Martha Gullo Senior Permissions Manager Human Kinetics, Inc. www.humankinetics.com P: 217-351-5076 ext. 2223 F: 217-351-2674 E: [email protected]
222
Page 1 of 4Kyle R Barnes
Medicine & Science in Sports & Exercise
Authorship Responsibility, Disclosure, and Copyright Transfer
Manuscript Title Effects of Resistance Training on Running Economy and Cross-Country Performance
including all accompanying digital supplementary content, if any (the "Work")
Author Kyle R Barnes
Are you the corresponding Author?
Yes
No
Mailing Address SPRINZ. Level 2 AUT-Millennium Campus, 17 Antares, Mairangi Bay 0630, Auckland, New Zealand
Telephone +64 9 921 9559
Fax Number +64 9 479 1486
Email Address [email protected] Each author must read and provide the information requested in the form, and sign the following statements; this document must be distributed and completed by each co-author for their original electronic or ink signature. For instructions to electronically sign this document, please see instructions at the bottom of the form below the Signature field. DISCLOSURES/CONFLICT OF INTEREST: All questions in this section MUST be answered by each author. To verify this, the author must click the “Check for Required” fields button at the bottom of the form before signing it. Completed forms must be submitted online through Editorial Manager along with the article in order for your submission to be sent for peer review. Any relevant current or past conflicts of interest or sources of funding listed on this form must also be included on the Title page of the manuscript (as indicated in the Instructions for Authors). Submissions which do not comply with these instructions will be returned to the author for correction prior to review. If you have questions about the submission process, please contact: Managing Editor Ken Wilson; E-mail: [email protected].
RETAINED RIGHTS: Except for copyright, other proprietary rights related to the Work (e.g., patent or other rights to any process or procedure) shall be retained by the author. To reproduce any text, figures, tables, or illustrations from this Work in future works of their own, the author must obtain written permission from Lippincott Williams & Wilkins (LWW); such permission cannot be unreasonably withheld by LWW.
ORIGINALITY: Each author warrants that his or her submission to the Work is original, does not infringe any copyright, and that he or she has full power to enter into this agreement. Neither this Work nor a similar work has been published nor shall be submitted for publication elsewhere while under consideration by this Publication.
AUTHORSHIP RESPONSIBILITY: Each author warrants that he or she has participated sufficiently in the intellectual content, the analysis of data, if applicable, and the writing of the Work to take public responsibility for it. Each has reviewed the final version of the Work, believes it represents valid work, and approves it for publication. Moreover, should the editors of the Publication request the data upon which the work is based, they shall produce it.
PREPRINTS: Upon acceptance of the article for publication, each author warrants that he/she will promptly remove any prior versions of this Work (normally a preprint) that may have been posted to an electronic server.
DISCLAIMER: Each author warrants that this Work contains no libelous or unlawful statements and does not infringe any other personal or proprietary right of others, nor contains any fraudulent, plagiarized or incorrectly attributed material. If excerpts (e.g., text, figures, tables, illustrations, or audio/video files) from copyrighted works are included, a written release will be secured by the author prior to submission, and credit to the original publication will be properly acknowledged. Each author further warrants that he or she has obtained, prior to submission, written releases from patients whose names or likenesses are submitted as part of the Work. Should the Editor or LWW request copies of such written releases, the author shall provide them in a timely manner.
DISCLOSURES/CONFLICT OF INTEREST Each author must identify any financial interests or affiliations with institutions, organizations, or companies relevant to the manuscript by completing the form below. Additionally, any financial associations involving spouse or partner or children must be disclosed as well.
Note: Items 1, 2, and 3 listed below come from the ICMJE Uniform Disclosure Form for Potential Conflicts of Interest at http://www.icmje.org/update.html (dated July 2010), except for the columns in numbers 1 and 2 that ask whether the relationship is current, ongoing, or past.
Conditions of Submission
Corresponding Author's Name
Kyle R Barnes
223
Page 2 of 4Kyle R Barnes
1. The work under consideration for publicationDid you or your institution at any time receive payment or support in kind for any aspect of the submitted work (including but not limited to grants, data monitoring board, study design, manuscript preparation, statistical analysis, etc...)?
Complete each row by checking "No" or providing the requested information.
Type No Money Paid
to you
Money to Your
Institution*
Name of Entity
Is the relationship current (C), ongoing
(O), or past (P)?
Comments**
1. Grant C O P xADD
2. Consulting fee or honorarium C O P x ADD
3. Support for travel to meetings for the study or other purposes
C O P xADD
4. Fees for participation in review activities such as data monitoring boards, statistical analysis, end point committees, and the like
C O P x
ADD
5. Payment for writing or reviewing the manuscript
C O P xADD
6. Provision of writing assistance, medicines, equipment, or administrative support
C O P x
ADD
7. Other C O P xADD
* This means money that your institution received for your efforts on this study. ** Use this section to provide any needed explanation.
2. Relevant financial activities outside the submitted work
Place a check in the appropriate boxes in the table to indicate whether you have financial relationships (regardless of amount of compensation) with entities. Use one line for each entity; add as many lines as you need by clicking the "Add +" box. You should report relationships that were present during the 36 months prior to submission.
Type No Money Paid
to you
Money to Your
Institution*
Name of Entity
Is the relationship current (C), ongoing
(O), or past (P)?
Comments**
1. Board membership C O P xADD
2. Consultancy C O P x ADD
3. Employment C O P xADD
4. Expert testimony C O P xADD
5. Grants/grants pending C O P xADD
6. Payment for lectures including service on speakers bureaus
C O P xADD
* This means money that your institution received for your efforts. ** For example, if you report a consultancy above there is no need to report travel related to that consultancy on this line.
224
Page 3 of 4Kyle R Barnes
Type No Money Paid
to you
Money to Your
Institution*
Name of Entity
Is the relationship current (C), ongoing
(O), or past (P)?
Comments**
7. Payment for manuscript preparation
C O P xADD
8. Patents (planned, pending or issued)
C O P xADD
9. Royalties C O P xADD
10. Payment for development of educational presentations
C O P xADD
11. Stock/stock options C O P xADD
12. Travel/accommodations/meeting expenses unrelated to activities listed**
C O P x
ADD
13. Other (err on the side of full disclosure)
C O P xADD
* This means money that your institution received for your efforts. ** For example, if you report a consultancy above there is no need to report travel related to that consultancy on this line.
3. Other Relationships
Are there other relationships or activities that readers could perceive to have influenced, or that give the appearance of potentially influencing, what you wrote in the submitted work?
No other relationships/conditions/circumstances that present potential conflict of interest
Yes, the following relationships/conditions/circumstances are present (explain below):
Explanation
At the time of manuscript acceptance, journals will ask the author to confirm and, if necessary, update their disclosure statements. On occasion, journals may ask the author to disclose further information about reported relationships.
Transfer of CopyrightAUTHOR's OWN WORK: In consideration of LWW and American College of Sports Medicine's publication of the Work, the author hereby transfers, assigns, and otherwise conveys all his/her copyright ownership worldwide, in all languages, and in all forms of media now or hereafter known, including electronic media such as CD-ROM, Internet, and Intranet, to American College of Sports Medicine. If American College of Sports Medicine should decide for any reason not to publish the Work, American College of Sports Medicine shall give prompt notice of its decision to the corresponding author, this agreement shall terminate, and neither the author, LWW, nor American College of Sports Medicine shall be under any further liability or obligation. Each author grants LWW and American College of Sports Medicine the rights to use his or her name and biographical data (including professional affiliation) in the Work and in its or the journal's promotion.
WORK MADE FOR HIRE: If this Work or any element thereof has been commissioned by another person or organization, or if it has been written as part of the duties of an employee, an authorized representative of the commissioning organization or employer must also sign this form stating his or her title in the organization.
GOVERNMENT EMPLOYEES: If the Work or a portion of it has been created in the course of any author's employment by the United States Government, check the "Government" box at the end of this form. A work prepared by a government employee as part of his or her official duties is called a "work of the U.S. Government" and is not subject to copyright. If it is not prepared as part of the employee's official duties, it may be subject to copyright.
INSTITUTIONAL REVIEW BOARD/ANIMAL CARE COMMITTEE APPROVAL: Each author warrants that his or her institution has approved the protocol for any investigation involving humans or animals and that all experimentation was conducted in conformity with ethical and humane principles of research.
WARRANTIES: Each author warranty made in this form is for the benefit of LWW, American College of Sports Medicine, and the Editor; each author agrees to defend, indemnify, and hold harmless those parties for any breach of such warranties.

225
Page 4 of 4Kyle R Barnes
Author(s) Posting of Articles to an Institutional RepositoryMedicine & Science in Sports & Exercise will permit the author(s) to deposit for display a "final peer-reviewed manuscript" (the final manuscript after peer-review and acceptance for publication but prior to the publisher's copyediting, design, formatting, and other services) 12 months after publication of the final article on his/her personal web site, university's institutional repository or employer's intranet, subject to the following:
* You may only deposit the final peer-reviewed manuscript.
* You may not update the final peer-reviewed manuscript text or replace it with a proof or with the final published version.
* You may not include the final peer-reviewed manuscript or any other version of the article in any commercial site or in any repository owned or operated by
any third party. For authors of articles based on research funded by NIH, Wellcome Trust, HHMI, or other funding agency, see below for the services that LWW will provide on your behalf to comply with "Public Access Policy" guidelines.
* You may not display the final peer-reviewed manuscript until twelve months after publication of the final article.
* You must attach the following notice to the final peer-reviewed manuscript: "This is a non-final version of an article published in final form in (provide complete journal citation)".
* You shall provide a link in the final peer-reviewed manuscript to the Medicine & Science in Sports & Exercise website.
"Public Access Policy" Funding Disclosure
Please disclose below if you have received funding for research on which your article is based from any of the following organizations:
National Institutes of Health (NIH) Wellcome Trust Howard Hughes Medical Institute (HHMI)
Other Please List:
Compliance with NIH and Other Research Funding Agency Accessibility RequirementsA number of research funding agencies now require or request the author to submit the final peer-reviewed manuscript (the article after peer review and acceptance but not the final published article) to a repository that is accessible online by all without charge. Within medical research, three funding agencies in particular have announced such policies:
* The U.S. National Institutes of Health (NIH) requires the author to deposit the final peer-reviewed manuscript based on NIH-funded research in its repository PubMed Central (PMC) within twelve months after publication of the final article in the journal.
* The Howard Hughes Medical Institute (HHMI) requires as a condition of research grants, deposit in PMC, but in its case within six months after publication of the final article.
* The Wellcome Trust requires, as a condition of research grants, deposit in UK PubMed Central within six months after publication of the final article.
As a service to our authors, LWW will identify to National Library of Medicine (NLM) articles that require deposit. This Copyright Transfer Agreement provides the mechanism for identifying such articles.
LWW will transmit the final peer-reviewed manuscript of an article based on research funded in whole or in part by one or more of these three agencies to Pub Med Central.
Upon NIH request, it remains the legal responsibility of the author to confirm with NIH the provenance of his/her manuscript for purposes of deposit. Author will not deposit articles him/herself. Author will not alter the final peer-reviewed manuscript already transmitted to NIH.
Author will not authorize the display of the final peer-reviewed manuscript prior to: (a) 12 months following publication of the final article, in the case of NIH, (b) 6 months following publication of the final article, in the case of Wellcome
Trust and HHMI
Hide All Table Rows Checked No Check For Required Fields
Author's Own Work Work for Hire Government
Date 02-26-2013
SignatureImportant Note: Once you electronically sign this form, you will not be able to make any additional changes to it. To electronically sign this form: 1) First click Check For Required Fields button above. 2) Provide any missing information highlighted in red. 3) Click the Hide All Table Rows Checked No button above. 4) Click the signature field above and provide the information requested in the dialog boxes. For additional help with electronically signing this form, go to http://links.lww.com/ZUAT/A106