Designing and Running Reports
96
Designing and Running Reports Applicable to 7.180 onwards
-
Upload
khangminh22 -
Category
Documents
-
view
0 -
download
0
Transcript of Designing and Running Reports

Designing and Running Reports
Applicable to 7.180 onwards

Capita SIMS, Franklin Court, Priory Business Park, Cardington, Bedfordshire MK44 3JZ Tel: 01234 838080 Fax: 01234 832036 Email: [email protected] Web: www.capita-sims.co.uk
Revision History
Version Change Description Date
7.180 - 1.0 Initial release. 06/02/2018
© Capita Business Services Ltd 2018. All rights reserved. No part of this publication may be reproduced, photocopied, stored on a retrieval
system, translated or transmitted without the express written consent of the publisher. Microsoft® and Windows® are either registered trademarks or trademarks of Microsoft
Corporation in the United States and/or other countries.
Capita Doc Ref: SS_REP7180/HBK/060218/CE
Providing Feedback on Documentation
We always welcome comments and feedback on the quality of our documentation including online help files and handbooks. If you have any comments, feedback or
suggestions regarding the module help file, this handbook (PDF file) or any other aspect of our documentation, please email:
Please ensure that you include the module name, version and aspect of documentation on which you are commenting.

C|Contents 01| Introduction .................................................................. 1
Overview ........................................................................................ 1 What’s New in this Release? ........................................................... 1 Permissions and Licensing Requirements ....................................... 2
Process Permissions ............................................................... 2 Information Domain Permissions ............................................ 3
02| Previewing and Running Existing Reports ..................... 5 Introduction ................................................................................... 5 Previewing Reports ......................................................................... 6 Selecting a Report .......................................................................... 6
Adding a Report as a Favourite ............................................... 7 Entering Parameter Values ..................................................... 7 Changing the Preview Sort Order ............................................ 9 Adding and Removing Records in Preview Mode ..................... 9 Changing the Preview Mode View ......................................... 10 Toggling Records in Preview Mode ........................................ 11
Running Reports ........................................................................... 11 Opening the Required Report (Run Mode) .................................... 11
Selecting the Report Output Type ......................................... 12 Running an Excel Report ............................................................... 12 Running a Word List Report .......................................................... 13
Creating a New Word List Report Template (Run Mode) ....... 14 Running a Word Form Report (RTF) .............................................. 14 Running a Text Report .................................................................. 15 Running a Web Page Report ......................................................... 16
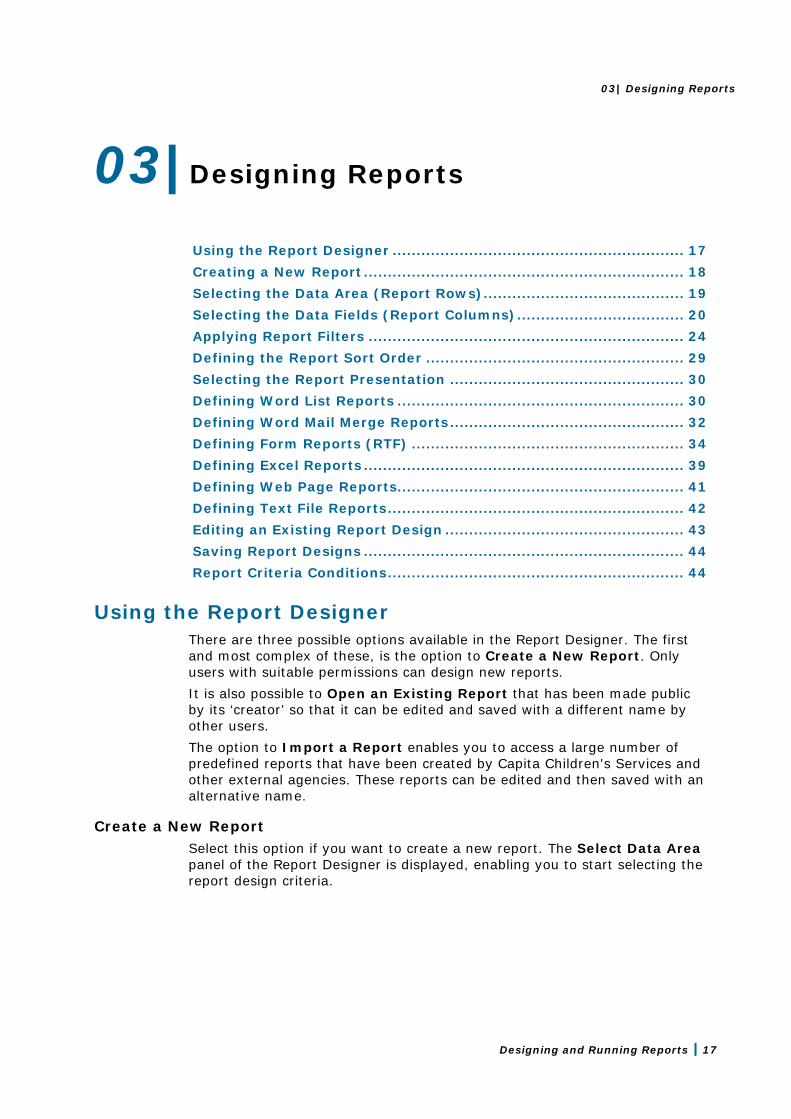
03| Designing Reports ....................................................... 17 Using the Report Designer ............................................................ 17 Creating a New Report .................................................................. 18
The Report Summary ............................................................ 18 Selecting the Data Area (Report Rows) ........................................ 19
Refining the Data Area .......................................................... 19 Selecting the Data Fields (Report Columns).................................. 20
Inserting Related Fields (Sub Reports) ................................. 22 Applying Report Filters ................................................................. 24
Defining New Filter Conditions .............................................. 25 Modifying an Existing Filter Condition ................................... 26 Loading an Existing Filter Condition from an Existing Report 27

Adding an AND Clause ........................................................... 27 Adding an OR Clause ............................................................. 28 Adding Combinations of AND/OR Clauses ............................. 28 Deleting Clauses ................................................................... 28
Defining the Report Sort Order ..................................................... 29 Selecting the Report Presentation ................................................ 30 Defining Word List Reports ........................................................... 30
Editing an Existing Word List Template ................................. 32 Defining Word Mail Merge Reports ................................................ 32
Editing the Report Mail Merge Document .............................. 34 Defining Form Reports (RTF) ........................................................ 34
Editing an Existing Form Report (RTF) .................................. 36 Specifying Page Breaks ......................................................... 36 Specifying Sub Tables and Report Inserts ............................. 37
Defining Excel Reports .................................................................. 39 Setting up a Group of List Reports for Excel .......................... 41
Defining Web Page Reports .......................................................... 41 Defining Text File Reports ............................................................. 42 Editing an Existing Report Design ................................................. 43 Saving Report Designs .................................................................. 44 Report Criteria Conditions ............................................................. 44
04| Defining and Running Analysis Reports ....................... 47 Introduction ................................................................................. 47 Opening Existing Reports .............................................................. 47 Defining Analysis Reports ............................................................. 47 Running an Analysis Report .......................................................... 49
Changing the Calculation Method .......................................... 53 Copying an Analysis Report to Excel ..................................... 53
05| Running Reports with an Effective Date ...................... 55 Introduction ................................................................................. 55 Running Reports with an Effective Date ........................................ 55
Specifying the Effective Date ................................................ 56 Entering Parameter Values ................................................... 56
Designing Reports with an Effective Date ..................................... 57
06| Predefined Reports ...................................................... 61 Introduction ................................................................................. 61
Label Generation ................................................................... 61 Importing Predefined Reports ...................................................... 62 Viewing a Predefined Report ........................................................ 64
07| Report Storage Management ....................................... 67

Introduction ................................................................................. 67 Managing Report Categories ......................................................... 68
Adding a Category ................................................................. 69 Editing an Existing Category ................................................. 70 Deleting a Category .............................................................. 70 Activating/Deactivating Report Categories ........................... 71
Saving Report Designs .................................................................. 71 Making Reports Public .................................................................. 72
Deleting Saved Reports and Report Criteria .......................... 72 Exporting Reports ......................................................................... 73 Changing Ownership of a Report .................................................. 73
08| Running Scheduled Reports ......................................... 75 Introduction ................................................................................. 75 Setting up the Report Scheduler ................................................... 75
Permissions Required ........................................................... 75 Creating a Scheduled Task - Windows 7 ................................ 76
Selecting Reports for Scheduling .................................................. 81 Viewing Errors in the Schedule ..................................................... 85
Index ............................................................................... 87


01| Introduction
Designing and Running Reports 1
01|Introduction
Overview .......................................................................................... 1 What’s New in this Release? ............................................................ 1 Permissions and Licensing Requirements ........................................ 2
Overview This handbook provides information on steps necessary for previewing, designing, running and storing reports. SIMS contains a powerful Reporting tool designed using Microsoft® .NET technology. This provides the ability to generate reports via various outputs, for example, HTML, Excel and Internet browsers. The Reporting tool in SIMS features a ‘wizard’ to assist with the design and generation of reports. The ability to create reports using Rich Text Format has also been incorporated to enable reports to be designed and run using different word processing packages other than Microsoft® Word. There are also a number of predefined reports that have been incorporated for users’ convenience. These include a student Data Collection Sheet, Record Sheet and Assessment reports, as well as a large number of predefined reports for Special Educational Needs, School Organisation, Staff and Contacts. Reports that have been created can be saved onto the Document Management Server for your own individual use or made available to other users with sufficient permissions.
What’s New in this Release? Enhancements to the Reporting Dictionary
Reports | Design Report The Enrolment Status Changes sub-report has been added to the reporting dictionary (under Student | History). The Qualification Type field has been added to the Exams sub-report (under Student) (applicable to Secondary schools only). The Address Note field has been added to the reporting dictionary (under Student | Family home). Name fields (under Student | Basic Details) have been split into Chosen Names and Legal Names groups.
The following Chosen Names can now be added to a report: Surname Initial Forename & Surname Initial.

01| Introduction
2 Designing and Running Reports
The following Legal Names can now be added to a report: Initials Legal Surname Initial Initial & Legal Surname Legal Forename & Legal Surname Legal Forename & Legal Surname Initial Legal Surname & Initial.
The Communicator field has been added to the reporting dictionary (under Communication). The School Objective field in the Objectives sub-report has been renamed School Objective Detail. The School Objective Summary field has been added to the Objectives sub-report. These amendments enable the reporting on objectives for members of staff (under Staff | Objective Details).
Permissions and Licensing Requirements You need to be a member of one or more of the following System Manager User Groups to ensure you have the permissions required to use the functionality outlined in this handbook.
Process Permissions There are five types of Process permissions that can be granted for Reporting. These permissions enable access to the various functions available in Reporting in SIMS.
Run Report Permission Users with this permission can only run reports that have been made public.
Design Report Permission Users with this permission can open any public or personally created report design or create new reports as required, as well as running any public report.
Administer Reports Permission Users with this permission can add or delete Report Categories. They can also open any report design made accessible to them and create new reports as required. They can also run any public reports.
Import Reports Permission Users with this permission can import any reports made available to them.
Export Reports Permission Users with this permission can export any required reports for use by users with suitable permissions.

01| Introduction
Designing and Running Reports 3
Information Domain Permissions Information Domain permissions enable you to restrict the data that can be viewed by users when they are running reports. It is, therefore, possible to enable users to run reports but to hide certain types of data, such as medical history. Careful consideration must be given to the permissions that you provide to users of the system.
NOTE: Users assigned to the SIMS Manager or SIMS User Groups have access to all data. You may, therefore, wish to remove some Information Domain permissions or create suitable new Groups to which users can be added.
If you have not been given permission to view certain areas of data, such as medical history, the impact is as follows: When running reports:
You are not able to view columns of data for which you do not have permission. These are returned as blank in the resulting report.
You are not able to run a report where a report criteria is used, for which you do not have permission, e.g. where religion = Greek Orthodox.
You are not able to run a report where a sort order is included for which you do not have permission to view, e.g. sort by Home Language.
When designing reports: You are not able to include fields in the design of a report for which you do not have permission. Such fields are not made available for selection. If your permissions have changed since a previously defined report, the fields which you no longer have permission to view are removed and a warning message is displayed advising you of this. Please contact your System Manager if you are unsure whether you have the applicable permissions. For more information on setting up permissions, please refer to the Managing SIMS Users, Groups and Databases handbook. For a list of the permissions available for each release, please refer to the appropriate Permissions spreadsheet. Copies can be obtained from the My Account (https://myaccount.capita-cs.co.uk) website. To find the spreadsheet, search for <sims version> sims permissions spreadsheet, e.g. 7.178 sims permissions spreadsheet.

01| Introduction
4 Designing and Running Reports

02| Previewing and Running Existing Reports
Designing and Running Reports 5
02|Previewing and Running Existing Reports
Introduction ..................................................................................... 5 Previewing Reports .......................................................................... 6 Selecting a Report ............................................................................ 6 Running Reports ............................................................................ 11 Opening the Required Report (Run Mode) ..................................... 11 Running an Excel Report ................................................................ 12 Running a Word List Report ........................................................... 13 Running a Word Form Report (RTF) ............................................... 14 Running a Text Report ................................................................... 15 Running a Web Page Report........................................................... 16
Introduction Existing reports can be previewed in SIMS and also processed in any of the following ways:
as a list displayed in Microsoft® Word, Excel or Internet Explorer as a series of forms, e.g. mail merged letters in a Word document as a text file (comma separated, tab separated or XML) as information which can be used for statistical analysis.
Reports that have already been designed by other users can be made Public so that they become available to the majority of users. Depending on how the original reports were designed, it may be possible in some instances to change the Report Output, i.e. how the report looks when it is printed and to modify the records that are displayed. To enable users to see how a report looks before finally printing it and to enable changes to be made to the records displayed, there is a Preview Mode available in the Reporting tool. Becoming familiar with the various ways a report can be modified in Preview Mode makes designing your own specific reports much less complicated. On the left-hand side of the window, there are four report Category folders, in which various different types of reports are stored. Click the + button next to the Focus folder to expand the list of folders available.

02| Previewing and Running Existing Reports
6 Designing and Running Reports
If other users have previously defined some reports or the Predefined reports have already been imported, there are some existing reports available for you to preview.
More Information: Importing Predefined Reports on page 62
Previewing Reports The Report Preview option gives users the opportunity to check that the data returned meets their requirements before producing the final report output. Once a report is in Preview mode, it is also possible to add or remove records from the preview. Any amendments are reflected in the final output, although not saved with the original report design. In addition, the sort order can be changed, which is also reflected in the final report output. It is possible to change the content and order of a report on an ad-hoc basis. This is particularly useful when producing a report of children attending a school trip. You can then add or remove pupil/students who may/may not be able to attend.
Selecting a Report 1. Select Reports | Run Reports and use the navigation tree to locate the
folder in which the required report is stored. Expand and contract the folder structure by clicking the + or - buttons until the required folder is visible.
All reports that are stored in the selected folder are displayed in the right-hand panel.

02| Previewing and Running Existing Reports
Designing and Running Reports 7
NOTE: The availability of reports depends on the permissions assigned to you and whether report designs have been made Public. Permissions can also be applied to specific data fields and therefore it is possible that some reports can be produced, but may include some blank columns.
The reports displayed can be sorted by clicking the appropriate column header, e.g. Name, Owner, Updated, etc.
2. Highlight the required report name and click the Preview button to view the report.
3. The system may prompt you to Enter Parameter Values in order to restrict the amount of data returned.
4. Click the OK button to produce the report. The length of time required to generate the report preview depends on the complexity of the report design and any additional report criteria that are selected.
Adding a Report as a Favourite A report can be added as a favourite so it is available from Reports | Run Report and selecting the Favourites folder. Adding a report as a favourite also makes the report available from the My Favourite Reports panel on the SIMS Home Page.
1. Select Reports | Run Report to display the Report browser. 2. Navigate to the folder containing the required report(s), e.g. Focus |
Student. Alternatively, a report under My Reports can be made a favourite by navigating to the My Reports folder.
3. Highlight the required report(s), right-click the selection then select Add to favourites from the pop-up menu. Multiple reports can be selected, if required.
4. Check that the report(s) have been added by clicking the Favourites folder in the Report browser.
5. Re-open SIMS to display the report(s) in the My Favourite Reports panel on the SIMS Home Page.
Entering Parameter Values When a report is designed, it is possible to apply various criteria to limit the records returned. For example, a report could be limited to all the pupil/students in a particular year. To provide greater flexibility, it is also possible to enter values for these criteria when an existing report is run. You could for example, be prompted to select the Years that you wish to be included in the report. This enables you to run the same report, selecting a different year each time.

02| Previewing and Running Existing Reports
8 Designing and Running Reports
If a report has been set up in this way, when prompted to enter Run Time Parameters, enter values, such as Surnames, choose existing values by selecting appropriate check boxes or specify a required date.
Users can refine the report using the Show All filter. This option is available when defining the run-time parameters and when designing a new report and specifying a new filter. The Show All filter is switched off by default, thus ensuring that only active groups are displayed for selection. Clicking in the Show All filter check box displays all groups, both active and inactive. For example, Year Groups and Registration Groups that are no longer in use and have been removed from the Pastoral Structure, can be selected and included in the report. Click the OK button to continue. The report appears in the Preview Report Results panel together with the name of the report that you have selected.

02| Previewing and Running Existing Reports
Designing and Running Reports 9
NOTE: You can increase the size of the Preview Report Results panel by dragging the horizontal line above the report name until the required size is achieved.
If you are happy with the data returned in the report, click the Run button to generate the report.
Changing the Preview Sort Order By default, the report is previewed in the order that was defined in the original report design. It is possible however, to order the data in any column in the display by clicking the column heading. This activates a toggle function that orders the data in the chosen column in ascending and descending order, i.e. clicking the Forename column arranges the display of students’ names in alphabetical order by their forename.
NOTE: Any changes made to the sort order when in Preview mode are reflected in the final report output.
Adding and Removing Records in Preview Mode There may be occasions when you wish to remove records from those returned in the report. For example, a report has been created that lists the pupil/students in Year 10, studying French, who are going on a trip to France. Several of the pupil/students are subsequently unable to attend and need to be removed from the original report. This can be achieved by Excluding the appropriate records.

02| Previewing and Running Existing Reports
10 Designing and Running Reports
Alternatively, you may wish to include records that were outside the original report criteria. Using the previous example, you could add pupil/student records to the report to replace the original pupil/students who are unable to attend the trip to France. This can be achieved by Including the additional records.
Adding Records in Preview Mode 1. Click the Extend button.
This begins a search of the database for all available records within the Focus of the report, e.g. students. A message is displayed, indicating that the report is being generated. All available records within the focus are extracted.
2. View the extended records by clicking the View button and selecting Excluded. The newly extracted records are denoted by an X (Extended) symbol in the first column.
3. Highlight the records to be included in the report preview by holding down the Ctrl key and clicking the row. To highlight sequentially listed records, click the first record and hold down the Shift key until you reach the last record required. Alternatively, double-click records to include them. A combination of methods may be used as necessary. To view the details of a particular record, right-click it and select Details from the pop-up menu.
4. Click the Include button to add the highlighted records. These records no longer appear in the Excluded view.
5. To check that the records have been successfully included, click the View button again and select Selected. All included records are identifiable by an & (Included) symbol in the first column.
Removing Records in Preview Mode 1. Click the View button and ensure that Selected is chosen from the drop-
down list. Highlight the records to be excluded from the report preview by holding down the Ctrl key and clicking the row. To highlight sequentially listed records, click the first record and hold down the Shift key until you reach the last record required. A combination of methods may be used as necessary.
2. Click the Exclude button to remove the highlighted records from the Preview display. Alternatively, right-click a particular record and select Exclude from the drop-down menu.
3. To check that the records have been successfully excluded, click the View button and select Excluded. All excluded records are identifiable by an R (Removed) symbol in the first column.
Changing the Preview Mode View By default, only records extracted using the original report definition are displayed in a report Preview. If you have added and/or removed records, you can view all available records at any stage by clicking the View button and selecting All.

02| Previewing and Running Existing Reports
Designing and Running Reports 11
The display includes all records, i.e. those from the original report selection, together with any that have been added or removed. The records to be included in the report are shown on a white background whilst those that have been either added or removed when the Preview list was extended, are highlighted in grey. The symbols shown in the first column indicate the following:
No symbol & R X
Original report selection record.
Record added to the original report selection.
Record removed from the original report selection.
Record not included in the original report selection and not required (excluded).
You can also restrict the view to Selected records and Excluded records only, by selecting the appropriate option from the View button drop-down list.
Toggling Records in Preview Mode When listing records in the All view, it is possible to change the status of a record using the Toggle button. Toggling changes the record status to the opposite of its current status and can be a useful method of quickly changing current selections. For example, if a record has been Excluded (denoted by an X), clicking the Toggle button selects that particular record and changes the symbol to an & (Included).
Running Reports Reports can be run from both the Run Reports window and the Design Reports window. The reports available depends on which reports have been made Public and what permissions have been assigned to you. You may wish to preview a report to add/remove records as required.
Opening the Required Report (Run Mode) 1. Select Reports | Run Report to display the Reports browser. 2. Use the navigation tree to locate the folder in which the required report is
stored. All reports in the selected folder are displayed in the right-hand panel. Expand and contract the folder structure by clicking the + or – buttons as required.
3. Highlight the required report name and double-click it to display the Enter Parameter values for report dialog. Specify the parameters and click the OK button.
4. If applicable, select the type of output required before running the report.
More Information: Entering Parameter Values on page 56

02| Previewing and Running Existing Reports
12 Designing and Running Reports
Selecting the Report Output Type It is frequently possible to specify how you would like the report to be presented before printing commences. Select an option from the list.
There may be occasions when the type of report output has been preselected by the person who designed the report. If this is the case, you are not able to change the report output type from the option originally specified.
Running an Excel Report Use this option to produce a list report in Microsoft® Excel enabling the data to be further manipulated, or where the number of columns exceeds that which could be neatly displayed in a Word document. This type of output is particularly suitable for printing reports.
1. Select Reports | Run Report to display the Reports browser. 2. Use the navigation tree to locate the folder in which the required report is
stored. All reports in the selected folder are displayed in the right-hand panel. Expand and contract the folder structure by clicking the + or – buttons as required. Highlight the required report name and click the OK button.
NOTE: If the Allow choice of output at runtime option was selected when the report was designed, you can select the output type before the report is run.
3. Select Excel from the drop-down list and then click the Run button. 4. The report is either displayed directly in Excel or you are prompted to enter
the run-time parameters, if these were not specified when the report was designed.
Run-time Parameter Definition
Standard Portrait/Standard Landscape
Select the required radio button to choose the required orientation.
Report Template Select this radio button if you wish to use a report template instead of a portrait or landscape output.

02| Previewing and Running Existing Reports
Designing and Running Reports 13
Run-time Parameter Definition
Allow these settings to be changed at run-time
Select this check box if users are able to change the report output when the report is printed.
Divider Frequency This defines the number of records/rows to be grouped and separated by a horizontal line. Increase or decrease the figure as required using the Up and Down arrows.
Number of Fixed Columns This specifies the number of columns repeated on printed continuous pages if there is insufficient room to fit all columns onto a single page. Increase or decrease the figure as required using the Up and Down arrows.
Go straight to Print Preview Select this check box if you want the report to open in Excel’s print preview mode.
Group into Separate sheets Select this check box if you want the data in the report to be listed in groups. Where a report has been appropriately designed, it is possible to separate an Excel report into groups of data, with each group displayed in a separate Worksheet.
Record count Select this check box to insert the total number of records in the top left of the report, preceded by the text entered in the adjacent field (Defaults to Records).
Click the OK button to produce the report in Excel.
More Information: Defining Excel Reports on page 39 Setting up a Group of List Reports for Excel on page 41
Running a Word List Report Use this report output only if your list report fits comfortably across a sheet of paper. The list is produced by merging the data from the report design with a Word document (the format of which is determined by a Word template).
1. Select Reports | Run Report to display the Reports browser. Use the navigation tree to locate the folder in which the required report is stored. All reports in the selected folder are displayed in the right-hand panel. Expand and contract the folder structure by clicking the + or – buttons as required.
2. Highlight the required report name and click the OK button. If the Allow choice of output at runtime option was selected when the report was designed, you are required to select the output type before the report can be run.
3. Select Word List Report from the drop-down list and then click the Run button. You may be prompted to enter run-time parameters in order to restrict the amount of data returned, if these were not specified in the original report design.

02| Previewing and Running Existing Reports
14 Designing and Running Reports
4. The report is either displayed directly in Word for Windows or you are presented with a set of options via a Word List dialog.
Run-time Parameter Definition
Standard Portrait/Standard Landscape
Select the required radio button to choose the required orientation.
User-defined Template Select this radio button if you wish to use a user-defined template instead of a portrait or landscape output.
Allow these settings to be changed at run-time
Select this check box if users are able to change the report output when the report is printed.
More Information: Defining Word List Reports on page 30
Creating a New Word List Report Template (Run Mode) List reports can be produced by merging the data from the report with a Word document (based on an associated template). You can select or edit an existing template or create a new template. New templates are based on an existing base template.
1. From the Word List dialog, click the New button to display the Select Base Template dialog.
2. Select the required base template by clicking the appropriate folder name. Any existing templates are displayed in the right-hand panel. Click the required template name, then click the OK button.
3. Edit the template as required. Two merge fields are visible - <REPORT TITLE> and <REPORT TABLE>. You can do any of the following:
Format these fields to change the appearance of the resulting report text, e.g. colour, bold, italics, etc. The fields can also be repositioned, although this should be done with care to ensure the resulting report data fits on the page.
Insert logos, graphics and any other additional text. Change margins, page formatting, etc.
4. Click the Save button on the Word toolbar then close down Word. You are returned to the Word List dialog.
5. Overtype the file name New List Report in the File Name field. 6. Click the OK button to produce the report.
Running a Word Form Report (RTF) Use this report output when you want to produce a report consisting of one page per record, e.g. letters, forms, etc. You may wish to preview the report to check the content before running. Word Forms are produced using Word’s mail merge facility. A previously created document defines the content and layout of the report and is automatically selected.

02| Previewing and Running Existing Reports
Designing and Running Reports 15
1. Select Reports | Run Report to display the Report browser. 2. Highlight the required report.
If the Allow choice of output at run-time option was selected when creating the report design, you are required to select the output type before the report can be run.
3. Select Form Report (RTF) from the drop-down list and click the Run button. Word is launched and a separate page is created for each record in the report. You may be prompted to select a suitable template (i.e. Landscape or Portrait) if this is not specified in the report design.
Run-time Parameter Definition
Standard Portrait/Standard Landscape
Select the required radio button to choose the required orientation.
User-defined Template Select this radio button if you wish to use a report template instead of a portrait or landscape output.
When editing user-defined templates, use Word with macro support field names
Select this check box if appropriate.
Allow these settings to be changed at run-time
Select this check box if users are able to change the report output when the report is printed.
More Information: Specifying Page Breaks on page 36 Specifying Sub Tables and Report Inserts on page 37
Running a Text Report Running a Text report exports the report content into a text file. You may wish to preview the report to check the content before running.
1. Select Reports | Run Report to display the Reports browser. If the Allow choice of output at runtime option was selected when creating the report design, you are required to select the output type before the report can be run.
2. Select Text from the drop-down list and then click the Run button. The report is either exported and saved as a text file automatically (a message dialog appears displaying the file name) or you are prompted to enter run time parameters, if these were not specified in the report design.
3. Enter a file name for the text file in the File Name field or click the Browse button and navigate to the destination of the required file.
4. Select the required type of text file Format from the following options: Comma Separated (CSV) Tab Separated XML (no schema) XML (with schema).

02| Previewing and Running Existing Reports
16 Designing and Running Reports
5. Click the OK button to produce the report.
Running a Web Page Report Running an HTML report exports the report data to an HTML file which can be viewed through Internet Explorer. You may wish to preview the report to check the content before running.
1. Select Reports | Run Report to display the Reports browser. If the Allow choice of output at runtime option was selected when creating the report design, you are required to select the output type before the report can be run.
2. Select Web page from the drop-down list and then click the Run button. The report is either opened immediately in Internet Explorer® or you are prompted to enter your chosen location for the Web page.
3. Enter a Web page address to save the report as .HTM or .HTML in the Web Page field or click the Browse button to navigate to an existing file.
4. Select the View in browser when web page is created check box if you want to view the report straight away.
5. Select the Allow web page location to be chosen at run-time check box if users are able to specify this themselves when the report is run.
6. Click the OK button to produce the report.
More Information: Defining Web Page Reports on page 41
03| Designing Reports
Designing and Running Reports 17
03|Designing Reports
Using the Report Designer ............................................................. 17 Creating a New Report ................................................................... 18 Selecting the Data Area (Report Rows) .......................................... 19 Selecting the Data Fields (Report Columns) ................................... 20 Applying Report Filters .................................................................. 24 Defining the Report Sort Order ...................................................... 29 Selecting the Report Presentation ................................................. 30 Defining Word List Reports ............................................................ 30 Defining Word Mail Merge Reports ................................................. 32 Defining Form Reports (RTF) ......................................................... 34 Defining Excel Reports ................................................................... 39 Defining Web Page Reports ............................................................ 41 Defining Text File Reports .............................................................. 42 Editing an Existing Report Design .................................................. 43 Saving Report Designs ................................................................... 44 Report Criteria Conditions .............................................................. 44
Using the Report Designer There are three possible options available in the Report Designer. The first and most complex of these, is the option to Create a New Report. Only users with suitable permissions can design new reports. It is also possible to Open an Existing Report that has been made public by its ‘creator’ so that it can be edited and saved with a different name by other users. The option to Import a Report enables you to access a large number of predefined reports that have been created by Capita Children's Services and other external agencies. These reports can be edited and then saved with an alternative name.
Create a New Report Select this option if you want to create a new report. The Select Data Area panel of the Report Designer is displayed, enabling you to start selecting the report design criteria.

03| Designing Reports
18 Designing and Running Reports
Open an Existing Report Select this option if you want to open an existing report to edit the criteria or view the report summary. The Open Report dialog is opened, enabling you to browse to the location of an existing report.
Import a Report Select this option to display the Import Reports dialog, enabling you to import a previously created report from an alternative location. Before creating or running a report designed by another user, it is advisable to import the selection of predefined reports that have been provided for use with this version of the Reporting tool. This gives you an idea of the reports that are already available and the data fields that they contain and should make designing new reports far easier for first time users.
Creating a New Report There are five key processes involved in designing a report. The Report Designer guides you through these processes in chronological order but previous stages can be revisited at any point by clicking the Back button until you reach the required screen.
The Report Summary As you proceed with designing a new report, a Report Summary is displayed in the bottom left-hand corner of the page. This summary is updated each time you make a data selection. Once all aspects of the report definition have been made, you can review your choices at a glance by checking the details in the Report Summary.

03| Designing Reports
Designing and Running Reports 19
You can also revisit any individual report design area by clicking the relevant hyperlink text in the Report Summary. This enables you to change your original selection (apart from the Data Area), enabling you to modify the report data before running the report.
Selecting the Data Area (Report Rows) 1. Select Reports | Design Report to display the Report Designer.
Select the Create a new report option. After selecting to create a new report, you are presented with the Select Data Area panel. The Data Area is the focus on which your report is based, i.e. People, School or Agency. As a result, once you have selected a data area it is not possible to change it for the report you are currently creating. In order to select a different data area, you must save or abandon the current report, close down the Report Designer and create a new report by selecting Reports | Design Report from the top Menu Bar again.
2. In the Select Data Area panel, highlight the required focus by expanding and contracting the navigation tree and click the Next button. Alternatively, double-click the required focus to select it. The chosen focus, e.g. People | Student, School | Class, form the Rows of the report.
Refining the Data Area Depending on the Data Area you have selected and permissions assigned to you, you may be given the option to further refine the Data Area by the selection of a subset of that area – the Population. Where the report is based on Student information, the Data Area Population can be refined to:
On-Roll Accepted Pre-admissions Leavers All students Leavers (Deceased).

03| Designing Reports
20 Designing and Running Reports
Select the required population from the drop-down list and click the Next button to display the Select Data Fields panel.
Selecting the Data Fields (Report Columns) The Select Data Fields panel of the Report Designer enables you to select items of information (Data Fields) for the report and the order in which the information is displayed. These items of information are displayed in the report as Columns. Selecting the Data Fields is achieved by choosing the required data fields (columns) from those available. The Data Area (focus) chosen previously for the report determines which fields are now available for inclusion. For example, selecting Student and On-Roll as the focus of your report populates the Select Fields to be included in the report panel with student related criteria, e.g. Registration and SEN information.
It is also possible to load Data Fields from an existing report by clicking the Load from existing report hyperlink.
1. Select the required field(s), one at a time, by expanding and contracting the navigation tree.

03| Designing Reports
Designing and Running Reports 21
Alternatively, double-click a field group name, e.g. Basic Details to view all the criteria contained within this field group. Either double-click the required field or click the Right Arrow button to select it as a report column. The selected field is now displayed in the right-hand panel.
The Focus Bar in the Select fields to be included in the report panel displays the name of the Data Area (Focus) previously selected, i.e. the entity on which your report is based. To save time expanding and contracting the navigation tree in search of particular criteria, enter the criteria name into the Find field. The navigation tree is expanded to display the first recognised field that matches the letters entered. The Full List check box always defaults to Yes, so that all Data Fields are available for selection. The Caption field displays whichever criterion is currently highlighted in the right-hand side of the panel. It is possible to change the name or Caption of a particular Data Field (column title) by highlighting the appropriate Data Field from the right-hand panel and editing the name. The new name then becomes the column title and is displayed in square brackets, adjacent to the field name.
2. Select as many Data Fields as required to provide the information needed in this report.
NOTE: You must select at least one Data Field to include in the report.

03| Designing Reports
22 Designing and Running Reports
If you make a mistake at any time, highlight the incorrect selection in the right-hand panel and use the Left arrow button to remove the criterion. You can also change the order in which the columns appear in your report by using the Up and Down arrow buttons to shuffle the Data Fields around until you are satisfied with how your report looks. If you decide that all of the Data Fields you have selected do not produce a satisfactory report, click the Clear button to remove all previous selections and start again. If you want to insert a blank column into your report, e.g. for tick boxes on data capture forms, click the Blank button to add a [Blank column] to the bottom of the selected Data Fields.
Inserting Related Fields (Sub Reports) It is possible to insert Related fields into reports (if required). For students, this could include related Classes, Contacts, Assessment Results, etc. Once included, you can also apply additional criteria to these fields to restrict the data returned. Related fields are located in the lower section of the navigation tree and are denoted by the blue grid icon.
Related Fields icon
For example, you may wish to produce a report that lists all the students in the school who have a medical condition and are in classes with a size greater than 26. This would enable you to pinpoint any students with medical conditions who attend several classes with a large class size. The report currently contains fields from the Student Focus but you would also want to report on fields from Classes and Medical Conditions. Therefore, you must use related fields in order to generate the report. A related field is known as a sub report. Additional report criteria can also be added to a sub report by highlighting the sub report and clicking the Define settings for this Sub report button.
Define settings for this Sub report button
Alternatively, double-click the sub report to display the Selection criteria that relates to the area that you have selected (if any).

03| Designing Reports
Designing and Running Reports 23
Defining the Sort Order for the Sub Report You can define the sort order by clicking the Define button adjacent to the Sort Order field to display the Sort order for related dialog. You can change the order in which the fields appear in your report by using the Up and Down arrow buttons. Either double-click the required field or use the Right arrow button to select it. The selected field is now displayed in the right-hand panel.
Including Records with no Such <Item in the Report> Select the Include records with no such… (named according to the related area you have selected) check box.
Displaying the First Record only <in the Report> Select the Display first record only check box (if required). For example, if you wish to list a student’s best marks in Maths, English and Science, set up an assessment result where the subject = Maths, then order by grade value (descending) and select the Display first record only check box. The next column can be set up in the same way except that the subject should = English. The third column can be set up in the same way but the subject should = Science. A sub report can be duplicated and then edited, if required. Highlight the sub report and click the Define the settings for this sub report button.
Duplicate the selected Sub report button
NOTE: The Duplicate Sub report button and Define settings for this Sub report button is only be visible when Related fields have been selected.

03| Designing Reports
24 Designing and Running Reports
Applying Report Filter Conditions to the Sub Report You can apply report filters to Related fields in order to restrict the records returned in the report output. The process of selecting the filter consists of selecting the Attribute, specifying the Condition, e.g. Equals, Greater than, etc. then entering a Value. Each Attribute/Condition/Value set is referred to as a clause. It is possible to add many different clauses.
When you have selected all the Data Fields required and any additional report criteria, click the Next button to display the Apply Filters panel.
More Information: Adding an AND Clause on page 27
Applying Report Filters Report Filters are used to restrict the records returned in the report output. For example, you may wish to limit the number of pupil/students returned in a Student report according to their age, gender, registration group, etc. This can be achieved by using filters. Unless you wish to include all available records within the chosen report data area (e.g. all pupil/students), you need to restrict the records returned by applying report filters, e.g. pupil/students in Year 10 who have a Statement of Special Needs.

03| Designing Reports
Designing and Running Reports 25
The filter condition consists of an Attribute, Condition, Value and Prompt set and is referred to as a Clause. It is possible to add many different clauses.
More Information: Adding an AND Clause on page 27
Defining New Filter Conditions The report records returned can be restricted further using the Define Filter Condition dialog (available from the Apply Filter area of the Report Designer).
1. Click the New button to display the Define Filter Condition dialog. The icon that represents the New button is the same as the icon used for Related Fields.
2. Select the Attribute to add the filter to by selecting from the navigation tree.
3. Click +/- to expand/contract the tree until the required field can be seen. Alternatively, double-click a Field Group name to expand/contract the tree.

03| Designing Reports
26 Designing and Running Reports
The Find field and Full list facility can be used to help search for a specific attribute. To search for a field name, enter the name in the Find field. The tree is expanded to display the first field matching the letters entered. The Enter/edit condition phrase options change according to the Attribute selected.
4. Select a Condition from the drop-down list. For example, if the Age field is selected, conditions are made available for number fields, i.e. Equals, Does Not Equal, Less Than, Greater Than and Between. Where the chosen attribute contains a set of possible values (lookup codes), users can click the Select All button to include all the active values in the report. Fixed lookups, such as Gender, are always considered active. If you make a mistake, the selections can be removed by selecting the Clear All button. The Show All filter check box can also be selected. This displays both the active and inactive lookup values for inclusion in the report.
5. Add a prompt (if required). This facility enables you to delay specifying the Value of the filter until the report is actually run. The prompt is then displayed.
6. Select the Prompt at runtime check box. A default prompt is displayed in the field below, which can be amended, if required.
7. To return to the default prompt, click the Default button. 8. Click the OK button to return to the Define Filter panel.
More Information: Report Criteria Conditions on page 44
Modifying an Existing Filter Condition 1. From the Define Filter panel, highlight the filter condition to be modified
and click the Modify button to display the Define Filter Condition dialog.
2. Edit the Condition, Value and Prompt at run-time text.
NOTE: The Attribute cannot be altered at this stage.
3. Click the OK button to return to the Define Filter panel. 4. Save the current filter definition. 5. Additional clauses can now be added.
More Information: Adding an AND Clause on page 27

03| Designing Reports
Designing and Running Reports 27
Loading an Existing Filter Condition from an Existing Report The process of defining the report criteria for a report can be complex. It can, therefore, be useful to open previously saved definitions that were used with similar reports and use these as the basis of your new report.
1. Click Load from an existing report to display the Load from existing report dialog.
2. Click the appropriate folder name. Any existing reports stored in the selected folder are displayed in the right-hand panel.
3. Select View and then select the required option from the resulting menu. Alternatively, click in the right-hand panel and select from the pop-up menu. The report can be viewed in the following modes:
List Icons Details - name of report, the focus that the report is based on (e.g.
Student), report owner, (e.g. Mark Smith), report supplier, (e.g. Longham School) and the date that the report was last updated.
4. Highlight the required report name and click the OK button. The relevant criteria for that report are loaded into the area of the Report Designer you are in. Alternatively, double-click the report name.
Adding an AND Clause Additional clauses can be added to any existing clause. These are inserted using the AND option and records are only returned if they pass both clauses. In addition, combinations of AND and OR clauses can be used.
1. Select the required Attribute, Condition and Value as described in Defining New Filter Conditions.

03| Designing Reports
28 Designing and Running Reports
2. From the Define Filter panel, highlight the Focus, which is followed by the word ‘where’ to which you wish to attach the additional clause.
3. Click the AND button to display the Define Filter Condition dialog. 4. Add the AND clause using the same method used when defining the original
filter condition. 5. Click the OK button to return to the Define Filter panel.
The Define Filter panel is updated to include the new clause, which is appended to the existing clause and preceded by the word AND. Further clauses can be added, if required.
Adding an OR Clause 1. Select the required Attribute, Condition and Value items (please see
Defining New Filter Conditions on page 25). 2. From the Define Filter panel, highlight the Focus, which is followed by the
word ‘where’, to which you wish to attach the additional Clause. 3. Click the OR button to display the Define Filter Condition dialog. 4. Add the OR Clause using the same method used when defining the original
Filter Condition. 5. Click the OK button to return to the Define Filter panel.
Adding Combinations of AND/OR Clauses It is possible to join several clauses together with an AND, and also have combinations of AND and OR. Complex criteria can be generated in this way. It is advisable to save complex report criteria selections for future use. The Define Filter panel is updated to include the new clause, which is preceded with the word OR. Further clauses can be added as required.
Deleting Clauses Clauses associated with the current report can be deleted, if required. For example, if the existing clauses state ‘dietary needs includes gluten free and meal arrangements includes schools meals’, you may wish to delete ‘and meal arrangements includes schools meals’.

03| Designing Reports
Designing and Running Reports 29
1. From the Define Filter panel, highlight the Clause to be deleted and click the Delete button.
2. To delete ALL clauses attached to the current report, highlight the Focus (which is followed by the word ‘where’), e.g. Students where, and either press the Delete key or click the Delete button.
3. When you have set up the required report filters, click the Next button to display the Define Sort Order panel.
Defining the Report Sort Order The Define Sort Order section of the Report Designer enables you to choose the order in which the rows of your report are displayed. Each report design is automatically sorted with an appropriate default sort order, e.g. surname order for Student Focus reports, etc. All reports have an appropriate default sort order (e.g. Surname order for a Student report), but it is possible to specify any sort order required. The sort order can contain multiple fields e.g. sort by Surname, Type of Need, then Date of Birth, etc.
The default sort order is shown in the Define Sort Order panel and is determined by the Data Area initially selected. However, you can choose one or more alternative fields to sort the rows, if required.
1. From the navigation tree, navigate to the field on which you wish to sort the report. If the required field is not visible, expand and contract the tree by clicking the + and - buttons until the required field can be seen. Alternatively, double-click a field group name to expand the tree. The required field can also be found by entering the field name in the Find field. The tree expands to display the first field matching the field name entered.
2. Select the field by either clicking the Right arrow button or double-clicking the field name to select it. To remove a selected field, highlight it and click the Left arrow button.
3. Set the sort order priority by highlighting the field name in the Sort fields panel and then clicking the Up or Down arrow button. You can sort the report on more than one field and choose the sort order priority according to the first field in the sort list, e.g. by Surname, then Forename, then Date of Birth, etc.

03| Designing Reports
30 Designing and Running Reports
4. By default, fields are automatically sorted in ascending order. To sort in descending order, select the check box adjacent to the appropriate field.
NOTE: If you change the sort order priority, all sort fields affected default to ascending order and you need to reselect any fields that you wish to appear in descending order.
The sort order is saved with the report design. 5. Click the Next button to display the Define Presentations panel.
Selecting the Report Presentation Once the report definition has been created, you need to set up the report outputs. You can provide the person running the report with a choice of output, or force the report to be generated with one specific output. There are currently seven different types of report output, which can be set up according to your requirements.
In addition to saving complete report designs, it is also possible to save separate elements of the report design, i.e. save the report selection criteria independently, or the data required selection independently, or both. Once saved, they can be used to design new reports without the need to reselect the information. To force the report to be generated with one output, select the required output type from the Define Presentations panel, e.g. Excel, then deselect the Allow choice of output at run-time check box. The Enter required settings for report output types panel displays relevant fields for completion, depending on the output type selected.
Defining Word List Reports Word List reports can be used when the report output presentation is required as a simple table. Microsoft Word® Lists can be generated for reports that comfortably fit the width of a sheet of paper. The list is displayed in a table within a single Word document.

03| Designing Reports
Designing and Running Reports 31
The layout/design of the report is determined by a previously defined Word template that contains relevant text, formatting and mail merge fields which are replaced with data from your database when the report is run. Default templates are provided, which can be edited, if required. These templates are stored in the Document Management Server.
1. Select Word List Report from the Define Presentations panel. The right-hand panel changes to accommodate the input of your Word List report settings.
2. Select the Allow choice of output at run-time check box (if required). This enables the user to specify the settings when the report is run. If this check box is not selected, the report automatically opens in Excel according to the settings you define.
3. In the Enter required settings for report output types panel, enter a Report Title.
4. Select the Suppress duplicates check box, if required.
If you expect to see repeated rows on the report, ensure that this check box is not selected.
5. Select the required template type from the Word List Report Settings panel:
Standard Portrait - A simple list report is produced. Click the Preview button to view the result.
Standard Landscape - A simple list report is produced. Click the Preview button to view the result.
User-defined Template - If you wish to use Word with macro support for field names, ensure that the associated check box is selected.
Allow this template selection to be made at run-time, if required, by selecting the associated check box.
6. If required, you can preview the report by clicking the Preview button on the main toolbar, run the report by clicking the Run button or save the report design by clicking the Save As button.

03| Designing Reports
32 Designing and Running Reports
7. Click the Next button to continue.
Editing an Existing Word List Template New templates can be created by basing them on existing templates. Once created, the template is associated with the current report and both are stored in the Document Management Server.
NOTE: This template is for the current report only and cannot be used in conjunction with any other report.
1. If a template is required to be used with more than one report it can be saved to a location of your choice by using the Save As option in Word.
2. Save the template and close down Word. 3. In the Report Designer, save the report design.
If additional changes are required, click the associated Edit button to reopen Word and edit as required.
Reusable Templates There may be occasions when a template is appropriate to use with more than one report, for example where the school address and logo have been added.
1. To ensure a template is available for reuse, after editing the template and before closing Word, use the Save As option in Word to save the template to a location of your choice.
2. When the template is next required, click the User-defined template radio button (in the Report Settings pane) and navigate to where the template is saved.
Defining Word Mail Merge Reports Word Mail Merge reports should be generated when you want the report to consist of one page per record, e.g. letters, forms, etc. This type of output is produced using Word’s mail merge facility. To set up Word Mail Merge reports, you must create and associate a mail merge document that contains the required mail merge fields and formatting. Click the New button to launch Word. The report fields are available in the form of buttons situated on a toolbar. Once created, you must save the Word document and close Word immediately. This associates the mail merge document with the report design.
1. Select Word Mailmerge from the Define Presentations panel. The right-hand panel changes to accommodate the input of your Mail Merge report settings.
2. Select the Allow choice of output at run-time check box (if required). This enables the user to specify the settings when the report is run. If this check box is not selected, the report is automatically opened and based on the associated mail merge document.
3. In the Enter required settings for report output types panel, enter a Report Title.

03| Designing Reports
Designing and Running Reports 33
4. Select the Suppress duplicates check box (if required).
If you expect to see repeated rows on the report, ensure that this check box is not selected. There can only be one mail merge document associated with the report and you must therefore either create a new mail merge document or edit the existing mail merge document. SIMS looks for a Word template called SIMSReportForm.dot when creating this type of report. If this template is not found, SIMS uses the Normal.dot template. This results in a report being generated based on a blank document. It is therefore recommended that you edit or create a template called SIMSReportForm.dot and store it in the C:\PROGRAM FILES\SIMS\SIMS .net folder.
5. Click the New button to create a new mail merge document (if required). A Microsoft Word template is opened, enabling you to enter text and mail merge fields. The document should be saved with the default name of ReportMailmerge. When complete, click the Save button and close Word. Alternatively, close Word without saving, then when prompted to save, click the Yes button.
6. If you want to use an existing label template, click the Open button and select the required template.
7. Click the Edit button to edit the existing mail merge document (if required). 8. Before progressing further, save the report design. This process associates
the merged document with the report design. 9. To disassociate the merged document with the report design, click the
Delete button. 10. If required, you can preview the report by clicking the Preview button or
run the report by clicking the Run button. 11. Click the Next button to continue.
More Information: Editing the Report Mail Merge Document on page 34 Deleting the Current Word Mail Merge Document on page 34

03| Designing Reports
34 Designing and Running Reports
Editing the Report Mail Merge Document 1. From the Word Mailmerge settings panel, click the Edit button. Word is
launched with the associated merge document displayed. The report fields are available on a toolbar button.
2. Insert additional mail merge fields by clicking the Insert Merge Field button.
3. To insert further merge fields, position the cursor where you want to insert the merge field then click the Insert Merge Field button on the Word toolbar and select the required merge field, e.g. surname, forename, DOB, etc.
NOTE: The fields available are the same as the fields included in the report design. Each merge field is inserted with double chevrons (e.g. <<Surname>>) and is replaced with live data when the report is run.
4. Format the merge fields and the remainder of the merge document as required. The options are:
Add or remove merge fields. Format merge fields to change the appearance of the resulting report
text, e.g. colour, bold, italics, etc. The fields can also be repositioned although this should be done with care to ensure the resulting report data fits on the page.
Insert logos, graphics and any other additional text. Change margins, page formatting, etc.
5. Click the Save button on the Word toolbar then close down Word. 6. Switch back to SIMS and save the report design. The edited merge
document is associated with the report design.
NOTE: The association with this merge document is maintained unless you click the Edit button again or the Delete button. If either of these buttons are clicked, you need to reload the report design (without saving the current report design) to load the merge document template that was associated with the report at the time it was last saved.
Deleting the Current Word Mail Merge Document To break the association with the current mail merge document, click the Delete button. You subsequently need to create another mail merge document before you can produce a Word Mail Merge report.
Defining Form Reports (RTF) Form reports use standard Rich Text Format (RTF) which has the advantage that it can be read by any word-processor. This format provides more flexible control of the report. You can present the result as a simple table, or as a form report. Sub-tables and report inserts are also available.

03| Designing Reports
Designing and Running Reports 35
On running the report, key fields in the selected template are replaced with the appropriate values from the report data. The RTF file is opened in whichever application you have associated with RTF files.
1. Select Form Report (RTF) from the Define Presentations panel. The right-hand panel changes to accommodate the input of your RTF report settings.
2. Select the Allow choice of output at run-time check box (if required). This enables the user to specify the settings when the report is run. If this check box is not selected, the report is automatically opened in whichever application you have associated with RTF files.
3. In the Enter required settings for report output types panel, enter a Report Title.
4. Select the Suppress duplicates check box (if required).
If you expect to see repeated rows on the report, ensure that this check box is not selected.
5. In the Form Report (RTF) Settings panel, Select a Rich Text Format template to be used for this report.
Standard Portrait - A simple list report is produced. Click the Preview button to view the result.
Standard Landscape - A simple list report is produced. Click the Preview button to view the result.
User Defined Template - If you wish to use Word with macro support for field names, ensure that the associated check box is selected.
When editing user-defined templates, use Word with macro support field names - Select this check box if appropriate.

03| Designing Reports
36 Designing and Running Reports
Allow selection of template to be made at run-time, (if required), by selecting the associated check box.
6. If required, you can preview the report by clicking the Preview button on the main toolbar, run the report by clicking the Run button or save the report design by clicking the Save As button. Alternatively, specify Page breaks and/or sub-tables and report inserts by clicking in any of the selected sort field check boxes.
7. When you have finished specifying the settings for your report, click the Next button to continue.
More Information: Specifying Page Breaks on page 36
Editing an Existing Form Report (RTF) New templates can be created by basing them on existing templates. Once created, the template is associated with the report you are designing and is also available for use with other templates.
1. From the Report Settings panel, select the User-defined template radio button. Confirm that you want to use a blank template.
2. If you select Yes, the blank template, file name Blank.rtfTemplate, opens in the word processor you have associated with Rich Text Formats. Alternatively, select No to display the Select a base template on which to base your use-defined template dialog from where you can select the template of your choice. Highlight the appropriate template name:
StandardPortrait.rtfTemplate StandardLandscape.rtfTemplate
or a previously created RTF template. Click the Open button to display the template in the word processor you have associated with Rich Text Formats.
3. Edit the template as required by entering numerous fields to achieve various results.
Specifying Page Breaks Previously, when running a Standard Portrait or Standard Landscape report in Form Report (RTF) mode, a simple columnar list was produced. Depending on the ‘sort fields’ selected when defining your report, the system now identifies these as possible areas for page break separation, e.g. a page break can be inserted after each Surname, Forename. It is worth bearing in mind that if Surname is chosen as the ‘sort field’ i.e. wherever the key value of the sort field changes, a page break is inserted, all students with the surname of Smith (for example) are displayed on one page. To prevent this occurring, it is possible to use a combination of the Page break ‘sort fields’ so that only students with the same Surname and Forename appear on the same page. The ability to specify when page breaks are inserted is only available when designing reports as Word Form Reports (RTF) and when using the Standard Portrait and Standard Landscape options, not when using user defined templates.

03| Designing Reports
Designing and Running Reports 37
Specify required Page breaks and/or sub-tables and report inserts by clicking in any of the selected sort field check boxes that are displayed in the Form Report (RTF) Settings panel.
Specifying Sub Tables and Report Inserts Sometimes, there may be a requirement to create complex predefined reports that contain subsets of data. It is possible to define a <REPORT INSERT> tag that can be included in the user-defined template along with the sub report name i.e. <REPORT INSERT ContactsSubReport>. An unlimited number of sub reports can be inserted into a main report in this way.
Key Fields On running the report, SIMS replaces any key fields it finds in the template with the appropriate values from the report.
System Key Fields Report title: <REPORT TITLE>
Date report produced: <REPORT DATE>
Time report produced: <REPORT TIME>
User who produced the report: <REPORT USER>
Selection filter used in the report: <REPORT FILTER>
Number of records in the report: <RECORD COUNT>
Formatting Dates It is possible to add a formatting string for a date.
Format Definition Example
d date 1
dd date 01
ddd day Mon
dddd day Monday
M month 1
MM month 01
MMM month Jan
MMMM month January
yy year 16
yyyy year 2016
For example, Student <STUDENT> <DOB dd-MM-yy> would display Ben Abbott 27-05-06.

03| Designing Reports
38 Designing and Running Reports
Report Key Fields To include any field from the report, simply type the Column title you have designed for the field and put it inside angle brackets. The name and the case must match, otherwise it is not translated. It does not matter if there are fields in the report that are not included in the template because it is possible to re-use fields multiple times. This is similar to mail merge, except that the list of fields is not available. This is because we are not making any direct link between SIMS and the application used to read the RTF files. Instead, the list of fields is copied to the clipboard when creating a new RTF template, so you can paste it into your document for reference. The Report Key Fields are case-sensitive, so they must be the same as those defined in the report. Otherwise, key fields are not translated.
Personal Pronouns Fields The following can be used to deal correctly with male/female variations but the Gender field must be included in the report or they are not translated: <he/she>
<his/her>
<him/her>
<his/hers>
Photo Fields Photo fields can be sized by a percentage: <Photo (50%)>
Logical Fields Logical fields by default return True or False, but these can be replaced with other alternatives: <Active (active/inactive)>
Dates If you do not wish to repeat the whole document for each record, specify the start and end of the portion of the document that repeats for each record in the report using <RECORD START> and <RECORD END>.
If <RECORD START> is not present, the beginning of the document is assumed. If <RECORD END> is not present, the end of the document is assumed and a page break is then used to separate each record. Care should be taken not to include unwanted paragraph marks. If your report includes a related multiple recordset, such as a list of the classes for each student, you can display this information in a table. You must add a table to the template and put the report key fields in the appropriate columns. When SIMS finds the related fields it knows to repeat the row for each class. In addition, an entire report can be inserted, provided that it has been defined with a RTF template.

03| Designing Reports
Designing and Running Reports 39
The inserted report must be for the same Focus (e.g. Student) and SIMS ignores the selection filter defined for the insert report and execute it for the current focus. The resulting Rich Text is inserted into the final report. To include a report insert at a given point, use the key <REPORT INSERT [report name]> where [report name] is the name of the report you wish to insert. If the report cannot be found or is not a Rich Text report, an error message occurs.
NOTE: Report Inserts are necessarily slow, as each inserted report has to be executed once for every item in the main report.
Using RTF to produce simple List Reports RTF has recently been extended to produce simple list reports; instead of specifying where individual fields go in the template, a table of the complete dataset can be produced simply by including the tag <REPORT TABLE>.
Thus a blank page with this tag at the top is sufficient to produce a full report. The other system tags are also available, but individual field tags are ignored if the <REPORT TABLE> tag is found.
The system tries to size the columns according to the maximum width of the text, but it may end up too wide for the page, in which case a form report needs to be designed with fixed column widths.
Grouping data If you precede your <REPORT TABLE> with a <GROUP BY column_name> tag, the system excludes that column from the table and instead it produces a table for each different value of the group by field.
NOTE: The dataset needs to be ordered by this field, to prevent the report using numerous pages.
1. Save the template and close the word processor. 2. Switch back to SIMS Reporting and save the report design.
The modified template is saved with the report design but does not affect any other reports that use the original template. All templates are stored in the Document Management Server. If additional changes are required, click the associated Edit button to re-open the word processor and edit as required.
Defining Excel Reports 1. Select Excel from the Define Presentations panel. The right-hand panel
changes to accommodate the input of your Excel report settings. 2. Select the Allow choice of output at run-time check box (if required).
This enables the user to specify the settings when the report is run. If this check box is not selected, the report is automatically opened in Excel according to the settings defined.
3. Enter a title for the report in the Report Title field.

03| Designing Reports
40 Designing and Running Reports
4. Select the Suppress duplicates check box (if required).
If you expect to see repeated rows on the report, ensure that this check box is not selected.
5. From the Excel Settings panel, select the Use the following settings to control Excel's presentation check box (if required).
Standard Portrait/Standard Landscape Select the appropriate radio button.
Report Template Select this option and browse to the location of a stored report template.
Divider Frequency Defines the number of records/rows to be grouped and separated by a horizontal line.
Number of Fixed Columns Specifies the number of columns repeated on printed continuation pages if there is insufficient room to fit all columns onto a single page.
Go straight to Print Preview Select this check box if you want the report to open in Excel’s print preview mode.
Group into Separate Sheets Select this check box if you want the data in the report to be listed in groups. Where a report has been appropriately designed, it is possible to separate an Excel report into groups of data, with each group displayed on a separate worksheet.
Record Count Select this check box to insert the number of records in the top left-hand side of the report, preceded by the text entered in the adjacent field (defaults to Records).
6. Select the Allow these setting to be changed at run-time check box (if required).

03| Designing Reports
Designing and Running Reports 41
This option enables the user to specify the settings when the report is run. If this check box is not selected, the report is automatically opened in Internet Explorer and saved with the file name specified.
7. If required, preview the report by clicking the Preview button, run the report by clicking the Run button or save the report design by clicking the Save As button.
8. Click the Next button to continue.
Setting up a Group of List Reports for Excel It is possible to design an Excel report so that it is split into groups that are presented in separate worksheets within the Excel Spreadsheet. For example, a list report that includes all pupil/students in Registration Groups 8A, 8B and 8C can be separated into three lists, one for each Registration Group. Each list (e.g. Registration Group) would be displayed on a separate worksheet within the Excel report. Ensure that the following form part of the report design:
The field to be separated must be included in the sort order. Using the previous example, this would be Reg Group. This field must be the first field in the sort order, although other sort fields can be included.
The field to be separated/grouped must be the last field in the Select Data Fields section of the Report Designer and therefore, the last column in the report. The field does not actually appear as a column in the report, but is used as the title.
The Group into Separate Sheets check box must be selected in the Excel Output settings.
Defining Web Page Reports HTML web page reports are presented in tabular format directly in your Internet Browser.
1. Select Web page from the Define Presentation panel. The right-hand panel changes to accommodate the input of your Web page report settings.
2. Select the Allow choice of output at run-time check box (if required). This enables the user to specify the settings when the report is run. If this check box is not selected, the report is automatically opened in Excel according to the settings you define.
3. In the Enter required settings for report output types panel, enter a Report Title.
4. Select the Suppress duplicates check box (if required).

03| Designing Reports
42 Designing and Running Reports
If you expect to see repeated rows on the report, ensure that this check box is not selected.
5. Enter a file name for the report in the Web page field or click the Browse button to navigate to the location of an existing file.
6. Select the View in browser when web page is created check box (if required). This enables you to view the report immediately after the web page design is complete.
7. Select the Allow web page location to be chosen at run-time check box (if required). This option enables the user to specify the settings when the report is run. If this check box is not selected, the report is automatically opened in your default web browser and saved with the file name specified. If required, you can preview the report by clicking the Preview button, run the report by clicking the Run button or save the report design by clicking the Save As button.
8. Click the Next button to continue.
Defining Text File Reports 1. Select Text File from the Define Presentations panel. The right-hand
panel changes to accommodate the input of your Text File report settings. 2. Select the Allow choice of output at run-time check box (if required).
This enables the user to specify the settings when the report is run. If this check box is not selected, the report is automatically opened in Excel according to the settings you define.
3. In the Enter required settings for report output types panel, enter a Report Title.
4. Select the Suppress duplicates check box (if required).

03| Designing Reports
Designing and Running Reports 43
If you expect to see repeated rows on the report, ensure that this check box is not selected.
5. Enter a file name for the report in the File Name field or click the Browse button to navigate to the location of an existing file.
6. Select the required text file Format type from the following options: Comma Separated – each value is separated by a comma. Tab Separated – each value is separated by a tab. XML no schema – each value is XML tagged. The tag definition is not
included. XML with schema – each value is XML tagged. The tag definition is
included. 7. Select the Allow these settings to be changed at run-time check box (if
required). This option enables the user to specify the settings when the report is run. If this check box is not selected, the report is opened automatically in Internet Explorer and saved with the file name specified.
8. If required, you can preview the report by clicking the Preview button, run the report by clicking the Run button or save the report design by clicking the Save As button.
9. Click the Next button to continue.
Editing an Existing Report Design The reports available depend on the permissions assigned to you.
1. Select Reports | Design Report to display the Report Designer. 2. Click Open an existing report to display the Open Report dialog. 3. From the navigation tree, select the folder in which the required report is
stored. All reports held in the folder are displayed in the right-hand panel. The navigation tree is similar to Windows® Explorer. Click +/- to expand/contract the tree.
4. Clicking the View button and selecting Detail, List or Icons changes the screen display.
5. Highlight the required report and click the OK button.

03| Designing Reports
44 Designing and Running Reports
Saving Report Designs Saved reports are stored by default in the Document Management Server. They are only available for viewing and editing by you, unless they are made Public (available to other users with appropriate permissions) at the point of saving. Alternatively, you can make existing reports Public by copying them to the appropriate Public folder, e.g. Focus or Category.
1. Click the Save As button on the Report Designer toolbar to display the Save Report as dialog. Alternatively, click Save my report in the Report Complete panel.
2. Enter a Name for the report. This can be up to 40 alphanumeric characters (including symbols). If you wish to make the report Public (available to others with appropriate permissions), deselect the Private check box. This automatically stores a copy of the report in the appropriate Focus folder which can then be accessed by users with appropriate permissions. If you choose not to do this now, you can subsequently make a report public by copying it to the Focus folder or the appropriate Category folder.
3. Click the OK button to save the report to the Document Management Server.
4. To overwrite the saved report, click the Save button.
NOTE: Check that the Report Categories are marked as active if you wish them to be visible.
Report Criteria Conditions When designing reports it is possible to define various criteria to restrict the data returned in the resulting report. Various Conditions are used, such as equals, does not equal, etc. The Conditions available depend on which type of field is selected.

03| Designing Reports
Designing and Running Reports 45
These are as follows:
After Returns records where the date is after the date you select.
Before Returns records where the date is before the date you select.
Begins Returns records where the letters entered appear at the beginning of the field, e.g. Surname Begins ‘Ha’ would return Haley, Hall, Hawkins, etc.
Between Returns records where the date falls between the range you select in the Value 1 and Value 2 fields, e.g. Date of Birth Between ’01 January 1999 and ’01 January 2000’.
Contains Returns records where the specified field contains any of the letters entered as long as they are consecutive, e.g. Address – Town Contains ‘BE’ returns Bedford, Belper, Aberdeen, etc.
Equals Returns records that match the specific value that you enter or select. For text fields, the search is not case sensitive.
Greater than Returns records where the field value is greater than the number you provide.
Less than Returns records where the field value is less than the number you provide. Is one of/includes (as applicable) Returns records where the field value matches any of the list values you select. Choose the values by selecting the check boxes adjacent to the value names. Is not one of/does not include (as applicable) Returns records where the field value does not match the list values you select. Choose the values by selecting the check boxes adjacent to the value names.
Is True or False Returns records that match the condition you choose – either True or False, e.g. Birth Certificate Seen is ‘True’.

03| Designing Reports
46 Designing and Running Reports
Sounds Like Returns records where matches sounds like the value entered, noting that the first letter is ignored, e.g. Forename sounds like ‘Tommi’ returns Tommy, Ethnicity sounds like ‘Bangladesh’ returns Bangladesh and Bangladeshi.

04| Defining and Running Analysis Reports
Designing and Running Reports 47
04|Defining and Running Analysis Reports
Introduction ................................................................................... 47 Opening Existing Reports ............................................................... 47 Defining Analysis Reports .............................................................. 47 Running an Analysis Report ........................................................... 49
Introduction In addition to the Word, RTF, Excel, Web and Text File report outputs, it is also possible to use the data generated by a report for further analysis within SIMS. This is achieved by presenting a tabular display of the report data in an Analysis window. The content of this table is defined by the report design, i.e. what is displayed in the rows and columns. By default, the analysis table displays a count of the values found in the report data, e.g. the number of pupil/students in each Registration Group who have school meals, the number of pupil/students who have a nut free dietary requirement, etc.
NOTE: There are currently no settings required for Analysis reports.
Opening Existing Reports 1. Select Reports | Design Report and click the Open button on the toolbar
or select Open an existing report from the Report Designer window. 2. Use the navigation tree to locate the folder in which the required report is
stored. All reports in the selected folder are displayed in the right-hand panel.
3. Highlight the required report name and click the OK button. The elements of the selected report populate the appropriate areas of the Report Designer and can be edited (with the exception of the Focus) to suit the report you are designing.
Defining Analysis Reports Choosing the Records to include in the Analysis Table
As with all reports, you need to determine which records should be included in the report. For example, if you are producing a Student Focus report, you may wish to restrict the report to the pupil/students within a specific year. This is achieved using report filters. If no report filters are applied, then all the records within the Focus of the report are analysed.
More Information: Applying Report Filters on page 24

04| Defining and Running Analysis Reports
48 Designing and Running Reports
Choosing the Additional Information that can be Displayed The first column of the report design determines what additional information can be viewed when you right-click a cell in the analysis table. It is therefore important that this column is informative, e.g. for a Student Focus report, use Full Name or Full Name and Reg Group.
More Information: Selecting the Data Area (Report Rows) on page 19
Choosing the Rows and Columns You need to determine what should be displayed in the rows and columns of the analysis table. For example, you may wish to produce an analysis table that lists all the pupil/students in Years 8 and 9, by Registration Group, who have a specific dietary need. The second column in the report design must be the field that is listed in rows and the third column in the report design must be the field that is listed in columns in the analysis table. Using the previous example, the rows can be Dietary Needs and columns Reg Groups, although these can be reversed if required. It is often best to choose the field with the narrowest content to be columns. In our example, Registration Group would be better as columns.
Further columns can be included in the report design to enable you to alter what is displayed in the rows and columns when the analysis table is generated. If you also want to know what meal types each pupil/student has, or you want to break the analysis down by gender, you would need to include these two fields in the report design.

04| Defining and Running Analysis Reports
Designing and Running Reports 49
NOTE: If you change the sort order priority, all sort fields affected default to ascending order and you need to reselect any fields that you wish to appear in descending order.
More Information: Selecting the Data Fields (Report Columns) on page 20
Running an Analysis Report Once the analysis table has been produced, the following options are available:
Each cell can be shaded according to its value – the higher the number, the darker the shading.
The width of the columns can be changed on an individual basis, or collectively.
Where required, the Analysis window can be maximised to full screen to display the optimum number of rows and columns.
The fields listed in the rows and columns can be changed to alter what is being analysed. The fields available depend on how the report was designed. For example, the previously displayed analysis table could be changed to show the number of male and female pupil/students of each dietary need.
The type of value displayed in each cell can be altered. By default, totals are displayed, but this can be changed to percentages or averages.
The number of decimal places in the display can be changed to a maximum of four.
Data displayed can be copied and automatically presented in Excel for further manipulation/editing as required.
Formula can be applied to further analyse the data. By default, values are counted. Scores can be assigned to values in the analysis table in order to provide a score-based analysis. This can be useful for analysing gender balance for example.
NOTE: In order to maximise what can be analysed, careful consideration must be given to the report design (please see Defining Analysis Reports on page 47).
You may prefer to preview the report to check the content before proceeding.
1. Open the required report in Run mode. If the Allow choice of output at runtime option was selected when creating the report design, you are required to select the output type before the report can be run.
2. Select Analysis from the drop-down list adjacent to the Run button. 3. Click the Run button. 4. The report is generated and the Analysis window is displayed. You can
change the way the data is displayed with several screen controls available that enable you to adjust the display.

04| Defining and Running Analysis Reports
50 Designing and Running Reports
More Information: Using Scores and Formulae on page 51
Shading Analysis Report Data 1. Move the Shading slide bar to the right to increase the colour depth and aid
the visual impact of the data. 2. The larger the data value, the darker the shading becomes. Cells that
contain a zero value remain grey. On exiting the Analysis dialog, the shading resets to the default of pale grey in all cells.
Changing Column Widths 1. Move the Col width slide bar to the right to increase the column width. This
enables the full column title to be seen at the top of each column and enables large data fields to be accommodated clearly.
2. You can also size columns individually by positioning the cursor over a column border until the cursor changes to a double-headed arrow. Drag the border until the column is the required width.
Specifying the Number of Decimal Places Data can be shown as whole figures or with up to four decimal places, if necessary. Select the required number of decimal places from the Decimals drop-down list.
Changing the Data Displayed in the Rows and Columns By default, the second and third fields/columns from the report design become the rows and columns of the analysis table. Once the analysis window is displayed, it is possible to change the data displayed in both the rows and columns as required.

04| Defining and Running Analysis Reports
Designing and Running Reports 51
To change the selection of data displayed in the analysis table, select the required field from the Row or Column drop-down lists. These lists are populated with the field/column names included in the original report design.
Using Scores and Formulae Scores are values that can be given to any set of data items and are used to perform calculations. By default, all items have a score of 1, but they can be assigned different values by clicking the Edit Score Tables button and entering the required value. An example use of scores is the examination of gender balance within groups. To achieve this, a value of 1 could be assigned to the F gender while M is assigned the value of –1.
1. Select the Edit Score Tables button to display the Edit Score Tables dialog. The dialog displays the current row definition and values. However, to define score values for another row definition, select the required values from the Select Score Table drop-down list.
2. Click into each value box in turn and edit the values as required. 3. Click the Finish button to save your selection.
Once the score values have been defined, they can be used in the analysis table by entering the name of the data type followed by the word Score in the lower Formula field, e.g. GenderScore.
Defining Scores and Formulae 1. Select the Edit Score Tables button to display the Edit Score Tables
dialog. The dialog displays the current row definition and values. However, to define score values for another row definition, select the required values from the Select Score Table drop-down list.
2. Click into each value box in turn and edit the values as required. 3. Click the Finish button to save your selection.

04| Defining and Running Analysis Reports
52 Designing and Running Reports
4. Once the score values have been defined, they can be used in the analysis table by entering the name of the data type followed by the word Score in the lower Formula field, e.g. GenderScore.
Hiding and Showing Rows and Columns 1. Click the particular row or column heading and select Hide this
Row/Column from the pop-up menu. 2. To reveal a hidden row or column, right-click anywhere within the row or
column headings and select Show Hidden Rows/Columns from the pop-up menu.
3. To invert a row or column, right-click the particular row or column heading and select Invert Selection from the pop-up menu.
4. It is also possible to select multiple rows or columns to be hidden. This is achieved by right-clicking the space above a column heading or to the left of row heading.
5. The selected rows/columns are highlighted in turquoise. You can then right-click and select Hide Selected Columns from the pop-up menu.
Displaying Additional Information By clicking into a cell containing a data value, it is possible to display the Individual Details and Calculations dialog.
This dialog displays the details according to the first field/column in the report design. For instance, if Year Group was selected, the dialog shows which year group makes up the value in the cell.
Merging Rows and Columns It is possible to merge two or more rows together to combine the analysis data. For example, you may wish to combine the values in the School Meals and Sandwiches rows to see the number of pupil/students in each Registration Group who stay at school during lunch time.

04| Defining and Running Analysis Reports
Designing and Running Reports 53
1. Drag the row heading onto the row to be merged. 2. The contents of the headings are merged and the values totalled. Columns
can be merged in the same way. 3. To unmerge a row or column, right-click the merged row/column and select
Unmerge this Row/Column from the pop-up menu. 4. It is also possible to select multiple rows or columns to be merged. This is
achieved by right-clicking the space above a column heading or to the left of a row heading. The selected rows/columns are highlighted in turquoise. You can then right-click and select Merge Selected Columns from the pop-up menu.
Changing the Calculation Method There are various methods available to change the way the analysis data is calculated. Once an analysis report has been created, the Calculate method can be changed at any time to give a different interpretation of the returned data.
To display the total value for both the rows and columns, select Total from the Calculate drop-down list.
To display the mean value for both the rows and columns, select Average from the Calculate drop-down list.
To display the percentage value for both the rows and columns, select % Population from the Calculate drop-down list.
Copying an Analysis Report to Excel This facility enables you to transfer the analysis report that has been created straight into Excel. Click the Copy to Excel button to launch Excel and copy the entire report into an Excel spreadsheet. The report title, the row and column definitions and the method used to calculate the values are all copied.
More Information: Defining Word List Reports on page 30 Editing an Existing Word List Template on page 32

04| Defining and Running Analysis Reports
54 Designing and Running Reports

05| Running Reports with an Effective Date
Designing and Running Reports 55
05|Running Reports with an Effective Date
Introduction ................................................................................... 55 Running Reports with an Effective Date ......................................... 55 Designing Reports with an Effective Date ...................................... 57
Introduction The facility to specify the Effective Date has been provided, primarily for the following reports:
Registration Group Report (Dated) Registration Group Report (Dated with Columns) Registration Group Report (Dated DOB sort)
Registration Group Report (Dated Gender Sort).
Running Reports with an Effective Date When selecting any of the four Registration Group reports, you can specify an Effective Date when the other Run Time Parameters are specified.

05| Running Reports with an Effective Date
56 Designing and Running Reports
NOTE: The default option is to Bypass effective date (Use Today). This check box is always selected until you specify otherwise. To Supply Effective Date, you must ensure that you deselect this check box before the Calendar button becomes active.
Specifying the Effective Date The Calendar date defaults to today’s date unless otherwise specified. It can be changed as follows:
Click the Calendar button to display the current month with today’s date highlighted.
Click the Forward or Back arrows to change the month as required, then click the specific date. Alternatively, click the month displayed to select a different month from the drop-down list.
Click the Year to display up and down arrows, enabling you to move between other years as necessary.
The date you have selected now appears in the relevant date fields.
Entering Parameter Values Specify the Year Group(s) that you want to report on by selecting the relevant check boxes. Alternatively, click the Select All button to report on all the Year Groups in your school. If you make a mistake, click the Clear All button and begin your selections again.
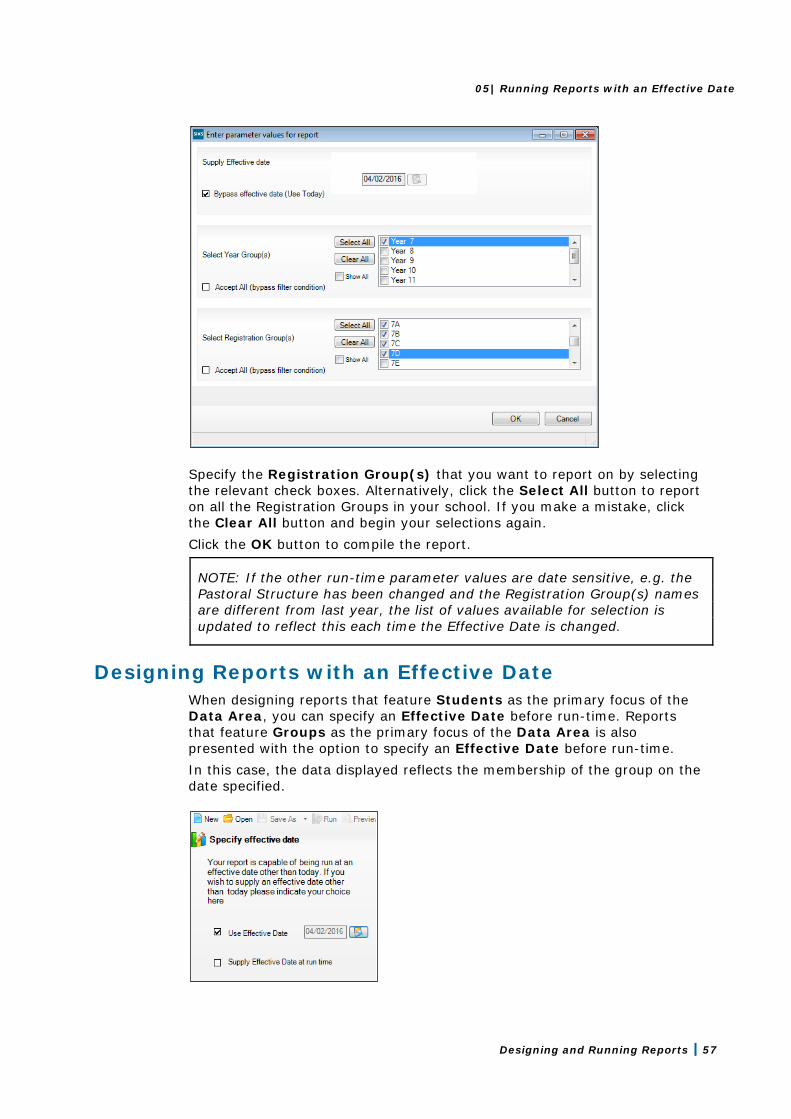
05| Running Reports with an Effective Date
Designing and Running Reports 57
Specify the Registration Group(s) that you want to report on by selecting the relevant check boxes. Alternatively, click the Select All button to report on all the Registration Groups in your school. If you make a mistake, click the Clear All button and begin your selections again. Click the OK button to compile the report.
NOTE: If the other run-time parameter values are date sensitive, e.g. the Pastoral Structure has been changed and the Registration Group(s) names are different from last year, the list of values available for selection is updated to reflect this each time the Effective Date is changed.
Designing Reports with an Effective Date When designing reports that feature Students as the primary focus of the Data Area, you can specify an Effective Date before run-time. Reports that feature Groups as the primary focus of the Data Area is also presented with the option to specify an Effective Date before run-time. In this case, the data displayed reflects the membership of the group on the date specified.

05| Running Reports with an Effective Date
58 Designing and Running Reports
If any other reports that you design can be used with an Effective Date, the system detects this and offers you the option of specifying one. Reports that are created using an Effective Date should not take any longer to compile than reports without an Effective Date. Select the Use Effective Date check box to activate the Calendar button and specify the date you require. Alternatively, select the Supply Effective Date at run-time check box and continue designing your report until you have decided which date to base the report on. If you select this check box, the Enter Parameter values for report dialog is displayed. You may decide at run-time that you do not want to specify an Effective Date. If this is the case, select the Bypass effective date (Use Today) check box before clicking the OK button to compile the report.

05| Running Reports with an Effective Date
Designing and Running Reports 59
The Effective Date can also be accessed from the Report Summary at the bottom of the Report Design page prior to printing or previewing your report. Click the effective on: hyperlink to return to the Specify Effective Date panel and select the required date.
Select the report output and continue as usual with printing or previewing your report.

05| Running Reports with an Effective Date
60 Designing and Running Reports

06| Predefined Reports
Designing and Running Reports 61
06|Predefined Reports
Introduction ................................................................................... 61 Importing Predefined Reports ....................................................... 62 Viewing a Predefined Report .......................................................... 64
Introduction A large selection of comprehensive predefined reports has been provided for use with this release of Reporting. These have been designed to minimise time spent on administration within the school and to enable users who have no need to design their own specific reports, to access varied and useful information. Before creating or running a report designed by another user, it is a good idea to import the selection of predefined reports that have been provided for use with this version of the Reporting tool. This gives you an idea of the reports that are already available and the data fields that they contain and should make designing your own reports far easier for first time users. Where appropriate, you are given the option to import any documents associated with the report. These include Word templates and merged documents that define the design of the resulting report. Once imported, these templates are stored, along with the actual report, on the Document Management Server. You can elect not to import these templates/merge documents, but you must ensure that a suitable alternative template and/or merge document is available in order to ensure the report is produced correctly. Predefined report catalogues are available for download from the My Account website (https://myaccount.capita-cs.co.uk). Search for REPCAT.
The catalogues list all the predefined reports that are currently available together with the location, description, run-time parameters, sort order and output type for each report. There is also a sample of each predefined report that we provide. The catalogues are updated as reports are added, amended or removed.
Label Generation In this release of Reporting, a number of label templates have been included with the predefined reports. These can be imported in exactly the same way as the other predefined reports, if required.

06| Predefined Reports
62 Designing and Running Reports
Importing Predefined Reports 1. Select Reports | Import to display the Import reports and associated
templates from an archive dialog. Alternatively, if you are using the Report Designer (Reports | Design Report), select the Import a report option from the Welcome screen.
2. Locate the predefined report(s) by navigating to their stored location. The folder containing these predefined reports can usually be found in the C:\Program Files\SIMS\SIMS .net folder and is named according to the latest version of SIMS, e.g. PreDefined_Reports_v7174.RptDef.

06| Predefined Reports
Designing and Running Reports 63
3. Click the Open button to return to the Select report file to import dialog. The file name and location you have specified are displayed in the Archive file field.
4. Where the specified file contains more than one report, you have the option to import selected reports only. If you do not wish to import a report, deselect the check box adjacent to the description.
NOTE: If you are re-importing a report that already exists on your system, the existing report is overwritten and, therefore, any changes are lost.
5. If you do not wish to import the associated templates (e.g. Word templates), deselect the Import associated templates check box.
6. To Overwrite existing report definitions, select the associated check box.
7. Click the Import button. The status of the imported report(s) change(s) to Imported.
8. Click the Close button to complete the process and close the dialog. All reports are stored on the Document Management Server. Imported reports are automatically stored in the appropriate Focus folder (e.g. Student, Staff, Class, etc.) but can be copied to other folders if required (provided you have sufficient permissions). However, you are not able to copy any of the imported predefined reports to your My Reports folder, as you did not create them.
NOTE: The availability of reports depends on the permissions assigned to you and whether report designs have been made public. Permissions can also be applied to specific data fields and it is therefore possible that some reports can be produced, but may have some blank columns.

06| Predefined Reports
64 Designing and Running Reports
Viewing a Predefined Report Once you have successfully imported a selection of the predefined reports, you need to log out of SIMS and log back in again before the newly imported reports are available for use.
1. Select Reports | Run Report to display the navigation tree.
2. Expand the Focus folder to view all the different report folders.
In some cases, you are prompted to enter or select run-time parameters when running a report. These parameters are used to restrict the records returned in the resulting report. You may, for example, be prompted to select the Year Group on which the report should be based.
3. Double-click a report definition of your choice to display the Enter parameter values for report dialog. This dialog looks slightly different from one report to another, due to the variety of data fields that are contained within each report.
4. Select any of the check boxes displayed or click the Select All button to select all of the check boxes in each panel of the dialog.
5. Click the OK button to produce the report.

06| Predefined Reports
Designing and Running Reports 65
6. The report can now be viewed or printed.

06| Predefined Reports
66 Designing and Running Reports

07| Report Storage Management
Designing and Running Reports 67
07|Report Storage Management
Introduction ................................................................................... 67 Managing Report Categories .......................................................... 68 Saving Report Designs ................................................................... 71 Making Reports Public ................................................................... 72 Exporting Reports .......................................................................... 73 Changing Ownership of a Report .................................................... 73
Introduction The Document Management Server is used to manage the storage of reports, templates, data required selections and report criteria conditions. These are collectively referred to as saved items. The Document Management Server contains the following main default folders:
My Reports\Templates is used to store all saved items created by you.
Favourites is used to store any publicly available saved items or saved items that you copy there.
Focus contains sub-folders for Student, Staff, Class, Aspect, Contact, etc. These folders are used to store any publicly available items.
Category is initially empty but users with appropriate permissions can create Report Categories which generate category sub-folders. You may for example, create Report Categories for each department within your establishment, e.g. Science, Maths, English, etc.
Owner contains sub-folders of all available report owners, which contain all the reports assigned to that owner. With the required permissions, it is possible to re-assign the ownership of a report from one person to another, by dragging the report(s) into the required owner's folder.

07| Report Storage Management
68 Designing and Running Reports
When saving a report, a copy is automatically stored in the My Reports folder and is only available for editing by you, its creator.
However, it is possible for the report to be made Public at the time of saving, if required. Making a report public, places a copy in the appropriate Focus folder and users with appropriate permissions can then open and edit your original report but must then save the report with a different name. If the report was saved as private, it can subsequently be made public by copying it to the appropriate Focus or Category folder.
Making a report public also enables other users with appropriate permissions to run reports that you have created and saved as public.
Managing Report Categories Creating a Report Category generates a folder within the Category folder of the Reports browser. Once created, you can save to, or open files from, any Report Category folder.
1. Select Reports | Export to display the Select reports to export browser or open an existing report via the Report Designer (Reports | Design Report).

07| Report Storage Management
Designing and Running Reports 69
2. Click the Tools button and select Category to display the Report Category dialog.
Adding a Category 1. Click the New button or right-click anywhere in the Description panel and
select Add from the pop-up menu to display the Category name dialog.
2. Enter a name for the new category up to a maximum of 40 alphanumeric characters (including symbols).

07| Report Storage Management
70 Designing and Running Reports
3. Click the OK button to return to the Report Category dialog.
4. Click the OK button to save the Category.
Editing an Existing Category 1. Click the Category name, then click the Edit button.
Alternatively, double-click the required Category name, or right-click the name and select Edit from the pop-up menu to display the Category name dialog.
2. Edit the category name as required (maximum of 40 alpha/numeric characters, including symbols).
3. Click the OK button to return to the Report Category dialog. 4. Click the OK button to save your changes.
Deleting a Category Only a link to the report is stored in the Report Category folder and it is therefore possible to delete a Report Category without deleting the reports themselves.
1. Highlight the category name and click the Delete button or press the Delete key. Alternatively, right-click the name and select Delete from the pop-up menu.
WARNING: The Category is deleted immediately. If a Category is deleted in error, click the Cancel button to restore.
2. Click the OK button to save your changes.

07| Report Storage Management
Designing and Running Reports 71
Activating/Deactivating Report Categories Activating Report Categories ensures that they are displayed as sub-folders in the main Category folder. Newly created categories are activated by default. The check box adjacent to a Report Category name indicates whether the category is active. Select the check box to activate a category and deselect the check box to deactivate the category. You are not be able to see any deactivated Report Categories.
Saving Report Designs Saved reports are stored by default on the Document Management Server. They are only available for viewing and editing by yourself, unless they are made Public (available to other users with appropriate permissions) at the point of saving, by ensuring that the Private check box is deselected. Alternatively, you can make existing reports Public by copying them to the appropriate Public folder, e.g. Focus or Category.
1. Click the Save As button on the Report Designer toolbar to display the Save Report as dialog. Alternatively, click Save my report in the Report Complete panel.
2. Enter a name for the report. This can be up to 40 alphanumeric characters (including symbols). If you wish to make the report Public (available to others with appropriate permissions), deselect the Private check box. This automatically stores a copy of the report in the appropriate Focus folder which can then be accessed by users with suitable permissions. If you choose not to do this now, you can subsequently make a report public by copying it to the Focus folder or the appropriate Category folder.
3. Click the OK button to save the report to the Document Management Server.
4. To overwrite the saved report, click the Save button.
NOTE: Check that the Report Categories are marked as active if you wish them to be visible.

07| Report Storage Management
72 Designing and Running Reports
Making Reports Public By default, all reports are stored in your My Reports folder and only you can edit or run them. You can make a report Public when saving by ensuring the Private check box is not selected. This saves a copy of the report into the appropriate Focus folder.
For example, you have designed a report using the Students Focus and wish to make the report Public. When you save, deselect the Private check box and a copy of the report is then be saved in both the My Reports and Students focus folder.
Alternatively, you can copy the report to a Public folder after the report is saved. The following are classed as Public folders: Focus folders, Category folders and their respective sub-folders.
NOTE: Individual users must activate specific report Categories for them to be visible. Therefore, if you save a report to a specific report Category folder, only those users who have activated that Category can see your report via the Category main folder.
Deleting Saved Reports and Report Criteria It is possible to delete reports that you have created. With the required permissions, you can delete the reports of others. The master copy of each item is stored in your My Reports folder. You must delete the item from this folder if you wish to permanently delete it. Deleting a report from any other folder simply prevents that item from being accessed from that location. Select Reports | Design Report to display the Report Designer.
Deleting a Report 1. Click Open an existing report to display the Open Report (report
browser) dialog. 2. Navigate to the required report. 3. Highlight the report name then press the Delete key. A confirmation dialog
is displayed. Click the OK button to complete the process. Alternatively, right-click the report name and select the Delete button.
Deleting a Report Template 1. From the Define presentations panel, select Word List Report. The
associated Word list report settings are displayed in the right-hand screen. 2. Select the User-defined template radio button to display the Select a
base template dialog. 3. Navigate to the template to be deleted. 4. Highlight the template name and press the Delete key. A confirmation
dialog is displayed. Click the Yes button to complete the process.
NOTE: The Standardlandscape.dot and Standardportrait.dot templates are read-only and cannot be deleted.
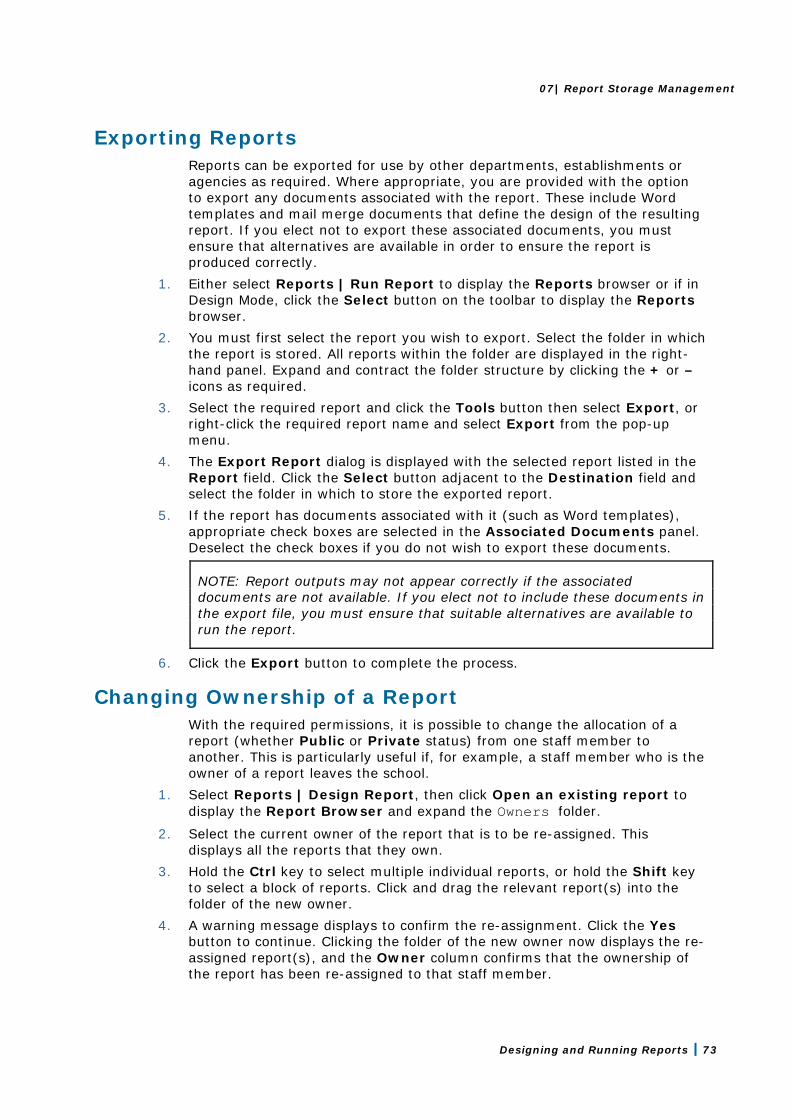
07| Report Storage Management
Designing and Running Reports 73
Exporting Reports Reports can be exported for use by other departments, establishments or agencies as required. Where appropriate, you are provided with the option to export any documents associated with the report. These include Word templates and mail merge documents that define the design of the resulting report. If you elect not to export these associated documents, you must ensure that alternatives are available in order to ensure the report is produced correctly.
1. Either select Reports | Run Report to display the Reports browser or if in Design Mode, click the Select button on the toolbar to display the Reports browser.
2. You must first select the report you wish to export. Select the folder in which the report is stored. All reports within the folder are displayed in the right-hand panel. Expand and contract the folder structure by clicking the + or – icons as required.
3. Select the required report and click the Tools button then select Export, or right-click the required report name and select Export from the pop-up menu.
4. The Export Report dialog is displayed with the selected report listed in the Report field. Click the Select button adjacent to the Destination field and select the folder in which to store the exported report.
5. If the report has documents associated with it (such as Word templates), appropriate check boxes are selected in the Associated Documents panel. Deselect the check boxes if you do not wish to export these documents.
NOTE: Report outputs may not appear correctly if the associated documents are not available. If you elect not to include these documents in the export file, you must ensure that suitable alternatives are available to run the report.
6. Click the Export button to complete the process.
Changing Ownership of a Report With the required permissions, it is possible to change the allocation of a report (whether Public or Private status) from one staff member to another. This is particularly useful if, for example, a staff member who is the owner of a report leaves the school.
1. Select Reports | Design Report, then click Open an existing report to display the Report Browser and expand the Owners folder.
2. Select the current owner of the report that is to be re-assigned. This displays all the reports that they own.
3. Hold the Ctrl key to select multiple individual reports, or hold the Shift key to select a block of reports. Click and drag the relevant report(s) into the folder of the new owner.
4. A warning message displays to confirm the re-assignment. Click the Yes button to continue. Clicking the folder of the new owner now displays the re-assigned report(s), and the Owner column confirms that the ownership of the report has been re-assigned to that staff member.

07| Report Storage Management
74 Designing and Running Reports

08| Running Scheduled Reports
Designing and Running Reports 75
08|Running Scheduled Reports
Introduction ................................................................................... 75 Setting up the Report Scheduler .................................................... 75 Selecting Reports for Scheduling ................................................... 81 Viewing Errors in the Schedule ...................................................... 85
Introduction Many members of staff within a school perform a variety of regular tasks and they require the ability to manage these tasks effectively within SIMS. Staff can now set up an automated scheduler to run selected reports for them. The details of these reports can be viewed from the My Scheduled Reports panel on their personal Home Page.
Setting up the Report Scheduler It is recommended that users most frequently responsible for setting up the scheduling of AutoReports, should have access rights for the entire domain area of SIMS to enable them to view the detail.
Permissions Required Any valid SIMS user can setup a scheduled task using the AutoReports.exe. However, for running any scheduled reports, permissions for the following processes in SIMS are required:
Designing or Running a Report - users must have sufficient access rights to design or run the existing report.
Execute Scheduled Report - users must have sufficient access rights to execute the scheduled report. a. The execute scheduled task permission can be checked via Focus |
System Manager | Manage Users. b. Search for then double-click the name of the applicable user to
display the User Details page. c. In the Permissions panel, navigate to Core, Home Page, Report
Execution Manager, Execute Scheduled Report, Execute. Document Management Server - users must have sufficient rights to
access the Document Management Server (DMS), to ensure that it is configured and running correctly. This permission is also required for running the report definitions and for storing the report outcomes on the Document Management Server.
Users of SIMS can now specify the names of individual reports that they want to be run automatically, at any time during the day and during off peak times for example, overnight. The benefit of running the reports at off peak times enables system administrators to minimise any potential performance issues that may otherwise be experienced by users.

08| Running Scheduled Reports
76 Designing and Running Reports
To enable users to benefit from the automatic running of reports, system administrators must first specify an automated task using the Windows® Scheduled Task wizard.
Creating a Scheduled Task - Windows 7 The automated task should be set up on the SIMS SQL server machine where the SIMS database is held. The task only runs successfully if the Document Management Server and the SIMS SQL server machine are both available. Once the automated task has been set up, individual users can specify which reports they want to run automatically on their PCs.
1. Ensure that you have logged into Windows as an administrator. 2. Click the Windows Start button to display the Start menu. 3. Select All Programs | Accessories | System Tools | Task Scheduler to
display the Task Scheduler page. Alternatively, click Control Panel then System and Security. If administrator rights have been set up you may be required to enter a Password.
4. Select Action | Create Basic Task to display the Create Basic Task Wizard. Alternatively, select Create Basic Task from the Actions panel.
5. Enter a suitable Name, e.g. AutoReports, and a Description (optional) for the scheduled task.

08| Running Scheduled Reports
Designing and Running Reports 77
6. Click the Next button to display the Task Trigger page.
7. Select the appropriate radio button to indicate when you require the task to start. Depending on the number of reports to be run, selecting the Daily option is most likely to provide a satisfactory result.

08| Running Scheduled Reports
78 Designing and Running Reports
NOTE: Before setting up the Windows Scheduled Task, system administrators may wish to canvass the opinion of senior users to ensure that the frequency of the task is sufficient for their purposes. For example, the frequency of the reports scheduled to run automatically in SIMS must be set to run Daily if the Windows Scheduled Task has been set to run on a Daily basis.
8. Click the Next button to display the Daily page.
9. Specify the day, month, year and time that the task is required to Start. 10. Enter the frequency of days that you wish the scheduled task to run in the
Recur every: [number] days field. 11. Click the Next button to display the Action page.

08| Running Scheduled Reports
Designing and Running Reports 79
12. Ensure that the Start a program radio button is selected. 13. Click the Next button to display the Start a Program page.
14. Click the Browse button and navigate to C:\Program Files\Microsoft SQL Server\MSSQL$SIMS\Binn (where C: is the network drive where SIMS is installed). For guidance on navigating to files on your local workstation when you are working in a Hosted environment, please contact your System Manager or local Support.

08| Running Scheduled Reports
80 Designing and Running Reports
15. Highlight the applicable scheduled task filename, e.g. AutoReports.exe then click the Open button to return to the Start a program page.
16. Enter the following text in the Add arguments (optional) field: “S:<servername>\<SQLinstance>◊/D:<database>◊/U:<simsuser>◊P:<Password>”
or for Trusted authentication: /S:<servername>/<SQLinstance>◊/D:<database>◊/T
IMPORTANT NOTES: It is essential that spaces are included, as indicated by the '◊' symbol in the previous examples. Archiving parameters are case sensitive.

08| Running Scheduled Reports
Designing and Running Reports 81
17. Click the Next button to display the Summary page.
18. Click the Finish button to return to the Task Scheduler page where the newly created scheduled task is displayed in the Active Tasks panel.
Selecting Reports for Scheduling 1. Click Focus | Alerts | Schedule Reports to display the My Reports
Setup dialog. Any existing reports that have already been scheduled are displayed in the My Schedule Reports panel. The Report Name, Frequency, Date/Day, Start Date, End Date, Previous Output, Skip Holidays indicator and the Recipient Name are all listed.

08| Running Scheduled Reports
82 Designing and Running Reports
It is possible to amend any or all of the current scheduled report details from this dialog.
NOTE: Users must ensure that reports are scheduled in line with the Windows Scheduled Task that has been set up. For example, selecting the Frequency of the reports in SIMS to run on a Daily basis is not very beneficial if the Windows Scheduled Task has been set up to run on a Weekly basis.
Changing the Frequency Identify the required report, click into the Frequency field and select an alternative frequency from the drop-down list.
Changing the Date/Day Identify the required report, click into the Date/Day field and overtype the current number. As Monthly is the last option in the Frequency field, the maximum number entered in the date/day field cannot exceed 31.
Changing the Start Date/End Date Identify the required report, click into the Start Date or the End Date field and click the drop-down arrow to display the Calendar. Select an alternative date. The End Date selected must be greater than the Start Date.
Changing the Previous Output Identify the required report, click into the Previous Output field and select either Leave or Delete from the drop-down list.
Changing the Skip Holidays Indicator Identify the required report, click into the Skip Holidays field and either select or de-select the check box.
Changing the Recipient Name Identify the required report and click the Choose Recipient button to display the Select Person dialog.
2. Enter the individual’s Surname and/or Forename, or select their Role from the drop-down list.

08| Running Scheduled Reports
Designing and Running Reports 83
3. Click the Search button to list all individuals who match the search criteria you have entered.
4. Highlight the required person from the list displayed and click the OK button to select them. It is also possible to delete any previously scheduled report details from this dialog. Highlight the relevant report and click the Delete button to remove it from the schedule.
5. Click the New Report button to display the Please choose report for scheduling dialog.
6. In the left-hand side of the dialog, a list of all the existing report focus folders is displayed. Expand the list until you locate the required report definition.
7. Highlight the required report definition and click the OK button to add it to the schedule. Some reports require the entry of report parameters to be specified before they can be added to the report schedule.

08| Running Scheduled Reports
84 Designing and Running Reports
In this case, the Enter Parameter Values for Report dialog is displayed.
When a report is designed, it is possible to apply various criteria to limit the records returned. For example, a report could be limited to all the pupil/students in a particular year. To provide greater flexibility, it is also possible to enter values for these criteria when a report is run. You could for example, be prompted to select the Years that you wish to be included in the report. This enables you to run the same report, selecting a different year each time. If a report has been set up in this way, when prompted to enter Run Time Parameters, you enter values, such as Surnames, choose existing values by selecting appropriate check boxes or specify a required date. Users can refine the report using the Show All filter. This option is available when defining the run-time parameters and when designing a new report and specifying a new filter. The Show All filter is switched off by default, thus ensuring that only active groups are displayed for selection. Clicking in the Show All filter check box displays all groups, both active and inactive. For example, Year Groups and Registration Groups that are no longer in use and have been removed from the Pastoral Structure can be selected and included in the report.
8. Click the OK button to continue.

08| Running Scheduled Reports
Designing and Running Reports 85
9. The Recipient Name defaults to the name of the user currently signed on to SIMS. Click the Choose Recipient button to display the Select Person dialog and identify an alternative recipient for the report output, if required.
10. Enter the individual’s Surname and/or Forename, or select their Role from the drop-down list.
11. Click the Search button to list all individuals who match the search criteria you have entered.
12. Highlight the required person from the list displayed and click the OK button to select them.
13. Continue scheduling reports in this way until all the required reports are listed in the My Reports Setup dialog.
14. Click the OK button to close the dialog.
Viewing Errors in the Schedule If users experience problems with the AutoReports scheduled task that they have set up, we recommend accessing the Event Viewer through Start | Control Panel | Administrative Tools | Event Viewer to check for errors.

08| Running Scheduled Reports
86 Designing and Running Reports

I| Index
Designing and Running Reports 87
Index A activating/de-activating
report categories .............................. 71 adding
records to preview mode ..................... 9 report categories .............................. 69
alerts scheduling reports ............................ 81
analysis reports defining .......................................... 47
AND clauses adding ............................................ 27 deleting .......................................... 28
AND/OR clauses adding ............................................ 28 deleting .......................................... 28
C changing
preview mode view ........................... 10 preview sort order .............................. 9
clauses defining .......................................... 24 deleting .......................................... 28
conditions selecting ......................................... 25
criteria conditions ................................ 44
D data area
selecting ......................................... 19 data fields
selecting ......................................... 20 defining
analysis reports ................................ 47 clauses ........................................... 24 Excel reports ................................... 39 filter conditions ................................ 25 form reports .................................... 34
groups of Excel reports ...................... 41 mail merge reports ........................... 32 report sort order ............................... 29 text reports ..................................... 42 web page (HTML) reports ................... 41 Word list reports ............................... 30 Word list template ............................ 14
deleting clauses ............................................ 28 mail merge reports ........................... 34 report categories .............................. 70 report templates ............................... 72 reports ............................................ 72
designing reports adding an AND clause ........................ 27 adding an OR clause.......................... 28 adding combinations of AND/OR
clauses ......................................... 28 applying filter conditions .................... 24 conditions ........................................ 25 creating a new report ........................ 19 data fields ....................................... 20 data required ................................... 20 defining Excel reports ........................ 39 defining form reports......................... 34 defining text reports .......................... 42 defining the sort order ....................... 29 defining web page (HTML) reports ....... 41 defining Word lists ............................ 30 defining Word mail merge reports ....... 32 deleting clauses ................................ 28 existing filter conditions
modifying ..................................... 26 filters .............................................. 24 report presentation ........................... 30 setting up a group of list reports for
excel ............................................ 41 sort order ........................................ 29 sub reports (related fields) ................. 23
duplicates suppressing ..................................... 32
I| Index
88 Designing and Running Reports
E editing
mail merge document ....................... 34 report categories .............................. 70
Excel reports defining .......................................... 39
excluded records ................................. 10 excluding records from a report
preview ........................................... 10 existing reports
editing a report design ...................... 43 exporting
reports ............................................ 73 templates ........................................ 73
F filter conditions
defining .......................................... 25 filters
applying .......................................... 24 form reports
defining .......................................... 34
G groups of excel reports
defining .......................................... 41
I importing
pre-defined reports ........................... 62 included records .................................. 10 including records in a report preview ...... 10 information domain permissions .............. 3
M mail merge documents
editing ............................................ 34 mail merge reports
defining .......................................... 32 deleting .......................................... 34
making reports public .......................... 72 managing
report categories .............................. 68
O opening existing reports ....................... 11 OR clauses
adding ............................................ 28
P permissions
information domain ............................. 3 pre-defined
reports ............................................ 61 pre-defined reports
importing ........................................ 62 preview
changing sort order ............................. 9 preview mode ....................................... 6
changing the view ............................. 10 removing records .............................. 10 toggling records ............................... 11
previewing reports adding records ................................... 9 changing sort order ............................. 9
public reports ...................................... 72
R records
excluded ......................................... 10 included .......................................... 10 toggling in preview mode ................... 11
related fields including ......................................... 23
removing records from a report preview ............ 10
report changing ownership .......................... 73 output type
selecting ....................................... 11 report categories
activating/de-activating ..................... 71 adding ............................................ 69 deleting ........................................... 70

I| Index
Designing and Running Reports 89
editing ............................................ 70 managing ........................................ 68
report columns selecting ......................................... 20
report design editing an existing one ...................... 43
report filter conditions applying .......................................... 24
report presentation defining .......................................... 30 selecting ......................................... 30
report preview changing sort order ............................ 9
report rows selecting ......................................... 19
report templates deleting .......................................... 72
reports creating new .................................... 19 criteria conditions ............................. 44 deleting .......................................... 72 exporting ........................................ 73 making public .................................. 72 opening existing ............................... 11 pre-defined ...................................... 61 RTF ................................................ 14 running
existing ........................................ 11 in Excel ........................................ 12 text reports .................................. 15 web page (HTML) .......................... 16 Word form report ........................... 14 Word list ...................................... 13
saving ............................................. 71 scheduling
alerts ........................................... 81 text ................................................ 15
csv .............................................. 15 no schema .................................... 15 tab separated ................................ 15 with schema ................................. 15
web page (HTML) ............................. 16 re-usable templates ............................. 32 running
Excel report ..................................... 12 existing reports ................................ 11 text reports ..................................... 15 web page report (HTML) .................... 16 Word form report .............................. 14 Word list report ................................ 13
running reports Excel .............................................. 12 RTF ................................................ 14 text ................................................ 15 web page (HTML) ............................. 16 Word list ......................................... 13
run-time parameters specifying run-time ...................... 56, 81
S saving
reports ............................................ 71 scheduling
alerts reports ......................................... 81
selecting report output type ............................ 11
sort order defining ........................................... 29
specifying run-time parameters .................... 56, 81
sub-reports related fields .................................... 23
suppressing duplicates ......................... 32
T templates
exporting ......................................... 73 re-usable ......................................... 32
text reports defining ........................................... 42

I| Index
90 Designing and Running Reports
W web page (HTML)
defining .......................................... 41 Word list template
defining .......................................... 14 Word lists
defining .......................................... 30