Uncertainty and reliability analysis applied to slope stability
16
ORIGINAL PAPER Uncertainty and Reliability Analysis Applied to Slope Stability: A Case Study From Sungun Copper Mine Mohsen Abbaszadeh • Kourosh Shahriar • Mostafa Sharifzadeh • Mehrdad Heydari Received: 5 September 2007 / Accepted: 20 April 2011 / Published online: 6 May 2011 Ó Springer Science+Business Media B.V. 2011 Abstract Nowadays, there are many new methods for slope stability analysis; including probabilistic methods assessing geotechnical uncertainties to develop safety factors. In this paper, a reliability index analysis for the Sungun copper mine slope stability is evaluated based on three methods of uncertainties consisting Taylor series method, Rosenblueth point estimate method and Monte-Carlo simulation method. Sungun copper mine will be one of the Iran’s biggest mines with final pit’s height of 700 meters. For this study two of its main slopes were assessed, one dipping to the NE (030) and the other to the SE (140). Probability density function of cohesion and angle of friction for the slopes were developed using limit equilibrium methods. These shear strengths were then used to determine the probability density function of safety factor and reliability index using the probabilistic methods. Results of the probabilistic analysis indicate that with ascending values of the uncertainties the reliability index decreases. Furthermore, it was determined that with the Monte Carlo simulation the seed number used has little effect on the reliability index of the safety factor especially with seed numbers in excess of 1200. Variations in the overall reliability index of safety factor were observed between the two slopes and this difference is explained by the differences in com- plexities of the geology within the cross-section. Keywords Slope stability Factor of safety Reliability index Monte Carlo simulation Sungun copper mine 1 Introduction In geotechnical engineering analysis and design, various sources of uncertainties are encountered and well recognized. Several features usually contribute to such uncertainties, like:(1) those associated with inherent randomness of natural processes;(2) model uncertainty reflecting the inability of the simulation model, design technique or empirical formula to represent the system’s true physical behavior, such as calculating the safety factor of slopes using limiting equilibrium methods of slices;(3) model parameter uncertainties resulting from inability to quantify accurately the model input parameters and (4) data uncertainties including (a) measurements errors, (b) data inconsistency and non-homogeneity and (c) data handling. In slope stability analysis, various sources of uncertainties are encountered, such as geological details missing in the exploration program, The paper is Dedicated to Ali Sharifzadeh who lost his life in a tragic car accident during the preparation of this research work. M. Abbaszadeh K. Shahriar M. Sharifzadeh (&) M. Heydari Department of Mining, Metallurgy and Petroleum Engineering, Amirkabir University of Technology, Hafez 424, 15875-4413 Tehran, Iran e-mail: [email protected] 123 Geotech Geol Eng (2011) 29:581–596 DOI 10.1007/s10706-011-9405-1
-
Upload
independent -
Category
Documents
-
view
8 -
download
0
Transcript of Uncertainty and reliability analysis applied to slope stability
ORIGINAL PAPER
Uncertainty and Reliability Analysis Applied to SlopeStability: A Case Study From Sungun Copper Mine
Mohsen Abbaszadeh • Kourosh Shahriar •
Mostafa Sharifzadeh • Mehrdad Heydari
Received: 5 September 2007 / Accepted: 20 April 2011 / Published online: 6 May 2011
� Springer Science+Business Media B.V. 2011
Abstract Nowadays, there are many new methods
for slope stability analysis; including probabilistic
methods assessing geotechnical uncertainties to
develop safety factors. In this paper, a reliability
index analysis for the Sungun copper mine slope
stability is evaluated based on three methods of
uncertainties consisting Taylor series method,
Rosenblueth point estimate method and Monte-Carlo
simulation method. Sungun copper mine will be one
of the Iran’s biggest mines with final pit’s height of
700 meters. For this study two of its main slopes were
assessed, one dipping to the NE (030) and the other to
the SE (140). Probability density function of cohesion
and angle of friction for the slopes were developed
using limit equilibrium methods. These shear
strengths were then used to determine the probability
density function of safety factor and reliability index
using the probabilistic methods. Results of the
probabilistic analysis indicate that with ascending
values of the uncertainties the reliability index
decreases. Furthermore, it was determined that with
the Monte Carlo simulation the seed number used has
little effect on the reliability index of the safety factor
especially with seed numbers in excess of 1200.
Variations in the overall reliability index of safety
factor were observed between the two slopes and this
difference is explained by the differences in com-
plexities of the geology within the cross-section.
Keywords Slope stability � Factor of safety �Reliability index � Monte Carlo simulation �Sungun copper mine
1 Introduction
In geotechnical engineering analysis and design,
various sources of uncertainties are encountered and
well recognized. Several features usually contribute
to such uncertainties, like:(1) those associated with
inherent randomness of natural processes;(2) model
uncertainty reflecting the inability of the simulation
model, design technique or empirical formula to
represent the system’s true physical behavior, such as
calculating the safety factor of slopes using limiting
equilibrium methods of slices;(3) model parameter
uncertainties resulting from inability to quantify
accurately the model input parameters and (4) data
uncertainties including (a) measurements errors,
(b) data inconsistency and non-homogeneity and
(c) data handling. In slope stability analysis, various
sources of uncertainties are encountered, such as
geological details missing in the exploration program,
The paper is Dedicated to Ali Sharifzadeh who lost his life in a
tragic car accident during the preparation of this research work.
M. Abbaszadeh � K. Shahriar � M. Sharifzadeh (&) �M. Heydari
Department of Mining, Metallurgy and Petroleum
Engineering, Amirkabir University of Technology,
Hafez 424, 15875-4413 Tehran, Iran
e-mail: [email protected]
123
Geotech Geol Eng (2011) 29:581–596
DOI 10.1007/s10706-011-9405-1
estimation of rock mass properties that are difficult to
quantify, fluctuation in pore water pressure, testing
errors and many other relevant factors.
In a deterministic analysis, the factor of safety is
defined as the ratio of resisting to driving forces on a
potential sliding surface. The slope is considered safe
only if the calculated safety of factor clearly exceeds
unity. Probability theory and reliability analyses
provide a rational framework for dealing with
uncertainties and decision making under uncertainty.
Depending on the level of sophistication, the analyses
provide one or more of the following outputs:
• Probability of failure (or probability of unsatis-
factory performance)
• Reliability index
• The most probable combination of parameters
leading to failure
• Sensitivity of result to any change in parameters
In his review of slope stability assessment methods,
Duncan (2000) pointed out that: ‘‘Through regulation
or tradition, the same value of safety factor is often
applied to conditions that involve widely varying
degrees of uncertainty. This is not logical.’’
Whereas, in a probabilistic framework the factor of
safety is expressed in terms of its mean value as well
as its variance. Reliability analysis is therefore used
to assess uncertainties in engineering variables such
as factor of safety of slope stability. The reliability
index, b, is often used to express the degree of
uncertainty in the calculated factor of safety. These
uncertainties are assessed by different approaches
such as the Taylor series method, Rosenblueth point
estimate method and Monte Carlo simulation method.
Slope stability analysis is a study within geotech-
nical engineering that is highly amenable to probabi-
listic treatment, and has received considerable
attention in the literature. The earliest papers appeared
in the 1990’s (e.g. Wolff 1985, Christian et al. 1994,
Christian et al. 1994, Lacasse and Nadim (1996),
Hassan and Wolff 2000, Duncan 2000).
Wu and Kraft (1970), Cornell (1971), Alonso (1976),
Tang et al. (1976), Venmarcke (1977), Wolff (1985), Li
and Lumb (1974), and Barabosa et al. (1989), applied a
probabilistic approach to analyze slope stability using
the Taylor series method. Recently, a number of
application of probabilistic slope stability studies using
other numerical approaches such as Monte-Carlo sim-
ulation or Rosenblueth’s point estimate method, have
been reported in the literature (Dai et al. 1993 and
Chowdhury and Xu 1993).
Christian et al. (1994) used the mean-first order
reliability method, which is simplification of the more
general first order reliability method. They found that
the reliability analysis is especially useful in estab-
lishing design values of safety factor representing
consistent risk for different types of failure. Tobutt
(1982) used the Monte-Carlo method as a sensitivity-
testing tool for slope stability and also as a method
for calculating the probability of failure of a given
mine slope.
This paper presents a probabilistic based approach
by which the relevant sources of shear strength (c, u)
uncertainty involved in slope stability analysis can be
modeled and analyzed. Three different methods are
used to quantify the uncertainty in the calculated
safety factor. These are Taylor series method,
Rosenblueth point estimate and Monte Carlo simu-
lation method. Two slopes, were selected to investi-
gate how the probability of failure and the reliability
index may vary among those three methods. The
results were obtained using two well-recognized
methods of slope stability analysis, namely Bishops’
method (1955) and Janbu’s method (1954).
2 Probabilistic Slope Stability
Analysis Procedure
Figure 1 illustrates schematically the methodology
used to evaluate the uncertainty and the reliability of
slope stability factor of safety for the Taylor’s series
method, Rosenblueth’s point estimate method and
Monte Carlo simulation method (before Abdullah
et al. 2000). The first step in the methodology is to
specify the slope geometry and the probability distri-
bution for the rock mass properties. The second step is
to search for the critical slip surface and its associated
factor of safety using limit equilibrium methods
(simplified Bishop’s method and simplified Janbu’s
method). Once the critical slip surface and the
uncertainties of rock mass properties are known (or
assumed), the reliability analysis can be performed. In
the case of the Taylor series method and the Rosen-
blueth method, the partial derivatives of the safety
factor must be evaluated with respect to each of the
rock mass properties. Then the mean and the variance
of the safety factor and the associated probability
582 Geotech Geol Eng (2011) 29:581–596
123
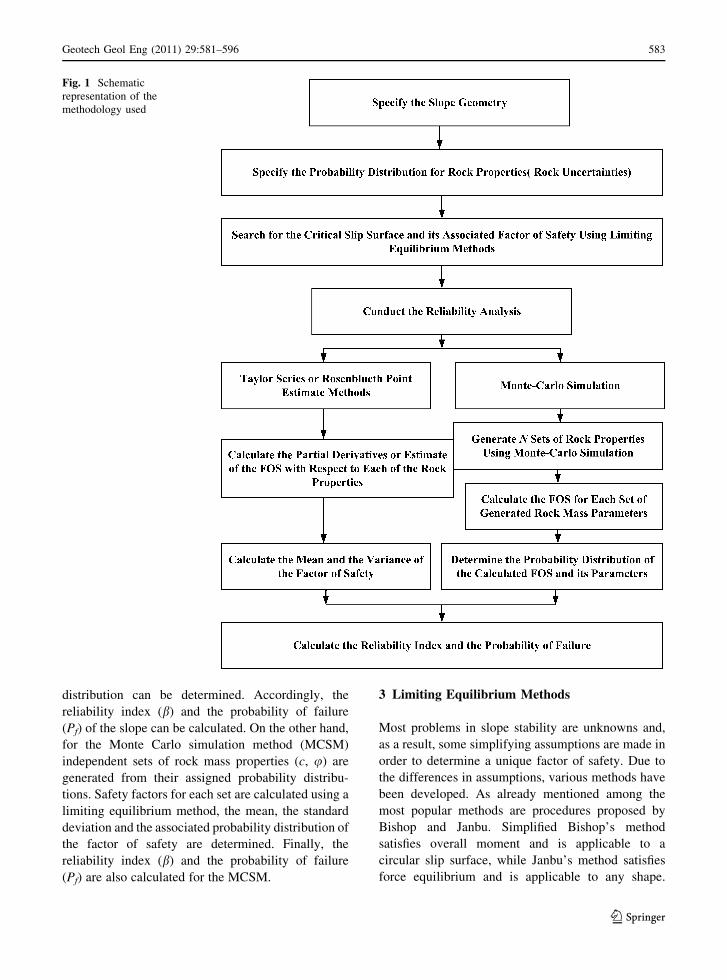
distribution can be determined. Accordingly, the
reliability index (b) and the probability of failure
(Pf) of the slope can be calculated. On the other hand,
for the Monte Carlo simulation method (MCSM)
independent sets of rock mass properties (c, u) are
generated from their assigned probability distribu-
tions. Safety factors for each set are calculated using a
limiting equilibrium method, the mean, the standard
deviation and the associated probability distribution of
the factor of safety are determined. Finally, the
reliability index (b) and the probability of failure
(Pf) are also calculated for the MCSM.
3 Limiting Equilibrium Methods
Most problems in slope stability are unknowns and,
as a result, some simplifying assumptions are made in
order to determine a unique factor of safety. Due to
the differences in assumptions, various methods have
been developed. As already mentioned among the
most popular methods are procedures proposed by
Bishop and Janbu. Simplified Bishop’s method
satisfies overall moment and is applicable to a
circular slip surface, while Janbu’s method satisfies
force equilibrium and is applicable to any shape.
Fig. 1 Schematic
representation of the
methodology used
Geotech Geol Eng (2011) 29:581–596 583
123
Hence, these methods were used to calculate the
factor of safety on a potential sliding surface in
Sungun copper mine slope stability analysis.
The limit equilibrium method was used for slope
stability analysis applying the Slide V.5.0
(Rocscience Inc 2003) computer code. The program
can also perform probabilistic analysis to assess
stability condition. Reliability analysis was per-
formed using the Taylor’s series method and the
Rosenblueth’s point estimate method and the MCSM.
4 Methods of Reliability Evaluation
The main intent of a probabilistic analysis is to
estimate the reliability index, using the mean and
standard deviation of the factor of safety. Alterna-
tively, the probability density function (PDF) of the
factor of safety, F, may be estimated and probability
of failure calculated directly. Limit equilibrium
equations may be used to develop the resultant joint
probability density function with parameters, the
mean and standard deviation due to variations in the
input parameters (cohesion and internal friction
angle). Such predictive models are called perfor-
mance functions and can be represented by an
equation of the form
F ¼ gðX1;X2; . . .;XnÞ þ e ð1Þ
where Xi component input variables, described as random
variables, e model error that accounts for the error
between the response of the adopted model and the real
world behavior (Christian et al. 1994). gð. . .Þ represents
a functional relationship for the factor of safety.
If the reliability index, b, is to be calculated, we
must calculate the mean and standard deviation of the
probability density function of the factor of safety, F,
in response to the input random variables. The
performance function, with continuous random vari-
ables as the input parameters, must be integrated to
generate the joint probability density function for a
closed form solution. Although this may be possible
for simple linear performance functions, the usual
factor of safety, F, equation cannot be integrated
directly, because it is complicated, requires iterations,
and cannot be simplified easily. So, we must resort to
deriving approximate solutions using numerical
methods. Most numerical methods will not provide
us with a probability density function of the factor of
safety, F, (Taylor’s series method and Rosenblueth
point estimate method), but will provide us with the
expected value, E[F], and the variance, Var[F], for
use in calculating the reliability index, b.
As a direct integration of the adopted performance
function for the factor of safety, F, is not feasible, the
expected value, E[F], and the variance, Var[F], of the
factor of safety may be estimated by using (1) Taylor
series method, (2) Rosenblueth’s point estimate
method, (3) Monte Carlo simulation, or (4) Fourier
analysis. The results of a MCSM and the Fourier
analysis will provide an estimate of the probability
density function of the factor of safety, F, as well. Of
these four methods, the first three have been used
extensively, while the Fourier analysis method has
been used primarily for block-slide models to analyze
rock slope stability.
4.1 Taylor Series Method
This method is based on the Taylor series expansion
of the performance function about the expected
values of the random variables (cohesion & internal
friction angle). If only the first-order terms of the
expansion are retained, the expected value of the
performance function for independent random vari-
ables may be approximated by
E½F� ¼ lF � g E½X1�;E½X2�; . . .;E½Xn�ð Þ þ e ð2ÞWhere the function gðX1;X2; . . .Þ is determined
using input parameters that correspond to the mean
values of the component random variables. For the
case where pairs of random variables show some
dependency (that is qXYj ji0), the expected value may
be approximated by
E½F� ¼ lF
� g E½X1�;E½X2�; . . .;E½Xn�ð Þ
þXk
i¼1
Xk
j¼1
o2F
oXioXjCov Xi;Xj
� �þ e
for i \ j
ð3Þ
In the above equation X2;X3; . . .;Xn are the mean
values of the component random variables and
e represents modeling error.
The Taylor series may also be used to estimate the
variance of the response of the performance function
to the input random variables. If all random variables
are independent, all covariance will be zero, and the
584 Geotech Geol Eng (2011) 29:581–596
123
second summation in Eq. 3 reduces to zero. The
assumption of independent (uncorrelated) rock mass
shear strength (c, u) is reported by various research-
ers. For example, Matsuo and Kuroda (1974) and
later on Matsuo (1976), showed that cohesion and
tanu are uncorrelated.
Although this method will give an exact solution
for a linear function, the first-order approximations
introduce error for nonlinear performance functions,
such as the ones typically used for the factor of
safety, F. In considering one of the limit equilibrium
formulations, the partial derivatives cannot be
derived directly and numerical methods must be used
to estimate these derivatives.
The U.S. Army Corps of Engineers recommends
the use of the finite difference approximation of the
derivative and the variance will be given by the
simplified expression (Abramson 2002)
Var½F� ¼ r2F �
1
4
Xk
i¼1
½DFi�2 þ V ½e� ð4Þ
The DF differences are obtained over two standard
deviations. In using this version of the Taylor series
method, the performance function will have to be
evaluated once for the expected value and then
2n times again, for the n random variables for total of
(2n ? 1) evaluations.
4.2 Rosenblueth’s Point Estimate Method
This point estimate procedure was originally pro-
posed by Rosenblueth (1975) where the probability
density functions of the random variables are simu-
lated by ‘‘point’’ masses located at plus or minus one
standard deviation from the mean values. This
method is direct, gives reasonably accurate results
quickly, and has been discussed in the literature
(Baecher and Christian 2003).
For the case of two random variables, X(c) and
Y(u), the performance function for the factor of
safety will take the form
F ¼ g X ; Yð Þ ð5ÞWhere the uncertainty in the random variables is
described by their standard deviation, rX and rY, and
their mean values are taken as lX and lY. For the
general case, we can also presume that the variables
are dependent, with a correlation coefficient of qXY,
and that the probability density functions are distrib-
uted normally.
For two random variables, the first step requires
the evaluation of the factor of safety, F, at four
unique combinations of the random variables, as
shown below
Fþþ ¼ g lX þ rXð Þ; lY þ rYð Þ½ �Fþ� ¼ g lX þ rXð Þ; lY � rYð Þ½ �F�þ ¼ g lX � rXð Þ; lY þ rYð Þ½ �F�� ¼ g lX � rXð Þ; lY � rYð Þ½ �
ð6Þ
In the above set of expressions, the subscripts
indicate the values of X and Y used to evaluate the
performance function. F??, for example, represents
the value of the function g(X,Y), as evaluated for
X = lX ? rX and Y = lY ? rY. Similarly, F?-
represents the value of the function g(X, Y), as
evaluated for X = lX ? rX and Y = lY - rY. Once
these expressions are evaluated, the expected factor
of safety, F, will be given by their sum as:
E½F� ¼ lF
¼ PþþFþþ þ Pþ�Fþ� þ P�þF�þ þ P��F��
ð7Þ
where P, is a coefficient in which defined as follow:
Pþþ ¼ P�� ¼1
41þ qXYð Þ
Pþ� ¼ P�þ ¼1
41� qXYð Þ
ð8Þ
The variance of the factor of safety, F, will be
given by
Var½F� ¼ E½F2� � E½F�ð Þ2 ð9Þ
where E[F] is expected value of the factor of safety,
F, from Eq. 9, and
E½F2� ¼ PþþF2þþ þ Pþ�F2
þ� þ P�þF2�þ þ P��F2
��
ð10ÞCalculating the expected value, E[F], and the
variance, Var[F], using Rosenblueth’s procedure
requires 2n evaluations of the performance function.
For only two variables, this is the less than the
number required for the Taylor series method.
However, for more than two variables, Rosenblueth’s
method will require more evaluations of the perfor-
mance function than with the Taylor series method.
Geotech Geol Eng (2011) 29:581–596 585
123
4.3 Monte Carlo Simulation Method
Monte Carlo simulation is used to obtain the prob-
ability distribution of dependent random variables
given the probability distribution of a set of indepen-
dent random variables. Thus, in Monte Carlo simu-
lation studies three steps are usually required:
(a) determining the independent variable (input),
(b) transforming the input as independent variable
(output), and (c) analyzing the output. Monte Carlo
simulation offers a practical approach to reliability
analysis because stochastic nature of the system
response (output) can be probabilistically duplicated.
In this technique, a large number of rock properties
such as shear strength of the rock mass can be
sampled from their known (or assumed) probability
distribution. For this purpose, the probability density
function for each of these rock mass variables must
be specified. Usually, a normal distribution is
assumed for the rock mass properties (Park and West
2001). Then, the corresponding safety factor of each
set is calculated. These values of safety factors are
plotted on a probability paper in order to determine
the distribution of the safety factor. The reliability
index (b) and the probability of failure (Pf) are then
calculated using the safety factor probability distri-
bution. This approach can be applied to any method
of slices, that uses limit equilibrium in the analysis of
slopes. In the present study, uncertainty in slope
stability is quantified by evaluating the reliability
index, which is defines as:
b ¼ E Fð Þ � 1:0
r Fð Þ ð11Þ
where b is the reliability index, E(F) the expected
value of the safety factor, and r(F) is the standard
deviation.
5 Sungun Copper Mine
Sungun Copper Mine (Sungun) in Azerbaijan Prov-
ince of northwest Iran at Lat. 38�38020 north and
Long. 46�45035 east. The mine is an open pit mine
exploiting the Sungun copper porphyry deposit. It is
designed to initially produce 7 Mtpa ore with the
intention to expand capacity to 14 Mtpa. The pit is
roughly semi circular with high walls on three sides
and a low wall to the east in the Sungun valley. The
interim pit which is the subject of this current study
has a maximum height of approximately 675 m. This
is thus considered to be a high to very high slope. The
considerable final slope height and the presence of
faults and intrusive dykes create on of the exceptional
case studies for geotechnical engineering and slope
stability. It is situated in a mountainous area in a
relatively active geological zone, where active faults
are observed.
According to recent studies, due to faults and their
seismic activity, the Sungun area is technically active
and therefore is deformed and heavily jointed (Sun-
gun copper mine geological report 2006).
5.1 Geotechnical Investigation
A specific geotechnical drilling program targeting the
interim and final pit limit conditions was imple-
mented. This used triple tube drilling equipment and
drilling techniques and polymer drilling mud to
minimize disturbance of samples and increase core
recovery. A 15-hole drilling program with inclined
and orientated drill holes drilled on the more critical
geotechnical radial sections through the major slopes
from pit center was undertaken comprising a total of
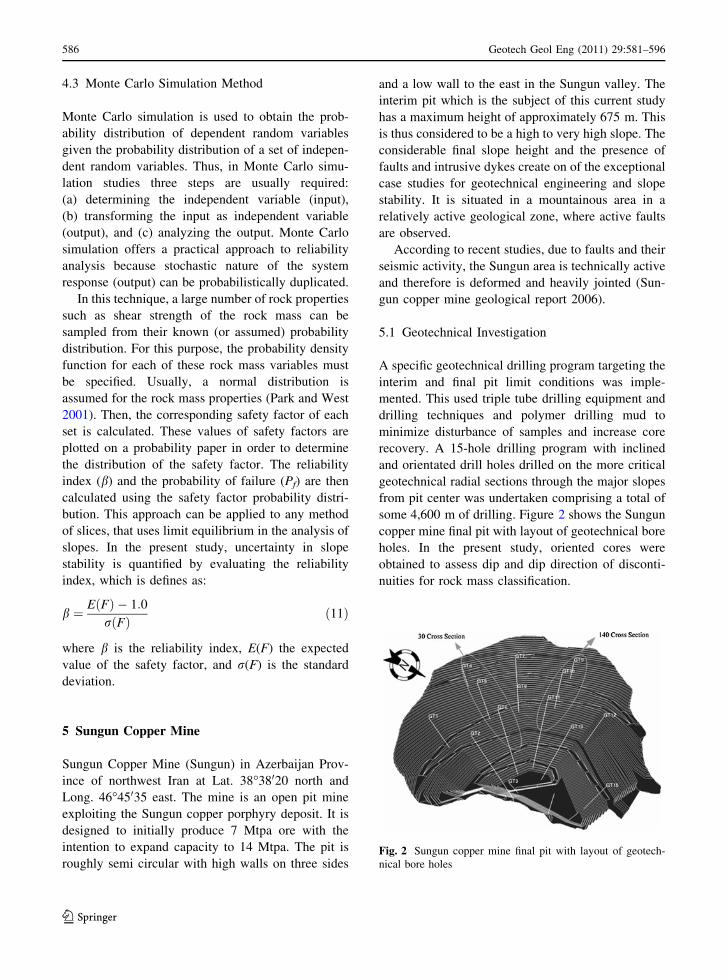
some 4,600 m of drilling. Figure 2 shows the Sungun
copper mine final pit with layout of geotechnical bore
holes. In the present study, oriented cores were
obtained to assess dip and dip direction of disconti-
nuities for rock mass classification.
Fig. 2 Sungun copper mine final pit with layout of geotech-
nical bore holes
586 Geotech Geol Eng (2011) 29:581–596
123

5.2 Main Lithological Units
The Sungun intrusive complex hosting the Sungun
porphyry copper stock intruded along the Sungun
anticline into Cretaceous limestone, marls and shales.
Pliocene-Quaternary tuff and agglomerate of andes-
itic to trachytic composition followed as late stage
extrusion discordantly overlying the intrusion after a
period of uplift and erosion. The Sungun porphyry
complex developed as a composite stock form an
early monzonite/quartzmonzonite phase to a later
diorite/granodiorite phase which intersects the early
phase as cross cutting dykes.
The Sungun Porphyry (SP) is the host rock of the
copper mineralization forming the main lithological
unit at Sungun. It consists predominantly of quartz
and plagioclase phyric quartz-monzonite. The Sun-
gun Porphyry (SP) is affected by various types of
alteration. Potassic (SP_POT) and propylitic
(SP_PRP) alteration in general do not weaken the
intact rock strength, whereas the phyllic (SP_PHY)
and especially the argillic (SP_ARG) alteration
reduce significantly the intact rock strength.
Dioritic to quartz-dioritic dykes are the most
abundant dykes in the Sungun Porphyry. Based on
alteration type and their chronological order of
intrusion DK1 dykes can be further subdivided into
DK1A, DK1A dykes with DK1A being the older. The
DK1A (DK1A_PHY, DK1A_PRP) is very similar to
Sungun Porphyry and as such is of general poor to
subordinately fair to occasionally good rock mass
quality frequently intersected by very poor rock mass
intervals. DK1B dykes often cross-cut DK1a dykes
and are as such of a later, post-mineralisation stage.
The DK1B rock mass is significantly of better rock
mass quality than the Sungun Porphyry or DK1A
dykes. Medium to wide joint spacing is more frequent
(Sungun Copper Project Mining Geotechnics and
Slope Design Studies, SRK Con., 2008).
5.3 Determination of the Inherent Rock Mass
Properties
Due to significant changes of Sungun copper mine’s
rock mass properties, determination of the mine slope
material engineering properties (i.e. cohesion strength
and internal friction angle uncertainties), effective
parameters on rock mass properties were modelled
using random variables. To aid in these determina-
tions, rock mass classification were done for each run
in the drilling process (Abbaszadeh et al. 2006). In
this study, rock mass classification of Sungun copper
mine slopes were assessed by using RMR and GSI
methods. Confidence level of geotechnical parame-
ters are determined 90% approximately. The rock
mass properties of each lithology-alteration are
shown in Tables 1 and 2 for 30 Azimuth and 140
Azimuth cross sections.
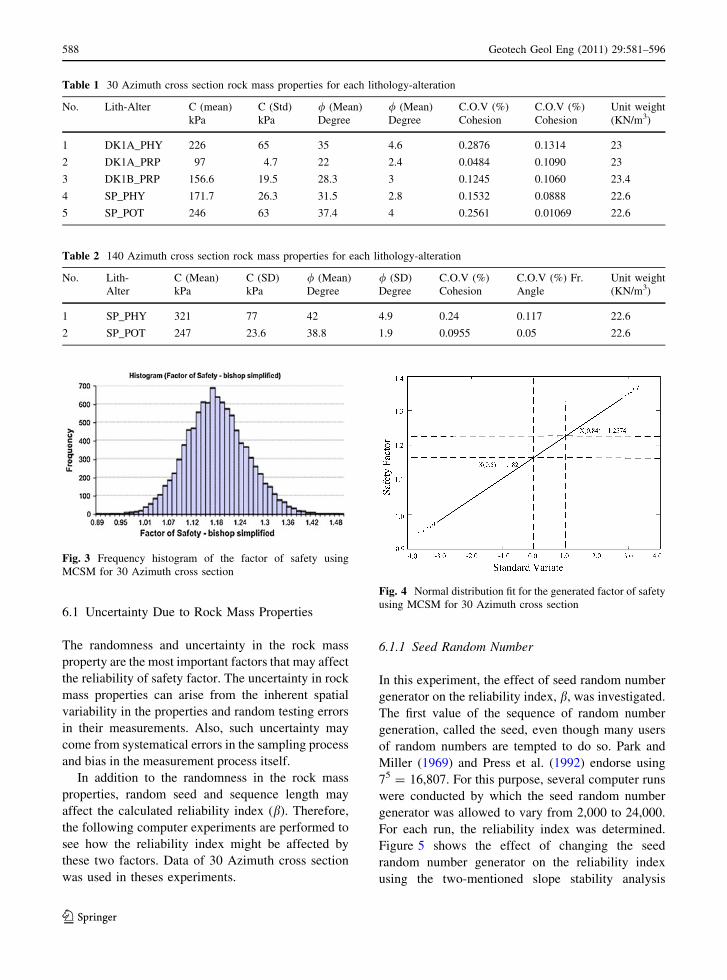
5.4 Probability Density Function Testing
To identify the probability distribution of the safety
factor, two sets of rock mass properties (c, u) for
each rock type were generated from their probability
distributions. Assuming the friction angle and cohe-
sion values are normally distributed random vari-
ables. Factors of safety were determined by limiting
equilibrium methods. For example, the frequency
histogram for the generated factor of safety using
data of 30 Azimuth cross section for the simplified
Bishop’s method is shown in Fig. 3. The individual
values of factor of safety can be plotted on a
histogram; in view of the nature of the input
distributions and complexity of the problem this will
usually take a normal form. It is helpful to process
this histogram further to determine factor of safety
less than some particular value F. In Fig. 3, for
example, 0.5 percent of the values have a factor of
safety less than 1.0 (Probability of failure) and 35
percent are less than 1.15 (Unsatisfactory perfor-
mance). The Chi-square goodness of fit test indicates
that the normal distribution adequately fits the
generated factor of safety for all two sets of random
variables (cohesion and internal friction angle)
(Fig. 4).
6 Factors Affecting Reliability Index
Reliability in slope stability analysis is affected by
various factors such as the uncertainty associated
with rock mass properties and the uncertainty asso-
ciated with analytical methods or models
(Abbaszadeh et al. 2006). The focus of this paper is
to address the reliability of safety factor due to rock
mass shear strength uncertainty.
Geotech Geol Eng (2011) 29:581–596 587
123
6.1 Uncertainty Due to Rock Mass Properties
The randomness and uncertainty in the rock mass
property are the most important factors that may affect
the reliability of safety factor. The uncertainty in rock
mass properties can arise from the inherent spatial
variability in the properties and random testing errors
in their measurements. Also, such uncertainty may
come from systematical errors in the sampling process
and bias in the measurement process itself.
In addition to the randomness in the rock mass
properties, random seed and sequence length may
affect the calculated reliability index (b). Therefore,
the following computer experiments are performed to
see how the reliability index might be affected by
these two factors. Data of 30 Azimuth cross section
was used in theses experiments.
6.1.1 Seed Random Number
In this experiment, the effect of seed random number
generator on the reliability index, b, was investigated.
The first value of the sequence of random number
generation, called the seed, even though many users
of random numbers are tempted to do so. Park and
Miller (1969) and Press et al. (1992) endorse using
75 = 16,807. For this purpose, several computer runs
were conducted by which the seed random number
generator was allowed to vary from 2,000 to 24,000.
For each run, the reliability index was determined.
Figure 5 shows the effect of changing the seed
random number generator on the reliability index
using the two-mentioned slope stability analysis
Table 1 30 Azimuth cross section rock mass properties for each lithology-alteration
No. Lith-Alter C (mean)
kPa
C (Std)
kPa
/ (Mean)
Degree
/ (Mean)
Degree
C.O.V (%)
Cohesion
C.O.V (%)
Cohesion
Unit weight
(KN/m3)
1 DK1A_PHY 226 65 35 4.6 0.2876 0.1314 23
2 DK1A_PRP 97 4.7 22 2.4 0.0484 0.1090 23
3 DK1B_PRP 156.6 19.5 28.3 3 0.1245 0.1060 23.4
4 SP_PHY 171.7 26.3 31.5 2.8 0.1532 0.0888 22.6
5 SP_POT 246 63 37.4 4 0.2561 0.01069 22.6
Table 2 140 Azimuth cross section rock mass properties for each lithology-alteration
No. Lith-
Alter
C (Mean)
kPa
C (SD)
kPa
/ (Mean)
Degree
/ (SD)
Degree
C.O.V (%)
Cohesion
C.O.V (%) Fr.
Angle
Unit weight
(KN/m3)
1 SP_PHY 321 77 42 4.9 0.24 0.117 22.6
2 SP_POT 247 23.6 38.8 1.9 0.0955 0.05 22.6
Fig. 3 Frequency histogram of the factor of safety using
MCSM for 30 Azimuth cross section
Fig. 4 Normal distribution fit for the generated factor of safety
using MCSM for 30 Azimuth cross section
588 Geotech Geol Eng (2011) 29:581–596
123
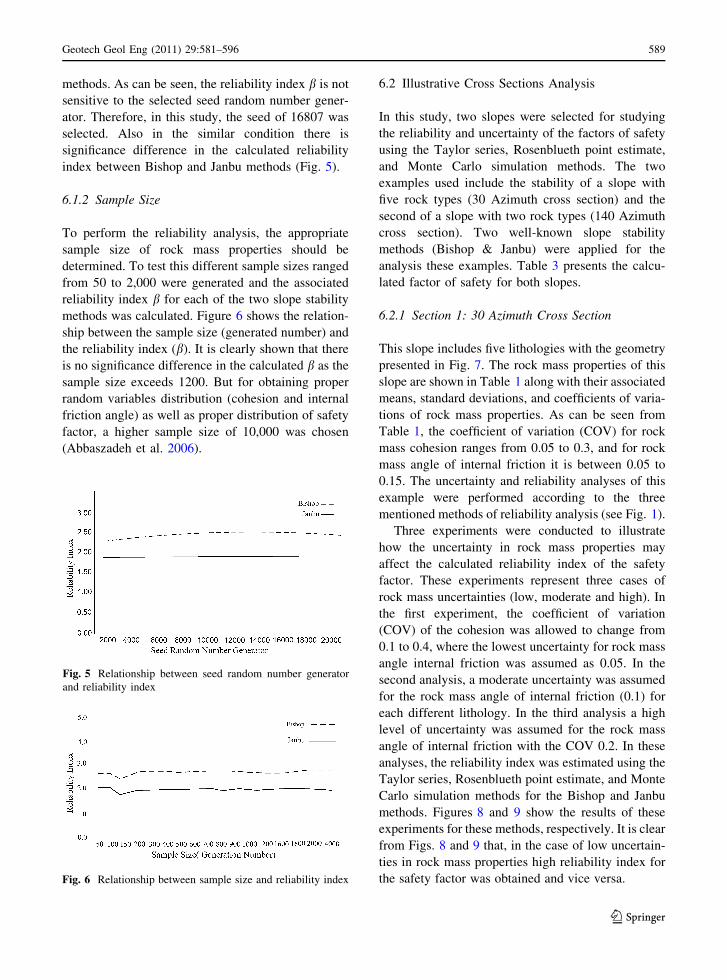
methods. As can be seen, the reliability index b is not
sensitive to the selected seed random number gener-
ator. Therefore, in this study, the seed of 16807 was
selected. Also in the similar condition there is
significance difference in the calculated reliability
index between Bishop and Janbu methods (Fig. 5).
6.1.2 Sample Size
To perform the reliability analysis, the appropriate
sample size of rock mass properties should be
determined. To test this different sample sizes ranged
from 50 to 2,000 were generated and the associated
reliability index b for each of the two slope stability
methods was calculated. Figure 6 shows the relation-
ship between the sample size (generated number) and
the reliability index (b). It is clearly shown that there
is no significance difference in the calculated b as the
sample size exceeds 1200. But for obtaining proper
random variables distribution (cohesion and internal
friction angle) as well as proper distribution of safety
factor, a higher sample size of 10,000 was chosen
(Abbaszadeh et al. 2006).
6.2 Illustrative Cross Sections Analysis
In this study, two slopes were selected for studying
the reliability and uncertainty of the factors of safety
using the Taylor series, Rosenblueth point estimate,
and Monte Carlo simulation methods. The two
examples used include the stability of a slope with
five rock types (30 Azimuth cross section) and the
second of a slope with two rock types (140 Azimuth
cross section). Two well-known slope stability
methods (Bishop & Janbu) were applied for the
analysis these examples. Table 3 presents the calcu-
lated factor of safety for both slopes.
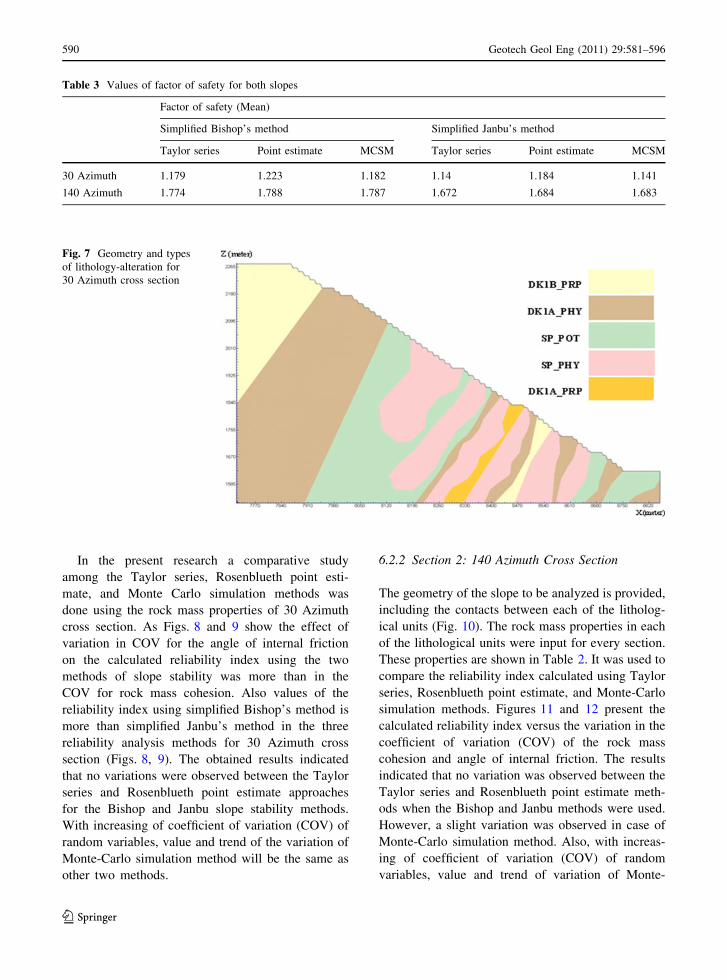
6.2.1 Section 1: 30 Azimuth Cross Section
This slope includes five lithologies with the geometry
presented in Fig. 7. The rock mass properties of this
slope are shown in Table 1 along with their associated
means, standard deviations, and coefficients of varia-
tions of rock mass properties. As can be seen from
Table 1, the coefficient of variation (COV) for rock
mass cohesion ranges from 0.05 to 0.3, and for rock
mass angle of internal friction it is between 0.05 to
0.15. The uncertainty and reliability analyses of this
example were performed according to the three
mentioned methods of reliability analysis (see Fig. 1).
Three experiments were conducted to illustrate
how the uncertainty in rock mass properties may
affect the calculated reliability index of the safety
factor. These experiments represent three cases of
rock mass uncertainties (low, moderate and high). In
the first experiment, the coefficient of variation
(COV) of the cohesion was allowed to change from
0.1 to 0.4, where the lowest uncertainty for rock mass
angle internal friction was assumed as 0.05. In the
second analysis, a moderate uncertainty was assumed
for the rock mass angle of internal friction (0.1) for
each different lithology. In the third analysis a high
level of uncertainty was assumed for the rock mass
angle of internal friction with the COV 0.2. In these
analyses, the reliability index was estimated using the
Taylor series, Rosenblueth point estimate, and Monte
Carlo simulation methods for the Bishop and Janbu
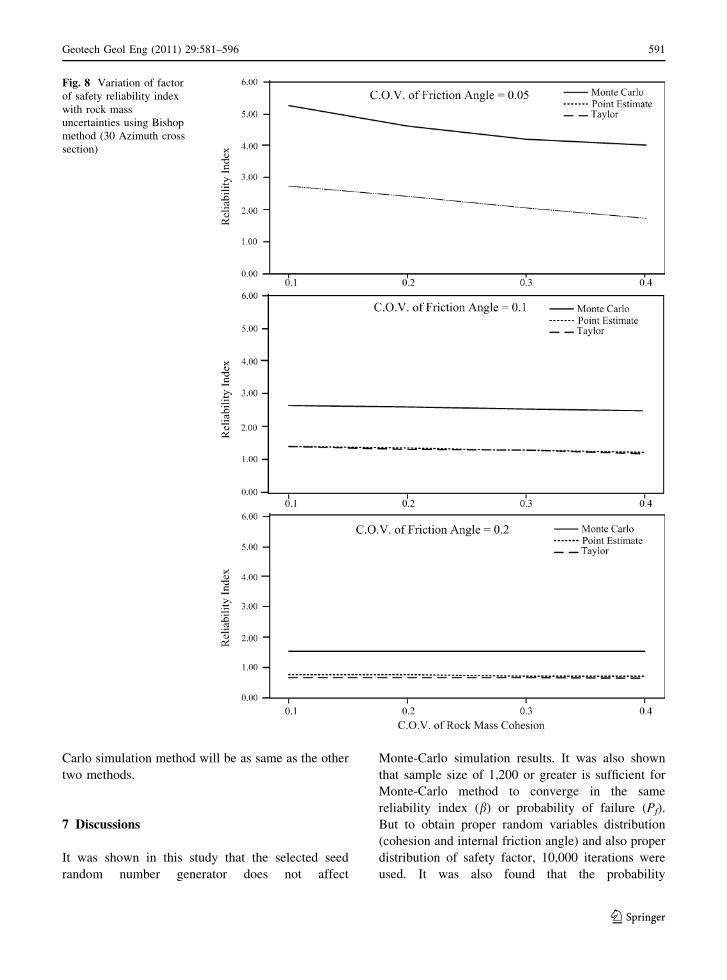
methods. Figures 8 and 9 show the results of these
experiments for these methods, respectively. It is clear
from Figs. 8 and 9 that, in the case of low uncertain-
ties in rock mass properties high reliability index for
the safety factor was obtained and vice versa.
Fig. 5 Relationship between seed random number generator
and reliability index
Fig. 6 Relationship between sample size and reliability index
Geotech Geol Eng (2011) 29:581–596 589
123
In the present research a comparative study
among the Taylor series, Rosenblueth point esti-
mate, and Monte Carlo simulation methods was
done using the rock mass properties of 30 Azimuth
cross section. As Figs. 8 and 9 show the effect of
variation in COV for the angle of internal friction
on the calculated reliability index using the two
methods of slope stability was more than in the
COV for rock mass cohesion. Also values of the
reliability index using simplified Bishop’s method is
more than simplified Janbu’s method in the three
reliability analysis methods for 30 Azimuth cross
section (Figs. 8, 9). The obtained results indicated
that no variations were observed between the Taylor
series and Rosenblueth point estimate approaches
for the Bishop and Janbu slope stability methods.
With increasing of coefficient of variation (COV) of
random variables, value and trend of the variation of
Monte-Carlo simulation method will be the same as
other two methods.
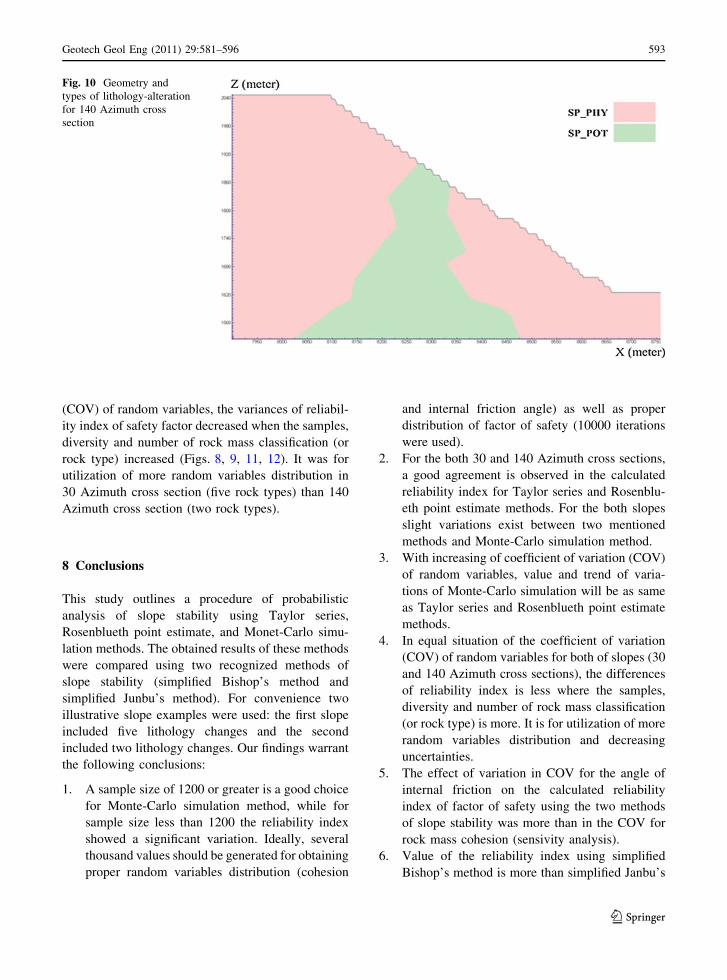
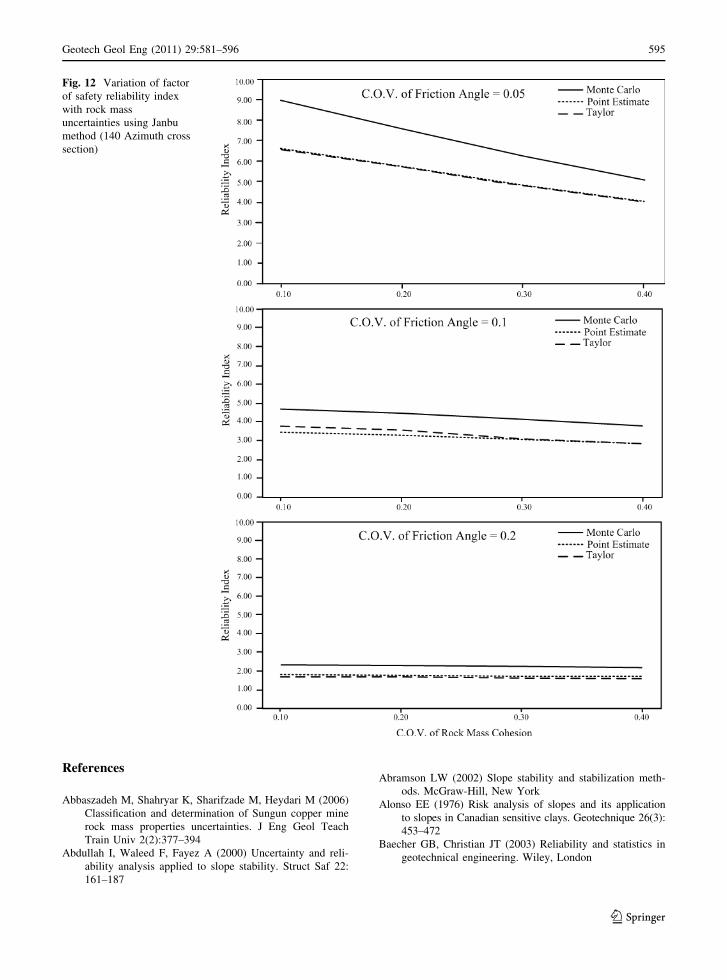
6.2.2 Section 2: 140 Azimuth Cross Section
The geometry of the slope to be analyzed is provided,
including the contacts between each of the litholog-
ical units (Fig. 10). The rock mass properties in each
of the lithological units were input for every section.
These properties are shown in Table 2. It was used to
compare the reliability index calculated using Taylor
series, Rosenblueth point estimate, and Monte-Carlo
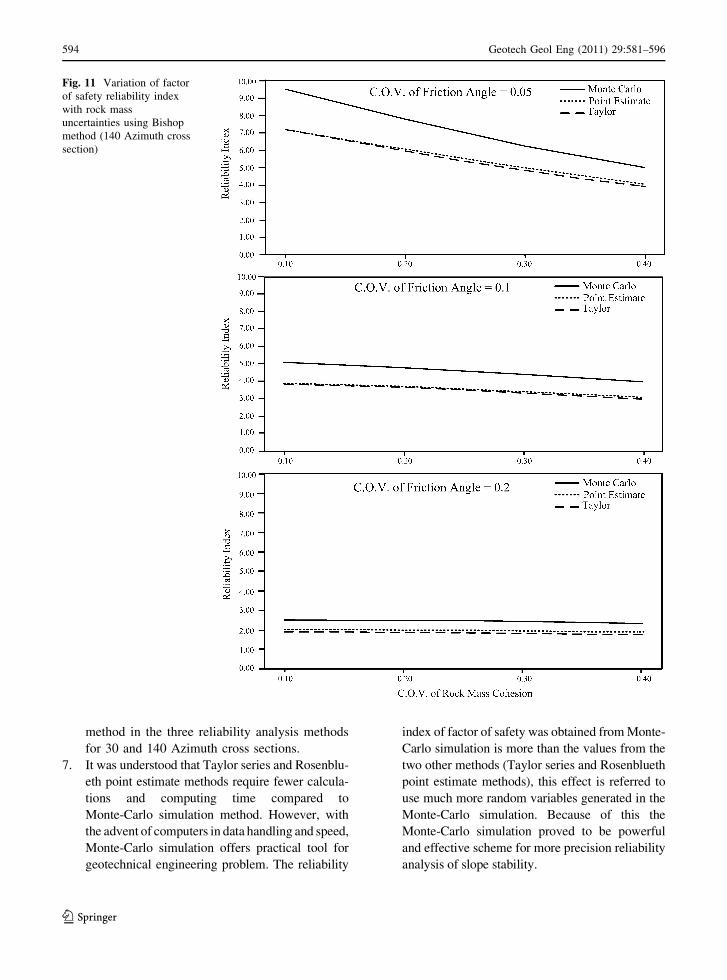
simulation methods. Figures 11 and 12 present the
calculated reliability index versus the variation in the
coefficient of variation (COV) of the rock mass
cohesion and angle of internal friction. The results
indicated that no variation was observed between the
Taylor series and Rosenblueth point estimate meth-
ods when the Bishop and Janbu methods were used.
However, a slight variation was observed in case of
Monte-Carlo simulation method. Also, with increas-
ing of coefficient of variation (COV) of random
variables, value and trend of variation of Monte-
Table 3 Values of factor of safety for both slopes
Factor of safety (Mean)
Simplified Bishop’s method Simplified Janbu’s method
Taylor series Point estimate MCSM Taylor series Point estimate MCSM
30 Azimuth 1.179 1.223 1.182 1.14 1.184 1.141
140 Azimuth 1.774 1.788 1.787 1.672 1.684 1.683
Fig. 7 Geometry and types
of lithology-alteration for
30 Azimuth cross section
590 Geotech Geol Eng (2011) 29:581–596
123
Carlo simulation method will be as same as the other
two methods.
7 Discussions
It was shown in this study that the selected seed
random number generator does not affect
Monte-Carlo simulation results. It was also shown
that sample size of 1,200 or greater is sufficient for
Monte-Carlo method to converge in the same
reliability index (b) or probability of failure (Pf).
But to obtain proper random variables distribution
(cohesion and internal friction angle) and also proper
distribution of safety factor, 10,000 iterations were
used. It was also found that the probability
Fig. 8 Variation of factor
of safety reliability index
with rock mass
uncertainties using Bishop
method (30 Azimuth cross
section)
Geotech Geol Eng (2011) 29:581–596 591
123

distribution of the safety factor of such sample size
was normally distributed. Sample of size 10,000 also
confirmed that the distribution of the safety factor
was normal.
In all the tested cases using Bishop and Janbu
methods, it was observed that there was a significant
difference in the calculated reliability index using
Taylor series, Rosenblueth point estimate, and Monte-
Carlo simulation methods. With increasing of the
coefficient of variation (COV) of random variables,
value and trend of variation of Monte-Carlo simulation
will be the same as two mentioned methods.
The main purpose of two slopes (30 Azimuth cross
section with five rock types and 140 Azimuth cross
section with two rock types) consideration was that:
In equal situations of the coefficient of variation
Fig. 9 Variation of factor
of safety reliability index
with rock mass
uncertainties using Janbu
method (30 Azimuth cross
section)
592 Geotech Geol Eng (2011) 29:581–596
123
(COV) of random variables, the variances of reliabil-
ity index of safety factor decreased when the samples,
diversity and number of rock mass classification (or
rock type) increased (Figs. 8, 9, 11, 12). It was for
utilization of more random variables distribution in
30 Azimuth cross section (five rock types) than 140
Azimuth cross section (two rock types).
8 Conclusions
This study outlines a procedure of probabilistic
analysis of slope stability using Taylor series,
Rosenblueth point estimate, and Monet-Carlo simu-
lation methods. The obtained results of these methods
were compared using two recognized methods of
slope stability (simplified Bishop’s method and
simplified Junbu’s method). For convenience two
illustrative slope examples were used: the first slope
included five lithology changes and the second
included two lithology changes. Our findings warrant
the following conclusions:
1. A sample size of 1200 or greater is a good choice
for Monte-Carlo simulation method, while for
sample size less than 1200 the reliability index
showed a significant variation. Ideally, several
thousand values should be generated for obtaining
proper random variables distribution (cohesion
and internal friction angle) as well as proper
distribution of factor of safety (10000 iterations
were used).
2. For the both 30 and 140 Azimuth cross sections,
a good agreement is observed in the calculated
reliability index for Taylor series and Rosenblu-
eth point estimate methods. For the both slopes
slight variations exist between two mentioned
methods and Monte-Carlo simulation method.
3. With increasing of coefficient of variation (COV)
of random variables, value and trend of varia-
tions of Monte-Carlo simulation will be as same
as Taylor series and Rosenblueth point estimate
methods.
4. In equal situation of the coefficient of variation
(COV) of random variables for both of slopes (30
and 140 Azimuth cross sections), the differences
of reliability index is less where the samples,
diversity and number of rock mass classification
(or rock type) is more. It is for utilization of more
random variables distribution and decreasing
uncertainties.
5. The effect of variation in COV for the angle of
internal friction on the calculated reliability
index of factor of safety using the two methods
of slope stability was more than in the COV for
rock mass cohesion (sensivity analysis).
6. Value of the reliability index using simplified
Bishop’s method is more than simplified Janbu’s
Fig. 10 Geometry and
types of lithology-alteration
for 140 Azimuth cross
section
Geotech Geol Eng (2011) 29:581–596 593
123
method in the three reliability analysis methods
for 30 and 140 Azimuth cross sections.
7. It was understood that Taylor series and Rosenblu-
eth point estimate methods require fewer calcula-
tions and computing time compared to
Monte-Carlo simulation method. However, with
the advent of computers in data handling and speed,
Monte-Carlo simulation offers practical tool for
geotechnical engineering problem. The reliability
index of factor of safety was obtained from Monte-
Carlo simulation is more than the values from the
two other methods (Taylor series and Rosenblueth
point estimate methods), this effect is referred to
use much more random variables generated in the
Monte-Carlo simulation. Because of this the
Monte-Carlo simulation proved to be powerful
and effective scheme for more precision reliability
analysis of slope stability.
Fig. 11 Variation of factor
of safety reliability index
with rock mass
uncertainties using Bishop
method (140 Azimuth cross
section)
594 Geotech Geol Eng (2011) 29:581–596
123
References
Abbaszadeh M, Shahryar K, Sharifzade M, Heydari M (2006)
Classification and determination of Sungun copper mine
rock mass properties uncertainties. J Eng Geol Teach
Train Univ 2(2):377–394
Abdullah I, Waleed F, Fayez A (2000) Uncertainty and reli-
ability analysis applied to slope stability. Struct Saf 22:
161–187
Abramson LW (2002) Slope stability and stabilization meth-
ods. McGraw-Hill, New York
Alonso EE (1976) Risk analysis of slopes and its application
to slopes in Canadian sensitive clays. Geotechnique 26(3):
453–472
Baecher GB, Christian JT (2003) Reliability and statistics in
geotechnical engineering. Wiley, London
Fig. 12 Variation of factor
of safety reliability index
with rock mass
uncertainties using Janbu
method (140 Azimuth cross
section)
Geotech Geol Eng (2011) 29:581–596 595
123
Barabosa MR, Morris DV, Sarma SK (1989) Factor of safety
and probability of failure of rock fill embankments.
Geotechnique 39(3):471–483
Bishop AW (1955) The use of slip circle in the stability
analysis of slopes. Geotechnique 5:7–17
Chowdhury RN, Xu DW (1993) Rational polynomial technique
in slope stability analysis. J Geotech Eng Div 119(12):
1910–1928
Christian JT, Ladd CC, Baecher GB (1994) Reliability applied
to slope stability analysis. J Geotech Eng Div 120(12):
2180–2207
Cornell CA (1971) First-order uncertainty analysis of soil
deformation and stability. In: Proceedings of 1st interna-
tional conference on application of probability and sta-
tistics in soil and structural engineering (ICAPI), Hong
Kong, pp 129–144
Dai Y, Fredlund DG, Stolte WJ (1993) A probabilistic slope
stability analysis using deterministic computer soft ware.
In: Proceedings of conference on probabilistic methods in
geotechnical engineering, Canbera, Australia, 10–12
February. pp 267–274
Duncan JM (2000) Factor of safety and reliability in geo-
technical engineering. J Geotechn Geoenviron Eng ASCE
126(4):307–316
Hassan AM, Wolff TF (2000) Effect of deterministic and
probabilistic models on slope reliability index. In: Grif-
fiths DV et al (ed) Slope stability 2000, GSP No. 101
pp 194–208
Janbu N (1954) Application of composite slip surface for sta-
bility analysis. In: Proceedings of European conference on
stability of earth slopes, Stockholm, Sweden, pp 43–49
Lacasse S, Nadim F (1996) Uncertainties in characterizing soil
properties. In Proceedings, Uncertainty ’96. American
Society of Civil Engineers, Reston, Va. Geotechnical
special publication no. 58, vol 1, pp 49–75
Li KS, Lumb P (1974) Probabilistic design of slopes. Can
Geotech J 24:520–535
Matsuo M (1976) Reliability in embankment design. M.I.T.
Department of Civil Engineering Research Report R
76–33. Massachusetts Institute of Technology, Cambridge
Matsuo M, Kuroda K (1974) Probabilistic approach to design
of embankments. Soil Found 14(2):1–17
Park SK, Miller KW (1969) Random number generators: good
ones hard to find. Commun ACM 31:1192–1201
Park H, West TR (2001) Development of a probabilistic
approach for rock wedge failure. J Eng Geol 59:233–251
Press WH, Teukolsky SA, Vetterling WT, Flannery BP (1992)
Numerical recipes in Fortran: the art of scientific com-
putation. Cambridge university press, Cambridge
Rocscience Inc (2003) Slide, 2D Limit equilibrium slope sta-
bility for soil and rock slopes, user guide
Rosenblueth E (1975) Point estimates for probability moments.
Proc Natl Acad Sci Math 72(10):3812–3814
Tang WH, Yucemen MS, Ang AHS (1976) Probability-based
short tem design of slopes. Can Geotech J 13(3):201–215
Tobutt DC (1982) Monte Carlo simulation methods for slope
stability. Comput Geosci 8(2):199–208
Venmarcke EH (1977) Reliability of earth slopes. J Geotech
Eng Div ASCE 103(11):1227–1246
Wolff TF (1985) Analysis and design of embankment dam
slopes: a probabilistic approach. Ph.D. thesis, Purdue
University, West Lafayette
Wu TH, Kraft LM (1970) Safety analysis of slopes. J Soil
Mech Found Div ASCE 96(2):609–630
596 Geotech Geol Eng (2011) 29:581–596
123