Outer membrane proteins: comparing X-ray and NMR structures by MD simulations in lipid bilayers
11
Eur Biophys J (2008) 37:131–141 DOI 10.1007/s00249-007-0185-8 123 ORIGINAL PAPER Outer membrane proteins: comparing X-ray and NMR structures by MD simulations in lipid bilayers Katherine Cox · Peter J. Bond · Alessandro Grottesi · Marc Baaden · Mark S. P. Sansom Received: 24 January 2006 / Revised: 7 May 2007 / Accepted: 8 May 2007 / Published online: 6 June 2007 © EBSA 2007 Abstract The structures of three bacterial outer membrane proteins (OmpA, OmpX and PagP) have been determined by both X-ray diVraction and NMR. We have used multiple (7 £ 15 ns) MD simulations to compare the conformational dynamics resulting from the X-ray versus the NMR struc- tures, each protein being simulated in a lipid (DMPC) bilayer. Conformational drift was assessed via calculation of the root mean square deviation as a function of time. On this basis the ‘quality’ of the starting structure seems mainly to inXuence the simulation stability of the trans- membrane -barrel domain. Root mean square Xuctuations were used to compare simulation mobility as a function of residue number. The resultant residue mobility proWles were qualitatively similar for the corresponding X-ray and NMR structure-based simulations. However, all three pro- teins were generally more mobile in the NMR-based than in the X-ray simulations. Principal components analysis was used to identify the dominant motions within each simula- tion. The Wrst two eigenvectors (which account for >50% of the protein motion) reveal that such motions are concen- trated in the extracellular loops and, in the case of PagP, in the N-terminal -helix. Residue proWles of the magnitude of motions corresponding to the Wrst two eigenvectors are similar for the corresponding X-ray and NMR simulations, but the directions of these motions correlate poorly reXect- ing incomplete sampling on a »10 ns timescale. Keywords Membrane protein · Outer membrane · Simulation · Molecular dynamics · Lipid bilayer Introduction Bacterial outer membrane proteins (OMPs) share a com- mon basic architecture, with the transmembrane (TM) domain formed by an anti-parallel -barrel. OMPs consti- tute about half of the mass of the bacterial outer membrane. The structure of 26 OMPs have been solved by X-ray diVraction (Buchanan 1999; Koebnik et al. 2000; Schulz 2000), of which three have also been determined by NMR (Arora et al. 2001; Fernandez et al. 2001; Hwang et al. 2002). OMPs provide an excellent opportunity for using molecular dynamics (MD) simulation studies to explore the conformational dynamics of a family of structurally related membrane proteins. This should allow us to deWne common dynamic properties alongside functionally important diVer- ences between individual OMPs (Bond et al. 2002; Domene et al. 2003). Thus, starting from an average struc- ture (in time and space) as determined by protein crystal- lography (PX) or NMR the dynamic behaviour of a single protein molecule can be simulated in a membrane (Fig. 1) (Baaden and Sansom 2004) or micellar (Böckmann and CaXisch 2005; Bond and Sansom 2003) environment in order to help explore the relationship between its structure and biological function. The majority of OMP structures have been determined by PX. However, recent developments in NMR methods K. Cox · P. J. Bond · A. Grottesi · M. S. P. Sansom (&) Department of Biochemistry, University of Oxford, South Parks Road, Oxford, OX1 3QU, UK e-mail: [email protected] M. Baaden Laboratoire de Biochimie Théorique, CNRS UPR 9080, Institut de Biologie Physico-Chimique, 13, rue Pierre et Marie Curie, 75005 Paris, France Present Address: A. Grottesi CASPUR, Supercomputing Consortium for University and Research, Via dei Tizii 6, 00185 Rome, Italy
-
Upload
sacklerinstitute -
Category
Documents
-
view
6 -
download
0
Transcript of Outer membrane proteins: comparing X-ray and NMR structures by MD simulations in lipid bilayers

Eur Biophys J (2008) 37:131–141
DOI 10.1007/s00249-007-0185-8ORIGINAL PAPER
Outer membrane proteins: comparing X-ray and NMR structures by MD simulations in lipid bilayers
Katherine Cox · Peter J. Bond · Alessandro Grottesi · Marc Baaden · Mark S. P. Sansom
Received: 24 January 2006 / Revised: 7 May 2007 / Accepted: 8 May 2007 / Published online: 6 June 2007© EBSA 2007
Abstract The structures of three bacterial outer membraneproteins (OmpA, OmpX and PagP) have been determinedby both X-ray diVraction and NMR. We have used multiple(7 £ 15 ns) MD simulations to compare the conformationaldynamics resulting from the X-ray versus the NMR struc-tures, each protein being simulated in a lipid (DMPC)bilayer. Conformational drift was assessed via calculationof the root mean square deviation as a function of time. Onthis basis the ‘quality’ of the starting structure seemsmainly to inXuence the simulation stability of the trans-membrane �-barrel domain. Root mean square Xuctuationswere used to compare simulation mobility as a function ofresidue number. The resultant residue mobility proWleswere qualitatively similar for the corresponding X-ray andNMR structure-based simulations. However, all three pro-teins were generally more mobile in the NMR-based than inthe X-ray simulations. Principal components analysis wasused to identify the dominant motions within each simula-tion. The Wrst two eigenvectors (which account for >50% ofthe protein motion) reveal that such motions are concen-trated in the extracellular loops and, in the case of PagP, inthe N-terminal �-helix. Residue proWles of the magnitude of
motions corresponding to the Wrst two eigenvectors aresimilar for the corresponding X-ray and NMR simulations,but the directions of these motions correlate poorly reXect-ing incomplete sampling on a »10 ns timescale.
Keywords Membrane protein · Outer membrane · Simulation · Molecular dynamics · Lipid bilayer
Introduction
Bacterial outer membrane proteins (OMPs) share a com-mon basic architecture, with the transmembrane (TM)domain formed by an anti-parallel �-barrel. OMPs consti-tute about half of the mass of the bacterial outer membrane.The structure of 26 OMPs have been solved by X-raydiVraction (Buchanan 1999; Koebnik et al. 2000; Schulz2000), of which three have also been determined by NMR(Arora et al. 2001; Fernandez et al. 2001; Hwang et al.2002). OMPs provide an excellent opportunity for usingmolecular dynamics (MD) simulation studies to explore theconformational dynamics of a family of structurally relatedmembrane proteins. This should allow us to deWne commondynamic properties alongside functionally important diVer-ences between individual OMPs (Bond et al. 2002;Domene et al. 2003). Thus, starting from an average struc-ture (in time and space) as determined by protein crystal-lography (PX) or NMR the dynamic behaviour of a singleprotein molecule can be simulated in a membrane (Fig. 1)(Baaden and Sansom 2004) or micellar (Böckmann andCaXisch 2005; Bond and Sansom 2003) environment inorder to help explore the relationship between its structureand biological function.
The majority of OMP structures have been determinedby PX. However, recent developments in NMR methods
K. Cox · P. J. Bond · A. Grottesi · M. S. P. Sansom (&)Department of Biochemistry, University of Oxford, South Parks Road, Oxford, OX1 3QU, UKe-mail: [email protected]
M. BaadenLaboratoire de Biochimie Théorique, CNRS UPR 9080, Institut de Biologie Physico-Chimique, 13, rue Pierre et Marie Curie, 75005 Paris, France
Present Address:A. GrottesiCASPUR, Supercomputing Consortium for University and Research, Via dei Tizii 6, 00185 Rome, Italy
123

132 Eur Biophys J (2008) 37:131–141
(Arora et al. 2001; Arora and Tamm 2001) have enabledthe structure determination of three OMPs in detergentmicelle environments. These are: OmpA (Arora et al.2001); OmpX (Fernandez et al. 2001) (which has beenreWned with additional constraints derived from selectiveprotonation of Val, Leu and Ile residues; Fernandez et al.2004); and the OM enzyme PagP (the structure of whichhas been determined in two diVerent detergents) (Hwanget al. 2002). The structures of these proteins have also beendetermined using PX (Ahn et al. 2004; Pautsch and Schulz2000; Vogt and Schulz 1999).
In general structures solved by NMR are of lower accu-racy and precision than high resolution PX structures(Spronk et al. 2002), although it remains diYcult to deWnethe ‘quality’ of an NMR structure (Snyder et al. 2005).Also, the experimental diYculties inherent in studyingmembrane proteins mean that NMR structures of the latterare generally based on fewer restraints per residue than fora water soluble protein of comparable size. A comparisonof the behaviour of NMR and PX structures of water solu-ble proteins in MD simulations suggested that NMR-derived structures on average exhibit a higher degree ofinternal strain than PX structures (Fan and Mark 2003).Given the increasing importance of NMR for structuredetermination of membrane proteins, it is of interest toexplore the inXuence of the origin of the starting structure
(NMR versus PX) on the conformational dynamics ofOMPs as seen in MD simulations in lipid bilayers. To thisend, we have performed multiple 15 ns MD simulationsstarting from both PX and NMR structures of OmpA,OmpX and PagP. The results of these studies enable us toexplore the extent to which the main features of MD simu-lations are robust to changes in the ‘quality’ of the startingmodel for the (membrane) protein.
Methods
Protein structures
Three OMPs for which both PX and NMR structures wereavailable were used as the basis of the simulations: OmpA,OmpX and PagP (Table 1; Fig. 2). For OmpA the 2.5 Åresolution PX structure (1BXW) (Pautsch and Schulz 1998)was used as this had a complete coordinate set for the extra-cellular loops. With respect to the NMR structures, wemanually selected one model from each ensemble, whichwas judged to be most compatible with a lipid bilayer envi-ronment. In particular, models were selected such that, e.g.loops were not in orientations that would bring them in con-tact with the hydrophobic core of the bilayer. For OmpXtwo simulations were performed: one using an earlier struc-ture (1ORM), and the other using a more recent structure(1Q9F), which was derived from substantially morerestraints per residue (see Table 1). Residues missing fromthe PX structure of PagP (i.e. residues 38–47 of loop L1)were built using Modeller v4 (http://www.salilab.org/mod-eller/) (Fiser et al. 2000; Sali and Blundell 1993).
The ionisation state of the sidechains in each structurewas based on pKA calculations, performed using the pro-gram WhatIf (Vriend 1990) combined with locally writtencode. The local code enabled us to take the complex envi-ronment of the ionisable sidechains and the low dielectricof the lipid bilayer slab into account in these calculations.In the case of OmpA and OmpX, the calculations were per-formed using the PX structures and the results were appliedto both the NMR and PX starting models. For PagP (as theNMR structure was published Wrst) the pKA calculationswere performed on the NMR structure and applied to thePX structure.
Setup of simulation systems
Each protein was embedded in a pre-equilibrated DMPCBilayer (Fig. 1). To orient the protein relative to the hydro-phobic core of the bilayer the tilt and translation of theprotein relative to a 30 Å thick hydrophobic slab was opti-mised, by minimisation of the membrane–protein interac-tion energy as calculated using empirical hydrophobicities
Fig. 1 Simulation setup for an OMP in a DMPC bilayer, illustrated forOmpANMR. The protein backbone is shown as a tube (cyan). The bilay-er lipids are in blue, with the headgroup phosphorus atoms as smallpurple spheres. Na+ ions are shown as red spheres; Cl¡ ions as greenspheres; water molecules are omitted for clarity
123
Eur Biophys J (2008) 37:131–141 133
(Roseman 1988). Each protein was subsequently embeddedin a DMPC bilayer as described in (Faraldo-Gómez et al.2002). After insertion of the protein, water and ions equiva-lent to »0.1 M NaCl were added by simple process ofsuperimposition. The system was energy minimised andthen underwent 0.5 ns of protein restrained dynamics to
allow lipid relaxation. This was followed by 15 ns ofproduction MD.
Simulation protocols
The OmpANMR, OmpX and PagP simulations wereperformed using GROMACS v3.14 (Lindahl et al. 2001)(see also www.gromacs.org); v2 was used for OmpAPX
(Bond and Sansom 2003). The GROMOS96 force Weld(van Gunsteren et al. 1996) was used for all simulations.Energy minimisations used up to 500 steps of steepestdescents. During protein restrained runs, harmonic positionrestraints with force constants of 10 kJ mol¡1 Å¡2 per atomwere applied to all non-hydrogen atoms. Electrostatic ener-gies were calculated using particle mesh Ewald (Dardenet al. 1993) with a 10 Å cut-oV for the real space calcula-tions. A cut-oV of 10 Å was also used for van der Waalsinteractions. All the simulations were performed at constanttemperature, pressure and number of particles. The temper-atures of the lipid, solvent (i.e. water and ions) and proteinswere coupled separately. The Berendsen temperaturecoupling algorithm (Berendsen et al. 1984) was applied at310 K, i.e. well above the main phase transition tempera-ture of DMPC TM = 297 K, with coupling constant �T =0.1 ps, and the system pressure was isotropically coupledusing a Berendsen barostat (Berendsen et al. 1981) at 1 barwith coupling constant �P = 1 ps. The timestep for integrationwas 2 fs, and coordinates and velocities were saved every 5 ps.The LINCS algorithm was used throughout to restrain bondlengths (Hess et al. 1997). Trajectories have been deposited inthe BioSimGRID database (www.biosimgrid.org).
Secondary structure analysis used DSSP (Kabsch andSander 1983). VMD (Humphrey et al. 1996) and Rasmol(Sayle and Milner-White 1995) were used for visualisation.Convergence analysis (Bond and Sansom 2003; Faraldo-Gómez et al. 2004) was carried out on the Wnal 10 ns ofeach simulation: average mean square Xuctuation (MSF)values were calculated for time windows of 0.1, 0.25, 0.5,1, 2, 4 and 8 ns. In each case the MSF values are evaluatedseparately for TM and non-TM residues. Principal component
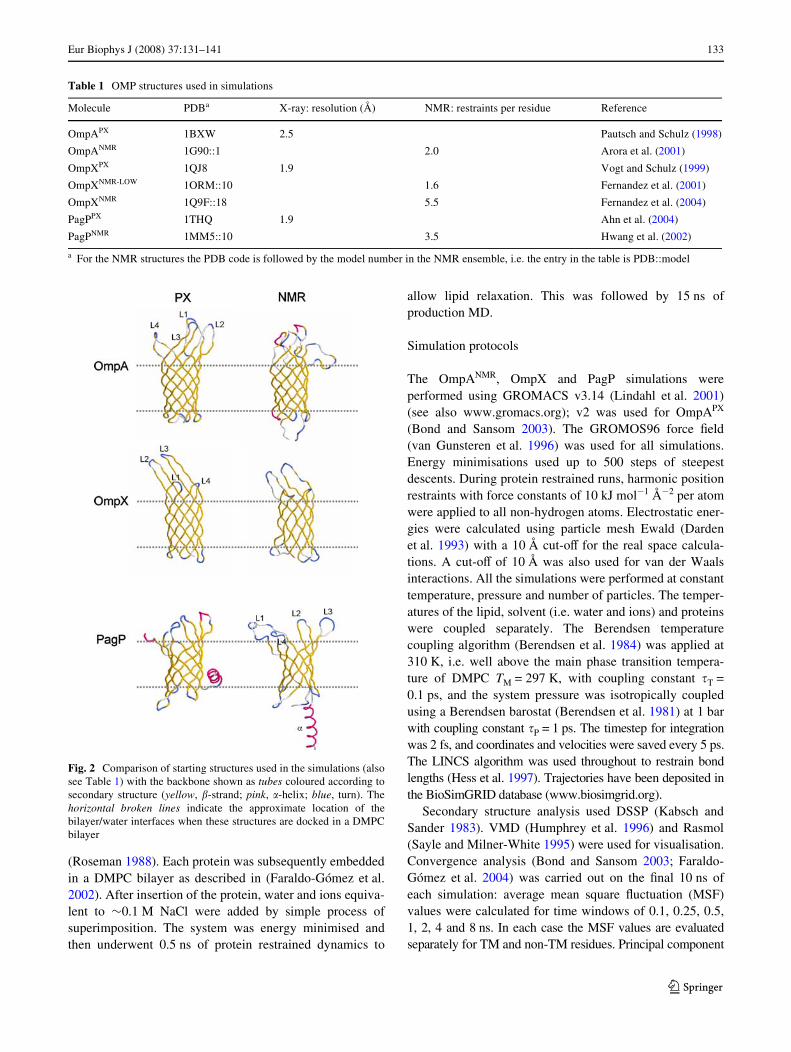
Fig. 2 Comparison of starting structures used in the simulations (alsosee Table 1) with the backbone shown as tubes coloured according tosecondary structure (yellow, �-strand; pink, �-helix; blue, turn). Thehorizontal broken lines indicate the approximate location of thebilayer/water interfaces when these structures are docked in a DMPCbilayer
Table 1 OMP structures used in simulations
a For the NMR structures the PDB code is followed by the model number in the NMR ensemble, i.e. the entry in the table is PDB::model
Molecule PDBa X-ray: resolution (Å) NMR: restraints per residue Reference
OmpAPX 1BXW 2.5 Pautsch and Schulz (1998)
OmpANMR 1G90::1 2.0 Arora et al. (2001)
OmpXPX 1QJ8 1.9 Vogt and Schulz (1999)
OmpXNMR-LOW 1ORM::10 1.6 Fernandez et al. (2001)
OmpXNMR 1Q9F::18 5.5 Fernandez et al. (2004)
PagPPX 1THQ 1.9 Ahn et al. (2004)
PagPNMR 1MM5::10 3.5 Hwang et al. (2002)
123

134 Eur Biophys J (2008) 37:131–141
analysis of the covariance matrix of the positional Xuctua-tions of the C� atoms was performed as described by (Amadeiet al. 1993; Garcia 1992). This matrix was generated fromthe Wnal 10 ns of each trajectory.
Results
Starting structures
Visual inspection of the starting structures (Fig. 2) revealsdiVerences between the PX and NMR structures, mainly inthe conformations of the extracellular loops (and of theN-terminal �-helix in the case of PagP), but also in someaspects of the local secondary structure of the TM barrels.These diVerences reXect the diVerent experimental condi-tions and techniques used during structure determination. Inparticular, they are likely to reXect diVerences in the envi-ronment of the Xexible loops experienced by the proteins indetergent micelles (for the NMR experiments) and in crys-tal lattices (for the X-ray studies) (see, e.g. Bond et al.2006, for a simulation perspective of OmpA loop mobilitywithin a crystal). The starting structures may also be com-pared by calculation of the root mean squared deviations(RMSDs) of the equivalent C� atoms in the PX and NMRstructures (Table 2). It can be seen that in each case theRMSDs are signiWcantly higher for the residues outside theTM region (i.e. the loops and turns) than for the �-barrelresidues within the TM region. Comparing the TM residueRMSDs between structures, they are higher for OmpA (alower resolution PX structure), and for the comparison ofOmpXNMR-LOW (which has a small number of restraints perresidue) with OmpXPX. More generally, if the structures areordered according to a common ‘quality’/resolution scale,one obtains starting from the highest quality structure:OmpXPX
t PagPPX > OmpAPX > OmpXNMR > PagPNMR >
OmpANMR > OmpXNMR-LOW. The higher quality structureshave a lower RMSD between their TM residues (OmpXand PagP), whereas the lower quality structures yield a higherRMSD for those residues (OmpA and OmpXNMR-LOW).However, this does not remain true for the non-TM resi-dues where no direct correlation with the quality of thestarting structure can be seen.
Each structure was energy minimised prior to the simu-lations. Comparing the potential energies (per residue) ofthe resultant minimised structures (Table 3) does not revealany correlation between the origin of the structure (PX ver-sus NMR) and the potential energy of the protein followingminimisation. Note that the potential energies per residuecited are therefore after minimisation to a local energy min-imum nearest to the published structure. Thus, the analysisdemonstrated the absence of a simple correlation betweenthe experimental method used and the corresponding force-Weld energy for the (locally) minimised structure. It is inter-esting to note that NMR structures can be of slightly lowerenergy, even though they are derived from relatively fewrestraints per residue.
Table 3 Summary of simulations
Each simulation was of 15 ns duration. The number of lipid (DMPC) molecules varied between 105 and 113 molecules. The number of watersranged from »4,800 to »5,600, and the total numbers of atoms from »21,000 to »24,000a Calculated for the local minimum closest to the experimental starting structure after 100 steps of energy minimisation of the proteinb Calculated for the last 5 ns of each simulation
Simulation Potential energy of proteina (kJ mol¡1)
Potential energy per residuea (kJ mol¡1)
Finalb C� RMSD for TM residues (Å)
Finalb C� RMSD for non-TM residues (Å)
OmpAPX ¡0.52 £ 104 ¡30.4 1.34 § 0.04 3.57 § 0.25
OmpANMR ¡1.36 £ 104 ¡79.5 3.08 § 0.86 8.00 § 0.44
OmpXPX ¡1.28 £ 104 ¡86.5 0.87 § 0.53 4.40 § 0.26
OmpXNMR-LOW ¡0.51 £ 104 ¡34.5 2.90 § 0.07 4.38 § 0.18
OmpXNMR ¡0.94 £ 104 ¡64.0 2.00 § 0.80 4.90 § 0.25
PagPPX ¡1.02 £ 104 ¡62.6 1.21 § 0.07 4.24 § 0.24
PagPNMR ¡0.83 £ 104 ¡51.0 1.32 § 0.05 7.51 § 0.27
Table 2 RMSDs between NMR and PX structures
a C� RMSD between NMR starting structure used in simulation andPX starting structure, Wtted onto the PX structureb Contains the L1 loop, nine missing residues of which were built viahomology modelling
Molecule RMSDa (Å)
All residues
TM residues
Non-TM residues
OmpA 7.4 3.7 10.0
OmpXNMR-LOW 5.1 3.5 6.2
OmpX 3.2 1.9 4.5
PagP 12.0 1.6 14.8b
123

Eur Biophys J (2008) 37:131–141 135
Structural drift
The overall drift of a membrane protein structure from itsinitial conformation during a simulation provides a crudemeasure of the ‘stability’ of a structure in its membraneenvironment. Structural drifts for each simulation can bequantiWed by calculating the RMSD with respect to time ofthe C� atoms from the starting structure. For this purposewe divided the structure into TM, and non-TM regions(Fig. 3; Table 3).
For each simulation the RMSDs are, as expected, lowerfor the TM region than for the non-TM region. Comparingthe two OmpA simulations, the RMSDs are signiWcantlyhigher when starting from the NMR structure, both for theTM (i.e. �-barrel) and non-TM (i.e. loop and turn) regions.In both OmpA simulations the main initial rise in RMSD iscomplete after »9 ns.
For the OmpX simulations, as the ‘quality’ of the struc-ture decreases the RMSD of the TM region increases, i.e.OmpXNMR-LOW > OmpXNMR > OmpXPX. For the non-TM
regions the equivalent RMSDs are all in the range 4–5 Å.Thus it would appear that the ‘quality’ of the structuremainly inXuences the simulation stability of the TM �-barrel.In both OmpXPX and OmpXNMR simulations, the initiallyrising RMSD reaches a plateau at »2 ns. However for theOmpXNMR-LOW simulation (data not shown), the TM regionRMSD levels oV but the non-TM RMSD continues to drift.
For all of the simulations, Procheck (Laskowski et al.1993) was used to assess the stereochemical quality of theprotein structure before and after the simulation. For the PXstructure-based simulations, there was some drift of �-barrelresidues from the most favoured region to the additionallyallowed regions. For the simulations based on NMR struc-tures, the corresponding drift was less, possibly as a resultof a poorer stereochemical quality of the starting structures.This may help to explain the higher TM region RMSD forthe NMR-based simulations, as it has been shown that thereis a correlation between backbone stereochemical qualityand Wnal RMSD in membrane protein simulations (Lawet al. 2005).
Fig. 3 Root mean square deviation (RMSD) of the C� atoms versus time for the a OmpAPX; b OmpANMR; C OmpXPX; d OmpXNMR, e PagPPX and f PagPNMR simula-tions. In each case the structures from the simulation were Wtted to the initial structure relative to which the RMSD was evaluated. The black and grey lines give the RMSDs for the transmembrane and non-transmembrane residues, respectively
123
136 Eur Biophys J (2008) 37:131–141
For all three proteins, the non-TM RMSDs are high,even for the PX structures. Such elevated RMSDs may reX-ect the release of restraints formed by crystal contacts. Forexample, the large extracellular ‘Xag’ of OmpXPX forms amajor crystal contact between the L3 loops of adjacentmonomers, and in PagPPX the L4 loop is stabilised by acontact to turn T2. When comparing simulations of globu-lar proteins starting from both NMR and PX structures (Fanand Mark 2003) it was noted that for those PX structuresthat gave a core backbone RMSD >3 Å this was mainly dueto the release of crystal packing forces.
C� RMSD matrices were calculated to enable a pairwisecomparison of each structure within a PX trajectory witheach structure within the corresponding NMR trajectory.Such analysis (data not shown) did not provide any supportfor convergence of the PX and NMR structures over thecourse of the simulations. This may reXect the incompletesampling of membrane protein conformational dynamicson a »10 ns timescale (Faraldo-Gómez et al. 2004). Tocheck this, the RMSD of structures along each NMR simu-lation was calculated against the Wnal structure from thecorresponding PX simulation. Again, these results did notsuggest convergence of the NMR and PX simulations.
Convergence analysis
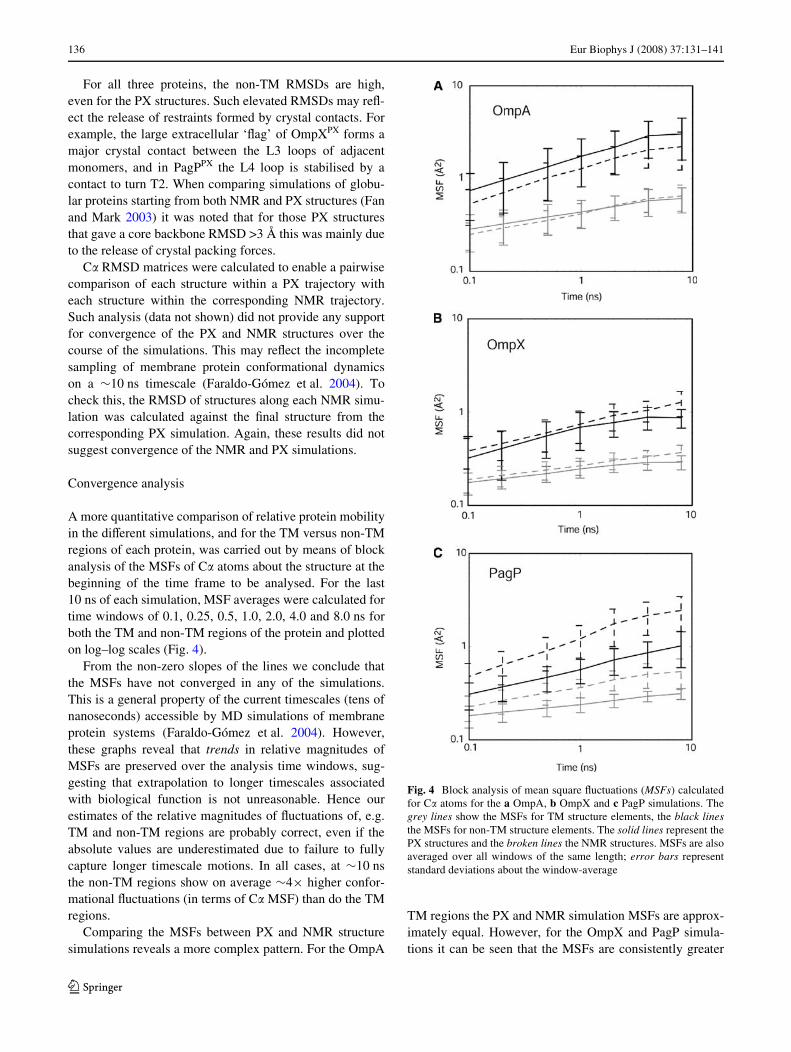
A more quantitative comparison of relative protein mobilityin the diVerent simulations, and for the TM versus non-TMregions of each protein, was carried out by means of blockanalysis of the MSFs of C� atoms about the structure at thebeginning of the time frame to be analysed. For the last10 ns of each simulation, MSF averages were calculated fortime windows of 0.1, 0.25, 0.5, 1.0, 2.0, 4.0 and 8.0 ns forboth the TM and non-TM regions of the protein and plottedon log–log scales (Fig. 4).
From the non-zero slopes of the lines we conclude thatthe MSFs have not converged in any of the simulations.This is a general property of the current timescales (tens ofnanoseconds) accessible by MD simulations of membraneprotein systems (Faraldo-Gómez et al. 2004). However,these graphs reveal that trends in relative magnitudes ofMSFs are preserved over the analysis time windows, sug-gesting that extrapolation to longer timescales associatedwith biological function is not unreasonable. Hence ourestimates of the relative magnitudes of Xuctuations of, e.g.TM and non-TM regions are probably correct, even if theabsolute values are underestimated due to failure to fullycapture longer timescale motions. In all cases, at »10 nsthe non-TM regions show on average »4£ higher confor-mational Xuctuations (in terms of C� MSF) than do the TMregions.
Comparing the MSFs between PX and NMR structuresimulations reveals a more complex pattern. For the OmpA
TM regions the PX and NMR simulation MSFs are approx-imately equal. However, for the OmpX and PagP simula-tions it can be seen that the MSFs are consistently greater
Fig. 4 Block analysis of mean square Xuctuations (MSFs) calculatedfor C� atoms for the a OmpA, b OmpX and c PagP simulations. Thegrey lines show the MSFs for TM structure elements, the black linesthe MSFs for non-TM structure elements. The solid lines represent thePX structures and the broken lines the NMR structures. MSFs are alsoaveraged over all windows of the same length; error bars representstandard deviations about the window-average
123
Eur Biophys J (2008) 37:131–141 137
for NMR simulations than for the PX simulations. Focusingon the non-TM regions, OmpA has a higher MSF for thePX than NMR simulation whereas for OmpX and PagP thereverse is true. This may reXect the more poorly deWnedconformations of the extracellular loops in the OmpA PXstructure, as has been suggested previously (Faraldo-Gómez et al. 2004). Indeed, coordinates were missing forseveral loop residues from the higher resolution structure ofOmpA (1QJP; Pautsch and Schulz 2000).
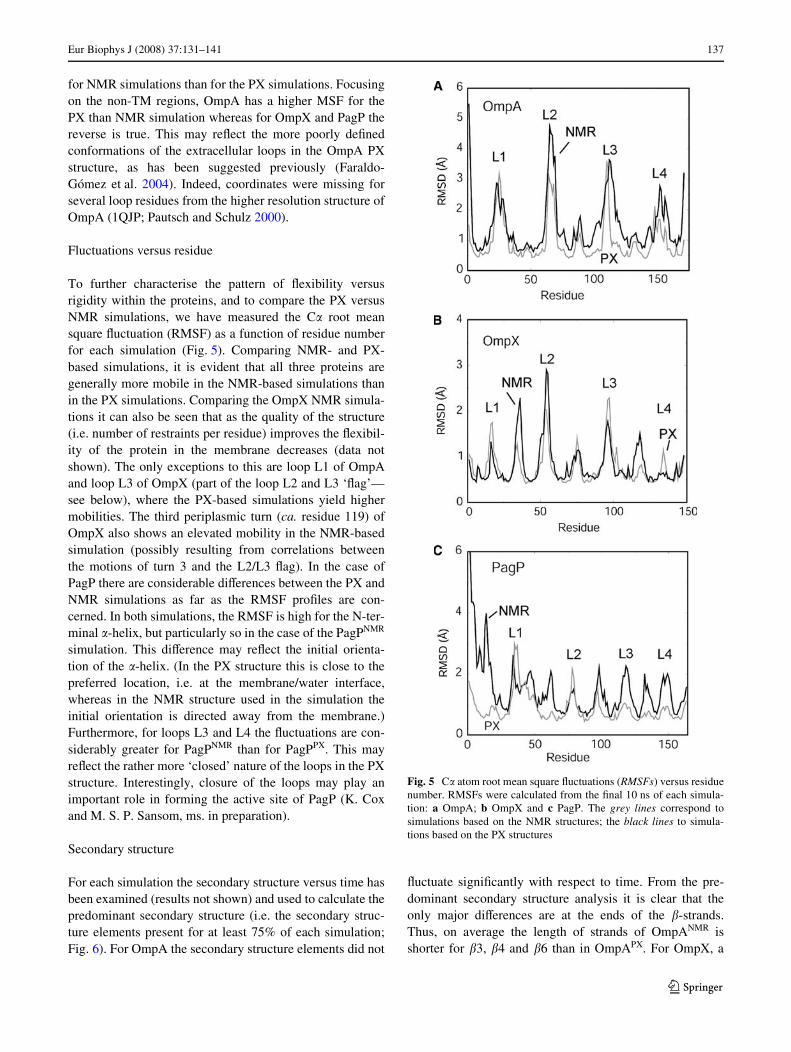
Fluctuations versus residue
To further characterise the pattern of Xexibility versusrigidity within the proteins, and to compare the PX versusNMR simulations, we have measured the C� root meansquare Xuctuation (RMSF) as a function of residue numberfor each simulation (Fig. 5). Comparing NMR- and PX-based simulations, it is evident that all three proteins aregenerally more mobile in the NMR-based simulations thanin the PX simulations. Comparing the OmpX NMR simula-tions it can also be seen that as the quality of the structure(i.e. number of restraints per residue) improves the Xexibil-ity of the protein in the membrane decreases (data notshown). The only exceptions to this are loop L1 of OmpAand loop L3 of OmpX (part of the loop L2 and L3 ‘Xag’—see below), where the PX-based simulations yield highermobilities. The third periplasmic turn (ca. residue 119) ofOmpX also shows an elevated mobility in the NMR-basedsimulation (possibly resulting from correlations betweenthe motions of turn 3 and the L2/L3 Xag). In the case ofPagP there are considerable diVerences between the PX andNMR simulations as far as the RMSF proWles are con-cerned. In both simulations, the RMSF is high for the N-ter-minal �-helix, but particularly so in the case of the PagPNMR
simulation. This diVerence may reXect the initial orienta-tion of the �-helix. (In the PX structure this is close to thepreferred location, i.e. at the membrane/water interface,whereas in the NMR structure used in the simulation theinitial orientation is directed away from the membrane.)Furthermore, for loops L3 and L4 the Xuctuations are con-siderably greater for PagPNMR than for PagPPX. This mayreXect the rather more ‘closed’ nature of the loops in the PXstructure. Interestingly, closure of the loops may play animportant role in forming the active site of PagP (K. Coxand M. S. P. Sansom, ms. in preparation).
Secondary structure
For each simulation the secondary structure versus time hasbeen examined (results not shown) and used to calculate thepredominant secondary structure (i.e. the secondary struc-ture elements present for at least 75% of each simulation;Fig. 6). For OmpA the secondary structure elements did not
Xuctuate signiWcantly with respect to time. From the pre-dominant secondary structure analysis it is clear that theonly major diVerences are at the ends of the �-strands.Thus, on average the length of strands of OmpANMR isshorter for �3, �4 and �6 than in OmpAPX. For OmpX, a
Fig. 5 C� atom root mean square Xuctuations (RMSFs) versus residuenumber. RMSFs were calculated from the Wnal 10 ns of each simula-tion: a OmpA; b OmpX and c PagP. The grey lines correspond tosimulations based on the NMR structures; the black lines to simula-tions based on the PX structures
123

138 Eur Biophys J (2008) 37:131–141
similar pattern is seen, with shorter strands for, e.g. �3, �4,�5 and �6 in the OmpXNMR simulation. For PagP thediVerence between the two simulations is less pronounced.Interestingly, given the diVerence in loop mobility notedabove, the secondary structure of L4 is less deWned in thePagPNMR than in the PagPPX simulation.
Principal components analysis
Principal components analysis has been employed to iden-tify the dominant motions in each simulation. The eigen-value proWles for the seven simulations (Table 4) reveal that
in all cases except one the Wrst two eigenvectors captured¸50% of the motion sampled during the simulation. How-ever, when the subspace overlap of the eigenvectors wascalculated for the covariance matrices from correspondingPX and NMR simulations (data not shown), for all the pair-wise covariance matrix comparisons a low dot product wasobserved, indicating that the essential motions of the twosystems were diVerent. This is presumed to reXect the rela-tive lack of convergence of the simulations (see above).
We have compared visually the nature of the Wrst twoprincipal motions (eigenvectors) for each structure and sim-ulation (Fig. 7). For both OmpA and OmpX these motionsare concentrated in the extracellular loops. The Wrst twoprincipal components for both OmpA simulations show thepresence of a concerted motion between loops L1, L2 andL3. From analysis of the displacement of the C� carbons ofthe OmpA simulations along the Wrst three eigenvectors, itcan be seen that the amplitude of the Xuctuations is similar(data not shown).
For OmpX, the principal motions are also concentratedin the loops, and especially in the L2/L3 Xag. However,there are signiWcant diVerences between the PX- and NMR-based simulations, as can be seen from Fig. 7. In particular,for eigenvectors 1 and 3 of OmpXPX the loop motion domi-nates, but for eigenvector 2 there is a correlated motionbetween the Xag loops (L2 and L3) and the Wrst �-hairpin(i.e. �1–L1–�2). These Xuctuations are ampliWed in theOmpXNMR simulations.
For the PagP simulations, comparison of the principalmotions revealed a more complex behaviour. For example,a concerted motion can be detected between the N-terminal�-helix and the L1 extracellular loop in the PagPNMR simu-lation, whereas the same motion is virtually absent from thePagPPX simulation. These diVerences in sampled motionspresumably reXect the rather diVerent orientations of the �-helix in the PX and NMR structures.
In general, there appears to be a correlation in the rela-tive magnitude of the principal motions between the corre-sponding PX and NMR based simulations. However, amore detailed residue-by-residue comparison of the anglesbetween the displacements corresponding to the Wrst eigen-vectors (data not shown) revealed somewhat imperfect cor-relations, suggesting that the two simulations have sampleddiVerent regions of subspace. Again, this probably resultsfrom incomplete sampling during 15 ns simulations.
Pores
A number of measurements of ionic currents using OmpAand OmpX reconstituted into planar lipid bilayers have sug-gested that these proteins are capable of forming ion perme-able pores (Dupont et al. 2004). (There have not been anysuggestions of pore formation by PagP.) Previous simulation
Fig. 6 Dominant secondary structure (i.e. secondary structure, asdetermined using DSSP, maintained for >75% of the simulation,calculated over the whole duration of each 15 ns simulation) for:a OmpAPX; b OmpANMR; c OmpXPX; d OmpXNMR, e PagPPX andf PagPNMR. Red, �-sheet; grey, coil; green, bend; yellow, turn; andblue, �-helix
Table 4 Percentage of motions represented by the eigenvectors
Simulation Percentage motion of eigenvector
Eigenvectors 1 and 2
Eigenvectors 1–5
Eigenvectors 1–10
OmpAPX 55 71 80
OmpANMR 55 75 83
OmpXPX 37 54 66
OmpXNMR-LOW 50 66 76
OmpXNMR 52 69 78
PagPPX 50 61 72
PagPNMR 65 78 85
123
Eur Biophys J (2008) 37:131–141 139
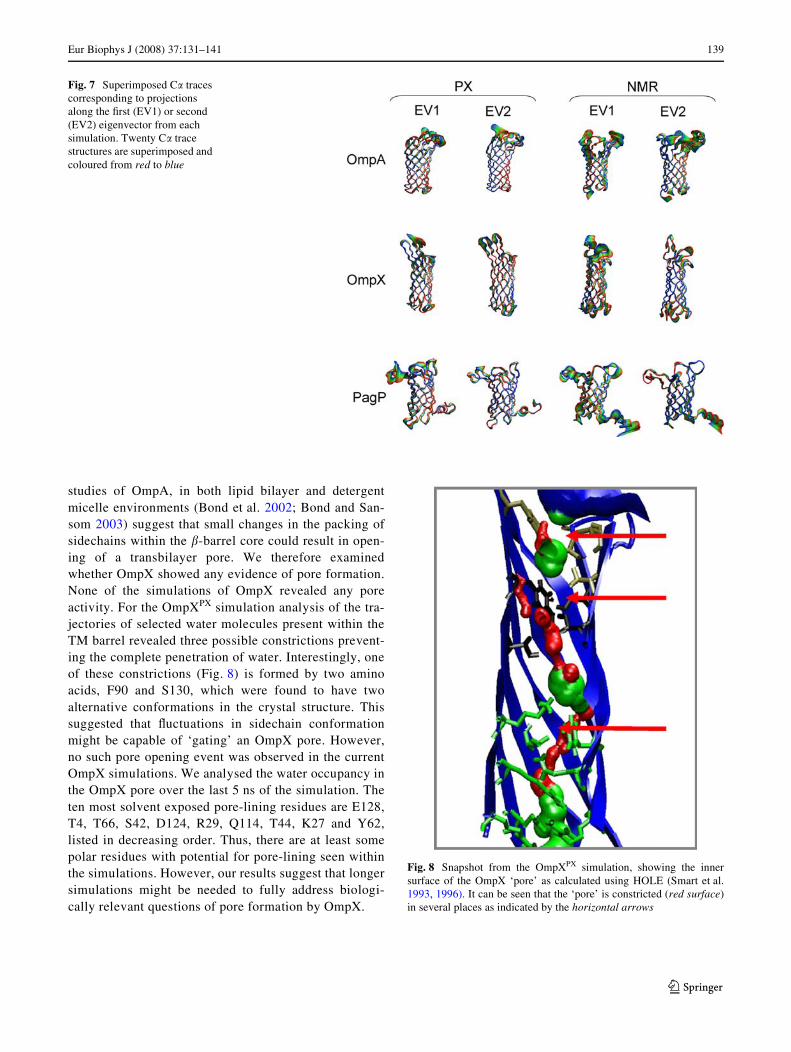
studies of OmpA, in both lipid bilayer and detergentmicelle environments (Bond et al. 2002; Bond and San-som 2003) suggest that small changes in the packing ofsidechains within the �-barrel core could result in open-ing of a transbilayer pore. We therefore examinedwhether OmpX showed any evidence of pore formation.None of the simulations of OmpX revealed any poreactivity. For the OmpXPX simulation analysis of the tra-jectories of selected water molecules present within theTM barrel revealed three possible constrictions prevent-ing the complete penetration of water. Interestingly, oneof these constrictions (Fig. 8) is formed by two aminoacids, F90 and S130, which were found to have twoalternative conformations in the crystal structure. Thissuggested that Xuctuations in sidechain conformationmight be capable of ‘gating’ an OmpX pore. However,no such pore opening event was observed in the currentOmpX simulations. We analysed the water occupancy inthe OmpX pore over the last 5 ns of the simulation. Theten most solvent exposed pore-lining residues are E128,T4, T66, S42, D124, R29, Q114, T44, K27 and Y62,listed in decreasing order. Thus, there are at least somepolar residues with potential for pore-lining seen withinthe simulations. However, our results suggest that longersimulations might be needed to fully address biologi-cally relevant questions of pore formation by OmpX.
Fig. 7 Superimposed C� traces corresponding to projections along the Wrst (EV1) or second (EV2) eigenvector from each simulation. Twenty C� trace structures are superimposed and coloured from red to blue
Fig. 8 Snapshot from the OmpXPX simulation, showing the innersurface of the OmpX ‘pore’ as calculated using HOLE (Smart et al.1993, 1996). It can be seen that the ‘pore’ is constricted (red surface)in several places as indicated by the horizontal arrows
123

140 Eur Biophys J (2008) 37:131–141
Discussion
These studies suggest that there are diVerences in the con-formational dynamics between OMP simulations based onPX versus on NMR structures. At present it is diYcult todissect out those diVerences which are a consequence of thevarious environments (crystal versus detergent micelle) usedin the structure determinations (Bond and Sansom 2003),those diVerences which arise from the variable quality of thestarting structures, and thus diVerences due to incompletesampling on a »10 ns timescale. However, common pat-terns between NMR and PX structure simulations doemerge, providing a strong indication of those simulationfeatures that are robust to changes in starting structure.
It is important to recognise that simulations based onNMR structures of OMPs do yield meaningful data, espe-cially in the context of the emergence of further membraneprotein structures based on NMR techniques upon whichsimulation studies may be based. Whilst we note that arecent simulation study of water soluble proteins has sug-gested that a signiWcant number of NMR structures may beless stable than their crystallographic counterparts (Fan andMark 2003), for the OMPs any such diVerences in stabilityof the TM regions (i.e. �-barrels) are relatively low. It isalso important to note that NMR methods for membraneprotein structure are advancing (Arora and Tamm 2001;Fernández and Wüthrich 2003) and as higher quality NMRstructures become available (Fernandez et al. 2004) thereliability of subsequent simulations also improves. How-ever, the number of restraints per residue is still low formembrane protein structures compared to their water solu-ble counterparts. For example, even the ‘best’ NMR struc-ture of an OMP (OmpX and 1Q9F) has only »6 restraintsper residue. In contrast, for many water soluble proteinsNMR structures with ¸20 restraints per residue (compara-ble to a 2.0–2.5 Å resolution PX structure) are available.
In terms of mobility, the overall patterns observed aresimilar to those seen in previous simulations (Baaden et al.2003; Baaden and Sansom 2004; Bond and Sansom 2003;Faraldo-Gómez et al. 2003; Tieleman and Berendsen1998), i.e. extracellular loop residues are more mobile thanTM �-barrel residues. In general the mobility is a littlehigher for NMR than for PX structures. Of course, onemust remember that the current simulations are in a DMPCmembrane, i.e. under in vitro conditions. In vivo the outerleaXet of the OM is composed of lipopolysaccharide, theconformational dynamics of which (Lins and Straatsma2001; Shroll and Straatsma 2002, 2003) are likely to modu-late the behaviour of the protein.
To this extent, we can see that PX and NMR structuresyield similar information on OMP Xexibility. However, atthe level of more detailed analysis of the conformationalspaces occupied by the principal motions, there is limited
overlap between the two classes of simulation. This sug-gests an upper bound on the level of interpretation of simu-lations of OMPs of duration 10–20 ns. To address moregeneric aspects of pore function and of protein–lipid inter-actions for these systems, one probably needs to extend thesimulations by an order of magnitude.
These simulations have probed some similarities andsome diVerences of the conformational dynamics based onNMR versus PX structures of OMPs. A number of othersimulations have explored the conformational dynamics ofOMPs in bilayer, detergent micelle (Böckmann andCaXisch 2005; Bond et al. 2004; Bond and Sansom 2003)and crystal (P. J. Bond and M. S. P. Sansom, ms. in prepa-ration) environments. There remains a need to extend suchstudies to a wider range of membrane proteins in order tomore fully understand the inXuence of both environmentand structure quality on the dynamics of membrane pro-teins, and in order to relate diVerences in conformation anddynamics (e.g. in PagP; Hwang et al. 2004) to membraneprotein function. In particular, the structures of a number ofsimpler �-helical membrane proteins have now been deter-mined by NMR, including the glycophorin A TM helixdimer (MacKenzie et al. 1997), Mistic (Roosild et al. 2005)and MerF (Howell et al. 2005). Thus an understanding ofthe inXuence of the quality of �-helical membrane proteinstructures in simulations should also soon be possible.
Acknowledgements KC was a BBSRC research student. Researchin MSPS’s laboratory is funded by the BBSRC, EPSRC and the Well-come Trust. Our thanks to all of our colleagues, especially SundeepDeol and Charles Blundell.
References
Ahn VE, Lo EI, Engel CK, Chen L, Hwang PM, Kay LE, Bishop RE,Privé GG (2004) A hydrocarbon ruler measures palmitate in theenzymatic acylation of endotoxin. EMBO J 23:2931–2941
Amadei A, Linssen ABM, Berendsen HJC (1993) Essential dynamicsof proteins. Proteins: Struc Funct Genet 17:412–425
Arora A, Abildgaard F, Bushweller JH, Tamm LK (2001) Structure ofouter membrane protein A transmembrane domain by NMR spec-troscopy. Nature Struct Biol 8:334–338
Arora A, Tamm LK (2001) Biophysical approaches to membrane pro-tein structure determination. Curr Opin Struct Biol 11:540–547
Baaden M, Meier C, Sansom MSP (2003) A molecular dynamicsinvestigation of mono- and dimeric states of the outer membraneenzyme OMPLA. J Mol Biol 331:177–189
Baaden M, Sansom MSP (2004) OmpT: molecular dynamics simula-tions of an outer membrane enzyme. Biophys J 87:2942–2953
Berendsen HJC, Postma JPM, van Gunsteren WF, DiNola A, Haak JR(1984) Molecular dynamics with coupling to an external bath. JChem Phys 81:3684–3690
Berendsen HJC, Postma JPM, van Gunsteren WF, Hermans J (1981)Intermolecular forces. Reidel, Dordrecht
Böckmann RA, CaXisch A (2005) Spontaneous formation of detergentmicelles around the outer membrane protein OmpX. Biophys J86:3191–3204
123
Eur Biophys J (2008) 37:131–141 141
Bond PJ, Cuthbertson JM, Deol SD, Sansom MSP (2004) MD simula-tions of spontaneous membrane protein/detergent micelle forma-tion. J Am Chem Soc 126:15948–15949
Bond PJ, Faraldo-Gómez JD, Deol SS, Sansom MSP (2006)Membrane protein dynamics and detergent interactions within acrystal: a simulation study of OmpA. Proc Natl Acad Sci USA103:9518–9523
Bond PJ, Faraldo-Gómez JD, Sansom MSP (2002) OmpA—a pore or nota pore? Simulation and modelling studies. Biophys J 83:763–775
Bond PJ, Sansom MSP (2003) Membrane protein dynamics vs. envi-ronment: simulations of OmpA in a micelle and in a bilayer. J MolBiol 329:1035–1053
Buchanan SK (1999) b-Barrel proteins from bacterial outer membranes:structure, function and refolding. Curr Opin Struct Biol 9:455–461
Darden T, York D, Pedersen L (1993) Particle mesh Ewald—anN.log(N) method for Ewald sums in large systems. J Chem Phys98:10089–10092
Domene C, Bond P, Sansom MSP (2003) Membrane protein simula-tion: ion channels and bacterial outer membrane proteins. AdvProt Chem 66:159–193
Dupont M, Dé E, Chollet R, Chevalier J, Pagès JM (2004) Enterobacteraerogenes OmpX, a cation-selective channel mar- and osmo-regulated. FEBS Lett 569:27–30
Fan H, Mark AE (2003) Relative stability of protein structures deter-mined by X-ray crystallography or NMR spectroscopy: a molec-ular dynamics simulation study. Proteins: Struct Funct Bioinf53:111–120
Faraldo-Gómez JD, Forrest LR, Baaden M, Bond PJ, Domene C,Patargias G, Cuthbertson J, Sansom MSP (2004) Conformationalsampling and dynamics of membrane proteins from 10-nanosecondcomputer simulations. Proteins: Struct Funct Bioinf 57:783–791
Faraldo-Gómez JD, Smith GR, Sansom MSP (2002) Setup and optimi-sation of membrane protein simulations. Eur Biophys J 31:217–227
Faraldo-Gómez JD, Smith GR, Sansom MSP (2003) Moleculardynamics simulations of the bacterial outer membrane proteinFhuA: a comparative study of the ferrichrome-free and boundstates. Biophys J 85:1–15
Fernandez C, Hilty C, Bonjour S, Adeishvili K, Pervushin K, WüthrichK (2001) Solution NMR studies of the integral membrane proteinsOmpX and OmpA from Escherichia coli. FEBS Lett 504:173–178
Fernandez C, Hilty C, Wider G, Güntert P, Wüthrich K (2004) NMRstructure of the integral membrane protein OmpX. J Mol Biol336:1211–1221
Fernández C, Wüthrich K (2003) NMR solution structure determina-tion of membrane proteins reconstituted in detergent micelles.FEBS Lett 555:144–150
Fiser A, Kinh Gian Do R, Sali A (2000) Modeling of loops in proteinstructures. Prot Sci 9:1753–1773
Garcia AE (1992) Large-amplitude nonlinear motions in proteins.Phys Rev Lett 68:2696–2699
Hess B, Bekker H, Berendsen HJC, Fraaije JGEM (1997) LINCS: alinear constraint solver for molecular simulations. J Comp Chem18:1463–1472
Howell SC, Mesleh MF, Opella SJ (2005) NMR structure determina-tion of a membrane protein with two transmembrane helices inmicelles: MerF of the bacterial mercury detoxiWcation system.Biochemistry 44:5196–5206
Humphrey W, Dalke A, Schulten K (1996) VMD—visual moleculardynamics. J Molec Graph 14:33–38
Hwang PM, Bishop RE, Kay LE (2004) The integral membrane en-zyme PagP alternates between two dynamically distinct states.Proc Natl Acad Sci USA 101:9618–9623
Hwang PM, Choy WY, Lo EI, Chen L, Forman-Kay JD, Raetz CRH,Privé GG, Bishop RE, Kay LE (2002) Solution structure anddynamics of the outer membrane enzyme PagP by NMR. ProcNatl Acad Sci USA 99:13560–13565
Kabsch W, Sander C (1983) Dictionary of protein secondary structure:pattern-recognition of hydrogen-bonded and geometrical fea-tures. Biopolymers 22:2577–2637
Koebnik R, Locher KP, Van Gelder P (2000) Structure and function ofbacterial outer membrane proteins: barrels in a nutshell. MolMicrobiol 37:239–253
Laskowski RA, Macarthur MW, Moss DS, Thornton JM (1993) Pro-check—a program to check the stereochemical quality of proteinstructures. J Appl Cryst 26:283–291
Law RJ, Capener C, Baaden M, Bond PJ, Campbell J, Patargias G, Arin-aminpathy Y, Sansom MSP (2005) Membrane protein structure qual-ity in molecular dynamics simulation. J Mol Graph Mod 24:157–165
Lindahl E, Hess B, van der Spoel D (2001) GROMACS 3.0: a packagefor molecular simulation and trajectory analysis. J Molec Model7:306–317
Lins RD, Straatsma TP (2001) Computer simulation of the rough lipo-polysaccharide membrane of Pseudomonas aeruginosa. BiophysJ 81:1037–1046
MacKenzie KR, Prestegard JH, Engelman DM (1997) A transmembranehelix dimer: structure and implications. Science 276:131–133
Pautsch A, Schulz GE (1998) Structure of the outer membrane proteinA transmembrane domain. Nature Struct Biol 5:1013–1017
Pautsch A, Schulz GE (2000) High-resolution structure of the OmpAmembrane domain. J Mol Biol 298:273–282
Roosild TP, Greenwald J, Vega M, Castronovo S, Riek R, Choe S(2005) NMR structure of Mistic, a membrane-integrating proteinfor membrane protein expression. Science 307:1317–1321
Roseman MA (1988) Hydrophilicity of polar amino acid side-chains ismarkedly reduced by Xanking peptide bonds. J Mol Biol200:513–522
Sali A, Blundell TL (1993) Comparative protein modeling by satisfac-tion of spatial restraints. J Mol Biol 234:779–815
Sayle RA, Milner-White EJ (1995) RasMol: biomolecular graphics forall. Trends Biochem Sci 20:374–376
Schulz GE (2000) b-Barrel membrane proteins. Curr Opin Struct Biol10:443–447
Shroll RM, Straatsma TP (2002) Molecular structure of the outerbacterial membrane of Pseudomonas aeruginosa via classicalsimulation. Biopolymers 65:395–407
Shroll RM, Straatsma TP (2003) Molecular basis for microbial adhe-sion to geochemical surfaces: computer simulation of Pseudomo-nas aeruginosa adhesion to goethite. Biophys J 84:1765–1772
Smart OS, Goodfellow JM, Wallace BA (1993) The pore dimensionsof gramicidin A. Biophys J 65:2455–2460
Smart OS, Neduvelil JG, Wang X, Wallace BA, Sansom MSP (1996)Hole: a program for the analysis of the pore dimensions of ionchannel structural models. J Mol Graph 14:354–360
Snyder DA, Bhattacharya A, Huang YJ, Montelione GT (2005)Assessing precision and accuracy of protein structures derivedfrom NMR data. Proteins: Struc Funct Bioinf 59:655–661
Spronk C, Linge JP, Hilbers CW, Vuister GW (2002) Improving thequality of protein structures derived by NMR spectroscopy. J Bio-mol NMR 22:281–289
Tieleman DP, Berendsen HJC (1998) A molecular dynamics study ofthe pores formed by Escherichia coli OmpF porin in a fully hy-drated palmitoyloleoylphosphatidylcholine bilayer. Biophys J74:2786–2801
van Gunsteren WF, Kruger P, Billeter SR, Mark AE, Eising AA, ScottWRP, Huneberger PH, Tironi IG (1996) Biomolecularsimulation: the GROMOS96 manual and user guide. Biomos &Hochschulverlag AG an der ETH Zurich, Groningen, Zurich
Vogt J, Schulz GE (1999) The structure of the outer membrane proteinOmpX from Escherichia coli reveals possible mechanisms ofvirulence. Structure Fold Des 7:1301–1309
Vriend G (1990) WhatIf—a molecular modeling and drug designprogram. J Mol Graph 8:52–56
123