
DSP2015Ekedebe_redacted.pdf - MD-SOAR
346
TOWSON UNIVERSITY OFFICE OF GRADUATE STUDIES TOWARDS EFFICIENT AND SECURED INTELLIGENT TRANSPORTATION SYSTEM (ITS) by Nnanna N. Ekedebe A Dissertation Presented to the faculty of Towson University in partial fulfillment of the requirements for the degree Doctor of Science Department of Computer and Information Sciences Towson University Towson, Maryland 21252 May, 2015
-
Upload
khangminh22 -
Category
Documents
-
view
1 -
download
0
Transcript of DSP2015Ekedebe_redacted.pdf - MD-SOAR

TOWSON UNIVERSITY
OFFICE OF GRADUATE STUDIES
TOWARDS EFFICIENT AND SECURED INTELLIGENT
TRANSPORTATION SYSTEM (ITS)
by
Nnanna N. Ekedebe
A Dissertation
Presented to the faculty of
Towson University
in partial fulfillment
of the requirements for the degree
Doctor of Science
Department of Computer and Information Sciences
Towson University
Towson, Maryland 21252
May, 2015

ii
© 2015 By Nnanna N. Ekedebe
All Rights Reserved

iii

iv
Acknowledgements
I will be, forever, indebted to my advisor, Dr. Wei Yu, for all his support – financially, and
otherwise throughout the arduous years of this dissertation research endeavor/adventure;
the same goes to my co-advisor, committee member, and department chair, Dr. Chao Lu.
Both were, extraordinarily, instrumental in the production of this dissertation research.
During the trying and tumultuous days, weeks, months, and even years of little or no
productivity/results and the subsequent frustrations, atrophy, self-doubt, and paralysis that
ensued on my ability to successfully navigate/carryout this gigantic project – that I had
never done before – they provided fatherly patience/advice in assuring me that only
tenacious, and patient perseverance was requisite to see me through – and this has proven
to be most accurate.
I will also like to thank my committee members: Dr. Robert J. Hammell II, and Dr.
Alexander Wijesinha for their insightful and encouraging feedback; the knowledge I got
from taking their classes immensely aided the completion of this great dissertation project
and I am very grateful.
Special thanks to all my colleagues in the Cyber-Physical Networked System and Security
(CPNSS) Research Laboratory group/team, and the V2X Simulation Runtime Environment
(VSimRTI) developers’ team for their critical evaluation and timely feedback.
To my dear father: Sir Ben Ekedebe, and late dear mother: Lady Eunice Ugwuezi Ekedebe,
your labors were, thankfully, not in vain; as my Bible says: a wise son makes a glad father
and mother.

v
To all my other family members, friends, and foes alike not mentioned herein – solely
because of space limitations – I equally thank you sincerely.
Finally, and above all else, simply put: Thank You Jesus! You are my best Friend, Father,
God, LORD, and Savior – I love you and owe my life/existence to you! Herein my Father
has been glorified, and will always be glorified. It is the LORD!

vi
Abstract
TOWARDS EFFICIENT AND SECURED INTELLIGENT
TRANSPORTATION SYSTEM (ITS)
Nnanna N. Ekedebe
According to the National Highway Traffic Safety Administration (NHTSA), in the U.S.,
road traffic congestions, and accidents are responsible for over $80 billion economic loss,
and over 32,800 deaths per year. Intelligent transportation system (ITS)/vehicular ad hoc
networks (VANETs), however, promises improved mobility/traffic efficiency, safety,
security, and greener transportation, etc. using vehicle-to-vehicle (V2V), and/or vehicle-
to-infrastructure (V2I) communication. However, in light of the aforementioned
challenges, these proclaimed levels of improvements have not fully/comprehensively been
critically evaluated/examined especially in a realistic setting i.e. using real-world data, and
road networks as corroborated by several authors/authorities in the ITS/VANET domain
[1-14]; as a result, one of the major goals of this dissertation is to fill this pertinent gap.
Consequently, in this dissertation research, using both real-world road traffic data
consisting of a total of 6 months traffic data of the Maryland (MD)/Washington DC and
Virginia (VA) areas from July 1st, to December 31st, 2012 – of which 6 weeks of this was
used as a representative sample after a comprehensive/exhaustive data analysis – and real-
world road networks, we first evaluate the performance of two popular vehicular routing
algorithms namely: A* (Astar), and Dijkstra’s routing algorithms respecting travel time

vii
performance in our developed generic real-world ITS test-bed using both small, and large
road networks. Next, using the two major VANET architectures – V2V, and V2I
communication architectures – we evaluate their performance respecting safety and traffic
efficiency. In order to do this, we developed a mobile application we called Incident
Warning Application (IWA) of which IWA-equipped vehicles utilize this application to
evade a compound road accident consisting of a blocking of the entire roadway lanes,
presence of slippery/frozen ice, and reduced speed limit as a result of fog. Vehicles (classic
vehicles) unequipped with this mobile application are unaware of this congested condition
– they, therefore, drive heedlessly unto the congested road and eventually suffer the
consequences in the form of delayed arrival time/increased travel time. In addition, we
analyze the performance of V2V and V2I communication in the presence of a type of denial
of service (DoS) attack – jamming attack – with the view of ascertaining which is most
resilient/effective when part of the system is under attack or is being compromised also
respecting the evaluation metrics of traffic efficiency, and safety. Also, using our real-
world data, and road network, we evaluated the performance of over 24 supervised machine
learning classification, and regression algorithms with respect to the evaluation metrics of
predictive accuracy, and prediction speed with the view of having a comprehensive, and
comparative reference manual i.e. a taxonomy. Finally, we examine the influence of driver
distractions/attentiveness on traffic efficiency, and safety performances with our developed
Driver Notification Application (DNA) using two popular driver models/age groups –
young drivers (ages 16 – 25 years), and middle-age drivers (ages 30 – 45 years) respectively
employing ad hoc/decentralized communication.

viii
Overall, our results show that no significant difference respecting travel time performance
was observed between Dijkstra and A* (Astar) algorithms in both small, and large road
networks. Next, V2I communication outperformed V2V communication respecting traffic
efficiency, and safety performances before, and during the execution of the jamming
(availability) attack. Also, classification tree (Ctree), and regression tree (Rtree) gave the
best performances respecting predictive accuracy and prediction speed amongst all the
algorithms examined/evaluated. In general, with respect to all other evaluated supervised
machine learning algorithms, a tradeoff between speed, and accuracy is imperative and will
be largely dependent on the scenario in question i.e. this tradeoff must be determined on
an individual/case-by-case basis. Lastly, our results lucidly shows that middle-age drivers
outperformed younger drivers respecting their ability to maintain their
attention/concentration levels for longer time periods while in transit; thereby resulting in
better safety, and traffic efficiency performances.

ix
Table of Contents
Acknowledgements ......................................................................................................................... iv
Abstract ........................................................................................................................................... vi
List of Tables ................................................................................................................................ xvii
List of Figures .............................................................................................................................. xviii
Chapter 1 .......................................................................................................................................... 1
Introduction ...................................................................................................................................... 1
Motivation and Background ........................................................................................................ 1
Mitigating Transportation Challenges ......................................................................................... 4
Overview of Dissertation Research ............................................................................................. 6
Main Contributions of Research .................................................................................................. 7
Significance of Research .............................................................................................................. 9
Organization of Dissertation Research ...................................................................................... 11
Chapter 2 ........................................................................................................................................ 15
Issues and Review of Related Literature........................................................................................ 15
1. Improving Safety and Traffic Efficiency ........................................................................... 15
1.1 Ameliorating Road Traffic Congestions .................................................................... 15
1.2 Intelligent Transportation System (ITS) Routing Architectures ................................ 16
1.3 Intelligent Transportation System (ITS) Routing Algorithms ................................... 18
1.3.1 Performance Metrics .......................................................................................... 19
1.4 Dijkstra and A*(Astar) Algorithms................................................................................ 21
1.5 Improving the Scalability of Algorithms ....................................................................... 22
1.6 Evaluating Performance ................................................................................................. 23
1.7 Environmental Impacts .................................................................................................. 25
1.8 Intelligent Transportation System (ITS) Applications ................................................... 28
2. Future Traffic Pattern Prediction ....................................................................................... 30
3. Human Factors Challenges in Intelligent Transportation System (ITS) ............................ 33

x
4. Security and Privacy: Challenges and Countermeasures in Intelligent Transportation
System (ITS) .............................................................................................................................. 52
4.1 Security and Privacy .................................................................................................. 54
4.2 Agez Security Simulator ............................................................................................ 56
4.3 Mitigating Availability Attacks ................................................................................. 62
Research Tasks .............................................................................................................................. 68
Chapter 3 ........................................................................................................................................ 69
Routing in Intelligent Transportation System (ITS) ...................................................................... 69
1. Overview ............................................................................................................................ 69
2. Motivation .......................................................................................................................... 70
3. Need for Adaptive Routing ................................................................................................ 73
4. Background ........................................................................................................................ 75
4.4 Dijkstra Algorithm ..................................................................................................... 76
4.5 A* (Astar) Algorithm ................................................................................................. 77
5. Main Contributions: A Generic ITS Test-Bed ................................................................... 78
5.1 Test-bed Setup ........................................................................................................... 78
5.2 Real-world Dataset ..................................................................................................... 83
5.3 Evaluation Scenarios .................................................................................................. 85
Scenario A: Scalability ...................................................................................................... 85
Scenario B: Adaptive Routing ........................................................................................... 86
Scenario C: Variable Speed Sign (VSS) ............................................................................ 86
Scenario D: A Hybrid Combination of Scenarios A – C ................................................... 87
5.4 Performance Evaluation Metrics ................................................................................ 89
6. Performance Evaluation Results of Routing Algorithms ................................................... 90
7. Remarks ............................................................................................................................. 96
Chapter 4 ........................................................................................................................................ 97
Connected Vehicles Technology ................................................................................................... 97
1. Overview ............................................................................................................................ 97
2. Motivation .......................................................................................................................... 98
3. Background ...................................................................................................................... 101
4. Main Contributions: Simulation Setup ............................................................................ 105

xi
4.1 V2X Simulation Framework: VSimRTI Architecture ............................................. 105
4.2 Simulation Input and Parameters ............................................................................. 108
4.2.1 Traffic Simulator (SUMO)............................................................................... 109
4.2.2 Network Simulator (JiST/SWANS) ................................................................. 110
4.2.3 Network Simulator (VSimRTI Cellular Simulator) ......................................... 110
4.2.4 Application Simulator (VSimRTI_App) .......................................................... 111
4.2.5 Event Simulator (eWorld) ................................................................................ 112
4.3 Evaluation Scenarios ................................................................................................ 115
5. Evaluation Results and Discussion .................................................................................. 121
5.1 Vehicle-to-Infrastructure (V2I) Communication for Safety and Traffic Efficiency 121
5.2 Vehicle-to-Vehicle (V2V) Communication for Safety and Traffic Efficiency ........ 127
5.3 V2V versus V2I Communications: A Comparison .................................................. 135
6. Remarks ........................................................................................................................... 140
Chapter 5 ...................................................................................................................................... 144
Realistic Traffic Pattern Prediction in Intelligent Transportation System (ITS) ......................... 144
1. Overview .......................................................................................................................... 144
2. Motivation ........................................................................................................................ 145
3. Background ...................................................................................................................... 149
4. A Taxonomy of Machine Learning Algorithms............................................................... 157
1.1 Machine Learning Overview ................................................................................... 157
1.2 Unsupervised Learning ............................................................................................ 158
1.3 Supervised Learning ................................................................................................ 159
1.3.1 Supervised Learning Classification ................................................................. 160
1.3.2 Supervised Learning Regression ...................................................................... 161
1.3.3 Supervised Learning Steps ............................................................................... 161
1.4 Regression Algorithms ............................................................................................. 164
1.4.1 Regression Ensemble (Boosted and Bagged Decision Trees) ......................... 164
1.4.2 Linear Regression ............................................................................................ 164
1.4.3 Stepwise Regression ........................................................................................ 164
1.4.4 Robust Regression ........................................................................................... 165
1.4.5 Neural Networks .............................................................................................. 165

xii
1.4.5.1 Applications ................................................................................................. 165
1.4.5.2 Design Steps ................................................................................................. 166
1.4.5.3 Neural Network Fitting ................................................................................ 166
1.4.5.4 Neural Network Time Series ........................................................................ 167
1.5 Classification Algorithms ........................................................................................ 169
1.5.1 Discriminant Analysis ...................................................................................... 170
1.5.2 Naïve Bayes ..................................................................................................... 170
1.5.3 K-Nearest Neighbor (KNN) ............................................................................. 171
1.5.4 Decision Trees ................................................................................................. 171
1.5.5 RobustBoost ..................................................................................................... 172
1.5.6 Bagging/Bootstrap Aggregation ...................................................................... 172
1.5.7 Support Vector Machines (SVM) .................................................................... 172
1.5.8 Artificial Neural Network (ANN) .................................................................... 173
1.5.8.1 Neural Network Pattern Recognition ........................................................... 173
1.5.9 Ensemble Learning – TreeBagger .................................................................... 174
1.5.10 Generalized Linear Model ............................................................................... 174
1.6 Evaluating Performance ........................................................................................... 174
1.6.1 Residuals .......................................................................................................... 174
1.6.2 Mean-Square Error (MSE) ............................................................................... 175
1.6.3 Root Mean Squared Error (RMSE) .................................................................. 175
1.6.4 Regression Value (R Value) ............................................................................ 176
1.6.5 Confusion Matrix ............................................................................................. 176
1.6.6 Receiver Operating Characteristics (ROC) ...................................................... 177
1.6.7 Additional Metrics and Plots............................................................................ 177
2. Main Contributions: Experimental Setup ........................................................................ 178
2.1 Experimental Equipment.......................................................................................... 179
2.2 Real-world Dataset ................................................................................................... 179
2.3 Evaluation Scenarios and Evaluation Metrics.......................................................... 180
2.4 Scenario A (Prediction Accuracy) ........................................................................... 181
2.5 Scenario B (Prediction Efficiency) .......................................................................... 181
2.6 Evaluated Algorithms .............................................................................................. 182

xiii
2.6.1 Classification Taxonomy ................................................................................. 182
2.6.2 Regression Taxonomy...................................................................................... 182
3. Evaluation Results and Discussion .................................................................................. 183
3.1 Regression Results ................................................................................................... 183
3.1.1 Predictive Accuracy ......................................................................................... 183
3.1.2 Prediction Speed .............................................................................................. 184
3.1.3 Linear Regression (pValue) ............................................................................. 188
3.2 Classification Results ............................................................................................... 189
3.2.1 Predictive Accuracy ......................................................................................... 189
3.2.2 Prediction Speed .............................................................................................. 191
3.2.3 Confusion Matrix ............................................................................................. 193
3.2.4 Receiver Operating Characteristics (ROC) Curve ........................................... 194
3.2.5 Decision Trees ................................................................................................. 195
3.2.6 Treebagger ....................................................................................................... 197
3.3 Notable Contributions .............................................................................................. 199
4. Remarks ........................................................................................................................... 199
Chapter 6 ...................................................................................................................................... 201
Human Factors Challenges in Intelligent Transportation System (ITS) ...................................... 201
1. Overview .......................................................................................................................... 201
2. Motivation and Background ............................................................................................ 202
3. Main Contributions: A Generic Human Factors ITS Test-bed ........................................ 206
3.1 Test-bed Setup and Simulation Parameters.............................................................. 206
1.1.1 The V2X Simulation Framework (VSimRTI) Behavior Simulator ................. 208
1.1.2 Components of our VSimRTI Behavior Simulator .......................................... 209
1.1.2.1 Behavior Module.......................................................................................... 209
1.1.2.2 Traffic Simulators ........................................................................................ 210
1.1.2.3 Communication Simulators .......................................................................... 211
1.1.2.4 Application Simulators ................................................................................ 212
1.2 Evaluation Scenarios ................................................................................................ 213
1.3 Performance Evaluation Metrics .............................................................................. 215
2. Performance Evaluation Results and Discussion ............................................................. 215

xiv
2.1 Human Factors Challenge: Young Driver ........................................................... 216
2.2 Human Factors Challenge: Middle-age Driver .................................................... 219
2.3 Human Factors Challenge: Middle-age versus Young Driver ............................. 222
3. Remarks ........................................................................................................................... 226
4. Outlook ............................................................................................................................ 227
Chapter 7 ...................................................................................................................................... 228
Securing Transportation Cyber-Physical Systems ....................................................................... 228
1. Overview .............................................................................................................................. 228
2. Motivation ........................................................................................................................ 229
3. Transportation Cyber-Physical Systems .......................................................................... 231
3.1 Architecture .............................................................................................................. 231
3.2 Applications ............................................................................................................. 232
3.3 Standards .................................................................................................................. 233
3.4 Characteristics .......................................................................................................... 234
4. Security and Privacy Issues in Transportation Cyber-Physical Systems ......................... 236
4.1 Security and Privacy Requirements ......................................................................... 236
4.2 Security and Privacy Challenges .............................................................................. 239
4.2.1 Security Actors/Entities ................................................................................... 242
4.2.2 Attacker Profiles .............................................................................................. 243
4.2.3 Attack Classifications ...................................................................................... 244
5. Security and Privacy Countermeasures in Transportation Cyber-Physical Systems ....... 252
5.1 Cryptography Mechanisms ...................................................................................... 252
5.2 Cryptography Protections ........................................................................................ 253
5.3 Public Key Infrastructure (PKI) ............................................................................... 254
5.3.1 VANET’s Public Key Infrastructure (VPKI) ................................................... 255
5.3.2 Group Signature ............................................................................................... 256
5.4 Security Countermeasures for Securing VANETs ................................................... 256
5.4.1 Generic Security Mechanisms ......................................................................... 256
5.4.1.1 Prevention Techniques ................................................................................. 256
5.4.1.2 Detection Techniques ................................................................................... 257
5.4.2 Specific Security Solutions for VANETs ........................................................ 258
xv
5.5 VANET Security Architectures ................................................................................... 260
5.5.1 Global Security Architecture ............................................................................... 260
5.5.2 Security Architecture for VANET (SAV)............................................................ 260
6. VANET Privacy ............................................................................................................... 261
7. Main Contributions: Test-bed Setup ................................................................................ 263
4.4 V2X Simulation Infrastructure ................................................................................. 263
4.5 Real-World Dataset .................................................................................................. 264
4.6 Simulation Input and Parameters ............................................................................. 264
4.7 Evaluation Scenarios ................................................................................................ 268
4.7.1 Scenario A (Traffic Efficiency) ....................................................................... 268
4.7.2 Scenario B (Safety) .......................................................................................... 269
4.7.3 Scenario C (Jamming Attack) .......................................................................... 269
8. Evaluation Results and Discussion .................................................................................. 273
8.1 Jamming Attack on Vehicle-to-Vehicle (V2V) Communication ............................. 273
8.2 Jamming Attack on Vehicle-to-Infrastructure (V2I) Communication ..................... 281
8.3 Jamming Attack on V2V versus V2I Communications: A Comparison ................. 286
9. Remarks ........................................................................................................................... 291
Chapter 8 ...................................................................................................................................... 293
Conclusions and Future Research ................................................................................................ 293
Final Remarks .......................................................................................................................... 293
Contribution to Knowledge ...................................................................................................... 295
Research Limitations ............................................................................................................... 296
Recommendations for Further Research .................................................................................. 298
References .................................................................................................................................... 304
CURRICULUM VITA ................................................................................................................ 317
Appendices ................................................................................................................................... 320
Appendix A .............................................................................................................................. 320
Code for Incident Warning Application (IWA) ....................................................................... 320
Appendix B .............................................................................................................................. 322
Traffic Prognosis ...................................................................................................................... 322
1. Actual Regression Results ............................................................................................... 322

xvi
2. Actual Classification Results ........................................................................................... 323

xvii
List of Tables
Table 1: Sample lanes meta-data. .................................................................................................. 84
Table 2: Sample lanes traffic data. ................................................................................................. 84
Table 3: Some of the (a) media access control (MAC), and (b) physical (PHY) layer parameters
used in our simulation [160] [147] [146] [89]. ............................................................................ 114
Table 4: Levels of predictor importance (in descending order). .................................................. 189
Table 5: Some simulation parameters used for our distracted driving scenario [152]. ................ 207
Table 6: Vehicle and RSU simulation parameters. ...................................................................... 266
Table 7: Actual versus predicted traffic volume levels of some regression algorithms on I-270 [173]
[204] [71]. .................................................................................................................................... 322
Table 8: Actual performance results of our evaluated regression algorithms - a multi-metric
comparison [173] [204] [71]. ....................................................................................................... 323
Table 9: More metrics used to evaluate the performance of our classification algorithms [173] [204]
[71]. .............................................................................................................................................. 323

xviii
List of Figures
Figure 1: Overview of greenhouse gases and their percentage distributions emitted as a result of
road transportation [25].................................................................................................................. 27
Figure 2: Carbon dioxide emissions in the U.S. by Source [24]. ................................................... 27
Figure 3: Aggregate U.S. greenhouse gas emissions contributed by each sector of the economy in
2012 [69] [15]. ............................................................................................................................... 28
Figure 4: Different interacting entities/artifacts that make up the ITS research domain [75]. ...... 34
Figure 5: Some goals/advantages/promises of ITS [76] [77] [78]. ................................................ 34
Figure 6: Other ITS simulator tools [22]. ...................................................................................... 36
Figure 7: Using V2X navigation to optimize traffic efficiency by avoiding congested routes [81]
[82]. ................................................................................................................................................ 37
Figure 8: Using V2X applications to circumnavigate a precarious road condition [81] [82]. ....... 37
Figure 9: Some human factors research focus/evaluation metrics [22]. ........................................ 39
Figure 10: Human factors challenges in ITS [22]. ......................................................................... 40
Figure 11: Some pertinent factors that should be considered when modeling the human driver
profile in order to overcome some of the human factors challenges in ITS [75] [22]. .................. 40
Figure 12: Automated, human, and shared/hybrid control scenarios while driving [86]. .............. 41
Figure 13: Human factors research focus in ITS [22]. ................................................................... 43
Figure 14: Some selection criteria for user participation in the study [87]. ................................... 44
Figure 15: Some performance metrics evaluated by Wagh et al. [90] that was used to
interpret/quantify human factors challenges. ................................................................................. 47
Figure 16: Human factor (HF) challenges observed by Wagh et al. [90]. ..................................... 48
Figure 17: Driver profile and different message notification formats/metrics observed/evaluated
[90]. ................................................................................................................................................ 48
Figure 18: Data processing steps. .................................................................................................. 80
Figure 19: Entire field data coverage area. .................................................................................... 82
Figure 20: Selected study area in Google map (left) and Openstreetmap (right). ......................... 83
Figure 21: Evaluation Scenarios used to determine the efficiency and effectiveness of the Dijkstra
and A* algorithms. ......................................................................................................................... 88
Figure 22: A small road network (top) and a large road network (bottom) showing vehicle routes
(both bidirectional, and unidirectional) from various sources to various destinations and positions
(Labels AX, AY, AZ; and BX, BY, BZ indicate where rerouting, as a result of an accident/closed
road, is triggered). .......................................................................................................................... 89
Figure 23: Total travel time (TT) for different routes in small road network using actual/normal
traffic volume patterns. .................................................................................................................. 91
Figure 24: Total travel distance (TD) for different routes in small road network using actual/normal
traffic volume patterns. .................................................................................................................. 91
Figure 25: Total travel time (TT) for Routes A and B in large (labels: a – d), and small (labels: e –
h) road networks using five times (5X) the actual/normal traffic volume patterns. ...................... 92
Figure 26: Total travel distance (TD) for Routes A and B in large (labels: a – d) and small (labels:
e – h) road networks using five times (5X) the actual/normal traffic volume patterns. ................. 92
xix
Figure 27: Number of rerouted vehicles through routes A and B for small and large road networks.
....................................................................................................................................................... 95
Figure 28: High-level VSimRTI architecture with coupled federates [151] [91] [81] [76] [77] [152].
..................................................................................................................................................... 107
Figure 29: Basic federates necessary for successful V2X simulation [151] [103] [152]. ............ 107
Figure 30: Various types of simulation tools so far coupled to VSimRTI [153] [76] [77]. ......... 108
Figure 31: Importing our road network from OpenStreetMap. .................................................... 109
Figure 32: Slippery ice event added to Constitution Avenue NW using eWorld. ....................... 113
Figure 33: Congested route (red line) taken by classic/IWA-unequipped vehicles, and alternative
route (blue line) taken by IWA-equipped vehicles in order to circumnavigate the congested route
[152]. ............................................................................................................................................ 118
Figure 34: Real-world view of traffic congestions experienced on Constitutional Avenue NW
during typical rush-hours traffic on Google Map. ....................................................................... 119
Figure 35: Connected vehicles simulation workflow [76] [166]. ................................................ 120
Figure 36: Performance of some evaluated metrics in relation to increasing IWA-enabled ratio.
..................................................................................................................................................... 124
Figure 37: Visualizing our simulation in the VSimRTI ITEF using V2I communication on Google
Map [152]. ................................................................................................................................... 125
Figure 38: One congested vehicle on Constitution Avenue NW using V2I Communication [152].
..................................................................................................................................................... 126
Figure 39: Travel Speed against time of 100% IWA-enabled vehicles using V2I communication
[152]. ............................................................................................................................................ 127
Figure 40: Performance of some evaluated metrics in relation to increasing IWA-enabled ratio.
..................................................................................................................................................... 130
Figure 41: Visualizing our simulation in the VSimRTI ITEF using V2V communication on Google
Map [152]. ................................................................................................................................... 131
Figure 42: Congested vehicles on Constitution Avenue NW using V2V Communication [152].
..................................................................................................................................................... 132
Figure 43: Travel speed against time of 100% IWA-enabled vehicles using V2V communication
with respect to some evaluated metrics [152]. ............................................................................. 133
Figure 44: Performance of some evaluated metrics in relation to increasing IWA-enabled ratio.
..................................................................................................................................................... 136
Figure 45: Variations of traffic volume with time on I-270. ........................................................ 150
Figure 46: Real-world view of time-variant traffic patterns on I-270. ........................................ 151
Figure 47: Variation of vehicle occupancy with time more data recorded in the mornings than at
any other times on our reference roadway – I-270. ..................................................................... 152
Figure 48: Actual vehicle speeds falling below the default speed limit – indicative of possible
congestion on I-270...................................................................................................................... 153
Figure 49: Machine learning overview [172]. , ............................................................................ 158
Figure 50: An illustration of the supervised learning process [172] [173]. ................................. 160
Figure 51: Supervised learning design steps [172] [173]............................................................. 163

xx
Figure 52: Regression plots for training, validation, test, and composite of all using neural network
fitting regression tool in Matlab [169]. ........................................................................................ 167
Figure 53: Adjusting the network architecture parameters to improve prediction accuracy using the
neural network time series regression tool in Matlab [169]. ........................................................ 169
Figure 54: Selected study area with reference roadway (I-270) highlighted. .............................. 180
Figure 55: Whole day actual traffic volume pattern on Wednesday, September 19th, 2012 on I-270
in relation to evaluated regression algorithms. ............................................................................ 185
Figure 56: Predictive accuracy of supervised machine learning regression algorithms as a function
of the root mean-square error (RMSE). ....................................................................................... 186
Figure 57: Prediction speed (efficiency) of supervised machine learning algorithms as a function
of the prediction time in seconds. ................................................................................................ 186
Figure 58: Performance of regression algorithms with respect to the regression value (R-value).
..................................................................................................................................................... 188
Figure 59: Predictive accuracy of supervised machine learning classification algorithms as a
function of the root mean-square error (RMSE). ......................................................................... 191
Figure 60: Prediction speed (efficiency) of supervised machine learning classification algorithms
as a function of prediction time in seconds. ................................................................................. 191
Figure 61: Predictive accuracy of classification algorithms with respect to confusion matrix. ... 192
Figure 62: Confusion matrix of neural network pattern recognition classification [169]. ........... 193
Figure 63: ROC curve of neural network pattern recognition classification algorithm (NN_p.reg).
..................................................................................................................................................... 194
Figure 64: Results of classification tree (Ctree) used in identifying the presence, or absence of
congestions on I-270. ................................................................................................................... 196
Figure 65: Results of regression tree (Rtree) used in forecasting future traffic volume patterns on I-
270 on Wednesday, September 19th, 2012. ................................................................................. 196
Figure 66: Level of importance of features used in Treebagger ensemble. ................................. 198
Figure 67: Factors responsible for most traffic accidents/crashes [20]. ....................................... 203
Figure 68: Several factors/parameters considered in modeling a drivers distraction/attention level
in relation to our performance evaluation metrics [46] [15, 210]. ............................................... 208
Figure 69: Incorporating customized driver behavior/reaction modules/models with VSimRTI and
coupled federates/simulators [152]. ............................................................................................. 209
Figure 70: More coupled simulators that can be used with VSimRTI in order to create a single
integrated simulation framework/architecture [76] [77]. ............................................................. 213
Figure 71: In-vehicle textual, audio, visual, and haptic notification of the congested condition on
our reference roadway – Constitution Avenue NW [211]. .......................................................... 214
Figure 72: Performance of some evaluated metrics in relation to the impact/influence of distracted
driving on the young driver model. .............................................................................................. 218
Figure 73: Performance of some evaluated metrics in relation to the impact/influence of distracted
driving on the middle-age driver model. ...................................................................................... 221
Figure 74: Comparing the impact/influence of distracted driving on the young, and middle-age
driver models respecting some of our evaluated metrics. ............................................................ 224
xxi
Figure 75: VANET network architectures: (a) pure cellular (V2I), (b) pure ad hoc (V2V), (c) hybrid
(V2V & V2I) [95] [96]. ............................................................................................................... 232
Figure 76: Examples of VANET threats and attacks [30]. .......................................................... 244
Figure 77: Sybil attack used to create an illusion of a congested condition in order to get undue
roadway usage priority for example [103]. .................................................................................. 247
Figure 78: Encryption and decryption processes [30]. ................................................................ 253
Figure 79: Using trust validation model (TVM) to avoid acting on malicious message dissemination
that can compromise both security, and privacy [31]. ................................................................. 262
Figure 80: Simulation visualization using the VSimRTI Websocket visualizer on Google Map
[152]. ............................................................................................................................................ 268
Figure 81: Jamming attack simulation workflow [76] [166]. ...................................................... 272
Figure 82: Performance of some evaluated metrics in relation to available communication channel
as a result of jamming attack. ...................................................................................................... 274
Figure 83: Visualizing our V2V jamming attack simulation scenario in the VSimRTI ITEF on
Google Map [152]. ....................................................................................................................... 275
Figure 84: Congested vehicles on Constitution Avenue NW using V2V Communication at 100%
available communication channel [152]. ..................................................................................... 276
Figure 85: Travel speed against time of 50% IWA-enabled vehicles using V2V communication at
100% available communication channel [152]. ........................................................................... 277
Figure 86: Visualizing our V2I jamming attack simulation scenario in the VSimRTI ITEF on
Google Map [152]. ....................................................................................................................... 281
Figure 87: Only classic/unequipped vehicles congested on Constitution Avenue NW using V2I
Communication at 100% available communication channel [152]. ............................................ 282
Figure 88: Travel Speed against time of 50% IWA-enabled vehicles using V2I communications at
100% available communication channel [152]. ........................................................................... 283
Figure 89: Performance of some evaluated metrics in relation to available communication channel
as a result of jamming attack. ...................................................................................................... 285
Figure 90: Performance of some evaluated metrics in relation to available communication channel
as a result of jamming attack. ...................................................................................................... 288

1
Chapter 1
Introduction
This chapter presents the background and motivation for pursuing this research work,
existing challenges, current mitigation approaches in intelligent transportation system
(ITS)/vehicular ad hoc networks (VANETs), and their drawbacks; it also highlights the
research overview; overall research aim, and specific research objectives. Lastly, it
presents the main contributions, significance/value, and organization of this dissertation
research.
Motivation and Background
In the U.S., the following transportation problems/challenges requiring immediate/urgent
attention have been identified by the National Highway Traffic Safety Administration
(NHTSA), and other imperative stakeholders:-
Safety challenges: According to the National Highway Traffic Safety Administration
(NHTSA), roadway fatal accidents have an average cost of $977,000 with about $2 million
used to resuscitate the critically/severely injured who, eventually, survive. Besides, the
current state of transportation has resulted in over: 32,800 deaths per year, 5.7 million
yearly crashes, $230 billion direct cost to the economy – approximately 2.3% of the total
gross domestic product (GDP) or $820 average cost per individual resident in the U.S., and
leading cause of death between the age bracket of 4 – 34 years [15] [16] [17] [18] [19] [20]
[21] [22].

2
Mobility/Environmental challenges: Traffic congestion results in the loss of $87.2 – $100
billion accruable to the U.S. economy i.e. over $750 per traveler in the U.S., 4.2 – 4.8
billion waste of productive hours – approximately one complete work/vacation week per
traveler/commuter, and 1.9 billion gallons wastages with respect to fuel/gas per year; 32%
of the carbon dioxide emissions in the environment is attributable to road
transportation/vehicles. In other words, lost productivity, resources, time, gas, and others
are some of the many undesirable consequences of road traffic congestions. Besides,
inefficient routing also exacerbates congestions which subsequently pervades to other
neighboring roadways if left unchecked [15] [18] [23] [17] [24] [25] [26] [16] [19] [8, 27,
28] [20] [21] [22].
Traffic Prediction challenges: Accurate and timely dissemination of congestion
information, and other pertinent traffic-related information is invaluable in improving
traffic mobility/efficiency, and safety, etc. This is especially true because with the
deluge/gamut of both streaming/real-time/dynamic, and historical/static traffic data, and
processing algorithms, efficient and effective synthesis is imperative in timely, and reliable
decision making. The criticality of efficient, and effective message dissemination using
artificial intelligence (AI)/machine learning algorithms is further heightened respecting
safety/life-critical messages having little, or no tolerance for errors/delays/latencies.
Coupled with all these is the seeming unavailability/scarcity of real-world datasets as has
been widely reported by various authors/authorities [1-14].
Human Factors challenges: In 2010, NHTSA reported that 3,092 deaths, and 417,000
injuries resulted from distracted driving [15]. Similarly, according to the results of the

3
analysis of the National Motor Vehicle Crash Causation Survey (NMVCCS) database
between 2005 and 2007, 11% of crashes were attributed to distractions as a causative agent.
Drilling further down to the details, the following lists the levels of distractions and their
causative agents/activities: 0.2% - use of cell phones, 0.9% - use of radios and similar
devices, and 12% - talking with other passengers, or use of cell phones. The age distribution
of drivers most prone to engage in an in-vehicle distracting activity was recorded at
between 16 to 25 years with the highest distraction propensity of 6.6% [15] [20] [21]. It is
also noteworthy that the strongest/best security, privacy, traffic efficiency, and safety
measures/applications can only be as strong/effective as the human driver – hence the name
human-in-the-loop problem. All types of distracted driving such as cognitive, visual, and
manual distractions militates against the realization of the lofty goals of ITS – hence
measures that maintain the drivers attention/focus/concentration while driving are highly
demanded.
Security challenges: Because of the predominant reliance on wireless communication
technologies with respect to vehicle-to-vehicle (V2V)/inter-vehicle communication (IVC),
and vehicle-to-infrastructure (V2I) communication (V2X communication), they are more
susceptible to security, and privacy attacks manifesting in the form of V2X message delay,
forgery, modification, replay, and suppression, etc. [29, 30] [29] [31]. Also, resulting from
the uniqueness of the vehicular ad hoc network (VANET) ecosystem some of which
consists of high speed nodes/vehicles with short connection times, and constantly changing
network topology, etc., conventional security mechanisms that are designed to satisfy the
confidentiality, integrity, and availability (CIA) security goals/requirements cannot be

4
directly used to address the gamut of threats respecting VANETs; hence some
adaptation/contextualization is necessary. In addition, in ITS, safety supersedes security,
and all other requirements; hence all security requirements/countermeasures must not, in
any way, compromise safety [20]. This is true because security requirements that
compromise/vitiate safety cannot be realistically adopted/implemented. Besides, because
of the safety/life-critical nature of VANETs, security compromises are usually
unacceptable and could result in fatalities – consequently, little or no tolerance for errors
is strictly mandated in the ITS/VANET ecosystem [29, 30] [29] [31].
From the aforesaid, it is self-evident that these numbers/problems are unacceptably high
and demand immediate reduction/mitigation – this is one of the primary/pivotal goals of
this work [15] [26].
Mitigating Transportation Challenges
According to the U.S. Federal Highway Administration (FHWA) [32], improving the
current traffic efficiency, building new roads and infrastructure, and encouraging
alternative modes of transportation (e.g. carpooling, taking the bus or train, etc. instead of
driving alone) are some of the major congestion mitigation techniques. However, of all the
aforementioned road traffic congestion mitigation/alleviation techniques, the use of
dynamic/adaptive routing mechanisms that optimally utilize the existing road capacity is,
generally, the most cost-efficient and effective technique [33]. Consequently, to overcome
some of these aforementioned challenges, there is an urgent need to dynamically (re)route
traffic via more efficient routes [8]. By taking the best/most optimal route from source to
destination – the fastest route – which can be distance-based, or time-based, several factors

5
respecting roadway conditions such as road constructions, presence of tolls, and others, all
contribute to the decision making process, leading to the shortest-path problem [34].
As previously stated, intelligent transportation system (ITS)/vehicular ad hoc network
(VANET) applications provide a more efficient/low latency, effective, reliable, greener
transportation, and safe driving experience that minimizes congestion resulting in better
traffic flow management [4, 6, 10, 35-38]. However, to achieve this, all ITS applications
using V2V/IVC, and V2I communications – collectively referred to as V2X
communications – such as situational awareness, dynamic traffic control signals, hard-
breaking signals, and others must work synergistically or cooperatively [7, 39]. For
example, using IntelliDrive applications, drivers can receive notifications on the
probability of other vehicle drivers running a red light, the presence of unforeseen road
conditions, including sharp/dangerous road bends, and others [14, 15] [20]. Also, adaptive
cruise control (ACC), advanced driver-assistance systems (ADASs), variable speed limits
(VSLs), ramp metering, and dynamic cruise control (DCC), etc. are additional mechanisms
used to improve safety, traffic efficiency, and effective utilization of vehicle gas/fuel, as
main goals of ITS [7, 9, 28, 35, 37, 38, 40-42]. By constantly monitoring variations in
traffic parameters such as densities, speeds, and queues, variable speed limits (VSLs) and
ramp metering can be adaptively controlled in real-time to minimize congestions. Note that
VSLs are primarily used to ameliorate congestions because, as aforesaid by the FHWA, it
is not feasible to keep constructing new roadways to meet the ever-growing traffic volume
densities. The reason is that resources are finite and less expensive alternatives need to be
developed [9, 41, 42] [32, 33].

6
In order to ensure safety in ITS, interconnected vehicles constantly exchange information
such as their location/position, speed, direction, etc. amongst one another [29]. The
exchange of information in a timely and accurate fashion is critical to accident
prevention/safety because, prior knowledge of future collisions in as little as one-half
second before actual impact can reduce road traffic collisions/accidents by as much as 60%
[43]. Safety messages, and other messages received by the driver have an impact on the
driver’s reaction time – 100ms is the minimum required latency for safety message
dissemination to all stakeholders prior to an accident [44]. Besides, with respect to
VANETs, safety-related applications must maintain a certain quality-of-service (QoS),
latency, security, and error rate levels, etc. [44]. As reported by NHTSA, 8% of unimpaired
driver accidents/crashes can be avoided using V2V and V2I communication [15]; in
addition, 71% of unimpaired driver crashes involving heavy duty trucks/vehicles can be
reduced/eliminated using V2V communication applications [15]. In the same vein, 12% of
crashes not addressed by V2V communication are addressed using V2I communication; in
other words, V2I communications serves as a complement/supplement to V2V
communication [15] [16] [17] [18] [19] [20] [21].
Overview of Dissertation Research
With respect to the foregoing problems, this dissertation research has as its primary
aim/goal of carrying out the investigation/evaluation/analysis, and implementation of
efficient and effective solutions, which ameliorate the adaptive routing, knowledge
discovery, security challenges, human factors challenges, and environmental
impacts/problems of ITS.

7
Specifically, respecting the ITS/VANET ecosystem/environment, this dissertation research
seeks to satisfy the following critical objectives:
Identify and evaluate critically the most efficient, and effective VANET routing
algorithm that minimizes congestions resulting in better traffic flow management.
With respect to a given road network, determine the safety, and traffic efficiency
challenges/environmental impacts of ITS/VANET architectures.
Analyze critically how the knowledge of previous, historical traffic volume
patterns/data/information can be efficiently, and effectively utilized to accurately predict
future patterns/conditions, leading to valuable, and timely decisions.
Explore the influence of a drivers motor, perceptual, and cognitive abilities/skills
(distraction/attention level) on the traffic efficiency, and safety benefits attributable to ITS.
Examine and assess the effects/impacts of security attacks/beaches in ITS, and how
can they be effectively mitigated in a realistic scenario.
Formulate recommendations for ameliorating the adaptive/dynamic routing, safety,
traffic efficiency/environmental impacts, security, knowledge discovery, and human
factors challenges of ITS/VANETs.
Main Contributions of Research
In order to satisfy/ameliorate the aforementioned research goals/objectives, and
transportation challenges, using our real-world data and real-world road networks, we
developed a mobile application we called Incident Warning Application (IWA), together
with a generic, and realistic ITS test-bed, on which we evaluated the performance of two

8
popular VANET routing algorithms in both small, and large road networks. Vehicles
equipped with this mobile application utilize it to evade a compound road accident
consisting of reduced speed limit as a result of fog, slippery roadway conditions as a result
of frozen ice, and the blocking of all 3-lanes of our reference roadway – Constitution
Avenue NW; on the other hand, classic/unequipped vehicles suffer the consequences of
this congested condition in the form of delayed/increased travel time. In addition, using the
aforementioned test-bed, we investigated the impact of a radio/wireless communication
channel jamming attack – a type of denial-of-service (DoS) attack – against the availability
security requirement/goal using both V2V, and V2I communications. Next, using over 24
supervised machine learning classification, and regression algorithms taxonomy, we
determine their prediction accuracy, and speed/efficiency in a realistic setting. Lastly, we
examined the influence of a driver’s level of distraction/attentiveness i.e. the human factors
challenge, with our developed in-vehicle Driver Notification Application (DNA) using two
age groups/driver models – young drivers (ages 16 – 25 years), and middle-age drivers
(ages 30 – 45 years) respectively.
Our empirical results show that of the two popular VANET routing algorithms evaluated
– Dijkstra, and A* (Astar) – both algorithms showed no significant differences with respect
to traffic efficiency (total trip/travel time) performances in both small, and large road
networks. Next, respecting the efficiency, and effectiveness of V2V/IVC, and V2I
communication architectures, V2I communication outperformed V2V communication
manifesting in better safety, and traffic efficiency performances. Also, with respect to
accurate traffic pattern prediction, and prediction speed/efficiency of all classification and

9
regression machine learning algorithms taxonomy evaluated, classification trees (Ctree),
and regression trees (Rtree) gave the best performances respecting both prediction
accuracy, and prediction speed. Next, using middle-age drivers, increasing a driver’s
distraction level had the least amount of negative impact on both traffic efficiency, and
safety over young drivers. In other words, a driver’s attention level is directly proportional
to his safety, and traffic efficiency performances, and vice versa. Finally, regarding security
attacks/compromises in VANETs, V2I communication showed more resilience over V2V
communication respecting jamming of its radio/communication channel as a result of
congestions.
Significance of Research
Our work is important in many respects. Predominantly, but not exhaustively, because of
our use of real-world data, and realistic road networks, our work can be directly, and
reliably utilized by transportation agencies/authorities/planners, traffic engineers, public
authorities, road users/operators, and other stakeholders (direct, or indirect) in the
Maryland (MD)/Washington DC and Virginia (VA) areas to better understand the
multifarious ramifications of the deployment of the ITS/VANET technology in a cost-
effective, secure, and efficient simulation setting first, before actual, expensive – and often
wasteful – real-world ventures/endeavors. Besides this, as is normal protocol/practice, real-
world studies are usually preceded by simulation studies because of the expensive nature
of the former. Also, we encountered a lot of significant difficulties in securing our real-
world traffic data and generating/preparing our realistic road networks – this experience is
not alien to those reported by many authors/authorities in the VANET/ITS research

10
domain; as a result, most of the existing literature/studies we evaluated also concur with
the importance of our work [1-14]. In addition, to the best of our knowledge, our work is
the first that has evaluated a taxonomy of several machine learning algorithms in the same
setting – as most of the works we evaluated utilized at most 3 – 4 algorithms for either
classification, or regression problems, but not both; this can be attributable to the extreme
difficulty we encountered, and the enormous perseverance required to accurately fine-tune
all their parameters to ensure maximum performance respecting prediction accuracy, and
prediction speed/efficiency. One of the imperative goals of this taxonomy is to develop a
comprehensive, and comparative work that will serve as a reference manual for
ascertaining which machine learning algorithm best suites the speed, and accuracy
requirements of real-time driving decisions together with their attendant tradeoffs.
Besides, the performance of our algorithms was evaluated using a multi-metric comparison
method/approach which, on its own, is a unique feat/achievement; this multi-metric
comparison approach was adopted/employed in order to satisfy the biases of all concerned
stakeholders – real, or unreal/perceived/otherwise – favoring the use of one or more metrics
as more accurate/reliable over others/another. It is important to note that this subject alone
has precipitated a lot of vigorous debate/discuss in literature with some authors arguing
for, or against the use of one superior metric – mostly/predominantly the root mean square
error (RMSE) – over/against another/others [37] [45]. Also, in relation to our jamming
security attack scenario and its influence on traffic efficiency, and safety performances,
again, to the best of our knowledge, our work is the first to give actual
empirical/experimental implementations of this in a realistic setting using both V2V, and
V2I communication architectures in the same setting. In the same vein, most research

11
studies respecting the ITS/VANET goals of improved mobility/traffic efficiency, and
safety do not consider the varying/often subjective human driver behavior modeling
challenges especially in a realistic setting – hence the name driver-in-the-loop
problem/human factors challenges. Besides, from our extensive/comprehensive review of
literature in the field [1-14] [46], we can unequivocally, and confidently assert that many
studies reviewed – over 99% – are either void of real-world data, real-world road networks,
or both [1-14]. Specifically, many authors such as Ahmed Helmy [47] has been looking
for real-world traffic data for over 3 years and counting in order to further their research
endeavors/efforts/studies, but to no avail. Consequently, because of their lack of
reliability/veracity of representativeness of chosen/evaluated scenarios, they are rendered,
from the beginning, ineligible/severely flawed for use in the real-world considerations of
the safety, traffic efficiency, security, traffic prediction, and human factors challenges, etc.
of ITS/VANETs. Finally, our work has also been vetted/juried/peer-reviewed and
published in reputable/prestigious conferences across the globe because of its immense
value and contribution to existing knowledge.
Organization of Dissertation Research
The rest of this dissertation research is organized as follows: in Chapter 2, we review the
related works buttressing the importance of this research. In Chapter 3, 4, 5, 6, and 7 we
present our research tasks in detail dealing with routing – traffic efficiency, and safety,
traffic forecasting/prognosis, human factors challenges, and security in ITS. Finally, we
again reexamine/reiterate/highlight the main contributions of this dissertation research,
together with some recommendations for future research in Chapter 8.
12
Chapter Outline
The structure of this dissertation is here summarized as follows:
Chapter 1: Introduction
This chapter introduces our research topic, and the motivation for embarking on this
research; the research objectives, contributions, significance/value, and organization are
also presented.
Chapter 2: Issues and Review of Related Literature
This chapter critically presents and evaluates the most recent and pertinent research studies
in the ITS/VANET domain that seeks to address its adaptive/dynamic routing, traffic
efficiency, safety, traffic forecasting, human factors, and security challenges towards
promulgating our overall research aim and specific research objectives.
Chapter 3: Need for Adaptive/Dynamic Routing
This chapter addresses the need for optimal/dynamic/adaptive routing in ITS; it further
uses this to realistically compare the performance of two popular vehicular routing
algorithms – A*(Astar), and Dijkstra – with a view of improving traffic
efficiency/mobility.
Chapter 4: VANET Architectures
Using our generic and realistic ITS test-bed and our developed Incident Warning
Application (IWA), the traffic efficiency and safety performances of two popular VANET

13
architectures – vehicle-to-vehicle (V2V), and vehicle-to-infrastructure (V2I)
communications – are compared in this chapter. The V2X Simulation Runtime
Infrastructure (VSimRTI) framework used in implementing these architectures is also
presented in detail – together with its constituent parts/components. The evaluation of these
two architectures are compared in relation to the traffic efficiency, and safety/life-critical
nature of road transportation which requires little or no tolerance for
errors/failures/latencies.
Chapter 5: Efficient and Effective Traffic Prognosis
In this chapter, we identify the need for efficient (fast/timely) and effective (accurate)
traffic pattern prognosis towards congestion alleviation. Thus, using a taxonomy of over
24 classification, and regression supervised machine learning algorithms, we evaluated
their prediction efficiency/speed, and prediction accuracy respectively. The major metric
used for our performance evaluation is the root mean square error (RMSE); some of the
algorithms evaluated/considered include, but are not limited to: Artificial Neural Networks
(ANN), Discriminant Analysis (DA), Naïve Bayes, and Support Vector Machines (SVM),
etc.
Chapter 6: Distracted Driving Human Factors Challenges
This chapter addresses the human factors challenges of ITS using the V2X Simulation
Runtime Infrastructure (VSimRTI) Behavior simulator, and developed in-vehicle Driver
Notification Application (DNA). The safety and traffic efficiency performances of two
popular human driver models: young, and middle-age drivers were modeled using the

14
VSimRTI behavior module coupled with the following simulators: SUMO traffic
simulator, application simulator, and OMNeT++ network/communication simulator with a
view of determining the impact of distracted driving on our chosen driver models.
Chapter 7: Compromising Security in VANETs
This chapter critically examines the current security and privacy issues in transportation
cyber-physical systems (CPS), requirements, challenges, and countermeasures –
prevention, and detection techniques. In addition, our simulation test-bed for carrying out
our Denial-of-Service (DoS) attack – jamming – is also presented. Using our V2X
simulation framework/infrastructure, the following coupled simulators are presented and
used for evaluating the impact of a jamming attack against the availability security
requirement on V2V, and V2I communication architectures: SUMO traffic simulator,
JiST/SWANS network/communication simulator, event simulator, and environment
simulator. Also, both architectures are compared based on their respective safety, and
traffic efficiency performances.
Chapter 8: Conclusions
This chapter again summarizes/highlights the importance, main contributions, and findings
of our research effort; it again identifies, and reiterates our primary research objectives
towards satisfying our overall research aims/goals. Here, we also present some of our
research limitations, and recommendations for further future research to
compatriots/fellow colleagues/researchers.

15
Chapter 2
Issues and Review of Related Literature
In this section, we examine some of the most recent and pertinent works that have sort to
address safety, traffic efficiency, need for realistic traffic prediction, human factors
challenges, and security/privacy attacks in ITS/VANETs relevant to justifying, situating,
promulgating, and fostering our research objectives.
1. Improving Safety and Traffic Efficiency
1.1 Ameliorating Road Traffic Congestions
The main objectives of QoS routing is to: (1) find the path/route that satisfies the minimum
QoS constraints, and (2) fully and efficiently utilize such routes [48]. Intelligently and
dynamically routing vehicles away from a congested roadway caused by an accident or
incident is both efficient and effective in congestion prevention, detection, and control [42];
more than one path can be taken from source to destination in a realistic environment [8].
In order to minimize or avoid delays, real-time (re)routing based on current, and
predicted/anticipated traffic volume patterns, with respect to time are pertinent in
redistributing traffic, thus ensuring that roadways are maximally utilized in an efficient,
and effective manner [8, 42, 45, 48]. Inter-vehicle communications (IVC) is used as a
congestion avoidance mechanism in distributed/decentralized routing [8]. Static controls,
and dynamic controls are some of congestion control/mitigation approaches [42] [49].
Because of the constant flux in traffic volumes/densities at different times (peak, or non-
peak), and days (weekdays or weekends), static traffic control techniques (foreseen and

16
predictable) are not effective in ameliorating congestion as they cannot dynamically adapt
to these and other unforeseen circumstances/situations in real-time, or at best, near real-
time. Hence, there is the need for dynamic traffic control strategies, which can be
unforeseen and unpredictable [42]. The hybrid approach to congestion control combines
the pros and cons of fixed/static, and dynamic signaling in order to ensure smooth,
dynamic, and adaptive traffic flow during peak/congested/saturated conditions and non-
peak/uncongested/unsaturated time periods and conditions [39]. For safety-critical
applications/technologies such as IVC in ITS, the delivery rate, and latency must be
optimal in order to ensure that safety and efficiency are satisfied and sustained [50].
1.2 Intelligent Transportation System (ITS) Routing Architectures
There are two types of architectures in ITS: (1) Centralized/infrastructure-based routing
architecture: In this scheme, a traffic control center guides the vehicle path based on the
most efficient and effective path with respect to the current traffic conditions (the path that
is currently available). (2) Decentralized/infrastructure-less routing architecture: This
scheme uses vehicle-to-vehicle (V2V)/inter-vehicle communication (IVC) for situational
awareness and information exchanges from source to destination [51] [8, 9]. For example,
with respect to the average trip time, Leontiadis et al. [8] asserted that local traffic
information is best disseminated in an ad hoc and distributed manner. Information
exchange overhead between vehicles and telecommunications equipment is reduced by
decentralized routing [8, 9]. With respect to misbehaving/faulty/malfunctioning nodes, the
decentralized approach has better average trip time performance in comparison with the
centralized approach because of the presence of IVC; note that only vehicle-to-

17
infrastructure (V2I) communication is used in the centralized approach [8]. The centralized
traffic control approach is not realistic especially in complex driving scenarios with lots of
vehicular traffic density because average trip time and computation time increases with
increase in traffic volume [41] [8] [52].
V2V/IVC decentralized routing is more flexible and less expensive because traditional
road-side units (RSUs) are costly, and limited in roadway coverage; they also result in
better/improved (reduced) average trip time [53] [12] [8]. Decentralized routing also has
better, and realistic performance in congestion avoidance/management compared with
centralized routing [8]. For example, IntelliDrive applications – previously referred to as
vehicle-infrastructure applications – enable V2V, and V2I communications using a
decentralized approach, where probe vehicles serve as communication paths/relays for
traffic condition information (single-hop, and/or multi-hop communication scope).
Bidirectional inter, and intra cluster communication is used for multi-hop propagation of
traffic information along highways [12] [54] [50] [20]. During the process of IVC (multi-
hop, or single-hop), each vehicle/node maintains a table containing the position,
speed/velocity, and direction of neighboring vehicles/nodes [28, 50]. The centralized
storage of traffic information in an infrastructure-based probing approach/method/scenario
results in more timely and accurate information exchange to vehicles. However, the
timeliness and accuracy of the infrastructure-less/decentralized probing method/approach
is diminished because of the delay/time taken to disseminate such information to other
vehicles [6] [8]. Security, privacy, safety, and reliability (trust) of disseminated information

18
is a very important area of research not dealt with in this dissertation, but is an interesting
area of research [8].
1.3 Intelligent Transportation System (ITS) Routing Algorithms
Similar to routing architectures, ITS routing algorithms can be centralized, decentralized,
or a combination of both – hybrid [41]. With respect to the type of addressing used (fixed,
or geographic), routing algorithms have been categorized as: unicast, and multicast;
flooding, non-flooding, and directed flooding based [50]; ad hoc, cluster, broadcast,
position, and geocast based; geocast, and broadcast; receiver-based, or sender-based [50].
Based on the routing metric in question, VANET routing algorithms can be classified as
the following: geographic location, mobility, connectivity, infrastructure, and probability
model based [50]. According to Taysi and Yavuz [50], in contrast with sender-based
routing algorithms, receiver-based routing algorithms generate lower overhead, making
them better suited for high density networks in major cities. Routing protocols have
unidirectional, or bidirectional path support with their corresponding advantages and
disadvantages [50, 55]. Routing (link, and path selection) is constrained by any of, or a
combination of the following metrics/requirements: bandwidth, delay, and cost [48].
Similarly, QoS is constrained by bandwidth, cost, and delay. Closely related to these QoS
metrics, bandwidth-constrained routing algorithms, cost-constrained routing algorithms,
and delay-constrained routing algorithms [56] [5, 48] were developed. Based on how the
network state information is maintained/updated, and how the best path from many
potential/possible/feasible paths are chosen, three routing strategies have been identified:
source routing, distributed routing, and hierarchical routing [48].
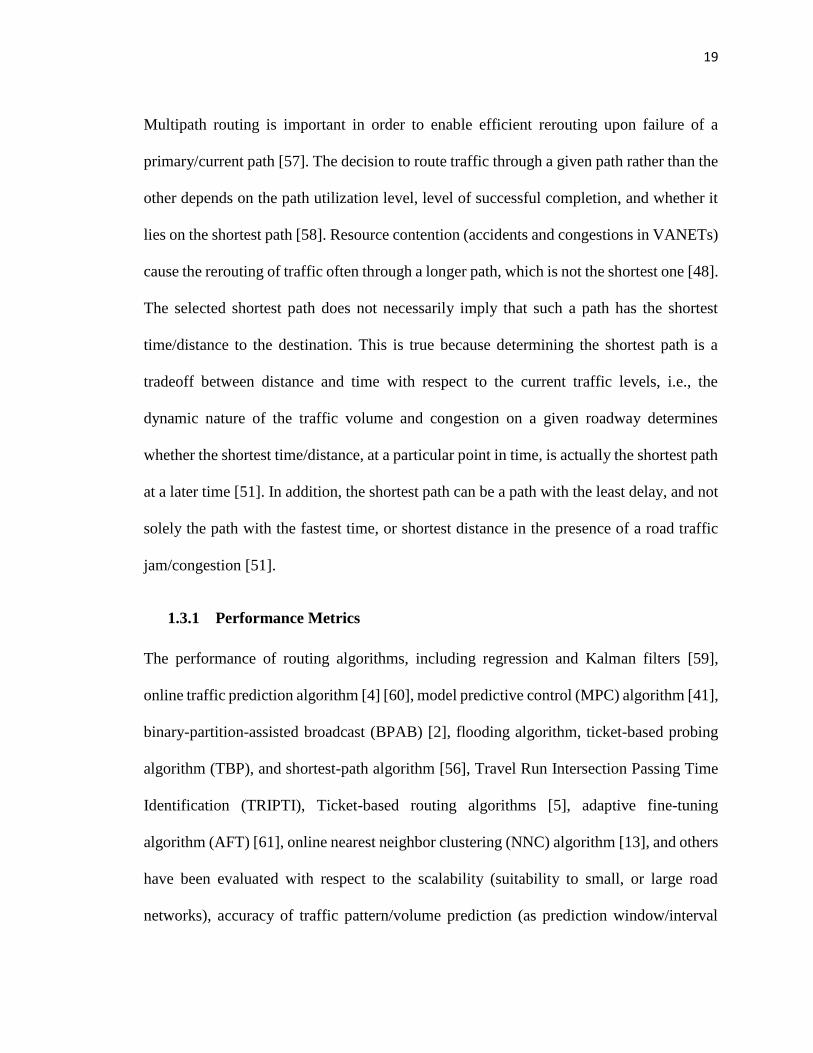
19
Multipath routing is important in order to enable efficient rerouting upon failure of a
primary/current path [57]. The decision to route traffic through a given path rather than the
other depends on the path utilization level, level of successful completion, and whether it
lies on the shortest path [58]. Resource contention (accidents and congestions in VANETs)
cause the rerouting of traffic often through a longer path, which is not the shortest one [48].
The selected shortest path does not necessarily imply that such a path has the shortest
time/distance to the destination. This is true because determining the shortest path is a
tradeoff between distance and time with respect to the current traffic levels, i.e., the
dynamic nature of the traffic volume and congestion on a given roadway determines
whether the shortest time/distance, at a particular point in time, is actually the shortest path
at a later time [51]. In addition, the shortest path can be a path with the least delay, and not
solely the path with the fastest time, or shortest distance in the presence of a road traffic
jam/congestion [51].
1.3.1 Performance Metrics
The performance of routing algorithms, including regression and Kalman filters [59],
online traffic prediction algorithm [4] [60], model predictive control (MPC) algorithm [41],
binary-partition-assisted broadcast (BPAB) [2], flooding algorithm, ticket-based probing
algorithm (TBP), and shortest-path algorithm [56], Travel Run Intersection Passing Time
Identification (TRIPTI), Ticket-based routing algorithms [5], adaptive fine-tuning
algorithm (AFT) [61], online nearest neighbor clustering (NNC) algorithm [13], and others
have been evaluated with respect to the scalability (suitability to small, or large road
networks), accuracy of traffic pattern/volume prediction (as prediction window/interval

20
increases/varies), and travel time/duration efficiency, and others [11, 34, 56]. Particularly,
Shigang and Nahrstedt compared the performance of three dynamic ad hoc-based routing
algorithms namely the Shortest Path (SR), flooding, and Ticket Based Probing (TBP) with
respect to the metrics of: success ratio, message overhead, and average path cost resulting
in varied performances depending on the particular metric in focus [56].
The existing investigated performance metrics such as number of stops, length of queue,
delays at intersections, (average) speed, and travel times/delays have also been used in
adaptive traffic control [5] [61]. Some other metrics used to compare the performance of
these VANET routing algorithms include, but is not limited to: time overhead,
computation/processing complexity, network state imprecision, delay (link, propagation,
processing, jitter, and delays, etc.), bandwidth, cost (number of hops),
scalability/extensibility as network size and complexity grows, latency, and others [48] [1]
[5]. An inverse relationship exists between latency and network congestion, i.e., increase
in congestion will reduce the amount of relayed messages, leading to increasing latency
[1]. The higher the flow rates, the greater the probability/propensity/tendency for road
traffic congestion [11]. Several studies have evaluated one or more of the following
performance metrics in a test/simulation environment, and/or field-test: speed/velocity,
acceleration, (average) travel/trip time, accuracy, efficiency, distance, deceleration,
traffic/vehicle density, cost, emission levels/environmental impacts, fuel consumption,
delay: end-to-end delay, end-to-end QoS, bandwidth, delay cost, bandwidth, traffic flow
rate, and others [5, 6, 11, 36, 39, 41, 48, 50, 51, 56, 62] [8, 34, 53] [1, 9, 28, 37]. For
example, Khabbaz et al. [53] evaluated the performance of their traffic models based on

21
mean/average queuing delay, mean/average transit delay, and mean/average end-to-end
delay against vehicle density. They defined Mean/average end-to-end delay as the sum of
mean/average queuing delay and mean/average transit delay [53]. Vehicular Density is
defined as the number of vehicles/length of roadway [12], or vehicle/meter [38, 53] [63].
Three perceived QoS performance metrics used/evaluated by Yung-Cheng and Nen-Fu
[12] include knowledge acquisition rate (KAR), effective propagation rate (EPR), and
safety-distance information rate (SDIR). In addition, vehicle speed, traffic density, and
propagation protocols are additional perceived QoS (PQoS) metrics evaluated [12]. In
addition, Caceres et al. [64] defined Vehicle intensity factor as the ratio of Average/mean
vehicle counts per hour over Average/mean counts per total estimation/measurement
period.
1.4 Dijkstra and A*(Astar) Algorithms
End-to-end QoS is maintained by adaptively and dynamically rerouting and redistributing
resources accordingly. Non-reservable resources perform best-effort delivery even for real-
time jobs. A dynamic, adaptive routing algorithm ensures full resource utilization through
resource redistribution among interconnected nodes in real-time/near real-time. The
routing algorithm also ensures that the final path chosen has the highest probability of
successfully establishing and completing the connection [58]. Adaptive traffic control aims
at dynamically regulating traffic in order to prevent (or at least minimize to the barest
extent) congestions, and other inefficiencies/delays on roadways [5]. In VANETs,
congestion information is sent from the source/primary vehicle/node to others, so that they
can adaptively reroute traffic through uncongested roadways using Dijkstra’s shortest path

22
algorithm; while re-computing their travel times in order to accommodate the effects of a
traffic incident. When the roadway becomes clear again, the same process is used to inform
other vehicles of this condition/information [6].
In order to forward packets to achieve the most minimum delay possible, each node/vehicle
has to know the speed limits of each possible roadway through which the packet can be
routed through – the shortest path (with respect to time, or distance) [50]. In a multipath
scenario, where data can be transmitted through one of many paths, the selected path (after
load-balancing) is the path with the minimal congestion level to the destination as
determined by the adaptive feedback loop messages from interconnecting nodes to the
destination [58] [10]. The algorithm proposed by S. Qing and Xiaofan [34] demonstrated
better efficiency (i.e., how fast they can preprocess, and compute the shortest/best path
from source to destination) with acceptable accuracy levels (i.e., how valid/reliable the
results are). Dijkstra’s algorithm, a widely used shortest path algorithm that is very efficient
when used in small road networks, becomes inefficient when used in large road networks
(like the A* (Astar) algorithm also); hence, the need for variations to this algorithm in order
to reduce/completely eliminate this inefficiency [34] [50]. With respect to traffic estimation
and dynamic routing a modified version of Dijkstra’s algorithm is used by CATE for
making vehicle routing decisions [8].
1.5 Improving the Scalability of Algorithms
The increase in the size of the network results in a scalability problem that leads to an
increase in network state imprecision. Clustering, a process of aggregating/grouping nodes
into clusters that share information with other clusters, is an attempt to minimize the

23
problems of scalability, and network state imprecision as the size of the network increases
[28, 36, 48]. Some advantages of clustering are fair channel use, contention reduction,
easier management, and control of network topology [36, 38]. Nevertheless, clustering
introduces the overhead of choosing a cluster head and maintaining nodes within a cluster
in a dynamic VANET with constantly changing node topology [36]. Besides being better
suited for small road networks, most algorithms for computing the shortest path have
inefficient preprocessing, computing, and storage costs associated with them.
Consequently, S. Qing and Xiaofan proposed a hierarchical routing algorithm, which is
suitable for efficient route computations on large road networks (like New York) and
compared its performance with two other well-known and previously employed
algorithms: SPAH algorithm, and A* algorithm (using Euclidean distance as cost function)
[34]. This hierarchical routing is an efficient routing algorithm that is used to compute the
shortest path form source to destination, which consist of two possible alternatives: within-
community routing (WICR) and between-community routing (BCR), based on whether the
source and destination nodes are within, or outside the community [34]. The metrics of
accuracy, and computation time/efficiency were used to evaluate the performance/validity
of the hierarchical routing algorithm in both within-community (WICR), and between-
community routing (BCR) [34]. The algorithm proposed by the authors showed better
efficiency with acceptable accuracy levels [34].
1.6 Evaluating Performance
Bidirectional coupling of networks, and road traffic simulators exhibits better performance
when compared with uncoupled/trace-based simulation. The drivers respond positively to

24
IVC messages/information while driving in order to choose the best/shortest route to their
destinations [6]. Sommer et al. [6] developed a hybrid simulation tool – Veins (Vehicles
in Network Simulation) [65] for bidirectional coupling of network simulator (OMNeT++)
[66], and road traffic microsimulator (SUMO) [67] in analyzing inter-vehicle
communication (IVC) over two different protocols: TCP (centralized), and UDP
(decentralized). With Veins, OMNeT++ controls the inter-vehicle communication (IVC)
protocols, while SUMO is responsible for vehicle/node movements using accurate street
maps of a particular place/city [6]. A model for CO2 emission can also be
coupled/integrated with veins to measure environmental impacts [6]. OMNeT++ is
responsible for adding nodes, deleting nodes (nodes that have reached their destination), or
moving nodes around. IVC determines their speed, and routes in relation to different
environmental conditions [6]. Like other tools: MobiDense (traffic simulator), and QualNet
(network simulator) used by Leontiadis et al. [8], Veins provides for real-time exchange of
information between the network and traffic simulators i.e. while the simulation is still
ongoing, active results can be collected [6]. Simulation experiments were carried out in the
scenarios where IVC was enabled and was not enabled. Although the simulation runtime
increases with bidirectional coupling, its pros far outweigh cons [55]. In addition, the need
for more realistic simulation with real-world topology/map using MobiDense (vehicle
traffic simulator) and QualNet (network simulator) with real-time exchange of information
between both simulators was also buttressed by Leontiadis et al. [8] as essential/needed.
This is because most studies simulate driving scenarios that are too simplistic and do not
reflect actual/complex and heterogeneous real-world driving scenarios/conditions [7] [1]
[11] [12] [13] [2] [14] [7]. Leontiadis et al. asserted that their work was the first to evaluate

25
the performance of distributed vehicular communication using a real-world city
map/topology, vehicle mobility simulators, and network simulators [8]. As a future work,
Yung-Cheng and Nen-Fu will try to incorporate real world maps in their study [12].
1.7 Environmental Impacts
Respecting vehicular emission levels and their environmental impacts, in a study by
Sommer et al. [6], the average speed of vehicles (in free flowing traffic) with and without
congestion was measured together with the emission levels utilized – environmental
impacts; the results show that all vehicles, on the average, emitted 63kg of CO2. By
integrating OMNeT++ mobility model with the EMIT model, the level of CO2 emission
can be roughly ascertained by considering factors, such as vehicle speed, acceleration, and
individual/unique vehicle features like mass/weight, engine, and installed catalytic
converter [6]. In order to minimize CO2 emissions, travel times, and average speeds must
be optimized in whatever model is chosen [28].
Using the throttle level of a vehicle operated by a driver as input, the following vehicle
performance metrics/parameters can be measured/determined: speed, acceleration, type of
transmission (automatic, or manual), fuel consumption, engine torque, and power, and
others [62] [9]. The model developed by Rakha et al. can be used by/coupled with existing
traffic simulators such as SUMO, fuel consumption, and emission models used in vehicular
transportation [62]. The type of driver (aggressive vs. defensive) and other driver behaviors
also can be estimated/determined from the throttle level as input [62]. Driver behavior or
throttle level, engine speed, fuel consumption levels, and others can be obtained from on-
board diagnostic (OBD) readers [62]. Depending on the air speed, vehicle mass, vehicle

26
speed, and grading of the roadway, and others, the level of resistance experienced by a
vehicle (e.g., aerodynamic resistance, grade resistance, and rolling resistance) affects the
amount of power utilized, the level of fuel consumption, and others [62]. Given a vehicles
acceleration, its speed and position values can easily be derived from it [62]. In the study
by also by Rakha et al. [62], the test model was validated with respect to model power
generated, and fuel consumption levels in a cruise controlled vehicle (with speed set a
104km/h or 65mi/h) over a 22km roadway in a real-world/field scenario [62]. The Virginia
Tech Comprehensive Power-based Fuel Model (VT-CPFM) was used for modeling the
fuel consumed by vehicles because of its ease of use and because it is freely/publicly
available – it has specific fuel economy data [62]. Besides, the acceleration, position, fuel
consumption, and speed estimates produced by the model correspond with field generated
results [62].
It is important to note that more greenhouse gas (GHG) emissions/fuel is utilized by
stationary, idling, or vehicles traveling at a reduced speed limit resulting from traffic
congestions in relation to their counterparts in free flowing traffic i.e. traveling at/over the
stipulated/actual speed limit as shown in Figure 1 [15].

27
Figure 1: Overview of greenhouse gases and their percentage distributions emitted as a
result of road transportation [25].
Figure 2: Carbon dioxide emissions in the U.S. by Source [24].
Besides the electricity sector (32%), the second largest culprit responsible for the emission
of greenhouse gas emissions to the environment in the tune of 28% in 2012 is the
transportation sector as shown in Figure 3 [15] [18] [68]. Similarly, next to the electric
sector (38%), the transportation sector (32%) is a major contributor – the second largest

28
contributor – to the total amount of carbon dioxide emitted into the environment as shown
by Figure 2.
Figure 3: Aggregate U.S. greenhouse gas emissions contributed by each sector of the
economy in 2012 [69] [15].
1.8 Intelligent Transportation System (ITS) Applications
Enhancing Safety Using V2V Communication: According to the National Highway Traffic
Safety Administration (NHTSA), 71% of unimpaired driver crashes using heavy duty
trucks/vehicles can be reduced/eliminated using V2V communication applications [15].
The following list of V2V safety application warnings can aid the driver in evading
potential crashes/accidents: emergency electronic break lights warning, forward collision
warning, do not pass warning, blind spot warning, loss of control warning, changing lane
warning, and bus driver/transit vehicle warning. The transit/bus driver warning emanates/is

29
seen from a scenario where a vehicle wants to turn right in front of a bus also trying to
make a right turn [15]. Other additional safety applications of ITS (V2V/V2I
communication) include, but are not limited to: curve speed warning, pedestrian warning,
red light warning, and movement assistance at intersections [15]. Enhancing Safety Using
V2I communications: It is noteworthy that 12% of crashes not addressed by V2V
communication are addressed using V2I communication; in other words, V2I
communications serves as a complement/supplement to V2V communication [15]. Using
traffic signal change and timing (SPaT), improvements in safety, and traffic
efficiency/mobility can be attained/enhanced [15]. Some of the possible/potential V2I
communications safety applications include, but are not limited to: emergency vehicle
priority assignment, vehicle speed management, intersection safety, rail crossing safety,
transit vehicle safety, commercial vehicle safety, and roadway departure safety/prevention
[15]. Other additional possible applications of V2I communication safety applications
include: stop sign gap assist (SSGA), curve speed warning (CSW), and red light violation
warning (RLVW) [15]. Building redundancy into sensors and other ITS
equipment/technology can be used to ensure fail-safe/resilient operations [15].
Because of these and other challenges, the need for realistic simulation and field studies
are pertinent in furthering our understanding on the efficiency and effectiveness of VANET
routing algorithms, architectures, safety, and mobility applications.
30
2. Future Traffic Pattern Prediction
There are a number of research efforts for carrying out future traffic pattern
prediction/prognosis. For example, the online traffic prediction algorithm is only able to
accurately predict/prognosticate traffic volume patterns 10 minutes ahead [4]. COMAC
(clustering and OFDMA-based MAC) is a fuzzy logic inference system for VANETs,
which is adaptive to driver behavior and can predict future vehicle speed and position,
while exchanging cluster heads based on stability [36]. Using a centralized model
predictive control (MPC), the total time spent (TTS) by drivers while waiting for prediction
is lower vis-à-vis the decentralized approach, but requires a longer computation time; in
order to minimize this computation time, the computation power (resources) must be
increased i.e. it is not very scalable unless computation power is also increased [41] [70].
Using Monte Carlo Simulation, the stochastic model reliably estimates/predicts traffic flow
patterns, and travel time/duration [11].
Dong and Mahmassani analyzed 7 month weekday traffic data and discovered 227
congestions most prevalent in the morning and evening rush-hours [11]. Tchrakian et al.
evaluated the accuracy of the algorithm they developed for day-time, weekday traffic flow
estimation/prediction [45]. In their study, every 15 minutes, 1 hour 15 minutes traffic
pattern was predicted by the algorithm [45]. They also showed that with the appropriate
forecasting window of 1 hour 15 minutes, prediction accuracy using spectral analysis is
obtained [45]. The comparison of the predicted vs. actual traffic flow/volume on a given
Friday used a 5 day historical traffic flow data pattern of previous Friday’s based on data
collected from loop detectors [45]. 5 – 6 days (5 days was used in this paper) of historical

31
traffic data proved optimal for a more accurate prediction; reducing this number introduced
errors in aggregation, and increasing it did affect the results obtained [45]. They also found
that predicting traffic flow/volume at larger time horizons/intervals (1 hour 15 minutes
instead of 15 minutes), introduces errors leading to inaccuracies [45]. Because of a decrease
in root mean square (RMS) error, moving horizontal averaging was shown to be effective
in its predictions [45]. The accuracy of the spectral analysis technique is comparable with
those of previously studied techniques using Neural Networks, time-series, and Mean
Absolute Percentage Error (MAPE) because of its adaptability to real-time scenarios [45].
In the future, this spectral analysis technique can also be effective when used with a signal
control scheme [45]. The performance of the experiment for evaluating traffic information
accuracy by Leontiadis et al. was evaluated based on three algorithms: Bayes, Bayes with
aging, and most recent estimate [8]. Up to a certain percentage (greater than 10%) of
misbehaving/faulty nodes are required to negatively affect (increase) the average trip time.
Algorithms such as Bayes tends to show more resilience/better performance as the number
of faulty nodes increase because its computations are based on averaging sample values
such that more accurate approximations/predictions can be made [8].
Y. Qing et al. proposed a means to more accurately predict/forecast traffic conditions
(speed, volume, and others) from irregular/intermittent data sources by introducing
acceleration, which is used to help in more reliable and accurate forecasting of speed, and
volume [14]. Time series, genetic algorithms, and neural networks have been used in short-
term traffic state forecasting to accurately predict travel times/speeds [14]. The study used
the naïve method, and neural networks (used for results aggregation from other methods)

32
and others [14]. Neural networks, in combination with the use of acceleration, and adjacent
segments produced the best results from all the algorithms/methods used [14]. With respect
to lane changes, and other driving maneuvers, decision trees were used in both lateral
guidance, and longitudinal guidance to ensure that they are efficiently, effectively, and
safely done [35]. Regression and Kalman filters, and neural network methods are some
attempt to more accurately predict traffic patterns. However, they cannot produce very
accurate results and are often only useful at particular periods/scenarios [4]. Using
Artificial Neural Networks (ANNs) and Support Vector Regression (SVR), Yongchang et
al. evaluated the travel time prediction accuracy of these artificial intelligence (AI)
schemes given the current travel time, flow and density of vehicles equipped with vehicle
infrastructure integration (VII) [37]. With respect to travel time prediction accuracy, the
results show that vehicle infrastructure integration with Support Vector Regression (VII-
SVR) barely outperformed that of vehicle infrastructure integration with Artificial Neural
Networks (VII-ANN). In addition, both AI schemes showed good performances with
irregular congestion conditions, which is currently a challenge to traditional sensor-based
road-side units (RSUs) [37].
Using several machine learning techniques namely Support Vector Machine (SVM), K-
Nearest Neighbor (K-NN), and several tree-based methods, Jahangiri and Rakha [71] set
out to build/develop classifiers that can be used to accurately predict/identify different
transportation modes such as walk, run, bike, car, and bus using data obtained/sourced from
smartphone sensors and a customized data acquisition system [71]. The authors also
identified several important features using the Mean Decrease Accuracy, and Mean

33
Decrease Gini [71]. Minimum redundancy maximum relevance (mRMR) was used as
feature selection criterion, while out-of-bag error, and five-fold cross-validation were used
as model selection criteria [71]. The following lists the overall detection accuracy of the
supervised machine learning algorithms/techniques evaluated in descending order i.e. from
most accurate to least accurate: Random Forest (RF) – 95.1%, Support Vector Machine
(SVM) – 94.62%, Bag – 94.4%, Decision Tree (DT) – 87.27%, and K-Nearest Neighbor
(KNN) – 91.2% [71].
In summary, accurate knowledge of the current traffic condition/pattern is invaluable in
congestion avoidance and amelioration. Consequently, we evaluated the prediction
accuracy of our data using several machine learning algorithms. The results will provide
reliable forecasts of future traffic volume patterns/conditions for reliable decision making.
3. Human Factors Challenges in Intelligent Transportation System (ITS)
As hitherto aforesaid, the ITS research domain is a multifaceted, interconnected, and
interactive area with different wireless devices, infrastructures, vehicles, humans,
environment, etc. compositions as shown in Figure 4 [72] [73]. In other words, different
interacting entities make up the ITS discipline/domain; some of these entities include,
but are not limited to: drivers – which can be completely automated, semi-automated,
or manual i.e. human driven; cyber-physical systems – consisting of sensing,
communication, and networking components, etc.; and transportation system –
consisting of mechanisms for traffic control management [74].

34
Figure 4: Different interacting entities/artifacts that make up the ITS research domain [75].
Figure 5: Some goals/advantages/promises of ITS [76] [77] [78].
ITS
Human
Data
InfrastructureEnvironment
Vehicle

35
In agreement with other authors/authorities, safety, and security are two major ITS goals
identified by the U.S. DOT. Other goals include: mobility, greener
transportation/reduction in the emission of greenhouse gases (GHG), etc. as shown in
Figure 5 [15]. Consequently, rerouting vehicles away from congested and precarious
routes (Figure 7, and Figure 8), trip rescheduling, using public transportation/carpooling,
etc. are some of the many ways of enhancing fuel-efficient, safe, and eco-friendly
navigation/travel [15] [18] [23] [17]. In addition, traffic mobility can be improved by
effectively aggregating, distributing, and utilizing/synthesizing streaming/real-time data to
end/road users [15]. For example, intelligent road (iRoad), one of many realistic
applications of the ITS technology, is particularly useful in the following applications:
intelligent fuel efficient vehicles, online best route queries, dynamic bandwidth allocation,
real-time dynamic traffic maps, remote assessment of accidents, and dynamic traffic signal
collaboration/coordination. Put together, all of these will result in the optimization of
transportation monitoring and design [79]. Also, distributed cyber-physical systems will
result in distributed collaboration for safety and collision avoidance in ITS [80]. However,
before fact-based evidence can be obtained by actual field tests, preliminary evidence
using simulation studies is imperative in order to effectuate later real-world/field
operational tests/studies (FOTs) [15] [18] [23] [17]. In a simulation environment/virtual
test-bed, the coupling of various types of simulators such as traffic, driving, and
network/communication simulators – as shown in Figure 6 is essential to adequately
investigate the human factors ITS research domain.

36
Figure 6: Other ITS simulator tools [22].
Situational awareness while driving is critical to safety [7]. Consequently, in the bid to
improve road safety, advanced driver-assistance systems (ADASs), and other built-
in/external devices have been incorporated into the vehicle [7]. Besides, ubiquitous smart
phones can also be used to monitor roadway conditions, and driving behaviors of drivers
by providing the driver with proper feedback to make safe, and intelligent driving decisions
[7]. Also, in order to improve safety, and minimize congestions, quality (efficient – fast
and selective/discrete without causing distractions, and effective – useful for decision
making) traffic information dissemination to drivers is essential [12]. This is especially true
because instead of aiding in congestion reduction, too much information
exchange/dissemination can also worsen the distraction problem if not selectively, and
efficiently disseminated [12]. As a result, bidirectionally coupled simulators (Figure 6)
enable real-time coupling/collaboration of network, and road traffic simulators such that
things such as: accidents, road congestions, and other roadway incidents are communicated
to the driver for timely and accurate decision making i.e. these information influence the
drivers behavior [55].
ITS Simulator Tools
Traffic Simulator e.g. PARAMICS,
SUMO
Driving Simulator e.g. STISIM,
CARSIM
Network Simulator e.g.
NS2, NS3

37
Figure 7: Using V2X navigation to optimize traffic efficiency by avoiding congested routes
[81] [82].
Figure 8: Using V2X applications to circumnavigate a precarious road condition [81] [82].
Having a uniformly interoperable, and secure communication platform between vehicle-
to-vehicle (V2V), and vehicle-to-infrastructure (V2I) communications is a major
requirement for effective traffic flow management, and collision avoidance. Vehicle-to-

38
vehicle (V2V), and vehicle-to-infrastructure (V2I) interaction/integration models are not
very efficient and effective in handling real-time decision making because current traffic
models take a homogenously simplistic approach. In other words, current models have the
limitation of not incorporating the unique characteristics/behaviors of the individual driver
such as whether or not the driver is an: aggressive, or defensive driver; expert, or novice
driver, etc. However, individual drivers are different with respect to their experience, age,
and other internal and external distractions experienced in the course of driving. Besides,
in the real-world, driving is a complex and heterogeneous activity that can be affected by
several factors such as accidents, weather, together with other man-made and
natural/environmental conditions/stimuli – hence the need to develop a more extensive and
inclusive heterogeneous model that is capable of handling these and many other dynamic,
real-time scenarios [83]. This is especially true because most ITS research has focused on
interactions among V2V, and V2I, but few have incorporated the human factors challenge
such as driver behavior, and cognitive overload, etc. into the research [84] [22] [75]. Put
differently, the need to develop a model that can handle/support human to vehicle
interactions and vice versa; human to environment/infrastructure interactions and vice
versa; and vehicle to environment/infrastructure interactions and vice versa is most
imperative.
Respecting the human actor, sensory inputs form the environment, and the vehicle are
modeled by the brain and used to make decisions (anticipate, predict, or plan the next
response/move). Some human factors research concerns/focus in ITS are shown pictorially
in Figure 9; from this figure, some of measurable parameters here include, but is not limited

39
to: information/cognitive overload, levels of task, time, performance, and
satisfaction/utility, etc. [85].
Figure 9: Some human factors research focus/evaluation metrics [22].
As partially depicted in Figure 10, and Figure 11, the choice of communication modes,
interface design, gender, ethnicity, age, vehicle type, etc. are also some of the human
factors challenges that must be considered during ITS human factors modeling and design.
In general, it is advised not to change the traditional way people do things in order not to
make it more difficult for them – make interface designs as easy to use as possible with
little or no learning curve.
Human driver
metrics
Perceptual: Sight, sound,
sense Cognitive division of
labor between humans & machines
Performance: Task, time, satisfaction
Cognitive overload
Cognition
Information overload
Motor
Accessibility
Usability
Increased data aggregation from large,
complex heterogenous
sources
Response/reaction to critical
events

40
Figure 10: Human factors challenges in ITS [22].
Figure 11: Some pertinent factors that should be considered when modeling the human
driver profile in order to overcome some of the human factors challenges in ITS [75] [22].
ITS Human Factors
Challenges
Human modelling
and simulation
Adaptive human-specific
algorithms
User-centered
design
Human driver
modeling
Perception
Situational awareness
Liabilities (cons)
Capabilities (pros)
Intent
Behavior analysis:
reaction/
response

41
In determining the users’ level of perception and satisfaction with ITS technology the
following observations are useful and should be recorded as shown in Figure 11: cognitive
overload, level of task performance, and satisfaction derived – usability – for users with
varying perceptual, motor, and other forms of impairments/challenges, etc. [83].
A number of research efforts respecting the human factors challenge in ITS have been
carried out. The Hybrid-State System (HSS) incorporates driving collaboration among
various entities such as the human driver, completely autonomous driver, and semi-
autonomous driver as shown in Figure 12. The simulation used data sets generated from
virtual sensors and objects, besides video data in the test-bed [84].
Figure 12: Automated, human, and shared/hybrid control scenarios while driving [86].
Analysis of human behavior, especially in the course of driving, and other pertinent metrics
are some of the human factors research focus in ITS as depicted in Figure 13. In order to
efficiently and effectively monitor and control the driver behavior – perceptual, motor, and
cognitive stimulus/response, etc. – vehicles are equipped with onboard units (OBU)
Feedback/control mechanism
Automated HumanBoth i.e. shared
control

42
consisting of: cameras, antennas, sensors, etc. Both onboard, and roadside smart sensors
serve as data sources for real-time information that is useful for real-time dynamic
traffic flow management that minimizes congestion – while also improving
road traffic safety conditions; these sensors have varying transmission ranges, latencies,
reliability, and security specifications, etc. [85].
In order to promulgate improved safety, and traffic efficiency/mobility via human behavior
monitoring, Gerla [21] advocates four driver reaction models that consists of: compliance
models – measures a drivers compliance to instructions or otherwise while driving;
physical condition models – detects/predicts a drivers distraction level e.g. as a result of
tiredness/sleepiness; reaction time models – measures a drivers reaction to unforeseen
traffic incidents; and autonomous care drive models – forecasts the duration/time lag in
restoring a distracted drivers attention [21]. In order to build a driver behavior model,
several in-vehicle devices such as video cameras/monitors, sensors, etc. are used to collect
pertinent information respecting driver behavior; besides, external traffic conditions
respecting the traffic parameters of other vehicles on the road such as heading, speed,
position, etc. are also imperative. Finally, machine learning algorithms/techniques can be
used to build/predict/forecast/prognosticate a human/automated vehicle driver model by
emulating a human drivers behavior [21]. In a completely/semi-automated vehicle driver
scenario, the human driver model can be used to make decisions such as whether to awaken
a sleepy driver, or to bypass the driver and stop a vehicles movement in order to
obviate/avoid an accident [21].

43
Figure 13: Human factors research focus in ITS [22].
In determining the human driver performance, a human factors (perceptual, motor, and
cognitive) speed control model that incorporates speed perception, speed selection –
decision support, pedal/motor control, and a vehicle mechanical model was developed by
Zhao et al. [87] using a driving simulator STISIM® (STISIMDRIVE M100K) platform
that compares modeled data with experimental data [87]. The following performance
metrics were evaluated by the authors: how many times the dashboard was looked at, how
many times the speedometer was looked at for speed perception, how decisions were made
based on bad weather, traffic congestion levels, motor control for various disabilities, and
how many outside looks for situational awareness, etc. [87]. The demographics of the study
that used the driving simulator consists of a total of 12 participants (6 males, and 6 females)
from ages 26 to 50 with a valid driver’s license, and at least 2 years of driving experience
Human factors
research focus in ITS
Analysis of driver behavior
Driver performance
modeling
Workload estimation
Driver perception of
and reaction to traffic
alerts/warnings

44
[87]. This demographics/human driver participants profile is further elaborated upon in
Figure 14.
Figure 14: Some selection criteria for user participation in the study [87].
The experimental setup consists of driving speed limit intervals of 25mph, 45mph, and
65mph in a driving scenario consisting of no traffic lights, no road signs, no pedestrians,
and a two lane highway without other vehicles present. Acceleration and deceleration were
the two independent variables measured. Both acceleration and deceleration have the
following as common attributes: gas pedal angle (degree), acceleration (ft/s2), and speed
(ft/s); deceleration, however, has the brake pedal angle (degree) as a unique attribute [87].
Also, situations that might cause a driver to exceed the speed limit and the resulting
consequence – a speeding ticket – can be determined in real-life applications of this driving
simulation [87].
Driver/Human
Profile
Demographic information
Age range
(26-50)Gender
Driving history
(> 2 years)
Total mileage covered
Date of first issue of drivers
license
45
A particular criticism/limitation of his study rests upon the fact that in the real-world,
driving is not a homogeneously simplistic activity; in other words, driving with no traffic
lights, no road signs, and no pedestrians is in contrast to what is obtainable in the real-
world.
In another study by Ishihara and Gera [88] various factors such as driver model: sleepy vs.
normal, old vs. young, distracted vs. not distracted, etc.; vehicle model: cars, trucks,
motorcycles, bikes, etc.; road model: highway, rural, urban, intersection, etc.; and
communication model: V2V, V2I, hybrid, etc., can be varied in order to improve traffic
efficiency, and safety by monitoring the drivers behavior [88]. The interactions of V2V,
and V2I communication can be used to obviate road traffic accidents emanating from a
distracted/sleepy driver. The authors also noted that the type of feedback/notification mode
(audio, visual, haptic, or a combination of some/all) plays a significant role in ameliorating
some of the negative consequences of distracted driving [88].
It is imperative to note that ad hoc/vehicle-to-vehicle (V2V) communication requires no
additional infrastructure cost while mainly employing/possessing a direct, efficient inter-
vehicle communication; broadcast communication using IEEE 802.11p; and dedicated
frequency used specifically for vehicular communication [89]. Cellular/vehicle-to-
infrastructure (V2I) communication, on the other hand, requires an additional infrastructure
cost while mainly possessing or employing higher transmission ranges, shared
communication medium/frequency, higher latencies, and unicast communication
compared with V2V/ad hoc communication [89]. Besides, at low V2X penetration rates,
multi-hop routing/communication/propagation cannot be effective owing to the

46
insufficiency/limited number of conveyors/relays from source to destination [89]. At
higher V2X penetration rates, however, network/radio channel congestion/saturation as a
result of high V2X message transmission/reception (exchanges) results in message
suppression [89].
Respecting the effects/influence of mobile phone use on driving performance, the
following metrics can be measured/observed as reported by Thakur [46]: visual distraction
i.e. loss of eye focus – for example as a result of a ringing phone; cognitive distraction: for
example, changes in emotions, thinking; physical distraction: frequent breaking, and
leaving the steering wheel [46]. The experimental setup consists of a total of 49 participants
(both male, and female) belonging to three different age groups namely: young (18 – 25
years) – consisting of 9 males, and 9 females; middle (30 – 45 years) consisting of 9 males,
and 8 females; and older (50 – 60 years) consisting of 8 males, and 6 females [46].
As severally aforesaid, vehicular cyber-physical systems (VCPS), also known as vehicular
ad hoc networks (VANET), promises enhanced driver, and pedestrian security [90].
Consequently, Wagh et al. [90], modeled a human vehicle driver profile in their study with
a view of determining the effect of traffic warning related message dissemination
respecting the efficiency, effectiveness, and utility on the human drivers
reaction/performance [90].
In an attempt to improve, and quantify the human factors research challenges in ITS, Wagh
et al., [90] also evaluated the following metrics/parameters in their study: driver
response/reaction to timely, and late warning/notification messages using an on-board data

47
fusion algorithm by measuring/observing reaction time, message type, hazard severity,
response/reaction type, driver’s individual preference, as well as information overload on
levels of driver distractions, confusions, and frustrations as elaborated pictorially in Figure
15 - Figure 17 [90]. To the best of the knowledge of the authors, this study is the
first/pioneer study that integrates/incorporates human factor challenges/perspectives with
the data fusion problem to improve VCPS safety, efficiency, and reliability [90].
Figure 15: Some performance metrics evaluated by Wagh et al. [90] that was used to
interpret/quantify human factors challenges.
Human driver
Driver profiles
Evaluation metrics
Utility i.e. of notifications
Efficient/effective notifications

48
Figure 16: Human factor (HF) challenges observed by Wagh et al. [90].
Figure 17: Driver profile and different message notification formats/metrics
observed/evaluated [90].
The experimental setup consists of STISIM as driving simulator; test drivers with steering
wheels, brake, and gas pedals; automatic transmission with a maximum speed limit of
70mph – speed warnings are given for speeds exceeding 40 mph through the audio and
Human Factor challenges
Information/cognitive overload
Confusions Frustrations Distractions
Driver
Elderly/Younger
Message preferences/metrics
Message utility
Individual/
personalized message
Repeated message Tactile message Visual message Textual message Audio message
49
video interface. An 89,000 feet long four-lane road (two lanes in opposite directions)
consisting of a total of 29 intersections (9 of which with violating traffic vehicles) were
used for the simulation [90]. Some of the factors that influence a drivers reaction/response
time include, but is not limited to: type of message, delivery mode, message frequency,
hazard severity with respect to vehicle location, response/reaction time, and rate of current
warning message with respect to the previous one [90].
Respecting the implications of a given type of message, the authors discovered that the
more a particular type of message is repeated, the more it is stored in long-term memory,
and the better the response time obtained/utility/satisfaction derived [90]. Total utility is
computed as the sum of the utilities derived from the message type, location of hazard,
communication mode, and notification range (NR)/delay [90]. As reported by the authors,
the greater the distance between the driver and the hazard (notification range), the more the
utility derived; in addition, the more accurate the drivers response/reaction will be i.e. he
will respond with greater accuracy and with fewer errors [90]. Besides, different
notification modes have different reaction times; the notification time depends on the
amount of time taken to decode/comprehend and respond to the message. The influence of
in-vehicle displays, smartphone applications, and other types of notification modes/devices
relative to the notification time(s), and frequency is imperative in effectively mitigating the
various undesirable consequences of distracted driving. Other metrics that can be
measured/observed include, but are not limited to driving behavior, reaction, and
preferences, etc. [91] [77] [76].
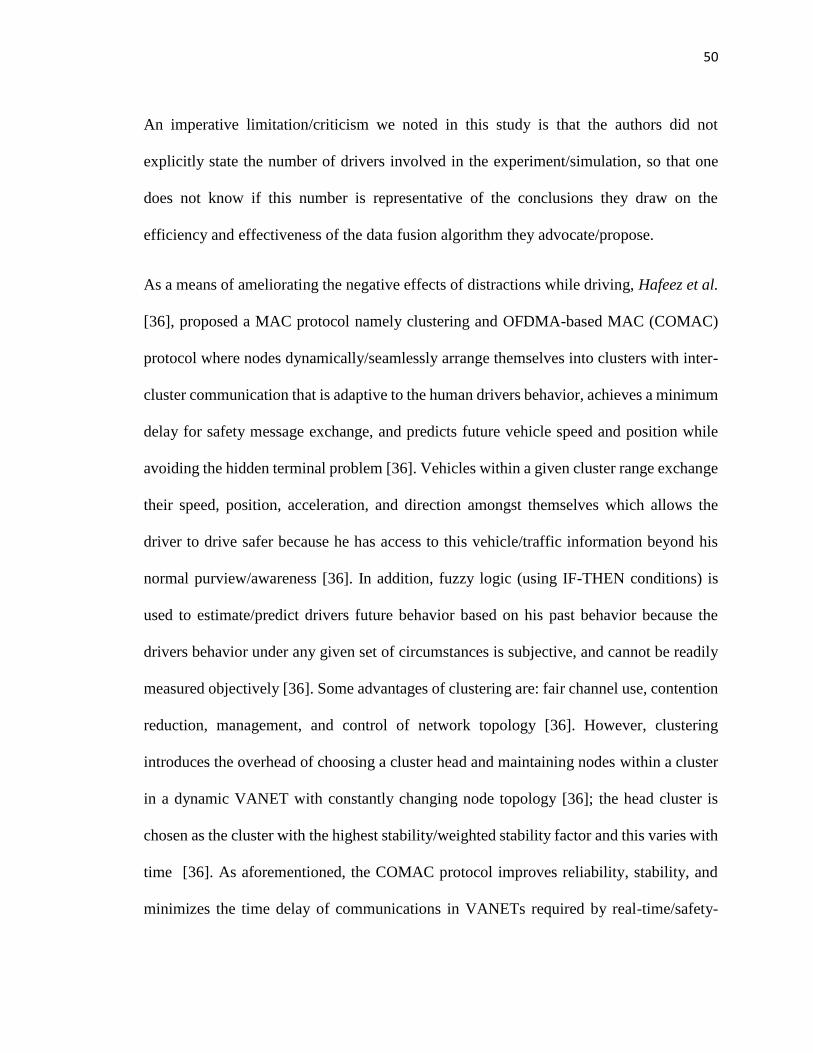
50
An imperative limitation/criticism we noted in this study is that the authors did not
explicitly state the number of drivers involved in the experiment/simulation, so that one
does not know if this number is representative of the conclusions they draw on the
efficiency and effectiveness of the data fusion algorithm they advocate/propose.
As a means of ameliorating the negative effects of distractions while driving, Hafeez et al.
[36], proposed a MAC protocol namely clustering and OFDMA-based MAC (COMAC)
protocol where nodes dynamically/seamlessly arrange themselves into clusters with inter-
cluster communication that is adaptive to the human drivers behavior, achieves a minimum
delay for safety message exchange, and predicts future vehicle speed and position while
avoiding the hidden terminal problem [36]. Vehicles within a given cluster range exchange
their speed, position, acceleration, and direction amongst themselves which allows the
driver to drive safer because he has access to this vehicle/traffic information beyond his
normal purview/awareness [36]. In addition, fuzzy logic (using IF-THEN conditions) is
used to estimate/predict drivers future behavior based on his past behavior because the
drivers behavior under any given set of circumstances is subjective, and cannot be readily
measured objectively [36]. Some advantages of clustering are: fair channel use, contention
reduction, management, and control of network topology [36]. However, clustering
introduces the overhead of choosing a cluster head and maintaining nodes within a cluster
in a dynamic VANET with constantly changing node topology [36]; the head cluster is
chosen as the cluster with the highest stability/weighted stability factor and this varies with
time [36]. As aforementioned, the COMAC protocol improves reliability, stability, and
minimizes the time delay of communications in VANETs required by real-time/safety-

51
critical applications [36]. However, as the number of vehicles increase (vehicle density),
reliability decreases and vice versa – given a specified communication range [36]. Also, as
the vehicle density decreases, emergency message travel time increases because of the
difficulty of finding neighboring cluster heads to propagate the message forward [36].
As reported by Sommer et al. [6], driver behavior is affected positively by vehicle-to-
vehicle (V2V)/inter-vehicle communication (IVC) and vice versa [6]. Also, using the
simple vehicle powertrain model for intelligent vehicle applications, the steering wheel is
controlled by the driver who determines the vehicles position and heading [62]. In addition,
the type of driver: aggressive vs. defensive, and other driver behaviors can be
estimated/determined from the throttle level as input [62]. Driver behavior or throttle level,
engine speed, fuel consumption levels, etc. can be obtained from the onboard diagnostic
(OBD) readers [62].
As previously stated/alluded to, most CPS research do not consider human
cognition/behavior. For this reason, an investigation into the effectiveness of ITS models
with respect to human factors research and driving behavior is an important area of
research that needs more exploration [22] [84] [92]. Also, an evaluation into the most
effective communication feedback/response/control methodology mainly based on
usability, and accessibility while driving is very imperative – especially in a complex and
heterogeneous driving environment. For example, in a situation where we have the
capability of both automated and human control, which one should be allowed control and
in what circumstances/situations/scenarios? In addition, what will happen when a fully
automated vehicle loses communication/control (V2V, V2I, etc.), and in what ways can

52
this undesirable situation be reliably mitigated/avoided? This is especially true because
sensor malfunctions/errors/inaccuracies/improper positioning’s, etc. can compromise
safety in a fully (100%) automated driving [35] [20]. These and other hitherto
ignored/neglected/unanticipated questions/concerns needs to be absolutely and adequately
addressed before ubiquitous use of the several promising ITS applications can be
unequivocally and reliably promulgated/accepted by all concerned stakeholders.
Evidently, from the above extensive review of literature, more realistic studies
incorporating the human factors challenge of ITS while using real-world scenarios (road
network topology and field data) that mimic the complex and heterogeneous real-world
traffic conditions have been evinced to be most needed/desirable – as most studies are void
of one or more of these; to this end, we attempt to make our own unique, realistic, and
imperative contribution.
4. Security and Privacy: Challenges and Countermeasures in Intelligent
Transportation System (ITS)
In many developed countries such as USA, Japan, UK, and Australia, road traffic
congestions are responsible for many economic losses to the tone of billions of dollars
[44]. Specifically, in the U.S., road accidents are responsible for over 2.7 million
(2,780,000) injuries, and 40,000 deaths per year. Over $380 billion/year is lost by the U.S.
economy as a result of wasted vehicle fuel/gas, and lost productive hours resulting from
congestions. According to the world health organization (WHO), road traffic accidents will
become the third highest contribution to the mortality rate resulting from injuries sustained
therefrom [83]. Intelligent transportation system (ITS)/vehicular ad hoc networks

53
(VANETs), however, engenders improved safety – via reductions in accidents,
comfort/infotainment/entertainment, and traffic efficiency, etc. [30] [29] [31, 93] [94] [95]
[96] [97, 98] [99] [100] [99] [101] [90].
VANETs (V2X communication) consist of vehicle-to-vehicle (V2V) communication (used
for conveying/disseminating non-safety messages – single and/or multi-hop) and vehicle-
to-infrastructure (V2I) communication (used for conveying safety-related messages –
single-hop) architectures. Using V2V communication, vehicle speeds, direction,
location/position, real-time road event conditions, etc. are constantly exchanged among
vehicles employing single, or multi-hop propagation every 100-1000 milliseconds. With
respect to V2X communication in VANETs, vehicles (OBUs) are highly mobile/dynamic
while infrastructure (RSUs) are immobile/fixed [50] [1] [29] [55]. Dedicated short range
communication (DSRC) messages such as decentralized environmental notification
messages (DENM), cooperative awareness message (CAM), and signal phase and timing
(SPaT) are used to ensure situational awareness, safety, and traffic efficiency [97]. Besides,
DSRC has been identified by the U.S. DOT, and other researchers as the only technology
currently available that meets the safety, latency, reliability, interoperability, security,
privacy, message prioritization, and accuracy requirements of ITS [15] [102] [20] [21].
Safety is critical with VANETs, hence the need to verify the accuracy,
correctness/truthfulness of V2V and V2I communication/messages together with
authentication and authorization; in other words, because of the safety-critical nature of
ITS, false-data injection (message insertion, deletion/modification) attacks in VANETs can
be fatal.

54
VANET applications and other value-added services such as infotainment – which require
storage and processing – are potential targets for security, privacy, and safety
compromising related attacks [31]. For example, replay attacks occupy bandwidth
preventing real-time digital signature verification especially for safety-critical messages.
These critical messages get eventually dropped from the queue because the bandwidth is
saturated [29]. Message falsification/alteration involves modifying a message/information
passing through a node that is intended for a receiver via single, or multi-hop
communication thereby negating the integrity property. This attack can be mitigated if the
same message passes through other non-compromised nodes in order to verify the validity
of the information. It is normally carried out by an inside node and it can be malicious or
rational; it is also active in nature [97]. Message deletion, modification,
forgery/counterfeit, and replay attacks can be mitigated by real-time digital signature
signing and verification [29]. Using PKI’s in VANETs as a security mechanism involves
the use of certificate authorities (CAs) – responsible for granting/issuing credentials
(containing both private and public key pair) and revoking certificates (using the
certification revocation list) [31] [103]. In other words, a secure ITS V2V, and V2I (V2X)
communication/network must ensure: device(s) authentication and validation, message
integrity, and message confidentiality [73].
4.1 Security and Privacy
Without some form of adaptation(s)/modification(s), not all generic IT security
models/requirements/goals and countermeasures can be directly transposed to
practical/realistic ITS applications/usages in the real world [29]. Authentication/non-

55
repudiation and the desire to remain anonymous (anonymity) are the major security
requirements in ITS [29]. The desire to remain anonymous - privacy (which can be
enforced/satisfied by using pseudonyms) and still maintain user authentication/non-
repudiation are two diametrically opposite/antithetical requirements requiring a kind of
tradeoff in order to balance their uneven/inverse relationship [29]. Several works in ITS
security have focused on the metrics of message authenticity and integrity/non-repudiation.
These can be ensured using public key infrastructure (PKI) and certificate authorities
(CA's) who validate that every connected node/vehicle is actually who they say/claim they
are [29].
Identity and location privacy can be preserved by the use of anonymous public keys [104]
[105]. In other words, anonymous key pairs are used to prevent vehicle/vehicle driver
identity tracking [104]. Also, in order to enhance anonymity in VANETs, all vehicle IP,
and MAC addresses must change with time [104]. As a privacy preserving approach, Raya
et al. [106] proposed the use of dynamic/frequently changing, anonymous, and preloaded
keys that vacillate/change according to a vehicles travel speed. These preloaded keys are
housed by the vehicles tamper-proof device (TPD) and are renewed/changed regularly –
after a year or a specific duration. Authorized personnel – after a judicial approval from a
judge – can, however, circumvent a vehicle drivers anonymity by reconstructing key
information using the uniquely identifiable electronic license plate (ELP) in order to
establish/prove liability i.e. the system only provides conditional/resolvable anonymity
[106] [107] [105] [108] [109].

56
Although the use of pseudonyms enhances privacy, a complementary privacy preserving
measure is to only reveal/give enough information to other nodes as absolutely necessary
to prevent tracking, inference/identity linking [107] [105].
4.2 Agez Security Simulator
The reliability of ITS/VANET communication applications and services research are still
at their early/nascent/infant stages and are predominantly theoretical in nature [110].
Because of the limited/inadequate communication security simulation research in the
VANET domain, most message integrity and origin/sender authentication mechanisms are
not realistic – they are too optimistic [110]. Most research focus on traffic efficiency and
safety, but not security; most security research in VANETs are theoretical in nature i.e.
they are mainly in the form of survey/review papers with very few/limited
empirical/experimental, and realistic studies [110]. Consequently, Lobach and Radusch
[110] presented a comprehensive security simulator named Agez towards network and
application security evaluations in VANETs using the V2X simulation runtime
environment (VSimRTI) [110]. In other words, because of the gap in research respecting
security simulations, the authors evaluated the impact of inculcating communication
security metrics in relation to vehicle-to-vehicle (V2V), and vehicle-to-infrastructure (V2I)
communication security [110] – Agez was used as a means of adding security
metrics/measures to messages before disseminating them to connected vehicles [110]. The
Agez security simulator possess features such as: strong cryptography in message
encryption and decryption as it is based on the Trusted Communication Test-bed (TCT),
message signing and verification, and variations in short-term identifiers of vehicles – used

57
to preserve drivers privacy [110] [111] [112]. The simulation setup consists of Agez
coupled with VSimRTI together with other simulators. The simulation results show that
signing and verifying every message is very expensive respecting simulation processing
time [110]. Specifically, message verification increased the simulation time by a factor of
34 times without any form of optimization. After several optimizations were done in Agez,
however, the number of security operations were reduced resulting in only a 9% increase
in processing time [110]. Besides, by applying Verify on Demand (VOD), the processing
time of messages was significantly reduced while plausibility checks were used to
supplement for missing checks. Although VOD significantly impacts communication
security by not verifying each and every single message, plausibility checks on only
received message adequately compensated for the deficits. The authors also reiterated the
importance of having security at different layers of the communication stack especially the
network, and application layers [110].
Raya and Hubaux [93] identified three major areas/classifications of security
threats/attacks in VANETs namely: safety application, payment-based application, and
attacks on privacy [93]. With respect to VANET safety applications, because of the safety-
critical nature of VANETs, they are normally accompanied by high levels of liability [93].
With respect to privacy, because of V2V and V2I (V2X) communication, it is easier to
track vehicles and/or their drivers [93].
Using the V2X simulation runtime infrastructure (VSimRTI), Bißmeyer et al. [98]
executed both single, and multi-lane roadway attacks in order to ascertain its effect on
traffic efficiency while measuring the drivers behavior [98]. The results show that traffic

58
efficiency was negatively affected in all the three evaluated attack scenarios: single-lane,
multi-lane, and Sybil attacks evidenced by both temporal, and permanent reductions in
travel speed [98]. The choice of a single-lane, urban roadway (over other types of roadways
such as a multi-lane highway) by an attacker can be used in order to inflict the most
detriment to traffic efficiency and other performance metrics [98].
Raya et al. [106] identified some security threats/vulnerabilities to the adoption of
vehicular communications (VC) [106]. They also proposed a security
framework/architecture that maintains authentication, authorization, and accounting
(AAA) via hardware security of onboard units (OBU) which consists of the event data
recorder (EDR): serves as the black box – synonymous to an airplane – that keeps a log
(time, location/position, speed, direction, etc.) of all vehicle activities; and tamper-proof
device (TPD): ensures that the integrity of uniquely identifiable cryptographic keys are
maintained by securing them. All these must work together in order to accurately attribute
liability to the offending/liable party/parties – in the case of an accident/any other
emergency [106] [105]. This security architecture is also resilient against attacks – ensures
continuous operations (availability) while under attack [106].
Although the use of PKI for VANETs offers some advantages, a prominent drawback is
seen respecting certificate revocation of compromised/malfunctioning nodes whose keys
should be ignored and invalidated by receiving nodes [106]. Although the distribution of
the most recently revoked certificates is the most common certificate revocation method,
the use of certificate revocation lists (CRLs) alone suffers from the following challenges:
1) The efficient, and effective use of CRLs is contingent on the ubiquity of infrastructure

59
– which is impractical especially at the early stages of ITS deployment owing to high costs
[106]. (2) Keys can be automatically revoked using short-lived certificates, but the
gap/window between when these keys are identified as candidates for revocation to when
they are actually done introduces a vulnerability window [106]. (3) CRLs are quite long
because of the transient and high mobility nature of interacting vehicles/nodes in ITS
resulting in the accumulation of data while in transit [106] [107] [105]. In order to
ameliorate these and other drawbacks of the use of CRLs in ITS, Raya et al. [106] proposed
a number of revocation protocols namely: Distributed Revocation Protocol (DRP),
Revocation Protocol of the Tamper-Proof Device (RTPD), and Revocation protocol using
Compressed Certificate Revocation Lists (RCCRL) [106].
Some attacker models already envisioned in the VANET domain consists of four categories
namely: Insider vs. Outsider, Malicious vs. Rational, Active vs. Passive, and Local vs.
Extended [104]. Consequently, from the above attacker model, attackers in the VANET
ecosystem can be identified/characterized respecting there: Membership
(Outsider/Insider), Motivation (Malicious/Rational), Method (Passive/Active), and Scope
(Local/Extended). The above characterization gives rise to the syntax:
Membership.Motivation.Method.Scope [104] [113].
The use of digital signatures for message authentication against all other existing
authentication mechanisms/methods has been identified by Raya and Hubaux as the
simplest and most efficient [104]. The use of public key cryptography in wireless
communication networks such as VANETs has, however, been identified to introduce
some level of overhead that adversely degrades/reduces overall performance because each

60
message consists of the digital signature of the sender and the certificate of the certificate
authority (CA). In order to improve this situation, Elliptic Curve Cryptography (ECC)
came to the rescue with a smaller signature size, and a better/faster execution time – mainly
seen respecting its efficient signature verification time [104]. According to the authors,
although the use of digital signatures with attached certificates as a means of ensuring
security creates some level of overhead, the overhead thus created still does not
diminish/invalidate its superiority over other alternative symmetric authentication
approaches/mechanisms such as the use of group keys, and pairwise keys [104].
Comparing the authentication mechanisms evaluated by the authors, the use of pairwise
keys resulted in greater message overhead over the use of ECC [104]. About 54% message
overhead is saved by using group keys over pairwise keys [104]. In summary, despite the
perceived high overhead of using digital signatures for authentication in VANETs, they
outperformed the symmetric pairwise, and group keys method evaluated by the authors
[104].
One criticism of this study is that the authors indicated that because they primarily did an
analytical study instead of an empirical one, the conclusions they draw may be thus biased.
This is true because representative conclusions can only be drawn based on an
empirical/experimental evaluation that is repeatable, robust, and reliable [104].
Fuentes et al.[107] identified and examined several current, generic, and peculiar – e.g.
data trust – security and privacy issues/challenges facing VANETs; they also analyzed
some security models and requirements, security attacks, and their countermeasures
necessary to ensure the satisfaction of the confidentiality, integrity/non-repudiation, data

61
trust, and availability security goals of VANETs/ITS. Besides, they asserted that more
research work is needed especially in the nascent, and emerging field/area of VANET
security [107]. Specifically, confidentiality, integrity/non-repudiation, availability, data
trust, identification, and authentication (both entity, an attribute), etc. are some of the
VANET security requirements identified by the authors [107]. They also classified
VANET attacks as: attacks on identification and authentication manifesting as Sybil, and
impersonation attacks; attacks on non-repudiation; attacks on confidentiality; attacks on
availability; attacks on privacy; and attacks on data trust [107] [109].
Isaac et al. [105] examined some of the security threats, and security attacks militating
against the widespread deployment of VANETs and their corresponding countermeasures
[105]. Specifically, the security challenges/issues of: key management, secure location,
reputation preservation, and privacy/anonymity were the focus of the authors
survey/evaluation [105]. They also evaluated the following list of security attacks
respecting VANETs and provided some current/existing countermeasures for them:
malicious vehicle, brute force, traffic analysis, illusion, Sybil and position
falsification/cheating, and node misbehavior attacks [105].
Inefficiency, and inadequate scalability are some of the major drawbacks militating against
the adoption of symmetric authentication in VANETs [108]. Because the VANET
technology domain is still evolving, many open challenges/questions have not been
adequately addressed [108]. Consequently, Caballero-Gil et al. [108] provided insight into
some VANET services, characteristics, security/privacy challenges, and countermeasures
in order to mitigate them [108]. The authors proposed group formation, and management

62
as a security measure towards minimizing communication overheads in VANETs while
improving privacy, integrity, and authenticity [108] [114].
According to Hussain and Oh [109], a VANET-based cloud must satisfy the following
requirements and thus were evaluated by the authors: confidentiality, integrity,
authentication, timeliness, privacy, conditional anonymity, and non-frameability [109].
The authors assert that, to the best of their knowledge, their work pioneered the transfer of
traffic information, and warning message dissemination from the traditional VANET to the
cloud [109]. Consequently, they focused on cooperative driving amongst vehicles hence
the name Cooperation as a Service (CaaS). CaaS consist of three different types of services
namely: Infotainment as a Service (IfaaS), Traffic Information as a Service (TIaaS), and
Warning as a Service (WaaS) [109]. Specifically, in this paper, the authors focused their
work on TIaaS, and WaaS and will consider IfaaS in a later work [109].
4.3 Mitigating Availability Attacks
Attacks on availability manifests in the form of: Denial of Service attack (DoS): Here, high
frequency signals can be used to jam the communication channel in order to overwhelm it
or deplete other network resources [115] [116] [117] [118] [119]. Distributed Denial of
Service attack (DDoS): This is a severe/escalated/exacerbated case of a DoS attack that
decentralizes the attacks to spring up from multiple locations – often at different time
slots/intervals – in order to cause more devastations resulting in complete network paralysis
[115] [119]. Broadcast tampering attack: Broadcast safety messages for example can be
falsified in order to create a false sense/illusion of an accident when there is none [115].
Malware attack: Here, an attacker can maliciously infect a node or entity with worms,

63
viruses, and spywares with the intent of causing malfunctions that can even lead to loss of
lives [115]. Spamming attack: Attackers can disseminate unsolicited spam messages –
often just advertisements – through the network with a view of saturating available useful
bandwidth thereby increasing the latency of legitimate messages across the network until
the network eventually becomes unavailable [115]. Blackhole attack: This attack can be
perpetrated by either completely refusing to serve as a router for neighboring nodes, or
after commencing to do so, a node/entity drops out from the communication thereby
starving/precluding the transmission of messages from one part of the network –
originator/source to the other – destination [115]. Sybil attacks: A Sybil attack has the effect
of consuming precious and unused bandwidth thereby compromising the availability
security requirement/goal [105].
Attacks against availability – jamming attack for example – can be mitigated by
periodically switching/varying the communication channel, and/or the communication
technology used [104]. In order to ensure continuous operation while all or part of the
system/network is under attack – DoS resilience – frequency hopping techniques are
inadequate and have their own limitations. Consequently, Raya et al. [106] proposed the
use of many transceivers at varying frequency bands as a feasible complement [106].
Besides, as an additional mitigation approach, both communication channel switching,
and/or communication technology switching can be used. For example, if DSRC is down,
other supporting technologies such as Bluetooth – for very short range communications,
and other wireless/cellular communication technologies can be activated to counterbalance
this. When no fallback mechanism is available/possible, the driver must be notified in a

64
timely manner such that he may not rely on VANET safety, and traffic efficiency
applications that are nonexistent [104].
According to Sumra et al. [115], attacks (e.g. DoS attacks) that severely impact the network
functions – availability attacks – are more consequential/have more priority over other
attacks on the remaining security goals of integrity, and confidentiality [115]. They further
elaborate that attacks on integrity precedes/supersedes confidentiality attacks because
whereas confidentiality attacks are mostly passive in nature e.g. network
eavesdropping/monitoring, integrity attacks such as message (safety/non-safety)
alterations/modifications have higher priority since they can be safety/life-critical in nature.
They argue that availability, as a security goal, is more consequential compared to integrity,
or confidentiality because even when all users/nodes are properly authenticated with all
other security mechanisms and countermeasures employed/implemented, they still cannot
communicate because the network is unavailable/down. Consequently, availability, as a
security requirement/goal, is most important because without it, having the others –
integrity, and confidentiality – will be futile [115]. As a result, in increasing order of
priority, the following threat levels were given/accorded to each security goal thus:
confidentiality (threat level 1 – least important), integrity (threat level 2 – moderately
important), and availability (threat level 3 – most important/consequential). In other words,
availability attacks/compromises have more consequences of failure than integrity, or
confidentiality attacks [115].
On the one hand, I agree with the authors’ judgment on the preeminence of availability as
a security goal over integrity, and confidentiality because the latter’s are based/contingent

65
on the preexistence of a stable/available network. However, on the other hand, one can also
argue in favor of integrity, or confidentiality as being superior because, if what is
sent/transmitted is not the same as what is received, and/or sensitive information can be
disclosed to unauthorized parties, solely having an always available network is
insufficient/inadequate and will not engender the widespread adoption of the VANET
technology.
Network availability, and the desire to route traffic through the shortest-path has been the
focus of many previous algorithms, but not Quality of Service (QoS) [56]. The primary
path to the destination is the least cost path; all other paths are secondary paths which are
only utilized when the primary path is out of service/unavailable/fails [56]. Consequently,
because of transmission range limitations, non-adjacent nodes employ multi-hop
communications to send messages/talk to target/destination nodes [56].
In a shared link/communication medium, CPU time, bandwidth, buffer space, main
memory, disk space, etc. are constantly under contention because resources (non-
reservable) that are scarce have to be contended with [58]. Consequently, Quality of
Service (QoS) routing in a dynamic ad hoc network is difficult and unpredictable because
of changes in network topology and inaccurate network state information i.e. the state of
the network and its nodes are not definitely known because of constantly joining, exiting,
and moving/changing nodes from one location to another [56]. In other words, the more
the nodes are constantly moving, the more the degradation in QoS – as QoS depends on
some nodes remaining stationary/unchanged/immovable [56]. As a result,
flooding/broadcasting occupies limited bandwidth/resource and this is a major drawback

66
of using it for vehicle-to-vehicle (V2V)/inter-vehicle/distributed communication (IVC)
[36] [6] [50].
As aforesaid, QoS overhead is higher in ad hoc networks than in the wired counterpart or
other best-effort routing algorithms because of the dynamic and unpredictable data
transmission paths [56]. Consequently, as a mitigation against availability attacks, the
ticket-based probing algorithm (TBP) provides for dynamic path maintenance, self-
healing/reconfiguration together with other fault-tolerant features that provide for
path/network redundancy, and repairs – coupled with the fact that the topology, and
routes/nodes of ad hoc networks are in a constant state of flux [56] [50].
Path redundancy is an attempt to mitigate or ameliorate the negative effects of dynamic
changes in topology while path repair tends to resuscitate/re-establish broken paths [56].
In other words, on the one hand, a multipath redundancy approach is used to ameliorate
the loss/decrease in QoS as a result of broken/failed routes/paths. On the other hand, path
repairing tries to fix broken paths at the exact point of failure – path reconfiguration – by
rerouting traffic through the nearest available neighboring node that satisfies the cost,
delay, and bandwidth requirements of the connection without having to completely reroute
traffic through a completely different/new path [56] [51].
As aforesaid, just as in the healthcare system/domain – and other safety/life-critical
systems – the ITS domain must have little or no tolerance for risks/failures. Consequently,
in order to ensure the ability to commercialize this technology, real life tests must be
carried out in both managed/simulated, and unmanaged environments/scenarios [120].

67
This is especially true because, left on its own, simulation is incomprehensive, and
insufficient in determining faults as some faults can only be determined when actual road
tests are conducted [80, 121]. However, simulation is an important first step because not
every possible scenario can be covered within the boundaries of limited scope, time, and
budget [122]. Interoperability between and among various ITS vendors/suppliers
including legacy systems, however, is a major challenge. This is true because current
automotive software development is limited and not standardized because most
components are integrated from multiple vendors [123]. Also, the proactive determination
– rather than reactive – of ITS failure points and mitigation techniques is a major challenge
– besides the need for more energy efficient/low power, wireless, secure, and highly
available sensors [122].
As a further elaboration, and in summary, it is important to reiterate that vehicles equipped
with various types of connectivity for infotainment, safety, traffic efficiency/mobility, and
security applications/equipment, etc. expose themselves to more possibilities for attacks as
a result of their wireless connectivity [29] [93]. In addition, because of the unique features
of VANETs such as high node mobility, short connection times, etc.
conventional/traditional security mechanisms are somewhat inadequate/impotent in
dealing with all the possible gamut of threats that exist in the ITS/VANET ecosystem [30].
As aforesaid, security can be compromised between V2V, V2I (e.g. RSUs, servers, etc.),
or V2X communication pathways/mediums [29]. For example, V2V/V2X communication
message exchanges can be deleted, modified, forged/counterfeited, or replayed (after
message recording) when attacked/compromised by an adversary [29]. In ITS, however,

68
safety trumps security (i.e. confidentiality, integrity, and availability [CIA]); hence all
security countermeasures/mitigation techniques must be developed and evaluated in light
of this [29]. Besides, because of the safety/life-critical nature of VANETs, security
compromises are usually unacceptable and could result in fatalities. Consequently, little or
no tolerance for errors is strictly mandated in the VANET ecosystem.
It is pertinent to note that owing to the relatively new and constantly evolving field/domain
of ITS/VANETs, most of the existing research efforts are predominantly theoretical in
nature. Consequently, more empirical, and realistic privacy/security research are needed –
this is one major gap we attempt to fill in this dissertation research.
Research Tasks
This section presents a more detailed exposition of our research tasks respecting
adaptive/dynamic routing, safety, traffic efficiency, forecasting, human factors, and
security challenges in intelligent transportation system (ITS)/vehicular ad hoc networks
(VANETs).

69
Chapter 3
Routing in Intelligent Transportation System (ITS)
1. Overview
Intelligent transportation system (ITS) applications are expected to provide a more
efficient, effective, reliable, and safe driving experience, which can minimize road traffic
congestion resulting in a better traffic flow management. To efficiently manage traffic
flows, in this chapter, we compare the effectiveness of two well-known vehicle routing
algorithms: the Dijkstra's shortest path algorithm and the A* (Astar) algorithm in terms of
the total travel time and the travel distance. To this end, we built a generic ITS test-bed and
created several real-world driving scenarios using field and simulation data to evaluate the
performance of these two routing algorithms. The dataset used in our simulation consist of
six weeks traffic volume data from 08/01/2012 to 09/12/2012 in the Maryland
(MD)/Washington DC and Virginia (VA) area. Our simulation data shows that an increase
in network size results in scalability problems as the efficiency and effectiveness of these
algorithms diminishes in larger road networks with greater traffic volume densities, flow
rates, and congested conditions. In addition, the imprecision of the road network increases
as the network size and the traffic volume density increases. Our study shows that the
ability of these vehicular routing algorithms to adaptively route traffic depends on the size
and type of road networks, and the current roadway conditions.

70
2. Motivation
As aforesaid, in the U.S., about $78.2 billion is annually wasted as a result of road traffic
congestion [8, 27, 28, 124]. Lost productivity, resources, time, gas, etc., are some examples
of the many undesirable consequences of road traffic congestion. To address these issues,
there is an urgent need to dynamically route traffic to less congested roadways [8]. By
taking the best or the most optimal/fastest route from source to destination – that can be
either distance-based or time-based – road conditions including road constructions,
presence of tolls, and others, all contribute to the decision making process, leading to the
shortest-path problem in terms of travel experiences [34].
Intelligent transportation system (ITS) applications can provide a more efficient, effective,
reliable, and safe driving experience, which can minimize congestion with a better
management of traffic flow [4, 6, 10, 35-38]. Nonetheless, to achieve this, all ITS
applications such as vehicle-to-vehicle (V2V)/inter-vehicle communications (IVC),
vehicle-to-infrastructure (V2I) communications – V2X communications – situational
awareness, dynamic traffic control signals, and hard-breaking signals for collision or crash
avoidance, etc. must work synergistically or cooperatively [7, 39]. For example, using
IntelliDrive applications, drivers can receive notifications on the probability of other
vehicle drivers running a red light, the presence of unforeseen road conditions, including
sharp and/or dangerous road bends, etc. [14, 15]. Adaptive cruise control (ACC), advanced
driver-assistance systems (ADASs), variable speed limits (VSLs)/variable speed signs
(VSSs), ramp metering, and dynamic cruise control (DCC), etc., are the existing
mechanisms used to ensure safety, efficiency, and effective utilization of vehicle gas, as

71
the main goals of ITS [7, 9, 28, 35, 37, 38, 40-42] [20]. Static traffic controls (foreseen and
predictable) and dynamic traffic controls (unforeseen and unpredictable) are congestion
control mechanisms currently in use [42]. By constantly monitoring variations in traffic
parameters such as densities, speeds, and queues, VSLs and ramp metering can be
adaptively controlled in real-time to minimize congestions. It is worth noting that VSLs
are primarily used to ameliorate congestions because it is not feasible to keep constructing
new roadways to meet the ever-growing traffic volume densities. The reason is that
resources are finite and less expensive alternatives need to be developed/employed [9, 41,
42].
The need to dynamically route traffic from one location to another in order to minimize
congestion resulting in better traffic flow management has been expressed and buttressed
by a number of existing research efforts [4-10]. Nonetheless, most existing studies simulate
driving scenarios, which are too simplistic and do not reflect actual, complex and
heterogeneous real-world driving conditions [1, 2, 7, 11-14]. A distinguishing
characteristic of our research effort is that, unlike other studies that are void of real-world
data and road networks in their simulation, our study uses the actual real-life traffic volume
data and road network topologies in our simulation studies and field analysis. Evidently,
this makes our work more representative and conclusions we draw more accurate to reflect
real-world practice.
With respect to the foregoing problems, this research has as its primary objective of
conducting an investigation and implementation of efficient and effective solutions, which
ameliorate the congestion problems of ITS, using adaptive routing, leading to an efficient

72
traffic flow management. Specifically, two vehicular traffic routing algorithms namely, the
Dijkstra, and the A* algorithms, are evaluated based on their effects on total travel time
(TT) and total travel distance (TD) using both real-world and simulation data. Using the
following scenarios, the efficiency, and effectiveness of both algorithms are determined by
measuring their effect on the following scenarios:
Scenario 1: Increasing the traffic volumes by up to five times (5X) more than the
normal traffic rate.
Scenario 2: Blocking a given roadway by simulating an accident that triggers
rerouting.
Scenario 3: Dynamically reducing the variable speed signs (VSS) at different time
intervals by up to five times less.
Scenario 4: Combination of the above three scenarios.
Our results show that the efficiency and effectiveness of both algorithms are determined
by the size of the road network used and the amount of traffic on the evaluated routes. In
theory, the A* algorithm is better suited for use in larger road networks as the Dijkstra’s
algorithms performance, i.e. in terms of its efficiency and effectiveness, degrades because
it suffers from scalability issues. Nonetheless, our evaluation results show that no
significant difference was observed using both algorithms in both small and large road
networks. One possible reason for this is that the real-world traffic volume data, used as
input to the traffic simulator, needs to be further increased and more scenarios needs to be
included in order to observe significant differences. In addition, some differences may be

73
observed by further increasing the size of the road networks that was used in the
performance evaluation.
The rest of this chapter is organized as follows: in Section 3, we examine some of the latest
related works in the research field. In Section 4, we introduce the vehicular routing
algorithms in detail. In Section 5, we present our research methods used to achieve our
research objectives and describe the structure of our real-world data, table relationships,
and experimental setup. In Section 6, we present the results of our simulation experiments.
Finally, in Section 7, we draw conclusions based on the results of our study.
3. Need for Adaptive Routing
In this section, we briefly review the latest research efforts that have examined the need for
adaptive routing to minimize congestion, resulting in a better traffic flow management, the
advantages and disadvantages of some of the existing routing algorithms, and existing
performance metrics used to evaluate them.
The need for more realistic traffic simulation has been buttressed by several research efforts
as necessary [1, 2, 7, 11-14]. For example, Leontiadis et al. asserted that their work was
the first to evaluate the performance of distributed vehicular communication using a real-
world city map as the topology, vehicle mobility simulators, and network simulators [8].
Yung-Cheng and Nen-Fu will try to incorporate real-world road networks in their future
study in order to make their results more germane [12].
The performance of routing algorithms, including regression and Kalman filters [59],
online traffic prediction algorithm [4, 60], model predictive control (MPC) algorithm [41],

74
binary-partition-assisted broadcast (BPAB) [2], flooding algorithm, ticket-based probing
algorithm (TBP), and shortest-path algorithm [56], Travel Run Intersection Passing Time
Identification (TRIPTI), Ticket-based routing algorithms [5], adaptive fine-tuning
algorithm (AFT) [61], online nearest neighbor clustering (NNC) algorithm [13], etc. have
been evaluated with respect to the scalability (suitability to small or large road networks),
the accuracy of traffic pattern and volume prediction (as prediction window or interval
increases), the efficiency of travel time, and others [11, 34, 56]. For example, Shigang and
Nahrstedt compared the performance of three dynamic ad hoc-based routing algorithms
namely the shortest path, flooding, and Ticket Based Probing (TBP) with respect to the
metrics: success ratio, message overhead, and average path cost [56].
The existing investigated performance metrics that have been used in adaptive traffic
control, include number of stops, length of queue, delays at intersections, (average) speed,
and travel times/delays [5, 61]. Some metrics used to compare the performance of these
VANET routing algorithms include, but are not limited to time overhead, computation or
processing complexity, network state imprecision, delay (link, propagation, processing,
jitter, delays, and others), bandwidth, cost (the number of hops), scalability or extensibility
as the network size and complexity grows, latency, and others [1, 5, 48]. An inverse
relationship exists between latency and network congestion, i.e. increase in congestion will
reduce the amount of relayed messages, leading to increasing latency [1]. The higher the
flow rates, the greater the probability for road traffic congestion [11]. Several studies have
evaluated one or more of the following performance metrics in a test or simulation
environment, and/or field-test, including speed/velocity, acceleration, (average) travel/trip

75
time, accuracy, efficiency, distance, deceleration, traffic/vehicle density, cost, emission
levels/environmental impacts, fuel consumption, Quality of Service (QoS) (e.g. end-to-end
delay, bandwidth, delay cost, bandwidth, traffic flow rate, and others) [1, 5, 6, 8, 9, 11, 28,
34, 36, 37, 39, 41, 48, 50, 51, 53, 56, 62]. For example, Khabbaz et al. [53] evaluated the
performance of their traffic models based on the average queuing delay, the average transit
delay, and the average end-to-end delay against vehicle density. They defined the average
end-to-end delay as the sum of the average queuing delay and the average transit delay
[53]. Vehicular density is defined as the number of vehicles per a given length of roadway
[12] or vehicles per meter (vehicles/meter) [38, 53, 63]. Three perceived QoS performance
metrics evaluated by Yung-Cheng and Nen-Fu [12] include the knowledge acquisition rate
(KAR), the effective propagation rate (EPR), and the safety-distance information rate
(SDIR). Vehicle speed, traffic density, and propagation protocols are additionally
perceived QoS (PQoS) metrics that are evaluated [12]. In addition, Caceres et al. [64]
defined the vehicle intensity factor as the ratio of the average vehicle counts per hour over
the average counts per the total measurement period.
From the above related literature survey the majority of authors agree that there is a need
for realistic field, and simulation studies, which can evaluate the efficiency and
effectiveness of vehicular routing algorithms; this is what we seek to answer in this
chapter/section.
4. Background
In this section, we review the Dijkstra, and A* vehicular routing algorithms which are
widely used in the traffic management.

76
4.4 Dijkstra Algorithm
Generally speaking, the Dijkstra algorithm is used for a single-source shortest-path
problem computation, given vertices/nodes (V) and non-negative edges/roadways/streets
(E) in a directed graph (G), i.e. G = (V, E) [125, 126].
Assumptions
1. Edge weights: w(a,b) ≥ 0; // applies only to non-negative edge weights [w]
2. (a,b) Є E;
3. a, and b are sets of adjacent vertices with edge weights or costs [w];
4. With a Є SV (where SV is a set of known vertices set) [125].
DIJKSTRA (G, w, sa)
INITIALIZE SINGLE-SOURCE (G, sa)
1. SV = 0
2. Qp = V[G]
3. while Qp ≠ 0
4. do a = SELECT-MIN (QP)
5. SV = SV U {a}
6. for each vertex a Є Adjacent [b]
7. do RELAX (a,b,w) [126].

77
The pseudo code above selects a vertex with the minimum edge or road weight (w) or
distance (d) from a given source (sa) to a given destination (da) and adds it to the set of
vertices (Sv) stored in a priority queue (Qp). This process continues until all the intermediate
edges (i.e. roadways or street) from source to destination are exhausted. Dijkstra’s
algorithm uses the greedy strategy because only the most adjacent edges are chosen to be
stored in the priority queue (Qp) containing a set (SV) of non-negative edges. With
Dijkstra’s algorithm, the shortest-path from a given source to a given destination is
independent of the level of congestion or roadway conditions, i.e., it is solely based on the
shortest distance between two points. The running time complexity of Dijkstra’s algorithm
worsens as the size of the network increases – this is where the A* algorithm becomes
pertinent [8, 34, 50, 124-127].
4.5 A* (Astar) Algorithm
The A* algorithm is a hybrid of heuristics-based algorithms such as best-first-search and
algorithms such as Dijkstra. It is mostly popular for route finding because of its flexibility
and its applicability to a wide variety of scenarios. A unique feature peculiar to A*, not
used by other similar greedy best-first-search algorithms like Dijkstra, is that previously
traveled distances from the source are taken into account in future route selections. By
choosing vertices that are closest to the starting point (used by Dijkstra’s algorithm) and
vertices that are closest to the goal (used by best-first-search), the A* algorithm’s
performance is significantly enhanced. Using a sorted priority queue, the least-cost route
from source to destination is determined using best-first-search, which considers the least
amount of nodes [124, 128-130].

78
We now explain the basic principle of A*. Let g(a) = cost from source to sink of vertex a,
and h(a) = estimated distance or cost of the vertex a to the destination. Going through
different iterations, the choice of a path, f(a), depends on that with the lowest: f(a) = g(a)
+ h(a) [129, 130]. The value of the heuristic h(a) determines how accurate and how fast
the A* algorithm determines the best path from source to sink/destination [124, 129, 131].
5. Main Contributions: A Generic ITS Test-Bed
In this section, we first describe our evaluation setup used in our evaluation of the two
vehicular routing algorithms introduced in Section 4 and then present the real-world
dataset, followed by the evaluation scenarios, and performance metrics.
5.1 Test-bed Setup
In order to achieve an efficient traffic flow management that will ameliorate the congestion
problems of ITS, we built a generic ITS test-bed to evaluate the performance of different
routing algorithms. In this chapter, the two well-known routing algorithms: Dijkstra
algorithm and A* (Astar) algorithm, which were introduced in Section 4, were used to
carry out the performance evaluation. We used a DELL PRECISION T5600 desktop
configured with Intel® Xeon(R) CPU E5-2609 @ 2.40GHz, 64GB of memory, and 2TB
hard disk drive (HDD), running Windows 7, 64 bits to implement the ITS test-bed. We
used software such as MATLAB R2013a, Weka 3.6.9, and Microsoft’s Excel 2013 to assist
with data processing.

79
Data processing comprises the following steps: data collection, cleaning and preprocessing,
selection and categorization, analysis, visualization, and interpretation as shown in Figure
18.
Step 1 -- Data Collection: In total, over 15GB of 6 months traffic data from July
2012 to December 2012 of the Maryland (MD)/Washington DC and Virginia (VA) area
was used in this study.
Step 2 -- Data Cleaning and Preprocessing: Here, missing or erroneous fields or
records, together with other outliers, were identified and were not used in our final selection
criteria.
Step 3 -- Data Selection and Categorization: Out of the total dataset or population,
a representative sample of 6 weeks traffic data from 08/01/2012 to 09/12/2012, was chosen
with the covered area shown in Figure 20.
Step 4 -- Data Analysis: The average speeds, traffic volume patterns, and other
measures of central tendency or deviations were used to better understand the data
distribution.
Step 5 -- Data Visualization and Interpretation: Finally, we identified the
interesting patterns such as congestion prone areas and times when congestions are most
prevalent, etc. using Microsoft’s Excel 2013 and MATLAB R2013a.

80
Data Cleaning & Processing
Start
End
Increase Data?
Data Selection & Categorization
Data Analysis
Real-world Data
Visualization & Interpretation
Yes
No
Figure 18: Data processing steps.

81
We implemented and evaluated the traffic simulation scenarios using the Simulation for
Urban Mobility (SUMO) traffic simulator [132]. Before inputting data into the SUMO
traffic simulator, we imported the network topology from openstreetmap.org, while
ensuring that the number of lanes, traffic lights, road junctions, etc. represents the actual
real-world driving conditions. Specifically, Osmfilter was used to remove unwanted
entities such as buildings, parks, and other non-traffic related entities or artifacts. This
greatly reduced the file size of the road network, thus ensuring that traffic simulation can
be more efficiently and effectively performed. We cleaned and preprocessed data using
Java openstreetmap editor (JOSM), and Merkaartor 0.17.2, which are two very popular
Openstreetmap editors used to identify and fix unconnected road segments, junctions and
other bugs in the road network. From these editors, our real-world road network in its
entirety consists of the following entities/artifacts: 238,207
vertices/nodes/junctions/intersections, 12,009 ways/streets, and 2,361 relations/group of
streets. As a general rule, most road networks are quite dirty as they are crowd-sourced
from multiple users that predispose them to inaccuracies because verification and
validation for accuracy and correctness are not strictly incentivized and mandated. Finally,
the SUMO netconvert.exe tool was used to remove unwanted edges (i.e. streets or
roadways) and routes were generated by the SUMO duarouter.exe tool.
Besides the prohibitive nature of the cost associated with real-world studies, it can be
more efficient (and possibly more effective) to first try out different ambiguous problems
in a simulation environment before proceeding to field validation [1-14, 41, 52-54].
SUMO is responsible for vehicle or node movements using accurate street maps of the

82
Maryland (MD)/Washington D.C and Virginia (VA) areas. The choice of one route
against another is determined by a number of factors such as roadway speeds, traffic
conditions, different environmental conditions, and the shortest distance or time to the
destination, etc. [6]. Figure 19 shows our entire data coverage area in Google Maps while
Figure 20 illustrates our selected study area in the Google map (left) and the
Openstreetmap (right).
Figure 19: Entire field data coverage area.

83
Figure 20: Selected study area in Google map (left) and Openstreetmap (right).
5.2 Real-world Dataset
Owing to the fact that most studies [1, 2, 7, 8, 11-14] simulate unrealistic or randomly
generated traffic data and road networks as input, in the entirety of this dissertation, we
used the real-world traffic dataset from the Maryland (MD), Washington D.C, and Virginia
(VA) areas as inputs, which consist of lanes data and traffic data. The sample lanes data
and traffic data are shown in Tables 1, and 2, respectively. From the lanes data, the
evaluation area shown in Figure 20 can be divided into different zones. The lane ID is
assigned to uniquely identify the number of lanes in a zone. The lane type consists of
normal, on/off ramp, express, bus, toll, and unknown types. Road-side detectors, which
consist of microware, acoustic, RTMS, and unknown, are deployed along the road and are
used to record the real-world traffic volume patterns plus other traffic-related parameters.
For example, the lane ID 8978 belongs to zone 3193, which is a one-lane road. The detector
for lane 8978 is deployed in I-95 at 0.71 mile north of I-695. For the traffic data, shown in
Table 2, the microwave detector records the traffic parameters for each lane every 1 minute.

84
The useful traffic information mainly includes the vehicle speed, vehicle/traffic volume,
and occupancy. For example, at time 00:00:48 on 09/01/2012, the average traffic travel
speed on lane 8978 is 58.8 km/hour; in addition, over the last minute, four vehicles passed
through the lane with ID 8978. The occupancy refers to the number of vehicles within a
given duration/estimation period through a given road/lane.
Similar to the research done by Caceres et al. [64], six weeks, weekday traffic volume
counts (Wednesday and Thursday) (excluding days prior to, and after a holiday/weekend)
was used in this study. In order to ensure consistent results, we also made sure that the days
chosen did not fall into a holiday. One hour traffic volume counts, between 5:00 a.m. and
9:00 a.m., were aggregated together and compared. One of our chosen roadways (I-270 @
MD 109), showed remarkably higher levels of congestion between these times (5:00 a.m.
– 9:00 a.m.); which are non-existent during the weekends [54, 64]. This is quite normal
because most traffic congestions are experienced during the morning (8:00 a.m. – 10:00
a.m.), and evening (4:00 p.m. – 7:00 p.m.) rush-hours [14, 53, 64]. Because of the distinct
Table 1: Sample lanes meta-data.
Table 2: Sample lanes traffic data.

85
difference between traffic volume on weekdays compared to that on weekends, they are
usually analyzed and treated differently [4, 5, 11, 45].
5.3 Evaluation Scenarios
The following scenarios were used in determining the efficiency and effectiveness of the
Dijkstra and A* algorithms as shown in Figure 20:
Scenario A: Increasing the normal traffic volume through a given route or roadway
by as much as five times (5X) more than its actual volume.
Scenario B: Rerouting traffic by simulating an accident which blocks a given travel
roadway or route, thereby triggering adaptive rerouting to the same destination through
other roadways.
Scenario C: Dynamically reducing the variable speed signs (VSS) by five times
less than the actual speed limit and measuring the effects of possible congestions on travel
time.
Scenario D: Combining scenarios A – C.
Scenario A: Scalability
Scenario A: Road traffic congestions are normally experienced between 5:00 a.m. and 9:00
a.m. weekdays through Routes A (i.e. vehicles traveling from point 1 [source] to point 2
[destination]) and B (i.e. vehicles traveling in the opposite direction) having a normal
maximum traffic volume of 144 vehicles every 5 minutes as shown in Figure 22 (left). Five
times this number (720 vehicles) was used as an input to the SUMO traffic simulator in
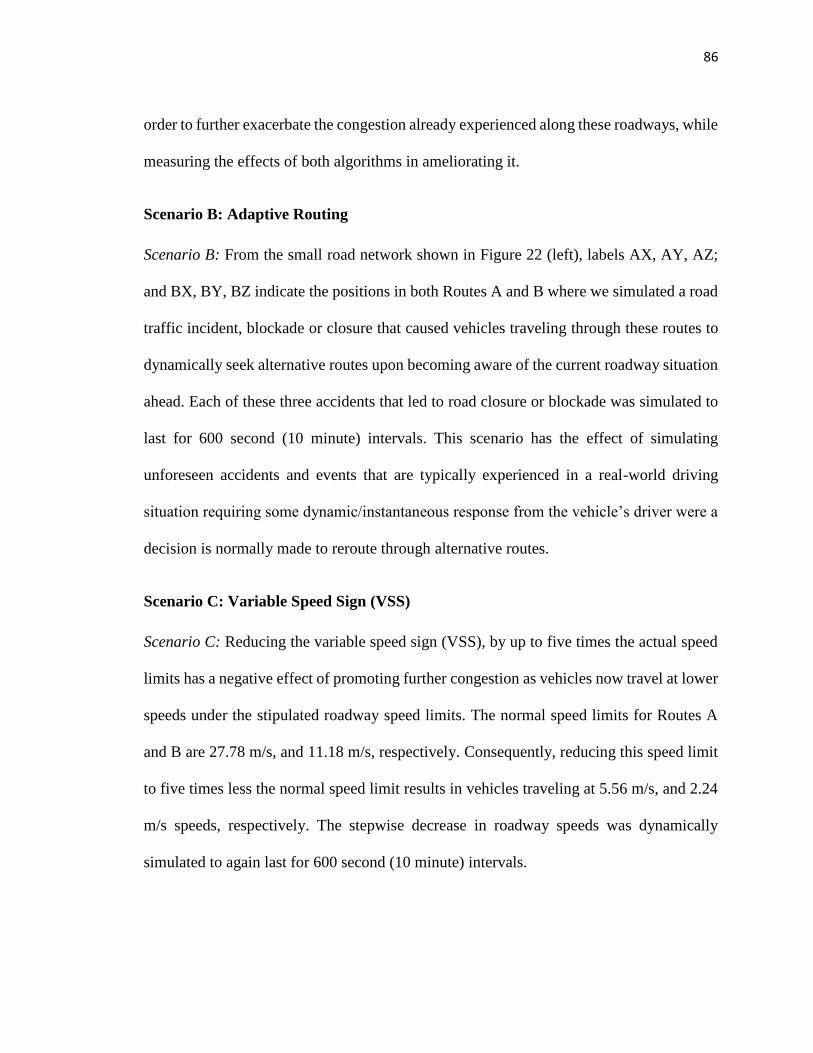
86
order to further exacerbate the congestion already experienced along these roadways, while
measuring the effects of both algorithms in ameliorating it.
Scenario B: Adaptive Routing
Scenario B: From the small road network shown in Figure 22 (left), labels AX, AY, AZ;
and BX, BY, BZ indicate the positions in both Routes A and B where we simulated a road
traffic incident, blockade or closure that caused vehicles traveling through these routes to
dynamically seek alternative routes upon becoming aware of the current roadway situation
ahead. Each of these three accidents that led to road closure or blockade was simulated to
last for 600 second (10 minute) intervals. This scenario has the effect of simulating
unforeseen accidents and events that are typically experienced in a real-world driving
situation requiring some dynamic/instantaneous response from the vehicle’s driver were a
decision is normally made to reroute through alternative routes.
Scenario C: Variable Speed Sign (VSS)
Scenario C: Reducing the variable speed sign (VSS), by up to five times the actual speed
limits has a negative effect of promoting further congestion as vehicles now travel at lower
speeds under the stipulated roadway speed limits. The normal speed limits for Routes A
and B are 27.78 m/s, and 11.18 m/s, respectively. Consequently, reducing this speed limit
to five times less the normal speed limit results in vehicles traveling at 5.56 m/s, and 2.24
m/s speeds, respectively. The stepwise decrease in roadway speeds was dynamically
simulated to again last for 600 second (10 minute) intervals.

87
Scenario D: A Hybrid Combination of Scenarios A – C
Scenario D: Combining Scenarios A – C means that vehicles can be rerouted through less
congested roadways especially when vehicles travel at five times less than actual roadway
speed limits. In this scenario, special care was taken to ensure that the vehicles rerouting
time intervals did not overlap with those of decreasing variable speed signs (VSS) in
scenario C. Hence, the synergy of scenarios A – C and their effects on road traffic
congestion can be better observed.
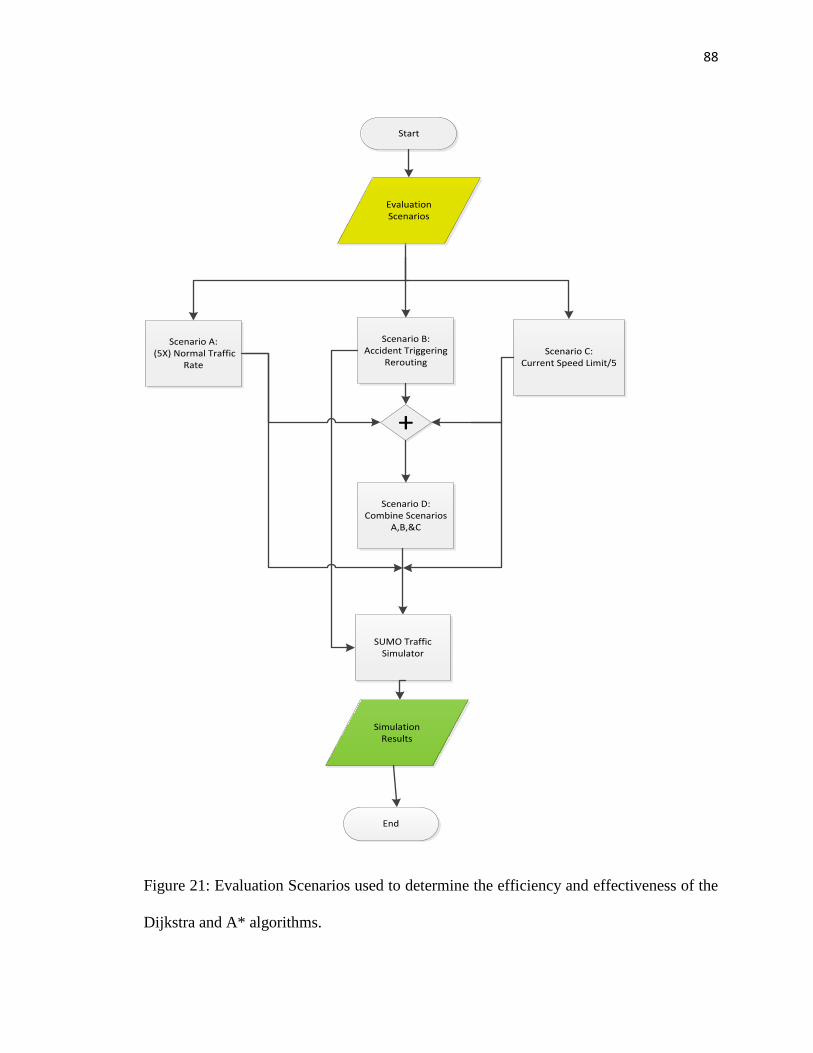
88
Start
End
Scenario A: (5X) Normal Traffic
Rate
Simulation Results
+
Scenario D: Combine Scenarios
A,B,&C
Scenario B: Accident Triggering
ReroutingScenario C:
Current Speed Limit/5
Evaluation Scenarios
SUMO Traffic Simulator
Figure 21: Evaluation Scenarios used to determine the efficiency and effectiveness of the
Dijkstra and A* algorithms.

89
Again, a hybrid of simulation and field data analysis were used to evaluate the efficiency
and effectiveness of both aforementioned algorithms.
Figure 22: A small road network (top) and a large road network (bottom) showing vehicle
routes (both bidirectional, and unidirectional) from various sources to various destinations
and positions (Labels AX, AY, AZ; and BX, BY, BZ indicate where rerouting, as a result
of an accident/closed road, is triggered).
5.4 Performance Evaluation Metrics
In general, algorithms are evaluated based on their correctness (effectiveness and
accuracy), robustness (scalability), and execution time (efficiency) [125, 126]. Similarly,

90
we evaluated the performance of our algorithms based on the shortest travel time (TT), and
travel distance (TD) from a given source to a given destination. The TT for a vehicle,
traveling through a predefined route, represents the travel duration from when a vehicle
enters and exits the simulation. It is measured in seconds for each vehicle emitted into the
SUMO traffic simulator. Similarly, the TD, measured in meters, represents the total travel
length of a route on which vehicles travel when going from a given source to a given
destination.
6. Performance Evaluation Results of Routing Algorithms
In this section, we evaluate the performance of Dijkstra and A* routing algorithms with
respect to the effects of rerouting, decrease in variable speed signs (VSS), increase in traffic
volume, and a hybrid approach on total travel time (TT), and travel distance (TD)
computations.
Figure 23, and Figure 24 show the total travel time (TT), and total travel distance (TD)
through different vehicle routes from various sources to various destinations using Dijkstra,
and A* routing algorithms with normal traffic volume patterns in the small road network
as depicted in Figure 22. These vehicle routes: A, B, C, D, E, F, G, H, I, and J correspond
to vehicles traveling from one point (source) to another (destination): 1 – 2; 2 – 1; 3 – 4;
4 – 3; 5 – 6; 9 – 10; 11 – 3; 6 – 5; 7 – 8; and 5 – 6 as shown in Figure 22.

91
Figure 23: Total travel time (TT) for different routes in small road
network using actual/normal traffic volume patterns.
Figure 24: Total travel distance (TD) for different routes in
small road network using actual/normal traffic volume
patterns.
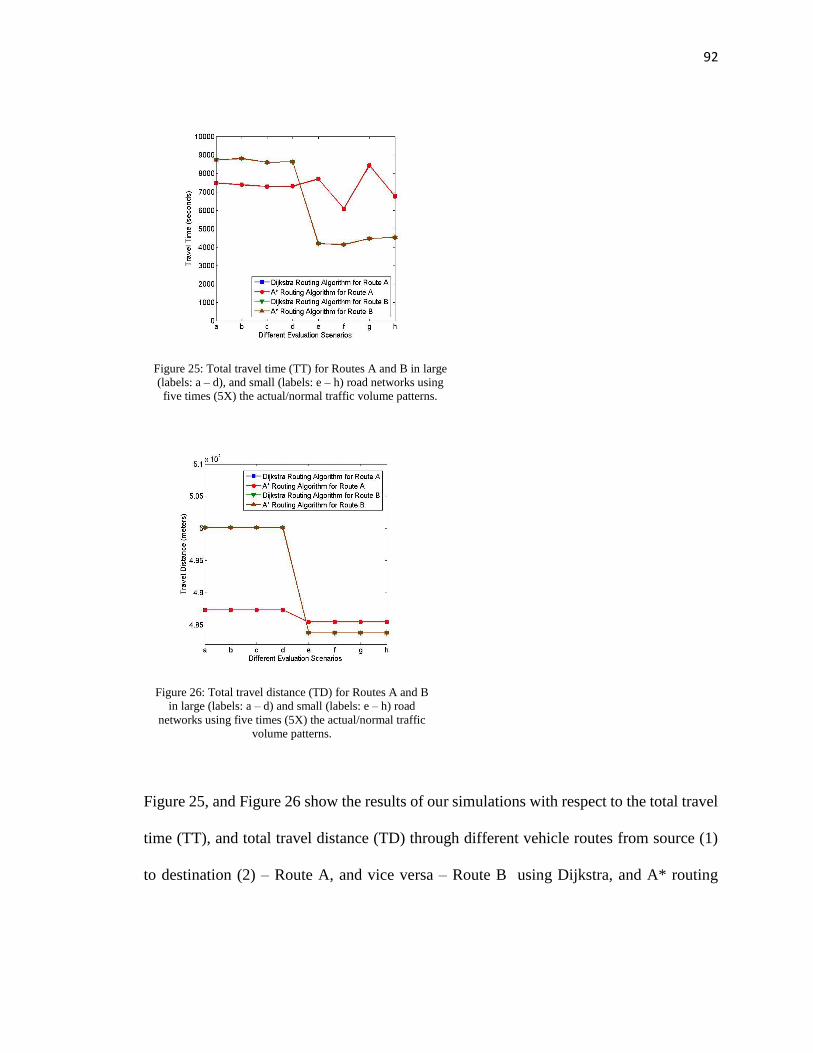
92
Figure 25, and Figure 26 show the results of our simulations with respect to the total travel
time (TT), and total travel distance (TD) through different vehicle routes from source (1)
to destination (2) – Route A, and vice versa – Route B using Dijkstra, and A* routing
Figure 25: Total travel time (TT) for Routes A and B in large
(labels: a – d), and small (labels: e – h) road networks using
five times (5X) the actual/normal traffic volume patterns.
Figure 26: Total travel distance (TD) for Routes A and B
in large (labels: a – d) and small (labels: e – h) road
networks using five times (5X) the actual/normal traffic
volume patterns.

93
algorithms with five times (5X) the normal traffic volume patterns in both large (labels a –
d), and small (labels e – h) road networks as shown in Figure 22.
We analyze the effect of the use of large and small road networks on total travel time (TT)
and total travel distance (TD). From Figure 25, and Figure 26, labels a – d refers to
Scenarios A, B, C, and D applied with respect to the large road network through Routes A
and B. In the same vein, labels e – h equally refers to Scenarios A, B, C, and D with respect
to the small road network, also through Routes A, and B.
With respect to both the large road network (Figure 22 [right], Figure 25, and Figure 26),
and the small road network (Figure 22 [left], Figure 23, and Figure 24), as a general rule,
an increase in the normal traffic volume of up to five times (5X) increases the total travel
time (TT), and total travel distance (TD) for both Routes A and B in the large road network
as seen by comparing Figure 25, and Figure 26 with Figure 23, and Figure 24. Specifically,
Scenario C (the use of decreasing VSS), with label c, as shown in both Figure 25, and
Figure 26, gives the best reduction in TT by 192 seconds and 124 seconds for Routes A,
and B, respectively. The TD of all scenarios for both Routes A and B remained almost
constant at 48,736.09 meters and 50,013.15 meters, respectively as shown in Figure 26
(labels a – d).
With respect to the small road network as shown in Figure 23, an increase in the normal
traffic volume by up to 5 times results in an increase in TT by up to 4.56 times (i.e. 5,703
seconds), and 5.27 times (i.e. 6,992 seconds) of the normal TT for Routes A and B,
respectively as seen by comparing Figure 25 (labels e – f) and Figure 23 (Routes A, & B).

94
The TD for Route A remains constant with Route B, showing a slight increase of 5.1
meters. From Figure 25, using rerouting alone (Scenario B, label f) has the best
performance in terms of the reduction of TT by 1,628 seconds and 57 seconds for Routes
A and B, respectively. In addition, the TD of all scenarios for both Routes A and B remain
almost constant at 48,548.11 meters and 48,376.65 meters, respectively as shown in Figure
26 (labels e – h).
In addition, when comparing Figure 25, the performance of the use of both large road
network - decreasing VSS (Scenario C, label c), and the small road network –
implementing rerouting (Scenario B, label f), Scenario B (label f) gives the best TT
performance by reducing the TT by 1,212 seconds (16.63%) and 4,485 seconds (52.1%)
for Routes A and B, respectively. In addition, Scenario B, label f also performed better than
Scenario C, label c with respect to TD by reducing it by 187.98 meters (3.9%), and 1,636.5
meters (3.3%) for Routes A and B, respectively as shown in Figure 26. Evidently, for all
the scenarios evaluated using both large, and small road networks, implementing rerouting,
and the use of decreasing VSS have the positive effect of reducing TT while TD remains
constant – which is good for fuel economy, travel time efficiency, and is environmentally
friendly, etc. Because resources for continuously constructing new roadways to ameliorate
congestions are limited, these congestion mitigation approaches have proven to be more
efficient and effective solutions.

95
As we can see, both algorithms – Dijkstra, and A*, tend to show the same performance
with respect to travel time (TT) and travel distance (TD) in both small and large road
networks. One reason for this observation is that the size of the network and the traffic
volumes need to be further increased in order to show significant differences. This is
because the A* algorithm is widely known to be an improvement over the Dijkstra’s
algorithm especially when large road networks are considered, i.e. the performance of the
Dijkstra’s algorithm degrades as the size of the road network increases. Our next tasks will
be to further increase the size of the network, while varying other network parameters, and
taking note of where differences in the total travel times (TT) and the total travel distance
(TD) exist between the two algorithms in both large and small road networks.
We also examine the total number of rerouted vehicles in both large and small road
networks through Routes A and B, respectively. As shown in Figure 27, in the large road
network, out of a total of 720 emitted vehicles through Route A, the A* algorithm rerouted
148 vehicles. A total of 56 vehicles, out of 720 emitted vehicles was also rerouted using
Figure 27: Number of rerouted vehicles through routes A and B
for small and large road networks.

96
the A* algorithm through Route B. The Dijkstra algorithm did not reroute any vehicles in
both Routes A and B. With respect to the small road network, 198 vehicles each were
rerouted by both the A* and Dijkstra algorithms through Route A from the total of 720
emitted vehicles. No vehicle was rerouted by both algorithms through Route B. A possible
reason for this could be that the routes, on which rerouting was implemented, was avoided
by the vehicles while traversing from the source to the destination.
7. Remarks
The motivation behind the development of an efficient and effective vehicle routing
algorithm cannot be over emphasized. This is consequent upon the fact that congested
roadways eventually propagate to other neighboring roadways, leading to time, gas, and
other resource wastage together with inefficiencies in traffic flow management – hence the
need for realistic simulation studies and field studies. Using real-world data and simulation
studies, in this chapter, we evaluated the performance of two vehicle routing algorithms,
namely Dijkstra’s algorithm, and A* algorithm respecting traffic efficiency. The
simulation experiments were conducted using the SUMO traffic simulator; the evaluation
metrics we used are total travel time (TT), and total travel distance (TD). In addition, the
scalability, accuracy, and reliability of these algorithms, with respect to large and small
road networks, effects of variable speed signs (VSS), rerouting, increase in total traffic
volume (individually, and in combination) together with other performance tradeoffs were
evaluated.

97
Chapter 4
Connected Vehicles Technology
1. Overview
Traffic efficiency and safety are major hallmarks of Intelligent Transportation System
(ITS). To accurately validate, and investigate the effectiveness of traffic efficiency and
safety application to ITS, realistic studies are highly demanded [12]. Consequently, in this
chapter, using real-world traffic and simulation data, we developed a realistic ITS test-bed
and a mobile application known as Incident Warning Application (IWA) with the view of
answering the question: what are the traffic efficiency and safety benefits of vehicle-to-
vehicle (V2V), and vehicle-to-infrastructure (V2I) communications in a realistic ITS
environment? Our real-world dataset consists of six weeks road traffic data in the Maryland
(MD)/Washington DC and Virginia (VA) areas from August 1st, 2012 to September 12th,
2012. With respect to classic/unequipped vehicles, our evaluation results show that
vehicles running our IWA showed improvements in almost all the performance metrics
evaluated. Specifically, our data shows that improvements in travel time (139.89%), fuel
consumption (11.77%), and environmental emissions – carbon dioxide [CO2] (11.77%),
etc. can be achieved through V2I communication at 100% IWA-equipped vehicles.
Similarly, with respect to V2V communication, the following improvements were
observed at 5% IWA-equipped vehicles: travel time (126.78%), fuel consumption (8.05%),
and environmental emissions – carbon dioxide [CO2] (8.05%), etc.

98
Comparing the performance of V2I communication with V2V communication on IWA-
equipped vehicles, our results show that V2I communication outperformed V2V
communication respecting both traffic efficiency, and safety at specific IWA-enabled ratio.
Most significantly, at 35% IWA-equipped vehicles, V2I communication outperformed
V2V communication respecting travel time (55.2%), fuel consumption (6.1%), and
environmental emissions – carbon dioxide [CO2] (6.1%), etc.
2. Motivation
The need to adaptively/dynamically route traffic from one point/place/location to another
in order to minimize congestion resulting in better traffic flow management has been
expressed and buttressed by several existing research efforts as a necessity [1, 2, 4-14].
According to the U.S. Federal Highway Administration (FHWA) [32], improving the
current traffic efficiency, building new roads and infrastructure, and encouraging
alternative modes of transportation (e.g. carpooling, taking the bus or train, etc. instead of
driving alone) are some of the major congestion mitigation techniques. However, of all the
aforementioned road traffic congestion mitigation/alleviation techniques, the use of
dynamic/adaptive routing mechanisms that optimally utilize the existing road capacity is,
generally, the most cost-efficient and effective technique [33].
Inefficient routing leads to greater environmental pollution, fuel/gas/energy wastages, and
others, which are deleterious to the environment. In order to dynamically control traffic to
minimize these undesirable consequences, mechanisms such as variable speed limits and
ramp metering are used in ITS applications [28, 42, 63]. Inter-vehicle communication
(IVC)/ vehicle-to-vehicle (V2V) communication ameliorate congestion, resulting in

99
improved safety and travel times because traffic is rerouted through the most effective route
to evade congestions [36, 133, 134] [34] [12] [35]. Although IVC is capable of providing
better safety and average trip time, it can lead to negative environmental impacts because
vehicles usually take longer routes to avoid congestion. In addition, if the source of the
congestion is not contained in a timely manner, these alternative routes will become
congested because more and more vehicles are routed through the same finite capacity
roadway [2, 6, 8]. Consequently, more CO2 is emitted (given the same distance) without
IVC than with IVC – while neglecting the fact that rerouting normally takes a longer path
[6]. It is worth noting that vehicle-to-infrastructure (V2I) communication has the
disadvantage of leading to future congestions of the alternative roadway(s) because all
vehicles try to use them in order to avoid congestions on the primary roadway without
having prior knowledge of the congested conditions on these alternative routes [33].
Some ITS safety applications include, but are not limited to: hard-breaking signals
alert/emergency break warning used in crash or collision avoidance, possible red-light
violation warning by other vehicles, future precarious road bends warnings, hazardous
traffic maneuvering warnings or blind spot warning, and speed advisories, etc. Similarly,
traffic light assistant, traffic pattern forecasting, optimal route guidance, traffic situational
awareness, and Green-Light Optimal Speed Advisory (GLOSA), etc. are some of the traffic
efficiency applications in ITS [7, 15, 39, 135].
In general, and from the aforesaid, vehicle-to-x (V2X) communication leads to improved
traffic efficiency and safety with equipped vehicles constantly exchanging their positions,
directions, speeds, (situational awareness) etc. to their neighbors to ensure optimal routing.

100
In order to better understand the problem domain of ITS safety and traffic efficiency,
simulation experiments should normally be conducted first before actual field tests because
of the expensive nature of the latter [33, 136, 137].
Consequently, in this chapter, we address the issue of evaluating the safety and traffic
efficiency applications of ITS using real-world dataset. Particularly, we developed a test-
bed based on our real-world traffic trace data and simulated a traffic incident. The
simulated traffic incident resulted in vehicles equipped with our developed mobile Incident
Warning Application (IWA) taking alternative routes, though longer, to the destination in
order to avoid a traffic incident on its primary/original route. The vehicles without IWA,
on the other hand, get delayed by the incident.
Our results clearly show that V2I communication, evidently, resulted in both more
significant safety and traffic efficiency improvements over V2V communication especially
prevalent at specific IWA-enabled ratio; we defined this ratio as the average/ratio of IWA-
equipped vehicles that responded positively to the change route directive by rerouting to
the total number of IWA-equipped vehicles emitted in the simulation. It is worth noting
that the use of real-world traffic data, along with real-world road network topologies,
makes our work have unique contributions.
The rest of this chapter is organized as follows: in Section 3, we review some of existing,
and most recent research efforts related to ITS traffic efficiency and safety applications. In
Section 4, we present our test bed setup in detail. In Section 5, we present the results of our
experimental evaluations. Finally, we conclude this chapter in Section 6.

101
3. Background
In this section, we review some of existing research efforts with respect to safety and traffic
efficiency in ITS.
As aforesaid, because of the expensive nature of field tests/studies, simulation studies are
normally done first [98]. Consequently, using the V2X Simulation Runtime Infrastructure
(VSimRTI), Schunemann et al. [33] obtained better travel time (TT) performance (a metric
to evaluate traffic efficiency) by dynamically rerouting vehicles through alternate routes to
avoid congestion. As the number of V2X enabled vehicles increase, more vehicles take
alternate routes to avoid the congestion on the main route. Their results showed that when
80% vehicles were V2X enabled, close to 50% travel time is attained.
Decentralized routing has been found to reduce vehicular travel time through congestion
avoidance [6, 9, 28, 62]. It achieves this goal by dynamically routing equipped vehicles
away from congested roadways, resulting in a 6.5% reduction in travel time with 25% V2X
enabled vehicles [138] [33]. Vehicle-to-vehicle (V2V) communication was used to achieve
better travel time in comparison with centralized approaches especially by increasing the
ratio of V2X enabled vehicles [33]. A noted disadvantage of centralized routing is that its
accuracy (in disseminating current traffic information) is mainly determined by the optimal
placement of road-side units (RSUs) and other infrastructure components; besides its
expensive nature emanating from additional infrastructure costs. Notably, travel times can
be negatively affected by having 10% or more of faulty or misbehaving nodes (e.g. RSUs)
on a given roadway.

102
Other factors that can lead to decreased efficiency and effectiveness of decentralized
routing include, but are not limited to: sparseness of V2V vehicles, natural or
environmental factors (e.g. rain, fog, ice, etc.), interference with respect to rural versus
urban roadways, high buildings or obstacles, transmission power, bandwidth, and
communication range limitations, together with other natural, and man-made events, etc.
[8, 64].
In order to create a congested scenario towards the evaluation of V2X traffic efficiency,
Schunemann et al. [33] made vehicles prefer using alternate routes more than the primary
route by reducing the maximum speed limit of the main route to 50 km/h; thereby, giving
the alternate routes more priority because, at any point congestion is sensed, V2X vehicles
chose the route(s) with the least/best travel time (TT) to the destination. Congestions were
also created by prolonging the duration of the red light at traffic light junctions while
reducing the duration of the green light. Primarily, vehicle speed rather than travel time
(popularly used especially by the Dijkstra’s algorithm) was used as the primary weighting
factor in determining the presence of congestions and selecting alternative routes because
of its better accuracy in predicting congestion. This is true because the use of travel time
does not consider factors such as the dynamic nature of traffic congestions, effects of
inefficient traffic light transitions/timings, and unforeseen road incidents, etc. [33] [134].
Besides, at varying traffic densities of low (50 vehicles), medium (100 vehicles), and high
(150 vehicles), 3.3%, 16.6%, and 17.3% improvements/benefits in average fuel
consumption levels were obtained using the adaptive route change algorithm (ARC) [139].
Vehicles running ARC, and in general, other V2X applications are rerouted from a

103
congested route to alternative routes without subsequently overwhelming these alternate
routes. The reason ARC does not congest alternative routes is that because it uses vehicle-
to-vehicle (V2V) communication, it has prior knowledge of their congested
states/conditions [134, 140]. At 100% V2X penetration rate, the performance benefits of
ARC equipped vehicles diminished from that recorded at 60 - 70% (the most optimal
penetration rate) because all vehicles are routed from the primary roadway to alternative
roadway(s) – which may probably become congested especially if using vehicle-to-
infrastructure (V2I) communication because it, mainly, does not take into account the
congested condition of alternative routes [8, 45]. Consequently, setting the maximum
limit/threshold of ARC equipped vehicles that should/should not reroute can be used to
proactively arrest/prevent this undesirable condition [140]. In the same vein, Katsaros et
al. [140] recorded improvements with respect to traffic efficiency metrics of: fuel
consumption (17.3% reduction), trip time (26.5% reduction), stop times/waits at traffic
lights, average queue size (32.5% reduction), and maximum queue size at the most optimal
V2X penetration rates of 60 – 70% (and not at 100%) using Green Light Optimized Speed
Advisory (GLOSA), and Adaptive Route Change (ARC) algorithm [140]. Evidently,
besides improvements in trip time, adaptive routing also resulted in reduced fuel
consumptions and environmental emissions [140]. GLOSA minimizes fuel consumption
by preventing frequent braking/stoppages and subsequent recommencements/accelerations
at intersections which equally translates into improved trip time, and lower environmental
emissions, etc. [141]. With GLOSA, CO2 emission, and fuel consumption levels were
found to be equal [141] [140]. Although this and many other studies utilized a real-world
road network topology, they are normally void of realistic traffic data – the authors also

104
acknowledged its importance and its possible biasing effect on the results obtained and will
endeavor to use realistic data in their next study.
Queck et al. evaluated a vehicle-to-x (V2X) scenario where leading vehicles detect a
slippery road and broadcasts this information to trailing vehicles who try to look for
alternative routes to circumvent/avoid this precarious/perilous road condition – to ensure
route optimization and safety. Congestion was triggered in the roadway with a slippery/ice
condition because vehicles reduce their speeds while traversing the affected area; on
receiving the warning, vehicles further down the road try to use alternative routes in order
to avoid the congested condition, and not further exacerbate/aggravate it [142]. With
respect to traffic efficiency applications, using the driving/travel times (TT) of each vehicle
that enters and exits the simulation, Queck et al. calculated the mean/average travel times
of each vehicle category/class: classic, equipped, and application-supported [142]. Some
marginal improvement in trip/travel time (TT) was observed when the penetration rate of
application-supported vehicles increased to between 5% - 7% [142]. The results clearly
show that application-supported vehicles, at penetration rates of 8% and above, attained a
remarkably noticeable decrease in TT which is good for traffic efficiency, and the
environment [142] [138] [33].
In summary, increase in V2X penetration rates/number of application-equipped vehicles is
directly proportional to improvements in safety, and traffic efficiency e.g. trip time, fuel
efficiency/economy, etc. [140, 141]. In reality, however, increases in V2X penetration rates
usually reach a saturation point of safety, and traffic efficiency improvements before they
start to decline.

105
From extensively reviewing literature, the need for more realistic studies with respect to
traffic efficiency, and safety applications using V2V, and V2I communication in ITS has
been shown to be very imperative. Most existing studies were not based on real-world data,
and/or road network required for accurate, unbiased, and realistic simulation results [1, 2]
[3] [4-10] [7] [1] [11] [12] [13] [2] [14] [7] [47]. To this end, we endeavor to fill this
integral gap.
4. Main Contributions: Simulation Setup
In this section, we present a detailed description of the inputs to our simulation test-bed,
and our evaluation scenarios.
4.1 V2X Simulation Framework: VSimRTI Architecture
Using the V2X Simulation Runtime Infrastructure (VSimRTI), the problems of flexibly
coupling simulators together, synchronizing them, and enabling them to interact with each
other/one another has been solved without requiring changes to the underlying
infrastructure – which is a major downside of fixed coupling approaches [137]. Deriving
from the Institute of Electrical and Electronics Engineers (IEEE) standard for Modeling
and Simulation (M&S) High Level Architecture (HLA), the V2X Simulation Runtime
Infrastructure (VSimRTI) is used for evaluating various types of V2X scenarios [133, 134,
137, 140-146]. It enables flexible/loose coupling of various simulators such as traffic,
network/communication, and environment, etc. that can be easily modified based on the
simulation goal/objective [134, 142, 144, 146]. Several traffic (SUMO, and VISSIM),
communication/network (JIST/SWANS, OMNeT++, ns-3), and application

106
(VSimRTI_App) simulators, besides other data visualization/analysis, and development
tools have been successfully coupled with VSimRTI as shown in Figure 30 [133, 134, 137,
140, 141, 146-149]. Upon starting a federate/simulator e.g. the SUMO traffic simulator, a
bidirectional communication is established between the Federates ambassador, and the
V2X simulation runtime infrastructure (VSimRTI). VSimRTI consists of components
responsible for federation, vehicle data, time/synchronization, and
interaction/communication managements [133, 137, 142, 144, 145]. Figure 28 and Figure
29 show the VSimRTI architecture together with its interacting federates.
Similar to VSimRTI, other frameworks have attempted to enable/establish bidirectional
coupling of traffic, and communications simulators mostly in a fixed manner attended by
their pros and cons. Some of these frameworks include, but are not limited to: TraNS
couples the open source SUMO traffic simulator with ns-2 [137, 141, 142, 150]; the
Multiple Simulator Interlinking Environment for C2CC in VANETs (MSIECV) couples
the commercial traffic simulator VISSIM and the ns-2 network simulator with
Matlab/Simulink responsible for application level simulation [142, 150]; iTETRIS couples
SUMO traffic simulator, and ns-3 network simulator – it is particularly suited for large-
scale simulation scenarios; veins couples SUMO with OMNeT++ network simulator [6,
8, 65-67, 149]; and Paramics & ns-2, which as the name indicates, couples the Paramics
traffic simulator with the ns-2 network simulator. At the minimum, traffic, application, and
communication/network simulator interactions/couplings are required for successful V2X
communication using most V2X frameworks/infrastructure such as iTETRIS – this is also
true with VSimRTI [6, 133, 134, 137, 142, 145, 148, 150].

107
Figure 28: High-level VSimRTI architecture with coupled federates [151] [91] [81] [76]
[77] [152].
Figure 29: Basic federates necessary for successful V2X simulation [151] [103] [152].

108
Figure 30: Various types of simulation tools so far coupled to VSimRTI [153] [76] [77].
4.2 Simulation Input and Parameters
We used the V2X simulation runtime infrastructure (VSimRTI) platform for the purposes
of our study. The vehicle movements were carried out using the SUMO traffic simulator
with its traffic control interface (TraCI) used to control the simulation at runtime. The
SUMO vehicle movements were used as input to the VSimRTI cellular simulator – used
for V2I communication, and the Java in simulation time/scalable wireless ad hoc network
simulator (JiST/SWANS) – used for V2V communication; eWorld
(http://eworld.sourceforge.net/) was used to generate slippery ice and fog events on our
road network topology imported from OpenStreetMap (http://www.openstreetmap.org) –
as shown in Figure 31, before subsequently feeding it into SUMO as inputs [33]. The
VSimRTI cellular and network simulators are responsible for adding nodes, deleting nodes

109
(nodes that have reached their destination), or moving nodes around. V2I, and V2V/IVC
determines their speeds, and routes in relation to different environmental conditions [6].
Figure 31: Importing our road network from OpenStreetMap.
A more detailed exposition at the VSimRTI framework and its coupled
federates/simulators requisite for successful V2X simulation thus ensues:
4.2.1 Traffic Simulator (SUMO)
We used the open source microscopic simulation for urban mobility (SUMO)1 traffic
simulator as our traffic simulator. Some of its features include, but is not limited to: support
for lane changing, overtaking, simulating vehicles individually, modeling of driver
imperfections, collision-free vehicle movements, multi, and single-lane roadway support,
1 http://www.dlr.de/ts/en/desktopdefault.aspx/tabid-9883/16931_read-41000/

110
etc. Road networks (streets/edges), and navigation routes were generated in SUMO using
the netconvert.exe, and duarouter.exe tools [132] [98] [142].
4.2.2 Network Simulator (JiST/SWANS)
The Java in simulation time (JiST)2, a virtual machine based simulator, was used together
with its scalable wireless ad hoc network simulator (SWANS) adjunct as our chosen
network simulator. With JiST/SWANS, cooperative awareness messages (CAM) are used
to identify nodes (vehicles, RSUs, or traffic lights) transmission timestamp, and position
(latitude and longitude), speed, direction/heading, etc. In the same vein, decentralized
environmental notification message (DENM) messages are used for event notifications that
can trigger rerouting to all vehicles/nodes within its communication range via single-
hop/centralized (broadcast), or multi-hop/decentralized (ad hoc) communication [98].
Some of the features of the JiST/SWANS network/communication simulator includes, but
is not limited to: specifications for transmission range, transmission power, bandwidth,
receiver sensitivity, and geographic routing protocol, etc. A major advantage of the
JiST/SWANS communication simulator is that it is highly scalable with increasing
network size. Its network layer supports IPv4 and the transport layer supports both UDP,
and TCP [154, 155] [156, 157] [142].
4.2.3 Network Simulator (VSimRTI Cellular Simulator)
The built-in VSimRTI cellular simulator allows for the simulation of cell phone/cellular
communication technologies such as universal mobile telecommunications system
2 http://vanet.info/jist-swans

111
(UMTS), and long term evolution (LTE), etc. Previously before now, it required exclusive
usage i.e. it could not be used together with any other network simulator such as
JiST/SWANS. However, with the latest release of VSimRTI (VSimRTI version 0.13.5),
the VSimRTI cellular simulator can now be used to complement/supplement the network
simulator [152]. In order to use the VSimRTI cellular simulator, the network, regions, and
geoserver configuration files must be present [152]. Using the cellular simulator,
metrics/parameters such as bandwidth (bits/sec), throughput (bits/sec), and packet delivery
ratio (pdr), etc. can be configured/varied/modified [152] [158]. Besides modifying the
application in order to use the cellular simulator, the scenario must also be altered [152]
[158]. It also supports customized delays with respect to some special regions such as areas
having a high population density or are susceptible to poor signal reception quality as a
result of the difficult terrain [152]. Respecting the supported transmission/propagation
modes, V2X messages can be transmitted/propagated via unicast (unidirected to a single
node), broadcast (sent to every node), or geocast (sent to every node within a given region)
[152]. Specifically, in our scenario, the decentralized environment notification message
(DENM) from the cellular simulator is used to trigger rerouting using geocast
communication i.e. only nodes/vehicles within the geocast radius/communication range
(300m) receive and are expected to respond to reroute/change route directives [158] [152].
4.2.4 Application Simulator (VSimRTI_App)
Using the application simulator/federate, applications can be implemented that control
nodes (vehicles, RSUs, and traffic lights) in a simulation [98] [145]. Specifically, we
developed/implemented an application called incident warning application (IWA) with

112
code snippet/sample shown in Appendix A; vehicles running this application are able to
use it to bypass identified traffic incidents with the propensity/proclivity of leading to
traffic congestions, and other precarious driving conditions. This application can be
configured to either support decentralized/vehicle-to-vehicle (V2V)/inter-vehicle
communication (IVC) using the JiST/SWANS network/communication simulator, or
centralized/vehicle-to-infrastructure (V2I) communication using the VSimRTI cellular
simulator, but not both; our next task is to enable it to support both i.e. hybrid/vehicle-to-
vehicle-to-infrastructure (V2V2I) communication [142].
4.2.5 Event Simulator (eWorld)
The eWorld framework allows for the importation of OpenStreetMap files – both online,
and offline – on which environmental events such as traffic jams, presence of fogs,
icy/slippery street, rains, road works/constructions, etc. can be incorporated into the map.
The environmental events enriched map can subsequently be either exported to the SUMO
traffic simulator as input, databases, or saved within eWorld’s file format. Other eWorld
environmental events that can be added to the road networks include, but are not limited
to: glazed frost, snow, ozone, smog, CO2, and temperature variations. Also, the duration of
these events relative to the entire simulation runtime can also be configured. After adding
environmental events to a map, eWorld can export it directly into SUMO specific file
formats which consists of SUMO network, edge/street, node, route, event definitions,
traffic light definitions, variable speed sign definitions, rerouter definitions, and
configuration definition files. In addition, traffic lights, vehicle routes, and points of
interests (PoIs) can be added and modified using eWorld. Besides, SUMO dump

113
files/simulation outputs/results can also be imported into eWorld in order to
compute/analyze some simulation statistics/parameters such as total travel time, vehicular
density, occupancy, and average speed, etc. Simulation results can also be visualized within
eWorld with capabilities of high occupancy lane/street colorings, and width visualizations
[142] [159]. Figure 32 shows a slipper and frozen ice event being added to our reference
study area – Constitution Avenue NW using eWorld.
Figure 32: Slippery ice event added to Constitution Avenue NW using eWorld.
As shown in Table 3, the following major, but incomplete list of parameters were used in
our simulation setup: communication range (300m), maximum node bandwidth
(100Mbps), throughput (350Mbps), and Packet Delivery Ratio (PDR) – 1.0 [142] [137]
[133], etc. Our simulation was run 21 times with the ratio of IWA-equipped vehicles in
relation to IWA-unequipped/classic vehicles increased from 0% to 100% at 5% increments
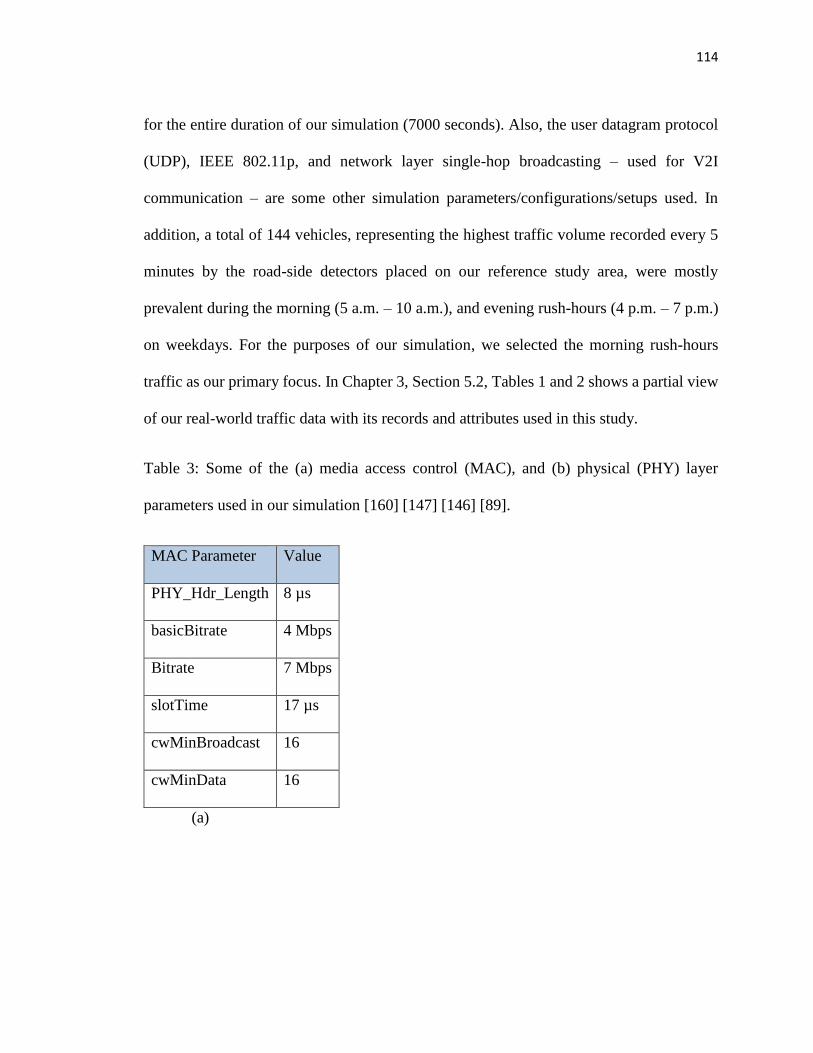
114
for the entire duration of our simulation (7000 seconds). Also, the user datagram protocol
(UDP), IEEE 802.11p, and network layer single-hop broadcasting – used for V2I
communication – are some other simulation parameters/configurations/setups used. In
addition, a total of 144 vehicles, representing the highest traffic volume recorded every 5
minutes by the road-side detectors placed on our reference study area, were mostly
prevalent during the morning (5 a.m. – 10 a.m.), and evening rush-hours (4 p.m. – 7 p.m.)
on weekdays. For the purposes of our simulation, we selected the morning rush-hours
traffic as our primary focus. In Chapter 3, Section 5.2, Tables 1 and 2 shows a partial view
of our real-world traffic data with its records and attributes used in this study.
Table 3: Some of the (a) media access control (MAC), and (b) physical (PHY) layer
parameters used in our simulation [160] [147] [146] [89].
MAC Parameter Value
PHY_Hdr_Length 8 µs
basicBitrate 4 Mbps
Bitrate 7 Mbps
slotTime 17 µs
cwMinBroadcast 16
cwMinData 16
(a)

115
PHY Parameter Value
carrierFrequency 5.9 GHz
rxSensitivity -91 dbm
rxThreshold -81 dbm
txAntennagain 0 db
antennaHeight 1.5 – 10.0 m
txPower 15 dbm
noisePower -95 dbm
Maximum Node Bandwidth 100 Mbps
Throughput 100 – 350 Mbps
Minimal CAM/DENM Length 1500 bytes
Other Parameters Value
Simulation Duration 7000 seconds
Simulation Area 77000 * 67000 meters
Packet Delivery Ratio (PDR) 1.0
Vehicle Number/Count 144
(b)
4.3 Evaluation Scenarios
In order to ascertain the traffic efficiency and safety benefits of V2V, and V2I
communications, we developed the following scenarios as depicted in
Figure 35:

116
Scenario 1: Here, we evaluated the traffic efficiency of V2V, and V2I communications. In
order to do this, we simulated a road traffic incident on Constitution Avenue, which
consists of a road accident, slippery road segment caused by ice, and reduced speed as a
result of poor roadway visibility caused by fog as shown in Figure 33 (red line/route), and
Figure 34. Unequipped (classic) vehicles suffer the consequences of the aforementioned
incident, while our IWA-equipped vehicles bypass the incident through H. Street NW –
Figure 33 (blue line/route) – because they positively responded to the change route
directive received on getting to 9th Street. Our simulated vehicles emanated from John
Hanson Hwy (source) to Dulles Toll Road (destination). The normal speed limit of
Constitution Avenue, where an accident was simulated, is 50 km/h. Following the complete
stoppage of vehicles for 40 minutes because of the road accident that blocked all 3 lanes,
all affected vehicles later resumed their journey at a reduced speed of 20 km/h for another
50 minutes because of the perilous icy and slippery road condition coupled with low
visibility deriving from the presence of fog until they completely traversed away from this
affected street after traveling a distance of 82.32 meters [146]. Using the Handbook
Emission Factors for Road Transport (HBEFA) version 3.1 database [60, 161], which is
similar to the Passenger car and Heavy duty vehicle Emission Model (PHEM), we modeled
the pollutant/emission levels of our simulation by coupling its database to our simulation
with the SUMO traffic simulator [60, 132] – specifying the passenger and light
duty/delivery category (HBEFA3/PC_G_EU4) as emission class. Besides passenger cars
(PC), light commercial vehicles (LCV), and Heavy Duty Vehicles (HDV) are some other
vehicle categories that can be modeled with HBEFA [60, 67, 132, 162-164]. The following
six major pollutants were considered for the purposes of our study: CO2 (carbon dioxide),

117
CO (carbon monoxide), HC – hydrocarbons (consisting of CH4 [methane], NMHC [non-
methane hydrocarbons], benzene, toluene, and xylene), NOx – Nitrogen oxides (consisting
of NO2 [nitrogen dioxide], NO [nitrogen monoxide]), PMx (particulate matters/particulate
mass value), and fuel consumption (FC) [132, 161, 164, 165].
Scenario 2: Here, we determine the safety rate of V2V, and V2I communications by
computing the ratio of all IWA-equipped vehicles, which actually rerouted against all
vehicles that received the reroute/change route directive. Consequently, if all IWA-
equipped vehicles that received the reroute directive to evade the deleterious road incident
on Constitutional Avenue NW actually rerouted, we have a 100% safety rate and vice
versa.
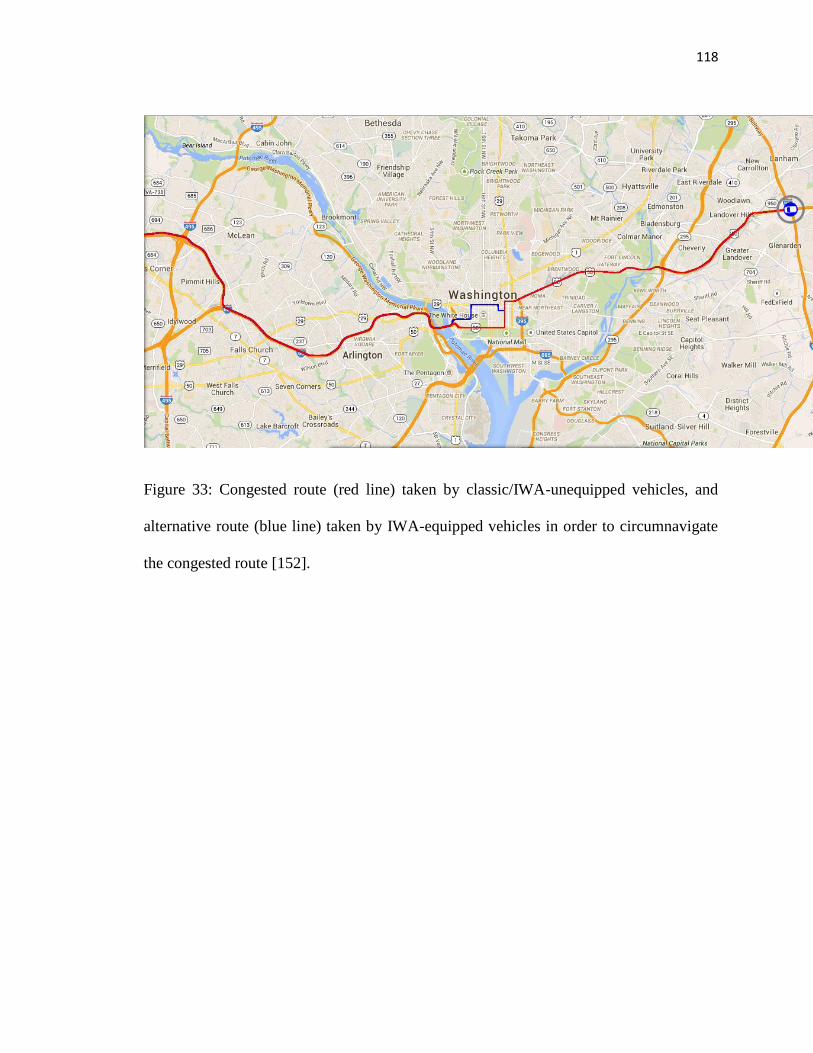
118
Figure 33: Congested route (red line) taken by classic/IWA-unequipped vehicles, and
alternative route (blue line) taken by IWA-equipped vehicles in order to circumnavigate
the congested route [152].

119
Figure 34: Real-world view of traffic congestions experienced on Constitutional Avenue
NW during typical rush-hours traffic on Google Map.

120
Scenario Convert
Start
End
OpenStreetMap Data
+
Scenario Database
Application Simulator
Traffic Simulator
Incident Warning
Application (IWA)
Environment Simulator
JiST/SWANS Communication
Simulator
VSimRTI Cellular
Simulator
Is IWA-equipped?
Is Rerouted?
Follow Alternative Route(s)
Follow Congested Route
Is V2V/Ad hoc?
VANET Architecture
Yes
No
Is Simulation Run = 21?
No Yes
No
Yes
VSimRTI
Mapping Configuration
VSimRTI Configuration
Files
Road-side Unit (RSU)
Ratio
Node Type
IWA-equipped/
Classic Ratio
Yes
NoSimulation
Results
Figure 35: Connected vehicles simulation workflow [76] [166].

121
5. Evaluation Results and Discussion
In this section, we present and compare the results of our realistic simulation studies using
two popular vehicular ad hoc network (VANET)/intelligent transportation system (ITS)
architectures – vehicle-to-infrastructure (V2I), and vehicle-to-vehicle (V2V)/inter-vehicle
communication (IVC). In this section, respecting traffic efficiency, the suffixes _app,
_noapp, and _ref in Figure 36 refers to vehicles equipped with our developed IWA (_app),
IWA-unequipped (classic) vehicles (_noapp), and reference vehicle performances (_ref)
with no simulated incident on Constitution Avenue NW. Similarly, respecting safety, we
denoted IWA-equipped vehicles that rerouted with (rerouted_yes), and those that did not
reroute with (rerouted_no) in response to the change route directive; the sum of both
vehicles is represented with (total).
5.1 Vehicle-to-Infrastructure (V2I) Communication for Safety and Traffic
Efficiency
Figure 37 shows a visualization of our simulation results in the VSimRTI integrated test
and evaluation framework (ITEF) using vehicle-to-infrastructure (V2I) communication at
100% IWA-enabled ratio [152]. Respecting V2I communication, Figure 36 [a – d] shows
the result of our traffic efficiency evaluation, while Figure 36 [e – f] shows the result of
our traffic safety evaluation. Generally speaking, and in corroboration with existing
studies, we found that V2I communication has the effect of improving safety and traffic

122
efficiency and the number of rerouted vehicles is also almost directly proportional to the
ratio of IWA-equipped vehicles emitted.
In particular, respecting traffic efficiency in Figure 36 [a – d], our results show that on the
one hand, the following average highest benefit was obtained at 100% IWA-enabled rate
as a result of V2I communication: travel time [TT]: (139.89%) – 2311.4 seconds, average
speed (58.51%) – 62.04 km/h, CO (2.20%) – 3.01g/m, CO2 (11.7%) – 0.79g/km, NOx
(4.68%) – 0.69g, HC (23.71%) – 0.52g, and fuel consumed (11.77%) – 0.31 liters. On the
other hand, the following losses were recorded at the same 100% IWA-enabled rate: PMx
(0.99%) – 6.36mg, and travel distance (0.49%) – 240.58 meters.
In the worst case scenario (i.e. at 95% IWA-enabled rate), the following benefits were still
obtained: travel time [TT]: (115.87%) – 1915.4 seconds, average speed (53.90%) –
57.13km/h, CO (0.33%) – 0.45g/m, CO2 (8.45%) – 0.56g/km, NOx (2.47%) – 0.36g, HC
(18.14%) – 0.4g, and fuel consumed (8.45%) – 0.22 liters. Similarly, the following losses
were recorded at the same 95% IWA-enabled rate: travel distance (0.49%) – 240.58 meters,
and PMx (2.44%) – 15.62mg.
With respect to safety, Figure 36 [e – f], at 50% IWA-enabled rate for example, out of the
72 emitted IWA-equipped vehicles, all 72 (100%) rerouted and thereby avoided the traffic
incident detected on Constitution Avenue.
Overall, because almost all IWA-equipped vehicles that received the change route request
actually heeded it (except at 65% IWA-enabled ratio and above where only one vehicle
each failed to reroute in subsequent simulation steps as shown in Figure 38, V2I

123
communication resulted in 100% safety performance below 65% IWA-enabled rate.
Nonetheless, it is worthy to note that, overall, V2I communication can provide 98.9% and
above safety performance, which is commendable, although it still cannot be reliably used
for safety/life-critical scenarios at 65% IWA rates and above where 100% performance is
still mandated.

124
(b)
48.3
48.35
48.4
48.45
48.5
48.55
48.6
48.65
48.7
0 5
10
15
20
25
30
35
40
45
50
55
60
65
70
75
80
85
90
95
100
Tra
vel
Dis
tan
ce (
km
)
IWA-enabled Ratio (%)
TD_app TD_noapp TD_ref
(a)
0
10
20
30
40
50
60
70
0 5
10 15 20 25 30 35 40 45 50 55 60 65 70 75 80 85 90 95
100
Tra
vel
Tim
e (m
inu
tes)
IWA-enabled Ratio (%)
TT_app TT_noapp TT_ref
Figure 36: Performance of some evaluated metrics in relation to increasing IWA-enabled ratio.
(c)
12.5
13
13.5
14
14.5
15
15.5
16
0 5
10
15
20
25
30
35
40
45
50
55
60
65
70
75
80
85
90
95
100
NO
x-e
mis
sion
s (g
)
IWA-enabled Ratio (%)
NOx_app NOx_noapp NOx_ref
(d)
5.50
6.00
6.50
7.00
7.50
8.00
0 5
10
15
20
25
30
35
40
45
50
55
60
65
70
75
80
85
90
95
100
CO
2-e
mis
sion
s (g
/km
)
IWA-enabled Ratio (%)
CO2_app CO2_noapp CO2_ref
(e)
98
98.5
99
99.5
100
100.5
0 5
10
15
20
25
30
35
40
45
50
55
60
65
70
75
80
85
90
95
100
Safe
ty R
ate
(%
)
IWA-enabled Ratio (%)
safety_app safety_ref
(f)
0
20
40
60
80
100
120
140
160
0 5
10
15
20
25
30
35
40
45
50
55
60
65
70
75
80
85
90
95
100
Em
itte
d V
ehic
les
IWA-enabled Ratio (%)
rerouted_yes rerouted_no total

125
Figure 37: Visualizing our simulation in the VSimRTI ITEF using V2I communication on
Google Map [152].
Figure 38 shows a single congested vehicle on Constitution Avenue NW at 100% IWA-
enabled ratio that failed to heed the change route request/reroute directive using V2I

126
communication.
Figure 38: One congested vehicle on Constitution Avenue NW using V2I Communication
[152].
Figure 39 shows the average speed performance at 100% IWA-enabled vehicles while
employing V2I communication [152].

127
Figure 39: Travel Speed against time of 100% IWA-enabled vehicles using V2I
communication [152].
5.2 Vehicle-to-Vehicle (V2V) Communication for Safety and Traffic Efficiency
Figure 41 shows a visualization of our simulation results in the VSimRTI integrated test
and evaluation framework (ITEF) using vehicle-to-vehicle (V2V)/inter-vehicle
communication (IVC) [152]. The overall average best case safety, and traffic efficiency
performances of V2V communication were recorded at 5% incident warning application
(IWA)-equipped vehicles ratio/penetration rate as shown in Figure 40 [a – d]. Conversely,
the mean worst-case safety, and traffic efficiency performances were recorded at 35%
IWA-equipped vehicles enabled ratio. Specifically, with respect to safety (Figure 40 [e
– f]), all vehicles running our IWA made use of them to reroute away from the congested
128
route and this was observed at between 5% to 10% IWA-penetration rates; hence a 100%
safety performance was recorded. The worst-case safety performance was recorded at 35%
IWA penetration rates because only 28 out of a total of 51 IWA-equipped vehicles actually
made use of it to avoid the precarious combination of road accident, icy streets, and fog; as
a result, only about 54.9% safety level was attained. Consequently, our results show that
the use of V2V communication is not desirable in disseminating safety-related/critical
messages where 100% accuracy is demanded with little or no tolerance for errors –
especially above 5 – 10% IWA enabled ratio.
Besides, with respect to traffic efficiency (Figure 40 [a – d]), our results show that on the
one hand, the following average best case improvements were obtained at the most optimal
enabled ratio of 5% incident warning application (IWA)-equipped vehicles as a result of
V2V communication: travel time [TT]: (126.78%) – 2078.8 seconds, average speed
(56.12%) – 59.94 km/h, CO2 (8.05%) – 0.54 g/km, NOx (2.12%) – 0.31g, HC (16.86%) –
0.7g, fuel consumed (8.05%) – 0.21 liters. Fuel consumption and CO2 emission levels gave
the same performance result [141] [140]. On the other hand, the following losses were
recorded/incurred by exacerbating/aggravating the evaluated performance metrics as a
result of V2V communication at the same 5% IWA-equipped vehicles penetration rate:
travel distance [TD]: (0.49%) – 242.26 meters, CO (0.61%) – 0.84g, and PMx (2.22%) –
17.02mg. Whereas our IWA-equipped vehicles took a longer route in order to avoid this
congested scenario as evidenced by their longer travel distances, their travel time (TT) is
quite optimal. Obviously, an inverse relationship exists between average travel speed and
average travel time.
129
Similarly, at 35% IWA-equipped vehicle enabled ratio, on the one hand, the following
average worst-case improvements were recorded: trip/travel time [TT]: (44.14%) –
1123.43 seconds, average speed (30.81%) – 21.2 km/h, CO2 (2.8%) – 0.2g/km, and HC
(6.88%) – 168.92mg. On the other hand, the following average losses were recorded: travel
distance [TD]: (0.27%) – 133 meters, PMx (3.27%) – 21.3mg, CO (1.68%) – 2.35g, and
NOx (0.3%) – 47.36mg. Classic/unequipped vehicles travelled at an average speed of 47.52
km/h from source to destination while IWA supported/equipped vehicles maintained an
average speed of (81.36 km/h). Consequently, because non-equipped/classic vehicles
travelled at lower and less uniform speeds owing to congestion, more fuel was utilized than
with IWA supported vehicles.

130
(b)
48.3
48.35
48.4
48.45
48.5
48.55
48.6
48.65
48.7
0 5
10
15
20
25
30
35
40
45
50
55
60
65
70
75
80
85
90
95
100
Tra
vel
Dis
tan
ce (
km
)
IWA-enabled Ratio (%)
TD_app TD_noapp TD_ref
(a)
0
10
20
30
40
50
60
70
0 5
10
15
20
25
30
35
40
45
50
55
60
65
70
75
80
85
90
95
100
Tra
vel
Tim
e (m
inu
tes)
IWA-enabled Ratio (%)
TT_app TT_noapp TT_ref
Figure 40: Performance of some evaluated metrics in relation to increasing IWA-enabled ratio.
(c)
12.5
13
13.5
14
14.5
15
15.5
16
0 5
10
15
20
25
30
35
40
45
50
55
60
65
70
75
80
85
90
95
100
NO
x-e
mis
sion
s (g
)
IWA-enabled Ratio (%)
NOx_app NOx_noapp NOx_ref
(d)
5.65.8
66.26.46.66.8
77.27.47.67.8
0 5
10
15
20
25
30
35
40
45
50
55
60
65
70
75
80
85
90
95
100
CO
2-e
mis
sion
s (g
/km
)
IWA-enabled Ratio (%)
CO2_app CO2_noapp CO2_ref
(e)
0
20
40
60
80
100
120
0 5
10
15
20
25
30
35
40
45
50
55
60
65
70
75
80
85
90
95
100
Safe
ty R
ate
(%
)
IWA-enabled Ratio (%)
safety_app safety_ref
(f)
0
20
40
60
80
100
120
140
160
0 5
10
15
20
25
30
35
40
45
50
55
60
65
70
75
80
85
90
95
100
Em
itte
d V
ehic
les
IWA-enabled Ratio (%)
rerouted_yes rerouted_no total

131
Figure 41: Visualizing our simulation in the VSimRTI ITEF using V2V communication on
Google Map [152].
Figure 42 shows some congested vehicles on Constitution Avenue NW at 100% IWA-
enabled ratio that failed to heed the change route/reroute request using V2V
communication.

132
Figure 42: Congested vehicles on Constitution Avenue NW using V2V Communication
[152].
Figure 43 shows the average speed performance at 100% IWA-enabled vehicles while
employing V2V communication [152].

133
Figure 43: Travel speed against time of 100% IWA-enabled vehicles using V2V
communication with respect to some evaluated metrics [152].
The overall poor performance (with respect to the evaluated metrics) of V2V
communication is attributable to the fact that not all IWA-equipped vehicles that received
the reroute directive actually heeded them. Possible reasons why these reroute/change route
directives were not heeded by IWA equipped vehicles could be because they got the
message a little bit too late in order to enable them to utilize it to bypass the incident on
time before it became too late. It is also evident that as the penetration rate of IWA
equipped/V2X vehicles increase, the number of vehicles that responded to the change route
request to reroute also increased. This is true because unlike V2I communication which is
primarily single-hop communication, V2V communication relies on multi-hop

134
communication with leading vehicles transmitting messages such as road
conditions/congested states to trailing or following vehicles. In a situation where more
classic vehicles outnumber V2X vehicles, these safety-critical messages may stop midway
as there are not enough relays/equipped vehicles that can convey these messages beyond
their communication range. This is one reason why safety-critical messages are best
disseminated via single-hop (V2I communication) rather than multi-hop (V2V
communication) [12]. Also, because of high V2X message exchanges, especially at high
IWA-equipped vehicles enabled ratio and increased travel speeds (especially in a highway
scenario), packet/message collisions can result in packet/message drops, corruption, and/or
delays sequel to bandwidth saturation, etc. It is also noteworthy that another possible reason
why V2V communication did not perform better as expected could be because of man-
made, and natural interferences. Man-made interferences such as presence of obstacles,
high-rise buildings, etc. and natural interferences such as fogs, heavy rains, tornadoes, etc.,
diminish the efficiency, and effectiveness/accuracy of V2V communications. This is
especially true because V2V communication simulations performed on highway scenarios
tend to produce more effective and predictable results than those done in other rural/city
scenarios because of the frequent interferences from high-rise buildings and other obstacles
that limit/interfere with the V2V multi-hop communication path. This is why, often times,
V2V communication is complemented with V2I communication as a hybrid – hence the
name V2X/V2V2I communication [8]. Besides rerouting vehicles away from the primary
roadway to the secondary/alternative one in order to avoid congestion, our IWA-equipped
vehicles also have prior knowledge of the congested states of these alternative/secondary

135
routes such that vehicles are not blindly rerouted from one congested roadway to another
– this is true when using V2V communication, but not V2I communication [13] [5].
5.3 V2V versus V2I Communications: A Comparison
Respecting traffic efficiency (Figure 44 [a – d]), the following best case performance of
V2I communication over V2V communication was obtained at 35% IWA penetration
rate/enabled ratio with the following improvements: travel time [TT]: (55.2%) – 15.08
minutes, average speed (35.1%) – 38.16km/h, PMx (1.93%) – 0.01g, CO (2.78%) – 0.003
g/km, CO2 (6.1%) – 0.41g/km, NOx (3.68%) – 0.54g, HC (10.66%) – 0.23g, and fuel
consumed (6.1%) – 0.16 liters. On the other hand, the following loss was observed with
respect to V2I communication: travel distance (0.22%) – 0.1 meters.
In the worst case, the following improvements/benefits of V2I communication over V2V
communication were still recorded at 10% IWA-equipped vehicles: travel time [TT]:
(0.0081%) – 0.0022 minutes, speed (0.0081%) – 0.0086km/h, PMx (0.46%) – 0.0029g,
CO (0.5%) – 0.00068g/km, CO2 (0.4%) – 0.026g/km, NOx (0.42%) – 0.064g, HC (0.46%)
– 0.01g, and fuel (0.4%) – 0.01 liters.
With respect to safety (Figure 44 [e – f]), both V2V and V2I communication were equal
with each having a 100% safety rate at 10% IWA-equipped vehicles. In the same vein, a
45.09% V2I communication average best case safety benefit over V2V communication
was obtained at the best IWA-equipped vehicles ratio of 35%. This is so because at 35%
IWA-equipped vehicles, only 23 V2V out of a total of 51 V2Vss vehicles rerouted in
response to the reroute directive. In other words, at 35% IWA-equipped vehicles ratio, all

136
equipped vehicles heeded the change route/reroute directive using V2I communication, but
not all equipped vehicles did same using V2V communication.
Figure 44: Performance of some evaluated metrics in relation to increasing IWA-enabled ratio.
ss
(e)
0
20
40
60
80
100
120
0 5
10
15
20
25
30
35
40
45
50
55
60
65
70
75
80
85
90
95
100
Safe
ty R
ate
(%
)
IWA-enbled Ratio (%)
safety_app.v2v safety_ref safety_app.v2i
(f)
0
20
40
60
80
100
120
140
160
0 5
10
15
20
25
30
35
40
45
50
55
60
65
70
75
80
85
90
95
100
Em
itte
d V
ehic
les
IWA-enabled Ratio (%)
rerouted_yes.v2v rerouted_yes.v2i total_ref
(b)
48.3
48.35
48.4
48.45
48.5
48.55
48.6
48.65
48.7
0 5
10
15
20
25
30
35
40
45
50
55
60
65
70
75
80
85
90
95
100
Tra
vel
Dis
tan
ce (
km
)
IWA-enabled Ratio (%)
TD_app.v2v TD_app.v2i TD_ref
(a)
0
5
10
15
20
25
30
35
40
45
0 5
10
15
20
25
30
35
40
45
50
55
60
65
70
75
80
85
90
95
100
Tra
vel
Tim
e (m
inu
tes)
IWA-enabled Ratio (%)
TT_app.v2v TT_app.v2i TT_ref
(c)
13
13.5
14
14.5
15
15.5
16
0 5
10
15
20
25
30
35
40
45
50
55
60
65
70
75
80
85
90
95
100
NO
x-e
mis
sion
s (g
)
IWA-enabled Ratio (%)
NOx_app.v2v NOx_app.v2i NOx_ref
(d)
5.8
6
6.2
6.4
6.6
6.8
7
7.2
0 5
10
15
20
25
30
35
40
45
50
55
60
65
70
75
80
85
90
95
100
CO
2-e
mis
sion
s (g
/km
)
IWA-enabled Ratio (%)
CO2_app.v2v CO2_app.v2i CO2_ref

137
Overall, with respect to travel time and other evaluated performance metrics, V2I
communication, surprisingly outperformed V2V communication because it showed more
resilience to both external/natural, and man-made interferences resulting in better traffic
efficiency, and safety performances.
These benefits are attributable to the fact that IWA-equipped vehicles avoided the traffic
incident and spent less time on the roads before reaching their final destination (Dulles Toll
Road) although at a greater travel distance. Consequently, the classic vehicles travelled, on
the average, at below half (48 km/h) the average speed of IWA-equipped vehicles (106
km/h). Besides, as aforesaid/alluded to, the following factors affect the amount of power
utilized/the fuel consumption levels of vehicles in transit: air speed, vehicle mass, vehicle
speed, grading of the roadway, and the level of resistance experienced by a vehicle (e.g.
aerodynamic resistance, grade resistance, and rolling resistance), etc. [62]. Another
plausible reason why V2I communication performed as well as it did could also be as a
result of the fact that it uses broadcast or single-hop communication to inform equipped
vehicles of the traffic incident that triggered rerouting. In other words, IWA-equipped
vehicles received the reroute directive within an activation distance of 300m, which was
sufficient enough for them to make the timely decision to bypass the traffic incident on
Constitution Avenue NW. Also, in most research literature/studies, it has been severally
noted that safety/life-critical messages are best disseminated using
V2I/centralized/broadcast/single-hop communication over V2V/decentralized/ad
hoc/multi-hop communication because of the susceptibility of the later to external

138
interferences (natural/man-made) together with the negative effects of message
propagation via flooding/multi-hop communication. Evidently, external interferences
(natural and/or man-made) such as rainfall, high-rise buildings, and other obstacles showed
little or no adverse effects on V2I communication compared to V2V communication.
Nevertheless, in a realistic scenario, however, not all vehicle drivers that receive a
reroute/change route directive actually respond to it. This can be due to several factors such
as the efficiency and effectiveness of the notification mode, driver agility/attentiveness
while driving, together with other internal and external factors, etc. [167].
As aforesaid, the centralized storage of traffic information in an infrastructure-based
probing approach/method/scenario results in more timely and accurate information
exchange to vehicles; however, the timeliness and accuracy of the infrastructure-
less/decentralized probing method/approach is diminished because of the delay/time taken
to disseminate such information to other vehicles using single, and/or multi-hop
communication/propagation [8]. In other words, information dissemination delay is present
in the decentralized approach, but not in the centralized approach – as all the vehicles need
to do is to access it from one central location [8]. Besides, on the one hand, using vehicle-
to-vehicle (V2V) communication is more cost effective than using vehicle-to-infrastructure
(V2I) communication because it eliminates the need for additional infrastructure costs
[168] [82]. On the other hand, infrastructure-based/centralized routing results in an increase
in average trip time when compared to the decentralized approach because of its limited
road monitoring coverage and its inflexibility [8]. In other words, accurate traffic

139
volume/density information depends on the time and location; the accuracy of information
obtained from a roadway depends on the number of road-side units (RSUs)/detectors and
their even distribution [36]. Decentralized/probe-vehicle based dissemination improves
(decreases) average trip time because of route flexibility and more information being
available where traditional RSUs have not yet been installed using V2V or IVC [8] [12].
The efficiency (travel time benefit) of V2I communication diminishes when all vehicles
heed the alternative path/route it suggests because of the lack of the knowledge of the
congested state of the alternative routes owing to V2I communication – this is typical of
traditional/conventional centralized traffic management approaches [82]. However, unlike
V2I communication, V2V communication has foreknowledge on the congested
situation/condition of alternative routes. Its accuracy is heightened when lower speeds,
rather than the conventional travel time method is used for congestion
determination/prediction [82]. Also, in general, lower CO2 emissions and fuel consumption
levels are used by IWA-equipped vehicles that avoided the road traffic congestion on
Constitution Avenue NW. Also, the results produced by both metrics are
synonymous/similar [82].
However, contrary to our results, some authors assert that V2V communication
outperformed V2I communication with respect to traffic efficiency and safety by rerouting
vehicles better [168] [82]. For example, Leontiadis, et al. [8], asserts that decentralized
traffic flow management showed better realistic performance in congestion
avoidance/management than the traditional ones (centralized), where RSUs are used to

140
collect data to a central traffic management center before dissemination to vehicles that
need it to efficiently avoid routing through congested roadways [8]. The overhead in the
exchange of information between vehicles and telecommunication equipment is also
reduced by the decentralized approach [8].
This seemingly contrary result goes to show that the effectiveness of the communication
mode chosen is largely influenced by the type of roadway in question, together with other
external/environmental influences (man-made, and/or natural); and not
necessarily/essentially the communication mode chosen.
6. Remarks
In chapter/section, we addressed the issue of evaluating the safety and traffic efficiency
applications of ITS using real-world dataset. We developed a test-bed based on our real-
world traffic trace data and simulated a traffic incident. Our evaluation results have
conclusively shown that significant benefits can be derivable using V2V communication,
and V2I communication in a realistic environment.
Specifically, using V2I communication – with respect to some of our evaluated metrics –
our results gave: 139.89%, 2.2%, 11.7%, 23.71%, 4.68%, 58.51%, and 11.7%
improvements in travel time (TT), CO, CO2, HC, NOx, average speed, and fuel
consumption at 100% IWA-equipped ratio. In addition, with respect to safety, our data also
showed that below 65% IWA-enabled ratio, 100% safety performance was observed. Our
results clearly demonstrated that tangible improvements, especially with respect to traffic

141
efficiency and safety, were obtained using V2I communication in our realistic simulation
test bed.
Similarly, using V2V communication – with respect to some of our evaluated metrics –
our results gave: 126.78%, 8.05%, 16.86 %, 2.12 %, 56.12 %, and 8.05% improvements in
travel time (TT), CO2, HC, NOx, average speed, and fuel consumption at 5% IWA-
equipped ratio. In addition, with respect to safety, our data also showed that at between 5%
– 10% IWA-enabled ratio, our best case safety performance of 100% safety performance
was observed. Our results clearly demonstrated that tangible improvements, especially
with respect to traffic efficiency and safety, were obtained using V2V communication in
our realistic simulation test bed.
Finally, comparing the performance of V2V communication with V2I communication, our
results show that V2I communication outperformed V2V communication respecting the
evaluation metrics of safety, and traffic efficiency. Specifically, with respect to some of
our evaluated metrics, V2I communication showed the following improvements over V2V
communication: 55.2%, 2.78%, 6.1%, 10.66%, 3.68%, 5.1%, and 6.1% improvements in
travel time (TT), CO, CO2, HC, NOx, average speed, and fuel consumption. With respect
to safety, both V2V and V2I communication were equal with each having a 100% safety
rate at between 5% – 10% IWA equipped vehicles. In the same vein, a 45.09% V2I
communication average best case safety benefit over V2V communication was obtained at
35% IWA enabled ratio because only 23 V2V out of a total of 51 V2I vehicles rerouted in
response to the reroute directive. Our results clearly demonstrated that tangible

142
improvements, especially with respect to traffic efficiency and safety, were obtained using
V2I communication over V2V communication in our realistic simulation test bed.
Summarily, our results concur with existing studies that assert that safety-critical messages
are best disseminated using single-hop communication especially in a complex,
heterogeneous driving environment having a mixture of classic and V2X vehicles in equal
or unequal proportions. As evidently shown by the results, V2X communication, indeed,
results in improved safety, and traffic efficiency; however, these improvements are mostly
dependent on factors which can be man-made (internal), natural (external), or a
combination of both. Overall, as the penetration rate/volume of the incident warning
application (IWA) equipped vehicles increase, performance with respect to travel time
(TT), safety, and other performance metrics also increase [13] [140, 141]. Besides, our
results quantitatively identifies the advantages and disadvantages of the various evaluated
VANET routing architectures with respect to their emission levels/pollution levels, gas and
fuel utilization levels and their overall impact on the environment. Based on our results,
recommendations for ensuring greener transportation can also be ascertained/proffered
respecting the type of VANET architecture chosen; surprisingly, however, V2I
communication performed better than V2V communication with respect to all evaluated
performance metrics contrary to the results/assertions of some authors [8, 9, 41, 52] [12,
53].
.

143

144
Chapter 5
Realistic Traffic Pattern Prediction in Intelligent Transportation System (ITS)
1. Overview
As the saying goes, accurate and timely knowledge is power; this is especially true in real-
time/dynamic, and adaptive congestion amelioration/avoidance in intelligent transportation
system (ITS) leading to improved traffic flow management. Besides, the past is a good
predictor of the future as traffic patterns normally follow a predictable pattern with respect
to time of day, and day of week. Consequently, in this chapter/section, we evaluated the
predictive accuracy, and prediction speed of several supervised machine learning
algorithms (thirteen regression, and twelve classification) respecting traffic volume, and
average speed – towards congestion identification – using six weeks real-world traffic data
from August 1st, 2012 to September 12th, 2012 in the Maryland/Washington DC, and
Virginia area. Our entire dataset consists of six months traffic data pattern from July 2012
to December 2012, of which 6 weeks was used as a representative sample for the purposes
of this study on our reference roadway – I-270 [8, 45, 169].
With respect to regression, regression tree (Rtree) gave the best predictive accuracy with a
root mean-square error (RMSE) of 0.38, and the best prediction speed of 0.15 seconds
amongst all the evaluated regression algorithms. Similarly, with respect to classification,
classification tree (Ctree) gave the best predictive accuracy with an RMSE of zero (0), and
prediction speed/time/efficiency of 0.34 seconds. It is pertinent to note that variations exist

145
respecting prediction accuracy, and prediction speed; hence, a tradeoff is often necessary
respecting the priority/criticality of the application area/domain in question. It is also
imperative to note from the outset that, algorithm design and calibration are important
factors in determining their effectiveness.
2. Motivation
Prior knowledge of future traffic patterns immensely aid in congestion
prevention/avoidance, and control resulting in better traffic flow management, and less
negative environmental impacts [9]. This is true because past and current traffic data are
used to attempt to predict future traffic patterns [4, 8, 45]. Traffic congestion conditions
can be caused by a variety of factors, including natural incidents (e.g., fogs/poor visibility,
rainstorms, adverse weather conditions, etc.), and man-made incidents (e.g., accidents,
drivers behavior, road works/constructions, presence of tolls, etc.), or a combination of
both [11, 34, 53]. Traffic volume/congestion levels vary with time (time-variant), and day
of week (weekdays vs. weekends) as a road that is congested at 9 a.m. may become free an
hour or so later and vice versa [4]; hence they are analyzed differently [11] [5]. Traffic
volume/density, not only, depends on the time, but also on the location/roadway in question
[36]. Higher traffic volumes/densities are mostly recorded during morning and evening
rush hours e.g. 8 a.m. – 10 a.m., and 4 p.m. – 7 p.m. [14, 53, 64]. Traffic volume patterns
also depends on the type of roadway in question because of the differences in traffic
volume, roadway capacity, number of intersections, speed limits, number of red/traffic
lights, etc. between arterial/rural and freeway/highway traffic patterns – as variations exists

146
in the results observed in both types of roadways [8, 54]. Real-time/dynamic, and adaptive
travel time estimation has also been expressed by many drivers as needed; this is because
knowing the real-time current traffic condition(s) greatly influences the drivers choice of
route(s), and departure times [37]. Historical/current travel times obtained from traditional
road-side units (RSUs), automatic vehicle identification (AVI) systems, cell phones, and
other smart mobile devices, etc. are some of the existing methods of predicting travel times;
these methods of travel time prediction become quite unreliable especially in the presence
of congestions/traffic incidents [37].
Spatio-temporal data analysis is important for online/dynamic traffic density and
congestion estimations, etc. because of the constantly changing nature of traffic patterns,
thereby making static traffic data analysis ineffective especially in ensuring safety,
efficiency, and effectiveness in intelligent transportation system (ITS) [12, 13]. Vehicle
occupancy volume patterns also varies by time of day with morning patterns having more
consistent volumes (when many people are on their way to work) than at any other time
(afternoons, or returning from work in the evenings) [64] – this statement also corroborates
with our preliminary results.
Variations in vehicle travel times – especially more than 10km/h below the official speed
limit, and/or for more than 15 consecutive minutes – are very good indications of the
presence of congestion [11] [45] [37]. Besides, congestion is also determined by
comparing/dividing the actual average speed of individual vehicles plying a roadway on a
given time of day with the maximum speed limit of the same roadway. The closer this

147
division is greater than or equal to one (1), the lower the propensity to congestion and vice
versa [4-6, 8, 170]. Congested road points also have high traffic volumes that
influence/tend to lead to the congestion of neighboring road points and vice versa. Without
efficient routing, roads closer to a congested road point are more influenced/impacted
by/prone to congestion than other roads further from it [4, 8].
As previously stated/alluded to, accurate knowledge of the current traffic condition/pattern
is invaluable in congestion avoidance and amelioration. Consequently, in this
chapter/section, we evaluated the prediction accuracy, and speed of several machine
learning algorithms using our real-world traffic data under varying heterogeneous traffic
conditions. In more details, we also:
Evaluated the efficiency, and effectiveness of a taxonomy of thirteen regression,
and twelve classification supervised machine learning algorithms respecting full day traffic
volume pattern prognosis/forecast.
Identified the effect of variation of forecasting window on the prediction accuracy
of algorithms.
Determined the relationship (if any) between congestions, time of day, model fitting
time/speed, prediction speed, and prediction accuracy of algorithms.
Our results provide reliable forecasts/prognosis of future traffic volume patterns, and of the
presence/absence of congestions for reliable decision making – especially with respect to
real-time safety/life-critical scenarios. To the best of our knowledge, using our unique field
data, our work is the first to evaluate the prediction accuracy, and efficiency of a

148
gamut/plethora/taxonomy of supervised machine learning algorithms (both classification,
and regression) respecting time-variant traffic patterns in a heterogeneous driving
environment in the same work. This is true because all our evaluated/reviewed
literature/related works examined only at most three or four algorithms largely because of
the difficulty in writing, and recalibrating/fine-tuning these algorithms to ensure optimum
performance results. Besides, a by-product of our research is the evaluation of different
machine learning models/methods/algorithms with the aim of determining which one is
best suited to more efficient, and accurate traffic pattern prediction and why. Consequently,
our results can be directly used by transportation authorities/agencies, and other concerned
stakeholders road users/operators, and traffic engineers/personnel’s, etc. as a reliable
reference guide/manual to more fully understand the most efficient, and effective
supervised classification, and regression machine learning algorithm in a realistic scenario
especially respecting real-time safety/life-critical applications that have little or no
tolerance for errors/mistakes.
In brief, our results show that with respect to accurate traffic volume pattern prediction
(regression), regression tree (Rtree) gave the best performance respecting prediction speed,
and prediction accuracy. Similarly, classification tree (Ctree) gave the best prediction
accuracy and prediction speed with respect to identifying the presence/absence of
congestions (classification) on our reference highway.
The rest of this chapter is organized as follows: Section 3 presents some background
material and some of the latest research work in our domain respecting the importance,

149
requirements, and challenges of accurate, and timely traffic condition prediction/prognosis,
and Section 4 introduces the various evaluated regression and classification algorithms in
detail. Section 5 presents our experimental setup, and Section 6 examines and elaborates
on the results of our empirical/experimental evaluation. Finally, Section 7 summarizes our
major findings based on our evaluation results.
3. Background
In this section, we provide some background material respecting traffic patterns, review
some of the existing, and most prominent research efforts that have examined the need for
reliable traffic pattern predictions/forecasting towards congestion amelioration in order to
foster better traffic flow management in ITS.
As aforesaid/alluded to, prior knowledge of future traffic patterns immensely aid in
congestion prevention/avoidance, and control resulting in better traffic flow management,
and less negative environmental impacts [9]. Traffic congestion conditions can be caused
by a variety of factors, including natural incidents (e.g., fogs/poor visibility, rainstorms,
adverse weather conditions, etc.), and man-made incidents (e.g., accidents, drivers
behavior, road works/constructions, presence of tolls, etc.), or a combination of both [11,
34, 53]. Traffic volume/congestion levels vary with time (time-variant), and day of week
(weekdays vs. weekends) as a road that is congested at 9 a.m. may become free an hour or
so later and vice versa [4]; hence they are analyzed differently [11] [5] as shown in Figure
45 and Figure 46. Traffic volume/density, not only, depends on the time, but also on the
location/roadway in question [36]. Higher traffic volumes/densities are mostly recorded
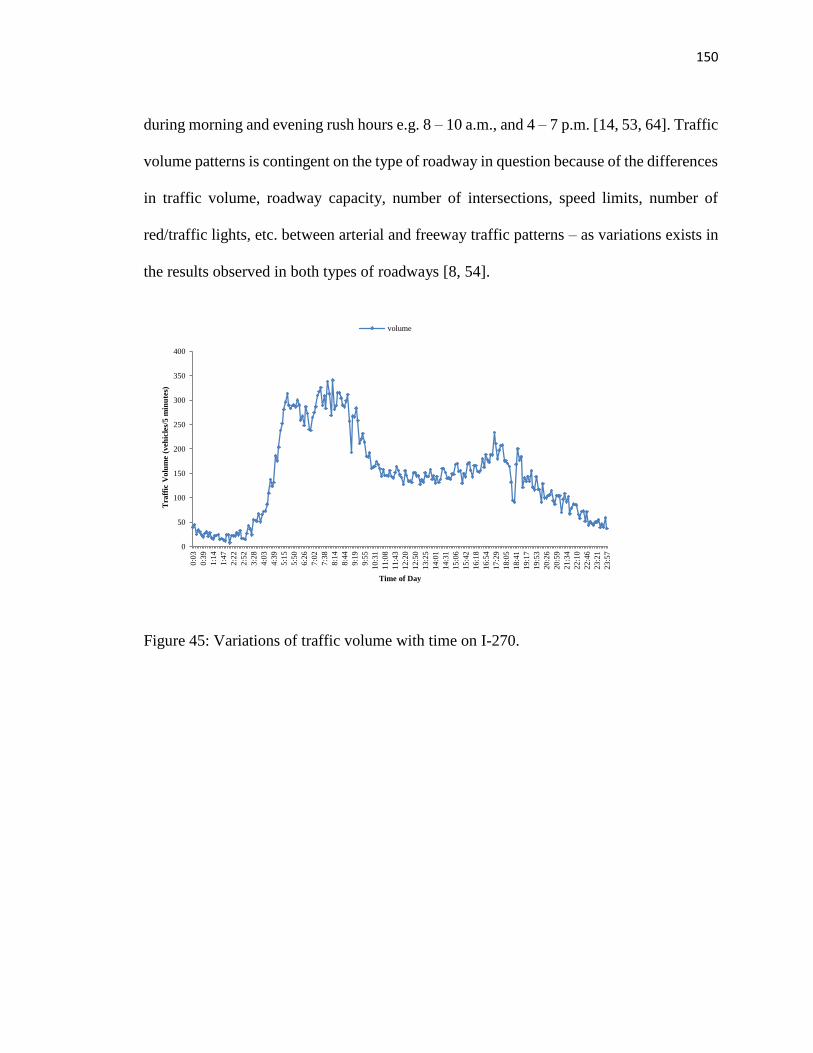
150
during morning and evening rush hours e.g. 8 – 10 a.m., and 4 – 7 p.m. [14, 53, 64]. Traffic
volume patterns is contingent on the type of roadway in question because of the differences
in traffic volume, roadway capacity, number of intersections, speed limits, number of
red/traffic lights, etc. between arterial and freeway traffic patterns – as variations exists in
the results observed in both types of roadways [8, 54].
Figure 45: Variations of traffic volume with time on I-270.
0
50
100
150
200
250
300
350
400
0:0
3
0:3
9
1:1
4
1:4
7
2:2
2
2:5
2
3:2
8
4:0
3
4:3
9
5:1
5
5:5
0
6:2
6
7:0
2
7:3
8
8:1
4
8:4
4
9:1
9
9:5
5
10:3
1
11:0
8
11:4
3
12:2
0
12:5
0
13:2
5
14:0
1
14:3
1
15:0
6
15:4
2
16:1
8
16:5
4
17:2
9
18:0
5
18:4
1
19:1
7
19:5
3
20:2
6
20:5
9
21:3
4
22:1
0
22:4
6
23:2
1
23:5
7
Tra
ffic
Volu
me
(veh
icle
s/5 m
inu
tes)
Time of Day
volume

151
Figure 46: Real-world view of time-variant traffic patterns on I-270.
Past and current traffic data are used to attempt to predict the future traffic patterns [4, 8,
45]. Using an unsupervised technique in cluster analysis, the online nearest neighbor
clustering (NNC) algorithm evaluated by Linda and Manic can dynamically identify
current, and predict future traffic density areas [13]. Spatio-temporal data analysis is
important for online/dynamic traffic density and congestion estimations, etc. because of
the constantly changing nature of traffic patterns, thereby making static traffic data analysis
ineffective especially in ensuring safety, traffic efficiency, and effectiveness in ITS [12,
13]. Vehicle occupancy volume patterns also varies by time of day with morning patterns
having more consistent volumes (when people are on their way to work) than at any other
time (afternoons, or returning from work in the evenings) [64]. This statement corroborates

152
with our preliminary results as shown in Figure 47. According to Junping et al. [171],
combining data from multiple detector sources complement one another thereby ensuring
that better quality traffic data is generated for effective analysis [171].
Figure 47: Variation of vehicle occupancy with time more data recorded in the mornings
than at any other times on our reference roadway – I-270.
Variations in vehicle travel times – especially more than 10km/h below the official speed
limit , and/or more than 15 consecutive minutes – are very good indications of the presence
of congestion [11] [45] [37]. Besides, traffic speed, occupancy, and flow (rates) are mostly
used to determine traffic conditions/patterns relative to congestions [171]. Figure 48 shows
a scenario were the actual speed of vehicles falls below the default speed limit form more
than 15 consecutive minutes on I-270; this is indicative of possible road traffic
0
5
10
15
20
25
30
35
40
0:0
3
0:3
3
1:0
3
1:3
0
1:5
9
2:2
6
2:5
2
3:2
2
3:5
2
4:2
1
4:5
1
5:2
1
5:5
0
6:2
0
6:5
0
7:2
0
7:5
0
8:2
0
8:4
4
9:1
4
9:4
3
10:1
3
10:4
3
11:1
3
11:4
3
12:1
4
12:3
8
13:0
7
13:3
6
14:0
7
14:3
1
15:0
1
15:3
0
16:0
0
16:3
0
16:5
9
17:2
9
17:5
9
18:2
9
18:5
9
19:2
9
19:5
9
20:2
6
20:5
3
21:2
2
21:5
2
22:2
2
22:5
2
23:2
1
23:5
1
Occ
up
an
cy
Time of Day
occupancy

153
congestion/incident. Besides, congestion is also determined by comparing/dividing the
actual average speed limit/travel time of a given roadway with the maximum speed
limit/travel time of individual vehicles plying that road. The closer this division is greater
than or equal to 1, the less the propensity to congestion and vice versa [4-6, 8, 170]. As a
general rule, congested road points have high traffic volumes that influence/tend to lead to
the congestion of neighboring road points and vice versa as shown in Figure 45. As a result,
without efficient routing, roads closer to a congested road point are more
influenced/impacted by/prone to congestion than roads further from it [4, 8].
Figure 48: Actual vehicle speeds falling below the default speed limit – indicative of
possible congestion on I-270.
Several factors affect the prediction accuracy of algorithms. When current traffic
data/information on the status of a link is not available from sensors (maybe because of
0
10
20
30
40
50
60
70
80
90
0:0
3
0:3
9
1:1
4
1:4
7
2:2
2
2:5
2
3:2
8
4:0
3
4:3
9
5:1
5
5:5
0
6:2
6
7:0
2
7:3
8
8:1
4
8:4
4
9:1
9
9:5
5
10:3
1
11:0
8
11:4
3
12:2
0
12:5
0
13:2
5
14:0
1
14:3
1
15:0
6
15:4
2
16:1
8
16:5
4
17:2
9
18:0
5
18:4
1
19:1
7
19:5
3
20:2
6
20:5
9
21:3
4
22:1
0
22:4
6
23:2
1
23:5
7
Tra
vel
Sp
eed
(k
m/h
)
Time of Day
speed speed_limit

154
some type of equipment/device failure, etc.), historical information is used instead [8]. The
performance (with respect to trip time) of traditional static sensors (video cameras,
induction loops, etc.) and distributed VANETs – where each vehicle serves as a node and
dynamically routes traffic based on the information exchanged (speed/velocity, travel time,
and location/position) to, and from other vehicles – was evaluated by Leontiadis et al. [8]
in both real-world and simulation environments with the later performing better. They also
discovered that having 10% or more of misbehaving/faulty nodes is required to negatively
affect (increase) the average trip time as a result of erroneous computations [8]. Besides,
traditional road-side units (RSUs)/sensors tend to over-count/overestimate vehicular traffic
volumes (by counting traffic flow in other adjacent/neighboring lanes), and/or under-
count/underestimate such by less than 10% – leading to erroneous traffic volume
counts/computations [64].
Smart/Cell phones provide a complementary, and less expensive source of traffic volume
information separate from the traditional road side sensors (RSUs) e.g. induction loops,
video cameras, etc. because traditional RSUs have coverage limitations especially when
you consider less busy, and rural roadways [64]. However, used alone, cell phone probe
vehicle traffic volume data is insufficient for real-time traffic volume estimation, for e.g.
in emergency incident response scenarios, but can be used in conjunction with existing
traditional means [64]. Although they produce inconsistent/incomplete data because not all
drivers carry/use, or leave their cell phones on while driving, they can, however,
complement other data sourcing techniques as one more avenue for multi-data

155
sourcing/collection [171]. This is true because traditional RSUs like loop detectors have
high installation and maintenance costs associated with them [171].
In order to obtain more representative, and accurate results, traffic volume measurement
intervals/time has been found to be most effective when set between 5 – 15 minutes.
Erroneous results/fluctuations in traffic volume patterns are introduced when traffic
volume is sampled/measured above, or below this range/interval [64] [4] [45] [11] [54].
Also, 5 – 6 days of repeated/same day historical traffic data proved optimal for a more
accurate prediction; reducing this number introduced errors in aggregation, and increasing
it did affect the results obtained [45]. It is noteworthy that the forecasting window is
inversely proportional to the prediction accuracy of the algorithm i.e. as the forecasting
window increases, the prediction accuracy decreases and vice versa [45]. Besides, other
studies have segmented daily traffic volume patterns into different categories of varying
weekday times (peak and non-peak), and non-weekday/weekend times (morning,
afternoon, and evening) as an aid to efficient, and effective analysis [5].
Travel time prediction is a very popular metric for ascertaining the prediction accuracy of
several artificial intelligence (AI) algorithms. Consequently, using Artificial Neural
Networks (ANNs) and Support Vector Regression (SVR), Yongchang et al. evaluated the
travel time prediction accuracy of these AI schemes given the current travel time, flow and
density of vehicles equipped with vehicle infrastructure integration (VII) [37]. The study
area consist of a total of about 11 miles of freeway traffic with the highest traffic volume
patterns observed between 4:30 p.m. and 6:30 p.m. [37]. Specifically, traffic values, queue

156
length, and travel time are inputs to the simulation setup that was used to generate a total
of 4 weeks traffic data used as training (two weeks), and test sets (the other 2 weeks) – both
randomly selected [37]. The following metrics were used to ascertain the prediction
accuracy of the evaluated algorithms: mean relative error (MRE), standard deviation of
relative error (SRE), root mean square error proportional (RMSEP), and mean absolute
relative error (MARE) [37]. With respect to travel time prediction accuracy, the results
show that vehicle infrastructure integration with Support Vector Regression (VII-SVR)
barely/slightly outperformed that of vehicle infrastructure integration with Artificial
Neural Networks (VII-ANN); both VII-SVR, and VII-ANN, however, outperformed the
instantaneous travel time prediction algorithm used as a baseline. The results also showed
that given 20% of VII-enabled vehicles, while using MARE as performance metrics, VII-
ANN and VII-SVR algorithms showed one of the best results/performances reported in
literature [37]. In addition, both AI schemes showed good performances with irregular
congestion conditions, which is currently a challenge to traditional sensor-based RSUs.
VII-SVR performed better than VII-ANN, and lastly instantaneous algorithm because SVR
is adaptable to both recurrent/normal (uncongested) and non-recurrent (congested) traffic
scenarios because it can use real-time traffic data to make decisions without the need for
training dataset; because of this, VII-SVR, however, seems to overestimate the travel time
[37]. The accuracy of the instantaneous algorithm/model diminishes because of its
assumption that travel time remains unchanged over short time intervals (with or without
congestion present) – this is, however, not true especially in congested conditions.
Although this study utilized real-world traffic data of the Greenville, SC highway/freeway

157
network [37], a limitation of this study is that it only considered morning traffic patterns
rather than a more comprehensive view of whole day traffic patterns [37].
From our extensive review of literature, it is lucidly evident that there is need for more
comprehensive evaluation of more whole day – as most studies evaluated utilized less than
whole day intervals/durations – supervised machine learning algorithms (both
classification and regression) i.e. a taxonomy using real-world traffic data and real-world
road networks in a heterogeneous driving environment for both traditional transportation,
and intelligent transportation systems (ITS). To this end, in this chapter, we endeavor to
fill this gap.
4. A Taxonomy of Machine Learning Algorithms
In this section, we present an overview of the types of machine learning algorithms together
with a detailed exposition of the supervised (classification, and regression) machine
learning algorithms evaluated in this chapter.
1.1 Machine Learning Overview
The various types of machine learning algorithms can be classified under two major/broad
nomenclature/headings: supervised learning algorithms, and unsupervised learning
algorithms. These two machine learning algorithms are further divided into various
categories as depicted in Figure 49.

158
Unsupervised Learning
Clustering
Classification
Regression
Supervised Learning
Machine Learning
No training data
Uses training data
Produces categorical output
Produces categorical output
Produces numeric output
Figure 49: Machine learning overview [172]. 3,4
1.2 Unsupervised Learning
Unsupervised machine learning uses only input data to group and interpret data [172].
Examples of unsupervised machine learning algorithms include: hidden markov models,
self-organizing maps, k-Means clustering, hierarchical clustering, and Gaussian mixture
models [172]. For example, cluster analysis – an unsupervised machine learning
algorithm/technique – is used in the data exploration stage in order to discover hidden
3 http://www.financialit.net/blog/get-smart---the-financial-services-industry-embraces-machine-learning/183 4 https://machinelearningmastery.com/applied-machine-learning-process/

159
patterns (feature/attribute relationships) or groupings (clusters) in data in order to
improve/aid data analysis/interpretation/understanding [172].
1.3 Supervised Learning
As the name suggests, supervised learning, in contrast to unsupervised learning, takes
known data, and known responses (serving as a teacher) as input and produces a model as
output. This model is now used with new/unknown data to ascertain the accuracy of the
model based on its predicted responses/targets as shown in
Figure 51. In other words, supervised machine learning uses both input and output data to
produce predictive models [172] [172] [169] [71]. It is important to note from the outset
that, algorithm design and calibration are important factors in determining their
effectiveness. Supervised learning algorithms can be classified into two major categories:
classification, and regression.

160
Known Data
Model
Known Responses
New Data
Predicted Responses
Figure 50: An illustration of the supervised learning process5 [172] [173].
1.3.1 Supervised Learning Classification
Classification is used for discrete/categorical response values derivable/present in data; in
other words, it only applies to nominal, and not ordinal responses. Nominal responses can
be binary responses (consists of only two responses), or polytomous responses (consists of
more than two responses) [173]. In other words, these nominal responses must have limited
values/possibilities such as ‘True’ versus ‘False’ [172].
5 http://www.mathworks.com/help/stats/supervised-learning-machine-learning-workflow-and-algorithms.html

161
1.3.2 Supervised Learning Regression
Regression is used for indiscrete/continuous response values. Regression is particularly
suited for real number responses such as speed of a vehicle in km/h i.e. it is the process of
fitting models with numerical responses [172] [173] e.g. Nonlinear regression model,
multivariate regression, mixed effects models, nonlinear mixed-effect models,
regularization, multiple linear regression with multiple predictor variables, and model
assessment for plotting and diagnostic statistics, etc. are some examples of regression
algorithms/applications [172] [172] [174].
1.3.3 Supervised Learning Steps
The following steps make up the supervised learning design steps/process as shown in
Figure 51: (1) Data preparation, (2) Algorithm selection: The performance of algorithms
are usually evaluated based on the following features/criteria: training speed; amount of
memory used; accuracy of fittings, and predictions on network data; and ease of
interpretation of justifications/reasons for prediction results [173], (3) Model fittings
selection, (4) Validation method selection: Resubstitution, out-of-bag, and cross-validation
errors are the three prominent ways of evaluating the accuracy of a fitted model [173]. (5)
Fit model until desired accuracy level: You can change a validated model with a
new/improved one in order to ensure/enhance improvements such as: reduced memory

162
usage/footprint, improve speed, and obtain more accurate predictions, etc. [173] (6) Use
fitted model for subsequent predictions [172] [173] [175].

163
Prepare Data
Start
End
Satisfied?
Fit/Train Model
Fitted/Trained Model
Collect Data
Model Predictions
Yes
No
Increase Data?
Improve Accuracy?
Change Algorithm?
Validate/Test Model
Use Model
Select AlgorithmConfigure Algorithm
No
Yes
Yes
Yes
No
Known Responses
No
Unknown Responses
Figure 51: Supervised learning design steps [172] [173].
164
1.4 Regression Algorithms
In this chapter, the following regression algorithms were evaluated in order to
determine/forecast/prognosticate the traffic volume pattern on our selected/reference
roadway (I-270) [175] [172].
1.4.1 Regression Ensemble (Boosted and Bagged Decision Trees)
Both boosted decision tree, and bagged decision tree are regression ensembles/non-linear
regression models having a variety of visualization capabilities. We used the regression
ensemble to predict the traffic volume on I-270 given the speed, occupancy, time, and
quality measures [173]. A disadvantage/downside of using ensembles is that they tend to
overtrain [173].
1.4.2 Linear Regression
Linear regression is a parametric regression technique, while regression trees is an example
of a non-parametric regression technique [172]. Regression models display the
relationship between dependent/response variable (Y), and
independent/predictor/explanatory variable(s) (X) [173]. Linear and nonlinear regression
techniques are particularly used when the model structure is known beforehand. A linear
model assumes a linear/direct relationship/dependence of features/predictors [176].
1.4.3 Stepwise Regression

165
Stepwise regression does multiple linear regression using fewer/a subset of predictors as
compared to linear regression. This allows you to determine the optimal/most relevant
number of predictors that can be used to attain the best prediction accuracy/precision at
minimal overhead [172] [173] [177].
1.4.4 Robust Regression
This algorithm is, primarily, used to reduce the effects of outliers. Unlike the
ordinary/standard least square fit, RobustOpts produces a model that is resistant to outlier
effects in the data i.e. its model is less sensitive to major/huge changes in minute parts of a
dataset [178].
1.4.5 Neural Networks
The MATLAB neural network toolbox supports both supervised, and unsupervised
learning. Supervised learning is made possible with dynamic radial basis and feed-forward
networks; unsupervised learning is made possible with competitive layers, and self-
organizing maps (SOMs) [169]. The neural network toolbox can be used in the following
application domains/tasks: fitting data/functions, pattern recognition, dynamic system
monitoring and control, and clustering [169].
1.4.5.1 Applications
Some of the industrial/business application areas were neural network toolbox has been
utilized include, but is not limited to: transportation, securities, medicine, oil and gas,
robotics, insurance, finance, banking, automotive, manufacturing, and defense, etc. [169].

166
1.4.5.2 Design Steps
The seven neural network design steps/workflow are: data collection, network creation,
network configuration, weights and biases initialization, network training, network
validation, and network utilization [169] [179].
1.4.5.3 Neural Network Fitting
The neural network fitting tool is a non-linear regression model used for estimating future
values given present values [169]. The fitting function consist of two-layer feed-forward
network [169]. The Levenberg-Marquadt training algorithm (trainlm) was used in our
scenario; other training algorithms that can be used to improve accuracy with support for
large, and noisy datasets include the Bayesian Regularization (trainbr), and Scaled
Conjugate Gradient (trainscg) training algorithms [169]. In the study by Yongchang et al.
[37], multilayer feedforward (MLF) neural network with back propagation was used for
vehicle infrastructure integration with Artificial Neural Networks (VII-ANN) development
with the following parameters: learning rate (0.01), input layer (1), hidden layer (2), and
output layer (1) [37]. Increasing the number of hidden neurons, training vectors, input
values, and varying the initial weights and biases of the network followed by subsequent
retraining are some of the steps that can be employed in order to improve the accuracy of
predicted results (outputs, or targets/feedback) [169]. Retraining a neural network several
times can also be used to, conclusively, determine/establish the accuracy of the model and
its predictions [169].

167
Figure 52: Regression plots for training, validation, test, and composite of all using neural
network fitting regression tool in Matlab [169].
1.4.5.4 Neural Network Time Series
Dynamic neural networks are particularly suited for time series prediction [169]. Neural
network time series prediction and modeling are especially suited for highly nonlinear

168
systems [169]. Predicting the future value of bonds, stocks, and the future condition of a
new engine installation/equipment, etc. are some of the many areas/domains where time
series predictions are requisite [169]. In order to predict future traffic volume given
past/historical data, the nonlinear autoregressive with exogenous (external) input (NARX)
time series prediction problem was used in this dissertation research because of its better
prediction accuracy resulting from its use of additional information from input data [169].
The standard/typical NARX network is a two-layer feed-forward network which consists
of a hidden layer with a sigmoid transfer function, and an output layer with a linear transfer
function [169]. A default of 10 hidden neurons, and a value of 4 delays (updated from its
default of 2 in order to obtain more accurate predictions) was used for training as shown in
Figure 53 [169]. The Levenberg-Marquardt training algorithm was also used [169]; the
computations of the R values, training, validation, and testing steps were done using open
loop/series-parallel architecture [169]. To improve the network performance after training,
the value of the hidden neurons and/or delays can also be edited [169]. Overfitting occurs
when training set performance is much better than test set performance; it can be
ameliorated by reducing the number of neurons used in training – the opposite is also true
[169]. On the one hand, overfitting, and more computations are the results of excessively
increasing the number of neurons and delays. On the other hand, however, increasing the
number of neurons, and delays enables the network to solve more complex/complicated
problems more efficiently – hence a balance is imperative [169].

169
Figure 53: Adjusting the network architecture parameters to improve prediction accuracy
using the neural network time series regression tool in Matlab [169].
1.5 Classification Algorithms
The following classification/regression algorithms were also evaluated to
determine/prognosticate the presence/absence of possible roadway congestion on our
reference roadway (I-270).

170
1.5.1 Discriminant Analysis
This is a classification method where different classes produce data that is based on
different Gaussian distributions [173]. Discriminant analysis is an example of a parametric
method, while classification and regression trees are examples of nonparametric methods
[173]. Another name for linear discriminant analysis is Fisher discriminant analysis [173]
[180].
1.5.2 Naïve Bayes
It is mainly used when the features of a class are independent of one another; however,
they can also be used when the features are dependent [173]. It is used to predict/estimate
the probability/probability density of a test sets features given the training data as class
[180] [181] [179]. Naïve Bayes classification gives more accurate classifications than other
classifiers while using less training data to determine the optimal features required for more
accurate predictions because of its class independence characteristics. Because of this, it is
particularly suited for datasets with many predictors/features [173]. Different distributions
such as kernel, Gaussian (normal), multinomial, and multivariate multinomial
distributions, etc. can be used with/is supported by the Naïve Bayes classification object
[173]; using kernel distributions and large datasets, the Naïve Bayes prediction speed and
memory usage levels suffers adversely as opposed to using simple distribution [175] [172].
It can be used for both classification and regression.

171
1.5.3 K-Nearest Neighbor (KNN)
Nearest neighbor classifies new data points using the training set; it can be used to
find/search for the K-nearest/closest point to another point. It has some of its
applications/uses in bioinformatics, computer vision, and analysis of marketing data [173].
It supports several distance metrics such as: correlation, hamming, mahalonobis,
Euclidean, and any custom distance metric that can be created by the user [180] [176].
Using nearest neighbor with high dimensional data diminishes its prediction accuracy in
contrast to using it with low dimensional data. When used for/applied to kd-trees, fitting is
done by nearest neighbor in contrast to when used for/applied to linear search [175] [172].
It can be used for both classification and regression; in other words, it can be used for
either categorical, or continuous predictors/features at any one time, but not both [175]
[172] – with the resubstitution loss giving the percentage of data that are/can be
misclassified based on the prediction results of an algorithm [173] [182].
1.5.4 Decision Trees
Decision Trees are of two types: classification trees – give nominal/discrete/categorical
responses e.g. true versus false (i.e. it supports categorical predictors) [175] [172], and
regression trees – give numeric/continuous responses e.g. traffic volume patterns on a
given roadway overtime. They can be used to forecast/prognosticate/predict responses to
data by traversing from the root/source node to the leaf nodes where the responses are
located/situated [180] [173] [182].

172
1.5.5 RobustBoost
Even with the presence of noise in the training data, RobustBoost still produces good
classification prediction results. Like many other algorithms, tuning the RobustBoost
algorithm will ensure that its predictive accuracy is further improved [173].
1.5.6 Bagging/Bootstrap Aggregation
This is a type of ensemble learning that trains learners using data that has been resampled;
it can be used for both classification and regression [173]. With respect to classification, it
can be used for creating a classification ensemble using bagged decision tree or bootstrap
aggregation; you can also create a classification ensemble using LSBOOST. Bagging is
important because, using it, you get to know the best predictor that has the most influence
on the response/target [173] [176].
1.5.7 Support Vector Machines (SVM)
SVM is used when your data consist of exactly two classes that can be separated in order
to obtain the best hyperplane i.e. the one with the greatest margin between the two classes;
it can be used for both binary classification, and regression. It gives better memory usage
and prediction efficiency/speed results when used with few support vectors as opposed to
many support vectors. Although the default linear function used by SVM makes it easier
to interpret how data classifications are done, using a kernel function instead makes this
interpretation much more difficult [175] [172]. Like with other algorithms,

173
selecting/determining the optimal parameters for the SVM algorithm is a very important
step to its effectiveness [37] [172] [173] [183] [182] [176] [71].
1.5.8 Artificial Neural Network (ANN)
Artificial neural network supports both supervised learning (using dynamic, feed-forward,
and radial basis networks), and unsupervised learning (using competitive layers and self-
organizing maps [SOMs]); it also supports classification and regression algorithms [180]
[183].
1.5.8.1 Neural Network Pattern Recognition
Neural network pattern recognition can only be used for classification problems. Neural
networks can be used for pattern identification, and classification/association such as
classifying a tumor as either of two targets: benign or malignant [169]. Simply put,
respecting pattern recognition problems, neural networks are used to classify inputs into
corresponding finite categories of targets/target categories [169]. In this research, 10
hidden neurons, and two output neurons/target categories, or elements were used [169].
The network training in order to classify inputs to corresponding targets was done using
scaled conjugate gradient backpropagation. It is important to note that neural network
fitting, and time series can be used for both classification and regression problems [169]
[179].

174
1.5.9 Ensemble Learning – TreeBagger
Treebagger can be used for both classification and regression predictions. Using bagging
(which stands for bootstrap aggregation ensemble technique), several weak learners are
aggregated to produce a strong learner [180].
1.5.10 Generalized Linear Model
The generalized linear model is a special type of nonlinear models that employs linear
methods [173]. The distribution of the generalized linear model’s response can be
binomial, Poisson, gamma, inverse Gaussian, and normal distributions. It can be used for
both classification, and regression [180] [184] [185] [186] [187] [188] [189] [190] [191]
[192] [193] [194] [195] [196] [197] [198] [199] [200] [201].
1.6 Evaluating Performance
Some of the several performance measures, and plots/graphs that have been used to
ascertain the predictive accuracy of machine learning algorithms include, but are not
limited to:
1.6.1 Residuals
Residuals are used to estimate the quality of a model produced by training data, and
subsequently used for testing data. In order to discover correlations, outliers, or errors in a
model or data, a histogram plot, and probability plots can be used [173]. The closer the
value of the residuals is to zero, the better the prediction accuracy of an algorithm and vice
versa. In other words,

175
Errors/residuals = target – output
1.6.2 Mean-Square Error (MSE)
The mean-square error (MSE) is defined as the average/mean squared difference between
output vectors and target vectors. The lower the MSE, the better the performance of an
algorithm/lower the prediction/forecasting errors. Therefore, a MSE of zero means that no
errors were produced [169]. Also, the MSE is roughly the square root of the resubstitution
error [173].
1.6.3 Root Mean Squared Error (RMSE)
The root mean square error (RMSE) shows the standard deviation of the error distribution.
It is the square root of the mean-squared error (MSE). Consequently, like the MSE, the
lower this number, the better the predictive accuracy of an algorithm [173] [183] [176]
[202] [203] [179].
As earlier stated: 𝐸𝑟𝑟𝑜𝑟𝑠/𝑟𝑒𝑠𝑖𝑑𝑢𝑎𝑙𝑠 = ∑ [𝑡𝑎𝑟𝑔𝑒𝑡 − 𝑜𝑢𝑡𝑝𝑢𝑡] 𝑛
𝑘=0
𝑋 = ∑𝑅𝑒𝑠𝑖𝑑𝑢𝑎𝑙𝑠
𝑇𝑜𝑡𝑎𝑙 𝑛𝑢𝑚𝑏𝑒𝑟 𝑜𝑓 𝑠𝑎𝑚𝑝𝑙𝑒𝑠
𝑛
𝑘=0
MSE = X2
RMSE = √𝑀𝑆𝐸

176
1.6.4 Regression Value (R Value)
R-squared (coefficient of determination), and adjusted R-squared (adjusted coefficient of
determination) shows the predictive accuracy of a model with respect to a new
response/target variable. The regression plot (plotregression) is a linear plot between the
network outputs and intended targets/responses [169]; like the error histogram plot, the
regression plot is used to validate/ascertain network performance [169]. Its value
determines whether any relationship exists between outputs and targets. If R=1, a close
relationship exists; if R=0, a random relationship exist [169].For example, an R value of
0.752 means that a model has an accuracy of about 75% in predicting a new test
set/response data [173] [178]. In other words, the closer the regression (R) value of a
regression plot is to one (1), e.g. 0.93, the better the performance and vice versa. A perfect
fit is obtained when all the network outputs and targets lie along the 45 degree line of the
regression plot i.e. R = 1[169] [172].
1.6.5 Confusion Matrix
Confusion matrices can be used to evaluate the performance of trained network models
such as a trained pattern recognition network model [169].
Confusion matrix, C, is defined thus = TP FN
FP TN
Where TP = True positive value/number of true positives, TN = Number of true negatives,
FN = Number of false negatives, and FP = Number of false positives. Respecting confusion
177
matrices, any value above or below/outside its diagonal (highlighted in red) is misclassified
[173] [182]. Other metrics derivable from the confusion matrix include, but are not limited
to: Positive predictive value (PPV) = TP/(TP + FP) [173]; Positive instances, P = TP + FN
(i.e. the horizontal/row of the confusion matrix) [173]; Negative instances, N = FP + TN,
etc. [173] [204] [71]. These and other metrics were used to evaluate the predictive accuracy
and prediction speed of our evaluated algorithms are further elaborated upon in Appendix
B.
1.6.6 Receiver Operating Characteristics (ROC)
The Receiver Operating Characteristic (ROC) curve can be used to evaluate the
performance of a classification ensemble [180]. It is a plot of true positive (TP) rate
(sensitivity) versus false positive (FP) rate (1 – specificity) at different classification
outputs. With respect to the ROC curve, the higher this curve is towards the upper left hand
corner of the true positive rate (sensitivity) axis i.e. heading towards 100% sensitivity, and
specificity respectively, the better/greater the accuracy/performance [169] [169] [173]
[183] [181] [179].
1.6.7 Additional Metrics and Plots
Other metrics/plots that can be used to evaluate the performance of algorithms include, but
are not limited to: Percent Error (%E) shows the misclassified samples; a value of 0 (zero)
means no/zero misclassifications while a value of 100 means maximum/complete
misclassifications [169]. The performance plot (plotperf) shows the plots of the training,
test, and validation errors [169]. The Error Autocorrelation plot, besides other plots, can

178
be used to validate network performance; it shows the relationship between prediction
errors over time. A perfect prediction model has only one nonzero value at zero lag – this
represents the mean-squared error (MSE) [169]. The input-error cross-correlation
function/plot shows the relationship between errors and input sequences. A perfect
prediction model has all correlations equal to zero; prediction accuracy can be improved if
correlations exist between the input and the error [169]. Perfcurve, cross-entropy,
classification error, or exponential loss are some other additional means of ascertaining
the predictive accuracy (performance) of a classifier on test data after training [173] [169]
[169] [173] [183] [181] [179].
In summary, confusion matrices, regression plots, and receiver operating characteristics
(ROC) curves, plus other performance metrics/plots employed for training, testing, and
validation – together with a combination of all three can be used to ascertain/validate the
predictive performance/quality of network outputs relative to targets [169] [173] [183]
[181] [179].
2. Main Contributions: Experimental Setup
In this section, we describe our experimental setup, real-world dataset, evaluation scenarios
towards to attainment of our research goals and objectives, and the performance metrics
used for evaluating our results.

179
2.1 Experimental Equipment
In seeking to determine the efficiency, and effectiveness of several supervised machine
learning algorithms, we used the same equipment, and machine configuration used for our
test-bed setup in earlier sections i.e. Chapter 3, Section 5.1.
2.2 Real-world Dataset
As shown in Table 1, and Table 2 (Chapter 3, Section 5.2), with respect to classification
and regression using neural networks, our dataset consists of 1330 samples with five
features/predictors as input vectors namely: zone_id, speed, date/time, occupancy, and
quality, and one target vector element – congested – with two possible
categories/outcomes: yes = 1 (for speed less than the default speed limit of the roadway –
65km/h – indicating the presence of congestion on the roadway [I-270]), or no = 0 (for
speed greater than or equal to 65km/h – indicating the absence of congestion on I-270) as
shown in Figure 62 and Figure 64 respectively i.e. with respect to classification. Similarly,
traffic volume pattern is used as the sole target vector respecting regression [169] [205]
[206] [207] [208] [179] [209]. Figure 54 show a pictorial representation of our dataset in
Google Maps with our reference roadway (I-270) highlighted.

180
Figure 54: Selected study area with reference roadway (I-270) highlighted.
Out of the entire 1330 input samples/timesteps, 900 samples (70%), 200 samples (15%),
and 200 samples (15%) were used for training, validation, and testing respectively [169]
[169].
2.3 Evaluation Scenarios and Evaluation Metrics
Using our training set with five predictors as shown in Table 2, the performance of several
machine learning algorithms/techniques was evaluated and visualized. After training our 6
weeks traffic dataset (predictors) from August 1st, 2012 to September 12th, 2012, we
compared it with one week test set (response) i.e. September 19th, 2012, in order to obtain

181
a predicted result/output. This predicted result was then compared/validated with the
actual/target values in order to determine the prediction accuracy, and prediction speed of
the machine learning algorithm/technique used [180].
The following scenarios were used in our performance evaluation:
2.4 Scenario A (Prediction Accuracy)
In this chapter, we determine the predictive accuracy of our algorithms, primarily, with
respect to their root mean-square error (RMSE) values. As previously noted, the lower the
RMSE value, the better its predictive accuracy, and vice versa. Regression (R), mean-
square error (MSE), and confusion matrix values are some of the other prominent metrics
used to determine the predictive accuracy of our algorithms.
2.5 Scenario B (Prediction Efficiency)
We determine the prediction speed of our algorithms respecting the total time (in seconds)
taken to fit the model with training data in addition to testing the accuracy of the models
output with new test data.
As earlier stated, the performance of algorithms can also be evaluated based on a number
of other different factors/metrics such as: fitting speed, level of memory consumption, and
ease of interpretation of results, etc. [173].

182
2.6 Evaluated Algorithms
The following taxonomy of classification, and regression supervised machine learning
algorithms were evaluated in this research.
2.6.1 Classification Taxonomy
The following are the list of supervised machine learning classification algorithms
evaluated in this research with respect to prediction accuracy, and prediction speed: Neural
network pattern recognition (NN_p.reg), Neural network time series (NN_time), Neural
network fitting (NN_fit), Naïve bayes (NB), Classification decision tree (Ctree),
Discriminant analysis (DA), Support vector machine (SVM), K-nearest neighbors (KNN),
Generalized linear model (GLM), Treebagger (TB), Classification ensemble using
boosting (LSBOOST), and Classification ensemble using bagging/bootstrap
aggregation/bagged decision tree (BAG) [172] [181].
2.6.2 Regression Taxonomy
In the same vein, the following supervised machine learning regression algorithms were
also evaluated with respect to prediction accuracy, and speed/time: Regression decision
trees (Rtree), Treebagger regression (TB.R), Generalized linear regression model
(GLM.R), Stepwise generalized linear regression model (GLM.S), Linear regression (LR),
Stepwise linear regression (SLR), Robust linear regression (RLR), Boosted decision tree
(BDT), Bagged decision tree (BGDT), K-nearest neighbor regression (KNN.R), Naïve

183
bayes regression (NB.R), Neural network fitting regression (NN_fit.R), and Neural
network time series (NN_time.R) [172] [176].
3. Evaluation Results and Discussion
In this section, we present and critically analyze the results of our experiments using the
predictive accuracy, and prediction speed of the evaluated algorithms as primary evaluation
criteria.
3.1 Regression Results
3.1.1 Predictive Accuracy
As earlier stated, the root mean-square error (RMSE) value was used in ascertaining the
prediction accuracy of the evaluated algorithms with respect to traffic volume patterns on
I-270. Accordingly, from Figure 56, the predictive accuracy of the machine learning
algorithms we evaluated are listed in descending order from most accurate to least accurate
with their corresponding RMS errors: Regression tree [Rtree]: 0.39, Boosted decision tree
[BDT]: 1.97, Stepwise generalized linear model [GLM.S]: 2.27, Bagged decision tree
[BGDT]: 2.51, Naïve bayes regression [NB.R]: 2.76, Stepwise linear regression [SLR]:
4.42, Neural network fitting regression [NN_fit.R]: 6.06, Linear regression [LR]: 7.51,
Generalized linear model regression [GLM.R]: 7.51, Robust linear regression [RLR]:
11.24, K-nearest neighbor regression [KNN.R]: 11.73, Neural network time series
regression [NN_time.R]: 20.20, and Treebagger regression [TB.R]: 38.39.

184
3.1.2 Prediction Speed
Similarly, from Figure 57, with respect to prediction speed, the following gives the
performance of our evaluated algorithms from most efficient (left) to least efficient (right)
– in descending order – with their corresponding prediction time (in seconds): Regression
tree [Rtree]: 0.15, Naïve bayes regression [NB.R]: 0.28, Linear regression [LR]: 0.42,
Robust linear regression [RLR]: 0.58, Generalized linear model regression [GLM.R]: 0.58,
K-nearest neighbor [KNN.R]: 0.71, Treebagger regression [TB.R]: 0.93, Stepwise linear
regression [SLR]: 1.02, Boosted decision tree [BDT]: 1.25, Bagged decision tree [BGDT]:
1.50, Neural network fitting regression [NN_fit.R]: 2.06, Stepwise generalized linear
model regression [GLM.S]: 2.82, and Neural network time series [NN_time.R]: 4.12.
Overall, respecting both predictive accuracy (Figure 56), and prediction speed (Figure 57),
Regression tree [Rtree] gave the best prediction accuracy, and prediction speed/efficiency,
while Treebagger regression [TB.R], and Neural network time series [NN_time.R] gave
the worst prediction accuracy, and prediction speed/efficiency.
Figure 55 shows the actual whole day traffic volume pattern recorded on I-270 on
September 19th, 2012 in relation to similar patterns forecasted by our regression algorithms.
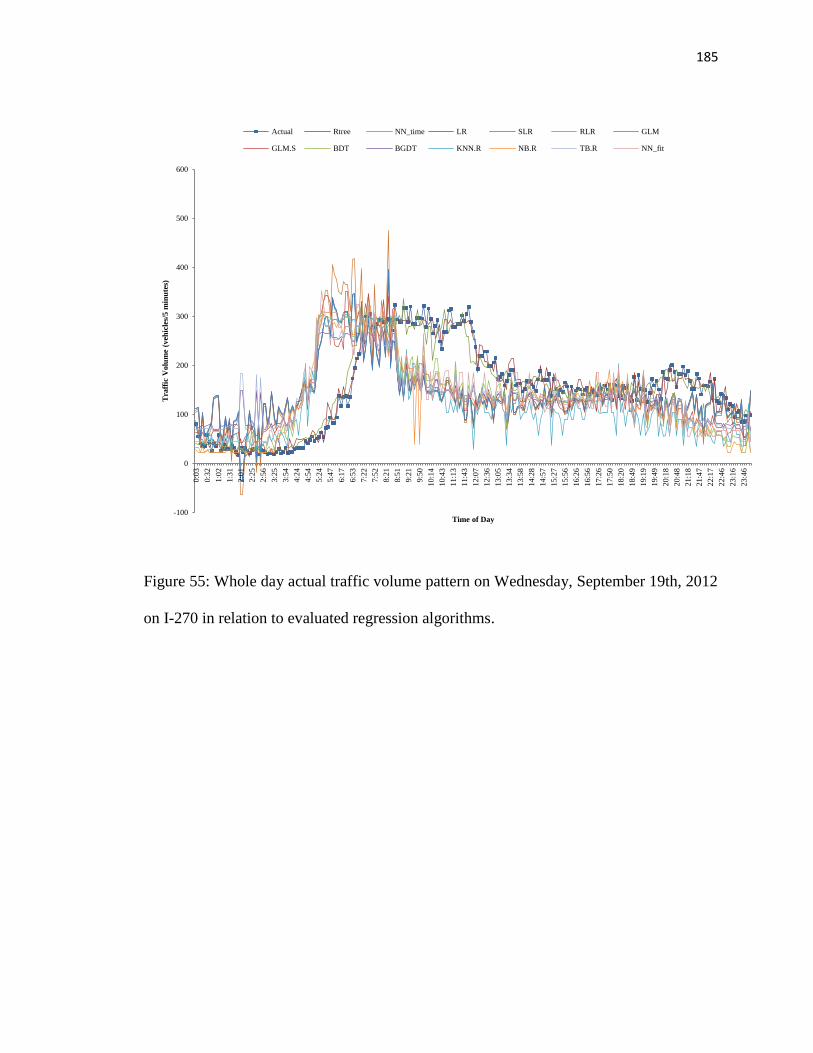
185
Figure 55: Whole day actual traffic volume pattern on Wednesday, September 19th, 2012
on I-270 in relation to evaluated regression algorithms.
-100
0
100
200
300
400
500
600
0:0
3
0:3
2
1:0
2
1:3
1
2:0
1
2:2
5
2:5
6
3:2
5
3:5
4
4:2
4
4:5
4
5:2
4
5:4
7
6:1
7
6:5
3
7:2
2
7:5
2
8:2
1
8:5
1
9:2
1
9:5
0
10:1
4
10:4
3
11:1
3
11:4
3
12:0
7
12:3
6
13:0
5
13:3
4
13:5
8
14:2
8
14:5
7
15:2
7
15:5
6
16:2
6
16:5
6
17:2
6
17:5
0
18:2
0
18:4
9
19:1
9
19:4
9
20:1
8
20:4
8
21:1
8
21:4
7
22:1
7
22:4
6
23:1
6
23:4
6
Tra
ffic
Volu
me
(veh
icle
s/5 m
inu
tes)
Time of Day
Actual Rtree NN_time LR SLR RLR GLM
GLM.S BDT BGDT KNN.R NB.R TB.R NN_fit

186
Figure 56: Predictive accuracy of supervised machine learning regression algorithms as a
function of the root mean-square error (RMSE).
Figure 57: Prediction speed (efficiency) of supervised machine learning algorithms as a
function of the prediction time in seconds.
Figure 58 shows the performance of our evaluated regression algorithms relative to their
R-values. As previously noted, the closer the R-value is to one (1), the better the predictive
accuracy of the algorithm and vice versa. Consequently, from Figure 58, naïve bayes
regression (NB.R) algorithm gave the best prediction accuracy, while stepwise linear
regression (SLR) algorithm gave the worst recorded performance. The superior
05
1015202530354045
RM
SE
Regression Algorithms
RMSE
0
0.51
1.52
2.53
3.5
44.5
Tim
e (s
econ
ds)
Regression Algorithms
Prediction_time Fitting_time

187
performance of naïve bayes regression (NB.R) could be attributable to the fact that, as
previously stated, algorithms such as Bayes tends to show more resilience/better
performance as the number of faulty nodes increase because its computations are based on
averaging sample values such that more accurate approximations/predictions can be made
[8]. Besides, Naïve Bayes classification gives more accurate classifications than other
classifiers while using less training data to determine the optimal features required for more
accurate predictions because of its class independence characteristics. Because of this, it is
particularly suited for datasets with many predictors/features [173]. However, as
aforementioned, when using kernel distributions and large datasets, the Naïve Bayes
prediction speed and memory usage levels suffers adversely as opposed to using simple
distribution [175] [172].
In another reference study [175] [172] of much fewer supervised learning algorithms, the
authors assigned a high predictive accuracy to Support Vector Machine (SVM) over Trees
(classification and/or regression trees), and Naïve Bayes – which both received a medium
predictive accuracy [175] [172]. In the same vein, respecting prediction speed, both Trees
(classification and/or regression trees) had a fast prediction speed over Nearest Neighbor –
which received a medium prediction speed. Lastly, respecting fitting speed, Trees
(classification and/or regression trees), Nearest Neighbor, and Discriminant Analysis all
gave a fast fitting speed, while Support Vector Machine (SVM) gave a medium fitting
speed. Besides, the authors [175] [172] also found Trees (classification and/or regression
trees) to have low memory usage capacity, and be easy to interpret [175] [172].

188
Figure 58: Performance of regression algorithms with respect to the regression value (R-
value).
3.1.3 Linear Regression (pValue)
With respect to linear regression, a predictor with a low p-value (e.g. < 0.05) means that
changes in its value will affect the response value immensely and vice versa. Every
predictor has a p-value; in other words, the closer the p-value is to zero, the better/more
desirable. In general, predictors with high p-values are usually weak/inconsequential
predictors [172] [173]. Table 4 shows the levels of performance of our real-world dataset
features with respect to predictor importance in descending order of importance i.e. from
most important (Occupancy – with ID: x3) to least important (Quality – with ID: x4).
0
0.2
0.4
0.6
0.8
1
1.2
R-V
alu
e
Regression Algorithms
R_value R_error

189
Table 4: Levels of predictor importance (in descending order).
ID pValue Predictors
x3 1.04E-169 Occupancy
x2 2.65E-50 Speed
x1 0.30516 Zone_id
x5 0.30646 Time of Day
x4 Quality
3.2 Classification Results
Similar to the work by Dong and Mahmassani, from our real-world data, we identified 49
congestions most prevalent in the morning and evening rush hours as shown in the
confusion matrix in Figure 62 [11].
3.2.1 Predictive Accuracy
Respecting the effectiveness of our evaluated algorithms in accurately predicting the
presence (average speed less than speed limit [65km/h]), or absence (average speed greater
than or equal to speed limit [65km/h]) on I-270, the following lists the predictive accuracy
of our evaluated supervised machine learning classification algorithms in decreasing order
of accuracy i.e. from most accurate to least accurate with their corresponding root mean-
square errors (RMSE) as shown in Figure 59: Classification tree [Ctree]: 0, Treebagger
classification [TB]: 0, Classification ensemble with boosting [LSBOOST]: 0,
Classification ensemble with bagging/bootstrap aggregation [BAG]: 0, Generalized linear

190
model classification [GLM]: 1.78999E-13, Neural network fitting classification [NN_fit]:
6.70647E-05, Naïve bayes classification [NB]: 0.004, Neural network prediction
classification [NN_p.reg]: 0.0051, Support vector machine [SVM]: 0.008, Discriminant
analysis [DA]: 0.06, K-nearest neighbor classification [KNN]: 0.20, and Neural network
time series classification [NN_time]: 0.30. Because most of the classification algorithms
we evaluated gave a RMSE value of zero (0), or very close to zero, one can safely say that
they are equally effective/accurate respecting prediction accuracy. Beside, Discriminant
analysis [DA], K-nearest neighbor [KNN], and Neural network time series classifications,
all other classification algorithms gave us a prediction accuracy of 99.19% and above (as
shown in Figure 59) which is very desirable i.e. their RMS errors was zero, or very close
to zero. In other words, the high level of prediction accuracy exhibited by these algorithms
can be attributable to the fact that they accurately identified/classified the presence, or
absence of congestions on our reference roadway (I-270) with little or no
misclassifications/errors in the form of false positives (FP), and/or false negatives (FN) as
shown in Figure 62.

191
Figure 59: Predictive accuracy of supervised machine learning classification algorithms as
a function of the root mean-square error (RMSE).
Figure 60: Prediction speed (efficiency) of supervised machine learning classification
algorithms as a function of prediction time in seconds.
3.2.2 Prediction Speed
Similarly, respecting prediction speed/time, the following lists the efficiency of our
evaluated algorithms in descending order from most efficient (left) to least efficient (right)
with their corresponding prediction time in seconds as shown in Figure 60: Classification
tree [Ctree]: 0.34, K-nearest neighbor classification [KNN]: 0.70, Naïve Bayes
classification [NB]: 0.90, Classification ensemble with boosting [LSBOOST]: 1.15,
0
0.05
0.1
0.15
0.2
0.25
0.3
0.35R
MS
E
Classification Algorithms
RMSE
0
1
2
3
4
5
6
Tim
e (s
econ
ds)
Classification Algorithms
Prediction_time Fitting_time

192
Support vector machine [SVM]: 1.97, Neural network pattern recognition classification
[NN_p.reg]: 2.05, Discriminant analysis [DA]: 2.57, Neural network fitting classification
[NN_fit]: 2.84, Classification ensemble with bagging [BAG]: 3.09, Neural network time
series classification [NN_time]: 3.38, Treebagger classification [TB]: 5.05, and
Generalized linear model classification [GLM]: 5.27.
Figure 61: Predictive accuracy of classification algorithms with respect to confusion
matrix.
0
20
40
60
80
100
120
Pre
dic
tive
Acc
ura
cy (
%)
Classification Algorithms
Predictive_Accuracy Misclassified

193
Figure 62: Confusion matrix of neural network pattern recognition classification [169].
Where TPR = True positive rate/sensitivity, FPR = False positive rate, TNR = True
negative rate, PPV = Positive predictive value, NPV = Negative predictive value, and
ACC = Predictive accuracy/accuracy.
3.2.3 Confusion Matrix
With respect to the confusion matrix, as shown in Figure 62, any value laying outside the
green diagonal is misclassified with the rightmost bottom row (in blue) showing the total
correctly classified cases (in green characters) – i.e. 98.4%, and misclassified cases (in red

194
characters) – i.e. 1.6%; the total correctly classified cases/accuracy (ACC) of 98.4%
signifies a very good congestion recognition/prediction performance [169].
3.2.4 Receiver Operating Characteristics (ROC) Curve
As previously noted, the receiver operating characteristics (ROC) curve shows a plot of
the true positive rate (sensitivity) against the false positive rate (1 – Specificity). Figure 63
shows the classification accuracy of the neural network pattern recognition classification
algorithm (NN_p.reg) with 100% sensitivity/performance in prognosticating the presence,
or absence of congestions on I-270.
Figure 63: ROC curve of neural network pattern recognition classification algorithm
(NN_p.reg).

195
Overall, respecting both predictive accuracy, and prediction speed, classification trees
(Ctree) gave the best predictive accuracy, and speed. On the one hand, from its RMSE
value, neural network time series classification algorithm (NN_time) gave the worst
predictive accuracy (Figure 59, and Figure 61); on the other hand, generalized linear model
classification gave the worst prediction speed (Figure 60).
3.2.5 Decision Trees
With respect to decision trees, evaluations/tests on an attribute, the results of those tests,
and the response/decision taken are represented in a decision tree flow chart by internal
nodes, branches, and leaf nodes [180]. Figure 64 shows the results of our classification of
the presence of congestion i.e. speed limit less than 65km/h – one (1), or absence of
congestion i.e. speed limit greater than or equal to 65km/h – zero (0) on our selected
roadway – I-270. Similarly, Figure 65 shows the series of regression tree computations that
take place in order to prognosticate traffic volume patterns using our dataset – from a
simple root node (top/higher) to more complex/detailed branch, and leaf nodes
(bottom/lower).

196
Figure 64: Results of classification tree (Ctree) used in identifying the presence, or absence
of congestions on I-270.
Figure 65: Results of regression tree (Rtree) used in forecasting future traffic volume
patterns on I-270 on Wednesday, September 19th, 2012.
In summary, the superior performance of classification tree (Ctree), and regression tree
(Rtree) algorithms can be attributable to the fact that both trees are used to
forecast/prognosticate/predict responses to data by traversing from the root/source node to

197
the leaf nodes where the responses (which can be nominal i.e. classification e.g. true, or
false; or numeric i.e. regression) reside as shown in Figure 64, and Figure 65 respectively
[173]. Using regression trees, a good fit is usually obtained respecting the training data, but
the predictive accuracy of new test data is often poor. The use of smaller trees with as few
levels as possible was used to minimize outliers [173].
3.2.6 Treebagger
With respect to Treebagger ensemble learning, estimating feature importance tries to
classify/categorize training set attributes/features based on the effect they have on the
prediction accuracy of machine learning techniques/algorithms [180]. Figure 66 shows the
level of importance of features/predictors with respect to our real-world dataset as
previously shown in Table 1, and Table 2 (Chapter 3, Section 5.2). Important features
primarily determine the predictive accuracy/capability of algorithms more than
unimportant one’s [173]. Evidently, from Figure 66, the most important predictor/training
feature is shown to be the level of occupancy on I-270 (68%), followed by the roadway
speed (28%), and time of day (4%). The other predictors/features/attributes: zone_id, and
quality have no effect on the models produced and their subsequent prediction performance
results/outputs because they are predominantly constant values.

198
Figure 66: Level of importance of features used in Treebagger ensemble.
Generally speaking, in both classification, and regression, the fitting time (Fitting_time) is
always less than the prediction time (Prediction_time) and rises or falls accordingly –
although some variations exist respecting our results from Figure 57, and Figure 60. This
is true because more work is usually done after fitting a model by evaluating/validating the
models accuracy with new test data. Respecting classification algorithms, the most
significant difference between fitting time and prediction time is observable with respect
to generalized linear model classification (GLM) algorithm at: 4.70 seconds as shown in
Figure 60. Similarly, respecting regression algorithms, Figure 57 shows the most
significant difference between prediction, and fitting time to correspond to those of
generalized linear model stepwise regression (GLM.S) algorithm at: 1.17 seconds.
In order to obtain more representative, and accurate results, traffic volume measurement
intervals/time has been found to be most effective when set between 5 – 15 minutes.
Erroneous results/fluctuations in traffic volume patterns are introduced when traffic
volume is sampled/measured above, or below this range/interval [64] [4] [45] [11] [54].
0%
28%
68%
0% 4%
Zone_id Speed Occupancy Quality Time of Day

199
Also, 5-6 days of repeated/same day historical traffic data has proved optimal for a more
accurate prediction. As earlier stated, reducing this number introduced errors in
aggregation, and increasing it did affect the results obtained [45]. Besides, the forecasting
window is inversely proportional to the prediction accuracy of the algorithm i.e. as the
forecasting window increases, the prediction accuracy decreases, and vice versa [45].
Consequently, several studies have segmented daily traffic volume patterns into different
categories of varying weekday/non-weekday, or weekend times: peak and non-peak;
morning, afternoon, and evening, etc. as an aid to more efficient, and effective analysis;
however, because we evaluated an entire days traffic volume pattern – this, indeed, makes
our work more encompassing [5].
3.3 Notable Contributions
To the best of our knowledge, using our unique, and scarce/difficult to obtain field data,
our work is the first to evaluate the prediction accuracy (effectiveness), and prediction
speed (efficiency) of time-variant/series traffic patterns in a heterogeneous driving
environment using a taxonomy of several machine learning algorithms. Besides, a by-
product of our research is the evaluation of different machine learning
models/methods/algorithms with the aim of determining which one is best suited to more
accurate traffic pattern prediction and why.
4. Remarks
Accurate knowledge of the current traffic condition/patterns is invaluable in congestion
avoidance and amelioration. Consequently, in this chapter, we evaluated the performance

200
of several supervised machine learning (classification, and regression) algorithms with
respect to prediction accuracy, and prediction speed using realistic traffic data, and road
networks. Overall, our results showed that classification tree (Ctree), and regression tree
(Rtree) gave the best predictive accuracy with respect to the root mean-square error
(RMSE), and prediction speed/efficiency among all the evaluated, supervised
classification, and regression machine learning algorithms. We also demonstrated that,
often, a tradeoff between prediction speed and accuracy is frequently necessary especially
respecting safety/life-critical scenarios requiring little or no tolerance for errors/delays. In
summary, the travel time/volume prediction accuracy of these and other artificial
intelligence (AI) algorithms such as genetic algorithms, and fuzzy logic, etc. depends on
the design and calibration of their parameters as they also are not generic i.e. they need to
be, meticulously, fine-tuned to suit the particular type of problem/roadway in question [37].
As an extension to our current work, we will also evaluate the efficiency, and effectiveness
of these algorithms – in addition to some others we have already been working on such as
genetic, time series, multistart, and simulated annealing algorithms, etc. – respecting this,
and other pertinent evaluation metrics such as: CPU usage, memory usage, and ease of
interpretation of results [173].

201
Chapter 6
Human Factors Challenges in Intelligent Transportation System (ITS)
1. Overview
Driver distraction is an ever-present, and often ever-growing trend resulting in safety
compromises attributable to distractions from in-vehicle technological equipment usage
[210]. Consequently, the effective design of driver-vehicle interfaces (DVIs) and other
human-machine interfaces (HMIs) together with their usability, and accessibility while
driving is most requisite [15]. Driving distractions can be classified as: visual distractions
– any activity that takes your eyes away from the road, cognitive distraction – any activity
that takes your mind away from the course of driving, and manual distractions – any
activity that takes your hands away from the steering wheel [15]. Besides, multitasking
during driving is a distractive activity that can increase the risks/likelihood of vehicular
crashes/accidents besides cognitive/information overloading as a result of operating in-
vehicle communication devices by the driver. Consequently, as earlier stated/expressed,
any technology that minimizes/eliminates multitasking reduces overloading – by
minimizing the number and complexity of driving tasks a person can perform – and other
sources of distracted driving is highly demanded [15].
Owing to the aforesaid, with our developed in-vehicle Driver Notification Application
(DNA), we examine the effects of increasing driver distraction levels on the evaluation

202
metrics of traffic efficiency, and safety using two types of popular driver models – young
drivers (ages 16 – 25 years), and middle-age drivers (ages 30 – 45 years).
Overall, our results show that as a drivers distraction level is increased, less heed is given
to change route/reroute directives from the in-vehicle on-board unit (OBU) using visual,
audio, and haptic feedback/notifications. Interestingly, middle-age drivers proved more
effective/resilient in mitigating the negative effects of driver distraction over young drivers
by overcoming the visual/perceptual, motor response, and cognitive distraction levels of
the driver in a timelier, and effective manner.
2. Motivation and Background
As previously stated, according to the results of the analysis of the National Motor Vehicle
Crash Causation Survey (NMVCCS) database between 2005 and 2007, 11% of crashes
were attributed to distractions as a causative agent/culprit. Drilling further down to the
details, the following lists the levels of distractions and their causative
agents/culprits/activities: 0.2% - use of cell phones, 0.9% - use of radios and similar
devices, and 12% - talking with other passengers, or use of cell phones. The age distribution
of drivers most prone to engage in an in-vehicle distracting activity was recorded at
between 16 to 25 years with the highest distraction propensity of 6.6% [15]. Besides, in
2010, the National Highway Traffic Safety Administration (NHTSA) reported that 3,092
deaths, and 417,000 injuries resulted from distracted driving alone [15].

203
In another study reported by the United States Department of Transportation (U.S. DoT)
Research and Innovative Technology Administration (RITA) in 2011 – as shown in Figure
67 [20], the majority of road transportation accidents/crashes – safety challenge – are
attributed to the human driver i.e. they are human factors related/precipitated/caused [20].
Figure 67: Factors responsible for most traffic accidents/crashes [20].
Owing from the aforesaid, it is self-evident that the need for more human factors research
in intelligent transportation system (ITS)/vehicular ad hoc networks (VANETs) cannot be
overemphasized. This is consequent upon the fact that, besides the traditional sources of
distractions already present in vehicles such as fatigue, radio operations, distractions/noise
from passengers, eating, etc., the growth of portable devices and other in-vehicle
technologies have further exacerbated the levels/sources of distractions experienced by
drivers while driving [15]. In addition, increasing multitasking activities tends to increase
a drivers level of distraction and consequent risk exposures. This is true, in addition to the

204
fact that activities with high complexity/stages of completion, and are attention demanding,
etc. have the propensity of further increasing a drivers workload while driving [15].
Prioritizing the information conveyed to the driver from a gamut, and the mode of such
presentation (audio, video, text, vibrations, or a combination of one or more of the
aforementioned modes, etc.) is imperative in minimizing distracted driving/competing with
drivers attention [15]. Obviously, this will go a long way in obviating many of the attendant
accidents/crashes, and other exposures to risk consequent upon/deriving from distracted
driving [15].
One of the goals of the human factors research in ITS is to mitigate sources of distractions
emanating from the use of in-vehicle information systems (IVIS) [15]. Consequently, the
effective design of the human-machine interface (HMI)/driver-vehicle interface (DVI)
together with their operation modes in order to reduce distractions, and driver workload is
pertinent in ameliorating the human factors (HF) challenges of ITS [15]. The connected
vehicles human factors research ensures that safety applications, and other applications do
not, inadvertently, distract the driver as a result of competing attention from visual, and
audio prompts (through increased driver workload) requiring attention; thereby dividing
the drivers full attention requisite in the course of driving [15]. As a safety measure, in-
vehicle technologies can also advice a distracted/sleepy driver, whose attention status has
declined, of his/her propensity to crashes/accidents [15].
Going forward, there is a need for more accurate and standardized metrics for measuring
distraction levels together with their corresponding mitigation techniques [15]. This is

205
because a lot of inconsistent metrics have been developed/promulgated by several
researchers in both the industry and academic domains in order to measure/quantify driver
distraction. It is noteworthy that, although it may be evident that distraction levels are
somewhat related to the drivers behavior, both attributes are, particularly,
challenging/difficult to quantify because of the non-uniform/varying/unpredictable, and
often subjective driver responses/reactions. Consequently, NHTSA is pioneering the effort
towards furthering the ITS human factors research domain by developing a consistent,
scientific/objective/empirical metrics and guidelines for quantifying a drivers distraction
level that, they hope, will be acceptable to all concerned stakeholders [15].
From the aforesaid, it is self-evidently imperative that more studies that incorporate the
human factors challenge in intelligent transportation system (ITS) are essential to
promulgating/fostering the ITS research domain in relation to its promised
deliverables/benefits – this is the primary goal of this research.
Consequently, using field, and simulation data, we investigated the safety, and traffic
efficiency promised benefits of ITS in the presence of distracted driving using two distinct,
but popular age groups/driver models: ages 16 – 25 years (young drivers), and ages 30 –
45 years (middle-age drivers). Our high-level/overall results show that middle-age drivers
outperformed young drivers in better overcoming the distraction barrier introduced by the
subjective, and unpredictable human driver.

206
3. Main Contributions: A Generic Human Factors ITS Test-bed
As aforesaid, most research in intelligent transportation system (ITS)/vehicular ad hoc
networks (VANETs) do not incorporate the human factors challenge; this is further
compounded by the fact that human behaviors are quite erratic/unique/idiosyncratic –
varying by race, gender, age, and driving experience, etc.
In order to help bridge this pertinent gap, using field and simulation studies, we model the
distraction level of a driver as a composite of several factors such as cognitive, perceptual,
and motor impairments/challenges, etc. as shown in Figure 68. Specifically, using our
realistic field data, road network, and simulation, we investigate the impact of driver
distraction levels on the two popular age groups/driver models – young, and middle-age
drivers. Our choice of this age group was informed by the fact that, as aforementioned,
according to the National Highway Traffic Safety Administration (NHTSA), the age
distribution of drivers most prone to engage in an in-vehicle distracting activity was
recorded at between 16 to 25 years with the highest distraction propensity of 6.6% [15]
[20] [21].
3.1 Test-bed Setup and Simulation Parameters
Our test-bed setup is synonymous to that used in Section 5.1 of Chapter 3. Specifically,
Figure 70 shows some of the coupled simulators used in order to carry out our distracted
driving scenario. In the same vein, Table 5 shows some of the simulation parameters used
in our distracted driving simulation.

207
Table 5: Some simulation parameters used for our distracted driving scenario [152].
Simulation Parameter Value
Maximum Node Bandwidth 100000000 bits/s
Packet Delivery Ratio (PDR) 1.0
Throughput 500000000 bits/s
Simulation Duration 7000 seconds
Simulation Area 77000 * 67000 meters
MAC Bitrate 6 Mbps
MAC Basic Bitrate 3 Mbps
Carrier Frequency 5.9 GHz DSRC band
Protocol/Standard IEEE 802.11p/WAVE
Vehicle/RSU Tx Antenna Height 2m/100m
Vehicle/RSU Rx Antenna Height 2m/100m
Radio Sensitivity -85 dBm
Radio Attenuation Model FreeSpaceModel
RSU Tx Power 50 mW
Figure 68 shows some of the various factors/parameters considered in modeling our driver
distraction/attention level used in our simulation study.
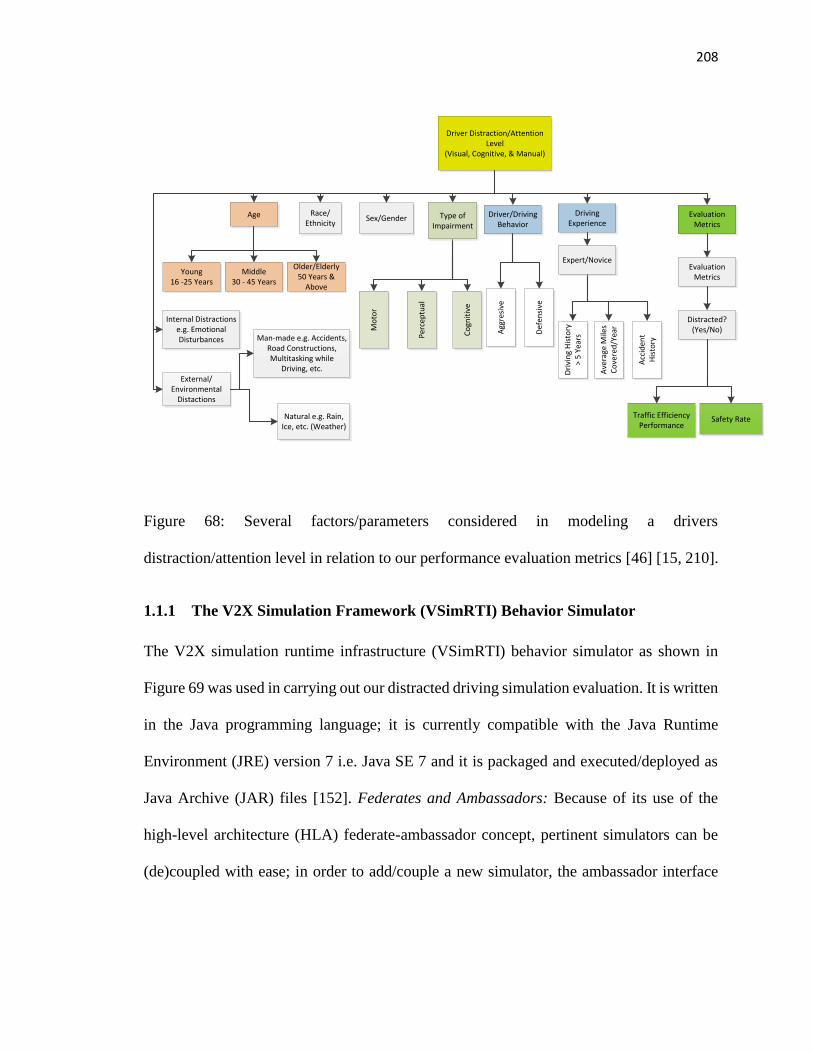
208
Driver Distraction/Attention Level
(Visual, Cognitive, & Manual)
Sex/GenderAge Race/Ethnicity
Young16 -25 Years
Middle30 - 45 Years
Older/Elderly50 Years &
Above
Co
gnit
ive
Per
cep
tual
Mo
tor
Driver/Driving Behavior
Driving Experience
Evaluation Metrics
Def
ensi
ve
Agg
resi
ve
Acc
iden
t H
isto
ry
Ave
rage
Mile
s C
ove
red
/Yea
r
Dri
vin
g H
isto
ry
> 5
Yea
rs
Expert/NoviceEvaluation
Metrics
Distracted?(Yes/No)
Safety RateTraffic Efficiency Performance
Type of Impairment
Internal Distractions e.g. Emotional Disturbances
External/Environmental
Distactions
Man-made e.g. Accidents, Road Constructions, Multitasking while
Driving, etc.
Natural e.g. Rain, Ice, etc. (Weather)
Figure 68: Several factors/parameters considered in modeling a drivers
distraction/attention level in relation to our performance evaluation metrics [46] [15, 210].
1.1.1 The V2X Simulation Framework (VSimRTI) Behavior Simulator
The V2X simulation runtime infrastructure (VSimRTI) behavior simulator as shown in
Figure 69 was used in carrying out our distracted driving simulation evaluation. It is written
in the Java programming language; it is currently compatible with the Java Runtime
Environment (JRE) version 7 i.e. Java SE 7 and it is packaged and executed/deployed as
Java Archive (JAR) files [152]. Federates and Ambassadors: Because of its use of the
high-level architecture (HLA) federate-ambassador concept, pertinent simulators can be
(de)coupled with ease; in order to add/couple a new simulator, the ambassador interface
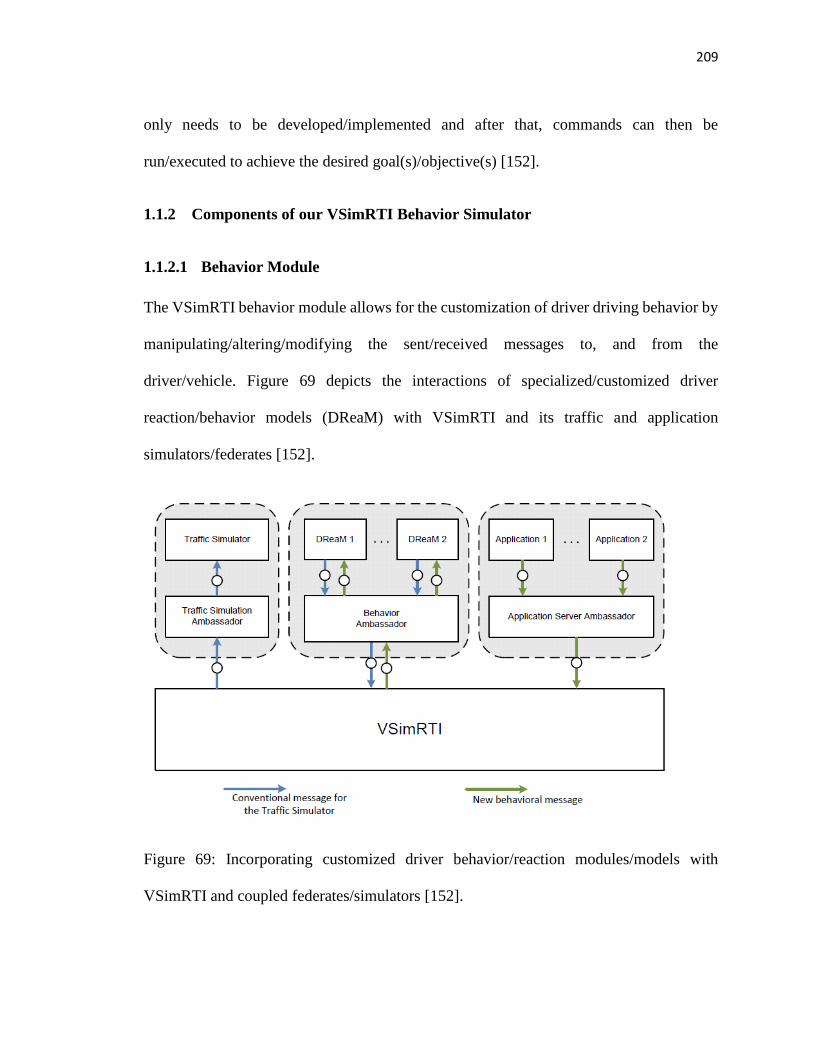
209
only needs to be developed/implemented and after that, commands can then be
run/executed to achieve the desired goal(s)/objective(s) [152].
1.1.2 Components of our VSimRTI Behavior Simulator
1.1.2.1 Behavior Module
The VSimRTI behavior module allows for the customization of driver driving behavior by
manipulating/altering/modifying the sent/received messages to, and from the
driver/vehicle. Figure 69 depicts the interactions of specialized/customized driver
reaction/behavior models (DReaM) with VSimRTI and its traffic and application
simulators/federates [152].
Figure 69: Incorporating customized driver behavior/reaction modules/models with
VSimRTI and coupled federates/simulators [152].
210
In general, a vehicles behavior in the form of lane, route, and/or speed changes/controls
can be executed/implemented using the vehicle control interface [152].
1.1.2.2 Traffic Simulators
Besides simulating vehicular movements/traffic, other entities such as pedestrians, trains,
planes, and ships/boats, etc. can also be simulated using the traffic simulator.
Consequently, different types of traffic simulators are distinguished based on whether they
are: microscopic models, sub-microscopic models, macroscopic models, or mesoscopic
models. Microscopic models allows for the simulation of individual vehicles, which
implies that it is computationally expensive. Currently, two types of microscopic traffic
simulators – SUMO (Simulation of Urban Mobility), and VISSIM (Verkehr In Städten –
Simulationsmodell) – are supported by VSimRTI; sub-microscopic models are a further
refined/detailed version of the microscopic model and is hence the most computationally
expensive model; macroscopic models focuses on entire traffic flow simulation and not on
individual vehicles – hence useful for prognosticating traffic jams and requires less
computational resources; mesoscopic models balances the pros and cons of both
microscopic, and macroscopic, and sub-microscopic models [152].
1.1.2.2.1 SUMO
SUMO was developed by the German Aerospace Center as a microscopic traffic simulator,
and free software written in C++ that can be used to simulate road networks at a speed that
is faster than real-time in order to enhance its scalability. Using SUMO, each vehicle is
simulated individually via its assigned route. Currently, SUMO version 22 i.e. SUMO

211
0.22.0 is supported and is deployed/comes preconfigured with VSimRTI [152]. A unique
feature of VSimRTI is seen in the fact that unlike classic traffic simulation procedures,
VSimRTI creates SUMO route files at runtime in order to enable dynamic/adaptive routing
[152].
1.1.2.3 Communication Simulators
3.1.2.3.1 OMNeT++
The OMNeT++6,7 discrete event simulator uses/employs its extensions for wireless
communication such as INET, INETMANET, and Mobility frameworks for simulation of
distributed systems and computer networks [152]. It is an open source software for
academic use written in C++ by OpenSim Ltd. and the OMNeT++ community. It can be
run in both Windows (using mingw), and Linux operating systems [152]. Using the latest
INETMANET extension (INETMANET 1.latest), VSimRTI is coupled with the
OMNeT++ version 4.4 using the supplied installation script [152]. For the purposes of our
distracted driving study, we employed the OMNeT++ discrete event simulator. Another
network/communication simulator that can be used with VSimRTI is ns-3 [152].
3.1.2.3.2 JiST/SWANS
It is written in Java and can be used across platforms/on different operating systems; its
new routing protocol now supports geographic routing [152]. Network layer routing
6 http://omnetpp.org/ 7 https://github.com/aarizaq/inetmanet-2.0

212
protocols, radio channel, and physical layer (antenna height, receiver sensitivity, and
transmission power, etc.) parameters respecting network nodes (vehicles, traffic lights,
and/or road-side units) can be configured using the SWANS configuration file [152].
Wireless protocols/standards such as IEEE 802.11b, and IEEE 802.11p – vehicular
communication standard, etc. are some of the other configurable physical layer parameters
[152]. Respecting network layer routing, single-hop broadcast, and Greedy Geocast
(CGGC) are some of the options available for use [152].
1.1.2.4 Application Simulators
The application simulator is responsible for creating V2X applications following the
European Telecommunications Standards Institute (ETSI) standard. Accord to the
standard, Cooperative Awareness Messages (CAM) are used for vehicular/traffic
situational awareness, while Decentralized Environmental Notification Messages (DENM)
are used to alter node (vehicle, road-side unit, and/or traffic light) behaviors [152].

213
Figure 70: More coupled simulators that can be used with VSimRTI in order to create a
single integrated simulation framework/architecture [76] [77].
1.2 Evaluation Scenarios
Our evaluation scenario consists of a simulated accident on Constitutional Avenue NW,
which has the effect of blocking its entire 3 lanes together with reduced speed limit as a
result of slippery roadway caused by frozen ice, and poor driving visibility as a result of
the presence of fog. For the purposes of this study, vehicles emanate from John Hanson
Hwy (source) to Dulles Toll Road (destination) via Constitution Avenue NW (if vehicle
driver is DNA-equipped and distracted), or H. Street NW (if vehicle driver is DNA-
equipped and not distracted)

214
In order to evade this precarious road condition, vehicles running our developed Driver
Notification Application (DNA) are notified via their in-vehicle onboard units (OBUs) –
informing the human driver to take an alternative route using textual, visual, audio, and
haptic feedback mechanisms as shown in Figure 71. When travel speed across a roadway
falls, typically because of congestion, DNA-equipped vehicles relay/convey this
information to trailing ones who then use this information to compute the edge weights in
addition to alternative route(s) travel times. These vehicle drivers are advised reroute when
an alternative route has better travel time than the main/primary route [82] [76] [166].
Figure 71: In-vehicle textual, audio, visual, and haptic notification of the congested
condition on our reference roadway – Constitution Avenue NW [211].

215
1.3 Performance Evaluation Metrics
Emanating from the above evaluation scenarios, we determine the efficiency, and
effectiveness of young, and middle-age driver models respecting the evaluation metrics of
traffic efficiency, and safety performances using ad hoc/decentralized communication
architecture. Specifically, respecting traffic efficiency, the best traffic efficiency result is
equivalent to the fastest vehicle trip/travel time from source (John Hanson Hwy – from the
West) to destination (Dulles Toll Road – in the East). With respect to safety performance,
the highest safety performance (100%) is obtained when all DNA-equipped vehicles that
received the reroute/change route directive to evade Constitutional Avenue NW did same
and vice versa. In summary, equipped vehicles that failed to heed these reroute directives
suffer adverse effects respecting their safety, and traffic efficiency performances – the
opposite is also true.
2. Performance Evaluation Results and Discussion
We here present the results of our empirical study respecting the influence of driver
distraction levels on the safety, and traffic efficiency performances of young, and middle-
age driver models/age groups using decentralized/ad hoc communication. Again, the
suffixes _app, _noapp, and _ref, in this section, refers to vehicles running our driver
notification application (DNA) (_app), classic/DNA-unequipped vehicles (_noapp), and
reference measurements/results (_ref) void of all simulated incidents on Constitutional
Avenue NW. In the same vein, DNA-equipped vehicle drivers that heeded, and did not
heed the reroute/change route directives are denoted with (rerouted_yes), and

216
(rerouted_no) respectively. Finally, the aggregate of all (rerouted_yes/no) vehicles is
denoted by (total).
2.1 Human Factors Challenge: Young Driver
Figure 72 [a – d] shows the results of our traffic efficiency, and safety – Figure 72 [e – f]
– performance results respecting the young driver model.
On the one hand, the best case traffic efficiency scenario respecting travel time [TT] was
observed at 100 emitted vehicles, and 100% driver agility/attentiveness were no difference
existed amongst the performance metrics evaluated. On the other hand, the worst case
traffic efficiency scenario respecting travel time [TT] performance was observed at 5
emitted vehicles and 5% driver agility/attentiveness resulting in the following losses: travel
time [TT]: 84.99% (23.21 minutes/1392.8 seconds), average speed: 70.86% (0.012 km/h),
PMx: 3.74% (23.96mg), CO: 5.76% (7.85g), C02: 11.69% (787.67g/km), NOx: 7.1%
(1.06g), HC: 20.86% (0.46g), and fuel consumed: 11.69% (0.31 liters). An improvement
in travel distance [TD]: 0.29% (0.145km) was also observed here.
At 5% DNA-emitted vehicles, and 5% driver agility/attentiveness, the average speed of
DNA-equipped vehicles fell from 106.92 km/h (reference) to 57.62km/h as a consequence
of the road traffic congestion on Constitution Avenue NW resulting in a 53.89%
decrease/loss. The losses/deteriorations in the evaluated performance metrics can be
attributable to this decrease in average speed.

217
With respect to safety, the best case safety rate/performance (70%) was observed at 100
emitted vehicles, and 100% driver agility/attentiveness because only 70 out of 100 DNA-
equipped vehicles heeded the change route/reroute directive. In the same vein, the worst
case safety performance (32%) was observed at 50 DNA-emitted vehicles, and 50% driver
agility/attentiveness because only 16 out of 50 equipped vehicles heeded the change route
directive.

218
Figure 72: Performance of some evaluated metrics in relation to the impact/influence of distracted driving on
the young driver model.
(b)
48.3
48.35
48.4
48.45
48.5
48.55
48.6
48.65
48.7
5
10
15
20
25
30
35
40
45
50
55
60
65
70
75
80
85
90
95
100
Tra
vel
Dis
tan
ce (
km
)
Drivers Attention Level (%)
TD_app TD_ref TD_noapp
(a)
0
10
20
30
40
50
60
70
5 10 15 20 25 30 35 40 45 50 55 60 65 70 75 80 85 90 95 100
Tra
vel
Tim
e (M
inu
tes)
Drivers Attention Level (%)
TT_app TT_ref TT_noapp
(c)
0
0.5
1
1.5
2
2.5
3
5 10 15 20 25 30 35 40 45 50 55 60 65 70 75 80 85 90 95 100
HC
-em
issi
on
s (g
)
Drivers Atention Level (%)
HC_app HC_ref HC_noapp
(d)
2.5
2.6
2.7
2.8
2.9
3
3.1
5 10 15 20 25 30 35 40 45 50 55 60 65 70 75 80 85 90 95 100
Fu
el C
on
sum
ed (
Lit
ers)
Drivers Attention Level (%)
fuel_app fuel_ref fuel_noapp
(e)
0
20
40
60
80
100
120
5
10
15
20
25
30
35
40
45
50
55
60
65
70
75
80
85
90
95
100
Safe
ty R
ate
(%
)
Drivers Attention Level (%)
Safety_app_% safety_app.ref safety_total
(f)
0
20
40
60
80
100
120
5
10
15
20
25
30
35
40
45
50
55
60
65
70
75
80
85
90
95
100
Rer
ou
ted
Veh
icle
s
Drivers Attention Level (%)
reroute_yes rerouted_yes.ref total

219
2.2 Human Factors Challenge: Middle-age Driver
Figure 73 [a – d] shows the results of our traffic efficiency, and safety –
Figure 73 [e – f] – performance results respecting the middle-age driver model. The best
case traffic efficiency scenario respecting travel time [TT] was observed at 100 emitted
vehicles when the driver’s agility/attentiveness is highest (100%) i.e. there was no
difference observed with respect to the performance metrics evaluated in this scenario in
relation to the reference scenario. Similarly, the safety rate remained unchanged at 100%
because all equipped vehicle drivers (100) heeded the change route/reroute directive on
time.
The worst case traffic efficiency scenario with respect to travel time [TT] performance was
observed at 5 emitted vehicles with driver’s agility/attentiveness at its lowest point (5%).
This resulted in the following losses: travel time [TT]: 84.86% (23.18 minutes/1390.8
seconds), average speed: 46.06% (49.25km/h), PMx: 2.24% (0.014g), CO: 3.78% (5.1g),
CO2: 8.96% (602.25g), NOx: 5.07% (0.75g), HC: 16.46% (0.36g), and fuel consumed:
8.96% (0.24 liters). On the other hand, an improvement in travel distance [TD]: 0.29%
(145.35 meters) was observed also at 5% driver agility/attentiveness, and 5 emitted
vehicles.
At 5% DNA-emitted vehicles, and 5% driver agility/attentiveness, the average speed of
DNA-equipped vehicles fell from a reference of 106.9 km/h to 57.65 km/h as a result of

220
the road traffic congestion on Constitution Avenue NW leading to a 53.93% decrease. This
decrease is responsible for the deteriorations in the performance metrics evaluated as a
result of increased trip/travel time.
With respect to safety, the lowest safety performance (40%) was also observed at 5%
agility/attentiveness, and 5 emitted vehicles because out of a total of 5 DNA-emitted
vehicles, only 2 heeded the change route request.

221
Figure 73: Performance of some evaluated metrics in relation to the impact/influence of distracted driving on
the middle-age driver model.
(b)
48.3
48.35
48.4
48.45
48.5
48.55
48.6
48.65
48.7
5
10
15
20
25
30
35
40
45
50
55
60
65
70
75
80
85
90
95
100
Tra
vel
Dis
tan
ce (
km
)
Drivers Attention Level (%)
TD_app TD_ref TD_noapp
(a)
0
10
20
30
40
50
60
70
5 10 15 20 25 30 35 40 45 50 55 60 65 70 75 80 85 90 95 100
Tra
vel
Tim
e (m
inu
tes)
Drivers Attention Level (%)
TT_app TT_ref TT_noapp
(c)
0
0.5
1
1.5
2
2.5
3
5 10 15 20 25 30 35 40 45 50 55 60 65 70 75 80 85 90 95 100
HC
-em
issi
on
s (g
)
Drivers Attention Level (%)
HC_app HC_ref HC_noapp
(d)
2.5
2.6
2.7
2.8
2.9
3
3.1
5 10 15 20 25 30 35 40 45 50 55 60 65 70 75 80 85 90 95 100
Fu
el C
on
sum
ed (
lite
rs)
Drivers Attention Level (%)
fuel_app fuel_ref fuel_noapp
(e)
0
20
40
60
80
100
120
5
10
15
20
25
30
35
40
45
50
55
60
65
70
75
80
85
90
95
100
Safe
ty R
ate
(%
)
Drivers Attention Level (%)
Safety_app_% safety_ref safety_total
(f)
0
20
40
60
80
100
120
5
10
15
20
25
30
35
40
45
50
55
60
65
70
75
80
85
90
95
100
Em
itte
d V
ehic
les
Drivers Attention Level (%)
reroute_yes rerouted_yes.ref total.ref

222
2.3 Human Factors Challenge: Middle-age versus Young Driver
Figure 74 [a – d] shows the results of our traffic efficiency, and safety – Figure 74 [e – f]
– performance results comparing the performances of the young driver model in relation
to the middle-age driver model. In this section, the additional suffixes (.m), and (.y) in
Figure 74 denotes the performance results of middle-age (.m), and young (.y) drivers
respectively.
With respect to travel time, on the one hand, the best case traffic efficiency performance
was observed at 95 emitted vehicles, and 95% driver agility/attention with the following
improvements of middle-age drivers over young drivers: travel time [TT]: 26.19% (10.05
minutes/603.16 seconds), average speed: 35.69% (27.11km/h), PMx: 1.7% (0.011g), CO:
1.77% (2.46g), CO2: 4.12% (289.61g), NOx: 2.66% (0.4g), HC: 6.46% (0.15g), and fuel
consumed: 4.12% (0.11 liters). On the other hand, young drivers outperformed middle-age
drivers with respect to travel distance [TD] by 0.15% (0.07km) also at 95 emitted vehicles.
On the other hand, also with respect to travel time, the following worst case traffic
efficiency performance was observed at 10 emitted vehicles, and 10% driver
agility/attention with the following improvements of middle-age drivers over young
drivers: travel time [TT]: 0.03% (1 second), and average speed: 0.035% (0.022Km/h).
However, young drivers outperformed middle-age drivers with respect to the following
metrics – although no change/difference in travel distance [TD] was observed: PMx: 0.41%
(0.0026g), CO: 0.27% (0.38g), CO2: 0.47% (34.01g), NOx: 0.43% (0.067g), HC: 0.32
(0.0082g), and fuel consumed: 0.47% (0.013 liters).

223
At 95 DNA-emitted vehicles, and 95% driver agility/attentiveness, the decrease in average
speed by 73.69% from 103.05km/h (middle-age) to 75.94km/h (young) is attributable to
the road traffic congestion on Constitution Avenue NW; this resulted in better performance
of middle-age drivers over young drivers in relation to the evaluated performance metrics
– especially respecting traffic efficiency.
The best case safety performance with respect to middle-age drivers (100%), and young
drivers (70%) were observed at 100 DNA emitted-vehicles, and 100% driver
agility/attentiveness. Similarly, the worst case safety performances of both middle-age, and
young drivers (40% each) was recorded at 5 IWA-emitted vehicles, and 5% driver
agility/attention.

224
Figure 74: Comparing the impact/influence of distracted driving on the young, and middle-
age driver models respecting some of our evaluated metrics.
(b)
48.4
48.45
48.5
48.55
48.6
48.65
48.7
5
10
15
20
25
30
35
40
45
50
55
60
65
70
75
80
85
90
95
100
Tra
vel
Dis
tan
ce (
km
)
Drivers Attention Level (%)
TD_app.m TD_app.y TD_ref
(a)
0
10
20
30
40
50
60
5 10 15 20 25 30 35 40 45 50 55 60 65 70 75 80 85 90 95 100
Tra
vel
Tim
e (m
inu
tes)
Drivers Attention Level (%)
TT_app.m TT_app.y TT_ref
(c)
0
0.5
1
1.5
2
2.5
3
5 10 15 20 25 30 35 40 45 50 55 60 65 70 75 80 85 90 95 100
HC
-em
issi
on
s (g
)
Drivers Attention Level (%)
HC_app.m HC_app.y HC_ref
(d)
2.5
2.6
2.7
2.8
2.9
3
3.1
5 10 15 20 25 30 35 40 45 50 55 60 65 70 75 80 85 90 95 100
Fu
el C
on
sum
ed (
Lit
ers)
Drivers Attention Level (%)
fuel_app.m fuel_app.y fuel_ref
(e)
0
20
40
60
80
100
120
5
10
15
20
25
30
35
40
45
50
55
60
65
70
75
80
85
90
95
100
Safe
ty R
ate
(%
)
Drivers Attention Level (%)
Safety_app.m Safety_app.y safety_ref
(f)
0
20
40
60
80
100
120
5
10
15
20
25
30
35
40
45
50
55
60
65
70
75
80
85
90
95
100
Em
itte
d V
ehic
les
Drivers Attention Level (%)
reroute_yes.m reroute_yes.y rerouted_yes.ref

225
When travel speed across a roadway falls, typically because of congestion, DNA-equipped
vehicles relay/convey this information to trailing ones who then use this information to
compute the edge weights in addition to alternative route(s) travel times. These vehicles
reroute when an alternative route has better travel time than the main/primary route [82].
In general, the higher the V2X penetration rates, more application-supported vehicles take
alternative routes to get to the destination thereby improving traffic efficiency, and safety.
However, high vehicular traffic densities/volumes, increased packet collisions as a result
of more nodes (vehicles, RSU’s, and traffic lights, etc.), and interferences from external
obstacles such as high buildings, etc. are typical characteristics of urban/city roadways –
the opposite is true for rural roadways [82]. Consequently, V2X traffic efficiency, and
safety performances, for example, is highly dependent on the type/nature of the
used/evaluated roadway [82].
Because V2V communication relies on multi-hop communication, several V2V reroute
messages are lost/do not reach the intended vehicles on time in order to trigger rerouting
through alternative routes – especially at low DNA-supported vehicles (V2X) penetration
rates [82]. This is one of the primary reasons why V2I (single-hop) communication is
preferred over V2V (multi-hop) communication respecting safety/life-critical
applications/scenarios [82].
Although rerouted vehicles took a longer distance to get to the destination, these alternative
routes had higher speed limits, lower traffic densities, and higher roadway capacities.
Consequently, their travel time performance was comparable to those vehicles that took

226
the main/original congested route [82]. However, because DNA-equipped vehicles
travelled at greater distances and speed through alternative routes to get to the destination,
they incurred additional fuel consumption and CO2 emissions i.e. they became
worse/increased/worsened [82] – compared to our reference scenario where no
accident/incident was present on Constitutional Avenue NW [82].
3. Remarks
In this chapter, we have experimentally demonstrated that the levels of driver distractions
adversely affects the safety, and traffic efficiency/mobility goals of intelligent
transportation system (ITS)/vehicular ad hoc networks (VANETs); using both field and
simulation data, we modeled a drivers distraction levels as being a composite of:
perceptual/visual, motor (reaction/response time/agility), and cognitive skills/capabilities,
etc. From our results, we have seen that middle-age drivers showed more
resilience/effectiveness over younger drivers in alleviating the adverse effects of distracted
driving.
It is important to note that vehicle-to-vehicle (V2V) communication performance is
hampered by several factors such as low vehicle-to-x (V2X) penetration rates, low traffic
volume/densities which eventually leads to a disconnect in communication because of the
long inter-vehicle distance that exceeds the communication range of V2V communication
via multi-hop communication. In order to ameliorate this weakness in V2V/decentralized
communication/routing, V2I communication can be used to complement/supplement them
using nodes/road-side units (RSUs) employing centralized/decentralized routing [82]. In

227
other words, V2V communication is only effective when the inter-vehicle distance of V2X
equipped vehicles lies within the communication range of the transmitting/sending vehicle
and the receiving vehicle using multi-hop propagation/routing [82].
4. Outlook
The following will be interesting/important future research areas: the influence of
automated vehicles/robotics, electric vehicles, together with their interactions with the
traditional human-driven vehicles have not been adequately proven to be compatible/co-
exist in a complex heterogeneous driving environment [15]. In addition, the interaction of
human-to-machine, and machine-to-machine/robotics systems needs to be further
evaluated to determine whether their use is beneficial, or detrimental to mobility/traffic
efficiency, safety, and security goals of ITS especially respecting the levels of distractions
introduced by their usage. Besides, it also will be astonishing to note the most expedient
point (if any) of transferring (full/partial) vehicular control from the human driver to the
machine and vice versa in order to especially meet the safety goals of ITS [15] [21]. Finally,
the advent of automated technologies have also highlighted several deficient areas
requiring more/further research/investigations; some of these areas include, but are not
limited to: human factors, security, reliability, and need for more
standardization/normalization/unification of standards/policies/evaluation metrics together
with their subsequent unanimous adoption by all stakeholders [15].

228
Chapter 7
Securing Transportation Cyber-Physical Systems
1. Overview
As earlier stated/alluded to severally in this dissertation research, vehicle-to-vehicle (V2V),
and vehicle-to-infrastructure (V2I) communications in intelligent transportation systems
(ITS)/vehicular ad hoc networks (VANETs) have been touted to be a major panacea for
improving safety, traffic efficiency, and provision of infotainment services. However, their
levels of improvements have not been adequately evaluated especially in a complex,
heterogeneous real-world setting – particularly, in the presence of various security/privacy
attacks.
Besides, like in other security domains, confidentiality, integrity, and availability (CIA) are
imperative security requirements that must be guaranteed in order to engender confidence,
and widespread adoption of the intelligent transportation system (ITS)/vehicular ad hoc
network (VANET) technology. Consequently, security compromises in ITS/VANETs, like
in other safety/life-critical systems/applications, can be calamitous resulting in the loss of
lives. Consequently, these systems must have little or no tolerance for errors,
vulnerabilities/exposures, and other possible security flaws that can be compromised by
the adversary.
To this end, we experimentally demonstrated the devastating effects of a physical layer
jamming attack i.e. a type of denial of service (DoS) attack, against the availability security

229
requirement/goal/objective on vehicle-to-vehicle (V2V), and vehicle-to-infrastructure
(V2I) communication architectures using real-world data, and road networks.
Our overall result shows that, although V2V, and V2I communication architectures were
both adversely affected by the jamming attack, V2I communication, however, showed
more resilience to V2V communication in accurately disseminating safety-critical
messages to their intended vehicles/destinations resulting in better safety, and traffic
efficiency performances/measures. In addition, we also proffered some mitigation
techniques against attacks that are intended to compromise/vitiate the availability security
requirement/goal in general, and denial-of-service (DoS) – jamming – attacks in particular.
2. Motivation
Owing to the safety/life-critical nature/requirement of intelligent transportation system
(ITS)/vehicular ad hoc networks (VANETs), little or no tolerance for errors is strictly
mandated in the ITS/VANET ecosystem. Security compromises in ITS/VANETs can be
quite disastrous and will, subsequently, hinder the already fragile trust by stakeholders –
more especially road users/operators – in embracing the laudable mobility/traffic
efficiency, safety, and infotainment, etc. promises of this evolving/fledgling technology.
From the aforesaid, mitigation techniques that strive to preserve the confidentiality,
integrity, and availability (CIA) security and privacy goals of ITS are imperative. It is,
however, important to note that of all the promised security, mobility/traffic efficiency, and
greener transportation, etc. benefits of ITS/VANETs, none is more imperative than safety.

230
In other words, to be reliably adopted in the real-world, all traditional, and emerging
ITS/VANET applications must never, in any way, vitiate/compromise safety [20].
With all these in mind, in this chapter, we attempt to investigate the impact of vehicle-to-
vehicle (V2V), and vehicle-to-infrastructure (V2I) communications jamming attacks in a
realistic scenario. We also proffer some mitigation techniques that can ensure that continual
operations are sustained even when all, or part of the system is under attack/being
compromised.
Besides, in this chapter, we provide some background information respecting the
ITS/VANET domain in relation to its architecture, standards, features, and applications in
Section 3. Next, in Section 4, we examine some of the security, and privacy requirements,
and challenges in the ITS ecosystem; this is, subsequently, followed by an exposition of
some of the available countermeasures/mitigation techniques employed to address some of
the identified challenges/potential vulnerabilities in Sections 5, and 6. Following in Section
7, we present our main contribution in light of an actual empirical/experimental
demonstration of a denial-of-service (DoS)/jamming attack against the availability security
goal/requirement using both V2V, and V2I communications. In Section 8, we highlight
some of the major findings of our experimental/empirical study. Finally, in Section 9, we
buttress some of our evaluation results and draw conclusions based on them.

231
3. Transportation Cyber-Physical Systems
Smart vehicles are able to process, record/store data/information from vehicle-to-vehicle
(V2V) and vehicle-to-infrastructure (V2I) communications. The VANET is made up of
entities such as on-board units (OBUs), road-side units (RSUs), and trusted platform
module (TPM), etc. These entities communicate with one another via V2V, and/or V2I
communication as shown in Figure 75. V2I communication requires more bandwidth and
is less susceptible to attacks. Some of the wireless communication standards that can be
used with V2I communication include, but are not limited to: GSM, UMTS, WiMAX, etc.
In VANETs, two main routing methods have been identified: source/centralized/vehicle-
to-infrastructure routing protocol (single-hop), and hop by hop/decentralized/vehicle-to-
vehicle routing protocol (multi-hop). The six main classifications of V2V routing protocols
in VANETs include: topology-based (which can be proactive/table-driven, reactive/on-
demand, or hybrid), position-based, multicast-based, cluster-based, broadcast-based, and
geocast-based routing protocols. On the other hand, static, and dynamic infrastructure-
based routing protocols are examples of V2I routing protocols [30, 31, 44, 212-215].
3.1 Architecture
The three main types of architecture in VANETs are: cellular/wireless
LAN/centralized/vehicle-to-infrastructure (V2I) communication architecture, ad
hoc/decentralized/vehicle-to-vehicle (V2V) communication architecture – can be single-
hop (used for safety related messages/communication), or multi-hop (used for non-safety
related messages) depending on the position of the receiver relative to the sender, and a

232
combination of both (hybrid). They are pictorially shown in the Figure 75 below. In
VANETs, message transmissions can be via broadcast (V2I), or unicast/ad hoc (V2V) [97]
[216] [96].
Figure 75: VANET network architectures: (a) pure cellular (V2I), (b) pure ad hoc (V2V),
(c) hybrid (V2V & V2I) [95] [96].
3.2 Applications
VANET applications/services can be categorized under the following headings: safety,
comfort/infotainment, and traffic efficiency applications. Traffic efficiency and safety can
be enhanced via cooperative driving, and traffic monitoring applications. Some safety
applications of VANETs include, but are not limited to: electronic break light warnings,
and cooperative collision avoidance. Some traffic efficiency applications of VANETs
include, but are not limited to: road congestion notifications, parking availability
notification, etc. Besides, VANET applications can be used for warning, traffic
management, and provision of value-added applications. Payment, infotainment, and
location-based services are some of the value added applications of VANETs. Maintenance

233
applications in VANETs could be in the form of remote vehicle diagnosis [30, 31, 44, 94-
97, 217] [218].
3.3 Standards
In the VANET domain, dedicated short range communication (DSRC), and wireless access
in vehicular environments (WAVE) are the approved vehicular communication standards
in use. DSRC and WAVE are both based on IEEE 802.11p, and IEEE 1609 – a higher
standard that IEEE 802.11p depends upon. Besides the DSRC (IEEE 802.11p), and WAVE
(IEEE 1609), WiMAX, satellite, and cellular wireless technologies can also be used in
VANETs.
Using WAVE, or the DSRC protocol/communication standard, V2V and V2I
communication is secured against a lot of attacks such as: spoofing, eavesdropping, and
modification attacks, etc. It protects against these attacks using public key, hybrid key, and
elliptical curve cryptography (ECC) techniques. The DSRC channel allocations in USA
consists of 7 channels at 10MHz; that of Europe, however, consists of 5 channels also at
10MHz [94] [30, 219].
DSRC: The 5.850 – 5.925GHz spectrum has been reserved by the U.S. Federal
Communications Commission (FCC) for vehicular communications. The DSRC (IEEE
802.11p originating from IEEE 802.11) is the wireless communication standard for
VANETs having a data rate of between 3 – 27 Mbps using a 10MHz channel with a
maximum transmission range of 1000 meters. DSRC/IEEE 802.11p has low

234
communication latency, and fast link setup time with high data transfer ranges. However,
a drawback of IEEE 802.11p is that as the number of nodes increases, its performance
degrades [36]. It is also plagued by problems such as the presence of collisions, low
throughput, and predictability problems especially in VANETs with large number of nodes
[36]. For situational awareness, vehicles constantly send beacon packets amongst one
another with a frequency of 10 messages/second at a maximum communication range of
150m.
WAVE: The WAVE design/architecture addresses features such as security, safety,
automatic tolls, and traffic efficiency. IEEE 1609.2 reduces message overhead by half
when elliptic curve digital signature algorithm (ECDSA) is used for signature generation
and verification/validation. Verification on demand (VoD), used in IEEE 1609.2 is an
approach to reduce the computational/processing overhead of each connected vehicle by
sampling/selecting a subset of the entire message for processing based on their threat level
instead of the entire population. Like the IEEE 802.11p, the WAVE standard has gone
through a lot of evolutions with specific/specialized standards that are more applicable to
certain domains/problems than others [44] [30, 31] [93] [99] [101] [29] [15, 220, 221]
[101] [20] [21].
3.4 Characteristics
VANETs are a subset of mobile ad hoc networks (MANETs) and other ad hoc networks
sharing similar characteristics with autonomous devices (vehicles/OBUs, RSUs, traffic
lights) acting as routers with frequently changing topologies that transmit information/data
235
from source to destination. Nodes with higher mobility and speeds, more scalability,
frequently changing/dynamic network topologies, predictable mobility, regular
disconnections, transmission medium availability (air), support for anonymity, bandwidth
limitations, susceptibility to attenuations, and transmission power limitations especially as
communication range/distance increases, etc. are some of the most prominent/unique
features of VANETs that distinguish them from MANETs. Besides, VANETs have higher
privacy, safety, and security requirements compared to MANETs [31] [44] [30] [94] [95].
Buttressing, some of the aforementioned points, VANETs possess unique features such as:
Dynamic topology: Nodes in VANETs usually move at very high speeds resulting in short
connection times – especially for nodes moving in opposite directions together with
susceptibility to interferences as a result of reflections from multipath propagations,
climate/weather (natural interferences), etc.
Bandwidth limitations: Reflections, signal fading/delays, diffractions, etc. all limit the
effectiveness of exchanged messages in V2X communication with a maximum theoretical
throughput of 27 Mbps.
Transmission power limitations: VANETs also have limited transmission powers (for up
to a maximum of 1000m).
Energy efficiency: Because of steady power supply from batteries, and other sources
VANETs do not normally suffer from energy limitations as experienced in other mobile
devices such as smart phones. Besides, energy considerations/constraints might be

236
neglected for VANETs especially with respect to energy used by cryptographic algorithms,
because of its efficient/effective energy storage/utilization [30, 31, 44] [95].
4. Security and Privacy Issues in Transportation Cyber-Physical Systems
4.1 Security and Privacy Requirements
Security, safety, and privacy are major requirements of VANET. Security requirements in
VANETs include, but are not limited to: integrity/data trust, confidentiality, non-
repudiation, access control, real-time operational constraints/demands, availability, and
privacy protection. Some of these security requirements are unique to VANETs, but others
are applicable to general security measures.
The following are some more elaborations of the requirements for VANET
security/privacy [97] [31] [94] [95] [96] [44, 104, 220, 222]:
Identification and Authentication: All on-board units (OBUs)/connected vehicles,
road-side units (RSUs), and every other participating entity must be properly authenticated
before joining the network. Authenticating a vehicle/sender by the receiver is important in
order to determine whether the sender is legitimate especially with respect to safety/life-
critical messages. This is true because false data injection in VANETs can be used to
disrupt traffic flow, get undeserved road use priority, and cause accidents or other life
threatening injuries, etc. Authentication (identity verification) prevents privilege
escalation/increase in a node (vehicle, or RSU) authorization level. It also prevents Sybil
attacks i.e. one vehicle cannot take over the entire road by claiming there is an

237
accident/congestion ahead because a vehicle can only possess one unique network
identification number at any given time [223].
Data consistency verification: The system must give the same results/output given
a specified input.
Confidentiality: Not every message in VANETs should be encrypted – for example,
safety related messages. However, message exchanges between and/or among RSUs that
are sensitive in nature e.g. toll payments, internet connections via RSUs, etc. must be
encrypted such that if an adversary gets hold of this information, it will be meaningless.
Secure communication can be realized/achieved using public/asymmetric key
cryptography/encryption. In other words, confidentiality obviates/prevents unauthorized
access [223].
Message integrity/data trust: The system must not permit modifications in transit.
Non-repudiation: Although a driver’s privacy must not be compromised, offending
parties must be reliably made liable/culpable for their actions. Non-repudiation is
dependent on proper authentication. It ensures that an entity/sender (vehicle, or
infrastructure – RSU) cannot feign ignorance of all or part of its action because
auditability/accountability is enforced by storing/maintaining evidence such as a vehicles
route, timestamps, speed, and other actions/violations in a tamper proof device (TPD).
Consequently, a sender cannot deny/refute sending a message – thus providing evidence
for eventual prosecution.
Availability: The system must not experience unscheduled downtime. Availability
ensures continuous operation/performance by designing fault-tolerant, resilient systems,

238
and using devices with high survivability such that normal operations continue even while
under attack and/or parts of the network (devices) have failed/become unavailable. In other
words, continuous availability must be maintained with respect to both anticipated, and
unanticipated usage [223].
Traceability and revocation: The system must maintain a valid and verifiable
log/record of all activities of participating nodes in order to enforce the non-
repudiation/auditability condition. However, maintaining a balance between
auditability/accountability, and privacy in VANETs is a major challenge.
Privacy: The system must not collect unauthorized personally identifiable
information. A major challenge ensues in trying to balance the need for privacy, and the
need for security. In general, however, with respect to privacy, unauthorized persons must
not track a driver’s behavior, and location (past, and present movements), etc. In other
words, personally identifiable information must not be traceable to an actual user [44] [31]
[97].
Satisfaction of real-time constraints: The safety/life-critical nature of VANET
safety applications mandates 100% reliability/dependability with no tolerance for errors.
With respect to VANET safety applications, real-time delivery, reliability, latency,
security, and trust must be guaranteed.
Access control: Using access policies, unauthorized access to privileged/sensitive
information is forbidden by preventing privilege/role escalations.
In summary, balance/tradeoff must be reached between ensuring security, and ensuring
privacy. This is true because some emergency situations may require law enforcement

239
officers, for example, to know where a vehicle is located, and who owns it in order to be
able to respond appropriately. Besides, the desire for privacy and security must not
jeopardize real-time operations.
It is imperative to note that, the above list of security and privacy requirements of VANETs
is not intended to be a comprehensive one – this is true because new requirements usually
emanate upon actual real-world deployments/implementations.
4.2 Security and Privacy Challenges
Just as security, safety, and privacy are major VANET requirements, they are also major
VANET challenges [30] [31] [94, 97] [29, 95] [44] [216]. Security compromises in
VANETs can be fatal/disastrous because of its safety-critical nature. Generally, real-time
communication requirements for responding to safety-critical messages before it becomes
too late, increase in network size as the number of connected vehicles increase, frequent
changes in network topology, transient authentication/security mechanisms, diverse
definitions of security, safety, and privacy with respect to different jurisdictions,
centralized storage/management of keys – who should be responsible for this and why, lack
of user buy-in, etc. are some of the factors/constraints that must be addressed before
VANETs can be widely adopted. In more details, some of the security challenges
respecting VANETs include, but are not limited to:

240
1. High mobility: It is more difficult to ensure security, and non-repudiation because
of the transient nature of V2V and V2I communication interactions owing to frequently
changing network topology/high mobility.
2. Conflict between privacy and security requirements: Generally speaking, more
security usually means less privacy and vice versa. Many drivers will be unwilling to give
up their privacy for some perceived security benefit. Besides, another major challenge is
to balance strong security with good performance.
3. Availability: A high availability requirement is mandated in VANETs especially
because of its safety-critical nature by providing fail-safe, resilient, and fault-tolerant
operations.
4. Low tolerance for errors: With respect to VANETs, more focus must be placed on
preventative security measures rather than corrective/detective ones. This is true because
in a safety/life-critical scenario/application, for example, any infinitesimal delay in the
dissemination of messages to intended recipients can prove fatal/calamitous. Bandwidth
saturation, and communication/processing overheads are some of the drawbacks to real-
time/near real-time communications in VANETs.
5. Key distribution: With lots of participating stakeholders such as government,
vehicle manufactures, etc. it is difficult to ascertain who should be the certificate authority
(CA) responsible for (public) key distribution such that attacks such as Sybil/spoofing
attacks, for example, can be thwarted without compromising the users’ privacy
requirements. Also, interoperability among these different participating entities is also a
major challenge. For example, interoperability amongst different certificate authorities

241
(CAs) residing/situated in different geographic jurisdictions and governed by varying laws
and liabilities, is a major problem besides the privacy problem of vehicle tracking, user
profiling, and vehicle identification through linking.
6. Cooperation: Aligning the interests of manufactures, consumers, and government,
etc. is challenging because of their often divergent interests/goals. For example,
users/consumers may offer fierce resistance to VANET use and will be reluctant to adopt
it because they perceive that they are being monitored, or will subsequently be monitored
by the technology.
More specifically, before VANET technology can be fully embraced by all stakeholders
(direct, and/or indirect), it must address three major areas of challenge: social, economic,
and technical. Some of these challenges are summarized thus [31, 93, 97]:
1. Network scale and dynamics: VANETs need new security different from
conventional approaches because of frequent changes in network topology, scale, and
mobility, etc.
2. Privacy: Driver and vehicle anonymity militates against privacy violations,
however, an offending driver can feign ignorance of committing a crime if 100% privacy
is implemented. Consequently, a tradeoff between privacy and security is imperative.
3. Trust: Abuse may become inevitable if authorities are given
unmitigated/unabridged powers. Consequently, misuse of authority by an authorized entity
e.g. the police is a major privacy concern. However, if appropriate security and privacy
measures are implemented, the challenge of not having enthusiastic users of the technology

242
because of security, and privacy concerns can be allayed by focusing on the benefits of the
technology such as reduced road traffic accidents (safety), traffic efficiency/mobility, and
provision of infotainment services, etc. This is true because although there are risks
associated with the use of cellphones/the internet, people still use them today because they
are convinced that their benefits far outweigh the risks.
4. Cost: Installation costs with respect to consumers/road users/drivers, and
authorities (infrastructure) costs must be kept to the lowest/barest minimum in order to
ensure quick and easy adoption.
5. Gradual deployment: Of VANET technology must be supported owing to high
infrastructure cost factors and other ramifications/constraints respecting stakeholders.
The above list of possible VANETs challenges is not intended to be an exhaustive one –
this is true because new challenges usually surface/manifest upon actual real-world
deployments/implementations.
4.2.1 Security Actors/Entities
Some actors who are directly or indirectly involved in VANET security include, but are
not limited to: vehicle driver, on-board unit (OBU), road-side unit (RSU), third parties e.g.
certificate authorities (CAs) – trusted, and untrusted stakeholders – and the adversary (who
can be internal/authenticated vs. external, rational vs. irrational, active vs. passive, and
local vs. extended); it is important to note that the OBU/vehicle, the RSU, and all order
legitimate entities/nodes can be normal or malicious [30]. In other words, besides vehicles,

243
other entities/nodes such as RSUs, and traffic lights are also susceptible to attacks based
on identified vulnerabilities [31].
4.2.2 Attacker Profiles
As aforesaid, attackers in a VANET environment can be categorized as: outsider vs.
insider, malicious vs. rational, active vs. passive, and local vs. extended [97] [44] [31].
1. Outsider vs. insider: It is very difficult for an outsider to carry out devastating
attacks. Insiders, however, unleash more damages than outsiders because they are
legitimate members of the network and they have been fully authenticated. Insiders can
also be in the form of industrial insiders who can intentionally inject destructive code into
a system.
2. Malicious vs. rational: Malicious attackers are undirected – they derive no specific
gain/benefit in attacking/bringing down the system; as an example of malicious attackers,
pranksters can cause accidents or illusions of one such that other following vehicles are
forced to slow down. Rational attackers are, however, more predictable, focused/goal-
directed/benefit-oriented, and seek a specific result. For example, the rational attacker can
use eavesdropping/impersonation, and message delay/suppression to attack a network.
3. Active vs. passive: Active nodes (insiders) have network authorization; passive
nodes (outsiders) can only do things such as eavesdropping – they are not authenticated to
operate within the network. Using eavesdropping as a passive attack mechanism, a
government agency, for example, can try to categorize/profile drivers based on their
behavior if given unabridged powers.

244
4. Local vs. extended: Local attackers are restricted in geographical
influence/coverage/scope while extended attackers reach to larger geographical areas.
4.2.3 Attack Classifications
Some VANET security vulnerabilities/possible attacks can be carried out via jamming,
interference, eavesdropping, etc. [30] [215]. Figure 76 shows an incomprehensive list of
possible threats and attacks against some VANET system/security requirements.
Figure 76: Examples of VANET threats and attacks [30].
It is pertinent to note that developing a comprehensive threat model on possible VANET
attacks is a prerequisite for developing effective countermeasures against them [93].
Consequently, we further elaborate upon some of the aforementioned VANET security
threats/attacks and their corresponding compromised security goals/requirements [31] [44,
93] [30] [29] [224] [101]:

245
2. Availability attacks: Availability in VANETs can be compromised by denial of
service (DoS), replay, and channel jamming attacks, etc. Availability attack aims at
disruption of network operation; for example, it may focus on safety, and payment-related
applications leading to wireless channel jamming, and denial of service (DoS) attacks with
the aim of causing the network not to perform its proper/normal functions resulting in
network downtime/unavailability. It manifests in the form of:
Denial of Service attacks: Can be perpetrated by a malicious internal/external node.
It can be used to prevent vehicles from getting critical safety-related messages by jamming
the communication channel – it is a malicious and active attack. For example, a DoS attack
can be used to prevent real-time verification of legitimate/critical message signatures
because of replay attacks from spurious/non-critical messages used to overwhelm the
system/queue.
Some DoS attack examples can be executed via:
- Jamming attack: Usually an intentional attack aimed at communication channel
(physical layer) disruption. Jamming aims at precluding/starving other nodes from utilizing
available resources [91].
- Greedy behavior attack: Greedy drivers can give the illusion of an accident on a
lane/road in order to take over the entire roadway/lane by causing following vehicles to use
alternative routes/lanes/paths.

246
- Blackhole attack: This is an attack on availability where a malicious node hoards
received packets/messages and refuses to participate in routing it from source to
destination. This attack can also lead to man in the middle attack.
- Grayhole attack: This is a malicious attack that selectively deletes/excludes some
data packets meant for certain applications.
- Sinkhole attack: Here, a malicious node tries to redirect data packets to pass through
it – it can thus decide to either modify these packets that it has attracted to itself or it can
completely delete it. A sinkhole attack can be the first step in executing a grayhole and/or
blackhole attack.
- Malware attack: Can be perpetrated, for example, during software updates where
malicious software can be installed advertently, or inadvertently [30].
- Wormhole attack: This is a DoS attack that creates the illusion that two far
away/widely separated malicious nodes are close to each other’s communication range.
Consequently, other neighboring nodes falsely believe that both nodes are adjacent to each
other when this is not so [30] [44] [216].
- Broadcast tampering attack: Can be executed by legitimate nodes that hide safety
related messages leading to accidents.
- Spamming attack: Has the effect of consuming precious bandwidth leading to
collisions.
3. Authentication and identification attacks: Manifests itself via:
Sybil attack: This has the effect of causing a malicious node to possess more than
one (many) identities at the same time which can be used to create a fallacious sense of

247
congestion as shown in Figure 77. Adequate authentication (security) guards against
Sybil/spoofing attacks where a single vehicle can create a false notion of the presence of
an accident, for example, when there is none [44] [216].
Figure 77: Sybil attack used to create an illusion of a congested condition in order to get
undue roadway usage priority for example [103].
GPS spoofing/position faking attack: This can be used to deceptively provide a
position/location of a node that is untrue. Cheating with positioning, speed, and identity
information applies to both safety and payment related applications such that an attacker
can feign knowledge/ignorance of committing a malicious attack [93].
Node impersonation attack: Impersonation involves cheating with somebody
else’s/some entities (vehicles, RSUs, or traffic lights) identity [93]. It violates
authentication by allowing one or more nodes in the network to have the same network
identification number which, in normal circumstances, must be unique. Consequently, the
impersonating/malicious node can feign ignorance of an attack since the non-repudiation

248
security requirement has been violated with impunity. To be useful as evidence (after/post-
collision), incidents must use digital signatures that support non-repudiation with no
support for anonymity [29] [30] [216]. Property (vehicle, or RSU), location/position, and
identity authentication mechanisms can be used to prevent impersonation attacks. It makes
sure that the communicating entities are authorized together with their positions (location
authentication) [97] [225] [44]. Impersonation attacks can be carried out by insiders to the
network and it is normally rational and active [97].
Tunneling attack: Here, the attacker establishes a tunnel to another part of the
network using a different communication channel – this is very similar to a wormhole
attack.
Key and/or certificate replication attack: Duplicates unique keys/certificates
making unique identification of nodes/vehicles difficult especially in disputes/accident
resolutions because of the ambiguity created.
4. Confidentiality attacks: Confidentiality ensures that only authorized persons have
access to data/resources. An attack on confidentiality manifests itself via eavesdropping,
and traffic analysis (passive) attacks; this can, not only lead to confidentiality violations,
but also to violations of privacy.
Eavesdropping: Here, the adversary tries to obtain access to secret/confidential data
via a vehicle (moving/stationary), or a compromised infrastructure/RSU. Implementing
confidentiality requirements can be used to mitigate this type of attack via encryption.

249
5. Integrity and data trust attacks: Ensures that data has not been modified in transit
i.e. it makes sure that what was sent is the same as what was received. This attack manifests
itself in:
Masquerading attack: Here, the attacker hides under a false identity (mask) that
has the appearance of emanating from a legitimately authenticated node, and uses this to
generate untrue/lying messages or to execute blackhole attacks.
Replay attack: A unique feature of replay attacks is that unlike other types of
attacks, replay attacks can be perpetrated by illegitimate nodes. Message replay has the
negative effects of consuming/occupying precious bandwidth resulting in the dropping of
priority messages from the queue when full. Message deletion and replay are used to bring
down the efficiency of the system; they cannot be prevented by using digital signatures like
message forgery, and modification can [29, 30].
1. Suppressing/fabricating/modifying/tampering with messages: Violates the
integrity/non-repudiation security requirement. Fabrication attacks manifest via
dissemination of false/bogus information, cheating with sensed information, tunneling,
masquerading, and hidden vehicle attacks [44]. Hidden vehicle attacks prevents vehicles
from participating in traffic condition information dissemination thus breaking the multi-
hop message distribution path; it is usually active and perpetrated by an insider [216]. By
deleting, forging, replaying, or modifying a message containing parameters such as vehicle
speed, timestamp, location, or direction, the receiving entity/vehicle can over or
underestimate the severity of the message leading to collisions and other
negative/undesirable events/consequences [29]. Specifically, message modification can

250
trigger a false sense of security when a critical message that should trigger collision
avoidance mechanisms/applications is downgraded and vice versa. This attack is
perpetrated by a rational attacker [216].
Illusion attack: Here, voluntary sensors that generate false data are placed in the
network. Because these malicious sensors are properly authenticated, they cannot be
prevented by authentication mechanisms [30]. It is important to note that illusion,
modification, masquerading, and replay/broadcast attacks are also considered attacks on
authentication, and identification.
6. Non-repudiation/accountability attacks: This attack manifests itself in the form
of loss of traceability/auditability of events or activities.
Other VANET attacks/threats include:
Privacy attacks: This manifests itself as:
Tracking: Identity disclosure attack can be carried out via tracking of
vehicles/nodes [93].
Social engineering [226].
Timing attack: Here, critical messages are intentionally delayed such that they
arrive out of sync and cannot be subsequently used [30]. It can involve adding a delay to a
sent message or not sending the message at all; this has the effect of negatively affecting
availability, and delaying time/safety-critical information from promptly getting to its
intended destination. Here, message integrity is not compromised – it only arrives out of
251
sync, or might not even arrive at all; with safety-critical messages, the consequences of this
attack can be calamitous [97] [44] [216].
Hardware tampering: Can be done by the manufacturer; it can be mitigated by
physical inspection and the use of the trusted platform module (TPM). Here, it is required
that availability be maintained. The attacker can be from the inside, or outside; rational and
active [31] [97].
Brute force attack: Can be committed/executed against message confidentiality,
encryption keys, or identification and authentication. For example, a brute force/dictionary
attack can be performed in order to discover the network identification (ID) number of a
node (vehicle, RSU, or traffic light) [30].
Man in the middle attack: This attack violates authentication, integrity, and non-
repudiation mechanisms. It is executed by having an intermediate/middle node or vehicle
relaying messages to/from one vehicle to another while the transmitting vehicle falsely
assumes that it is in direct communication with the receiving vehicle/node. Consequently,
an innocent sending node can be falsely accused of a malicious activity/action they are not
responsible for. Non-repudiation, and use of digital signatures and certificates can be used
to mitigate against this type of attack [97].
Besides, with respect to the security requirements of a system, we can also categorize
attacks in VANETs thus:
Attacks on authentication and secrecy
Network availability attacks

252
Stealthy attacks on integrity of service(s) [44].
Raya and Hubaux [93] identified three major areas/classifications of security
threats/attacks in VANETs namely: safety application, payment-based application, and
attacks on privacy. With respect to VANET safety applications, because of the safety-
critical nature of VANETs, they are normally accompanied by high levels of liability.
Respecting privacy, because of V2V and V2I (V2X) communication, it is easier to track
vehicles and/or their drivers.
An exhaustive/comprehensive list of all possible adversaries, requirements, and
countermeasures in a security system is unrealistic/impractical, especially prior to adequate
(full/partial) real-world implementations/deployments – as is the case with VANETs [44].
To this end, the various attacks and threats here presented are only an incomprehensive list.
5. Security and Privacy Countermeasures in Transportation Cyber-Physical
Systems
5.1 Cryptography Mechanisms
Figure 78 shows a pictorial view of the encryption/decryption process.
Symmetric/secret/private key cryptography: Uses the encryption key to easily
obtain the decryption key. It thrives on the fact that the secret key is never revealed to
outsiders beside the communicating entities. However, the requirement that both parties
possess the secret key is a drawback respecting symmetric key cryptosystem in relation to
its asymmetric/public key counterpart [30]. Symmetric/private key cryptography is no

253
longer used for VANETs and in most other domains because of its scalability issues/high
overhead in key maintenance cost, especially when network size increases [31].
Asymmetric/public key cryptography: Here, the public key – which as the name
implies is made public – is used for encrypting the message, while the private key (not
made public) is used for message decryption. The wireless access in vehicular
environments (WAVE) uses public/asymmetric key cryptography. Public key/asymmetric
cryptography is used/applied in digital signatures via digital certificates issued by
certificate authorities (CAs). It is, however, slower/less efficient than its symmetric/private
key cryptography counterpart. Besides, the process of verifying the digital signature of the
sender by the receiver in order to verify that the message is authentic is not very amenable
to real-time/safety-critical applications requiring little or no latency/delay [29] [227].
Figure 78: Encryption and decryption processes [30].
5.2 Cryptography Protections
By the use of cryptography, the following security requirements can be attained/satisfied:
Confidentiality: Most exchanged VANET messages are transmitted
unencrypted/unprotected excepting sensitive security/privacy related one’s such as

254
electronic toll payments [30]. For example, in general, safety-related messages are
normally not secured by encryption/other security mechanisms because of the absence of
critical/private data/information [44].
Authentication: Implemented via digital signatures.
Integrity: Implemented via one way hash functions.
Non-repudiation: Ensures that all participating nodes cannot feign ignorance of all
or part of its legitimate communication/activities.
5.3 Public Key Infrastructure (PKI)
A public key infrastructure (PKI) simply consists of several hardware, software, and
procedures, etc. interacting together. It is normally employed to handle key exchanges as
the number of participating users/nodes increases i.e. the PKI certification authority (CA)
acts as a middle-man/trusted third party between/among users. It maintains the life cycle
of digital certificates – certificates in VANETs go through the issue, distribution,
validation, and revocation lifecycles [30].
Identification, authentication, authorization, confidentiality, and non-repudiation are
achieved using PKI’s, and digital certificates. It is, however, imperative to note that
interoperability, privacy and the need to constantly update the certificate revocation list
(CRL) in real-time/near real-time is a major challenge in VANETs [31]. It is also germane
to note that using PKI’s alone cannot protect against privacy attacks/breaches as they were
not originally designed to provide privacy [31] [99] [100].

255
5.3.1 VANET’s Public Key Infrastructure (VPKI)
Similarly, VANET/vehicular PKI (VPKI) is used to efficiently authenticate
communicating entities/nodes in a VANET environment using digital certificates/IDs
issued by the certificate authority (CA) [30] [29]. Each vehicle on the road is validated by
a certificate authority (CA) trusted by both parties. Key management in VANETs requires
anonymously installing, certifying, and revoking a public/private key pair by a certificate
authority (CA) [44].
Interoperability, inter-domain authentication and authorization between and among CAs
located in different geographical jurisdictions/boundaries is another challenge i.e. how
authentication and authorization can be efficiently, and effectively performed between two
or more intersecting CA domains (in real/near real-time). As a solution to the
interoperability and authentication problems identified in VANETs, Inter-domain
Authentication System (AS) was proposed [31].
As earlier said, although the use of PKI’s alone provide countermeasures against security
compromises, they are helpless against privacy issues/compromises [31]. Privacy can,
however, be maintained by using a centralized public key infrastructure (PKI) together
with a trusted third-party [31] [97]. Encryption/cryptography is also used to
ensure/maintain privacy [97].
A disadvantage of using VPKI is that it introduces delays in terms of signature generation,
transmission, and verification especially respecting safety/life-critical messages [93].

256
Besides, because of the large number of PKI's and the amount of instructions required to
be executed, real-time digital signature verification suffers from significant
performance/message overheads requiring expensive computational resources/power –
delays resulting in overheads in computation and unnecessary bandwidth over-utilization
are undesirable [29].
5.3.2 Group Signature
Group-based signatures, an alternative to using PKI’s, reduce the amount of exchanged
keys in VANETs [31]. However, group-based signature and identity-based signature
approaches can suffer from scalability problems especially as the number of vehicles in the
group/cluster continually increases i.e. computational complexity increases as scalability
increases [31].
5.4 Security Countermeasures for Securing VANETs
Most VANET implementations only start addressing security issues when a breach has
occurred as security is not built/designed into most implementations – this is also true of
many other IT domains besides VANETs [93].
5.4.1 Generic Security Mechanisms
In VANETs, like many other security domains, proactive (preventative) security
mechanisms supersedes reactive (detective) one’s [97] [44].
5.4.1.1 Prevention Techniques

257
Preventative security techniques are analogous to intrusion prevention mechanisms in other
network security domains; they can be implemented via:
1. Digital signature-based techniques: Ensures authentication, integrity, and non-
repudiation of participating entities. It can be certificate-based/certificate-void. The
efficiency of digital signatures especially as scalability increases has not been sufficiently
studied/ascertained.
2. Proprietary system design: This is aimed at making it difficult for an adversary to
penetrate the system using known vulnerabilities.
3. Temper proof hardware: Can securely store evidence from malicious
modifications/attacks using tamper resistant/proof device (TPD) [44].
5.4.1.2 Detection Techniques
Reactive security measures are synonymous to intrusion detection techniques in other
network security domains [44]. When preventive security mechanisms fail to deter an
attack, detective security measures must be triggered as a fallback mechanism. Efficiently
and reliably implementing detective security measures can go a long way in even
preventing collisions and other safety-critical compromises/disasters; they can be
implemented via:
5. Signature-based detection: Compares network traffic with previously known attack
signatures. It is effective only against known attacks/exploits. Some of its advantages
include: simplicity, and fast attack detection, etc. On the other hand, some of its

258
disadvantages are: incapacitation against new attacks because it depends on regular updates
to the attack signature database.
6. Anomaly-based detection: Detects unusual network activity based on predefined
thresholds. Some of its advantages are: does not require frequent updates of attack
signature database; it has a downside of being susceptible to producing many false-positive
results as a result of the vague/equivocal definition of normal versus abnormal
use/behavior.
7. Context verification: The normal operation of entities in a VANET e.g. RSUs,
vehicles, and traffic lights, together with their environmental interactions, can be used to
deduce/infer the presence or absence of attacks/abnormal operation/behavior [31] [44]
[98].
5.4.2 Specific Security Solutions for VANETs
1. Specific attack-based solutions: Privacy-preserving detection of abuses of
pseudonyms (P2DAP) militates against Sybil attacks in VANETs. It is, however,
incapacitated with respect to collusion attacks [44]. Channel, communication technology,
and key switches/changes are some security solutions against attacks such as DoS.
2. Use of digital signatures: Ensures message security; they can be used to provide
authentication, integrity, and non-repudiation security requirements. Message security can
be protected/ensured using vehicular PKI. With respect to vehicular PKI, each vehicle uses
its pair of public/private key pairs to sign/verify all sent/broadcasted messages [97].
3. Use of electronic license plates (ELPs): EPLs can be issued by transportation
authorities to uniquely identify vehicles [93].

259
4. Use of encryption: Confidentiality is ensured by encrypting all messages before
sending them [97].
5. Event data recording: Ensures that all events/incidents amongst participating
entities (vehicles, RSUs, and traffic lights) are meticulously logged/stored for audit
purposes which may be used for establishing liability/exonerating from liability.
6. Use of tamper-proof device/hardware: This is a physical security mechanism used
to secure messages (incoming, and outgoing), keys, etc. Electronic license plates (ELPs)
and VPKI can be kept safe/secured using tamper-proof hardware [93]. Besides, all events
in VANETs must be logged using event data recording which can subsequently be retrieved
and analyzed for audit purposes.
7. Data correlation: As a protection against false data injection attacks, data
correlation verifies the relevance, credibility, and consistency of data/information
emanating from various sources before making actionable decisions with them [93].
8. Secure positioning: Can be maintained using GPS security measures.
9. Secure routing: Secure routing/communication can be identity-based – unicast
(sent to an individual node), and/or geography-based (multicast) – sent to two or more
nodes (a group of nodes) [44]. Secure routing protocol (SRP) [228] and secure beaconing
[229] fall under the category of ID-based routing protocols because they are susceptible to
privacy breaches/violations [44]. In general, because security is usually included as an
afterthought, most secure routing protocols violate privacy requirements [44].
10. Secure MAC: Besides securing routing, securing the medium access control (MAC)
is also pertinent [44] [230] [231].

260
5.5 VANET Security Architectures
In the VANET literature, many authors have proposed several VANET security
architectures, primarily, dealing with is security, and privacy requirements. Some of these
architectures include, but are not limited to:
5.5.1 Global Security Architecture
Because privacy, safety and security are some of the main deliverables of VANETs,
Engoulou et al. [97], proposed a global security architecture for dealing with the security
requirements, threats, and challenges of VANETs. This global security architecture
consists of five levels grouped into three stages namely: security material, and
authentication level (prevention stage); trust, and message/data level (detection and
correction stage); and cryptographic level (privacy stage) [97] [94].
5.5.2 Security Architecture for VANET (SAV)
In addition, attacks in VANETs were described with respect to its: nature, scope,
consequences/impact, and target as shown in the security architecture for VANET (SAV)
[97]. It consists of basic security elements (public key infrastructure, positioning and time),
single hop security (integrity, non-repudiation, authentication, and confidentiality), multi-
hop security (end-to-end security mechanisms for confidentiality, authentication, non-
repudiation), and services protection (routing, location services, warning alarms, etc.) [97].

261
6. VANET Privacy
Privacy risks escalate when participating entities (vehicles, RSUs, and traffic lights) give
out more information than is absolutely necessary [31]. Identity privacy, location privacy,
and data privacy are the three main domains of privacy in VANETs. Anonymity can be
used to ensure privacy using pseudonyms; pseudonyms are generic aliases/identifiers used
to avoid the use of real/personally identifiable information [31]. Most pseudonimity
techniques can successfully guarantee location, and identity privacy; pseudonyms can also
be used to prevent the malicious vehicle/individual/node linking (user profiling), and
tracking [31]. Certificate authorities (CA’s) manage a nodes (vehicle, traffic light, or RSU)
identity using public and private key cryptography/encryption [97].
Serna-Olvera [31] proposed a privacy aware security framework that consists of:
4 Authentication System (AS): Using policy mapping, the AS enables the
interoperability of PKI’s, and certificate validation across untrusted domains.
5 Anonymous Information Retrieval (AIR): Uses query permutation and query
forgery/manipulation to prevent node/vehicle tracking that can be used for user profiling.
6 Attribute-Based Privacy (ABP): Uses incomplete/selective attribute/parameter
disclosures to prevent vehicle tracking.
7 Trust Validation Model (TVM): As shown in Figure 79, TVM uses trust-
levels/sensitivity levels to avoid unauthorized access to a vehicles private information that
can cause a vehicle to believe a lie in order to deceive or manipulate it [31]. The Online
Certificate Status Protocol (OCSP) is used to increase the efficiency of the verification of

262
the status of a vehicle based on the certificate revocation list (CRL) in a situation where
you have many certificate authorities (CAs). It also reduces network traffic resulting in
better bandwidth management.
Figure 79: Using trust validation model (TVM) to avoid acting on malicious message
dissemination that can compromise both security, and privacy [31].
Summarily, the Privacy Enhancing Model (PEM) which consists of Attribute-Based
Privacy (ABP) protocol – using Attribute-Based Credentials (ABC) and Anonymous
Information Retrieval (AIR) protocol – can be used to ensure that a vehicle cannot be
tracked, or linked with an identifier; in doing this, privacy/anonymity is preserved [31].
The danger of possible leak of personally identifiable information – a privacy concern –
263
can be mitigated using a privacy enhancement feature to encrypt the hash of the senders
public key which can only be decrypted by authorized parties/entities [29]. In other words,
encryption can be used to ensure privacy [29].
Finally, security, and reliability are major prerequisites for dependable and wide-usage of
VANET safety-critical applications [44]. More security means less privacy and vice versa;
hence, a tradeoff must be reached because in order to enhance security, some privacy must
be sacrificed and vice versa [44]. Conflicts between security and efficiency/performance,
security and quality-of-service (QoS), together with other conflicting actors/requirements
must be resolved in order to improve/increase the real-world adoption of VANETs [44]. A
holistic view of security from the ground up is essential, but lacking in VANETs – more
research is needed in this area [44] [232].
7. Main Contributions: Test-bed Setup
Here, we give a detailed description of our simulation architecture/platform, input,
parameters, and evaluation scenarios towards the attainment of our research goals and
objectives.
A number of research efforts have sort to address the privacy and security challenges of
VANETs, however, most of these works are mostly abstract/theoretical without the use of
real-world data, realistic road networks, or both [30] [230] [231] [44]. In order to bridge
this gap, we used both real-world data, and road networks in our study.
4.4 V2X Simulation Infrastructure
264
In order to carry out our V2X jamming attack scenario, we used the V2X simulation
runtime infrastructure (VSimRTI) co-simulation platform which comprises traffic,
application, and communication simulators; the reason for this is that the use of traffic
simulators alone is inadequate in fulfilling the requirements of V2X simulation [98]. In
order to simulate V2X communication, every participating equipped vehicle must be
running an application. In our scenario, our equipped vehicles were running our incident
warning application (IWA).
4.5 Real-World Dataset
Our use of real-world traffic data was born from the fact that many existing studies [1-14]
are void of them – hence, they simulate an overly simplistic and unrealistic traffic condition
using unrealistic road networks/topologies which cannot be deemed representative of real-
world practice. As a result, six weeks, weekday traffic volume data patterns were collected,
and analyzed before feeding its output to the SUMO traffic simulator [132]. Because most
traffic congestions are experienced in the morning (5:00 a.m./7:00 a.m. – 10:00 a.m.), and
evening (4:00 p.m. – 7:00 p.m.) rush-hours, we chose the morning traffic condition as our
primary simulation focus [37, 53]. Table 1 and Table 2 – in Chapter 3, Section 5.2 – shows
a snapshot of our real-world traffic data.
4.6 Simulation Input and Parameters
As aforesaid, we used the V2X simulation runtime infrastructure (VSimRTI) for the
purposes of our study because of its unique capability of coupling various types of
simulators together in a flexible manner [134]. In summary, using road network data from

265
OpenStreetMap8, as input, eWorld9 was used to generate events such as ice, road
accidents/obstacles, etc. which were subsequently exported as inputs to the simulation for
urban mobility (SUMO) traffic simulator [142] [144]. SUMO generated vehicular traffic
was then used as input to the VSimRTI cellular simulator, or the Java in simulation
time/scalable wireless ad hoc network simulator (JiST/SWANS) [133, 144]
network/communication simulator which handles the exchange of messages among nodes
such as vehicles, road-side units (RSUs), and traffic lights; they can also modify a vehicles
position, speed, direction, etc. through a socket interface at runtime using the SUMO
Traffic Control Interface (TraCI) [33]. The VSimRTI cellular simulator – used for
cellular/V2I/centralized message(s) transmission, and the JiST/SWANS
network/communication simulator – used for ad hoc/V2V/decentralized message(s)
transmission are both responsible for relaying vehicular situational awareness messages
with cooperative awareness messages (CAM), and messages that trigger rerouting with
decentralized environment notification messages (DENM), etc. upon detecting roadway
congestions caused by ice, accident, and fog; both CAM and DENM have message lengths
of 1500 bytes each [133, 134, 148]. Some of the simulator parameters used in our
simulation study include, but are not limited to: communication range (300m), frequency
(5.9GHz), protocol (Cached Greedy Geo-cast [CGGC] geo-broadcasting protocol),
wireless communication protocol/standard (IEEE 802.11p), bandwidth (10 Mbps); our
8 http://www.openstreetmap.org 9 http://eworld.sourceforge.net/

266
total simulation runtime/duration was set at 7000 seconds with a total simulation area of
77000 x 67000 m.
In addition, the following JiST/SWANs network/communication simulator parameters
respecting our vehicles and road-side units (RSUs) were used in our simulation (Table 6)
– which is typical of real-world conditions.
Table 6: Vehicle and RSU simulation parameters.
Simulation
Parameter
Value
Vehicle RSU
Antenna height 1.5 m 10.0 m
Transmission power
18.5
dbm
17
dbm
Transmitter/Receiver
antenna gain
0 dbm 0 dbm
Receiver sensitivity -91 dbm
-91
dbm
Receiver threshold -81 dbm
-81
dbm
Specifically, we conducted our vehicle-to-infrastructure (V2I)/centralized jamming attack
scenario using the VSimRTI cellular (CELL) simulator. Using the cellular simulator, V2X

267
messages can be configured to be transmitted to nodes/vehicles/RSUs via broadcast,
geocast, or unicast addressing/communication [233]. Besides, VSimRTI is responsible for
time management, managing/controlling/directing communication amongst coupled
simulators, and ensuring that each application-equipped vehicle/node is simulated
individually [233].
Figure 80 shows our study area in the VSimRTI Websocket visualizer on Google Map with
IWA-equipped vehicles (red colored entities/nodes – vehicles, RSUs, or traffic lights –
signifies V2X message (CAM/DENM) transmission, while green colored entities/nodes –
vehicles, RSUs, or traffic lights – signifies V2X message (CAM/DENM) reception); IWA-
unequipped/classic/traditional entities/nodes – black colored vehicles, RSUs, or traffic
lights – signifies no V2X message transmission or reception support in our simulation.

268
Figure 80: Simulation visualization using the VSimRTI Websocket visualizer on Google
Map [152].
4.7 Evaluation Scenarios
In seeking to find/ascertain the traffic efficiency, safety/effectiveness, and resilience to
attacks of vehicle-to-vehicle (V2V), and vehicle-to-infrastructure (V2I) communications,
the following scenarios were employed as shown in
Figure 81.
4.7.1 Scenario A (Traffic Efficiency)

269
Vehicles using our IWA are notified to reroute because of the detected road traffic
congestion ahead. Classic/non-equipped vehicles do not receive/respond to these reroute
messages, hence they drive heedlessly/blindly to meet the congested situation. As a result,
our incident warning application (IWA) equipped vehicles bypass this incident while
unequipped/classic vehicles suffer the consequences especially manifesting in
aggravated/exacerbated trip time (TT), fuel consumption (FC), and CO2 emission, etc.
4.7.2 Scenario B (Safety)
The metric we used to evaluate safety is with respect to the total number of IWA-equipped
vehicles that actually rerouted/heeded the reroute message/directive to take an alternative
route to its destination in relation to the entire population equipped to reroute. Accordingly,
100% safety is attained if all vehicles that got the reroute request actually heeded them and
vice versa. We assume that all our incident warning application (IWA) equipped vehicles
that received the message/directive to reroute actually heeds it. Using the human machine
interface (HMI), V2X equipped vehicle drivers are notified of traffic-related
incidents/events [98] [140, 141].
4.7.3 Scenario C (Jamming Attack)
This attack has a negative effect on scenarios A, and B respectively. In this attack, we
disrupt the wireless communications channels ability to disseminate traffic related
information to intended recipients in a progressive manner. As previously stated, a
jamming attack is usually an intentional attack aimed at communication channel
disruption/congestion. Jamming aims at precluding/starving other nodes from utilizing

270
available resources – it is a type of denial of service (DoS) attack that is active and
malicious in nature [30]. In order to evaluate the effect of a jamming attack on our
simulation setup, we simulated a situation where a malicious insider overwhelms the
radio/communication channel with spurious signals thereby obviating legitimate vehicles
from receiving reroute/safety-critical messages (as a result of wireless network congestion)
in order to effectuate rerouting that will lead to bypassing of the identified congestion on
the original/primary route. In order to execute our jamming attack, we gradually decreased
the available communication channel percentage from 100% (totally uncompromised –
100% availability) to 0% (totally compromised – 0% availability) at 5% decrements.
Attacks were performed while observing/measuring corresponding driver reactions. The
ratio of IWA-equipped vehicles to classic /unequipped vehicles was kept constant at 50%
each for the entirety of our simulation runs.
Specifically, from our real-world traffic data, on our evaluated route, a maximum of 144
vehicles every 5 minutes was recorded at congestion prevalent times (5 a.m. – 10 a.m. in
the morning) during weekdays [146]. Consequently, we simulated a road incident on
Constitution Avenue NW, between this time interval, that has the effect of blocking its
entire 3 lanes for 40 minutes. Thereafter, the default travel speed limit of all vehicles was
reduced from 50km/h to 20km/h for another 50 minutes because of slippery road segments
caused by frozen ice and compounded by the presence of fog around the area that resulted
in poor driving visibility; the length of the affected roadway is 82.3 meters [28]. Without
the traffic incident on Constitution Avenue NW, every vehicle emanating from John

271
Hanson Hwy from the West (source) through New York Ave NE, and finally to Dulles Toll
Road in the East (destination) will traverse/enter Constitution Avenue via 9th Street.
However, because of the traffic incident on Constitution Avenue, on getting to 9th Street,
our incident warning application (IWA) equipped vehicles will receive reroute
messages/directives from the road-side unit (RSU), located on 9th Street, to bypass
Constitution Avenue. As a result, the IWA- equipped vehicles avoid the congestion on
Constitution Avenue, by talking an alternative route via H. Street NW to Custis Memorial
Pkwy before finally arriving at the final destination – Dulles Toll Rd. On the other hand,
unequipped/classic vehicles suffer the consequences of the congestion on Constitution
Avenue because they are uninformed/unintelligent.
In addition, using the Handbook Emission Factors for Road Transport (HBEFA), we
evaluated the performance of the following six major pollutants: PMx (particulate matters
or particulate mass value), NOx (comprising NO2 [nitrogen dioxide], and NO [nitrogen
monoxide]), HC – hydrocarbons ( consisting of benzene, toluene, CH4 [methane], NMHC
[non-methane hydrocarbons], and xylene), CO2 (carbon dioxide), and CO (carbon
monoxide) [132, 161, 164, 165] [60, 132, 161] [60, 67, 132, 162-164]. Each driver’s
emission footprint is displayed via the vehicles on-board diagnostics display (OBD).

272
Scenario Convert
Start
End
OpenStreetMap Data
+
Scenario Database
Application Simulator
Traffic Simulator
Incident Warning
Application (IWA)
Environment Simulator
JiST/SWANS Communication
Simulator
VSimRTI Cellular
Simulator
Is IWA-equipped?
Is Jammed?
Follow Alternative Route(s)
Follow Congested Route
Is V2V/Ad hoc?
VANET Architecture
Yes
No
Is Simulation Run = 21?
No No
Yes
Yes
VSimRTI
Mapping Configuration
VSimRTI Configuration
Files
Road-side Unit (RSU)
Ratio
Node Type
IWA-equipped/
Classic Ratio
Yes
NoSimulation
Results
Figure 81: Jamming attack simulation workflow [76] [166].
273
8. Evaluation Results and Discussion
In this section, the results of our jamming attack and its effect on traffic efficiency, and
safety applications of vehicle-to-vehicle (V2V), and vehicle-to-infrastructure (V2I)
communications are presented and later compared. Again, it is important to note that the
ratio of IWA-equipped vehicles to classic /unequipped vehicles was kept constant at 50%
each for the entirety of our simulation runs. The suffixes _a, _n, and _r shown in Figure 82
(a – f), and subsequently in this chapter refer to the evaluated performance metrics with
respect to vehicles that are running our incident warning application (IWA) used to bypass
the road traffic congestion on Constitution Avenue by circumnavigating through other
alternative/secondary routes (_a) – these vehicles are suffering from the adverse effects of
the jamming attack, vehicles that are running our IWA, but are not negatively
affected/influenced by the jamming attack (_n), and vehicles that travel through the
primary/original route via Constitution Avenue free of congestions (_r).
8.1 Jamming Attack on Vehicle-to-Vehicle (V2V) Communication
Figure 83 shows the visualization of our jamming simulation attack on V2V
communication. Figure 82 (a – f) show the results of our 21 simulation runs with respect
to some of our evaluated performance metrics from 0% to 100% communication channel
availability each at 5% steps/increments.

274
(b)
48.3
48.35
48.4
48.45
48.5
48.55
48.6
0 5
10
15
20
25
30
35
40
45
50
55
60
65
70
75
80
85
90
95
100
Tra
vel
Dis
tan
ce (
km
)
Available Communication Channel (%)
TD_a TD_n TD_r
(a)
0
10
20
30
40
50
60
70
0 5
10
15
20
25
30
35
40
45
50
55
60
65
70
75
80
85
90
95
100
Tra
vel
Tim
e (m
inu
tes)
Available Communication Channel (%)
TT_a TT_n TT_r
Figure 82: Performance of some evaluated metrics in relation to available communication channel as a result of jamming attack.
(c)
0
1
2
3
4
5
6
7
8
9
0 5
10
15
20
25
30
35
40
45
50
55
60
65
70
75
80
85
90
95
100
CO
2-e
mis
sion
s (g
/km
)
Available Communication Channel (%)
CO2_a CO2_n CO2_r
(d)
0
0.5
1
1.5
2
2.5
3
3.5
0 5
10
15
20
25
30
35
40
45
50
55
60
65
70
75
80
85
90
95
100
Fu
el C
on
sum
ed (
lite
rs)
Available Communication Channel (%)
fuel_a fuel_n fuel_r
(e)
0
20
40
60
80
100
120
0 5
10
15
20
25
30
35
40
45
50
55
60
65
70
75
80
85
90
95
100
Safe
ty R
ate
(%
)
Available Communication Channel (%)
safety_a safety_n safety_r
(f)
0
10
20
30
40
50
60
70
80
0 5
10
15
20
25
30
35
40
45
50
55
60
65
70
75
80
85
90
95
100
Em
itte
d V
ehic
les
Available Communication Channel (%)
reroute_yes_a reroute_no_a total

275
Figure 83: Visualizing our V2V jamming attack simulation scenario in the VSimRTI ITEF
on Google Map [152].
Figure 84 shows several IWA-enabled vehicles (in blue) congested on Constitution Avenue
NW at 100% available communication channel that failed to heed the change route/reroute
request using V2V communication.
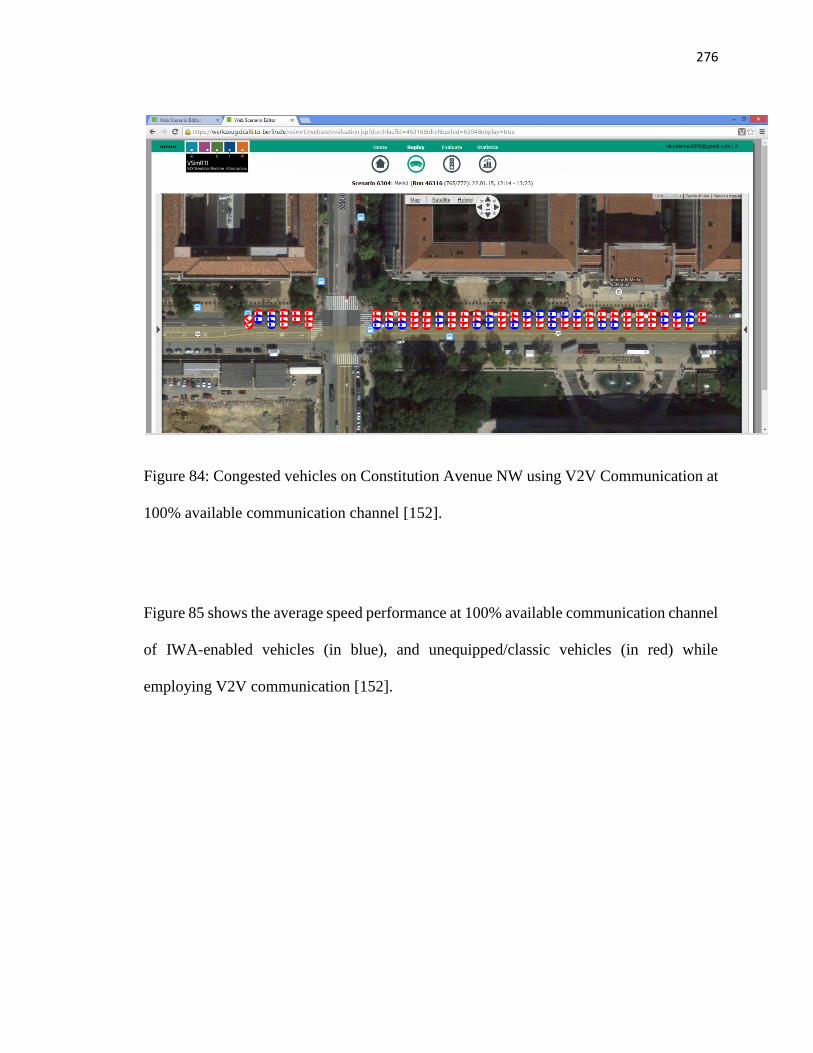
276
Figure 84: Congested vehicles on Constitution Avenue NW using V2V Communication at
100% available communication channel [152].
Figure 85 shows the average speed performance at 100% available communication channel
of IWA-enabled vehicles (in blue), and unequipped/classic vehicles (in red) while
employing V2V communication [152].

277
Figure 85: Travel speed against time of 50% IWA-enabled vehicles using V2V
communication at 100% available communication channel [152].
Again, the ratio of IWA-equipped vehicles to classic/unequipped vehicles was kept
constant at 50% each throughout the entire 21 simulation runs. Besides rerouting vehicles
away from the primary roadway to the secondary/alternative one in order to avoid
congestion, our IWA equipped vehicles also have prior knowledge of the congested states
of these alternative/secondary routes such that vehicles are not blindly rerouted from one
congested roadway to another – this is true when using V2V communication, but not V2I
communication [13] [5].

278
With respect to traffic efficiency (shown in Figure 82 [a – d]), our average best case result
– with respect to travel time [TT] – was obtained at 100% communication channel
availability with little or no difference observed amongst the evaluated performance
metrics. In the same vein, the average worst case scenario was, evidently, observed at 0%
available communication channel with the following recorded losses: travel time [TT]:
(60.92%) – 3655.56 seconds, average speed (38.06%) – 29.01km/h, PMx (3.16%) – 0.02g,
CO (4.18%) – 5.81g/m, CO2 (9.28%) – 0.65g/km, NOx (5.68%) – 8.06g, HC (15.76%) –
0.37g, and fuel consumed (9.28%) – 0.25 liters. The only improvement was observed
respecting travel distance [TD] at: (0.33%) – 161.5 meters. Similarly, with respect to the
average second worst case result obtained at 5% available communication channel, the
following losses were observed: travel time [TT]: (54.92%) – 1260.63 seconds, average
speed (35.64%) – 27.16km/h, NOx (5.51%) – 0.84g, PMx (3.25%) – 0.02g, CO (4.07%) –
5.65g/m, CO2 (8.81%) – 0.61g/km, HC (14.66%) – 0.34g, and fuel consumed (8.81%) –
0.24 liters. The only improvement was observed with respect to travel distance [TD] at:
(0.29%) – 144.68 meters. Generally, IWA-equipped vehicles under the influence of the
communication channel jamming attack (_a) travelled at an average speed of 61.66 km/h
from source to destination while IWA supported/equipped vehicles, free from the jamming
attack (_n), maintained an average speed of 76.2 km/h. Consequently, because attacked
vehicles travelled at lower and less uniform speeds owing to congestion, more fuel was
utilized in the attack scenario than with the attack-free vehicles scenario.

279
Similarly, with respect to safety (Figure 82 [e – f]), the average best case safety
performance was observed at 100% available communication channel having a safety rate
of 66.66% i.e. only 48 out of 72 equipped vehicles heeded the reroute/change route
directive – 24 equipped vehicles did not. On the other hand, the average worst case safety
performance was observed at 0% available communication channel resulting in a 0% safety
rate because none of the 72 IWA-equipped vehicles got the reroute/change route directive
consequent upon the completely jammed radio/communication channel. Similarly, the
average second worst case safety performance was observed at 5% available
communication channel with a safety rate of 6.94%. This means that only 5 out of 72
equipped vehicles heeded the change route directive i.e. 67 equipped vehicles did not.
The overall poor performance (with respect to the evaluated metrics) of V2V
communication is attributable to the fact that not all IWA-equipped vehicles that received
the reroute directive actually heeded them. Possible reasons why these reroute/change route
directives were not heeded by IWA-equipped vehicles could be because they got the
message a little bit too late in order to enable them to utilize it to bypass the incident on
time (relative to their current travel speed) before it became too late [98]. It is also evident
that as the available communication channel of IWA-equipped/V2X vehicles increase, the
number of vehicles that responded to the change route request to reroute also increased.
This is true because unlike V2I communication which is primarily single-hop
communication, V2V communication relies on multi-hop communication with leading
vehicles transmitting messages such as road conditions/congested states to trailing or

280
following vehicles. In a situation where more classic vehicles outnumber V2X vehicles
within a given communication range i.e. 300m, these safety-critical messages may stop
midway as there are not enough relays/equipped vehicles that can convey these messages
beyond their communication range. This is one reason why safety-critical messages are
best disseminated via single-hop (V2I communication) rather than multi-hop (V2V
communication). Also, because of high V2X message exchanges sequel to high IWA-
equipped vehicles/nodes – especially at high communication channel availability and
increased travel speeds – particularly present in a highway scenario – packet/message
collisions can result in packet/message drops, corruption, and/or delays sequel to
bandwidth saturation, etc. It is also noteworthy that another possible reason why V2V
communication did not perform better as expected could be because of man-made, and
natural interferences. Man-made interferences such as presence of obstacles, high-rise
buildings, etc. and natural interferences such as fogs, heavy rains, tornadoes, etc., diminish
the efficiency, and effectiveness/accuracy of V2V communications. This is especially true
because V2V communication simulations performed on highway scenarios tend to produce
more effective and predictable results than those done in other rural/city scenarios because
of the infrequent interferences from high-rise buildings and other obstacles that
limit/interfere with the V2V multi-hop communication path. This is why, often times,
V2V/decentralized/ad hoc communication is complemented with
V2I/centralized/broadcast communication as a hybrid – hence the name V2X
communication [8].

281
8.2 Jamming Attack on Vehicle-to-Infrastructure (V2I) Communication
Figure 86 shows the visualization of our jamming simulation attack on V2I
communication.
The best case traffic efficiency scenario was observed at 100% available communication
channel resulting in little or no change in the evaluated performance metrics, including
safety rate.
Figure 86: Visualizing our V2I jamming attack simulation scenario in the VSimRTI ITEF
on Google Map [152].
Figure 87 shows no IWA-enabled vehicles (in blue) congested on Constitution Avenue
NW at 100% available communication channel that failed to heed the change route/reroute
request using V2I communication.

282
Figure 87: Only classic/unequipped vehicles congested on Constitution Avenue NW using
V2I Communication at 100% available communication channel [152].
Figure 88 shows the average speed performance at 100% available communication channel
of IWA-enabled vehicles (in blue), and unequipped/classic vehicles (in red) while
employing V2I communication [152].

283
Figure 88: Travel Speed against time of 50% IWA-enabled vehicles using V2I
communications at 100% available communication channel [152].
From
Figure 89 [a – d], in the worst case traffic efficiency scenario (0% available
communication channel), the following losses were observed: travel time [TT]: 125.24%
(34.22 minutes/2053.66 seconds), average speed: 55.82% (59.64km/h), PMx: 4.37%
(0.027g), CO: 5.99% (8.18g), CO2: 13.83% (930.86g), NOx: 8.23% (1.23g), HC: 24.3%
(0.53g), and fuel consumed: 13.83% (0.37 liters). The safety rate (
Figure 89 [e – f]) also fell from 100% to 0% because no vehicle (out of a total of 72 IWA-
equipped vehicles) received the change route/reroute directive requisite to avoid the traffic

284
incident on Constitutional Avenue NW because the entire available communication
channel has been jammed. The second worst case safety performance was, evidently,
recorded at 5% available communication channel with the following losses: travel time
[TT]: 117.07% (31.99 minutes/1919.76 seconds), average speed: 54.14% (57.85km/h),
PMx: 3.97% (0.025g), CO: 5.46% (7.44g), CO2: 12.82% (862.87g), NOx: 7.58% (1.13g),
HC: 22.58% (0.5g), and fuel consumed: 12.82% (0.34 liters). The second worst case safety
performance was recorded at 5% available communication channel as: 6.94% because
only 5 out of 72 IWA-equipped vehicles actually rerouted in response to the change route
request i.e. 67 did not.
Also at 0% available communication channel, the travel distance increased by 0.49%
(242.26 meters) because more vehicles took the congested route i.e. Constitution Avenue
NW. Overall, the average speed of IWA-equipped vehicles fell from 106.84km/h (in the
attack free scenario), to 47.2km/h in the attack scenario resulting in a decrease in average
speed of 55.82% (59.64km/h). This resulted in more deterioration in fuel consumption
levels, together with other evaluated performance metrics.
With respect to safety performance (
Figure 89 [e – f]), the best case safety performance (100%), and the worst case safety
performance (0%) were observed at 100%, and 0% available communication channel
respectively. This is true because at 100% available communication channel, all 72 IWA-
equipped vehicles heeded the change route directive on time, and vice versa.

285
Figure 89: Performance of some evaluated metrics in relation to available communication channel as a result
of jamming attack.
(b)
48.3
48.35
48.4
48.45
48.5
48.55
48.6
48.65
48.7
0 5
10
15
20
25
30
35
40
45
50
55
60
65
70
75
80
85
90
95
100
Tra
vel
Dis
tan
ce (
km
)
Available Communication Channel (%)
TD_a TD_n TD_r
(a)
0
10
20
30
40
50
60
70
0 5
10
15
20
25
30
35
40
45
50
55
60
65
70
75
80
85
90
95
100
Tra
vel
Tim
e (m
inu
tes)
Available Communication Channel (%)
TT_a TT_n TT_r
(c)
0
1
2
3
4
5
6
7
8
9
0 5
10
15
20
25
30
35
40
45
50
55
60
65
70
75
80
85
90
95
100
CO
2-e
mis
sion
s (g
/km
)
Available Communication Channel (%)
CO2_a CO2_n CO2_r
(d)
0
0.5
1
1.5
2
2.5
3
3.5
0 5
10
15
20
25
30
35
40
45
50
55
60
65
70
75
80
85
90
95
100
Fu
el C
on
sum
ed (
lite
rs)
Available Communication Channel (%)
fuel_a fuel_n fuel_r
(e)
0
20
40
60
80
100
120
0 5
10
15
20
25
30
35
40
45
50
55
60
65
70
75
80
85
90
95
100
Safe
ty R
ate
(%
)
Available Communication Channel (%)
safety_a safety_n safety_r
(f)
0
10
20
30
40
50
60
70
80
0 5
10
15
20
25
30
35
40
45
50
55
60
65
70
75
80
85
90
95
100
Em
itte
d V
ehic
les
Available Communication Channel (%)
reroute_yes.a reroute_no.a total_a

286
8.3 Jamming Attack on V2V versus V2I Communications: A Comparison
With respect to traffic efficiency performance (Figure 90 [a – d]), on the one hand, our best
case performance of V2I communication over V2V communication was observed at 100%
available communication channel with the following recorded improvements: travel time
[TT]: 28.55% (10.92 minutes/655.36 seconds), average speed: 40.20% (30.63km/h), PMx:
1.3% (8.41mg), CO: 1.85% (2.57g/m), CO2: 4.17% (0.29g/km), NOx: 2.53% (0.38g), HC:
7.02% (0.16g), and fuel consumed: 4.17% (0.11 liters). Travel distance, however, increased
by 0.16% (0.08km/80.75meters) because, using V2I communication, more IWA-equipped
vehicles rerouted – thereby taking a longer route/path to get to the destination over V2V
communication.
On the other hand, our worst case traffic efficiency performance was recorded at between
0% - 15% available communication channel with no difference was observed between V2I
communication, and V2V communication, because both VANET architectures equally
rerouted the same number of vehicles.
With respect to safety performance (Figure 90 [e – f]), the best case safety performance of
V2I communication over V2V communication was also observed at 100% available
communication channel because, while all IWA-equipped vehicles that got the change
route/reroute directive using V2I communication rerouted (resulting in a safety
performance of 100%), only 48 out of the total of 72 IWA-equipped vehicles – i.e. a safety
rate of 66.66% – actually heeded the change route/reroute directive using V2V

287
communication resulting in a deficit of 33.33% using V2V communication in relation to
V2I communication.
In the same vein, the worst case safety performance of V2I communication over V2V
communication was observed at 20% available communication channel were V2I
communication gave a 4.16% superior safety performance over V2V communication. In
other words, 17 out of 72 IWA-equipped vehicles heeded the change route request using
V2V communication – resulting in a safety rate of 23%, while 20 out of the same 72 IWA-
equipped vehicles heeded the reroute/change route directive using V2I communication –
resulting in a safety rate of 27.77%.

288
Figure 90: Performance of some evaluated metrics in relation to available communication channel as a
result of jamming attack.
(b)
48.3
48.35
48.4
48.45
48.5
48.55
48.6
48.65
48.7
0 5
10
15
20
25
30
35
40
45
50
55
60
65
70
75
80
85
90
95
100
Tra
vel
Dis
tan
ce (
km
)
Available Communication Channel (%)
TD.v2v_a TD.v2i_a TD_n TD_r
(a)
0
10
20
30
40
50
60
70
0 5
10
15
20
25
30
35
40
45
50
55
60
65
70
75
80
85
90
95
100
Tra
vel
Tim
e (m
inu
tes)
Available Communication Channel (%)
TT.v2v_a TT.v2i_a TT_n TT_r
(c)
0
1
2
3
4
5
6
7
8
9
0 5
10
15
20
25
30
35
40
45
50
55
60
65
70
75
80
85
90
95
100
CO
2-e
mis
sion
(g/k
m)
Available Communication Channel (%)
CO2.v2v_a CO2.v2i_a CO2_n CO2_r
(d)
0
0.5
1
1.5
2
2.5
3
3.5
0 5
10
15
20
25
30
35
40
45
50
55
60
65
70
75
80
85
90
95
100
Fu
el C
on
sum
ed (
lite
rs)
Available Communication Channel (%)
fuel.v2v_a fuel.v2i_a fuel_n fuel_r
(e)
0
20
40
60
80
100
120
0 5
10
15
20
25
30
35
40
45
50
55
60
65
70
75
80
85
90
95
100
Safe
ty R
ate
(%
)
Available Communication Channel (%)
safety.v2v_a safety.v2i_a safety_n safety_r
(f)
0
10
20
30
40
50
60
70
80
0 5
10
15
20
25
30
35
40
45
50
55
60
65
70
75
80
85
90
95
100
Em
itte
d V
ehic
les
Available Communication Channel (%)
reroute_yes.v2v_a reroute_no.v2v_a total reroute_yes.v2i_a reroute_no.v2i_a

289
As earlier emphasized upon, confidentiality, integrity, and availability (CIA) are the major
security goals/requirements of ITS/VANETs. To this end, a jamming attack – a type of
denial of service (DoS) attack – was executed against both V2V, and V2I communication
with a view of determining their resilience respecting traffic efficiency, and safety. In
summary, our high-level results show that V2I communication was more resilient to the
jamming attack implemented against its radio/communication channel than V2V
communication respecting both safety, and traffic efficiency. One reason for the superior
performance of V2I communication over V2V communication can be attributable to the
fact that, although V2I communication requires more bandwidth, it is, however, less
susceptible to attacks when compared to V2V communication as has been reported in
literature [30, 31, 44, 212-215]. Besides, respecting our centralized/V2I communication
scenario, IWA-equipped vehicles are informed about the congested condition on
Constitutional Avenue NW via broadcast communication i.e. geo-routing/casting
employing single-hop communication/propagation such that all vehicles within the
geographic/broadcast radius receive the change route/reroute directive. In the same vein,
respecting our decentralized/V2V scenario, IWA-equipped vehicles are informed of the
congested condition on Constitutional Avenue NW using geo-routing/casting employing
multi-hop communication/propagation from source to destination. However, at low
IWA/V2X-equipped vehicles ratio, multi-hop communication/propagation is susceptible
to failure because of the insufficient number of equipped vehicles necessary to
convey/relay the message(s) from source to destination [158] [167].
In closing, our results concur with existing studies that assert that safety-critical messages
are best disseminated using single-hop communication especially in a complex,

290
heterogeneous driving environment having a mixture of classic and V2X vehicles in equal
or unequal proportions such as ours. As evidently shown by our previous results in Chapter
4, V2X communication, indeed, results in improved safety, and traffic efficiency; however,
these improvements are mostly dependent on several factors which can be man-made
(internal), natural (external), or a combination of both. Overall, as the communication
channel available to incident warning application (IWA) equipped vehicles increase,
performance with respect to travel time (TT), safety, and other performance metrics also
increase – the opposite is also true [13] [140, 141].
A jamming attack can also be executed via a timing attack. As aforesaid, in light of a timing
attack, critical messages are intentionally delayed such that they arrive out of sync and
cannot be subsequently used [30]. It can involve adding a delay to a sent message or not
sending the message at all; this has the effect of negatively affecting availability, and
delaying time/safety-critical information from promptly getting to its intended destination;
respecting safety-critical messages, the consequences of this attack, as we have lucidly
seen, can be calamitous [97] [44] [216].
As previously stated/alluded to, denial of service attacks compromise availability by
jamming/flooding the network with overwhelming data. This attack can be carried out by
an insider/outsider, and rational/malicious attacker; however, more devastating attacks
usually emanate from an insider. Some mitigation techniques against DoS attacks include,
but are not limited to: use of frequency hopping, communication channel and key
switches/changes by the on-board unit (OBU) [97] [44]. Besides, building redundancy into
sensors and other ITS equipment/technology can be used to ensure fail-safe/resilient

291
operations. This can also be used to mitigate/lessen the severity of attacks against the
availability security requirement such as a jamming attack [15]. Applying techniques such
as graceful performance degradation, attack isolation/localization, network traffic load-
balancing, and defense-in-depth/layered security mitigation techniques can be used as a
countermeasure against attacks aimed at, particularly, compromising the availability
security requirement/goal.
9. Remarks
Generally speaking, intelligent transportation system (ITS) security attacks can be in the
form of message: deletion, modification, forgery, and replay attacks, etc. As one amongst
many mitigation techniques/countermeasures, real-time digital signature verification must
be done with little or no computational and performance overheads especially in safety/life-
critical scenarios in validating the authenticity of disseminated message(s) [29]. In
addition, ITS challenges are mostly domain specific – general communication security
measures are not directly suitable unless they are contextualized to the specific
requirements of ITS. Owing to this, and other imperative reasons, in this chapter, for each
security functional requirement, we have elucidated countermeasures/mitigation
techniques, risks, and possible attacks/vulnerabilities that can be launched/exploited
against it with a view of fostering the security of transportation cyber-physical systems.
Besides, in this chapter, we have empirically shown/demonstrated the adverse effects of
jamming attacks – a type of denial of service (DoS) attack – on the wireless
radio/communication channels (physical layer) ability to disseminate safety-critical
messages to intended/equipped vehicles in order to satisfy the availability security

292
goal/requirement. From our experimental results, we have also demonstrated that vehicle-
to-infrastructure (V2I) communication architecture outperformed vehicle-to-vehicle
(V2V) communication with respect to resilience against jamming attacks. By using
countermeasures/techniques such as building redundancy into systems/ITS equipment in
order to engender fail-safe operations – a type of layered security mechanism/defense-in-
depth – and implementing periodic/regular frequency hopping/changes, etc. attacks on the
availability security goal/requirement can be, to a large extent, mitigated – if not
completely eradicated [97] [44].
In closing, in the future, there is projected to be an astronomical leap in the number of
electric vehicles on the road. Besides, the amount of CO2 – together with other greenhouse
gases (GHG) – emitted into the environment can be radically reduced because of the advent
of electric/other hybrid vehicles. This is one of the major reasons why the United States
has been estimated to have about one million electric/hybrid vehicles by 2015 – which is
still expected to grow [68]. With this, however, also comes the challenge of modeling and
adequately securing the electricity generation, distribution, and storage
demands/requirements of electric vehicles in the smart grid.
293
Chapter 8
Conclusions and Future Research
In this section, we reiterate our empirical research findings based on our overall research
aim and specific research objectives/goals. We also give some recommendations for future
research based on our experiences and we again reiterate some of our unique contributions
to knowledge.
Final Remarks
In this dissertation, we have empirically demonstrated that, indeed, some tangible benefits
respecting safety, and traffic efficiency are derivable from intelligent transportation system
(ITS)/vehicular ad hoc networks (VANETs) using two VANET architectures: vehicle-to-
vehicle (V2V)/inter-vehicle communication (IVC), and vehicle-to-infrastructure (V2I)
communication in a realistic scenario.
First and foremost, we developed a generic real-world ITS test-bed, and a mobile
application called Incident Warning Application (IWA) using real-world data, and road
networks on which we evaluated the traffic efficiency performance of two popular
vehicular routing algorithms: Dijkstra, and A* (Astar) routing algorithms. Our results show
that no significant difference was observed respecting travel time (traffic efficiency)
performance between these two algorithms.
Next, using the aforementioned test-bed, we also evaluated the traffic efficiency/mobility,
and safety benefits of V2V/IVC, and V2I communication architectures respecting vehicles

294
equipped with our IWA. Our results show that V2I communication outperformed V2V
communication in relation to our reference/chosen roadway.
Also, using over 24 classification, and regression supervised machine learning algorithms,
we have shown that classification tree (Ctree), and regression tree (Rtree) gave the best
performances respecting the evaluation metrics of prediction speed/efficiency, and
prediction accuracy/effectiveness in reliably prognosticating traffic patterns/conditions.
We have also shown that depending on the goal/scenario/situation in question, the choice
of one machine learning algorithm over another may be necessary/pertinent/imperative,
thus requiring/necessitating some kind of tradeoff.
Next, using two major driver models mostly prone to accidents and distracted driving –
young drivers (ages 16 – 25 years), and middle-age drivers (ages 30 – 45 years), we also
evaluated the influence of distracted driving on the ITS goals of improved mobility/traffic
efficiency, and safety in a realistic scenario. Our results show that middle-age drivers
outperformed younger drivers in mitigating the influence of distracted driving using our
developed in-vehicle Driver Notification Application (DNA).
Finally, as earlier noted, confidentiality, integrity, and availability (CIA) are the major
security goals/requirements respecting the ITS/VANET ecosystem. To this end, using the
aforementioned simulation test-bed/setup, we evaluated the performance of V2V/IVC, and
V2I communication architectures under the influence of a type of denial-of-service (DoS)
attack – jamming attack – on both safety, and traffic efficiency. Our results show that V2I
communication outperformed V2V communication respecting both safety, and traffic
efficiency performances by showing more resilience/resistance to jamming attacks. We

295
have also shown that safety/life-critical messages are best disseminated using V2I/single-
hop communication as a result of its better accuracy in disseminating messages to intended
receivers in relation to V2V/multi-hop communication.
Contribution to Knowledge
Here, we highlight some of our major contributions to knowledge emanating from this
research study.
As has been lucidly documented from our comprehensive/extensive review of literature,
most research in the ITS/VANET domain are either void of real-world data, road networks,
or both. By fulfilling/satisfying these limitations in our study, our results can be directly,
and reliably used by traffic engineers, road users/operators, transportation
authorities/agencies, and other concerned stakeholders in comprehending the
results/ramifications of actual real-world implementations/deployments in a less expensive
simulation setting first.
Also, to the best of our knowledge, respecting our comprehensive/extensive evaluation of
over 24 supervised machine learning classification, and regression algorithms, our work is
the first to evaluate these many number of algorithms in the same setting – employing a
multi-metric evaluation/comparison approach. This is true because of the extreme
difficulty, tenacity/perseverance required in completing such a gigantic project.
Next, respecting the comparison of the mobility/traffic efficiency, and safety performance
cost of V2V/IVC, and V2I VANET communication architectures, to the best of our

296
knowledge, our work is the first to empirically/experimentally evaluate them in a realistic
scenario.
Again, to the best of our knowledge, or work is the first to empirically evaluate the
influence/impact of a Denial of Service (DoS) attack against the availability security
requirement – jamming attack – and distracted driving – a major human factors research
challenge – using the V2X simulation runtime infrastructure (VSimRTI) in a realistic
environment.
Last, but not least, the results of this research has been critically evaluated, peer-reviewed,
and published in several reputable/prestigious/esteemed/refereed conferences across the
globe, thus validating its importance and its unique contribution to existing knowledge,
especially, respecting the ITS/VANET domain.
Research Limitations
As aforesaid/alluded to throughout the entirety of this dissertation, realistic simulation
studies are most imperative, and often inevitable as a first step before real-world
studies/deployments/implementations can commence; one major reason for this is because
of the expensive nature of the later.
Consequently, although our work is amongst one of the few most realistic studies one can
find in the research literature – largely because of our use of difficult to secure/obtain real-
world data, and difficult to prepare realistic road networks corroborated by several research
studies [1-14] – actual real-world studies/implementations are most vital in
corroborating/validating the results we obtained solely in a simulation-based environment.

297
As may be obvious to the experienced reader, the resources necessary to execute this
gigantic project/task is beyond the scope and reach of these authors; however, this is
amongst one of our future aspirations. Nevertheless, we have also emphasized that because
of the realistic nature of our work, compared with most other existing research efforts in
the intelligent transportation system (ITS)/vehicular ad hoc network (VANET) domain,
ours can be more reliably/confidently utilized by all concerned stakeholders such as road
users/operators, traffic engineers, public authorities, and transportation
agencies/authorities, etc. to better understand the implications/ramifications of actual real-
world deployments of this promising technology – first in a least expensive simulation
setting – prior to more expensive, and often wasteful, real-world ventures. Also, real-
world/real-time, streaming/dynamic ITS big data analytics consumes a lot of system
resources requiring the use of computers of the supercomputer category/class – which, at
the moment, is outside the reach of this research/researchers within the scope, cost/budget,
and time constraints of this study. Nevertheless, we will endeavor to implement/execute
this in our future studies.
Besides, we also plan to develop/implement a dedicated driving simulator that can be
coupled to our existing V2X simulation runtime infrastructure (VSimRTI) architecture;
this will improve the effectiveness of our future human factors research results – which, in
this study was solely simulation-based.
Lastly, because various vehicles have different mass/weight, acceleration/deceleration,
engine design (manual versus automatic transmission), make, model, and manufacturer
specifications, etc., they all have different fuel consumption levels for example [62].
298
Consequently, our use of only one vehicle class/category – passenger vehicles – may not
be deemed representative to that obtainable in the real-world. However, again, within the
complexity, scope, time, budget/cost, and technical limits of this research work, our choice
of this vehicle class/category is not alien to that used by similar prestigious
researchers/works in the ITS/VANET domain; this is especially true for simulation-based
research works.
Recommendations for Further Research
In the course of this pertinent study, several ideas were generated that could not be
implemented within the scope, time, and cost limitations/boundaries of this work. As a
result, in this section, we try to elucidate some of the areas were further work is required.
According to the United States Department of Transportation (U.S. DOT), the
influence/impact of introducing the following new technologies possess a high-risk/high
reward characteristics especially respecting the ITS goals of safety, and security [15]:
Introduction of robotics using automated vehicles: This mandates changes in the
following incomprehensive areas: new infrastructure constructions/modifications;
inculcating varying levels of automation that have the capability of ensuring that the system
can fail safely, and full control can be regained by the human driver whenever necessary
or at predetermined conditions/occasions – whatever these conditions might be; economic,
legal, regulatory, and interoperability demands/requirements [15].
Electric vehicles (EVs): Vehicles consisting of electronic circuit boards and their
use of real-time/streaming data respecting the ITS goals of improved eco-friendly
driving/reduction in levels of energy and fuel usage is necessary. This is also true of other

299
hybrid vehicle models that can use both fuel/gas and other forms of energy such as
electricity, together with other forms of renewable energy. Alternatives to fuel/gasoline
(renewable energy) in transportation is essential in reducing the greenhouse
contribution/footprint of transportation and its related applications [15] [68]. This has
become very imperative because Europe plans to completely ban petrol/gas, and diesel
vehicles by 2050, while the UK plans to do the same by 2035 [234]. Similarly, in 2015, the
U.S. has been projected/estimated to have about one million hybrid/electric vehicles [68].
In addition, with the advent of electric vehicles, their comprehensive impact on the
available smart/power grid capacity is worthy of further evaluation studies – especially in
more realistic scenarios like ours. This is true because most existing studies cannot be
directly used in the real-world because they are either void of real-world data (which is
very difficult to obtain/secure based our experience), real-world road networks, or both [1-
14].
Besides, the use of current advances in 4th generation wireless
technologies/protocols such as long-term evolution (LTE), and Internet Protocol Version
6 (IPv6) and its impact on the goals of ITS and its interacting ecosystem is imperative. It
is important to note that amongst all other ITS security requirements identified by
stakeholders – including the U.S. DOT – such as: security, mobility/traffic efficiency, and
reduced fuel/energy consumption (environmental impacts), safety has always remained
most paramount. Consequently, any advances/improvements in all other areas of interest
that vitiates safety is highly undesirable and is guaranteed not to be adopted in the real-
world [15].

300
Also, in the future, we will endeavor to investigate the following interesting and
challenging research areas respecting the VANET/ITS domain:
VANET architecture: The effect of jamming attacks, together with other types of
security, and privacy attacks on V2V2I (hybrid) communication needs to be further
evaluated/studied. To this end, this will be the focus of our research in the near future. This
is especially true because sometime this year (2015), V2V communication technology for
vehicles will become a federal requirement in the United States [47]. In addition, security,
privacy, safety, and reliability (trust) of disseminated information is a very important area
of research not dealt with in this dissertation, but is an interesting area of research [8]. Also,
throughput, packet deliver ratio (pdr), end-to-end delay, and traffic information
dissemination/exchange time – together with other networking/communication/security
related metrics of the various ITS/VANET architectures will be the focus/subject of our
future research [8].
VANET clouds: The security, privacy, and storage challenges present in traditional
VANETs are also similar to those of VANET clouds [109] which consists of the following
three architectures: Vehicles using Clouds (VuC), Vehicular Clouds (VC), and Hybrid
Vehicular Clouds (HVC) [109] [235] [236]. VANET clouds have become an interesting
and attractive area of research because it mitigates some of the limitations of traditional
VANETs. For example, signal degradations as a result of various obstacles along the line-
of-sight (LOS) path, transmission range limitations, and other natural and/or man-made
conditions can result in packet drops thereby adversely affecting vehicle-to-vehicle (V2V),
and vehicle-to-infrastructure (V2I) communication efficiency and effectiveness. VANET
clouds, however, can extend the current transmission range limitations of traditional

301
VANETs – since they are not primarily LOS-based i.e. they are non-LOS [109]. Besides,
the big data generated by traditional VANETs can be easily migrated to the cloud in a cost
efficient and effective manner [109]; these and other challenges/promises respecting
VANET clouds also will be our primary research focus in the near future.
Human factors (HF): Safety, traffic efficiency, security, and privacy, etc. are only
as effective as the weakest link in the chain – this is often the unpredictable human driver,
hence the name human-in-the-loop challenge. Consequently, the influence of human factor
characteristics such as perceptual, motor, and cognitive skills/capabilities on the
aforementioned parameters is very much requisite both in field, and simulation studies.
Besides, as more self-driving/driverless cars are currently being promulgated by more
companies such as Google, it will be quite interesting to study their effects in a
heterogeneous driving environment consisting of other types of driving models such as
completely human driven, and semi-automatic (hybrid) driving. In other words, it is
absolutely imperative to identify ways of integrating human factors in requirements
gathering, design, and implementation of cyber-transportation systems (CTS)/ITS [21].
Cryptography: Because of the safety/life-critical nature of ITS and its strict
requirement of little or no tolerance for delays/latencies/errors in message dissemination,
the influence of various cryptographic algorithms on timely, and accurate message
dissemination is imperative, especially as the network size begins to scale/increase.
Besides, other challenges respecting cloud storage/processing; big data management of
both historical, and streaming/real-time/dynamic data; and application of various other
machine learning algorithms towards reliable and realistic traffic pattern prediction using
several designs/architectures such as client/server (centralized), and peer-to-peer

302
(decentralized) architectures, etc. is imperative and require more studies in order to further
the VANET/ITS domain. As an extension to our current work, we will also evaluate the
efficiency, and effectiveness of our machine learning algorithms respecting other pertinent
evaluation metrics such as: CPU usage, memory usage, and ease of interpretation of results
[173]. However, it is imperative to note that because of the prevalence of widespread,
complex, large-scale, and heterogeneous dynamic real-time datasets, it is a major challenge
to integrate these data sources into an integrated model that is useful for efficient and
effective knowledge discovery that will be useful for accurate, real-time decision making
[4].
In closing, respecting the relatively new research domain of ITS, it is normal for
requirements, challenges/problems, etc. to be in a constant state of flux because of the
flexible nature of research – especially prior to full, or partial real-world implementation.
Consequently, new requirements/problems are bound to emanate during or after real-world
deployments; hence, policy, technology, and requirements changes must be, inevitably,
anticipated sooner, or later [15].

303

304
References
[1] N. Cenerario, T. Delot, and S. Ilarri, "A Content-Based Dissemination Protocol for
VANETs: Exploiting the Encounter Probability," IEEE Transactions on Intelligent
Transportation Systems, vol. 12, pp. 771-782, 2011.
[2] J. Sahoo, E. H. K. Wu, P. K. Sahu, and M. Gerla, "Binary-Partition-Assisted MAC-Layer
Broadcast for Emergency Message Dissemination in VANETs," IEEE Transactions on
Intelligent Transportation Systems, vol. 12, pp. 757-770, 2011.
[3] M. Rondinone, J. Maneros, D. Krajzewicz, R. Bauza, P. Cataldi, F. Hrizi, J. Gozalvez, V.
Kumar, M. Röckl, and L. Lin, "iTETRIS: a modular simulation platform for the large scale
evaluation of cooperative ITS applications," Simulation Modelling Practice and Theory,
vol. 34, pp. 99-125, 2013.
[4] Z. Bowu, X. Kai, C. Xiuzhen, H. Liusheng, and B. Rongfang, "Traffic clustering and online
traffic prediction in vehicle networks: A social influence perspective," in INFOCOM, 2012
Proceedings IEEE, 2012, pp. 495-503.
[5] M. P. Hunter, W. Seung Kook, K. Hoe Kyoung, and S. Wonho, "A Probe-Vehicle-Based
Evaluation of Adaptive Traffic Signal Control," IEEE Transactions on Intelligent
Transportation Systems, vol. 13, pp. 704-713, 2012.
[6] C. Sommer, R. German, and F. Dressler, "Bidirectionally Coupled Network and Road
Traffic Simulation for Improved IVC Analysis," IEEE Transactions on Mobile Computing
(TMC), vol. 10, pp. 3-15, 2011.
[7] M. Fazeen, B. Gozick, R. Dantu, M. Bhukhiya, and M. C. Gonzalez, "Safe Driving Using
Mobile Phones," IEEE Transactions on Intelligent Transportation Systems, vol. 13, pp.
1462-1468, 2012.
[8] I. Leontiadis, G. Marfia, D. Mack, G. Pau, C. Mascolo, and M. Gerla, "On the Effectiveness
of an Opportunistic Traffic Management System for Vehicular Networks," IEEE
Transactions on Intelligent Transportation Systems, vol. 12, pp. 1537-1548, 2011.
[9] V. Milanes, J. Godoy, J. Villagra, and J. Perez, "Automated On-Ramp Merging System for
Congested Traffic Situations," IEEE Transactions on Intelligent Transportation Systems,
vol. 12, pp. 500-508, 2011.
[10] N. Tuan-Duc, O. Berder, and O. Sentieys, "Energy-Efficient Cooperative Techniques for
Infrastructure-to-Vehicle Communications," IEEE Transactions on Intelligent
Transportation Systems, vol. 12, pp. 659-668, 2011.
[11] J. Dong and H. S. Mahmassani, "Stochastic Modeling of Traffic Flow Breakdown
Phenomenon: Application to Predicting Travel Time Reliability," IEEE Transactions on
Intelligent Transportation Systems, vol. 13, pp. 1803-1809, 2012.
[12] C. Yung-Cheng and H. Nen-Fu, "An Efficient Traffic Information Forwarding Solution for
Vehicle Safety Communications on Highways," IEEE Transactions on Intelligent
Transportation Systems, vol. 13, pp. 631-643, 2012.
[13] O. Linda and M. Manic, "Online Spatio-Temporal Risk Assessment for Intelligent
Transportation Systems," IEEE Transactions on Intelligent Transportation Systems, vol.
12, pp. 194-200, 2011.
[14] Y. Qing, W. Y. Szeto, and S. C. Wong, "Short-Term Traffic Speed Forecasting Based on
Data Recorded at Irregular Intervals," IEEE Transactions on Intelligent Transportation
Systems, vol. 13, pp. 1727-1737, 2012.
[15] DOT, "Transforming Transportation through Connectivity: ITS Strategic Research Plan,
2010 - 2014," U.S. Department of Transportation 2012 - 2014 2012.

305
[16] R. Subramanian. (2009). Traffic Safety Facts: Motor Vehicle Traffic Crashes as a Leading
Cause of Death in the United States, 2006 (NHTSA). Available: http://www-
nrd.nhtsa.dot.gov/Pubs/811226.pdf.
[17] USDOT-NHTSA. (2002). The Economic Impact of Motor Vehicle Crashes 2000.
Available: http://www-nrd.nhtsa.dot.gov/Pubs/809446.PDF
[18] D. Shrank and T. Lomax. (2011). Urban Mobility Report: Texas Transportation Institute.
Available: http://mobility.tamu.edu
[19] E. a. CDC. (2010-2012). EPA and Centers for Disease Control Statistics. Available:
https://cfpub.epa.gov/;
https://www.cdc.gov/;https://www.cdc.gov/mmwr/preview/mmwrhtml/ss5608a.htm
[20] R. L. Bertini. (2011). Transforming Transportation Through Connectivity. Available:
http://www.its-ny.org/pdf/bertini-usdot.pdf
[21] M. Gerla. (2014). Driver behavior models. Available:
http://swimsys.cs.odu.edu/DriveSense14/Site/Agenda.html
[22] C. Qiao, Sadek, A., Wu, S., & Hulme, K. (2012). Driver-in-the loop cybertransportation
systems. Available: http://www.cse.buffalo.edu/CTS/index.htm
[23] USDOT-NHTSA. (2010). Frequency of Target Crashes for IntelliDrive Safety Systems.
Available:
http://www.nhtsa.gov/DOT/NHTSA/NVS/Crash%20Avoidance/Technical%20Publicatio
ns/2010/811381.pdf
[24] EPA. (2012). Overview of Greenhouse Gases. Available:
http://www.epa.gov/climatechange/ghgemissions/gases/co2.html
[25] EPA. (2012). National Greenhouse Gas Emissions Data. Available:
http://www.epa.gov/climatechange/ghgemissions/usinventoryreport.html
[26] L. J. Blincoe, A. Seay, E. Zaloshnja, T. Miller, E. Romano, S. Luchter, and R. Spicer, "The
economic impact of motor vehicle crashes, 2000," US Department of Transportation,
National Highway Traffic Safety Administration Washington, DC2002.
[27] J. A. Barria and S. Thajchayapong, "Detection and Classification of Traffic Anomalies
Using Microscopic Traffic Variables," Intelligent Transportation Systems, IEEE
Transactions on, vol. 12, pp. 695-704, 2011.
[28] K. Jerath and S. N. Brennan, "Analytical Prediction of Self-Organized Traffic Jams as a
Function of Increasing ACC Penetration," Intelligent Transportation Systems, IEEE
Transactions on, vol. 13, pp. 1782-1791, 2012.
[29] M. Zhao, J. Walker, and C.-C. Wang, "Security challenges for the intelligent transportation
system," presented at the Proceedings of the First International Conference on Security of
Internet of Things, Kollam, India, 2012.
[30] M. N. Mejri, J. Ben-Othman, and M. Hamdi, "Survey On VANET security challenges and
possible cryptographic solutions," Vehicular Communications, 2014.
[31] J. M. Serna-Olvera, "A trust-driven privacy architecture for vehicular ad-hoc networks,"
Computer Architecture, Universitat Politecnica de Catalunya (UPC), 2012.
[32] F. H. Administration, I. Cambridge Systematics, and T. T. Institute, "Traffic Congestion
and Reliability: Trends and Advanced Strategies for Congestion Mitigation," 2005.
[33] B. Schunemann, J. W. Wedel, and I. Radusch, "V2X-Based Traffic Congestion
Recognition and Avoidance," Tamkang Journal of Science and Engineering, vol. 13, pp.
63-70, 2010 2010.
[34] S. Qing and W. Xiaofan, "Efficient Routing on Large Road Networks Using Hierarchical
Communities," IEEE Transactions on Intelligent Transportation Systems, vol. 12, pp. 132-
140, 2011.

306
[35] M. Ardelt, C. Coester, and N. Kaempchen, "Highly Automated Driving on Freeways in
Real Traffic Using a Probabilistic Framework," IEEE Transactions on Intelligent
Transportation Systems, vol. 13, pp. 1576-1585, 2012.
[36] K. A. Hafeez, L. Zhao, Z. Liao, and B. N.-W. Ma, "Clustering and OFDMA-based MAC
protocol (COMAC) for vehicular ad hoc networks," EURASIP Journal on Wireless
Communications and Networking, vol. 2011, pp. 1-16, 2011.
[37] M. Yongchang, M. Chowdhury, A. Sadek, and M. Jeihani, "Integrated Traffic and
Communication Performance Evaluation of an Intelligent Vehicle Infrastructure
Integration (VII) System for Online Travel-Time Prediction," IEEE Transactions on
Intelligent Transportation Systems, vol. 13, pp. 1369-1382, 2012.
[38] K. Abrougui, A. Boukerche, and R. W. N. Pazzi, "Design and Evaluation of Context-
Aware and Location-Based Service Discovery Protocols for Vehicular Networks," IEEE
Transactions on Intelligent Transportation Systems, vol. 12, pp. 717-735, 2011.
[39] A. Kouvelas, K. Aboudolas, M. Papageorgiou, and E. B. Kosmatopoulos, "A Hybrid
Strategy for Real-Time Traffic Signal Control of Urban Road Networks," IEEE
Transactions on Intelligent Transportation Systems, vol. 12, pp. 884-894, 2011.
[40] X. Huimin and L. N. Boyle, "Drivers' Adaptation to Adaptive Cruise Control: Examination
of Automatic and Manual Braking," IEEE Transactions on Intelligent Transportation
Systems, vol. 13, pp. 1468-1473, 2012.
[41] J. R. D. Frejo and E. F. Camacho, "Global Versus Local MPC Algorithms in Freeway
Traffic Control With Ramp Metering and Variable Speed Limits," Intelligent
Transportation Systems, IEEE Transactions on, vol. 13, pp. 1556-1565, 2012.
[42] L. Jiancheng, G. Ziyou, P. Orenstein, and R. Hualing, "Control Strategies for Dispersing
Incident-Based Traffic Jams in Two-Way Grid Networks," IEEE Transactions on
Intelligent Transportation Systems, vol. 13, pp. 469-481, 2012.
[43] J. P. Thompson and C. D. Wang, "Apparatus and method for motion detection and tracking
of objects in a region for collision avoidance utilizing a real-time adaptive probabilistic
neural network," ed: Google Patents, 1997.
[44] M. Razzaque, A. Salehi, and S. M. Cheraghi, "Security and privacy in vehicular Ad-Hoc
networks: survey and the road ahead," in Wireless Networks and Security, ed: Springer,
2013, pp. 107-132.
[45] T. T. Tchrakian, B. Basu, and M. O'Mahony, "Real-Time Traffic Flow Forecasting Using
Spectral Analysis," IEEE Transactions on Intelligent Transportation Systems, vol. 13, pp.
519-526, 2012.
[46] G. S. Thakur. (2014). Challenges, opportunities, and importance of using heterogeneous
data source for building Adaptive Urban Dynamics System. Available:
http://swimsys.cs.odu.edu/DriveSense14/Site/Agenda.html
[47] A. Helmy. (2014). Global-Scale Sensing and Analysis of Vehicular Mobility (Forming Big
Data Vehicular Traces) Available:
http://swimsys.cs.odu.edu/DriveSense14/Site/Agenda.html
[48] C. Shigang and K. Nahrsted, "An overview of quality of service routing for next-generation
high-speed networks: problems and solutions," Network, IEEE, vol. 12, pp. 64-79, 1998.
[49] J. Biggam, Succeeding with your Master's Dissertation: A step-by-step handbook.
Berkshire, England: McGraw-Hill Open University Press, 2011.
[50] Z. C. Taysi and A. G. Yavuz, "Routing Protocols for GeoNet: A Survey," IEEE
Transactions on Intelligent Transportation Systems, vol. 13, pp. 939-954, 2012.
[51] C. Chang-Wu, C. Xin Chang, I. H. Peng, and C. Yen-Wen, "Study of safety and efficient
routing for intelligent transportation system," in Internet, 2009. AH-ICI 2009. First Asian
Himalayas International Conference on, 2009, pp. 1-5.

307
[52] S. Glaser, B. Vanholme, S. Mammar, D. Gruyer, and L. Nouveliere, "Maneuver-Based
Trajectory Planning for Highly Autonomous Vehicles on Real Road With Traffic and
Driver Interaction," IEEE Transactions on Intelligent Transportation Systems, vol. 11, pp.
589-606, 2010.
[53] M. J. Khabbaz, W. F. Fawaz, and C. M. Assi, "A Simple Free-Flow Traffic Model for
Vehicular Intermittently Connected Networks," IEEE Transactions on Intelligent
Transportation Systems, vol. 13, pp. 1312-1326, 2012.
[54] F. Dion, O. Jun-Seok, and R. Robinson, "Virtual Testbed for Assessing Probe Vehicle Data
in IntelliDrive Systems," IEEE Transactions on Intelligent Transportation Systems, vol.
12, pp. 635-644, 2011.
[55] C. Sommer and F. Dressler, "Progressing toward realistic mobility models in VANET
simulations," IEEE Communications Magazine, vol. 46, pp. 132-137, 2008.
[56] C. Shigang and K. Nahrstedt, "Distributed quality-of-service routing in ad hoc networks,"
IEEE Journal on Selected Areas in Communications, vol. 17, pp. 1488-1505, 1999.
[57] H. Yi-Ling and W. Kuochen, "A road-based QoS-aware multipath routing for urban
vehicular ad hoc networks," in Global Communications Conference (GLOBECOM), 2012
IEEE, 2012, pp. 189-194.
[58] S. Chen, "Quality of service in heterogeneous environments," University of Illinois at
Urbana-Champaign, 1997.
[59] C. Hsu-Yung and H. Shih-Han, "Intelligent Highway Traffic Surveillance With Self-
Diagnosis Abilities," IEEE Transactions on Intelligent Transportation Systems, vol. 12,
pp. 1462-1472, 2011.
[60] J. C. Herrera and A. M. Bayen, "Traffic flow reconstruction using mobile sensors and loop
detector data," 2007.
[61] A. Kouvelas, K. Aboudolas, E. B. Kosmatopoulos, and M. Papageorgiou, "Adaptive
Performance Optimization for Large-Scale Traffic Control Systems," IEEE Transactions
on Intelligent Transportation Systems, vol. 12, pp. 1434-1445, 2011.
[62] H. A. Rakha, A. Kyoungho, W. Faris, and K. S. Moran, "Simple Vehicle Powertrain Model
for Modeling Intelligent Vehicle Applications," IEEE Transactions on Intelligent
Transportation Systems, vol. 13, pp. 770-780, 2012.
[63] A. H. Ghods, F. Liping, and A. Rahimi-kian, "An Efficient Optimization Approach to Real-
Time Coordinated and Integrated Freeway Traffic Control," IEEE Transactions on
Intelligent Transportation Systems, vol. 11, pp. 873-884, 2010.
[64] N. Caceres, L. M. Romero, F. G. Benitez, and J. M. del Castillo, "Traffic Flow Estimation
Models Using Cellular Phone Data," IEEE Transactions on Intelligent Transportation
Systems, vol. 13, pp. 1430-1441, 2012.
[65] Veins. Vehicles in Network Simulation. Available: http://veins.car2x.org/
[66] OMNeT++. (OMNeT++ 4.2 ed.). Available: http://www.omnetpp.org/
[67] SUMO. Simulation of Urban MObility (0.17.0 ed.). Available: http://sumo-sim.org/
[68] T. Zhu, P. Yi, D. Towsley, and M. M. Begovic. (2014). Exploring connected electric
vehicles for concurrent energy distribution and passenger transportation. Available:
http://swimsys.cs.odu.edu/DriveSense14/Site/Agenda.html
[69] EPA. (2012). Sources of Greenhouse Gas Emissions:Transportation Sector Emissions.
Available: http://www.epa.gov/climatechange/ghgemissions/sources/transportation.html
[70] L. Shu, B. De Schutter, X. Yugeng, and H. Hellendoorn, "Fast Model Predictive Control
for Urban Road Networks via MILP," IEEE Transactions on Intelligent Transportation
Systems, vol. 12, pp. 846-856, 2011.
[71] A. Jahangiri and H. Rakha. (2014). Transportation Mode Recognition using smartphone
sensor data. Available: http://swimsys.cs.odu.edu/DriveSense14/Site/Agenda.html

308
[72] RITA. (2012). Research and innovative technology administration bureau of
transportation statistics. Available: http://www.transtats.bts.gov/
[73] S. Row, Cronin, B. (2012). What is the connected vehicle research program? Status and
span Available: http://www.pcb.its.dot.gov/t3/s120501/s120501_row.pdf
[74] C. Qiao, Sadek, A. W., Hulme, K.,Wu, S. (2010). Addressing design and human Factors
challenges in cyber-transportation systems with an integrated traffic-driving-networking
simulator. Available: http://cpsvo.org/file_browser
[75] F. Borrelli, Hedrick, K.,Bajcsy, R. (2009). Active safety control in automotive cyber-
physical systems Available: http://cps-vo.org/file_browser
[76] B. Schünemann. (2014). VSIMRTI WORKSHOP 2014: INTRODUCTION. Available:
https://www.dcaiti.tu-berlin.de/research/simulation/workshop/
[77] B. Schünemann. (2013). How eMobility and cooperative ITS benefit from each other.
Available: http://www.dcaiti.tu-berlin.de/research/simulation/workshop2013/
[78] I. Radusch. (2011). 1st VSimRTI Workshop 2011: Welcome to the 1st VSimRTI Workshop.
Available: https://www.dcaiti.tu-berlin.de/research/simulation/workshop2011/
[79] S. Chen, & Yin, Y. (n.d). CPS Small: transforming a city’s transportation infrastructure
through an embedded pervasive communication network. Available: http://cps-
vo.org/file_browser
[80] S. Lafortune, Del Vecchio, D. (n.d ). Cps: small: control of distributed cyber-physical
systems under partial information and limited communication Available:
http://cpsvo.org/file_browser
[81] B. Schünemann. (2011). 1st VSimRTI Workshop 2011: VSimRTI - Overview: Vehicle-2-X
Simulation Runtime Infrastructure. Available: https://www.dcaiti.tu-
berlin.de/research/simulation/workshop2011/
[82] B. Schünemann, "The V2X Simulation Runtime Infrastructure: VSimRTI," Doctor of
Philosopy, Mathematics and Natural Sciences University at Potsdam, Germany, 2011.
[83] A. Scacchioli. (2012). A unified approach for active safety in automotive cyber physical
systems Available: http://cpsvo.org/file_browser
[84] H. K. Bruce, Garlan, D., Platzer, A., Butts, K., Ramachandra, P. (2010). An architectural
approach to managing heterogeneous models for automotive control system design.
Available: http://cps-vo.org/file_browser
[85] J. B. Brazell, Donoho, L., Dexheimer, J., Hanneman, R., Langdon, G. (2005). M2M: The
wireless revolution: a technology forecast. Available: http://cps-vo.org/file_browser
[86] U. Ozguner. (n.d). Autonomous driving in urban environments Available: http://cps-
vo.org/file_browser
[87] G. Zhao, C. Wu, and B. Ou, "Mathematical modeling of average driver speed control with
the integration of queuing network-model human processor and rule-based decision field
theory," in Proceedings of the Human Factors and Ergonomics Society Annual Meeting,
2011, pp. 856-860.
[88] S. Ishihara and M. Gerla. (2014). Cooperative crash prevention using human behavior
monitoring. Available: http://swimsys.cs.odu.edu/DriveSense14/Site/Agenda.html
[89] R. Protzmann. (2012). 2nd VSimRTI Workshop 2012: Integration of Cellular Networks.
Available: https://www.dcaiti.tu-berlin.de/research/simulation/workshop2012/
[90] A. Wagh, L. Xu, W. Jingyan, Q. Chunming, and W. Changxu, "Human centric data fusion
in Vehicular Cyber-Physical Systems," in Proceedings of 2011 IEEE Conference on
Computer Communications Workshops, 2011, pp. 684-689.
[91] B. Schünemann. (n.d). Performance and scalability analyses of federation-based V2X
simulation systems. Available: http://www.dcaiti.tu-
berlin.de/staff/schuenemann/;http://secan-lab.uni.lu/vca2012/Schuenemann.pdf

309
[92] B. Park. (2011 ). Applied research using open experiment platform. Available: http://cps-
vo.org/file_browser
[93] M. Raya and J.-P. Hubaux, "Security aspects of inter-vehicle communications," in 5th
Swiss Transport Research Conference (STRC), 2005.
[94] S. Al-Sultan, M. M. Al-Doori, A. H. Al-Bayatti, and H. Zedan, "A comprehensive survey
on vehicular Ad Hoc network," Journal of network and computer applications, vol. 37, pp.
380-392, 2014.
[95] B. T. Sharef, R. A. Alsaqour, and M. Ismail, "Vehicular communication ad hoc routing
protocols: A survey," Journal of network and computer applications, vol. 40, pp. 363-396,
2014.
[96] M. Kakkasageri and S. Manvi, "Information management in vehicular ad hoc networks: A
review," Journal of network and computer applications, vol. 39, pp. 334-350, 2014.
[97] R. G. Engoulou, M. Bellaïche, S. Pierre, and A. Quintero, "VANET security surveys,"
Computer Communications, vol. 44, pp. 1-13, 2014.
[98] N. Bißmeyer, B. Schünemann, I. Radusch, and C. Schmidt, "Simulation of attacks and
corresponding driver behavior in vehicular ad hoc networks with VSimRTI," presented at
the Proceedings of the 4th International ICST Conference on Simulation Tools and
Techniques, Barcelona, Spain, 2011.
[99] D. Gantsou, "Invited Paper: VANET Security: Going Beyond Cryptographic-Centric
Solutions," in Vehicular Ad-hoc Networks for Smart Cities, ed: Springer, 2015, pp. 43-49.
[100] A. Laouiti, A. Qayyum, and M. N. M. Saad, "Vehicular Ad-hoc Networks for Smart
Cities," ed: Springer, 2014.
[101] A. E. eMagazine. (2012). Smart Cities, Intelligent Transportation and The Smart Grid.
Available: http://altenergymag.com/emagazine/2012/08/smart-cities-intelligent-
transportation-and-smart-grid-standards--part-1/1954
[102] R. Puvvala. (2012). Technical and commercial challenges of V2V and V2I networks.
Available: http://www.youtube.com/watch?v=HeKv7XvQiJI
[103] J. P. Stotz. (2011). 1st VSimRTI Workshop 2011: Simulation and evaluation of attacks in
vehicular ad hoc networks using VSimRTI. Available: https://www.dcaiti.tu-
berlin.de/research/simulation/workshop2011/
[104] M. Raya and J.-P. Hubaux, "Securing vehicular ad hoc networks," Journal of Computer
Security, vol. 15, pp. 39-68, 2007.
[105] J. T. Isaac, S. Zeadally, and J. S. Camara, "Security attacks and solutions for vehicular ad
hoc networks," IET Communications, vol. 4, pp. 894-903, 2010.
[106] M. Raya, P. Papadimitratos, and J.-P. Hubaux, "Securing vehicular communications,"
IEEE Wireless Communications Magazine, Special Issue on Inter-Vehicular
Communications, vol. 13, pp. 8-15, 2006.
[107] J. M. d. Fuentes, A. I. González-Tablas, and A. Ribagorda, "Overview of security issues in
Vehicular Ad-hoc Networks," Handbook of Reseach on Mobility and Computing, IGI
Global, 2010.
[108] P. Caballero-Gil, Security Issues in Vehicular Ad Hoc Networks: INTECH Open Access
Publisher, 2011.
[109] R. Hussain and H. Oh, "Cooperation-aware VANET clouds: providing secure cloud
services to vehicular ad hoc networks," Journal of information processing systems, vol. 10,
pp. 103-118, 2014.
[110] S. Lobach and I. Radusch, "Integration of Communication Security into Advanced
Simulation Environments for ITS," in Proc. of IEEE International Conference on
Vehicular Technology Conference (VTC Fall), 2011, pp. 1-6.

310
[111] I. T. S. Committee, "IEEE trial-use standard for wireless access in vehicular environments-
security services for applications and management messages," IEEE Vehicular Technology
Society Standard, vol. 1609, p. 2006, 2006.
[112] M. Gerlach and F. Friederici, "Implementing Trusted Vehicular Communications," in
Proc. of IEEE Vehicular Technology Conference (VTC Spring) 2009, pp. 1-2.
[113] Y.-C. Hu, A. Perrig, and D. B. Johnson, "Ariadne: A secure on-demand routing protocol
for ad hoc networks," Wireless networks, vol. 11, pp. 21-38, 2005.
[114] T. Johansson and L. Carr-Motycková, "Bandwidth-constrained clustering in ad hoc
networks," in Proceedings of the Third Annual Mediterranean Ad Hoc Networking
Workshop, 2004, pp. 379-385.
[115] I. A. Sumra, H. B. Hasbullah, and J.-l. B. AbManan, "Attacks on Security Goals
(Confidentiality, Integrity, Availability) in VANET: A Survey," in Vehicular Ad-hoc
Networks for Smart Cities, ed: Springer, 2015, pp. 51-61.
[116] S. Zeadally, R. Hunt, Y.-S. Chen, A. Irwin, and A. Hassan, "Vehicular ad hoc networks
(VANETS): status, results, and challenges," Telecommunication Systems, vol. 50, pp. 217-
241, 2012.
[117] I. A. Sumra, H. B. Hasbullah, and J.-l. b. AbManan, "Effects of attackers and attacks on
availability requirement in vehicular network: a survey," in Proc. of 2014 International
Conference on Computer and Information Sciences (ICCOINS), 2014, pp. 1-6.
[118] H. Hasbullah, I. Ahmed Soomro, and J.-l. Ab Manan, "Denial of service (dos) attack and
its possible solutions in VANET," World Academy of Science, Engineering and
Technology (WASET), vol. 65, pp. 411-415, 2010.
[119] S. Biswas, J. Misic, and V. Misic, "DDoS attack on WAVE-enabled VANET through
synchronization," in Proc. of IEEE Global Communications Conference (GLOBECOM),
2012, pp. 1079-1084.
[120] S. E. Shladower. (n.d). An automated highway system as the platform for defining
faulttolerant automotive architectures and design methods. Available: http://cps-
vo.org/file_browser
[121] R. Hill, Lafortune, A (2010). Fault tolerant discrete control logic in automotive
applications proposed research agenda [Position Paper] Available:
http://cpsvo.org/file_browser
[122] K. Pattipati, Sankavaram, C., Wang, B., Zhang, Y., Howell, M., Salman, M. (2011). Fault
diagnosis and prognosis in a network of embedded systems in automotive vehicles.
Available: http://cps-vo.org/file_browser
[123] A. Amici, Boules, N., Venkatesh, P. (2007). USCAR briefing to National Science
Foundation in support of cyber physical systems research funding Available: http://cps-
vo.org/file_browser
[124] H. Munoz-Avila. The A* Algorithm. Available:
www.cse.lehigh.edu/~munoz/CSE497/classes/Astar.ppt
[125] M. A. Weiss, Data Structures and Algorithm Analysis in JAVA, 3rd ed. New Jersey: Pearson
Education, Inc., 2012.
[126] T. H. Cormen, Leiserson, C.E., Rivest, R.L., Introduction to Algorithms. London, England:
The MIT Press, 2000.
[127] A. Drozdeck, Data Structures and Algorithms in Java, 2nd ed. USA: Thomson Course
Technology, 2005.
[128] A. Patel. (2014, 25 March 2014). Introduction to A*. Available:
http://theory.stanford.edu/~amitp/GameProgramming/AStarComparison.html
[129] R. Eranki. (2002, 25 March 2014). Pathfinding using A* (A-Star). 1-5. Available:
http://web.mit.edu/eranki/www/tutorials/search/

311
[130] Wikipedia. (2014, 25 March 2014). A* search algorithm. 1-9. Available:
http://en.wikipedia.org/wiki/A*_search_algorithm
[131] (2009, March 25 2014). A* algorithm tutorial. Available: http://heyes-jones.com/astar.php
[132] D. Krajzewicz, J. Erdmann, M. Behrisch, and L. Bieker, "Recent Development and
Applications of SUMO - Simulation of Urban MObility," International Journal On
Advances in Systems and Measurements, vol. 5, pp. 128-138, December 2012.
[133] B. Schünemann, "V2X simulation runtime infrastructure VSimRTI: An assessment tool to
design smart traffic management systems," Comput. Netw., vol. 55, pp. 3189-3198, 2011.
[134] B. Schunemann, D. Rieck, and I. Radusch, "Performance and scalability analyses of
federation-based V2X simulation systems," in Ad Hoc Networking Workshop (Med-Hoc-
Net), 2012 The 11th Annual Mediterranean, 2012, pp. 119-126.
[135] S. Röglinger, "A methodology for testing intersection related Vehicle-2-X applications,"
Computer Networks, vol. 55, pp. 3154-3168, 2011.
[136] B. Schünemann, K. Massow, and I. Radusch, "Realistic simulation of vehicular
communication and vehicle-2-X applications," presented at the Proceedings of the 1st
international conference on Simulation tools and techniques for communications, networks
and systems workshops, Marseille, France, 2008.
[137] T. Queck, B. Schüenemann, and I. Radusch, "Runtime infrastructure for simulating
vehicle-2-x communication scenarios," presented at the Proceedings of the fifth ACM
international workshop on VehiculAr Inter-NETworking, San Francisco, California, USA,
2008.
[138] D. Krajzewicz, D. T. Boyom, and P. Wagner, "Evaluation of the Performance of city-wide,
autonomous Route Choice based on Vehicle-to-vehicle-Communictaion," in In proceeding
of: TRB 2008 (87. Annual Meeting), 2008.
[139] C. Zinoviou, K. Katsaros, R. Kernchen, and M. Dianati, "Performance evaluation of an
Adaptive Route Change application using an integrated cooperative ITS simulation
platform," in Wireless Communications and Mobile Computing Conference (IWCMC),
2012 8th International, 2012, pp. 377-382.
[140] K. Katsaros, R. Kernchen, M. Dianati, D. Rieck, and C. Zinoviou, "Application of
vehicular communications for improving the efficiency of traffic in urban areas," Wirel.
Commun. Mob. Comput., vol. 11, pp. 1657-1667, 2011.
[141] K. Katsaros, R. Kernchen, M. Dianati, and D. Rieck, "Performance study of a Green Light
Optimized Speed Advisory (GLOSA) application using an integrated cooperative ITS
simulation platform," in Wireless Communications and Mobile Computing Conference
(IWCMC), 2011 7th International, 2011, pp. 918-923.
[142] T. Queck, B. Schunemann, I. Radusch, and C. Meinel, "Realistic Simulation of V2X
Communication Scenarios," in Asia-Pacific Services Computing Conference, 2008.
APSCC '08. IEEE, 2008, pp. 1623-1627.
[143] "IEEE Standard for Modeling and Simulation (M&S) High Level Architecture (HLA)--
Federate Interface Specification," IEEE Std 1516.1-2010 (Revision of IEEE Std 1516.1-
2000), pp. 1-378, 2010.
[144] D. Rieck, B. Schünemann, I. Radusch, and C. Meinel, "Efficient traffic simulator coupling
in a distributed V2X simulation environment," presented at the Proceedings of the 3rd
International ICST Conference on Simulation Tools and Techniques, Torremolinos,
Malaga, Spain, 2010.
[145] D. Chuang, B. Schuenemann, D. Rieck, and I. Radusch, "GRIND: An Generic Interface
for Coupling Power Grid Simulators with Traffic, Communication and Application
Simulation Tools," in SIMUL 2013, The Fifth International Conference on Advances in
System Simulation, 2013, pp. 174-177.

312
[146] N. N. Ekedebe, Z. Chen, G. Xu, C. Lu, and W. Yu, "On an efficient and effective Intelligent
Transportation System (ITS) using field and simulation data," in SPIE Sensing
Technology+ Applications, 2014, pp. 91210B-91210B-12.
[147] R. Protzmann, B. Schunemann, and I. Radusch, "The influences of communication models
on the simulated effectiveness of V2X applications," Communications Magazine, IEEE,
vol. 49, pp. 149-155, 2011.
[148] K. Gajananan, S. Sontisirikit, J. Zhang, M. Miska, E. Chung, S. Guha, and H. Prendinger,
"A Cooperative ITS study on green light optimisation using an integrated Traffic, Driving,
and Communication Simulator," in Australasian Transport Research Forum (ATRF), 36th,
2013, Brisbane, Queensland, Australia, 2013.
[149] B. Schünemann, "The V2X Simulation Runtime Infrastructure: VSimRTI," Ph.D,
Universit¨at Potsdam, Germany, 2011.
[150] M. Piorkowski, M. Raya, A. L. Lugo, P. Papadimitratos, M. Grossglauser, and J.-P.
Hubaux, "TraNS: realistic joint traffic and network simulator for VANETs," SIGMOBILE
Mob. Comput. Commun. Rev., vol. 12, pp. 31-33, 2008.
[151] T. Queck, B. Schünemann, and I. Radush. (2008). Runtime Infrastructure for Simulating
Vehicle-2-X Communication Scenarios. Available:
http://www.sigmobile.org/workshops/vanet2008/slides/Posters/queck.pdf
[152] M. Adamidis, S. Dunkel, J. Henning, H. Jiajun, F. Kage, B. Ladenthin, N. Naumann, R.
Protzmann, T. Queck, S. Reichel, D. Rieck, A. Scheck, E. Schleiff, B. Schünemann, and J.
Ullrich. (2014). VSimRTI: Vehicle-2-X Simulation Runtime Infrastructure: User
Documentation Version 0.13.5. Available: http://www.dcaiti.tu-
berlin.de/research/simulation/download/
[153] B. Schünemann. (2012). 2nd VSimRTI Workshop: Assessment of smart mobility solutions
by VSimRTI. Available: https://www.dcaiti.tu-
berlin.de/research/simulation/workshop2012/
[154] R. Barr, "Swans-scalable wireless ad hoc network simulator," March, URL< http://jist. ece.
cornell. edu/docs. html, 2004.
[155] R. Barr, Z. J. Haas, and R. v. Renesse, "JiST: an efficient approach to simulation using
virtual machines: Research Articles," Softw. Pract. Exper., vol. 35, pp. 539-576, 2005.
[156] N. Naumann, B. Schünemann, and I. Radusch, "Vsimrti-simulation runtime infrastructure
for v2x communication scenarios," in Proceedings of the 16th World Congress and
Exhibition on Intelligent Transport Systems and Services (ITS Stockholm 2009), ITS
Stockholm, 2009.
[157] N. Naumann, B. Schunemann, I. Radusch, and C. Meinel, "Improving V2X simulation
performance with optimistic synchronization," in Services Computing Conference, 2009.
APSCC 2009. IEEE Asia-Pacific, 2009, pp. 52-57.
[158] R. Protzmann, S. Dunkel, and J. Henning. (2014). VSimRTI Workshop 2014: How to
simulate mobility solutions? Available: https://www.dcaiti.tu-
berlin.de/research/simulation/workshop/
[159] H. P. Institute. (2013). eWorld. Available: http://eworld.sourceforge.net/
[160] R. Protzmann. (2011). 1st VSimRTI Workshop 2011: Impact assessment by simulations in
field operational tests. Available: https://www.dcaiti.tu-
berlin.de/research/simulation/workshop2011/
[161] J. Kühlwein, M. Rexeis, R. Luz, and S. Hausberger. (2013, Update of Emission Factors for
EURO 5 and EURO 6 vehicles for the HBEFA Version 3.2.
[162] S. f. U. M. (SUMO). (2014). PHEM (Passenger Car and Heavy Duty Emission Model).
[163] S. f. U. M. (SUMO). (2014, August 23 2014). Models/Emissions.
[164] P. D. S. Hausberger, D. I. M. Rexeis, D. I. M. Zallinger, D. I. R. Luz, and P. D. H.
Eichlseder. (2009, Emission Factors from the Model PHEM for HBEFA Version 3.

313
Available:
http://www.hbefa.net/e/documents/HBEFA_31_Docu_hot_emissionfactors_PC_LCV_H
DV.pdf
[165] P. W. Mario Keller. (2014, Handbook emission factors for road transport 3.1/3.2 Quick
reference.
[166] M. Adamidis and D. Rieck. (2014). VSIMRTI WORKSHOP 2014: HOW TO CREATE A
SIMULATION SCENARIO? Available: https://www.dcaiti.tu-
berlin.de/research/simulation/workshop/
[167] B. Ladenthin. (2014). VSimRTI Workshop 2014: Application development tutorial.
Available: https://www.dcaiti.tu-berlin.de/research/simulation/workshop/
[168] D. Krajzewicz, P. Wagner, and D. T. Boyom, "Evaluation of the Performance of City-
Wide, Autonomous Route Choice Based on Vehicle-to-Vehicle Communication," in
Transportation Research Board 87th Annual Meeting, 2008.
[169] M. H. Beale, M. T. Hagan, and H. B. Demuth. (2014). Neural Network Toolbox™ Getting
Started Guide. Available: http://www.mathworks.com/help/pdf_doc/nnet/nnet_gs.pdf
[170] O. Qing, R. L. Bertini, J. W. C. Van Lint, and S. P. Hoogendoorn, "A Theoretical
Framework for Traffic Speed Estimation by Fusing Low-Resolution Probe Vehicle Data,"
Intelligent Transportation Systems, IEEE Transactions on, vol. 12, pp. 747-756, 2011.
[171] Z. Junping, W. Fei-Yue, W. Kunfeng, L. Wei-Hua, X. Xin, and C. Cheng, "Data-Driven
Intelligent Transportation Systems: A Survey," Intelligent Transportation Systems, IEEE
Transactions on, vol. 12, pp. 1624-1639, 2011.
[172] MathWorks. (2014). Introduction to MATLAB Tutorial. Available:
http://www.mathworks.com/help/matlab/
[173] MathWorks. (2014). Statistics Toolbox™ User's Guide R2014b (9.1 ed.). Available:
http://www.mathworks.com/help/pdf_doc/stats/stats.pdf
[174] A. Stavrianou, P. Andritsos, and N. Nicoloyannis, "Overview and semantic issues of text
mining," ACM Sigmod Record, vol. 36, pp. 23-34, 2007.
[175] Matlab. (2014). Supervised Learning (Machine Learning) Workflow and Algorithms.
Available: http://www.mathworks.com/help/stats/supervised-learning-machine-learning-
workflow-and-algorithms.html
[176] H. M. Ashtawy and N. R. Mahapatra, "A comparative assessment of ranking accuracies of
conventional and machine-learning-based scoring functions for protein-ligand binding
affinity prediction," IEEE/ACM Transactions on Computational Biology and
Bioinformatics (TCBB), vol. 9, pp. 1301-1313, 2012.
[177] C. Ding and P. Chen, "Mining executive compensation data from SEC filings," in Data
Engineering Workshops, 2006. Proceedings. 22nd International Conference on, 2006, pp.
49-49.
[178] MathWorks. (2014). Interpreating Linear Regression Results. Available:
http://www.mathworks.com/help/stats/understanding-linear-regression-outputs.html
[179] A. M. McCormick and W. Eberle, "Discovering Fraud in Online Classified Ads," in
FLAIRS Conference, 2013.
[180] A. Gupta. (2014). Machine Learning using MATLAB. Available:
http://www.mathworks.com/matlabcentral/fileexchange/42744-machine-learning-with-
matlab
[181] A. Prodromidis, P. Chan, and S. Stolfo, "Meta-learning in distributed data mining systems:
Issues and approaches," Advances in distributed and parallel knowledge discovery, vol. 3,
2000.
[182] F. Cheng, J. Shen, Y. Yu, W. Li, G. Liu, P. W. Lee, and Y. Tang, "In silico prediction of
Tetrahymena pyriformis toxicity for diverse industrial chemicals with substructure pattern
recognition and machine learning methods," Chemosphere, vol. 82, pp. 1636-1643, 2011.

314
[183] N. Li and D. D. Wu, "Using text mining and sentiment analysis for online forums hotspot
detection and forecast," Decision Support Systems, vol. 48, pp. 354-368, 2010.
[184] X. Li, B. Plale, N. Vijayakumar, R. Ramachandran, S. Graves, and H. Conover, "Real-time
storm detection and weather forecast activation through data mining and events
processing," Earth Science Informatics, vol. 1, pp. 49-57, 2008.
[185] R. Li and G. Rose, "Incorporating uncertainty into short-term travel time predictions,"
Transportation Research Part C: Emerging Technologies, vol. 19, pp. 1006-1018, 2011.
[186] X. Zhang and J. A. Rice, "Short-term travel time prediction," Transportation Research
Part C: Emerging Technologies, vol. 11, pp. 187-210, 2003.
[187] W.-H. Lee, S.-S. Tseng, and S.-H. Tsai, "A knowledge based real-time travel time
prediction system for urban network," Expert Systems with Applications, vol. 36, pp. 4239-
4247, 2009.
[188] N. Williams, S. Zander, and G. Armitage, "A preliminary performance comparison of five
machine learning algorithms for practical IP traffic flow classification," ACM SIGCOMM
Computer Communication Review, vol. 36, pp. 5-16, 2006.
[189] J. Van Lint, S. Hoogendoorn, and H. J. van Zuylen, "Accurate freeway travel time
prediction with state-space neural networks under missing data," Transportation Research
Part C: Emerging Technologies, vol. 13, pp. 347-369, 2005.
[190] M. Castro-Neto, Y.-S. Jeong, M.-K. Jeong, and L. D. Han, "Online-SVR for short-term
traffic flow prediction under typical and atypical traffic conditions," Expert Systems with
Applications, vol. 36, pp. 6164-6173, 2009.
[191] T. Ahmed, B. Oreshkin, and M. Coates, "Machine learning approaches to network anomaly
detection," Proc. SysML, 2007.
[192] M. M. Chong, A. Abraham, and M. Paprzycki, "Traffic Accident Analysis Using Machine
Learning Paradigms," Informatica (Slovenia), vol. 29, pp. 89-98, 2005.
[193] Iknowfirst.com. (2014). Machine Learning Algorithms: Making Computers Smarter.
Available:
http://iknowfirst.com/machine_learning_algorithms_making_computers_smarter
[194] B. Choi and R. Chukkapalli, "Applying Machine Learning Methods For Time Series
Forecasting," Learning, vol. 4, p. 3.
[195] Y. Xie, K. Zhao, Y. Sun, and D. Chen, "Gaussian processes for short-term traffic volume
forecasting," Transportation Research Record: Journal of the Transportation Research
Board, vol. 2165, pp. 69-78, 2010.
[196] J. Clare, D. Bruckmann, T. Ott, and U. Weidmann, "Improving the Forecast of Freight
Transport Demand Using Machine Learning and Time Series Methods," presented at the
1st Swiss Transport Research Conference (STRC), Monte Verità / Ascona, 2014.
[197] P. Harrington, Machine learning in action: Manning Publications Co., 2012.
[198] S. Ahmed, "IP Traffic Forecasting Using Focused Time Delay Feed Forward Neural
Network."
[199] C. De Fabritiis, R. Ragona, and G. Valenti, "Traffic estimation and prediction based on
real time floating car data," in 11th International IEEE Conference on Intelligent
Transportation Systems, 2008. ITSC 2008, 2008, pp. 197-203.
[200] A. Testolin, M. Zanforlin, M. De Filippo De Grazia, D. Munaretto, A. Zanella, M. Zorzi,
and M. Zorzi, "A machine learning approach to QoE-based video admission control and
resource allocation in wireless systems," in Ad Hoc Networking Workshop (MED-HOC-
NET), 2014 13th Annual Mediterranean, 2014, pp. 31-38.
[201] P.-F. Pai and W.-C. Hong, "Forecasting regional electricity load based on recurrent support
vector machines with genetic algorithms," Electric Power Systems Research, vol. 74, pp.
417-425, 2005.

315
[202] M. Montes-y-Gómez, A. F. Gelbukh, A. López-López, and L. E. E. No, "Text mining as a
social thermometer," Meta, vol. 4, p. 125, 1999.
[203] I. H. Witten, "Text mining," Practical handbook of Internet computing, pp. 14-1, 2005.
[204] Wikipedia. (2014). Sensitivity and specificity. Available:
http://en.wikipedia.org/wiki/Sensitivity_and_specificity
[205] K. Norvag and R. Oyri, "News Item Extraction for Text Mining inWeb Newspapers," in
Web Information Retrieval and Integration, 2005. WIRI'05. Proceedings. International
Workshop on Challenges in, 2005, pp. 195-204.
[206] M. Montes-y-Gómez, A. F. Gelbukh, and A. López-López, "Extraction of Document
Intentions from Titles," in Proc. of the Workshop on Text Mining: Foundations, Techniques
and Applications (IJCAI-99), Stockholm, Sweden, 1999.
[207] A. Gelbukh, G. Sidorov, and A. Guzmán-Arenas, "Text categorization using a hierarchical
topic dictionary," in Proc. Text Mining workshop at 16th International Joint Conference
on Artificial Intelligence (IJCAI'99), Stockholm, Sweden, 1999, pp. 34-35.
[208] J. Dörre, P. Gerstl, and R. Seiffert, "Text mining: finding nuggets in mountains of textual
data," in Proceedings of the fifth ACM SIGKDD international conference on Knowledge
discovery and data mining, 1999, pp. 398-401.
[209] C. Zhai, A. Velivelli, and B. Yu, "A cross-collection mixture model for comparative text
mining," in Proceedings of the tenth ACM SIGKDD international conference on
Knowledge discovery and data mining, 2004, pp. 743-748.
[210] RITA. (2010–2014). ITS Strategic Research Plan, 2010–2014: Executive Summary.
Available: http://www.its.dot.gov/strategic_plan2010_2014/index.htm
[211] K. Katsaros. (2012). 2nd VSimRTI Workshop 2012: Smart applications assessment with
realistic traffic data. Available: https://www.dcaiti.tu-
berlin.de/research/simulation/workshop2012/
[212] J. Kakarla, S. S. Sathya, and B. G. Laxmi, "A Survey on Routing Protocols and its Issues
in VANET," International Journal of Computer Applications (0975 – 8887), vol. 28, 2011.
[213] L. K. Qabajeh, M. L. M. Kiah, and M. M. Qabajeh, "A scalable and secure position-based
routing protocols for ad-hoc networks," Malaysian Journal of Computer Science, vol. 22,
pp. 99-120, 2009.
[214] A. G. Dludla, N. Ntlatlapa, T. Nyandeni, and M. Adigun, "Towards designing energy-
efficient routing protocol for wireless mesh networks," presented at the Southern Africa
Telecommunication Networks and Applications Conference Swaziland (SATNAC) 2009.
[215] A. Dhamgaye and N. Chavhan, "Survey on security challenges in VANET 1," 2013.
[216] J. Molina-Gil, P. Caballero-Gil, and C. Caballero-Gil, "Aggregation and probabilistic
verification for data authentication in VANETs," Information Sciences, vol. 262, pp. 172-
189, 2014.
[217] A. Boukerche, H. A. B. F. Oliveira, E. F. Nakamura, and A. A. F. Loureiro, "Vehicular Ad
Hoc Networks: A New Challenge for Localization-Based Systems," Computer
Communications, vol. 31, pp. 2838-2849, 2008.
[218] M. Faezipour, M. Nourani, A. Saeed, and S. Addepalli, "Progress and challenges in
intelligent vehicle area networks," Communications of the ACM, vol. 55, pp. 90-100, 2012.
[219] D. Jiang and L. Delgrossi, "IEEE 802.11p: Towards an International Standard for Wireless
Access in Vehicular Environments," in Vehicular Technology Conference, 2008. VTC
Spring 2008. IEEE, 2008, pp. 2036-2040.
[220] C. V. S. C. Consortium, "Vehicle safety communications project: task 3 final report:
identify intelligent vehicle safety applications enabled by DSRC," National Highway
Traffic Safety Administration, US Department of Transportation, Washington DC, 2005.
[221] DSRC. Dedicated Short Range Communication. Available:
http://grouper.ieee.org/groups/scc32/dsrc/

316
[222] B. Parno and A. Perrig, "Challenges in securing vehicular networks," in Workshop on hot
topics in networks (HotNets-IV), 2005, pp. 1-6.
[223] S. Piramuthu. (2014). RFID, IoT, Data Analytics in Vehicular Systems. Available:
http://swimsys.cs.odu.edu/DriveSense14/Site/Agenda.html
[224] I. K. Azogu, M. T. Ferreira, J. A. Larcom, and H. Liu, "A new anti-jamming strategy for
VANET metrics-directed security defense," in Proc. of IEEE Globecom Workshops (GC
Wkshps), 2013, pp. 1344-1349.
[225] A. Stampoulis and Z. Chai, "A survey of security in vehicular networks," DOI= http://zoo.
cs. yale. edu/~ ams257/projects/wireless-survey. pdf (accessed: Nov 28, 2011), 2007.
[226] A. Zenebe, Staples, L., Kumar, R.,Ekedebe, N. (2010). Security awareness and security
behaviors of college students: basic security controls and e-mail security. Available:
http://archive-org.com/org/p/promoteresearch.org/2014-11-
13_4901655_2/ARCS_10_Proceedings_listing/
[227] S. Lobach. (2011). 1st VSimRTI Workshop 2011: Integration of V2X communication
security into VSimRTI. Available: https://www.dcaiti.tu-
berlin.de/research/simulation/workshop2011/
[228] P. Papadimitratos and Z. J. Haas, "Secure routing for mobile ad hoc networks," in
Proceedings of the SCS Commnication Networks and Distributed Systems Modeling and
Simulation Conference (CNDS), 2002, pp. 193-204.
[229] E. Schoch and F. Kargl, "On the efficiency of secure beaconing in VANETs," in
Proceedings of the third ACM conference on Wireless network security, 2010, pp. 111-
116.
[230] T. Zhou, R. R. Choudhury, P. Ning, and K. Chakrabarty, "P2DAP—Sybil Attacks
Detection in Vehicular Ad Hoc Networks," IEEE Journal on Selected Areas in
Communications, vol. 29, pp. 582-594, 2011.
[231] H. Hasbullah, I. A. Soomro, and J. Manan, "Denial of service (dos) attack and its possible
solutions in vanet," World Academy of Science, Engineering and Technology, vol. 65, p.
20, 2010.
[232] H. Dijiang, S. Misra, M. Verma, and X. Guoliang, "PACP: An Efficient Pseudonymous
Authentication-Based Conditional Privacy Protocol for VANETs," IEEE Transactions on
Intelligent Transportation Systems, vol. 12, pp. 736-746, 2011.
[233] R. Protzmann. (2013). 3rd VSimRTI Workshop: Smart caching of infotainment data
transferred through cellular networks. Available: http://www.dcaiti.tu-
berlin.de/research/simulation/workshop2013/
[234] F. Häusler. (2013). 3rd VSimRTI Workshop: Aggregate emission control of road traffic.
Available: http://www.dcaiti.tu-berlin.de/research/simulation/workshop2013/
[235] J. Son, H. Eun, H. Oh, S. Kim, and R. Hussain, "Rethinking vehicular communications:
merging VANET with cloud computing," in Proceedings of the 2012 IEEE 4th
International Conference on Cloud Computing Technology and Science (CloudCom),
2012, pp. 606-609.
[236] M. Eltoweissy, S. Olariu, and M. Younis, "Towards autonomous vehicular clouds," in Ad
hoc networks, ed: Springer, 2010, pp. 1-16.

317
CURRICULUM VITA
NAME: Nnanna N. Ekedebe
PROGRAM OF STUDY: Information Technology (IT)
DEGREE AND DATE TO BE CONFERRED: Doctor of Science, 2015
Secondary education:
Bowie State University, Bowie, MD, May 2010
Collegiate institutions attended Dates Degree Date of Degree
Towson University 2010 – 2015 D.Sc. May 2015
Bowie State University 2008 – 2010 M.Sc. May 2010
Federal University of Technology 2001 – 2005 B.Eng. August 2005
Majors: Information Technology (IT), Information System (IS), and Electrical &
Electronic Engineering (EEE)/ Computer Science (CS)
Professional publications:
Book Chapter
Ekedebe, N., Song, H., Yu, W., Lu, C., & Wan, Y. (2015). Securing transportation cyber-
physical systems. To appear in Securing Cyber Physical Systems. CRC Press. USA.
Peer-reviewed Proceedings/Conference Presentations
Ekedebe, N., Lu, C., Yu, W. (2015). Towards experimental evaluation of intelligent
transportation system safety and traffic efficiency. To appear in Proceedings of IEEE ICC
2015 Mobile and Wireless Networking Symposium. IEEE.
Ekedebe, N., Yu, W., Lu, C., & Moulema, P. (2015, April). An evaluation of the efficiency
and effectiveness of machine learning algorithms in realistic traffic pattern prediction using
field data. In SPIE Sensing Technology+ Applications. International Society for Optics and
Photonics.
Ekedebe, N., Yu, W., & Lu, C. (2015, April). On an efficient and effective Intelligent
Transportation System (ITS) safety and traffic efficiency applications with corresponding
driver’s behavior. In SPIE Defense+ Security. International Society for Optics and
Photonics.
318
Ekedebe, N., Yu, W., Lu, C., & Song, H. (2015, April). On a simulation study of cyber-
attacks on vehicle-to-infrastructure communication in intelligent transportation system.
In SPIE Sensing Technology+ Applications. International Society for Optics and
Photonics.
Ekedebe, N. (2015, April). On an investigation into intelligent transportation system (ITS)
safety, and traffic efficiency applications. In SPIE Sensing Technology+ Applications.
International Society for Optics and Photonics.
Ekedebe, N., Chen, Z., Xu, G., Lu, C., & Yu, W. (2014, May). On an efficient and effective
Intelligent Transportation System (ITS) using field and simulation data. In SPIE Sensing
Technology+ Applications (pp. 91210B-91210B). International Society for Optics and
Photonics.
Zheng, Y., Zhou, H., Chen, Z., & Ekedebe, N. (2014, June). Automated analysis and
evaluation of SEC documents. In Computer and Information Science (ICIS), 2014
IEEE/ACIS 13th International Conference on (pp. 119-124). IEEE.
Yu, W., Chen, Z., Xu, G., Wei, S., & Ekedebe, N. (2013, October). A threat monitoring
system for smart mobiles in enterprise networks. In Proceedings of the 2013 Research in
Adaptive and Convergent Systems (pp. 300-305). ACM.
Lazar, J., Feng, J., Brooks, T., Melamed, G., Wentz, B., Holman, J., & Ekedebe, N. (2012,
May). The SoundsRight CAPTCHA: an improved approach to audio human interaction
proofs for blind users. In Proceedings of the SIGCHI Conference on Human Factors in
Computing Systems (pp. 2267-2276). ACM.
Zenebe, A., Staples, L., Kumar, R.,Ekedebe, N. (2010). Security awareness and security
behaviors of college students: basic security controls and e-mail security, from
http://archive-org.com/org/p/promoteresearch.org/2014-11-
13_4901655_2/ARCS_10_Proceedings_listing/
Journal Article
Zhijiang Chen, Linqiang Ge, Guobin Xu, Wei Yu, Robert F. Erbacher, Hasan Cam, and
Nnanna Ekedebe. “A Threat Monitoring System in Enterprise Networks with Smart
Mobile Devices,” accepted to appear in International Journal of Security and Networks
(IJSN) – Inderscience Publisher, 2015.
Kumin, L., Lazar, J., Feng, J., Wentz, B., & Ekedebe, N. (2012). A usability evaluation of
workplace-related tasks on a multi-touch tablet computer by adults with Down
syndrome. Journal of Usability studies, 7(4), 118-142.

319
Professional positions held:
Certified Information Systems Security Professional (CISSP) Associate,
September 2011 – Present
Certified Information Systems Auditor (CISA)
Certified Information Security Manager (CISM)
Certified Project Management Professional (PMP), Project Management Institute
(PMI), August 2010 – Present
President & Web master, Management Information Systems (MIS) Club, Bowie
State University, May 2009 – May 2010
Financial Secretary, Graduate Students Association (GSA), Bowie State
University, May 2009 – May 2010
Oracle Certified Professional (OCA), and Oracle Certified Associate (OCA)

320
Appendices
Appendix A
Code for Incident Warning Application (IWA)
The code snippet for the mobile application – Incident Warning Application (IWA) –
developed in this research is here presented [152].
Incident Warning Application (IWA) Java Code [152].
// Author: Nnanna N. Ekedebe
// Copyright © May 8th, 2015
//AppName: Incident Warning Application (IWA)
package com.dcaiti.vsimrti.app.IncidentWarningApp;
import com.dcaiti.vsimrti.fed.app.api.helper.SafeTimerLong;
import com.dcaiti.vsimrti.fed.app.api.interfaces.Application;
import com.dcaiti.vsimrti.fed.app.api.interfaces.ApplicationLayer;
import com.dcaiti.vsimrti.fed.app.api.interfaces.CommunicationModule;
import com.dcaiti.vsimrti.fed.app.api.interfaces.unitaccess.controller.VehicleController;
import com.dcaiti.vsimrti.fed.app.api.interfaces.unitaccess.provider.VehicleProvider;
import com.dcaiti.vsimrti.fed.app.api.util.ReceivedV2XMessage;
import com.dcaiti.vsimrti.rti.objects.v2x.denm.DENM;
import com.dcaiti.vsimrti.geographic.GeometryHelper;
import com.dcaiti.vsimrti.rti.behavior.SlowDownData;
import com.dcaiti.vsimrti.rti.enums.SensorType;
import com.dcaiti.vsimrti.rti.geometry.GeoCircle;
import com.dcaiti.vsimrti.rti.geometry.GeoPoint;
import com.dcaiti.vsimrti.rti.objects.Route;
import com.dcaiti.vsimrti.rti.objects.address.DestinationAddressContainer;
import com.dcaiti.vsimrti.rti.objects.address.GeocastDestinationAddress;
import com.dcaiti.vsimrti.rti.objects.v2x.MessageRouting;
import com.dcaiti.vsimrti.rti.objects.v2x.V2XMessage;
import java.util.Objects;
import org.opengis.geometry.DirectPosition;
import org.slf4j.Logger;
/**
* Class implementing the application interface and fulfilling a re-routing
* based on changing roadway incident conditions.
*/
@SuppressWarnings("unused")
public class IncidentWarningApp implements Application {

321
/**
* Reference to the {@link ApplicationLayer}.
*/
private ApplicationLayer applicationLayer;
/**
* Short reference to the {@link VehicleController} for convenience.
*/
private VehicleController vc;
/**
* Short reference to the {@link VehicleProvider} for convenience.
*/
private VehicleProvider vp;
/**
* Short reference to the {@link CommunicationModule} for convenience.
*/
…

322
Appendix B
Traffic Prognosis
1. Actual Regression Results
Respecting some of our evaluated algorithms in prognosticating the actual traffic volume
patterns on I-270 [173] [204] [71].
Table 7: Actual versus predicted traffic volume levels of some regression algorithms on
I-270 [173] [204] [71].
Actual RLR GLM GLM.S BDT BGDT KNN.R NB.R TB.R NN_fit Time of Day
81 104 112 63 32 75 88 28 70 45 0:03
55 107 115 64 32 74 54 22 69 45 0:09
41 35 51 55 22 75 36 22 70 45 0:14
37 95 104 62 34 77 43 22 72 45 0:20
36 41 57 56 22 76 36 22 70 45 0:26
58 49 63 57 25 77 67 28 70 45 0:32
44 60 74 58 29 79 40 22 71 45 0:39
26 73 84 59 29 79 59 22 71 45 0:43
42 129 134 66 23 68 34 22 64 45 0:49
35 135 139 67 23 68 44 22 64 45 0:55
58 135 139 67 23 68 44 22 64 45 1:02
26 47 62 56 25 77 67 22 70 45 1:08
29 29 46 54 22 76 36 22 70 45 1:13
39 85 95 61 34 79 61 22 72 45 1:19
29 50 64 67 45 77 36 28 75 37 1:26
29 81 91 71 52 82 59 26 78 67 1:31
35 3 24 51 20 77 24 22 79 45 1:37
32 74 86 60 29 79 59 22 71 45 1:43
23 79 90 60 29 79 61 22 71 45 1:49
17 97 105 62 32 76 43 22 72 45 1:56
32 -63 -34 43 31 148 29 24 183 45 2:01
24 -63 -34 43 31 148 29 24 183 45 2:02
31 27 45 54 20 78 36 22 70 45 2:07
25 50 65 57 25 77 67 22 70 45 2:13
22 100 109 63 32 77 43 22 72 45 2:19
28 59 71 77 64 87 36 34 86 56 2:25
29 69 81 59 29 80 68 24 74 45 2:31
29 -19 4 56 43 148 29 28 182 37 2:37
18 76 87 60 29 79 59 22 72 45 2:44

323
Table 8: Actual performance results of our evaluated regression algorithms - a multi-
metric comparison [173] [204] [71].
Algorithm R_value R_error MSE RMSE Prediction_time Fitting_time
Rtree 0.93652 0.06348 0.149075637 0.386103143 0.154 0.128
NB.R 0.97626 0.02374 7.590135643 2.75502008 0.285 0.183
LR 0.83621 0.16379 56.4564748 7.513752378 0.42 0.324
RLR 0.84069 0.15931 126.2651262 11.23677561 0.584 0.351
GLM.R 0.83621 0.16379 56.4564748 7.513752378 0.588 0.411
KNN.R 0.92263 0.07737 137.6145707 11.73092369 0.711 0.155
TB.R 0.94798 0.05202 38.38577751 38.38577751 0.936 0.841
SLR 0.8361 0.1639 19.51204145 4.417243649 1.021 0.862
BDT 0.97551 0.02449 3.862772032 1.965393607 1.257 1.107
BGDT 0.95808 0.04192 6.279435827 2.50588025 1.509 1.155
NN_fit.R 0.970015 0.029985 36.68816236 6.057075396 2.06 1.735
GLM.S 0.94811 0.05189 5.175033923 2.274870089 2.822 1.648
NN_time.R 0.973027 0.026973 408.0444 20.20010891 4.124 3.17
2. Actual Classification Results
Respecting some of our evaluated algorithms in prognosticating the presence/absence of
congested traffic on I-270.
Table 9: More metrics used to evaluate the performance of our classification algorithms
[173] [204] [71].
(a)
Algorithm PA RA Mis R Pt Ft TP FP TN FN P N P+N
Ctree 100.00 100 0.00 1.00 0.34 0.15 200 0 0 49 249 0 249
TB 100.00 100 0.00 1.00 5.06 2.37 200 0 0 49 249 0 249
LSBOOST 100.00 100 0.00 1.00 1.16 0.96 200 0 0 49 249 0 249
BAG 100.00 100 0.00 1.00 3.09 3.07 200 0 0 49 249 0 249
NN_fit 100.00 100 0.00 1.00 2.84 2.30 200 0 0 29 229 0 249
NB 99.60 100 0.40 0.99 0.91 0.09 200 1 0 48 248 1 249
GLM 99.20 100 0.80 1.00 5.28 0.58 199 1 1 48 247 2 249
SVM 99.20 100 0.80 0.97 1.98 0.58 200 2 0 47 247 2 249
NN_p.reg 98.40 100 1.60 0.98 2.05 1.39 200 0 4 45 245 4 249
DA 93.57 100 6.43 0.79 2.58 0.18 200 16 0 33 233 16 249
KNN 80.32 100 19.68 0.80 0.71 0.12 200 49 0 0 200 49 249
NN_time 73.90 100 26.10 0.68 3.39 3.17 167 32 33 17 184 65 249

324
(b)
Algorithm PPV NPV TPR TNR FPR FDR ACC F1 I M
Ctree 1.00 0.00 0.80 0.00 0.00 0.00 0.80 0.89 -0.20 0.00
TB 1.00 0.00 0.80 0.00 0.00 0.00 0.80 0.89 -0.20 0.00
LSBOOST 1.00 0.00 0.80 0.00 0.00 0.00 0.80 0.89 -0.20 0.00
BAG 1.00 0.00 0.80 0.00 0.00 0.00 0.80 0.89 -0.20 0.00
NN_fit 1.00 0.00 0.87 0.00 0.00 0.00 0.80 0.93 -0.13 0.00
NB 1.00 0.00 0.81 0.00 1.00 0.00 0.80 0.89 -0.19 0.00
GLM 1.00 0.02 0.81 0.50 0.50 0.01 0.80 0.89 0.31 0.02
SVM 0.99 0.00 0.81 0.00 1.00 0.01 0.80 0.89 -0.19 -0.01
NN_p.reg 1.00 0.08 0.82 1.00 0.00 0.00 0.82 0.90 0.82 0.08
DA 0.93 0.00 0.86 0.00 1.00 0.07 0.80 0.89 -0.14 -0.07
KNN 0.80 0.00 1.00 0.00 1.00 0.20 0.80 0.89 0.00 -0.20
NN_time 0.84 0.66 0.91 0.51 0.49 0.16 0.80 0.87 0.42 0.50

325