Electroporation of Planar Lipid Bilayers and Membranes
62
CHAPTER SEVEN Electroporation of Planar Lipid Bilayers and Membranes Mojca Pavlin, Tadej Kotnik, Damijan Miklavc ˇic ˇ, Peter Kramar, and Alenka Mac ˇek Lebar 1, Contents 1. Introduction 167 2. Experimental Investigation of Electroporation on Planar Lipid Bilayers 169 2.1. Breakdown Voltage 170 2.2. Capacitance 173 2.3. Conductance/Resistance 174 3. Attempts of Theoretical Explanation of Electroporation 175 3.1. The Hydrodynamic Model 177 3.2. The Elastic Model 178 3.3. The Hydroelastic Model 179 3.4. The Viscohydroelastic Model 181 3.5. The Phase Transition Model 183 3.6. The Domain-Interface Breakdown Model 186 3.7. The Aqueous Pore Formation Model 187 3.8. Extensions of the Aqueous Pore Formation Model 192 4. Electroporation of Cells-Experimental Observations and Analysis of Underlying Phenomena 194 4.1. Induced Transmembrane Voltage and Forces on the Cell Membrane 195 4.2. Maxwell Stress Tensor and Forces Acting on a Cell in an External Field 198 4.3. Transport of Molecules Across Permeabilized Membrane 199 4.4. Experimental Studies and Theoretical Analysis of Cell Electroporation in vitro 201 5. Comparison between Planar Lipid Bilayers and Cell Electroporation 211 Appendix A 213 A.1. The Instability in the Hydrodynamic Model 213 A.2. The Instability in the Elastic Model 213 Corresponding author. Tel.: +386 1 4768 770; Fax: +386 1 4264 658 E-mail address: [email protected] (A. Mac ˇek Lebar). 1 University of Ljubljana, Faculty of Electrical Engineering, Trz ˇas ˇka 25, SI-1000 Ljubljana, Slovenia Advances in Planar Lipid Bilayers and Liposomes, Volume 6 r 2008 Published by Elsevier Inc. ISSN 1554-4516, DOI 10.1016/S1554-4516(07)06007-3 165
Transcript of Electroporation of Planar Lipid Bilayers and Membranes

C H A P T E R S E V E N
� CorreE-mail a
1 Unive
AdvanceISSN 1
Electroporation of Planar Lipid Bilayers
and Membranes
Mojca Pavlin, Tadej Kotnik, Damijan Miklavcic, Peter Kramar, and
Alenka Macek Lebar1,�
Contents
1. Introduction
1672. Experimental Investigation of Electroporation on Planar Lipid Bilayers
1692.1. Breakdown Voltage
1702.2. Capacitance
1732.3. Conductance/Resistance
1743. Attempts of Theoretical Explanation of Electroporation
1753.1. The Hydrodynamic Model
1773.2. The Elastic Model
1783.3. The Hydroelastic Model
1793.4. The Viscohydroelastic Model
1813.5. The Phase Transition Model
1833.6. The Domain-Interface Breakdown Model
1863.7. The Aqueous Pore Formation Model
1873.8. Extensions of the Aqueous Pore Formation Model
1924. Electroporation of Cells-Experimental Observations and Analysis of
Underlying Phenomena
1944.1. Induced Transmembrane Voltage and Forces on the Cell Membrane
1954.2. Maxwell Stress Tensor and Forces Acting on a Cell in an External Field
1984.3. Transport of Molecules Across Permeabilized Membrane
1994.4. Experimental Studies and Theoretical Analysis of Cell
Electroporation in vitro
2015. Comparison between Planar Lipid Bilayers and Cell Electroporation
211Appendix A
213A.1. The Instability in the Hydrodynamic Model
213A.2. The Instability in the Elastic Model
213sponding author. Tel.: +386 1 4768 770; Fax: +386 1 4264 658ddress: [email protected] (A. Macek Lebar).
rsity of Ljubljana, Faculty of Electrical Engineering, Trzaska 25, SI-1000 Ljubljana, Slovenia
s in Planar Lipid Bilayers and Liposomes, Volume 6 r 2008 Published by Elsevier Inc.554-4516, DOI 10.1016/S1554-4516(07)06007-3
165

M. Pavlin et al.166
A.3. The Instability in the Hydroelastic Model
214A.4. The Instability in the Viscohydroelastic Model
215A.5. The Energy of a Hydrophilic Pore
216Appendix B
217B.1. Calculation of the Fraction of Surface Area of Transient Pores
217B.2. Quantification of Ion Diffusion and Long-Lived Pores
218References
219Abstract
Strong external electric field can destabilize membranes and induce formation of pores
thus increasing membrane permeability. The phenomenon is known as membrane
electroporation, sometimes referred to also as dielectric breakdown or elect-
ropermeabilization. The structural changes involving rearrangement of the phospholipid
bilayer presumably lead to the formation of aqueous pores, which increases the con-
ductivity of the membrane and its permeability to water-soluble molecules which oth-
erwise are deprived of membrane transport mechanisms. This was shown in variety of
experimental conditions, on artificial membranes such as planar lipid bilayers and ves-
icles, as well as on biological cells in vitro and in vivo. While studies of electroporation
on artificial lipid bilayers enabled characterization of the biophysical processes, elect-
roporation of biological cells led to the development of numerous biomedical applica-
tions. Namely, cell electroporation increases membrane permeability to otherwise
nonpermeant molecules, which allows different biological and medical applications
including transfer of genes (electrogene transfer), transdermal drug delivery and elect-
rochemotherapy of tumors. In general, the key parameter for electroporation is the
induced transmembrane voltage generated by an external electric field due to the
difference in the electric properties of the membrane and the external medium, known
as Maxwell–Wagner polarization. It was also shown that pore formation and the effec-
tiveness of cell electroporation depend on parameters of electric pulses like number,
duration, repetition frequency and electric field strength, where the later is the crucial
parameter since increased transmembrane transport due to electroporation is only ob-
served above a certain threshold field. Two main theoretical approaches were developed
to describe electroporation. The electromechanical approach considers membranes as
elastic or viscoelastic bodies, and applying principles of electrostatics and elasticity
predict membrane rupture above critical membrane voltage. A conceptually different
approach describing formation and expansion of pores is based on energy consider-
ation; it is assumed that external electric field reduces the free energy barrier for
formation of hydrophilic pores due to lower polarization energy of water in the pores
compared to the membrane. Combined with stochastic mechanism of pores expansion it
can describe experimental data of bilayer membranes. Still, the molecular mechanisms
of pore formation and stabilization during electroporation are not fully understood and
rigorous experimental conformation of different theories is still lacking.
The focus of this chapter is to review experimental and theoretical data in the field
of electroporation and to connect biophysical aspects of the process with the phen-
omenological experimental observations obtained on planar lipid bilayers, vesicles and
cells.

Electroporation of Planar Lipid Bilayers and Membranes 167
1. Introduction
Biological membranes play a crucial role in living organisms. They are softcondensed matter structures that envelope the cells and their inner organelles.Biological membranes maintain relevant concentration gradients by acting asselective filters toward ions and molecules. Besides their passive role, they also host anumber of metabolic and biosynthetic activities [1].
The interaction of electric fields with biological membranes and purephospholipid bilayers has been extensively studied in the last decades [2,3]. Strongexternal electric field can destabilizes membranes and induce changes in theirstructure. The key parameter is the induced-transmembrane voltage generated byan external electric field due to the difference in the electric properties of themembrane and the external medium, known as Maxwell–Wagner polarization.According to the most plausible theory until now the lipids in the membrane arerearranged to form aqueous pores which increases the conductivity of the mem-brane and its permeability to water-soluble molecules which otherwise are deprivedof membrane transport mechanisms. Therefore this phenomenon is known aselectroporation, sometimes referred to also as dielectric breakdown or elect-ropermeabilization of membranes.
Reversible ‘‘electrical breakdown’’ of the membrane has first been reported byStampfli in 1958 [4], but for some time this report has been mostly unnoticed.Nearly a decade later, Sale and Hamilton reported on nonthermal electrical de-struction of microorganisms using strong electric pulses [5]. In 1972, Neumann andRosenheck showed that electric pulses induce a large increase of membrane per-meability in vesicles [6]. Following these pioneering studies three important workshave motivated a series of further investigations. First, Neumann et al. showed in1982 that genes can be transferred into the cells by using exponentially decayingelectric pulses [7]. A few years later, in 1987, Okino and Mohri and, in 1988, Miret al. showed that definite amounts of molecules are introduced into the cells ineither in vivo or in vitro conditions, by using electric pulses [8,9]. Most of the earlywork was done on isolated cells in conditions in vitro, but it is now known thatmany applications are also successful in in vivo situation. It was showed that usingelectroporation, small and large molecules can be introduced into cells and ex-tracted from cells, and proteins can be inserted into the membrane and cells can befused. As a result of its efficiency, electroporation has rapidly found its applicationsin many fields of biochemistry, molecular biology and medicine.
By applying an electric field of adequate strength and duration, the membranereturns into its normal state after the end of the exposure to the electric field –electroporation is reversible. However, if the exposure to electric field is too long orthe strength of the electric field is too high, the membrane does not reseal after theend of the exposure, and electroporation is irreversible in such a case. According tothe type of electroporation (i.e. reversible or irreversible), two groups of appli-cations exist: functional, where functionality of cells, tissues or microorganismsmust be sustained; and destructive, where electric fields are used to destroy plasmamembranes of cells or microorganisms [10].

M. Pavlin et al.168
Irreversible electroporation can be used for nonthermal food and water pres-ervation, where permanent destruction of microorganisms is required [11–13].
Functional applications are currently more widespread and established in differ-ent experimental or practical protocols. Probably, the most important functionalapplication is the introduction of a definite amount of small or large molecules tothe cytoplasm through the plasma membrane [14,15]. Electrochemotherapy (ECT)is a therapeutic approach in cancer treatment that combines chemotherapy andelectroporation. The delivery of electric pulses at the time when a chemother-apeutic drug reaches its highest extracellular concentration considerably increasesthe transport through the membrane toward the intracellular targets and cytotox-icity of a drug is enhanced. In several preclinical and clinical studies, either onhumans or animals, it was demonstrated that ECT can be used as the treatment ofchoice in local cancer treatment [16–18]. Application of electroporation for transferof DNA molecules into the cell is referred to as electrogenetransfection (EGT) andhas not yet entered clinical trials [15]. Another application of electroporation isinsertion of molecules into the cell membrane. As the membrane reseals, it entrapssome of the transported molecules, and if these molecules are amphipathic (con-stituted of both polar and nonpolar regions), they can remain stably incorporated inthe membrane [19,20]. Under appropriate experimental conditions, delivery ofelectric pulses can lead to the fusion of membranes of adjacent cells. Electrofusionhas been observed between suspended cells [21,22], and even between cells in tissue[23]. For successful electrofusion in suspension, the cells must previously be broughtinto close contact, for example, by dielectrophoresis [21]. Electrofusion has provedto be a successful approach in production of vaccines [24] and antibodies [25].
Application of high-voltage pulses to the skin causes a large increase in ionic andmolecular transport across the skin [26]. This has been applied for transdermaldelivery of drugs [27] and also works for larger molecules, for example, DNAoligonucleotides [28].
In spite of successful use of electroporation in biomedical applications, themolecular mechanisms of the involved processes are still not fully explained andthere is lack of connection between experimental data and theoretical descriptionsof pore formation [2,29–32]. It was shown that pore formation and the effectivenessof cell electroporation depend on parameters of electric pulses like number (N),duration (T), repetition frequency ( f ) and electric field strength (E). The later is thecrucial parameter since increased transmembrane transport due to electroporation isonly observed above a certain threshold field. It was also shown [33,34] that neitherelectrical energy nor charge of the electric pulses alone determine the extent ofelectroporation consequences and that the dependency on E, N and T is morecomplex [35].
Electroporation has been observed and studied in many different systems, i.e.artificial planar lipid bilayers, giant lipid vesicles, cells in vitro and in vivo. Cellmembranes are much more complicated than artificial lipid structures, with respectto geometry, composition and the presence of active processes. The problem as-sociated with the complexity of natural cell membranes can be avoided by inves-tigating synthetic liposomes or vesicles which mimic the geometry and the size ofcell membranes, but are void of ion channels and the multitude of other embedded

Electroporation of Planar Lipid Bilayers and Membranes 169
components. Artificial planar lipid bilayer is the simpliest modeling lipid system thatalso has the geometric advantage of providing electrical and chemical access to bothsides of a membrane.
In the following, we shall review experimental and theoretical data in the fieldof electroporation and connect biophysical aspects of the process with the phen-omenological experimental observations obtained on planar lipid bilayers, vesiclesand cells.
2. Experimental Investigation of Electroporation on
Planar Lipid Bilayers
The planar lipid bilayer can be considered as a small fraction of total cellmembrane. As such has often been used to investigate basic aspects of electrop-oration; especially because of its geometric advantage of allowing chemical andelectrical access to both sides of a membrane. Planar lipid bilayers can generally beformed by three different techniques: painting technique, folding technique or tip-dip technique [36]. In either case a thin bi-molecular film composed of specifiedphospholipids and organic solvent is formed on a small aperture in a hydrophobicpartition separating two aqueous compartments. Electrodes plunged in the aqueouscompartments permit the measurement of currents and voltages across the mem-brane. By reason of that two measuring principles of planar lipid bilayer’s propertiesare commonly used (Fig. 1): voltage clamp method [37–48] and current clampmethod [49,50,51–59]. From an electrical point of view a planar lipid bilayer can beregarded as a nonconducting capacitor, therefore two electrical properties, capac-itance (C) and resistance (R), mostly determine its behavior.
When voltage clamp method is used the voltage signal is applied to the planarlipid bilayer; either a step change [47], pulse [37,41,44], linear rising [60] or someother shape of the voltage signal. The simplest as well as mostly used shape ofthe voltage signal is a square voltage pulse [37,41]. It is commonly used for
Figure 1 Electrical properties of planar lipid bilayer: resistance (R), capacitance (C), thickness(d), voltage breakdown (Uc) and mass £uctuation (C) are measured with application of current(I) or voltage (U).

M. Pavlin et al.170
determination of planar lipid bilayer breakdown voltage (Uc) and capacitance [44].Some experiments were done by two sinus-shaped voltage signals: the first with lowfrequency and large amplitude and the second with high frequency and low am-plitude that was added to the first one. In this way lipid bilayer conductance andcapacitance were determined at the same time [59]. When current clamp method isused, the current is applied to the lipid bilayer. Usually this method is appropriatefor measuring resistance of a planar lipid bilayer and mass flow through it as aconsequence of increased membrane permeability. It is believed that during thiskind of measurements the lipid bilayer is more stable due to less voltage stress[50,53]; therefore, also small changes in membrane structure and the occurrence offluctuating defects can be observed [45,50,54]. Scalas et al. [54], for example,reported on time course of voltage fluctuations that followed an increase of themembrane conductance due to the opening and closing hydrophilic pores.
Combination of electrical recording techniques with different kinds of high fre-quency electromagnetic fields offers additional investigations of structure–functionrelationships of planar lipid bilayer and of membrane interacting peptides [61–64].For structure elucidation of lipid–water mesophases, small- and wide-angle X-rayscattering method were used [61]. Hanyu et al. [62] have presented an experimentalsystem which allows measurement of current (function) and fluorescence emission(structural change) of an ion channel in planar lipid bilayer while membrane po-tential is controlled [62]. Rapid and reversible changes in photo responsive planarlipid bilayers electrical properties when irradiated with light were studied byYamaguchi et al. [63]. Planar lipid bilayers have been also exposed to RF-field ofabout 900MHz according to GSM standards and authors have revealed thattemperature oscillations due to the pulsed radio frequency fields are too small toinfluence planar lipid bilayer’s low frequency behavior [64].
2.1. Breakdown Voltage
Breakdown voltage (Uc) is one of the most important properties of a lipid bilayerwhen biomedical and biotechnological applications of electroporation are underconsideration. It has been measured either by voltage clamp or current clampmethod using rectangular, triangular or step shape of the signal (Fig. 1). Mostly, thebreakdown voltage of the planar lipid bilayer is determined by a rectangular voltagepulse (10ms–10 s). The amplitude of the voltage pulse is incremented in small stepsuntil the breakdown of the bilayer is obtained [37]. First the voltage pulse chargesup the planar lipid bilayer. Above a critical voltage (breakdown voltage Uc) defectsare created in the planar lipid bilayer allowing an increase of the transmembranecurrent. Usually membrane collapses then after.
The influence of various factors, such as lipid composition [37,38,55], organicsolvent [41], temperature [44] and electrolyte composition [43,44], on the absolutevalue of Uc has been studied. Benz et al. have measured Uc by presence of varioussalts in the electrolyte bathing the membranes [44] and shown that presence of Li+,Na+, K+, Rb+ or Cs+ ions do not change Uc. It was also proved that ionic strengthof bathing solution had no influence on Uc [40,43]. Experiments have demon-strated that with increasing temperature Uc of planar lipid bilayer decrease. [44].

Table 1 Uc of planar lipid bilayer composed if lipid molecules of a single type. Allmeasurements have been done using 0.1M KCl as a bathing solution.
BLM Uc (mV) Method Reference
Azolecitin 423 Voltage clamp – 100 ms pulse [38]
POPC 450 Voltage clamp – 100 ms pulse [37,39,40]
POPS 480 Voltage clamp – 100 ms pulse [39,40]
Egg PC 280 Current clamp – triangle (1.6–2.5mHz) [52,55]
DPh PC 390 Current clamp – triangle (1.6–2.5mHz) [52,55]
527 Voltage clamp – 10 ms pulse [39,40]
DPh PS 525 Voltage clamp – 10 ms pulse [39,40]
PS 500 Current clamp – triangle (2.5mHz) [55]
GM 170 Current clamp – triangle (2.5mHz) [55]
Table 2 Uc of planar lipid bilayer composed from two lipid molecules or lipid molecules andsurfactants. All measurements have been done using 0.1M KCl as a bathing solution.
BLM Uc (mV) Method Reference
Azolecitin+Poloxamer 188 448 Voltage clamp – 10 ms pulse [38]
POPC+0.1 mM C12E8 383 Voltage clamp – 10 ms pulse [37]
POPC+1 mM C12E8 333 Voltage clamp – 10 ms pulse [37]
POPC+10 mM C12E8 333 Voltage clamp – 10 ms pulse [37]
Egg PC/Ch 4:1 270 Current clamp – triangle (2.5mHz) [55]
Electroporation of Planar Lipid Bilayers and Membranes 171
Uc depends on a type of hydrophilic chain of the lipids (Table 1). Meier hasreported that palmitoyl-oleoyl (PO) membrane require �100mV smaller break-down voltages compared to diphytanoyl (DPh) membranes [39].
Incorporation of nonphospholipid substances into planar lipid bilayer changesthe intensity and duration of the electrical stimulus needed for breakdown. Sucheffect is a consequence of the surfactant molecular shape acting to change thespontaneous curvature of the membrane, which is especially important duringthe defects formation process. Troiano et al. [37] performed a quantitative studyon the effect of C12E8 on planar lipid bilayer made of 1-palmitoyl 2-oleoylphosphatidylcholine (POPC). Their results and results of some other studies aregathered in Table 2.
Using voltage pulse protocol the number of applied voltage pulses is not knownin advance and each bilayer is exposed to voltage stress many times. Such a pre-treatment of the lipid bilayer affects its stability and consequently the determinedbreakdown voltage of the lipid bilayer [47]. Another approach for the breakdownvoltage determination was suggested by our group [60]. Using linear rising signalthe breakdown voltage is determined by a single voltage exposure.
Our system for following up electroporation of planar lipid bilayers consists of asignal generator, a Teflon chamber and a device, which is used for measurements ofmembrane current and voltage (Fig. 2).

Figure 2 System for electroporation of planar lipid bilayer. (1) The microprocessor board withMCF5204 processor and twomodules. One module generates arbitrary signals and the other thatis realized in Xillinx, is used for frequency extension. (2) Chamber for forming lipid bilayers andtwo Ag^AgCl electrodes. (3) Modules for current and voltage ampli¢cation. (4) Digitaloscilloscope for data storing [60].
M. Pavlin et al.172
Signal generator is a voltage generator of an arbitrary type that provides voltageamplitudes from –5 to +5V. It is controlled by costume written software(Genpyrrha), specially designed for drawing the voltage signal that is used formembrane electroporation.
Two Ag–AgCl electrodes, one on each side of the planar lipid bilayer areplunged into the salt solution. Transmembrane voltage is measured via a LeCroydifferential amplifier 1822. The same electrodes are used to measure transmembranecurrent. Both signals are stored in oscilloscope LeCroy Waverunner-2 354M inMatlab format and processed offline.
Chamber is made out of Teflon. It consists of two cubed reservoirs with volumeof 5.3 cm3 each. In the hole between two reservoirs a thin Teflon sheet with around hole (105 mm diameter) is inserted. Lipid bilayer is formed by the foldingmethod [36,65].
Measurement protocol consists of two parts: capacitance measurement (Fig. 3A)and lipid bilayer breakdown voltage measurement (Fig. 3B). Capacitance of eachplanar lipid bilayer is measured by discharge method [60].
Breakdown voltage (Uc) of the lipid bilayer is measured then after by the linearrising signal. The slope of the linear rising signal (k) and the peak voltage of thesignal have to be selected in advance. Breakdown voltage is defined as the voltage atthe moment tbr when sudden increase of transmembrane current is observed. Timeof breakdown tbr was defined as a lifetime of the lipid bilayer at a chosen slope of thelinear rising signal (Fig. 3). Owing to already known experimental evidence thatlipid bilayer lifetime is dependent on the applied voltage [37,66] and that the lipidbilayer breakdown voltage is dependent on the lipid bilayer pre-treatment [47],Uc and tbr are measured at six or seven different slopes. Indeed lifetime of lipidbilayer depends on the slope of linear rising voltage signal and also the breakdownvoltage is a function of the slope of the linear rising voltage signal; it increases withincreasing slope. Therefore, using nonlinear regression, a two parameters curve is

Figure 3 Measurement protocol: (A) capacitance measurement of lipid bilayer was measured intwo steps. In the ¢rst step, we measured capacitance of the electronic systemwithout lipid bilayer.Second step was measuring capacitance of electronic system with lipid bilayer and salt solution.(B) Voltage breakdown measurement with linear rising signal [60].
Electroporation of Planar Lipid Bilayers and Membranes 173
fitted to the data
U ¼a
1� e�t=b(1)
where U is Uc measured at different slopes, t the corresponding tbr, and a and b theparameters. Parameter a is an asymptote of the curve which corresponds to minimalbreakdown voltage UcMIN for specific bilayer. Parameter b governs the inclinationof the curve.
The results obtained with described measuring protocol are presented in Fig. 4.Uc and tbr of POPC, POPC+1mM C12E8 and palmitoyl-oleoyl phosphatidylserine(POPS):POPC (3:7) planar lipid bilayers have been measured and UcMIN for eachbilayer has been calculated. Computed parameter that corresponds to UcMIN forspecific bilayer is 0.49, 0.58 and 0.55V, respectively.
Evans et al. used similar approach in their experiments on lipid vesicles [67]. Theyapplied tension at different loading rates and they found out that tension needed formembrane rupture increases with increasing loading rate. As in our case the loadingrate dependence of rupture events implies a kinetic process of defect formation(see theoretical explanations in the next chapter). It has to be noted that measuringprotocol mentioned offers also better reproducibility and lower scattering of measureddata due to the fact that each bilayer is exposed to electroporation treatment only once.
2.2. Capacitance
The capacitance (C) is a parameter that is considered to be the best tool for probingthe stability and formal goodness of the planar lipid bilayer. It can be determined byvarious methods. Most common and simple method for measuring planar lipidbilayer capacitance is discharge pulse [38,41]. Galluci et al. have described a meas-urement system where two sinus signals with frequencies 1Hz and 1 kHz aremixed and applied to planar lipid bilayer. Amplitude and phase of both signalsgoverns planar lipid bilayer’s capacitance and resistance simultaneously [68]. Suchcontinuous monitoring of C may prove useful in tracking planar lipid bilayerelectrical properties that depend on the lipids composition and incorporated

Figure 4 The breakdown voltage (Uc) (dots) of lipid bilayers as a function of lifetime tbr. Thegray lines show seven di¡erent slopes (k) of applied liner rising voltage signal. Dash, dotted anddash^dotted curves represent two parameters curve ¢tted to data (1). Asymptotes of the curves (a)correspond to minimal breakdown voltageUcMIN for lipid bilayers made of POPC, POPC+1 mMC12E8 and POPS:POPC (3:7) (Table 3).
M. Pavlin et al.174
nonphospholipids substances. Capacitance of planar lipid bilayer can also bedetermined by triangular voltage signal [49], that is controlled by the regulationsystem including charged planar lipid bilayer as a part. Therefore the period of thetriangular voltage signal is related to capacitance of planar lipid bilayer. Whencurrent clamp method is used, capacitance of planar lipid bilayer can be measuredwith ramp signal [52,53,69].
Gallucci et al. have observed that the capacitance of planar lipid bilayer isdependent of concentration of salt solution. Capacitance measured in higher con-centration of salt solution is lower than in lower concentration of salt solution [68].Capacitances of planar lipid bilayers measured by various methods in different saltsolutions are gathered in Table 3.
2.3. Conductance/Resistance
Resistance (R) or conductance (G) as electrical property of nonpermeablized planarlipid bilayer can be measured only during application of voltage or current signal.Galluci et al. [68] have developed the system for measuring G and C simultaneouslyand continuously as a function of time. This method allows measuring of electricalproperties of nonpermeabilized planar lipid bilayer as well as during the process ofdefect formation and electroporation.
Melikov et al. [45] monitored fluctuations in planar lipid bilayer conductanceinduced by applying a voltage step of sufficiently high amplitude. They showed that

Table 3 Capacitance of planar lipid bilayers measured by various methods in dierent saltsolutions.
BLM C (mF/cm2) Salt solution Method Reference
Azolecitin 0.59 0.1M KCl Discharge pulse [38]
0.3–0.4 – Current ramp [69]
DOPC 0.1M NaCl Discharge pulse [41]
DOPE 0.1M NaCl Discharge pulse [41]
DPh PC 0.60–0.75 0.1M KCl [51–53,55]
0.76–1.13 1M KCl [51,54]
0.36 1M NaCl Discharge pulse [41]
Ox Ch 0.555 1M KCl Discharge pulse [41]
0.5 Current ramp [69]
0.41 1M KCl Muxd sin wave [59]
0.45 0.1M KCl Muxd sin wave [68]
0.47 0.5M KCl Muxd sin wave [68]
0.40 1M KCl Muxd sin wave [68]
PC 0.75 0.1M KCl Current clamp triangular [52,55]
PI 0.25 1M KCl Muxd sin wave [59]
0.30 0.1M KCl Muxd sin wave [68]
0.27 0.5M KCl Muxd sin wave [68]
0.25 1M KCl Muxd sin wave [68]
POPC 0.59 0.1M KCl Discharge pulse [37]
Electroporation of Planar Lipid Bilayers and Membranes 175
the amplitude of fluctuations varied in a rather broad interval (form 150 to 1500 pS)and they related them with the formation of local conductive defects (see theo-retical explanations in the next chapter).
Robello et al. [52] observed a sharp increase in conductance induced by externalelectric field obtained under current clamp conditions. They related it with cre-ation of hydrophilic paths that increase the planar lipid bilayer conductance by oneorder of magnitude.
Similarly Kalinowski et al. [70] presented chronopotentiometric method forfollowing planar lipid bilayer conductance during local conductive defects creationthat also allows observing of their dynamical behavior. The voltage fluctuationsreported in their work are consistent with theoretical models that predict formationof temporary aqueous pathways across the membrane.
3. Attempts of Theoretical Explanation of
Electroporation
A number of theoretical models have been put forward as possible explana-tions of electroporation. Here, an attempt will be made to present these modelsroughly in their chronological order of appearance, and to review them critically,

Table 4 Values of the quantities used in the evaluation of the models.
Parameter Notation Value Reference orexplanation
Membrane
Electric conductivity sm �3� 10�7 S/m [71]
Dielectric permittivity em 4.4� 10�11 F/m [71]
Elasticity module Y �1� 108N/m2 [72]
Viscosity m 0.6Ns/m2 [73]
Surface tension G �1� 10�3 J/m2 [32]
Edge tension g �1� 10�11 J/m [32]
Thickness (undistorted) d0 5� 10�9m [1]
Cytoplasm
Electric conductivity si 0.3 S/m [74,75]
Dielectric permittivity ei 7.1� 10�10 F/m Set at the same value
as eeExtracellular medium
Electric conductivity se 1.2 S/m [76] (blood serum at
351C)
Dielectric permittivity ee 7.1� 10�10 F/m [77] (physiological
saline at 351C)
M. Pavlin et al.176
comparing their properties and abilities to those that the complete theoreticaldescription of electroporation should provide:
�
A physically realistic picture of both the nonpermeabilized and the permeabili-zed membrane. Unlike a true breakdown process, electroporation does not leadto a total disintegration of the system, but is localized and often even reversible.�
Limited reversibility. Based on the amplitude and duration of electric pulses, thepermeabilized state is either reversible or irreversible.�
Dependence on pulse duration and the number of pulses. With longer pulses, alower amplitude suffices for achieving the permeabilized state.�
A realistic value of the minimal transmembrane voltage (‘‘critical voltage’’)at which permeabilization occurs. Most of the presented models provide anexpression for this voltage, typically a function of several quantities. By insertingthe typical values of these quantities into the expressions, we assess their agree-ment with experimentally measured critical voltage, which is in the range of afew hundred millivolts. These values are given in Table 4, where those which areeither known only up to an order of magnitude, or can vary considerably, aremarked by a tilde.�
Stochasticity. Variability of the critical pulse amplitude in experiments on cellscan largely be attributed to the variability of cell size within the treated pop-ulation. However, a certain degree of stochasticity is also observed in elect-ropermeabilization of pure lipid vesicles and planar bilayers. Some authors viewthe ability of a model to account for this as crucial [32].
Figure 5 Membrane deformation according to the hydrodynamic model.
Electroporation of Planar Lipid Bilayers and Membranes 177
3.1. The Hydrodynamic Model
The hydrodynamic model, developed in the early 1970s [78,79], describes themembrane as a charged layer of a nonconductive and noncompressible liquid sep-arating two conductive liquids. The transmembrane voltage exerts a pressure on thislayer, and as it is assumed noncompressible in volume, the decrease in its thicknessleads to an increase in its surface area. If either the volume enveloped by themembrane (in vesicles) or the perimeter of the membrane (in planar bilayers) isassumed to remain constant, the membrane thus becomes rippled (Fig. 5).
As the membrane surface area increases, so does its surface tension and therebythe pressure opposing the compression. At sufficiently low voltages, the two pressuresreach an equilibrium at which the membrane thickness stabilizes. However, as shownin Appendix A.1, this equilibration is only possible up to the critical voltage given by
U c ¼
ffiffiffiffiffiffiffiffiGd02�m
r(2)
where G is the surface tension of the membrane, d0 its uncompressed thickness andem its dielectric permittivity. Above Uc an instability occurs: the compressive pressureprevails, causing a breakdown of the membrane. Applying typical parameter valuesfrom Table 4 to the above expression, we get UcE0.24V, which is in good agree-ment with the experimental data. The equations in Appendix A.1 also describe themembrane thickness as a function of the transmembrane voltage (Fig. 6).
The hydrodynamic model has several shortcomings. First, it applies to liquidswith isotropic fluidity, which is not true for lipid bilayers, where transverse move-ment of molecules is very restricted. Second, it fails at the very first requirementlisted at the beginning of this chapter, as it does not describe the permeabilized

Figure 6 Membrane thickness as a function of the transmembrane voltage in the hydrodynamicmodel, using parameter values fromTable 4.
Figure 7 Membrane deformation according to the elastic model.
M. Pavlin et al.178
membrane. Of the other requirements, only the prediction of a realistic criticaltransmembrane voltage is met.
3.2. The Elastic Model
In contrast to the hydrodynamic model, which assumes a membrane with a con-stant volume and a variable surface, the elastic model, presented soon afterwards[80], assumes a variable volume and a constant surface (Fig. 7). In the elastic model,

Figure 8 Membrane thickness as a function of the transmembrane voltage in the elastic model,using parameter values fromTable 4.
Electroporation of Planar Lipid Bilayers and Membranes 179
the pressure exerted by the transmembrane voltage leads to a decrease in the volumeof the membrane and an increase of elastic pressure opposing the compression. Alsohere, the equilibrium becomes impossible above a critical voltage (see AppendixA.2) given by
U c � 0:61 d0
ffiffiffiffiffiY
�m
r(3)
where Y is the elasticity module of the membrane, d0 its uncompressed thicknessand em its dielectric permittivity. Above Uc, there is an instability similar to the onein the hydrodynamic model.
Applying typical parameter values (Table 4) to the expression above, we getUcE4.57V, which is roughly an order of magnitude too large. With the equationsin Appendix A.2, we can also plot the membrane thickness as a function of thetransmembrane voltage (Fig. 8).
In addition to the unrealistic prediction of critical voltage, the model assumesthat Y does not vary with deformation, which is certainly false at 39% compressionof the membrane at the point of instability (Fig. 8). This model also offers nodescription of the permeabilized membrane, and fails to meet any other require-ment listed at the beginning of this chapter.
3.3. The Hydroelastic Model
The assumptions on which the hydrodynamic and the elastic model are built aremutually excluding as well as unrealistic. By treating the membrane as a liquid withboth surface tension and elasticity, one obtains the more realistic hydroelasticmodel, in which both the volume and the surface of the membrane vary, and thecharged membrane both compresses in volume and forms ripples (Fig. 9).
Similarly to the two models described previously, the hydroelastic model pre-dicts a compressive instability (see Appendix A.3). With typical parameter values(Table 4) it yields UcE0.34V, which is in good agreement with experimental data.

Figure 9 Membrane deformation according to the hydroelastic model.
Figure 10 Membrane thickness as a function of the transmembrane voltage in the hydroelasticmodel, using parameter values fromTable 4.
M. Pavlin et al.180
According to the hydroelastic model, at Uc the membrane thickness is reduced to50% of the initial value (Fig. 10), its surface is enlarged to almost 200% of the initialvalue (Fig. 11) and the volume is reduced to 99.8% of the initial value (Fig. 12).
As Fig. 12 shows, according to the hydroelastic model the volume compressionis very small, and even at the critical voltage the membrane volume is reduced byonly 0.2% with respect to the initial value. Therefore, in this model the assumptionof constant value of the elasticity module is much more reasonable than in theelastic model, in which the membrane breakdown is associated with a volumereduction of almost 39%. While the description of the compressive instabilityprovided by the hydroelastic model is more realistic than those of the hydrodynamic

Figure 11 Membrane surface area as a function of the transmembrane voltage in thehydroelastic model, using parameter values fromTable 4.
Figure 12 Membrane volume as a function of the transmembrane voltage in the hydroelasticmodel, using parameter values fromTable 4.
Electroporation of Planar Lipid Bilayers and Membranes 181
and the elastic model, it has the same general drawback – it gives a nonsensicalpicture of the electropermeabilized membrane: a uniform, infinitely thin layer, onlythis time a rippled one. With the exception of a realistic prediction of the criticaltransmembrane voltage, the model also fails to meet any other requirement given inthe list at the beginning of this chapter.
3.4. The Viscohydroelastic Model
Making another step toward complexity, the viscohydroelastic model (referred toby its authors as viscoelastic) expands the hydroelastic model by adding to it themembrane viscosity [81,82]. As in the hydroelastic model, in this model thecharged membrane is both compressed and rippled. However, the viscosity impedesthe molecular flow, and thus the compression is not instantaneous, but follows theonset of the transmembrane voltage gradually.
During the compression and rippling of the membrane, the impeded molecularflow leads to the thinning of the membrane at those locations where the flow would

Figure 13 Membrane deformation according to the viscohydroelastic model.
M. Pavlin et al.182
have to be the most rapid to maintain the uniform thickness (Fig. 13). Up to acertain voltage, the membrane still reaches a state of equilibrium, but at highervoltages, the integrity of the membrane cannot be sustained and discontinuitiesform at the locations of the highest thinning. The analysis of such instability iselaborate and is described in more detail elsewhere [73,83], while Appendix A.4gives a short outline of its results. This analysis shows that in the viscohydroelasticmodel, the instability occurs if the transmembrane voltage exceeds the criticalamplitude given by
U c ¼
ffiffiffiffiffiffiffiffiffiffiffiffiffiffi8 GYd30�2m
4
s(4)
and lasts longer than the critical duration,
tc ¼24m
�2mU4
Gd30� 8Y
(5)
where m is membrane viscosity, the rest of the notation being the same as in thepreviously described models. Applying typical parameter values (Table 4), we getUcE2.68V, so in this aspect the viscohydroelastic model performs worse than boththe hydroelastic and the hydrodynamic model. However, it also offers a principaladvantage over any of the previously described models, as the requirement of anabove-critical voltage is linked to that of above-critical duration, providing a pos-sible explanation of the dependence of permeabilization on the duration of electric

Figure 14 Critical duration of the transmembrane voltage as a function of its amplitude in theviscohydroelastic model, using parameter values fromTable 4.
Electroporation of Planar Lipid Bilayers and Membranes 183
pulses. This is elucidated by Fig. 14, which shows the relation between the am-plitude and the critical duration of the transmembrane voltage. AtU ¼ 1.01�UcE2.71V, the critical duration tc of the transmembrane voltage isapproximately 450 ns, which is in close agreement with the sub-microsecond im-aging experiments [84,85]. Still, the critical duration in the model decreasesextremely rapidly, and at U ¼ 1.20�UcE3.12V we already have tcE17 ns, whileexperimentally this decrease is much slower. Also, according to the viscohydro-elastic model, the permeabilized membrane is torn along the ripples, but no suchdisconnections have so far been observed, making this description of the perm-eabilized membrane questionable.
3.5. The Phase Transition Model
According to the models presented up to this point, electropermeabilization is amodification of the supramolecular membrane structure. In contrast, the phasetransition model describes this phenomenon as a conformational change of mem-brane molecules [72]. On the molecular scale, the pressures are replaced by mo-lecular energies, and the pressure equilibrium corresponds to the state of minimumfree energy. With several minima of free energy, several stable states are possible,each corresponding to a distinct phase. In lipid bilayers, there are in general twosuch phases, solid (gel) and liquid phase.
The phase transition model of electropermeabilization is an extension of thestatistical mechanical model of lipid membrane structure [86,87]. According to thismodel, the free energy of the membrane at a temperature T and an average mo-lecular surface area S is given by an expression of a general form
W ðT ; SÞ ¼ W f ðSÞ þW cðT ; SÞ þW icðT ; SÞ þW ihðT ; SÞ (6)
where Wf is the flexibility energy (from continuous deformations, e.g. compres-sion), Wc is the conformational energy (from discrete deformations, e.g. trans–cistransitions), Wic is the energy of interactions between the hydrocarbon chains andWih is the energy of interactions between the polar heads of the lipids. Regrettably,

Figure 15 Free energy of a lipid molecule in the bilayer as a function of the molecular area, at¢ve di¡erent temperatures.The units on both axes are arbitrary.
Figure 16 Membrane deformation and breakdown according to the phase transition model.
M. Pavlin et al.184
in the statistical mechanical model of Jacobs and co-workers, only Wf(S) is anexpression with a genuine physical basis, while the rest are polynomial regressionsto the experimental data. In addition, the model contains several parameters withcompletely unknown actual values, and by adapting these one gets an arbitrarilygood agreement with the experimental data. The specific formulae of the phasetransition model are thus of little interest here, so we henceforth focus on thequalitative description it provides. Figure 15 illustrates this description by plottingthe free energy per molecule as a function of the average area occupied per mol-ecule, with the temperature serving as a parameter, and with arbitrary units on bothaxes.
As shown in Fig. 15, at temperatures below Tc1, the dependence of free energyon molecular area has a single minimum, which corresponds to the solid (gel)phase, which is the only possible stable state (Fig. 16, left). Between Tc1 and Tc2,a second minimum occurs on the curve, corresponding to the liquid phase. In thistemperature range, both phases can exist, but the one corresponding to the globalminimum is more frequent. Above Tc2, the first minimum disappears, and themembrane can only persist in the liquid phase (Fig. 16, center). Finally, at

Electroporation of Planar Lipid Bilayers and Membranes 185
temperatures above Tc3, the remaining minimum also vanishes, and the membranedissolves in the surrounding water, forming small micelles (Fig. 16, right). As anexample, for a DPPC bilayer, Tc1E251C, Tc2E401C and Tc3E1651C [1].
In the presence of a transmembrane voltage, the model described above has tobe expanded by an additional component of the free energy, the electrical energyWe, and the total free energy now becomes
W ðT ; S;UÞ ¼ W f ðSÞ þW cðT ; SÞ þW icðT ; SÞ þW ihðT ; SÞ þW eðT ; S;UÞ (7)
where we assume that the electrical energy depends not only on the transmembranevoltage, but also on the temperature and the molecular surface area. In his model[72], Sugar derived the following approximation for W eðT ; S;UÞ:
W eðT ; S;UÞ ¼ kT logYS
lpkT�
�2mS
128l3YU4 (8)
where k is the Boltzmann constant, T the absolute temperature, Y the elasticitymodule of the molecules in the direction of their hydrocarbon chains, S the averagearea of the molecules, l is the length of the hydrocarbon chains, em is the dielectricpermittivity of the molecules and U the transmembrane voltage. From this formulait is evident that at a sufficiently high transmembrane voltage,We becomes negative,shifting the entire free energy curve down, and this shift is more pronounced athigher molecular areas. Figure 17 shows this effect at a physiological temperatureT c1oToT c2 (for reasons described above, we again use arbitrary units for bothaxes). At a voltage Uc1, the first minimum of the free energy disappears, forcing themembrane into the liquid phase state. At a somewhat higher voltage Uc2, theremaining minimum also ceases to exist, leading to the breakdown of the mem-brane. The phases of the lipid membrane at various voltages are thus analogous tothose at various temperatures presented in Fig. 16. Using numerical values for allthe parameters of his model, Sugar calculated that for a DPPC bilayer,Uc1E260mV and Uc2E280mV.
Comparison between Figs. 15 and 17 shows that according to the phase tran-sition model, the presence of transmembrane voltage has an effect similar to
Figure 17 Free energy of a lipid molecule in the bilayer as a function of the molecular area, atfour di¡erent transmembrane voltages.The units on both axes are arbitrary.

M. Pavlin et al.186
heating, causing a transition to the liquid phase, and eventually to decompositionsimilar to a high-temperature disintegration. Such a description is very unrealistic,since the permeabilized membrane is far from complete disintegration, and oftenreturns to the nonpermeabilized state.
For an impartial evaluation of the predicted value of the critical transmembranevoltage, the parameters of the model which are at present arbitrary will have to bedetermined experimentally. In addition, this model is only provisional until thepolynomial expressions obtained by regression are replaced by physical laws.
Still, the phase transition model meets several requirements at which allthe previous models fail. The permeabilized state is the minimum of free energy,and the return to the nonpermeable state requires a sufficient input of energy,which offers a possible explanation of the observed durability of the permeabilizedstate. Similarly, the transition to this state requires a sufficient input of energy,which could explain the dependence on pulse duration. Above the second criticalvoltage, the downward slope of the free energy is never reversed, leading to abreakdown and explaining the limited reversibility of electropermeabilization.Except for the explanation of the dependence on the number of pulses, this modelthus meets all the qualitative requirements from the list at the beginning of thischapter. This suggests that the approach based on the free energy could be apromising one.
3.6. The Domain-Interface Breakdown Model
The domain-interface breakdown model takes into account the fact that cellmembranes can consist of distinct domains which differ in their lipid structure,particularly in their content of cholesterol. According to this model, elect-ropermeabilization is localized to the boundaries between the domains [88,89], asFig. 18 schematically shows.
Figure 18 Membrane breakdown according to the domain-interface breakdown model.

Electroporation of Planar Lipid Bilayers and Membranes 187
Similarly to the viscohydroelastic model, in the domain-interface breakdownmodel the increased permeability is a result of fractures, with the difference that inthe former model they occur along the ripples, while in the latter they form alongthe domain interfaces. As with the viscohydroelastic model, this description remainsquestionable, as such fractures have never been observed. In addition, while themodel describes permeabilization as localized to the domain interfaces, the phe-nomenon is also observed experimentally in bilayers and vesicles with homoge-neous lipid structure. Thus the domain-interface breakdown can only serve as anadditional mechanism, perhaps enhancing permeabilization in cell membranes withrespect to that in artificial bilayers and vesicles.
3.7. The Aqueous Pore Formation Model
The first four models treated here – the hydrodynamic, the elastic, the viscoelasticand the viscohydroelastic model – view electroporation as a large scale phenom-enon, in which the molecular structure of the membrane plays no direct role.1 Thenext two – the phase transition model and the domain-interface breakdownmodel – represent the other extreme, trying to explain the phenomenon by theproperties of individual lipid molecules and interactions between them.
A compromise between these two approaches is offered by the model of poreformation, according to which electropermeabilization is caused by formation oftransient aqueous pores (electroporation) in the lipid bilayer. In this model, eachpore is formed (surrounded) by a large number of lipid molecules, but the shape,size and stability of the pore are strongly influenced by the structure of thesemolecules and their local interactions.
The model of pore formation is the last one to be described here, and in itspresent form, it is considered by many as the most convincing explanation ofelectropermeabilization. Therefore, in the following paragraphs an attempt will bemade to follow its development rather comprehensively, from the first designs up toits current appearance.
The possibility of spontaneous pore formation in lipid bilayers was first analyzedin 1975, independently by two groups [90,91]. According to this analysis (whichdid not yet account for the effects of transmembrane voltage) formation of acylindrical pore of radius r changes the free energy of the membrane by
DW ðrÞ ¼ 2gpr � Gpr2 (9)
where g is the edge tension and G the surface tension of the membrane. The firstterm, often termed the edge energy, is positive, since a pore creates an edge in themembrane, with a length corresponding to the circumference of the pore. Thesecond term, the surface energy, is negative, as a pore reduces the surface area of themembrane. According to the above expression, the change of free energy is positivefor small pores, and negative for sufficiently large pores. This implies that
1 This point should not be obscured by the figures accompanying the models, in which separate lipid molecules are depicted.However, these figures combine the macroscopical description, which is actually provided by these models, with the existing
knowledge of molecular structure of the lipid membrane.

M. Pavlin et al.188
spontaneous pore formation is inhibited by an energy barrier, explaining the sta-bility of the membrane in the physiological conditions. The critical radius at whichthe energy barrier reaches a peak and the height of this peak are given by
rc ¼gG; DW c ¼ DW ðrcÞ ¼
pg2
G. (10)
Typical parameter values (Table 4) give rcE10 nm. If a larger pore is artificiallycreated (e.g. by piercing the membrane), this energy barrier is overcome, and sinceno stable state exists at larger pore radii, the membrane breaks down.
In the presence of a transmembrane voltage, formation of a pore also affects thecapacitive energy of the system. By accounting for this Abidor and co-workersobtained a more general expression for the change of the free energy [47],
DW ðr;UÞ ¼ 2gpr � Gpr2 �ð�e � �mÞpr2
2dU2. (11)
where U is the transmembrane voltage, while ee and em are the dielectric permit-tivities of the aqueous medium (in approximation, that of water) in the pore and themembrane. The transmembrane voltage reduces both the critical radius of the poreand the energy barrier, which are now given by
rcðUÞ ¼g
Gþ �e��m2d
U2; DW cðUÞ ¼ DW ðrc;UÞ ¼
pg2
Gþ �e��m2d
U2. (12)
Applying parameters values from Table 4, Fig. 19 shows the free energy curves inabsence and in presence of transmembrane voltage (solid) The voltage reduces thecritical radius from rcE10 nm (outside the graph range) to rcE1.93 nm, i.e. to lessthan 20% of the value in the absence of transmembrane voltage, and the energybarrier is decreased in the same proportion.
Figure 19 Free energy change due to the occurrence of a hydrophilic pore in the lipid bilayer,plotted as a function of the pore radius.The solid curves show the case of a constant edge tension,and the dashed curve the case where the edge tension increases as the pore radius decreases.
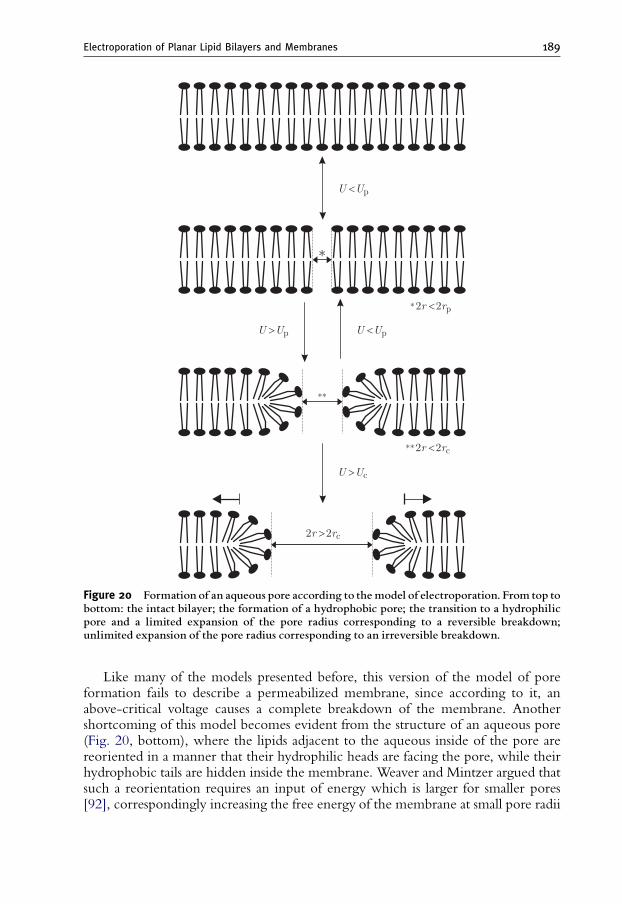
Figure 20 Formation of an aqueous pore according to the model of electroporation. From top tobottom: the intact bilayer; the formation of a hydrophobic pore; the transition to a hydrophilicpore and a limited expansion of the pore radius corresponding to a reversible breakdown;unlimited expansion of the pore radius corresponding to an irreversible breakdown.
Electroporation of Planar Lipid Bilayers and Membranes 189
Like many of the models presented before, this version of the model of poreformation fails to describe a permeabilized membrane, since according to it, anabove-critical voltage causes a complete breakdown of the membrane. Anothershortcoming of this model becomes evident from the structure of an aqueous pore(Fig. 20, bottom), where the lipids adjacent to the aqueous inside of the pore arereoriented in a manner that their hydrophilic heads are facing the pore, while theirhydrophobic tails are hidden inside the membrane. Weaver and Mintzer argued thatsuch a reorientation requires an input of energy which is larger for smaller pores[92], correspondingly increasing the free energy of the membrane at small pore radii

M. Pavlin et al.190
(Fig. 19, dashed). They suggested that this effect can be accounted for by treatingthe edge energy as a function g(r) the value of which becomes larger as the poreradius decreases,
DW ðr;UÞ ¼ 2gðrÞpr � Gpr2 �ð�e � �mÞpr2
2dU2, (13)
but they did not provide an expression for g(r).The next step in the revision of the model of pore formation was a crucial one,
as it described the stable state of a pore [46]. The argument that led to this revisionis again illustrated in Fig. 20, where the hydrophilic structure of the pore is reachedthrough a transition from an initial, hydrophobic state, in which the lipids still havetheir original orientation. The expressions for DW given so far do not deal with thistransition, and at all radii they treat the pore as fully formed, i.e. hydrophilic. Glaserand co-workers argued that up to the pore radius rp at which the hydrophilic stateforms, the free energy change due to a hydrophobic pore must be analyzed instead,for which they derived the expression (see Appendix A.5)
DW ðr;UÞ ¼ 2pdrGh
I1ðr=lÞI0ðr=lÞ
, (14)
where Gh is the surface tension at the interface of the hydrophobic internal surfaceof the pore and water, l is the characteristic length of hydrophobic interactions, andIk denotes the modified Bessel function of k-th order. As in the hydrophilic case,the total change of free energy also reflects the decrease of the membrane surfaceand the electric energy. The change of free energy of the membrane accompanyingelectroporation can thus be described by the system of two equations
DW ðr;UÞ ¼
2pdrGh
I1ðr=lÞI0ðr=lÞ
� Gpr2 �ð�e � �mÞpr2
2dU2; rorp
2prgðrÞ � Gpr2 �ð�e � �mÞpr2
2dU2; r4rp
8>>><>>>:
(15)
The pore radius rp at which the transition from the hydrophobic to the hydrophilicstate occurs corresponds to the intersection of the hydrophilic and the hydrophobicbranch of DW, but as g(r) is not defined, it is also impossible to give an explicitformulation of rp.
Using l ¼ 1 nm [93], Gh ¼ 0.05N/m [46] and other values as in Table 4, wecan plot both branches of DW on the same graph, as shown in Fig. 21. Fortransmembrane voltages of 250 and 350mV, the solid lines give the curve intowhich the hydrophobic and the hydrophilic branch combine, and the dashed linesare the extrapolations of these two branches beyond their actual domains. Regret-tably, a local minimum of free energy only occurs if the hydrophilic branch containsa suitable form of the (unknown) function g(r).
The model of pore formation as illustrated by Figs. 20 and 21 represents what istoday referred to as the aqueous pore formation model (or simply as ‘‘the standardmodel of electroporation’’), where the phenomenon is defined as formation ofaqueous pores in the presence of transmembrane voltage. In this model,

Figure 21 Free energy change due to the formation of an aqueous pore, plotted as a function ofthe pore radius.The initial increase corresponds to the formation and expansion of a hydrophilicpore, the local maximum to the transition to a hydrophilic pore, and the subsequent localminimum corresponds to the radius of a (semi-) stable hydrophilic pore. At su⁄ciently hightransmembrane voltages, this minimum transforms into a monotonic decrease, whichcorresponds to an irreversible breakdown.
Electroporation of Planar Lipid Bilayers and Membranes 191
transmembrane voltage decreases the energy input necessary to induce a transitionfrom the hydrophobic2 to the hydrophilic state. The hydrophilic pores correspondto a local minimum of free energy, and are thus stable, which could possibly explainthe experimentally observed durability of the permeabilized state. Reversibility ofthis state is limited as at voltages above the critical value there is an irreversiblebreakdown of the membrane. Qualitatively, also the dependence of elect-ropermeabilization on pulse duration is explained, since pore formation requiresa sufficient input of energy for the transition to the hydrophilic state. In the modelsof pore formation, including the aqueous pore formation model of electroporation,the transmembrane voltage does not cause, but only facilitates the formation ofhydrophilic pores, which can account for the stochasticity of electropermeabilizat-ion. As Figs. 19 and 20 testify, the values at which this facilitating effect becomespronounced are in hundreds of millivolts, and thus in relatively good agreementwith the experiments.
Still, the aqueous pore formation model of electroporation has two significantshortcomings. The first is clearly observable in Fig. 21; namely, with realistic pa-rameter values applied, the transmembrane voltage reduces the energy barrier of thehydrophobic–hydrophilic transition, but it reduces the barrier of an irreversiblebreakdown to a much larger extent. For example, a transmembrane voltage above361mV reduces the energy barrier of aqueous pore formation by only severalpercent, but once the pore is formed, this voltage imminently leads to the break-down. This effect is independent of the choice of the arbitrary function g(r), since itis governed exclusively by the contribution of the electric energy. Nonetheless, the
2 Because of the lateral thermic fluctuations of the lipid molecules, hydrophobic pores, with lifetimes in the picosecond range, are
in certain extent always present in the membrane.
M. Pavlin et al.192
undefined functional form of g(r) is the second shortcoming of the aqueous poreformation model of electroporation. In absence of its definition, the expressions forthe energy barrier that impedes the hydrophobic–hydrophilic transition, as well asthe minimum radius of a hydrophilic pore rp also remain undefined. This short-coming will probably be addressed in the future, either theoretically, by a derivationof a physical law which would define g(r), or experimentally, by a measurement ofits values. On the long term, the former alternative is definitely preferred.
Subsequent paragraphs contain a short overview of various extensions of theaqueous pore formation model that have been proposed by different authors.
3.8. Extensions of the Aqueous Pore Formation Model
Several approaches have been proposed for improving the aqueous pore formationmodel presented in the preceding section. Two of these [94,95] addressed its du-bious prediction that transmembrane voltage strongly facilitates an irreversiblebreakdown. Barnett and Weaver accounted for the fact that a pore alters not onlythe capacitive, but also the conductive energy of the membrane, and reformulatedthe electric energy as3
DW e ¼ �ð�e � �mÞp
dU2
Z r
0
r drð1þ lðrÞÞ2
(16)
with
lðrÞ ¼prsp2dse
(17)
where se and sp are the electric conductivities of the aqueous medium outside andinside the pore. The exact value of sp depends on the properties of the lipidheadgroups forming the surface of the pore, as well as on the properties of theaqueous medium inside the pore, but in the first approximation it is reasonable toassume that spEse, so that
lðrÞ ¼pr2d
(18)
and the electric energy is given by
DW e ¼ �ð�e � �mÞ U2
4d log 1þ pr2d
� �p
�2r
1þ pr2d
� �. (19)
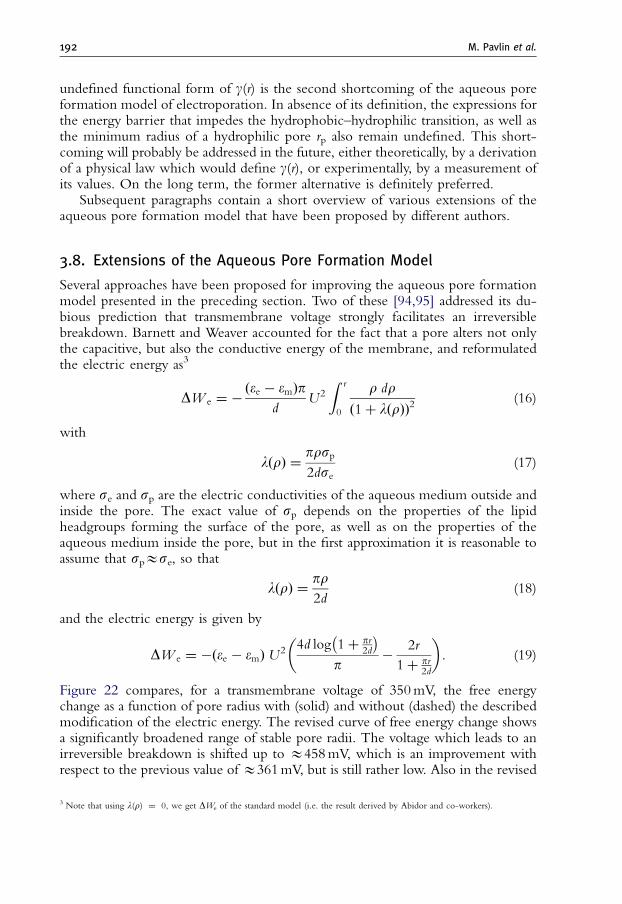
Figure 22 compares, for a transmembrane voltage of 350mV, the free energychange as a function of pore radius with (solid) and without (dashed) the describedmodification of the electric energy. The revised curve of free energy change showsa significantly broadened range of stable pore radii. The voltage which leads to anirreversible breakdown is shifted up to E458mV, which is an improvement withrespect to the previous value of E361mV, but is still rather low. Also in the revised
3 Note that using l(r) ¼ 0, we get DWe of the standard model (i.e. the result derived by Abidor and co-workers).

Figure 22 Free energy change as a function of the pore radius, without (dashed) and with(solid) the modi¢cation of the conductive electric energy as formulated by Barnett andWeaver[94].
Electroporation of Planar Lipid Bilayers and Membranes 193
model, the facilitating effect of transmembrane voltage on formation of aqueouspores remains very weak.
Freeman and co-workers [95] made an attempt to enhance this model further byaccounting for the energy needed by charged particles to traverse the pore(the Born energy), which led them to a more complicated expression for l(r)expressed as a polynomial regression of experimental data.
Another study has addressed the effect of the difference between the osmo-larities of the extracellular medium and the cytoplasm [32]. To address this effect,the change of free energy must incorporate the change of osmotic energy caused bythe pore formation,
DW osm ¼ �pe � pi�� ��R
2pr2 (20)
where pe and pi are the osmotic pressures in the extracellular medium and inside thevesicle or cell, respectively, and R is the radius of the vesicle or cell. The osmoticenergy thus acts similarly to the surface energy and the electric energy – it reducesthe free energy of the membrane, and is proportional to r2. This implies that adifference between the osmolarities makes the membrane more susceptible to theeffects of the transmembrane voltage, which seems to be in agreement with ex-periments [96,97].
Finally, it was also analyzed how electroporation is affected by the curvature ofthe membrane [98]. Unlike in planar bilayers, in vesicles and cells the membrane isinherently curved, with the curvature increasing with a decreasing cell radius.According to the calculations by Neumann and co-workers, the change of cur-vature energy caused by the pore formation is
DW crv ¼ �64Y
Rdp2r2 (21)

M. Pavlin et al.194
where Y is the elasticity module of the membrane and R the radius of the cell. Thisalso shows that the curvature reduces the free energy of the membrane and impliesthat, at a given transmembrane voltage, electroporation is more intense in smallercells.4
Today, many consider the aqueous pore formation model to be the most con-vincing explanation of electroporation. If in the future it preserves this status, thenfurther research, especially measurements of the relevant physical quantities, shouldgradually result in the improvement of the current form of the aqueous poreformation model. It is reasonable to expect that some of the tentative extensionsdescribed above will soon be incorporated into the model, while revisions andentirely new propositions will continue to appear. It is also reasonable to expectthat an explicit formulation of the function g(r) should be given in the near future.The insights obtained by molecular dynamics simulations, and perhaps by an ad-vanced method of visualization or another type of detection, should also yielda clearer picture of the electropermeabilized membrane on a nanometer scale,thereby providing the final verdict on the validity of the concept of electrop-oration.
4. Electroporation of Cells-Experimental Observations
and Analysis of Underlying Phenomena
The electroporation of cells is sometimes also referred to as elect-ropermeabilization, which stresses the crucial observation that increased perme-ability of the cell membrane is observed above a certain critical (threshold) appliedelectric field. It was shown by several independent studies that electroporation ofcells is closely related to electroporation of lipid bilayer membranes, referred to alsoas dielectric breakdown, and that the structural changes in the membrane areformed in the lipid part of the cell membrane. Still the exact molecular mechanismsof the formation, structure and stability of these permeable structures (pores) are notcompletely understood [32,99]. On one hand the theoretical descriptions that weredeveloped for lipid bilayers do not include cell structures such as cytoskeleton andproteins. In addition non of the existing theories can describe permeable structuresor pores which could be stable for minutes and hours after pulse application. Onthe other hand, the increased permeability after the pulses, which enables deliveryof molecules (drugs, DNA moleculesy) is crucial for application of cell elect-roporation in biotechnology in biomedicine [2,100,101]. Therefore, phenomeno-logical observations and quantification of cell electroporation can lead to someconclusions enabling evaluation of electroporation theories when applying them tosuch complex systems as cells and helps to understand the underlying mechanisms.
For this reason, we will present the theoretical and experimental data on theelectroporation of cells. We will focus on the experimental evidence of cell
4 This is true for a given transmembrane voltage, but not for a given pulse amplitude, since the transmembrane voltage induced by
the pulse is proportional to the cell radius.

Electroporation of Planar Lipid Bilayers and Membranes 195
electroporation in vitro and on related theoretical interpretations. First, we brieflypresent theoretical descriptions of phenomena involved in cell electroporation: theinduced transmembrane potential, forces which act on the cell and the transportwhich occurs through permeabilized cell membrane. Then we will overview sev-eral experimental studies, which studied different involved phenomena (imaging,conductivity, transport of moleculesy), and finally we discuss how the theoreticaldescription of pore formation presented in previous section can be applied toexperimental observations of cell electroporation.
4.1. Induced Transmembrane Voltage and Forces on the CellMembrane
Even though the exact physical–chemical mechanisms of cell electroporation arenot clear and several theoretical models exist, it is generally accepted that one of thekey parameters for successful permeabilization is the induced transmembrane volt-age. This voltage is generated by an external electric field due to the difference inthe electric properties of the membrane and the external medium, known as theMaxwell–Wagner polarization [102,103]. If the induced transmembrane voltage islarge enough, i.e. above the critical value, electroporation is observed – a cellmembrane becomes permeabilized in a reversible process allowing easier transportof ions and entrance of molecules that otherwise cannot easily cross the cell mem-brane [2,6,7,29,32,101].
4.1.1. The induced transmembrane voltage on a spherical cellWe consider a spherical cell exposed to an external homogeneous electric field E0,as schematically shown in Fig. 23, where R denotes radius of the cell, d thickness ofthe membrane, conductivities s and e permittivities of the cell membrane, cyto-plasm and exterior (Table 5).
The Laplace equation holds for all three regions: e – external medium, m –membrane and i – the cell interior. The respective potentials satisfying Laplace’s
Figure 23 A spherical cell in external electric ¢eld.
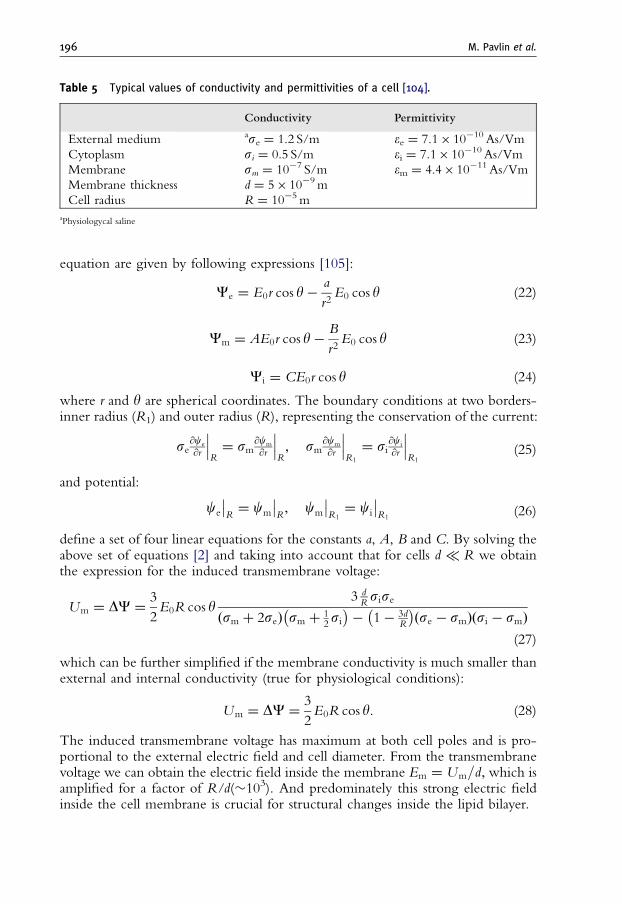
Table 5 Typical values of conductivity and permittivities of a cell [104].
Conductivity Permittivity
External medium ase ¼ 1.2 S/m ee ¼ 7.1� 10�10 As/Vm
Cytoplasm si ¼ 0.5 S/m ei ¼ 7.1� 10�10 As/Vm
Membrane sm ¼ 10�7 S/m em ¼ 4.4� 10�11 As/Vm
Membrane thickness d ¼ 5� 10�9m
Cell radius R ¼ 10�5m
aPhysiologycal saline
M. Pavlin et al.196
equation are given by following expressions [105]:
Ce ¼ E0r cos y�a
r2E0 cos y (22)
Cm ¼ AE0r cos y�B
r2E0 cos y (23)
Ci ¼ CE0r cos y (24)
where r and y are spherical coordinates. The boundary conditions at two borders-inner radius (R1) and outer radius (R), representing the conservation of the current:
se@ce
@r
���R¼ sm
@cm
@r
���R; sm
@cm
@r
���R1
¼ si@ci
@r
���R1
(25)
and potential:
ce
��R¼ cm
��R; cm
��R1
¼ ci
��R1
(26)
define a set of four linear equations for the constants a, A, B and C. By solving theabove set of equations [2] and taking into account that for cells d � R we obtainthe expression for the induced transmembrane voltage:
Um ¼ DC ¼3
2E0R cos y
3 dRsise
sm þ 2seð Þ sm þ 12si
� �� 1� 3d
R
� �se � smð Þ si � smð Þ
(27)
which can be further simplified if the membrane conductivity is much smaller thanexternal and internal conductivity (true for physiological conditions):
Um ¼ DC ¼3
2E0R cos y. (28)
The induced transmembrane voltage has maximum at both cell poles and is pro-portional to the external electric field and cell diameter. From the transmembranevoltage we can obtain the electric field inside the membrane Em ¼ Um=d; which isamplified for a factor of R/d(�103). And predominately this strong electric fieldinside the cell membrane is crucial for structural changes inside the lipid bilayer.

Electroporation of Planar Lipid Bilayers and Membranes 197
Most of the authors agree [29,106–108] that the induced transmembrane volt-age is superimposed on the resting transmembrane voltage, resulting in an asym-metric transmembrane voltage. The above equation gives the inducedtransmembrane voltage for a spherical cell, which is valid for cells for most ofthe conditions present in experiments and is widely used in the literature. However,there are some cases where this simplified equation leads to considerable errors: forvery low-conductive media seo0.01 S/m [109,110] the original equation has to beused where all three conductivities influence the induced transmembrane voltage.The above derivation follows from Laplace equation, which is valid only if theelectroneutrality condition is satisfied (no net charges in any of the regions). This isnot true for a biological cell where surface charge is present in a layer with thicknessof a Debye length. Thus, instead of the Laplace equation the Poisson equationshould be solved. The difference between the solutions of both equations is sig-nificant only for very low-conductive media and can be neglected otherwise[2,111].
Schwan derived the time dependent solution [109] for the induced transmem-brane voltage on a spherical cell for a step turn-on of a DC electrical field:
DC ¼3
2E0R cos y 1� e�t=t
� � 3 dRsise
sm þ 2seð Þ sm þ 12si
� �� 1� 3d
R
� �se � smð Þ si � smð Þ.
(29)
The time constant t also depends on the dielectric properties of the membrane:
t ¼�m
d
R
2sesi2se þ si
þ sm(30)
where em denotes permittivity of the membrane. The time constant t represents atypical time needed for charging of a cell membrane, which behaves as a capacitor.It is directly related to the frequency of beta dispersion observed in impedancespectra of cells. For a typical biological cell we obtain a time constant around amicrosecond, which represents the time that is needed for the induced transmem-brane voltage to build up on the cell membrane and for electroporation to occur.For times shorter than microsecond the cell interior is also exposed to an electricfield, resulting in the induced transmembrane voltage across the membrane of thecellular organelles. Thus for very short high-voltage pulses cell organelles can bepermeabilized [112]. The above equation is valid for the response of a cell to asquare pulse, however, for other pulse shapes the responses differs from the ex-ponential [113].
4.1.2. Dense cell systemsIn case of dense cell systems (dense suspension and tissue) with high cell volumefraction ðf40:1Þ [114,115] the local electric field E is lower than the appliedelectric field E0 due to the effect of neighboring cells. In Fig. 24 it can be seen thatin case when f ¼ 0.5 normalized induced transmembrane voltage is decreased from1.5 to 1.3 for cells organized in fcc lattice, which is the most realistic representationof cell ordering in dense suspension. Therefore in dense cell suspensions and tissuethe decrease in the local field should be taken into account.

0 0.1 0.2 0.3 0.4 0.5 0.6 0.7 0.80.9
1
1.1
1.2
1.3
1.4
1.5
1.6
f
TM
Pm
ax/E
0Rsc TMPmax
bcc TMPmax
fcc TMPmax
Figure 24 The normalized maximal (f ¼ 01) induced transmembrane voltage-TMPmax=E0Rin dense cell suspension (f-cell volume fraction) for three di¡erent cubic lattices (simple cubic ^sc, body centered cubic ^ bcc and face centered cubic lattice ^ fcc).
M. Pavlin et al.198
4.2. Maxwell Stress Tensor and Forces Acting on a Cell in anExternal Field
The cell membrane experiences different forces in the presence of an externalelectrical field, which can be derived from Maxwell stress tensor:
T ij ¼ � EiEj �12E2dij
� �. (31)
From the solution of a Laplace equation for a cell in an external field E0 (equa-tions (22–24)) we can calculate the electric fields in the cytoplasm, membrane andoutside the cell [2]. For the average radial component of the field inside themembrane we obtain:
Erm ¼3
2
Rð1� 2d=RÞ
dE0 cos y �
3
2
R
dE0 cos y (32)
and for radial components inside and outside the cell:
EriðR1Þ ¼ 3E0
smse2smse þ smsið Þ þ 2sised=R
cos y � 3E0
smRsi d
cos y (33)
EreðRÞ ¼ 3E0
smsi 1� 2d=R� �
2smse þ smsið Þ þ 2sised=Rcos y � 3E0
smRse d
cos y. (34)

Electroporation of Planar Lipid Bilayers and Membranes 199
If we insert the above equations into the expression for Maxwell stress tensor:
T ij ¼ � EiEj �12E2dij
� �(35)
we obtain the compression force in the membrane:
Tmrr ¼ �mE
2rm=2 ¼
9
8
R
d
� �2
�mE20cos
2y. (36)
Additionally, each surface experiences slightly different pressure yielding a netoutward-directed force which tends to elongate the cell in the direction of the field:
T err � T i
rr ¼9
2
R
d�mE
20cos
2y. (37)
The elongation due to Maxwell stress tensor can be observed for giant vesiclesunder the microscope [116] for electric fields used in electroporation, however forcells the cytoskeleton prevents cells to deform. Only in case of extremely strongelectric fields (above 10 kV/cm) that are used for electroporation of organelles withnanosecond pulses, some deformation of cells can be observed [117,118].
4.3. Transport of Molecules Across Permeabilized Membrane
In this section, we discuss the underlying mechanisms which contribute to theincreased transport for ions, molecules and macromolecules across an elect-ropermeabilized membrane. There are several possible transmembrane transportmechanisms of which most important are diffusion, electrophoresis, electroosmosisand osmosis. Which mechanism is dominant depends on the type of the object(ion, molecule), the length of the pulses, electric field strength, concentrationgradients and other physical parameters. However, general observation in differentexperimental studies was that transport of ions and molecules occurs only throughthe permeabilized area.
4.3.1. DiffusionThe flux of a given neutral molecule through the permeable membrane can bedescribed by diffusion equation:
dneðtÞ
dt¼ �
ceðtÞ � ciðtÞ
dD f perðt;E; tE;NÞ S0 (38)
where fper represents the fraction of pores in the cell membrane which is a complexfunction of time (t) (mostly due to resealing process), electric field strength (E),pulse duration (tE) and number of pulses (N). Additionally, the diffusion constant fora given molecule depends on the size of permeable structures (pores), leading to anequation which in real experimental observations of molecular uptake can be usedonly approximately. The above equation can also describe diffusion of ions orcharged molecules through the permeabilized region since diffusion is a relativelyslow process which occurs mainly after the pulse application and thus the Nernst–Planck equation (see equation (90)) simplifies to the above equation.

M. Pavlin et al.200
4.3.2. ElectrophoresisElectrophoresis is another mechanism of transport which was shown to be the mostimportant for the transport of charged macromolecules, especially for DNA mol-ecules. The electrophoretic driving force acts on the charged molecules in theelectric field, thus, unlike diffusion, is present only during the pulse. For this reasonprotocols for gene transfection use much longer pulses (a few to tens of millisec-onds) than pulses used for uptake of smaller molecules, or combination of shorthigh-voltage and long low-voltage pulses [119–121]. Electrophoretic force is thedriving force for all charged molecules:
F ¼ eeffEloc (39)
where eeff is the effective charge of a given molecule and Eloc the local electric field.The effective charge depends on the charge of a given molecule and on the ionicstrength of the solution. The velocity of a given molecule depends on its mobilityand viscosity of the medium.
4.3.3. Osmosis and electroosmosisThe osmotic flow is driven by the difference in the osmotic pressure inside andoutside of the cell:
FðtÞ / cðtÞ Dp (40)
depending also on the permeability of the membrane. In most experimental con-ditions isoosmolar media are used, however, when a cell membrane is permeabili-zed, ions and smaller molecules are free to move due to diffusion, whereasmacromolecules are bound inside the cell. Consequently, the cell interior is not inosmotic equilibrium with the exterior and thus water flowing into the cell causes itsswelling. This swelling, also named colloid-osmotic swelling, is observed in elect-roporation experiments on cells [122–125]. Together with the flow of water alsothe molecules are driven into the cell.
Electroosmosis is the transport of bulk liquid through a pore under the influenceof an electric field. In an electric field ions migrate together with their sheath ofwater molecules, which induces the flow of water through the pore.
4.3.4. The permeabilized surface areaIndependently on the process it was shown that the transport of ions and moleculesduring electroporation occurs only through the permeabilized area Sc, i.e. the areawhich is exposed to above-critical voltage [84,126–128]. From the expressionfor the induced transmembrane voltage for an isolated spherical cell (equation (28))we can define the critical angle yc where the induced voltage equals the criticalvoltage Uc:
DUc ¼ DC ¼ 1:5 ER cos yc. (41)
If we neglect the resting transmembrane voltage we obtain the formula for the areaof two spherical caps (see Fig. 25) where DC4Uc:
Sc ¼ 2� 2pR2ð1� cos ycÞ. (42)

Figure 25 Schematical representation of permeabilized area of cell membrane.
Electroporation of Planar Lipid Bilayers and Membranes 201
Now, we define the critical field as the electric field when yc ¼ 0 : Ec ¼ U c=1:5and thus obtain the total area exposed to above-threshold transmembranevoltage:
Sc ¼ S0ð1� Ec=EÞ. (43)
When considering the flow of molecules and ions across the permeabilized mem-brane above equation has to be incorporated in order to determine total flow acrossthe membrane. Therefore, part of electric field dependence of pore fraction fper isdue to the increased permeabilized surface.
4.4. Experimental Studies and Theoretical Analysis of CellElectroporation in vitro
Different studies analyzed cell electroporation in vitro either on single cells as well ason attached cells, cells in suspensions or multicell spheroids. Common observationis that electroporation is a threshold phenomenon and that it is governed by pulseparameters (duration, number and repetition frequency). Sometimes the criticalvoltage (or applied field) above which the transport is observed is defined as thereversible threshold since the changes are reversible and the cell membrane resealsafter a given time lasting from minutes to hours. The value of the critical (threshold)transmembrane voltage at the room temperature was reported to be between 0.2and 1V [29,31,85,108] depending on pulse parameters and experimental condi-tions [129]. Further increase of the electric field causes irreversible membranepermeabilization and cell death due to direct physical loss of membrane integrity ordue to excessive loss of the cell interior content.
4.4.1. Imaging of the transmembrane voltage during electroporationKinosita, Hibino and co-workers [84] used fast video imaging on a microsecondtime scale to measure transmembrane voltage of sea urchin eggs during and after the
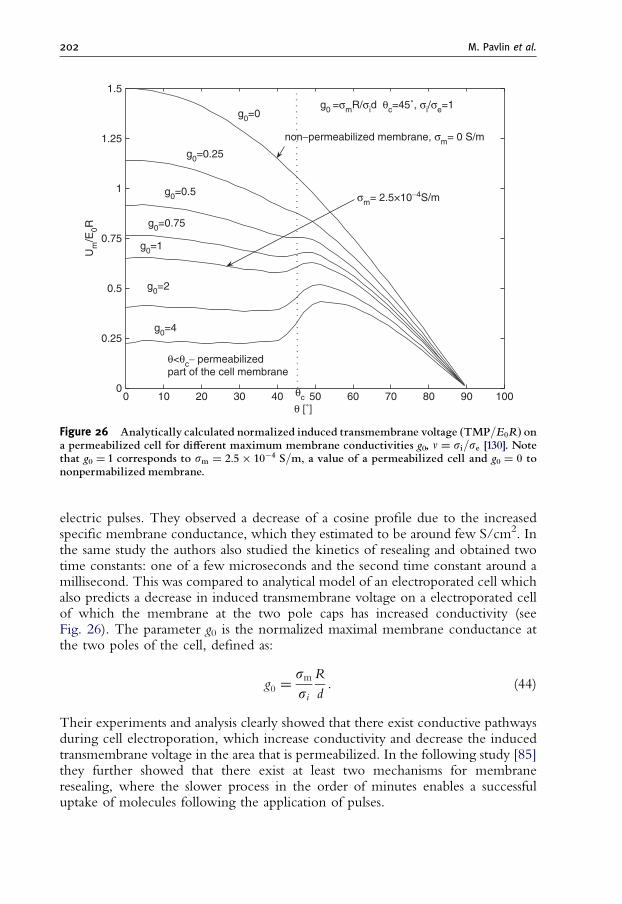
0 10 20 30 40 50 60 70 80 90 1000
0.25
0.5
0.75
1
1.25
1.5
θ [˚]
Um
/E0R
g0 =σmR/σid θc=45˚, σi/σe=1
g0=4
g0=2
g0=0.25
g0=0.5
g0=0.75
g0=1
g0=0
θc
non−permeabilized membrane, σm= 0 S/m
σm= 2.5×10⁻⁴S/m
θ<θc− permeabilizedpart of the cell membrane
Figure 26 Analytically calculated normalized induced transmembrane voltage ðTMP=E0RÞ ona permeabilized cell for di¡erent maximum membrane conductivities g0, n ¼ si=se [130]. Notethat g0 ¼ 1 corresponds to sm ¼ 2:5� 10�4 S=m; a value of a permeabilized cell and g0 ¼ 0 tononpermabilized membrane.
M. Pavlin et al.202
electric pulses. They observed a decrease of a cosine profile due to the increasedspecific membrane conductance, which they estimated to be around few S/cm2. Inthe same study the authors also studied the kinetics of resealing and obtained twotime constants: one of a few microseconds and the second time constant around amillisecond. This was compared to analytical model of an electroporated cell whichalso predicts a decrease in induced transmembrane voltage on a electroporated cellof which the membrane at the two pole caps has increased conductivity (seeFig. 26). The parameter g0 is the normalized maximal membrane conductance atthe two poles of the cell, defined as:
g0 ¼smsi
R
d. (44)
Their experiments and analysis clearly showed that there exist conductive pathwaysduring cell electroporation, which increase conductivity and decrease the inducedtransmembrane voltage in the area that is permeabilized. In the following study [85]they further showed that there exist at least two mechanisms for membraneresealing, where the slower process in the order of minutes enables a successfuluptake of molecules following the application of pulses.

Electroporation of Planar Lipid Bilayers and Membranes 203
4.4.2. Measurements of conductivity in cell suspensions andpellets – quantification of short-lived pores
The first measurements of electrical properties of cells in a suspension duringelectroporation were done by Kinosita and Tsong [122,131,132], who measuredelectric properties of the isotonic suspension of erythrocytes. They observed anincrease in the conductivity for electric fields around kV/cm and explained it withthe increased membrane permeability for the ions due to formation of pores in acell membrane. The initial step of pore formation was governed by the magnitudeof the transmembrane voltage. From the measured changes of conductivity usingtheir theoretical model they calculated the membrane conductivity and estimatedthe number of pores and ion flux through the permeabilized membrane. Theydetermined that conductivity increased in two steps: a fast step in the range of onemicrosecond and a slower step which takes around 100 s. Specific membrane con-ductance increased up to 100 S/cm2 but, in general, depended on pulse durationand electric field strength. After the end of the pulse the conductivity of the cellsuspension returned to its initial value in a few seconds, but later on again increaseddue to the ion efflux. These observations were confirmed by the experiments ofAbidor and co-authors [123,124] on cell pellets of different cell types, where anincrease in the pellet conductance during the pulses above the critical electric fieldfor electroporation was observed. After the pulse the conductance returned to theinitial level in several stages: the first stage lasted milliseconds, the second a fewseconds and the complete resealing was observed after minutes. They also observedchanges of conductance due to the osmotic swelling of cells. Using microsecondand nanosecond pulses, several following studies observed increased conductivityduring electroporation in vitro and in vivo [133,134] which suggested that meas-urement of conductivity could enable on-line observation and control of tissueelectroporation [125,135,136].
Recently we made an extensive in vitro study of conductivity during cell elect-roporation of cell (B16F1 cells) suspensions. Figure 27 represents transient con-ductivity changes DstranN=s0 during the N-th pulse for E0 ¼ [0.4–1.8] kV/cm. Anincrease in transient conductivity changes is observed above 0.5 kV/cm, which is inagreement with the threshold for permeabilization of B16 cells obtained for mo-lecular uptake. Interestingly, the number of pulses does not influence the transientconductivity [125,137].
From the measured conductivity changes fraction of the surface area of porescan be determined. Detailed derivation is presented in Appendix B.1. The fractionof transient pores fp can be estimated as:
f p ¼Spor
S0�
ð1� Ec=EÞ smr s0por
(45)
where s0por is the average conductivity between inside the cell and extracellularmedium and parameter r is:
r ¼1
1þ nbUm
w0�nbUm
� �exp w0 � nbUmð Þ �
nbUm
w0�nbUm
. (46)

0 0.5 1 1.5 2
0
0.05
0.1
0.15
0.2
0.25
E [kV/cm]
∆σN
tran
/σ0
reference
N = 1
N = 2
N = 4
N = 8
Figure 27 Transient conductivity changes duringN-th pulse of the train of 8�100 ms pulses areshown. DsNtran is normalized to the initial conductivity. Solid line-cells in medium, dotted line-reference measurement on mediumwithout cells during the ¢rst pulse.
Table 6 Calculation of conductivity inside the aqueous pore – values of used parameters.
N e/kT si Um R D
0.15 40V�1 0.5 S/m 900mV 9.5 mm 5nm
E Ec W0 r sm D
0.84 kV/cm 0.5 kV/cm 2.5–5 0.22–0.57 1.4–3.5� 10�5S/m 2.5� 10�5 cm2/s
M. Pavlin et al.204
The parameters are defined in Appendix B.1, the values used are presented inTable 6. For the membrane conductivity sm ¼ ½1:4� 3:5� � 10�5 and insertingvalues of parameters (see Table 6) we obtain for fraction of transient pores after 100 spulse being f p ¼ 10�5 � 10�4: Conductivity changes calculated theoretically takinginto account the nonohmic behavior of the conductivity inside the pore usingequation (46) are in good agreement with measured increase in conductivity duringthe pulses [125].
In Fig. 28, it is demonstrated that the conductivity changes relax almost to initiallevel in ten milliseconds (100Hz) and after 1 s the following pulses have almostidentical shape as the first pulse. This indicates that during electric pulses short-livedstructural changes are formed which transiently increase ion permeation, but havevery short lifetime after the pulses.

−2
0
2
4
6
8
10
12
14
x 10−3
∆σ(t
) [S
/m]
1 Hz 10 Hz 2.5 kHz 1 kHz 100 Hz
N = 1
N = 3
N = 5
Figure 28 E¡ect of the repetition frequency on the conductivity changes. Pulses 8�100 ms withrepetition frequencies from 1Hz^2.5 kHz were used, E ¼ 0.84 kV/cm. The time-dependentconductivity changes DsðtÞ of the ¢rst, third and the ¢fth pulse with respect to the ¢rst pulse(all initial levels are set to zero) are compared for di¡erent frequencies. Obtained from Ref.[125] with permission of Biophysical Society.
Electroporation of Planar Lipid Bilayers and Membranes 205
Altogether the conductivity measurements enable detection of short-lived per-meable structures which are formed during the pulses. However since the con-ductivity drops to initial level in milliseconds after the pulses, these ‘‘pores’’ do notrepresent long-lived permeable structures which enable transport of molecules afterthe pulses.
4.4.3. Experimental studies of the effect of different parameters onmolecular transport
The transport, which governs the uptake of molecules and leakage of cytoplasmcontents, depends on experimental conditions, pulse parameters and the test mol-ecule. The extensive studies of Teissie, Rols and colleagues, [30,96,120,138–141]examined the effect of different parameters (electric field strength, number ofpulses, duration) on the extent of permeabilization uptake of exogenous molecules,cell survival, release of intracellular ATP and resealing. With these measurements itwas shown that the critical parameter is the electric field strength and that theextent of permeabilization is governed by both duration and number of pulses. Theauthors define phenomenological electropermeabilization threshold Ep belowwhich no transport is observed for given pulse parameters. However, they alsodefine ‘‘limit’’ or real threshold Es [30] which is the threshold below which nopermeabilization occurs no matter how long the pulses are or how many are used.This threshold can be interpreted as the value of the electric field where criticaltransmembrane voltage is reached.

M. Pavlin et al.206
Two other extensive studies of electroporation in vitrowere made [33,34], whereauthors studied uptake and viability for different electric field strength, duration,number of pulses and also different cell volume fractions. Data indicated that nei-ther electrical energy nor charge determines the extent of permeabilization and thatthe dependency is more complex. The results of these two studies also suggest thatby increasing number and duration of pulses a certain ‘‘limit’’ threshold for perm-eabilization is reached, or in other words, the permeabilization curves start at thesame electric field strength but the slope is electric field dependent. Even thoughsome studies suggested [3] that pulse shape affects efficiency of electroporation ourextensive study [142] of different pulse shapes showed that this is not crucialparameter.
The general observation on the resealing kinetics of cell electroporation is thatresealing of the membrane lasts for minutes and is strongly dependent on thetemperature. Together with the fact that a colloid-osmotic effect is also present it isobvious that complete resealing of the cell membrane is governed by slow bio-logical processes, which was shown that is ATP dependant.
4.4.4. Osmotic cell swellingIt was shown in several experiments that cells swell during electroporation[123–125,132]. Swelling of permeabilized cells is caused due to the difference in thepermeabilities of ions and larger molecules (macromolecules) which results in anosmotic pressure that drives water into the cells and leads to cell swelling. Thedynamics and the extent of cell swelling can be observed using imaging of cellsduring and after pulse application. The results of the measurements of the cell sizesduring and after the pulses are shown in Fig. 29. The time constant of colloidosmotic swelling is few tens of seconds which is in agreement with the timeconstant for efflux of ions, which is between 10 and 20 s.
Figure 29 The e¡ect of colloid-osmotic swelling ^ relative changes of the surface areaDS=S0 ofcells for di¡erent applied electric ¢eld strengths E0 of the electric pulses (8�100 ms, 1Hz) andcontrol (E0 ¼ 0 kV/cm), time t ¼ 0 s ^ start of the ¢rst pulse, t ¼ 7 s end of pulsation.

Electroporation of Planar Lipid Bilayers and Membranes 207
4.4.5. Quantification of ion diffusion and the fraction of long-lived poresThe process of ion transport during electroporation is similarly as transport ofmolecules governed mostly by diffusion. An increase in conductivity between thepulses due to ion efflux can be therefore used to determine the permeabilitycoefficient and fraction of stable pores, which enable molecular transport which iscrucial for successful application of electroporation.
The diffusion of ions is a slow process compared to the duration of the electricpulses thus we can assume that the major contribution to efflux of ions occurswithout the presence of the electric field:
dceðtÞ
dt¼ �
D SðE;N Þ
d VFð1� FÞceðtÞ � FciðtÞð Þ. (47)
Definition of parameters and more detailed derivation is presented in AppendixB.2. The solution of above equation for ceðtÞ gives exponential rise to maximum,from which it follows that the conductivity between the pulses also increases as anexponential due to ion efflux. Form this it follows that the permeability coefficientkN after the N-th pulse can be determined from the measured conductivity at N-thpulse (DsN ) and at N+1-th pulse (DsNþ1):
kN ¼1
DtNln 1�
DsNDsmax
1�
DsNþ1
Dsmax
�(48)
The permeability coefficient is directly proportional to the fraction of long-livedpores – fper:
f Nper � kNdRFð1� FÞ
3D0; D0 ¼ D expð�0:43w0Þ. (49)
In Fig. 30 relative changes of the initial level of conductivity due to ion diffusionat the start of the N-th pulse Ds=s0 ¼ ðsN0 � s0Þ=s0 for consecutive pulses areshown. Similarly as in Fig. 27 the initial level starts to increase for above thethreshold E4 0.5 kV/cm, which can be explained with the efflux of ions (mostlyK+ ions) from the cytoplasm through membrane pores. For higher electric fieldsions efflux increases up to 1.6 kV depending also on the number of applied pulses.From measured Ds=s0 ¼ ðsN0 � s0Þ=s0 using equation (48) we calculated per-meability coefficients kN which are proportional to fraction of long-lived pores(fper). It can be seen (see Fig. 31) that kN approximately linearly increases withnumber of pulses, and as expected increases also with the electric field strength.
4.4.6. The effect of electric field on long-lived pore formation andstabilization
Previously we have obtained the equation (see equation (43)) that determines howthe electric field governs the area of the cell membrane, which is exposed to theabove-critical transmembrane voltage Uc and has increased permeability: ScðEÞ ¼S0 ð1� EcÞ=E� �
: Furthermore, we can assume that pore formation in the areawhere U4Uc is governed by the free energy of the pore, where the electrostaticterm also includes the square of the electric field DW e ¼ aE2 [32,46]. Based on thiswe can assume that the most simplified equation, which describes the field

0 0.5 1 1.5 2
0
0.1
0.2
0.3
0.4
0.5
E [kV/cm]
∆σ/σ
0N = 1
N = 2
N = 3
N = 4
N = 5
N = 6
N = 7
N = 8
Figure 30 Relative conductivity changes between the pulses due to ion di¡usion ^Ds=s0 ¼ ðsN0 � s0Þ=s0;where sN0 is the initial level at the start of the Nth pulse. 8�100 ms pulseswere used with repetition frequency 1Hz.
1 2 3 4 5 6 70
0.1
0.2
0.3
0.4
0.5
0.6
N
k N [s
−1]
E = 0.35kV/cm
E = 0.52kV/cm
E = 0.70kV/cm
E = 0.86kV/cm
E = 1.05kV/cm
E = 1.22kV/cm
E = 1.43kV/cm
E = 1.61kV/cm
Figure 31 The permeability coe⁄cients kN forNpulses obtained after theN-th pulse calculatedusing equation (48) from the conductivity changes Ds=s0 using 8�100 ms pulses. Obtained fromRef. [137] with permission of Elsevier.
M. Pavlin et al.208

Figure 32 The permeability coe⁄cients kN forNpulses obtained after theN-th pulse calculatedusing equation (48) from the conductivity changes Ds=s0 using 8�100 ms pulses. Comparison ofthe prediction of the model according to equation (50) (lines) and the measured permeabilitycoe⁄cients (symbols) is shown [137], with permission of Elsevier.
Electroporation of Planar Lipid Bilayers and Membranes 209
dependent permeability, can be written as [137]:
kN ðEÞ ¼ CN ð1� Ec=EÞE2. (50)
where CN are constants that depend on the size of the pores and their growth, andare thus dependent also on the number of pulses. The above equation takes intoaccount the increase of the area of the cell exposed to the above critical voltage andthe quadratic field dependence in the permeabilized region.
In Fig. 32 we compare the field dependence of the experimental permeabilitycoefficient with the theoretical model. As expected, the permeability coefficient kNand with this fraction of ‘‘transport’’ pores (see equation (48)) increases above thethreshold electric field. More interestingly, this simple model (equation (50)) canvery accurately describe the measured values, as can be seen in Fig. 32. Thisdemonstrates that long-lived pore formation is governed also by the energy of thepores as well as by the number of pulses.
4.4.7. General experimental observations of cell electroporationTo summarize different phenomenological observations of cell electroporation(electropermeabilization)
�
The state of transiently increased membrane conductivity indicates the existenceof short-lived membrane structures which enable ion permeation. In the aque-ous pores formation model of electroporation this corresponds to conductivehydrophilic pores [32]. An alternative explanation of these permeable structureswas that they are structural mismatches in the lipid organization [143]. Themembrane conductivity drops to the initial level in a range of a millisecond after
M. Pavlin et al.210
the pulses. This could be explained only with the existence of many small porestransient during the electric pulses, which close very rapidly (milliseconds) afterthe pulse. The number of these short-lived pores does not depend on thenumber of applied pulses but solely on the electric field strength and pulseduration.
�
The state of increased permeability can last for tens of minutes after pulseapplication. Therefore, it is clear that in contrast to transient pores which resealin milliseconds some pores are stabilized enabling transport across the membranein minutes after the pulses. The quantification of ion efflux shows that in con-trast to transient short-lived pores these stable pores are governed both by elec-tric field strength as well as the number of pulses. The fraction of long-livedstable pores increases with higher electric field due to larger area of the cellmembrane exposed to above critical voltage and due to higher energy which isavailable for pores formation. Moreover, each pulse increases the probability forthe formation of the stable pores.�
The resealing of the cell membrane is a biologically active ATP-dependantprocess which strongly depends on the temperature and lasts from minutes tohours after pulse application. This clearly shows that long-lived pores are ther-modynamically stable.This and other observations lead to conclusion that the nature of long-lived‘‘transport’’ pores is different than that of transient pores, which are present onlyduring the pulses.
4.4.8. Possible theoretical explanations of long-lived poresAs shown in previous section there exist two types of pores (structural changes) ofwhich nature, duration and number differs significantly. Hydrophilic pores are notstable after pulse application therefore some additional process must be involved information of stable pores. In Fig. 33 possible inter-relations between structuralchanges, conductivity changes and permeabilization (increased transport of mol-ecules) are shown.
As shown in figure above the nature of long-lived pores and the relation be-tween short-lived structural changes and long-lived is still not completely under-stood. In literature several explanations for the existence of these stable long-livedpores can be found. It was proposed that larger pores are formed by coalescence ofsmaller pores (defects) which travel in the membrane [144]. Some authors suggestedthat pores (defects) migrate along the membrane surface [32] and are groupedaround inclusions. Altogether, there are no direct experimental observations whichwould confirm the hypothesis of a coalescence of pores.
There is general agreement that proteins are involved in stabilization of largerpores [32,46]. Authors speculated that cytoskeleton structure could act similarly tothe macroscopic aperture of planar membrane experiments leading to rupture oflimited portions of a cell membrane but not of the entire membrane [32]. Otherauthors suggested [139] that disintegration of the cytoskeleton network could affectelectroporation where specific sites in the membrane would be more susceptible to

Figure 33 Possible inter-relations between structural changes, conductivity changes andpermeabilization (increased transport of molecules).
Electroporation of Planar Lipid Bilayers and Membranes 211
pore formation. Some experiments suggest that only a few large pores contributeto increased permeability [145], whereas other suggests a contribution from alarger number of small defects due to the structural mismatches in the lipid mem-brane or due to structural discontinuities at borders between the domains. Recentlyit was also shown that anisotropic inclusions can stabilize pores in the membrane[146].
Altogether, there is still no definite explanation for the long-lived permeablestructures in the cell membrane [99]. Whatever these structures are, they havelong resealing times and are large enough to facilitate transport of larger mole-cules.
5. Comparison between Planar Lipid Bilayers and Cell
Electroporation
We have to stress that the described theories were developed for planar bilayermembranes which differ from cell membranes where membrane proteins andcytoskeleton are present. However, several experiments demonstrated that thestructural changes probably occur in the lipid region of the cell membrane[29,32,147] and thus these theories can be applied to cell membranes as well.
Both in planar bilayer membranes and cell membranes the authors obtained agradual increase of conductivity in high electric fields. The time interval precedingthe irreversible breakdown and the rate of increase of conductivity are determinedby the strength of the applied electric field [147]. The greatest observed differenceis that the reversible electroporation in cells is much more common than in planar

M. Pavlin et al.212
bilayer membranes and that resealing of artificial bilayer membranes takes milli-seconds whereas resealing of cells can last for several minutes. And specifically thislong-lasting increased permeability of cell membrane is crucial for biotechnologicaland biomedical applications. This shows clearly that for a complete description ofcell electroporation the role of the curvature, colloid osmotic swelling and speciallycell structures, such as cytoskeleton, domains and membrane proteins have to bediscussed and examined.
Altogether from theoretical model of aqueous pore formation can relativelygood describe experimental observations on lipid bilayers: critical transmembranevoltage and stochastic nature of the process. However, up to now there is notheoretical description which could completely describe all observable phenomenapresent during cell electroporation and the underlying physical mechanism: theformation of structural changes in the membrane on a molecular level during theelectric pulse, stochastic nature of electroporation, the observed dependency ofmolecular uptake on pulse duration and number of pulses, field strength, repetitionfrequency, the strong nonlinear transmembrane current-voltage characteristics withthe critical transmembrane voltages between 0.2–1V and the stability of ‘‘pores’’after the pulses as well as the resealing dynamics.
Altogether, the model of an aqueous pore formation offers a plausible expla-nation for its stochastic nature and dependence on the pulse duration. The localminimum in the free energy could represent stable hydrophilic pores, which couldexplain the state of increase conductivity and permeability during the electricpulses. However, as it can be seen from Fig. 21, by using the realistic parametersa minimum in free energy is obtained only for very specific values of parametersusually suggesting that electroporation would immediately lead to irreversibleelectroporation. Thus as already discussed in the review of Weaver andChizmadzhev, some additional processes/structures have to be included to obtaina realistic theoretical model of stable pores which could explain long-lived per-meability of the cell membrane after electroporation. It is also clear that this the-oretical description should incorporate proteins and cytoskeleton which can becrucial factors that enables pore stabilization and prevent breakdown of the cellmembrane thus enabling the most important applications of cell electroporation:electrogene transfer and electrochemotherapy.
Strong support for the existence of pores was given recently by Marrink andcolleagues in a molecular dynamics simulation of a lipid bilayer without [148] andin the presence [149] of an external electric field. Owing to thermal energy thelipid molecules constantly fluctuate and sometimes form short-lived states, with astructure similar to that of a small hydrophilic pore. By this, the assumption of theexistence of small pores in the membrane before the application of the electric pulseis justified. The dynamic simulation in the presence of an external electric field[149] further showed existence of hydrophilic pores for the induced transmembranevoltage above 2.5V, which is much higher than experimentally observed criticaltransmembrane voltage (0.2–1V), however, these studies are important since theypresent calculations of the possible lipid states by taking into account forces ona molecular level. Future studies will probably enable building more realisticmodels.

Electroporation of Planar Lipid Bilayers and Membranes 213
Appendix A
A.1. The Instability in the Hydrodynamic Model
In this model, the membrane is a layer of nonconductive liquid with permittivity emand surface tension G. Its volume V is constant, while both its surface S andthickness d are variable, with initial values denoted by S0 and d0. The pressureexerted on the membrane by the transmembrane voltage U is given by
p1 ¼�mU2
2d2(A.1)
and is opposed by the pressure due to the increase of membrane surface, which isgiven by
p2 ¼ �GV
Z S
S0
dS ¼ �GðS � S0Þ
dS. (A.2)
Since in this model the volume is constant, dS ¼ d0S0; and we can write
p2 ¼ �GðS � S0Þ
d0S0¼ �
Gd0
S
S0� 1
� �¼ �
Gd0
d0
d� 1
� �¼ �G
1
d�
1
d0
� �. (A.3)
The equilibrium is obtained at a value of d at which p1 þ p2 ¼ 0:
�mU2
2d2� G
1
d�
1
d0
� �¼ 0 (A.4)
We rewrite this expression as
1
d0d2 � d þ
U2�m2G
¼ 0. (A.5)
This is a quadratic equation and thus has two solutions, but since at U ¼ 0 themembrane thickness is by definition d ¼ d0, only one has a physical meaning,namely
d ¼d0
21þ
ffiffiffiffiD
p� �; whereD ¼ 1�
2U2�mGd0
. (A.6)
Real solutions then exist only for D � 0; and the equilibrium is only reached atvoltages below the critical value given by
U c ¼
ffiffiffiffiffiffiffiffiGd02�m
r. (A.7)
A.2. The Instability in the Elastic Model
We represent the membrane as an elastic layer with permittivity em and elasticitymodule Ym. We assume that the membrane surface S is constant, while its volumeV and its thickness d are variable, with initial values V0 and d0. The pressure caused

M. Pavlin et al.214
by the voltage U is again
p1 ¼�mU2
2d2(A.8)
and is opposed by the pressure due to the compression of the membrane volume,
p2 ¼
Z V
V 0
Y ðV Þ
VdV . (A.9)
Assuming that Y does not vary with the deformation, we get
p2 ¼ Y
Z V
V 0
dV
V¼ �Y ln
V 0
V¼ �Y ln
d0
dþ ln
S0
S
� �. (A.10)
Since we assume a constant surface, S ¼ S0; the second logarithm is zero, and wehave
p2 ¼ �Y lnd0
d. (A.11)
The equilibrium is obtained at a value of d which gives p1 þ p2 ¼ 0:
�mU2
2d2� Y ln
d0
d¼ 0 (A.12)
which we rewrite as
�mU2
Yd2¼ ln
d20d2
. (A.13)
Let w ¼ d20=d2; then
Kw ¼ ln w; whereK ¼ �mU2
Yd20: (A.14)
This equation is not solvable analytically, but it is easily verified that real solutionsexist only for K 1=e: The equilibrium is thus only reached below the criticalvoltage given by
U c ¼ d0
ffiffiffiffiffiffiffiY
e�m
r� 0:61d0
ffiffiffiffiffiY
�m
r. (A.15)
A.3. The Instability in the Hydroelastic Model
We assign to the membrane a permittivity em, surface tension G and elasticitymodule Y, and we assume that the volume V, surface S and thickness d of themembrane are all variable, with initial values of the latter two denoted by S0 and d0.The pressure generated by the transmembrane voltage is opposed by the pressuresdue to the membrane surface tension and elasticity (see Appendices A.1 and A.2),

Electroporation of Planar Lipid Bilayers and Membranes 215
with the equilibrium given by
�mU2
2d2�
GðS � S0Þ
dS� Y ln
d0
d� Y ln
S0
S¼ 0. (A.16)
We rewrite this expression as
�mU2
2Yd2þ
GS0YdS
�GYd
¼ lnd0
dþ ln
S0
S(A.17)
and substitute c ¼ d0=d; x ¼ S0=S; to get
K1c2� K2cð1� xÞ ¼ lncþ ln x (A.18)
where K1 ¼ �mU2=2Yd20 and K2 ¼ G=Yd0: While in the direction perpendicularto the membrane surface, the pressures due to the elasticity and surface tension areco-oriented, in the direction parallel to the membrane they oppose each other, soin the equilibrium
GðS � S0Þ
dS� Y ln
d0
d� Y ln
S0
S¼ 0. (A.19)
With the same notation as above, this gives
K2cð1� xÞ ¼ lncþ ln x. (A.20)
Subtracting this equation from the first equilibrium equation, we get
K1c2� 2K2cð1� xÞ ¼ 0 (A.21)
and hence
1� x ¼K1
2K2
c. (A.22)
Inserting this result into the second equilibrium equation, we finally get
K1c2
2¼ lncþ ln 1�
K1
2K2
c� �
. (A.23)
This equation does not have a solution expressible as an elementary function, and todetermine Uc, we insert actual parameter values and calculate c numerically forincreasing values of U, until we reach the point U ¼ U c for which no real solutionsexist.
A.4. The Instability in the Viscohydroelastic Model
In a membrane with permittivity em, surface tension G, elasticity module Y andviscosity m, discontinuities occur after the transmembrane voltage U has beenpresent for the critical duration given by
tc ¼24m
2�mU2k2 � 8Y � Gd30k4
(A.24)

M. Pavlin et al.216
where k is the wave number (the reciprocal of the length of the ripples on themembrane). Note that at low values of U, we would obtain a negative value of tc,which is physically meaningless; this means that the membrane is stable, and thediscontinuities cannot occur at any tc. If the ripples can form freely (i.e. if there areno fixed points on the membrane), for a given U the wave number takes a value atwhich the value of tc is minimal
dtcdk
¼96mð�mU2k� Gd30k
3Þ
ð2�mU2k2 � 8Y � Gd30k4Þ
2. (A.25)
The solution k ¼ 0 is meaningless as it would imply that the ripples are infinitelylarge, so we have
k2 ¼�mU2
Gd30. (A.26)
Inserting this value into the expression for the critical duration, we get
tc ¼24m
�2mU4
Gd30� 8Y
. (A.27)
This expression takes a positive value only at voltages above the critical amplitudegiven by
U c ¼
ffiffiffiffiffiffiffiffiffiffiffiffiffi8GYd30�2m
4
s(A.28)
and the discontinuities occur if a voltage U4Uc lasts longer than the criticalduration at this voltage (see Fig. 14).
A.5. The Energy of a Hydrophilic Pore
At a distance r from the center of a cylindrical pore with a radius r, the strength ofhydrophobic interaction is given by
ZðrÞ ¼ Z0I0ðr=lÞI0ðr=lÞ
(A.29)
where Z0 is the value of Z(r) directly at the surface, l the characteristic length ofhydrophobic interaction and Ik the modified Bessel function of k-th order. Simul-taneously, the total energy of this interaction is described as
W ¼ 2pdZ r
0
Z2ðrÞ þ l2dZðrÞdr
� �2" #
rdr (A.30)

Electroporation of Planar Lipid Bilayers and Membranes 217
where d is the height of the pore (the thickness of the membrane). By joining theseexpressions, we obtain
W ¼ 2pdrlZ20I1ðr=lÞI0ðr=lÞ
. (A.31)
At r l; the ratio of the two Bessel functions approaches 1, and W is proportionalto the pore surface S ¼ 2prd;
W ¼ SlZ20 (A.32)
which shows that lZ20 corresponds to the surface tension Gh at the interface of thehydrophobic surface and water. Since Gh is measurable, it is then sensible to rewritethe energy of the pore as
W ¼ 2pdrGh
I1ðr=lÞI0ðr=lÞ
. (A.33)
Appendix B
B.1. Calculation of the Fraction of Surface Area of Transient Pores
Here, we present the estimation of the fraction of the surface area of pores in thecell membrane from the increased membrane conductivity (similar derivation wasfirst presented by Hibino [84]). We assume that the specific conductance of thepermeabilized area of a cell is approximately the sum of the conductance of Np
pores having radius rp
Gp ¼ Nppr2pspord
¼ Sporspord
(B.1)
where we neglect the very small conductance of nonpermeabilized cell membraneand Spor represents the surface of all conducting pores. On the other hand,this conductance is equal to the average membrane conductance of the perm-eabilized area as obtained from our measurement and from the theoretical modelGp ¼ Gmeas; thus
Sporspord
¼ Scsmd
(B.2)
where Sc represents the total permeabilized surface of one cell (the area exposedto above-threshold transmembrane voltage – Sc ¼ S0 ð1� EcÞ=E
� �and sm the
average membrane conductivity of permeabilized area as defined in the theoreticalmodel. From this it follows that the fraction of pores is
f p ¼Spor
S0¼
ScsmS0spor
�ð1� EcÞ=E� �
smspor
�ð1� EcÞ=E� �
smrs0por
(B.3)

M. Pavlin et al.218
where parameter r takes into account that conductivity inside the pores differs frombulk. Namely, conductance of the pore in an 1:1 electrolyte is given by [46]
Gpor ¼ G0
expðbUmÞ � 1bUm
d
R d
0exp bUm
d�xdþ wðxÞ
� dx
¼ G0r; G0 ¼ Nppr2ps0pord
(B.4)
where b ¼ e=kT and wðxÞ ¼ W ðxÞ=kT where e is the electron charge, Um thetransmembrane voltage and W(x) the energy of an ion inside the pore due to theinteractions of the ion with the pore walls [46,150]. Parameter r is a scaling factor,which reduces the conductivity of the ions inside the pores ðsporÞ; compared to thebulk approximation s0por � ðse þ siÞ=2 in the limit of very large pores wheninteractions are negligible. For a trapezoid shape of w(x) we obtain from equation(B.4) that when the transmembrane voltage is small nbUm � w0:
r ¼ exp �0:43 w0 � nbUmð Þ½ � (B.5)
which is true for physiological conditions where resting transmembrane voltage isbetween 50 and 100mV. When we apply external electric field typical for elect-roporation the transmembrane voltage is large and thus we can use approximationnbUm w0ðUE 25 mVÞ and we obtain
r ¼1
1þ nbUm
w0�nbUm
� �exp w0 � nbUmð Þ �
nbUm
w0�nbUm
(B.6)
where n is the relative size of the entrance region of the pore and was estimated tobe approximately 0.15 [46]. W0 is the energy of an ion inside center of a pore andwas estimated to be few kT [46,151,152].
B.2. Quantification of Ion Diffusion and Long-Lived Pores
Here we analyze theoretically the changes of conductivity on the time scale ofseconds, where diffusion of ions dominates. The transport of ions through themembrane is governed by Nernst–Planck equation:
dneðx; tÞ
dt¼ �DS
dcðx; tÞ
dx�
zF
RTDScðx; tÞ
dCðx; tÞ
dx(B.7)
where ne is the number of moles in the external medium, D the diffusion con-stant ð� 2� 10�5cm2=sÞ; c the molar concentration, S the total transport surfaceS ¼ N cSpor of Nc permeabilized cells andC the electric potential. In general D andS depend on time, pulse duration, electric field strength and number of pulses. Herewe will first analyze the ion efflux after the N pulses so only S will depend on N,and D will be constant. The diffusion of ions is a slow process compared to theduration of the electric pulses thus we can assume that the major contribution toefflux of ions occurs without the presence of the electric field. When there is noexternal electric field present DC is small since only the imbalance of the electriccharges due to concentration gradient contributes. Therefore the second term inequation (B.7) can be neglected. By replacing the concentration gradient withðce � ciÞ=d and by taking into account that the sum of ions inside and outside

Electroporation of Planar Lipid Bilayers and Membranes 219
remains constant, the equation further simplifies:
dceðtÞ
dt¼ �
DSðE;N Þ
dVFð1� FÞceðtÞ � Fc0i� �
(B.8)
where c0i is the initial internal concentration of K+ ions, Ve represent the externalvolume and function SðE;NÞ describes the field dependent surface of pores. If wefurther neglect the volume fraction changes and assume that S is approximatelyconstant, we obtain that the solution of the above equation is an exponentialincrease to maximum cmax
e ¼ Fc0i
ceðtÞ ¼ cmaxe 1� exp �
t
t
� �h i(B.9)
with a time constant t and permeability coefficient k being dependent on thefraction of transport pores f per:
t ¼1
f E
3D
dRFð1� FÞ; k ¼ 1=t. (B.10)
By measuring current and voltage during the train of successive pulses we obtainthe change of the initial level of the conductivity, i.e. conductivity increase due tothe ion efflux. Taking into account that the permeability coefficient depends on thenumber of pulses we can express the measured change of conductivity with [137]:
DsðtÞs0
¼XN
AN 1� exp �kN tð Þ�
. (B.11)
From this it follows that the permeability coefficient after the N-th pulse can bedetermined from the measured conductivity at N-th pulse ðDsN Þ and at N+1-thpulse ðDsNþ1Þ:
kN ¼1
DtNln 1�
DsNDsmax
1�
DsNþ1
Dsmax
�(B.12)
where DtN is the time difference between N-th and N+1-th pulse and Dsmax is themaximum value of the conductivity, i.e. the saturation point when the concen-trations inside and outside the cell are equal. From the permeability coefficient kNthe fraction of ‘‘transport’’ pores can be estimated using equation (B.10):
f NE � kNdRFð1� FÞ
3D0; D0 ¼ D expð�0:43w0Þ (B.13)
where we take into account that the effective diffusion constant D0 of K+ions insidethe pore differs from that in the bulk [46,151,152].
REFERENCES
[1] R.B. Gennis, Biomembranes, Molecular Structure and Function, Springer, New York, 1989.[2] E. Neumann, A. Sowers, C. Jordan, Electroporation and Electrofusion in Cell Biology,
Plenum, New York, 1989.

M. Pavlin et al.220
[3] D.C. Chang, B.M. Chassey, J.A. Saunders, A.E. Sowers, Guide to Electroporation and Elect-rofusion, Academic Press, New York, 1992.
[4] R. Stampfli, Reversible electrical breakdown of the excitable membrane of a Ranvier node,Ann. Acad. Brasil. Ciens. 30 (1958) 57–63.
[5] A.J.H. Sale, A. Hamilton, Effects of high electric fields on microorganisms: I. Killing of bacteriaand yeasts, Biochem. Biophys. Acta 148 (1967) 781–788.
[6] E. Neumann, K. Rosenheck, Permeability changes induced by electric impulses in vesicularmembranes, J. Membr. Biol. 10 (1972) 279–290.
[7] E. Neumann, M.S. Ridder, Y. Wang, P.H. Hofschneider, Gene transfer into mouse lyoma cellsby electroporation in high electric fields 1 (1982) 841–845.
[8] M. Okino, H. Mohri, Effects of high-voltage electrical impulse and an anticancer drug on invivo growing tumors, Jpn. J. Cancer Res. 78 (1987) 1319–1321.
[9] L.M. Mir, H. Banoun, C. Paoletti, Introduction of definite amounts of nonpermeant molecules intoliving cells after electropermeabilization: direct access to the cytosol, Exp. Cell Res. 175 (1988) 15–25.
[10] D. Miklavcic, M. Puc, Electroporation, Wiley Encyclopedia of Biomedical Engineering, Wiley,New York, 2006.
[11] J. Teissie, N. Eynard, M.C. Vernhes, A. Benichou, V. Ganeva, B. Galutzov, P.A. Cabanes,Recent biotechnological developments of electropulsation. A prospective review, Bioelectro-chemistry 55 (2002) 107–112.
[12] C.N. Haas, D.N. Aturaliye, Kinetics of electroporationassisted chlorination of giardia muris,Water Res. 33 (1999) 1761–1766.
[13] N.J. Rowan, S.J. MacGregor, J.G. Anderson, R.A. Fouracre, O. Farish, Pulsed electric fieldinactivation of diarrhoeagenic Bacillus cereus through irreversible electroporation, Lett. Appl.Microbiol. 31 (2000) 110–114.
[14] L.M. Mir, Therapeutic perspectives of in vivo cell electropermeabilization, Bioelectrochemistry53 (2001) 1–10.
[15] J. Gehl, Review: electroporation: theory and methods, perspectives for drug delivery, genetherapy and research, Acta Physiol. Scand. 177 (2003) 437–447.
[16] L.M. Mir, S. Orlowski, J. Belehradek, J. Teissie, M.P. Rols, G. Sersa, D. Miklavcic, R. Gilbert,R. Heller, Biomedical applications of electric pulses with special emphases on antitumorelectrochemotherapy, Bioelectrochem. Bioenerg. 38 (1995) 203–207.
[17] G. Sersa, B. Stabuc, M. Cemazar, B. Jancar, D. Miklavcic, Z. Rudolf, Electrochemotherapywith cisplatin: potentiation of local cisplatin antitumor effectiveness by application of electricpulses in cancer patients, Eur. J. Cancer 34 (1998) 1213–1218.
[18] R. Heller, R. Gilbert, M.J. Jaroszeski, Clinical application of electrochemotherapy, Adv. DrugDeliv. Rev. 35 (1999) 119–129.
[19] Y. Mouneimne, P.F. Tosi, R. Barhoumi, C. Nicolau, Electroinsertion of full length recom-binant CD4 into red blood cell membrane, Biochim. Biophys. Acta 1027 (1990) 53–58.
[20] S. Raffy, J. Teissie, Electroinsertion of glycophorin A in interdigitation-fusion giant unilamellarlipid vesicles, J. Biol. Chem. 272 (1997) 25524–25530.
[21] I.G. Abidor, A.E. Sowers, Kinetics and mechanism of cell membrane electrofusion, Biophys.J. 61 (1992) 1557–1569.
[22] A.E. Sowers, Membrane electrofusion: a paradigm for study of membrane fusion mechanisms,Methods Enzymol. 220 (1993) 196–211.
[23] H. Mekid, L.M. Mir, In vivo cell electrofusion, Biochim. Biophys. Acta 1524 (2000) 118–130.[24] T.H. Scott-Taylor, R. Pettengell, I. Clarke, G. Stuhler, M.C. La Barthe, P. Walden, A.G.
Dalgleish, Human tumour and dendritic cell hybrids generated by electrofusion: potential forcancer vaccines, Biochim. Biophys. Acta 1500 (2000) 265–267.
[25] E. Schmidt, U. Leinfelder, P. Gessner, D. Zillikens, E.B. Brocker, U. Zimmermann, CD19+ Blymphocytes are the major source of human antibody-secreting hybridomas generated byelectrofusion, J. Immunol. Methods 255 (2001) 93–102.
[26] M.R. Prausnitz, V.G. Bose, R. Langer, J.C. Weaver, Electroporation of mammalian skin: amechanism to enhance transdermal drug delivery, Proc. Natl. Acad. Sci. U.S.A. 90 (1993)10504–10508.
Electroporation of Planar Lipid Bilayers and Membranes 221
[27] R. Vanbever, N. Lecouturier, V. Preat, Transdermal delivery of metoprolol by electroporation,Pharmacol. Res. 11 (1994) 1657–1662.
[28] T.E. Zewert, U. Pliquett, R. Langer, J.C. Weaver, Transport of DNA antisense oligonucleotidesacross human skin by electroporation, Biochem. Biophys. Res. Commun. 212 (1995) 286–292.
[29] U. Zimmermann, Electric field-mediated fusion and related electrical phenomena, Biochim.Biophys. Acta 694 (1982) 227–277.
[30] M.P. Rols, J. Teissie, Electropermeabilization of mammalian cells. quantitative analysis of thephenomenon, Biophys. J. 58 (1990) 1089–1098.
[31] T.Y. Tsong, Electroporation of cell membranes, Biophys. J. 60 (1991) 297–306.[32] J.C. Weaver, Y.A. Chizmadzhev, Theory of electroporation: a review, Bioelectrochem. Bioen-
erg. 41 (1996) 135–160.[33] P.J. Canatella, J.F. Karr, J.A. Petros, M.R. Prausnitz., Quantitative study of electroporation-
mediated molecular uptake and cell viability, Biophys. J. 80 (2001) 755–764.[34] A. Macek-Lebar, D. Miklavcic, Cell electropermeabilization to small molecules in vitro: control
by pulse parameters, Radiol. Oncol. 35 (2001) 193–202.[35] D. Miklavcic, T. Kotnik, Electroporation for electrochemotherapy and gene therapy, in:
P.J. Rosch, M.S. Markov (Eds.), Bioelectromagnetic Medicine, Marcel Dekker, New York,2004, pp. 637–656.
[36] M. Smeyers, M. Leonetti, E. Goormaghtigh, F. Homble, Structure and function of plant membraneion channels reconstituted in planar lipid bilayers, in: H.T. Tien, A. Ottova-Leitmannova (Eds.),Planar Lipid Bilayers (BLMs) and Their Applications, Elsevier, New York, 2003, pp. 449–478.
[37] G.C. Troiano, L. Tung, V. Sharma, K.J. Stebe, The reduction in electroporation voltages by theaddition of surfactant to planar lipid bilayer, Biophys. J. 75 (1998) 880–888.
[38] V. Sharma, K. Uma Maheswari, J.C. Murphy, L. Tung, Poloxamer 188 decreases susceptibilityof artificial lipid membranes to electroporation, Biophys. J. 71 (1996) 3229–3241.
[39] W. Meier, A. Graff, A. Diederich, M. Winterhalter, Stabilization of planar lipid membranes: astratified layer approach, Phys. Chem. Chem. Phys. 2 (2000) 4559–4562.
[40] A. Diederich, G. Bahr, M. Winterhalter, Influence of surface charges on the rapture of blacklipid membranes, Phys. Rev., E 58 (1998) 4883–4889.
[41] R. Benz, K. Janko, Voltage-induced capacitance relaxation of lipid bilayer membranes; effectson membrane composition, Biochim. Biophys. Acta 455 (1976) 721–738.
[42] J. Vargas, J.M. Alarcon, E. Rojas, Displacement currents associated with the insertion ofAlzheimer disease amyloid (beta)-peptide into planar bilayer membranes, Biophys. J. 79 (2000)934–944.
[43] C. Wilhelm, M. Winterhalter, U. Zimmermann, R. Benz, Kinetics o pore size during ir-reversible electrical breakdown of lipid bilayer membranes, Biophys. J. 64 (1993) 121–128.
[44] R. Benz, F. Beckers, U. Zimmermann, Reversible electrical breakdown of lipid bilayer mem-branes: a charge-pulse relaxation study, J. Membr. Biol. 48 (1979) 181–204.
[45] K.C. Melikov, V.A. Frolov, A. Shcherbakov, A.V. Samsonov, Y.A. Chizmadzhev,L.V. Chernomordik, Voltage-induced nonconductive pre-pores and metastable single poresin unmodified planar lipid bilayer, Biophys. J. 80 (2001) 1829–1836.
[46] R.W. Glaser, S.L. Leikin, L.V. Chernomordik, V.F. Pastushenko, A.I. Sokirko, Reversibleelectrical breakdown of lipid bilayers: formation and evolution of pores, Biochim. Biophys.Acta 940 (1988) 275–287.
[47] I.G. Abidor, V.B. Arakelyan, L.V. Chernomordik, Y.A. Chizmadzhev, V.F. Pastushenko, M.R.Tarasevich, Electric breakdown of bilayer membranes: I. The main experimental facts and theirqualitative discussion, Bioelectrochem. Bioenerg. 6 (1979) 37–52.
[48] A.N. Chanturiya, Detection of transient capacitance increase associated with channel formationin lipid bilayers, Biochim. Biophys. Acta 1026 (1990) 248–250.
[49] S. Kalinowski, Z. Figaszewski, A new system for bilayer lipid membrane capacitance meas-urements: method apparatus and applications, Biochim. Biophys. Acta 1112 (1992) 57–66.
[50] S. Koronkiewicz, S. Kalinowski, K. Bryl, Programmable chronopotentiometry as a tool for thestudy of electroporation and resealing of pores in bilayer lipid membranes, Biochim. Biophys.Acta 1561 (2002) 222–229.

M. Pavlin et al.222
[51] A. Ridi, E. Scalas, M. Robello, A. Gliozzi, Linear response of a fluctuating lipid bilayer, ThinSolid Films 327–329 (1998) 796–799.
[52] M. Robello, A. Gliozzi, Conductance transition induced by an electric field in lipid bilayers,Biochim. Biophys. Acta 982 (1989) 173–176.
[53] A. Ridi, E. Scalas, A. Gliozzi, Noise measurements in bilayer lipid membranes during elect-roporation, EPJ E 2 (2000) 161–168.
[54] E. Scalas, A. Ridi, M. Robello, A. Gliozzi, Flicker noise in bilayer lipid membranes, Europhys.Lett. 43 (1998) 101–105.
[55] I. Genco, A. Gliozzi, A. Relini, M. Robello, E. Scalas, Electroporation in symmetric andasymmetric membranes, Biochim. Biophys. Acta 1149 (1993) 10–18.
[56] E. Pescio, A. Ridi, A. Gliozzi, A picoampere current generator for membrane electroporation,Rev. Sci. Instrum. 71 (2000) 1740–1744.
[57] M. Robello, M. Fresia, L. Maga, A. Grasso, S. Ciani, Permeation of divalent cations trough(alpha)-latrotoxin channels in lipid bilayers: steady-state current-voltage relationship, J. Membr.Biol. 95 (1987) 55–62.
[58] S. Kalinowski, Z. Figaszewski, A four-electrode potentiostat-galvanostat for studies of bilayerlipid membranes, Meas. Sci. Technol. 6 (1995) 1050–1055.
[59] S. Micelli, E. Gallucci, V. Ricciarelli, Studies of mitochondrial porin incorporation parametersand voltage-gated mechanism with different black lipid membranes, Bioelectrochemistry 52(2000) 63–75.
[60] P. Kramar, D. Miklavcic, A. Macek-Lebar, Determination of the lipid bilayer breakdownvoltage by means of a linear rising signal, Bioelectrochemistry 70 (2007) 23–27.
[61] A. Blume, Lipids, in: D. Waltz, J. Teissie, G. Milazzo (Eds.), Bioelectrochemistry of membranes,Birkhauser, Basel-Boston-Berlin, 2004, pp. 24–61.
[62] Y. Hanyu, T. Yamada, G. Matsumoto, Simultaneous measurement of spectroscopic and phys-iological signals from a planar bilayer system: detecting voltage-dependent movement of amembrane-incorporated peptide, Biochemistry 37 (1998) 15376–15382.
[63] H. Yamaguchi, H. Nakanishi, Characterization of the preparation process and photochemicalcontrol of electrical properties of bilayer lipid membranes containing azobenzene chromoph-ores, Biochim. Biophys. Acta 1148 (1993) 179–184.
[64] T.F. Eibert, M. Alaydrus, F. Wiczewski, V.W. Hansen, Electromagnetic and thermal analysisfor lipid bilayer membranes exposed to RF fields, IEEE Trans. Biomed. Eng. 46 (1999)1013–1021.
[65] N. Montal, P. Mueller, Formation of bimolecular membranes from lipid monolayersand a study of their electrical properties, Proc. Natl. Acad. Sci. U.S.A. 69 (1972) 3561–3566.
[66] A. Macek Lebar, G.C. Troiano, L. Tung, D. Miklavcic, Inter-pulse interval between rectangularvoltage pulses affects electroporation threshold of artificial lipid bilayers, IEEE Trans. Nanobio-science 1 (2002) 116–120.
[67] E. Evans, V. Heinrich, F. Ludwig, W. Rawicz, Dynamic tension spectroscopy and strength ofbiomembranes, Biophys. J. 85 (2003) 2342–2350.
[68] E. Gallucci, S. Micelli, G. Monticelli, Pore formation in lipid bilayer membranes made ofphosphatidylinositol and oxidized cholesterol followed by means of alternating current,Biophys. J. 71 (1996) 824–831.
[69] L.V. Chernomordik, S.I. Sukharev, I.G. Abidor, Yu.A. Chizmadzhev, Breakdown of lipidbilayer membranes in an electric field, Biochim. Biophys. Acta 736 (1983) 203–213.
[70] S. Kalinowski, G. Ibron, K. Bryl, Z. Figaszewski, Chronopotentiometric studies of electrop-oration of bilayer lipid membranes, Biochim. Biophys. Acta 1396 (1998) 204–212.
[71] P.R.C. Gascoyne, R. Pethig, J.P.H. Burt, F.F. Becker, Membrane changes accompanying theinduced differentiation of Friend murine erythroleukemia cells studied by dielectrophoresis,Biochim. Biophys. Acta 1146 (1993) 119–126.
[72] I.P. Sugar, A theory of the electric field-induced phase transition of phospholipid bilayers,Biochim. Biophys. Acta 556 (1979) 72–85.
[73] D.S. Dimitrov, R.K. Jain, Membrane stability, Biochim. Biophys. Acta 779 (1984) 437–468.

Electroporation of Planar Lipid Bilayers and Membranes 223
[74] C.M. Harris, D.B. Kell, The radio-frequency dielectric properties of yeast cells measured with arapid automated, frequency-domain dielectric spectrometer, Bioelectrochem. Bioenerg. 11(1983) 15–28.
[75] R. Hlzel, I. Lamprecht, Dielectric properties of yeast cells as determined by electrorotation,Biochim. Biophys. Acta 1104 (1992) 195–200.
[76] F.W. Sunderman, Measurement of serum total base, Am. J. Clin. Pathol. 15 (1945) 219–222.[77] K. Nrtemann, J. Hilland, U. Kaatze, Dielectric properties of aqueous NaCl solutions at
microwave frequencies, J. Phys. Chem. A 101 (1997) 6864–6869.[78] D.H. Michael, M.E. O’Neill, Electrohydrodynamic instability in plane layers of fluid, J. Fluid
Mech. 41 (1970) 571–580.[79] G.I. Taylor, D.H. Michael, On making holes in a sheet of fluid, J. Fluid Mech. 58 (1973)
625–639.[80] J.M. Crowley, Electrical breakdown of bimolecular lipid membranes as an electro-mechanical
instability, Biophys. J. 13 (1973) 711–724.[81] C. Maldarelli, R.K. Jain, I.B. Ivanov, E. Rckenstein, Stability of symmetric and unsymmetric,
thin liquid films to short and long wavelength perturbations, J. Colloid Interface Sci. 78 (1980)118–143.
[82] A. Steinchen, D. Gallez, A. Sanfeld, A viscoelastic approach to the hydrodynamic stability ofmembranes, J. Colloid Interface Sci. 85 (1982) 5–15.
[83] D.S. Dimitrov, Electric field-induced breakdown of lipid bilayer and cell membranes: a thinviscoelastic film model, J. Membr. Biol. 78 (1984) 53–60.
[84] M. Hibino, M. Shigemori, H. Itoh, K. Nagayama, K. Kinosita, Membrane conductance of anelectroporated cell analyzed by sub-microsecond imaging of transmembrane potential, Biophys.J. 59 (1991) 209–220.
[85] M. Hibino, H. Itoh, K. Kinosita, Time courses of electroporation as revealed by submicro-second imaging of transmembrane potential, Biophys. J. 64 (1993) 1789–1800.
[86] R.E. Jacobs, B.S. Hudson, H.C. Andersen, A theory of the chain melting phase transition ofaqueous phospholipid dispersions, Proc. Natl. Acad. Sci. U.S.A. 72 (1975) 3993–3997.
[87] R.E. Jacobs, B.S. Hudson, H.C. Andersen, A theory of phase transitions and phase diagrams forone- and two-component phospholipid bilayers, Biochemistry 16 (1977) 4349–4359.
[88] L. Cruzeiro-Hansson, O.G. Mouritsen, Passive ion permeability of lipid membranes modelledvia lipid-domain interfacial area, Biochim. Biophys. Acta 944 (1988) 63–72.
[89] L. Cruzeiro-Hansson, J.H. Ipsen, O.G. Mouritsen, Intrinsic molecules in lipid membraneschange the lipid-domain interfacial area: cholesterol at domain interfaces, Biochim. Biophys.Acta 979 (1989) 166–176.
[90] J.D. Litster, Stability of lipid bilayers and red blood cell membranes, Phys. Lett. 53A (1975)193–194.
[91] C. Taupin, M. Dvolaitzky, C. Sauterey, Osmotic pressure induced pores in phospholipidvesicles, Biochemistry 14 (1975) 4771–4775.
[92] J.C. Weaver, R.A. Mintzer, Decreased bilayer stability due to transmembrane potentials, Phys.Lett. 86A (1981) 57–59.
[93] J.N. Israelachvili, R.M. Pashley, Measurement of the hydrophobic interaction between twohydrophobic surfaces in aqueous electrolyte solutions, J. Colloid Interface Sci. 98 (1984)500–514.
[94] A. Barnett, J.C. Weaver, Electroporation: a unified quantitative theory of reversible electricalbreakdown and rupture, Bioelectrochem. Bioenerg. 25 (1991) 163–182.
[95] S.A. Freeman, M.A. Wang, J.C. Weaver, Theory of electroporation for a planar bilayer mem-brane: predictions of the fractional aqueous area, change in capacitance and pore-poreseparation, Biophys. J. 67 (1994) 42–56.
[96] M.P. Rols, J. Teissie, Modulation of electrically induced permeabilizaiton and fusion of Chinesehamster ovary cells by osmotic pressure, Biochemistry 29 (1990) 4561–4567.
[97] M. Golzio, M.P. Mora, C. Raynaud, C. Delteil, J. Teissie, M.P. Rols, Control by osmotic pres-sure of voltage-induced permeabilization and gene transfer in mammalian cells, Biophys. J. 74(1998) 3015–3022.

M. Pavlin et al.224
[98] E. Neumann, S. Kakorin, K. Tonsing, Fundamentals of electroporative delivery of drugs andgenes, Bioelectrochem. Bioenerg. 48 (1999) 3–16.
[99] J. Teissie, M. Golzio, M.P. Rols, Mechanisms of cell membrane electropermeabilization: aminireview of our present (lack of c) knowledge, Biochim. Biophys. Acta 1724 (2005) 270–280.
[100] S. Orlowski, L.M. Mir, Cell electroporation: a new tool for biochemical and pharmacologicalstudies, Biochim. Biophys. Acta 1154 (1993) 51–62.
[101] M.J. Jaroszeski, R. Heller, R. Gilbert, Electrochemotherapy, Electrogenetherapy and Trans-dermal Drug Delivery: Electrically Mediated Delivery of Molecules to Cells, Humana Press,Totowa, NJ, 1999.
[102] J.C. Maxwell, Treatise on Electricity and Magnetism, Oxford University Press, London, 1873.[103] K.S. Cole, Membrane, Ions and Impulses, University of California Press, Los Angeles, 1968.[104] K.R. Foster, H.P. Schwan, Dielectric properties of tissues, in: C. Polk, E. Postow (Eds.),
Handbook of Biological Effects of Electromagnetic Fields, CRC Press, Florida, 1986, pp. 28–96.[105] J.D. Jackson, Classical Electrodynamics, Wiley, New York, 1999.[106] U. Zimmermann, The effect of high-intensity electric pulses on eukaryotic cell membranes, in:
U. Zimmermann, G.A. Neil (Eds.), Electromanipulation of Cells, CRC press, London, 1996,pp. 1–105.
[107] E. Tekle, R.D. Astumian, P.B. Chock, Electro-permeabilization of cell membranes: effect of theresting membrane potential, Biochem. Biophys. Res. Commun. 172 (1990) 282–287.
[108] J. Teissie, M.P. Rols, An experimental evaluation of the critical potential difference inducingcell membrane electropermeabilization, Biophys. J. 65 (1993) 409–413.
[109] V.H. Pauly, H.P. Schwan, ber die Impendanz einer Suspension von kugelfrmigen Teilchen miteiner Schale, Z. Naturforsch. 14b (1959) 125–131.
[110] T. Kotnik, F. Bobanovic, D. Miklavcic, Sensitivity of transmembrane voltage induced by appliedelectric fields: a theoretical analysis, Bioelectrochem. Bioenerg. 43 (1997) 285–291.
[111] S. Takashima, Electrical Properties of Biopolimers and Membranes, Adam Hilger, Bristol,1989.
[112] K.H. Schoenbach, S.J. Beebe, E.S. Buescher, Intracellular effect of ultrashort electrical pulses,Bioelectromagnetics 22 (2001) 440–448.
[113] T. Kotnik, D. Miklavcic, T. Slivnik, Time course of transmembrane voltage induced by time-varying electric fields-a method for theoretical analysis and its application, Bioelectrochem.Bioenerg. 45 (1998) 3–16.
[114] R. Susil, D. Semrov, D. Miklavcic, Electric field-induced transmembrane potential depends oncell density and organization, Electro Magnetobiol. 17 (1998) 391–399.
[115] M. Pavlin, N. Pavselj, D. Miklavcic, Dependence of induced transmembrane potential on celldensity arrangement and cell position inside a cell system, IEEE Trans. Biomed. Eng. 49 (2002)605–612.
[116] M. Kummrow, W. Helfrich, Deformation of giant lipid vesicles by electric fields, Phys. Rew. A44 (1991) 8356–8360.
[117] K.J. Muller, V.L. Sukhorukov, U. Zimmermann, Reversible electropermeabilization of mam-malian cells by high-intensity, ultra-short pulses of submicrosecond duration, J. Membr. Biol.184 (2001) 161–170.
[118] R.P. Joshi, Q. Hu, K.H. Schoenbach, H. P. Hjalmarson, Theoretical predictions of electro-mechanical deformation of cells subjected to high voltages for membrane electroporation, Phys.Rev. E, 65 (2002) 021913.
[119] S.I. Sukharev, V.A. Klenchin, S.M. Serov, L.V. Chernomordik, Y.A. Chizmadzhev, Electrop-oration and electrophoretic DNA transfer into cells. The effect of DNA interaction withelectropores, Biophys. J. 63 (1992) 1320–1327.
[120] M.P. Rols, C. Delteil, M. Golzio, P. Dumond, S. Cros, J. Teissie, In vivo electrically mediatedprotein and gene transfer in murine melanoma, Nat. Biotechnol. 16 (1998) 168–171.
[121] S. Satkauskas, M.F. Bureau, M. Puc, A. Mahfoudi, D. Scherman, D. Miklavcic D, L.M. Mir,Mechanisms of in vivo DNA electrotransfer: respective contributions of cell elect-ropermeabilization and DNA electrophoresis, Mol. Ther. 5 (2002) 133–140.

Electroporation of Planar Lipid Bilayers and Membranes 225
[122] K. Kinosita, T.Y. Tsong, Voltage-induced conductance in human erythrocyte, Biochim.Biophys. Acta 554 (1979) 479–497.
[123] I.G. Abidor, A.I. Barbul, D.V. Zhelev, P. Doinov, I.N. Bandarina, E.M. Osipova, S.I. Sukharev,Electrical properties of cell pellet and cell fusion in a centrifuge, Biochim. Biophys. Acta. 115(1993) 207–218.
[124] I.G. Abidor, L.-H. Li, S.W. Hui, Studies of cell pellets: II. Osmotic properties, electroporation,and related phenomena: membrane interactions, Biophys. J. 67 (1994) 427–435.
[125] M. Pavlin, M. Kanduser, M. Rebersek, G. Pucihar, F.X. Hart, R. Magjarevic, D. Miklavcic,Effect of cell electroporation on the conductivity of a cell suspension, Biophys. J. 88 (2005)4378–4390.
[126] K. Schwister, B. Deuticke, Formation and properties of aqueous leaks induced in humanerythrocytes by electrical breakdown 816 (1985) 332–348.
[127] B. Gabriel, J. Teissie, Fluorescence imaging in the millisecond time range of membrane elect-ropermeabilization of single cells using a rapid ultra-low-light intensifying detection system,Eur. Biophys. J. 27 (1998) 291–298.
[128] B. Gabriel, J. Teissie, Time courses of mammalian cell electropermeabilization observed bymillisecond imaging of membrane property changes during the pulse, Biophys. J. 76 (1999)2158–2165.
[129] D. Miklavcic, D. Semrov, H. Mekid, L.M. Mir, A validated model of in vivo electric fielddistribution in tissues for electrochemotherpy and for DNA electrotransfer for gene therapy,Biochim. Biophys. Acta 1519 (2000) 73–83.
[130] M. Pavlin, D. Miklavcic, Effective conductivity of a suspension of permeabilized cells: a the-oretical analysis, Biophys. J. 85 (2003) 719–729.
[131] K. Kinosita, T.Y. Tsong, Voltage-induced pore formation and hemolysis of human erytrocytes,Biochim. Biophys. Acta 471 (1977) 227–242.
[132] K. Kinosita, T.Y. Tsong, Formation and resealing of pores of controlled sizes in human eryth-rocyte membrane, Nature 268 (1977) 438–441.
[133] A.L. Garner, N.Y. Chen, J. Yang, J. Kolb, R.J. Swanson, K.C. Loftin, S.J. Beebe, R.P. Joshi,K.H. Schoenbach, Time domain dielectric spectroscopy measurements of HL-60 cell suspen-sions after microsecond and nanosecond electrical pulses, IEEE Trans. Plasma Sci. 32 (2004)2073–2084.
[134] M. Schmeer, T. Seipp, U. Pliquett, S. Kakorin, E. Neumann, Mechanism for the conductivitychanges caused by membrane electroporation of CHO cell-pellets, Phys. Chem. Chem. Phys. 6(2004) 5564–5574.
[135] R.V. Davalos, B. Rubinsky, D.M. Otten, A feasibility study for electrical impedance tomo-graphy as a means to monitor tissue electroporation for molecular medicine, IEEE Trans.Biomed. Eng. 49 (2002) 400–403.
[136] U. Pliquett, R. Elez, A. Piiper, E. Neumann, Electroporation of subcutaneous mousetumors by rectangular and trapezium high voltage pulses, Bioelectrochemistry 62 (2004)83–93.
[137] M. Pavlin, V. Leben, D. Miklavcic, Electroporation in dense cell suspension-Theoretical andexperimental analysis of ion diffusion and cell permeabilization, Biochim. Biophys. Acta 1770(2007) 12–23.
[138] M.P. Rols, J. Teissie, Ionic-strength modulation of electrically induced permeabilization andassociates fusion of mammalian cells, Eur. J. Biochem. 179 (1989) 109–115.
[139] M.P. Rols, J. Teissie, Experimental evidence for involvement of the cytoskeleton in mammaliancell electropermeabilization, Biochim. Biophys. Acta 1111 (1992) 45–50.
[140] M.P. Rols, J. Teissie, The time course of electropermeabilization, in: M. Blank, (Ed.),Electricity and Magnetism in Biology and Medicine, San Francisco Press, San Francisco, 1993,pp. 151–154.
[141] M.P. Rols, J. Teissie, Electropermeabilization of mammalian cells to macromolecules: controlby pulse duration, Biophys. J. 75 (1998) 1415–1423.
[142] T. Kotnik, G. Pucihar, M. Rebersek, L.M. Mir, D. Miklavcic, Role of pulse shape in cellmembrane electropermeabilization, Biochim. Biophys. Acta 1614 (2003) 193–200.
M. Pavlin et al.226
[143] J. Teissie, C. Ramos, Correlation between electric field pulse induced long-lived perm-eabilization and fusogenicity in cell membranes, Biophys. J. 74 (1998) 1889–1898.
[144] I.P. Sugar, E. Neumann, Stochastic model for electric field-induced membrane pores elect-roporation, Biophys. Chem. 19 (1984) 211–225.
[145] D.C. Chang, T.S. Reese, Changes in membrane structure induced by electroporation asrevealed by rapid freezing electron microscopy, Biophys. J. 58 (1990) 1–12.
[146] M. Fosnaric, V. Kralj-Iglic, K. Bohinc, A. Iglic, S. May, Stabilization of pores in lipid bilayers byanisotropic inclusions, J. Phys. Chem. B 107 (2003) 12519–12526.
[147] L.V. Chernomordik, S.I. Sukarev, S.V. Popov, V.F. Pastushenko, A.V. Sokirko, I.G. Abidor, Y.A.Chizmadzev, The electrical breakdown of cell and lipid membranes: the similarity ofphenomenologies, Biochim. Biophys. Acta 902 (1987) 360–373.
[148] S.J. Marrink, E. Lindahl, O. Edholm, A.E. Mark, Simulation of the spontaneous aggregation ofphospholipids into bilayers 123 (2001) 8638–8639.
[149] D.P. Tieleman, H. Leontiadou, A.E. Mark, S.J. Marrink, Simulation of pore formation in lipidbilayers by mechanical stress and electric fsields, J. Am. Chem. Soc. 125 (2003) 6282–6383.
[150] A. Parsegian, Energy of an ion crossing a low dielectric membrane: Solutions to four relevantelectrostatic problems 221 (1969) 844–846.
[151] K.A. DeBruin, W. Krassowska, Modeling electroporation in a single cell. I. Effects of fieldstrength and rest potential, Biophys. J. 77 (1999) 1213–1223.
[152] K.A. DeBruin, W. Krassowska, Modeling electroporation in a single cell. II. Effects of ionicconcentrations, Biophys. J. 77 (1999) 1225–1233.