Wrinkling and electroporation of giant vesicles in the gel phase

ARTICLE
Masa Kanduser Æ Marjeta Sentjurc Æ Damijan Miklavcic
Cell membrane fluidity related to electroporation and resealing
Received: 20 April 2005 / Revised: 7 July 2005 / Accepted: 10 September 2005 / Published online: 8 October 2005� EBSA 2005
Abstract In this paper, we report the results of a sys-tematic attempt to relate the intrinsic plasma membranefluidity of three different cell lines to their electropora-tion behaviour, which consists of reversible and irre-versible electroporation. Apart from electroporationbehaviour of given cell lines the time course required formembrane resealing was determined in order to distin-guish the effect of resealing time from the cell’s ability tosurvive given electric pulse parameters. Reversible,irreversible electroporation and membrane resealingwere then related to cell membrane fluidity as deter-mined by electron paramagnetic resonance spectroscopyand computer characterization of membrane domains.We found that cell membrane fluidity does not havesignificant effect on reversible electroporation althoughthere is a tendency for the voltage required for reversibleelectroporation to increase with increased membranefluidity. Cell membrane fluidity, however, may affectirreversible electroporation. Nevertheless, this effect, ifpresent, is masked with different time courses of mem-brane resealing found for the different cell lines studied.The time course of cell membrane resealing itself couldbe related to the cell’s ability to survive.
Keywords Electroporation Æ Fluidity ÆOrder parameter Æ Membrane domain Æ In vitro ÆV-79 Æ DC-3F Æ B16-F1
Introduction
Electroporation is a technique widely used in biotech-nology and medicine for the delivery of drugs and genesinto living cells (Neumann et al. 1982; Fromm et al.1986; Mir 2000; Ferber 2001; Gehl 2003; Sersa et al.2003). The reversibility of the process was reported as animportant characteristic essential especially in genedelivery. For successful electroporation, the externalelectric field should induce the electric potential differ-ence across the cell membrane, to reach the critical valuein order to permeabilise the membrane. At the sametime, electric potential on the membrane should notexceed the value at which membrane rupture takes placewhich results in cell death (Neumann 1989). Althoughthe exact molecular mechanisms are not clearly eluci-dated, it is widely accepted that electroporation takesplace in the lipid bilayer of the plasma membrane(Chernomordik et al. 1987). The process of electropo-ration consists of different phases: pore formation as aresponse to induced super threshold membrane voltagelasting a few microseconds, followed by time dependentexpansion of the pore size in time range of 100 ls, andpore resealing in the minute range (Kinoshita and Tsong1979; Neumann et al. 1999, Leontiadou et al. 2004).Molecular transport takes place in the period after pulseapplication until the resealing of the cell membrane thatis in the millisecond to minute range (Gabriel and Teissie1997, 1999; Puc et al. 2003).
Reversibility of electroporation is governed byparameters of external electric field magnitude, dura-tion, characteristics of the electroporation medium, andof the cell that is exposed to the electric field. In case ofthe external electric field it was shown that pulseduration, number, amplitude and repetition frequencyshould be chosen properly for the reversibility of theprocess (Rols and Teissie 1990a; Vernhes et al. 1999;Canatella et al. 2001). If those parameters exceed theiroptimal values, irreversible electroporation takes place.Cell death is caused by severe damage of the DNA
M. Kanduser Æ D. Miklavcic (&)Faculty of Electrical Engineering, University of Ljubljana,Trzaska 25, Ljubljana, SloveniaE-mail: [email protected].: +386-1-4768456Fax: +386-1-4264658
M. SentjurcJozef Stefan Institute, Jamova 39, Ljubljana, Slovenia
Eur Biophys J (2006) 35: 196–204DOI 10.1007/s00249-005-0021-y

(Meaking et al. 1995) and irreversible loss of membranefunction as a semi permeable barrier, that causes celllyses (Hamilton and Sale 1967; Danfelter et al. 1998).
Concerning the characteristics of the electroporationmedium, it was also shown that electroporation dependson the composition of themedium (Rols and Teissie 1989;Djuzenova et al. 1996; Pucihar et al. 2001) and its osmo-larity (Rols and Teissie 1990b; Golzio et al. 1998). Con-ductivity of the electroporationmedium, and the electricaland geometrical properties of the cell affect inducedelectric potential on the cell membrane and thereforeelectroporation (Kotnik et al. 1997; Valic et al. 2003).
With respect to the biological characteristics of thecell, it was shown that different cell lines differ in theirresponse to the same parameters of the external electricfield (O’Hare et al. 1989; Neumann 1992; Cemazar et al.1998). Part of those differences is due to the cell size andshape and the geometrical properties of the cell, asmentioned before. In a given cell population large cellsare more sensitive to given electric field strengths thansmall ones (Sale and Hamilton 1967; Zimmermann 1982;Gaskova et al. 1996; Teissie et al. 1999). Nevertheless,cell size is not the only characteristic of the cell thatdetermines different response to given parameters of theelectric field (O’Hare et al. 1989; Cemazar et al. 1998).
Little is known, however, about the effect of cellmembrane properties on electroporation. In the study ofRols et al. it was shown that substances like ethanol andlysolecitin when incorporated into the cell membrane,change its fluidity and affect cell electroporationbehaviour (Rols et al. 1990).
As the addition of chemical compounds that incor-porate into the membrane could change its characteris-tics and electroporation behaviour (Kanduser et al.2003), we decided to use a different approach whichavoids addition of chemical compounds. The aim of ourstudy was to investigate the effect of intrinsic cellmembrane fluidity of three different cell lines on elec-troporation behaviour. Electroporation behaviour wasdefined as the reversible and irreversible electroporationof a given cell line and its cell membrane resealing afterthe application of the electric pulses.
Materials and methods
Cell culture
Three cell lines, V-79 Chinese hamster lung fibroblasts,DC-3F transformed Chinese hamster lung fibroblastsand B16-F1 murine melanoma, were used in theexperiments. All cell lines were grown in an Eagle’sminimum essential medium supplemented with 10%foetal bovine serum (Sigma–Aldrich Chemie GmbH,Deisenhofen, Germany) at 37�C in a humidified 5%CO2 atmosphere in an incubator (WTB Binder, La-bortechnik GmbH, Germany). For all experiments cellsuspension was prepared from confluent cultures by0.25% trypsin/EDTA solution (Sigma–Aldrich Chemie
GmbH). From the obtained cell suspension, trypsinand growth medium were removed by centrifugation at1000 g (180 g) at 4�C for 5 min (Sigma, Germany) andthe cell pellet was resuspended in the electroporationmedium. As an electroporation medium, Spinner’smodification of Eagle’s minimum essential mediumwithout calcium was used with pH 7.4, osmolarity300 mosm/kg and conductivity 1.6 S/m (Life Technol-ogies Ltd., Paisley, UK).
Electroporation
Cell suspension was kept on ice for approximately 5–10 min before the application of electric pulses. A 50- lldrop that contained 106 cells and 50 nM bleomycin wasplaced between two parallel plate stainless steel elec-trodes spaced 2 mm apart. The amplitude of the appliedpulses was from 80 to 400 V in increments of 40 V. Foreach of the pulse amplitudes, a train of eight rectangularpulses with duration of 100 ls and repetition frequency1 Hz was applied, and a control consisting of cells thatwere not exposed to the electric field was prepared. Forpulse application, a prototype electric pulse generatordescribed in detail in Puc et al. (2001), developed at theUniversity of Ljubljana, the Faculty of Electrical Engi-neering, Slovenia were used. After the pulse applicationall cells were incubated at room temperature (20–25�C)for 30 min to allow for membrane resealing. Eagle’sminimum essential medium supplemented with 10%foetal bovine serum was added when the cell membranewas resealed and cells were plated in a concentration of200 cells per Petri dish for clonogenic assay. Colonieswere grown for 5 days in the same conditions describedpreviously for cell cultures. After 5 days, colonies werefixed with methanol (Merck KGaA, Darmstadt, Ger-many) and stained with crystal violet (Sigma–AldrichChemie GmbH). Visible colonies were counted and re-sults normalised to control. The percentage of coloniesthat survived was subtracted from 100% to obtain thepercentage of bleomycin uptake. At least three experi-ments were pooled together for each data point pre-sented in the Results section.
Reversible electroporation was determined by uptakeof a cytostatic drug, bleomycin. When electroporationtakes place, bleomycin penetrates into the cell and in-duces cell death. The method was described in detail byKotnik et al. (2000), Mir et al. (1996) and Tounekti et al.(2001).
Irreversible electroporation was determined as de-scribed above for reversible electroporation. Cells insuspension were exposed to applied electric pulses in themedium without the addition of bleomycin. Results wereexpressed as a percentage of cell survival.
Differences in electroporation behaviour of threedifferent cell lines were tested by ANOVA test and thedifferences of the mean values among cell lines werecompared with all pair wise multiple comparison pro-cedures (Tukey test).
197

Membrane resealing was determined for cell lines V-79 and B16-F1 that differed the most in their electro-poration behaviour and membrane fluidity by the up-take of a cytostatic drug, bleomycin. In the controltreatment bleomycin was added before the pulse appli-cation while in the resealing treatments it was added atdifferent time intervals after pulse application. The timeintervals after pulse application were as follows: 1–5, 10,15, 20, 25 and 30 min. The voltage applied was selectedfor each cell line according to the voltages where weobtained 50% of membranes being permeabilised. Thiswas 147 V for cell line V-79 and 107 V for cell line B16-F1 for the 2 mm distance between the electrodes. Thetrain of eight rectangular pulses with a pulse duration of100 ls and a frequency of 1 Hz was applied. Cells wereincubated for 30 min at room temperature and platedfor clonogenic assay. Five independent experiments wereperformed for each cell line. Data are presented as per-centage of cells with the resealed membrane after thepulse application.
The average cell size (cell diameter) of non-electro-porated cells in the suspension was determined for eachcell line. In three independent experiments 90–130 cellswere measured for each experiment and cell line giving atotal of 270–390 cells measured per each cell line.Measurements of cell size were performed on living cellsin suspension under an inverted microscope (OlympusCK40, Germany), with the objective magnification of 40times. Images were acquired by digital camera andprocessed with Olympus DP software. For each cell line,data from three experiments were pooled together andthe differences in the mean values among cell lines werecompared with all pair wise multiple comparison pro-cedures (Tukey test), as samples followed normal dis-tribution.
Maximal induced transmembrane voltage was calcu-lated for all cell lines based on the equation:
UTI ¼ �1:5rE cosu ð1Þ
(Cole 1972; Marszalek et al. 1990; Kotnik et al. 1997),where UTI is the maximal induced transmembranevoltage, r is the radius of the cell, E is the strength of theapplied electric field estimated as voltage to distanceratio (U/d) and / is the angle between the direction ofthe electric field and the selected point on the cellsurface.
Cell membrane fluidity
Cell membrane fluidity was measured by an electronparamagnetic resonance (EPR) method, with X-bandEPR spectrometer (Bruker ESP 300), using the spinprobe methyl ester of 5-doxylpalmitate [MeFASL(10.3)],which is lipophilic and therefore dissolves in the mem-brane phospholipid bilayer. Since the nitroxide groupsof the spin probes inside the cell are reduced by the oxy–redoxy systems to the EPR invisible hydroxyl amines(Chen and Morse 1988), it is believed that the main
contribution to the EPR spectrum is from the spinprobes in the plasma membrane. Other evidence con-firming the proposed location of the spin probes aregiven in Curtain and Gordon (1984).
Cell suspension (1 ml) in electroporation medium(the same as used and described for electroporationexperiments) that contained 20·106 cells was incubatedfor 15 min at room temperature with constant shakingof the spin probe that was prepared as a thin film on thewall of a glass tube (from 60 ll of 0.1 mM ethanolsolution). Cell pellets obtained by centrifugation at1000 g at room temperature was put in glass capillaryand was measured with EPR spectrometer at 25�C. Eachmeasurement of the cell pellet was repeated three timesand three independent experiments were performed.
From the line shape of the EPR spectra informationon the ordering and dynamics of the spin probe, whichreflect the motional characteristics of its surroundings,were derived.
As a rough estimation of membrane fluidity we cal-culated overall empirical correlation time (semp) thatreflects the average dynamics of motion of the spinprobe in the lipid bilayer, using the equation:
temp ¼ KDH0 h0=h�1ð Þ1=2 � 1h i
; ð2Þ
where h�1 and h0 are high and middle field amplitudes ofthe EPR spectra, DH0 is the line width of the middle fieldline (Fig. 1) and K is a constant typical for the spinprobe used (Marsh 1981). This expression is valid onlyfor fast isotropic motion in solution and can be used inthe membrane only to compare relative differences in thespin probe dynamics between different cell lines anddifferent treatments (Marsh 1981). The empirical corre-lation time (semp) is inversely proportional to membranefluidity.
Average membrane fluidity is described with mo-tional characteristics of the membrane phospholipid al-kyl chains and is inversely proportional to averagemembrane viscosity (Sentjurc et al. 2002). However,since the membrane is heterogeneous, composed ofthe regions with different motional characteristics, the
Fig. 1 Typical EPR spectra of MeFASL(10.3) in the membrane ofcells at 25�C from which h0, DH0, and h�1 were calculated
198

fluidity in different regions is different. The regions thathave one or more measurable properties that distinguishit from neighbouring regions of the membrane are de-fined as domains (Bloom and Thewalt 1995).
For a more precise description of complex membranecharacteristics, including its lateral heterogeneity, acomputer simulation of the EPR spectra line-shape wasperformed. The model used (Strancar et al. 2000) takesinto account the fact that that the membrane is hetero-geneous and composed of domains with different fluiditycharacteristics. The experimental EPR spectrum is asuperposition of spectral components that correspond tothe spin probes in the membrane domain types withdifferent fluidity characteristics. Distinct domain typesare characterized with sets of spectral parameters, whichdescribe different modes of spin probe motion. Theparameters, which describe fluidity characteristics ofmembrane domains are the order parameter (S) androtational correlation time (sc). The order parameterdescribes the ordering of lipid hydrocarbon chains, canvary from 1 to 0, and is inversely proportional to thefluidity of certain membrane domain types, while therotational correlation time describes the dynamics of thespin probe motion in the domain and is proportional tothe fluidity. Further, the relative proportion of eachspectral component (d) is determined. It describes therelative amount of the spin probe with particular mo-tional characteristics and depends on the distribution ofthe spin probe between the domain types and on thedistribution and position of the spin probe within thedomain. It should be stressed that the lateral motion ofthe spin probe is slow on the time scale of EPR spectra.Therefore, an EPR spectrum describes only the prop-erties of a spin probe’s nearest surrounding (i.e. of therange of some nm). The tuning of EPR spectralparameters to obtain the best fit of the calculated spec-trum to the experimental spectrum was performed by theprogram EPRsim 2.6 (Filipic and Strancar 2001), and isimplemented in the software package EPRsim (http://www.ijs.si/ijs/dept/epr/).
From the best fit of the calculated to the experimentalspectrum we derived the order parameter, rotationalcorrelation time and the relative proportion of the spinprobes in the coexisting domain types. A good fit of thecalculated and experimental spectrum was obtained onlyif three domains were used.
Results
Cell electroporation behaviour
In the present work, we use the term reversible electro-poration to refer to the phenomenon where transient cellmembrane permeabilization for exogenous molecules isobserved. Reversible electroporation with respect to theapplied voltage of the electric pulses is presented inFig. 2a. The dependence of membrane permeabilizationon voltages of the applied electric pulses of cell lines
DC-3F and V-79 is very similar, while B16-F1 is perme-abilised at lower voltage (P<0.05).
The term irreversible electroporation is used for thephenomenon where cell death due to irreversible cell
Fig. 2 Reversible electroporation measured by bleomycin uptake(a) irreversible electroporation (b) and maximal induced trans-membrane voltage (c) of cell lines V-79, DC-3F and B16-F1. Thetrain of eight pulses, 100 ls and repetition frequency 1 Hz wasapplied. The voltage applied to 2 mm electrodes increasedgradually from 0 to 400 V. Values are means of three independentexperiments ± standard error. Two parameters sigmoid curve wasfitted to experimental data. Open symbols permeabilization, closedsymbols survival.(filled circle, open circle)V-79, (filled square, opensquare)DC-3F, (filled triangle, open triangle)B16-F1
199

membrane permeabilization is observed. Irreversibleelectroporation dependence on the applied voltage ofelectric pulses is presented in Fig. 2b. The course of cellsurvival shows that B16-F1 is able to sustain highervalues of the applied external electric field than DC-3Fand V-79 (P<0.01).
There was no significant difference in cell diameterbetween V-79 16.5±0.2 lm and DC-3F 16.2±0.2 lm,but both are smaller than B16-F1 18.5±0.16 (P<0.001).Even though the difference in the cell size is only 2 lm itrepresents a 110–140 mV difference in induced trans-membrane voltage. When we calculate the maximal in-duced transmembrane voltage for our cell lines (Eq. 1),the differences in reversible electroporation among themdiminish (Fig. 2c). For irreversible electroporation thecalculated maximal induced transmembrane voltage issignificantly higher (P<0.001) for the largest cell line(B16-F1) than for the two smaller ones (V-79 and DC-3F) (Fig. 2c).
Membrane resealing was determined for cell lines V-79 and B16-F1 that differed the most in their electro-poration behaviour and membrane fluidity by uptake ofa cytostatic drug, bleomycin. Cell membrane resealing ofcell lines V-79 and B16-F1 is presented in Fig. 3. Cellswere permeabilised at voltages where we observe 50% ofpermeabilization in order to avoid severe membranedamage. Cell line B16-F1 was permeabilised at 107 V,while cell line V-79 was permeabilised at 147 V. In thefirst 4 min after electric pulse application there is nosignificant differences in membrane resealing betweenthe two cell lines, nevertheless, the differences appearlater on. Membrane resealing in cell line B16-F1 iscompleted in 50% of the cells in a population 5 minafter pulse application, while in cell line V-79 it takesmore than 20 min to reach the same value. Even thoughall the cells in the population reseal within 30 min inboth cell lines, the differences between the resealing ofthe two cell lines are more than 15 min, which can havean important effect on cell survival (Fig. 2b).
Cell membrane fluidity
The empirical rotational correlation time (semp) at 25�C,which is related to the overall cell membrane fluidity,was 2.5±0.4 ns for V-79, 2.8±0.2 ns for DC-3F and3.0±0.4 ns for B16-F1 (Table 1). The differences show atendency towards decreased membrane fluidity from thecell line V-79 to the cell line B16-F1.
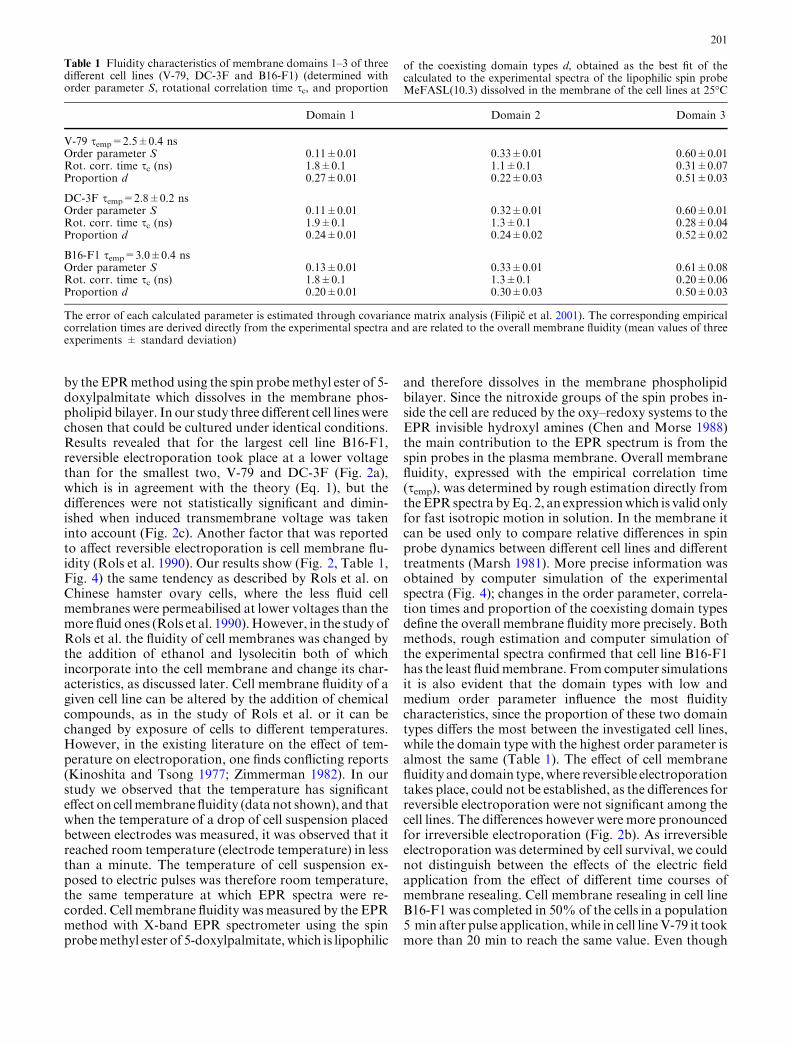
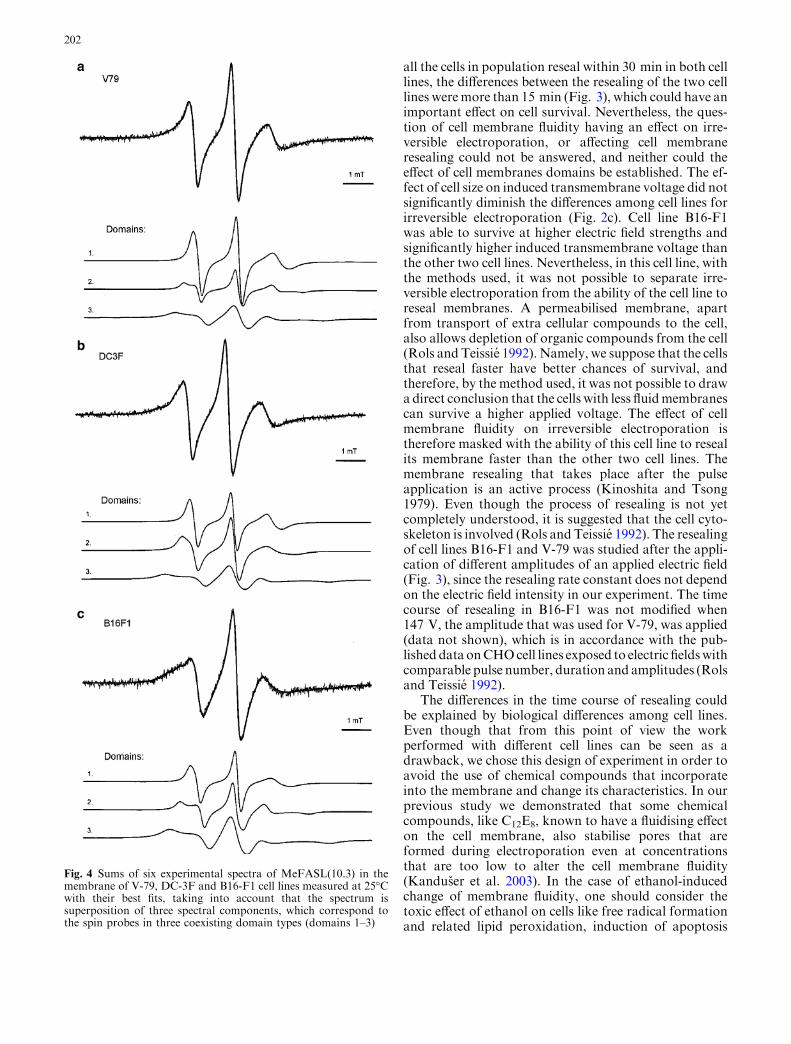
More detailed information about the cell membranecharacteristics in different cell lines was obtained bycomputer simulation of the experimental EPR spectra.Good agreement between the calculated and experi-mental spectrum was obtained only if we took intoaccount the fact that the spectrum is composed of threespectral components with different modes of spin probemotion (Fig. 4). Each spectral component correspondsto the spin probes in the domains, which exhibit equalfluidity characteristics, defined with order parameter andcorrelation time. According to our results the cellmembrane is composed of at least three different types ofdomains with different fluidity characteristics (Table 1).For the cell lines V-79 and DC-3F no significant differ-ences are observed between the order parameters andcorrelation times; only the portion of the less ordereddomain (domain 1) is slightly larger for V-79 cell lines. Alarger proportion of less ordered domains (i.e. the mostfluid domains) is reflected also in larger average mem-brane fluidity, which is expressed with slightly largerempirical correlation time (semp) for V-79 cell lines incomparison to the other two cell lines. The differencesare more pronounced with respect to the cell line B16-F1. Significant difference is observed in the proportionof domain 2, which is 0.24 for DC-3F cells and 0.3 forB16-F1 cells, while the proportion of the less ordereddomain (domain 1) is lower (Table 1). At the same time,the order parameter of the less ordered domain isslightly higher. As the less ordered domains correspondto the most fluid regions in the membrane, the lowestportion as well as the highest order parameter of thisdomain in the B16-F1 cell line means that the overallfluidity of B16-F1 membrane is larger as compared tothe membranes of V-79 or DC-3F cell lines. This is asexpressed also in the largest semp for this cell line.
Discussion
The aim of our study was to investigate the effect ofintrinsic cell membrane fluidity of three different celllines on electroporation behaviour. Electroporationbehaviour was defined as the reversible and irreversibleelectroporation of a given cell line and its cell membraneresealing after the application of electric pulses.
To establish the relation of intrinsic cell membranefluidity with electroporation behaviour of cell lines, in-duced transmembrane voltage was taken into account ascell size determines the maximal induced transmembranevoltage (Sale and Hamilton 1967; Zimmermann 1982;Teissie et al. 1999). Cell membrane fluidity was measured
Fig. 3 Membrane resealing after pulse application for cell lines V-79 and B16-F1. The train of eight pulses, 100 ls and repetitionfrequency 1 Hz was applied. The voltage applied to 2 mmelectrodes was 147 V for V-79 and 107 V for B16-F1. Values aremeans of five independent experiments ± standard error
200
by the EPRmethod using the spin probemethyl ester of 5-doxylpalmitate which dissolves in the membrane phos-pholipid bilayer. In our study three different cell lines werechosen that could be cultured under identical conditions.Results revealed that for the largest cell line B16-F1,reversible electroporation took place at a lower voltagethan for the smallest two, V-79 and DC-3F (Fig. 2a),which is in agreement with the theory (Eq. 1), but thedifferences were not statistically significant and dimin-ished when induced transmembrane voltage was takeninto account (Fig. 2c). Another factor that was reportedto affect reversible electroporation is cell membrane flu-idity (Rols et al. 1990). Our results show (Fig. 2, Table 1,Fig. 4) the same tendency as described by Rols et al. onChinese hamster ovary cells, where the less fluid cellmembranes were permeabilised at lower voltages than themore fluid ones (Rols et al. 1990).However, in the study ofRols et al. the fluidity of cell membranes was changed bythe addition of ethanol and lysolecitin both of whichincorporate into the cell membrane and change its char-acteristics, as discussed later. Cell membrane fluidity of agiven cell line can be altered by the addition of chemicalcompounds, as in the study of Rols et al. or it can bechanged by exposure of cells to different temperatures.However, in the existing literature on the effect of tem-perature on electroporation, one finds conflicting reports(Kinoshita and Tsong 1977; Zimmerman 1982). In ourstudy we observed that the temperature has significanteffect on cellmembranefluidity (data not shown), and thatwhen the temperature of a drop of cell suspension placedbetween electrodes was measured, it was observed that itreached room temperature (electrode temperature) in lessthan a minute. The temperature of cell suspension ex-posed to electric pulses was therefore room temperature,the same temperature at which EPR spectra were re-corded. Cell membrane fluidity was measured by the EPRmethod with X-band EPR spectrometer using the spinprobemethyl ester of 5-doxylpalmitate, which is lipophilic
and therefore dissolves in the membrane phospholipidbilayer. Since the nitroxide groups of the spin probes in-side the cell are reduced by the oxy–redoxy systems to theEPR invisible hydroxyl amines (Chen and Morse 1988)the main contribution to the EPR spectrum is from thespin probes in the plasma membrane. Overall membranefluidity, expressed with the empirical correlation time(semp), was determined by rough estimation directly fromtheEPRspectra byEq. 2, an expressionwhich is valid onlyfor fast isotropic motion in solution. In the membrane itcan be used only to compare relative differences in spinprobe dynamics between different cell lines and differenttreatments (Marsh 1981). More precise information wasobtained by computer simulation of the experimentalspectra (Fig. 4); changes in the order parameter, correla-tion times and proportion of the coexisting domain typesdefine the overall membrane fluidity more precisely. Bothmethods, rough estimation and computer simulation ofthe experimental spectra confirmed that cell line B16-F1has the least fluidmembrane. From computer simulationsit is also evident that the domain types with low andmedium order parameter influence the most fluiditycharacteristics, since the proportion of these two domaintypes differs the most between the investigated cell lines,while the domain type with the highest order parameter isalmost the same (Table 1). The effect of cell membranefluidity anddomain type,where reversible electroporationtakes place, could not be established, as the differences forreversible electroporation were not significant among thecell lines. The differences however were more pronouncedfor irreversible electroporation (Fig. 2b). As irreversibleelectroporation was determined by cell survival, we couldnot distinguish between the effects of the electric fieldapplication from the effect of different time courses ofmembrane resealing. Cell membrane resealing in cell lineB16-F1 was completed in 50% of the cells in a population5 min after pulse application, while in cell lineV-79 it tookmore than 20 min to reach the same value. Even though
Domain 1 Domain 2 Domain 3
V-79 semp=2.5±0.4 nsOrder parameter S 0.11±0.01 0.33±0.01 0.60±0.01Rot. corr. time sc (ns) 1.8±0.1 1.1±0.1 0.31±0.07Proportion d 0.27±0.01 0.22±0.03 0.51±0.03
DC-3F semp=2.8±0.2 nsOrder parameter S 0.11±0.01 0.32±0.01 0.60±0.01Rot. corr. time sc (ns) 1.9±0.1 1.3±0.1 0.28±0.04Proportion d 0.24±0.01 0.24±0.02 0.52±0.02
B16-F1 semp=3.0±0.4 nsOrder parameter S 0.13±0.01 0.33±0.01 0.61±0.08Rot. corr. time sc (ns) 1.8±0.1 1.3±0.1 0.20±0.06Proportion d 0.20±0.01 0.30±0.03 0.50±0.03
The error of each calculated parameter is estimated through covariance matrix analysis (Filipic et al. 2001). The corresponding empiricalcorrelation times are derived directly from the experimental spectra and are related to the overall membrane fluidity (mean values of threeexperiments ± standard deviation)
Table 1 Fluidity characteristics of membrane domains 1–3 of threedifferent cell lines (V-79, DC-3F and B16-F1) (determined withorder parameter S, rotational correlation time sc, and proportion
of the coexisting domain types d, obtained as the best fit of thecalculated to the experimental spectra of the lipophilic spin probeMeFASL(10.3) dissolved in the membrane of the cell lines at 25�C
201
all the cells in population reseal within 30 min in both celllines, the differences between the resealing of the two celllines weremore than 15 min (Fig. 3), which could have animportant effect on cell survival. Nevertheless, the ques-tion of cell membrane fluidity having an effect on irre-versible electroporation, or affecting cell membraneresealing could not be answered, and neither could theeffect of cell membranes domains be established. The ef-fect of cell size on induced transmembrane voltage did notsignificantly diminish the differences among cell lines forirreversible electroporation (Fig. 2c). Cell line B16-F1was able to survive at higher electric field strengths andsignificantly higher induced transmembrane voltage thanthe other two cell lines. Nevertheless, in this cell line, withthe methods used, it was not possible to separate irre-versible electroporation from the ability of the cell line toreseal membranes. A permeabilised membrane, apartfrom transport of extra cellular compounds to the cell,also allows depletion of organic compounds from the cell(Rols and Teissie 1992). Namely, we suppose that the cellsthat reseal faster have better chances of survival, andtherefore, by the method used, it was not possible to drawa direct conclusion that the cells with less fluidmembranescan survive a higher applied voltage. The effect of cellmembrane fluidity on irreversible electroporation istherefore masked with the ability of this cell line to resealits membrane faster than the other two cell lines. Themembrane resealing that takes place after the pulseapplication is an active process (Kinoshita and Tsong1979). Even though the process of resealing is not yetcompletely understood, it is suggested that the cell cyto-skeleton is involved (Rols and Teissie 1992). The resealingof cell lines B16-F1 and V-79 was studied after the appli-cation of different amplitudes of an applied electric field(Fig. 3), since the resealing rate constant does not dependon the electric field intensity in our experiment. The timecourse of resealing in B16-F1 was not modified when147 V, the amplitude that was used for V-79, was applied(data not shown), which is in accordance with the pub-lished data onCHOcell lines exposed to electric fieldswithcomparable pulse number, duration and amplitudes (Rolsand Teissie 1992).
The differences in the time course of resealing couldbe explained by biological differences among cell lines.Even though that from this point of view the workperformed with different cell lines can be seen as adrawback, we chose this design of experiment in order toavoid the use of chemical compounds that incorporateinto the membrane and change its characteristics. In ourprevious study we demonstrated that some chemicalcompounds, like C12E8, known to have a fluidising effecton the cell membrane, also stabilise pores that areformed during electroporation even at concentrationsthat are too low to alter the cell membrane fluidity(Kanduser et al. 2003). In the case of ethanol-inducedchange of membrane fluidity, one should consider thetoxic effect of ethanol on cells like free radical formationand related lipid peroxidation, induction of apoptosis
Fig. 4 Sums of six experimental spectra of MeFASL(10.3) in themembrane of V-79, DC-3F and B16-F1 cell lines measured at 25�Cwith their best fits, taking into account that the spectrum issuperposition of three spectral components, which correspond tothe spin probes in three coexisting domain types (domains 1–3)
202

and the disordering effect of ethanol on the cell mem-brane that affects the function of the molecules embed-ded in the cell membrane (Meshar et al. 1996; Li et al.2000; Jordao et al. 2004; Neuman 2002; Neuman et al.2002; Chen et al. 1996, 2000). With our experimentaldesign, we were able to study the effect of cell membranefluidity on electroporation behaviour of cell lines wheredifferences in cell membrane fluidity were the inherentproperty of cell membranes.
In conclusion, our results show that differences in cellmembrane fluidity observed for the cell lines investigatedare not sufficient to provide evidence for the effect onreversible electroporation, although there is a tendencythat, with increased membrane fluidity, the voltage re-quired for reversible electroporation decreases. On theother hand, cell membrane fluidity is associated with alower irreversible electroporation voltage; though itseffect is masked with faster resealing of the cell mem-brane of the B16-F1 cell line.
Acknowledgements This research was supported by the Ministry ofEducation, Science and Sport of the Republic of Slovenia.The authors wish to express their thanks to Zorka Stolic from theJ. Stefan Institute, Ljubljana, Slovenia, for technical assistance.
References
Bloom M, Thewalt JL (1995) Time and distance scales of mem-brane domain organization. Mol Membr Biol 12:9–13
Canatella PJ, Karr JF, Petros JA, Prausnitz MR (2001) Quanti-tative study of electroporation mediated uptake and cell via-bility. Biophys J 80:755–764
Chen K, Morse PD II, Swartz HM (1988) Kinetics of enzyme-mediated reduction of lipid soluble nitroxide spin labels byliving cells. Biochim Biophys Acta 943:477–484
Chen S-Y, Yang B, Jacobson K, Sulik KK (1996) The membranedisordering effect on ethanol on neural crest cells in vitro andthe protective role of GM1 ganglioside. Alcohol 13:589–595
Chen SY, Periasamy A, Yang B, Herman B, Jacobson K, Sulik KK(2000) Differential sensitivity of mouse neural cells to ethanol-induced toxicity. Alcohol 20:75–81
Chernomordik LV, Sukharev SI, Popov SV, Pastusenko VF, So-kiroko AV, Abidor IG, Chizmadzev YA (1987) The electricalbreakdown of cell and lipid membranes: the similarity of phe-nomenologies. Biochim Biophys Acta 902:360–373
Cole KS (1972) Membranes Ions and Impulses. Berkely, LosAngeles, p 15
Curtain CC, Gordon LM (1984) ESR spectroscopy of membranes.In: Alan R (ed) Membranes, detergents and receptor solubili-zation. Liss Inc., New York, pp 177–213
CemazarM, JarmT,Miklavcic D,Macek-Lebar A, IhanA,KopitarNA, Sersa G (1998) Effect of electric field induced intensity onelectropermeabilization and electro sensitivity of various tumourcell lines in vitro. Electromagnetobiol 17:263–272
Danfelter M, Engstrom P, Person B, Salford LG (1998) Effect ofhigh voltage pulses on survival of Chinese hamster V-79 lungfibroblast cells. Bioelectrochem Bioenerg 47:97–101
Djuzenova CS, ZimmermannU, FrankH, Sukhorukov VL, RichterE, FuhrG (1996) Effect ofmedium conductivity and compositionon the uptake of propidium iodide into electropermeabilizedmyeloma cells. Biochim Biophys Acta 1284:143–152
Ferber D (2001) Gene therapy: safer and virus free? Science294:1638–1642
Filipic B, Strancar J (2001) Tuning EPR spectral parameters withgenetic algorithm. Appl Soft Comput 1:83–90
Fromm ME, Taylor LP, Walbot V (1986) Stable transformation ofmaize after gene transfer by electroporation.Nature 319:791–793
Gabriel B, Teissie J (1997) Direct observation in the millisecondtime range of fluorescent molecule asymmetrical interactionwith the electropermeabilized cell membrane. Biophys J73:2630–2637
Gabriel B, Teissie J (1999) Time courses of mammalian cellelectropermeabilization observed by milisecond imaging ofmembrane property changes during the pulse. Biophys J76:2158–2165
Gehl J (2003) Electroporation: theory and methods, perspectivesfor drug delivery, gene therapy and research. Acta PhysiolScand 177:437–447
Gaskova D, Sigler K, Janderova B, Plasek J (1996) Effect of highvoltage electric pulses on yeast cells: factors influencing thekilling efficiency. Bioelectrochem Bioenerg 39:195–202
Hamilton WA, Sale JH (1967) Effects of high electric fields onmicro organism II. Mechanism of action of the lethal effect.Biochim Biophys Acta 148:789–800
Golzio M, Mora MP, Raynaud C, Delteil C, Teissie J, Rols MP(1998) Control by osmotic pressure of voltage induced per-meabilization and gene transfer in mammalian cells. Biophys J74:3015–3022
Jordao AA, Chiarello PG, Arantes MR, Meirelles M, Vannucchi H(2004) Effect of an dose of ethanol on lipid peroxidation in rats:action of vitamin E. Food Chem Toxicol 42:459–464
Kanduser M, Fosnaric M, Sentjurc M, Kralj-Iglic V, HagerstrandH, Iglic A, Miklavcic D (2003) Effect of surfactant polyoxy-ethylene glycol (C12E8) on electroporation of cell line DC-3F.Colloid Surf A 214:205–217
Kinoshita K, Tsong TY (1977) Formation and resealing of pores ofcontrolled sizes in human erythrocyte membrane. Nature268:438–440
Kinoshita K, Tsong TY (1979) Voltage induced conductance inhuman erythrocyte membranes. Biochim Biophys Acta554:479–497
Kotnik T, Macek-Lebar A, Miklavcic D, Mir LM (2000) Evalua-tion of cell membrane electropermeabilization by means of non-permeant cytotoxic agent. Biotechniques 28:921–926
Kotnik T, Bobanovic F, Miklavcic D (1997) Sensitivity of trans-membrane voltage induced by applied electric fields—a theo-retical analysis. Bioelectrochem Bioenerg 43:285–291
Leontiadou H, Mark AE, Marrink SJ (2004) Molecular dynamicssimulations of hydrophilic pores in lipid bilayers. Biophys J86:2156–2164
Li Y, King MA, Meyer MM (2000) a/nicotinic recetpor-mediatedprotection against ethanol-induced oxidative stress and cyto-toxicity in PC12 cells. Brain Res 861:165–167
Marsh D (1981) Electron spin resonance: spin labels. In: Grell E(ed) Membrane spectroscopy. Springer-Verlang, Berlin, pp 51–142
Meaking WS, Edgerton J, Wharton CW, Meldrum RA (1995)Electroporation induced damage in mammalian cell DNA.Biochim Biophys Acta 1264:357–362
Marszalek P, Liu DS, Tsong TY (1990) Schwan equation andtransmembrane potential induced by alternating electric field.Biophys J 58:1053–1058
Meshar A, Holownia A, Bardou LG, Menez J-F (1996) Effect ofacetaldehyde generated from ethanol by ADH-transfectedCHO cells on their membrane fatty acid profiles. Alcohol13:611–616
Mir LM (2000) Therapeutic perspectives of in vivo electroper-meabilization. Bioelectrochemistry 53:1–10
Mir LM, Tounekti O, Orlowski S (1996) Bleomycin: revival of anold drug. Gen Pharmacol 27:745–748
Neuman MG (2002) Synergetic signaling of apoptosis in vitro byethanol and acetaminophen. Alcohol 27:89–98
Neuman MG, Haber JA, Malkiewicz IM, Cameron RG, Katz GG,Shear NH (2002) Ethanol signals for apoptosis in cultured skincells. Alcohol 26:179–190
Neumann E (1989) The relaxation hysteresis of membrane elec-troporation. In: Neumann E, Sowers AE, Jordan CA (eds)
203

Electroporation and electrofusion in cell biology. PleniumPress, New York, pp 61–82
Neumann E (1992) Membrane electroporation and direct genetransfer. Bioelectrochem Bioenerg 28:247–267
Neumann E, Schaefer-Ridder M, Wang Y, Holschneider PH (1982)Gene transfer into mouse lyoma cells by electroporation in highelectric fields. EMBO J 1:841–845
Neumann E, Kakorin S, Toesing K (1999) Fundamentals of elec-troporative delivery of drugs and genes. Bioelectrochem Bio-energ 48:3–16
O’Hare MJ, Ormerod MG, Imrie PR, Peacock JH, Asche W (1989)Electropermeabilization and electrosensitivity of different typesof mammalian cells. In: Neumann E, Sowers AE, Jordan CA(eds) Electroporation and electrofusion in cell biology. PleniumPress, New York, pp 319–330
Puc M, Flisar K, Rebersek S, Miklavcic D (2001) Electroporatorfor in vitro cell permeabilization. Radiol Oncol 35:203–207
Puc M, Kotnik T, Mir L, Miklavcic D (2003) Quantitative modelof small molecules uptake after in vitro cell electropermeabili-zation. Bioelectrochemistry 60:1–10
Pucihar G, Kotnik T, Kanduser M, Miklavcic D (2001) Theinfluence of medium conductivity on electropermeabilizationand survival of cells in vitro. Bioelectrochemistry 54:107–115
Rols MP, Teissie J (1989) Ionic strength modulation of electricallyinduced permeabilization and associated fusion of mammaliancells. Eur J Biochem 179:109–115
Rols MP, Teissie J (1990a) Electropermeabilization of mammaliancells. Quantitative analysis of the phenomenaon. Biophys J58:1089–1098
Rols MP, Teissie J (1990b) Modulation of electrically inducedpermeabilization and fusion of Chinese hamster ovary cells byosmotic pressure. Biochemistry 29:4561–4567
Rols MP, Teissie J (1992) Experimental evidence for the in-volvememnt of the cytoskeleton in mammalian cell electroper-meabilization. Biochim Biophys Acta 1111:45–50
Rols MP, Dahhou F, Mishra KP, Teissie J (1990) Control ofelectric field induced cell membrane permeabilization by mem-brane order. Biochemistry 29:2960–2966
Sale AJH, Hamilton WA (1967) Effect of high electric field onmicro organisms. I. Killing of bacteria and yeasts. BiochimBiophys Acta 148:781–788
Sersa G, Cemazar M, Rudolf Z (2003) Electrochemotherapy: ad-ventages and drawbacks in treatment of cancer patient. CancerTher 1:133–142
Sentjurc M, Strancar J, Koklic T (2002) Membrane domain alter-ation under the action of biologically active substances: an EPRstudy. Curr Top Biophys 26:65–73
Strancar J, Sentjurc M, Schara M (2000) Fast and accurate char-acterization of biological membranes by EPR spectral simula-tion of nitroxides. J Magn Reson 142:254–265
Teissie J, Eynord N, Gabriel B, Rols MP (1999) Electropermea-bilization of cell membranes. Adv Drug Deliv Rev 35:3–19
Tounekti O, Kenani A, Foray N, Orlowski S, Mir LM (2001) Theratio of single to double strand DNA brakes and their absolutevalues determine cell death pathway. Br J Cancer 84:1272–1279
Valic B, Golzio M, Pavlin M, Schatz A, Faurie C, Gabriel B, Te-issie J, Rols M-P, Miklavcic D (2003) Effect of electric fieldinduced transmembrane potential on spheroidal cells: theoryand experiment. Eur Biophys J Biophy 32:519–528
Vernhes MC, Cabanes PA, Teissie J (1999) Chinese hamster ovarycells sensitivity to localized electrical stress. BioelectrochemBioenerg 48:17–25
Zimmermann U (1982) Electric field mediated fusion and relatedelectrical phenomena. Biochem Biophys Acta 694:227–277
204
Copyright © 2022 FDOKUMEN