Wrinkling and electroporation of giant vesicles in the gel phase
7
Wrinkling and electroporation of giant vesicles in the gel phase† Roland L. Knorr, Margarita Staykova, Rub en Serral Graci a‡ and Rumiana Dimova * Received 10th December 2009, Accepted 29th January 2010 First published as an Advance Article on the web 4th March 2010 DOI: 10.1039/b925929e Electric pulses applied to fluid phospholipid vesicles deform them and can induce the formation of pores, which reseal after the end of the pulse. The mechanical and rheological properties of membranes in the gel phase differ significantly from those of fluid membranes, thus a difference in the vesicle behavior in electric fields is expected. However, studies addressing this problem are scarce. Here, we investigate the response of giant gel-phase vesicles to electric pulses and resolve the dynamics of deformation with microsecond resolution. We find that the critical transmembrane potential leading to poration is several times higher as compared to that of fluid membranes. In addition, the resealing of the pores is arrested. Interestingly, the vesicle shapes change from ellipsoidal to spherocylindrical during the electric pulse and the membrane becomes periodically wrinkled with ridges aligned with the field direction and wavelengths in the micrometre range. Such membrane wrinkling has not been reported previously. The corrugations comply with universal laws of wrinkling of surfaces with lengthscale dimensions from nanometres to metres. Introduction The behavior of cells and vesicles subjected to electric fields has been an object of extensive studies in the last couple of decades. 1–6 The phenomena of electroporation and electrofusion are of particular interest because of their vast use in cell biology and biotechnology as means for cell hybridization or for introducing molecules such as proteins, foreign genes (plasmids), antibodies, or drugs into cells. Strong electric DC-pulses of short duration induce transient pores across the cell membrane allowing the influx and efflux of molecules, or the fusion of two cells, which are in close proximity. To understand the process of cell electroporation, a significant number of studies have been performed on model membranes. The majority of these studies have employed single-component vesicles whose lipids are in the fluid state. When subjected to weak pulses, such vesicles deform due to the electric stress imposed on the lipid bilayer. The vesicle shape change depends on the conductivity ratio between the inner and outer vesicle solution, as demonstrated on small 100 nm vesicles 7–9 and on cell-sized giant unilamellar vesicles (GUVs). 10,11 Whereas the results for the small vesicles are based on indirect measurements, GUVs provide direct visualization of the membrane response with optical microscopy 12–16 owing to their large size. In electric fields, the potential built across the membrane induces an effective electrical tension. 10,17 Under sufficiently strong or long pulses, the membrane of fluid phase vesicles may rupture. 10,17–19 In giant vesicles exposed to pulses in the 100 ms range, this process is accompanied by the formation of optically detectable pores with micrometre sizes. 10 In charged membranes, such pores destabilize the membrane and can lead to vesicle collapse. 20 In neutral phos- phatidylcholine membranes, the pores reseal and their lifetime is typically in the range of a few tens of milliseconds. 10 The overall behavior of the vesicles exposed to electric pulses depends strongly on the material properties of the constituting lipid bilayer. It is well known that the mechanical and rheological properties of membranes in the gel phase differ drastically from those in fluid state; for a concise comparison see ref. 15. For example, the bending stiffness and the shear surface viscosity of gel-phase membranes are orders of magnitude higher than those reported for membranes in the fluid phase, 21–24 and membranes in the gel phase are thicker. 25 Such features can be expected to leave a signature on the response of gel-phase membranes to electric fields. However, only a scarce number of studies in the literature have considered this problem. Among them, electroporation of 100 nm gel-phase vesicles was reported as transient and fully reversible with lifetime of the nanometre pores in the millisecond range. 26 On the other hand, micrometre pores induced in giant vesicles were observed as long-living. 16,27 Electric fields were also shown to affect the phase transition of certain lipids, 28 support- ing an earlier theory by Sugar. 29 A convenient lipid to investigate the response of gel-phase membranes to electric pulses is dipalmitoylphosphatidylcholine (DPPC). DPPC is the primary component of the lung surfac- tant 30 and is found in large amounts in the cell nuclei. 31 The main phase transition of this lipid is at 41.6 C. 32 Thus, at room temperature DPPC membranes are in the gel phase. We used DPPC giant vesicles to investigate the response of gel- phase membranes to DC pulses in the submillisecond range. Confocal and phase contrast microscopy in combination with fast digital imaging were employed to shed light on the behavior of gel-phase vesicles. The dynamics of deformation and poration Max Planck Institute of Colloids and Interfaces, Science Park Golm, 14424 Potsdam, Germany. E-mail: [email protected]; Fax: +49 331 567 9615; Tel: +49 331 567 9612 † Electronic supplementary information (ESI) available: Degree of deformation of a gel-phase vesicle exposed to pulses with different field strength. See DOI: 10.1039/b925929e ‡ Present address: Culgi B.V. P.O. Box 252 2300 AG Leiden, The Netherlands. 1990 | Soft Matter , 2010, 6, 1990–1996 This journal is ª The Royal Society of Chemistry 2010 PAPER www.rsc.org/softmatter | Soft Matter
-
Upload
independent -
Category
Documents
-
view
0 -
download
0
Transcript of Wrinkling and electroporation of giant vesicles in the gel phase

PAPER www.rsc.org/softmatter | Soft Matter
Wrinkling and electroporation of giant vesicles in the gel phase†
Roland L. Knorr, Margarita Staykova, Rub�en Serral Graci�a‡ and Rumiana Dimova*
Received 10th December 2009, Accepted 29th January 2010
First published as an Advance Article on the web 4th March 2010
DOI: 10.1039/b925929e
Electric pulses applied to fluid phospholipid vesicles deform them and can induce the formation of
pores, which reseal after the end of the pulse. The mechanical and rheological properties of membranes
in the gel phase differ significantly from those of fluid membranes, thus a difference in the vesicle
behavior in electric fields is expected. However, studies addressing this problem are scarce. Here, we
investigate the response of giant gel-phase vesicles to electric pulses and resolve the dynamics of
deformation with microsecond resolution. We find that the critical transmembrane potential leading to
poration is several times higher as compared to that of fluid membranes. In addition, the resealing of
the pores is arrested. Interestingly, the vesicle shapes change from ellipsoidal to spherocylindrical
during the electric pulse and the membrane becomes periodically wrinkled with ridges aligned with the
field direction and wavelengths in the micrometre range. Such membrane wrinkling has not been
reported previously. The corrugations comply with universal laws of wrinkling of surfaces with
lengthscale dimensions from nanometres to metres.
Introduction
The behavior of cells and vesicles subjected to electric fields has
been an object of extensive studies in the last couple of decades.1–6
The phenomena of electroporation and electrofusion are of
particular interest because of their vast use in cell biology and
biotechnology as means for cell hybridization or for introducing
molecules such as proteins, foreign genes (plasmids), antibodies,
or drugs into cells. Strong electric DC-pulses of short duration
induce transient pores across the cell membrane allowing the
influx and efflux of molecules, or the fusion of two cells, which
are in close proximity.
To understand the process of cell electroporation, a significant
number of studies have been performed on model membranes.
The majority of these studies have employed single-component
vesicles whose lipids are in the fluid state. When subjected to
weak pulses, such vesicles deform due to the electric stress
imposed on the lipid bilayer. The vesicle shape change depends
on the conductivity ratio between the inner and outer vesicle
solution, as demonstrated on small �100 nm vesicles7–9 and on
cell-sized giant unilamellar vesicles (GUVs).10,11 Whereas the
results for the small vesicles are based on indirect measurements,
GUVs provide direct visualization of the membrane response
with optical microscopy12–16 owing to their large size.
In electric fields, the potential built across the membrane induces
an effective electrical tension.10,17 Under sufficiently strong or long
pulses, the membrane of fluid phase vesicles may rupture.10,17–19
Max Planck Institute of Colloids and Interfaces, Science Park Golm, 14424Potsdam, Germany. E-mail: [email protected]; Fax: +49331 567 9615; Tel: +49 331 567 9612
† Electronic supplementary information (ESI) available: Degree ofdeformation of a gel-phase vesicle exposed to pulses with different fieldstrength. See DOI: 10.1039/b925929e
‡ Present address: Culgi B.V. P.O. Box 252 2300 AG Leiden, TheNetherlands.
1990 | Soft Matter, 2010, 6, 1990–1996
In giant vesicles exposed to pulses in the 100 ms range, this process
is accompanied by the formation of optically detectable pores with
micrometre sizes.10 In charged membranes, such pores destabilize
the membrane and can lead to vesicle collapse.20 In neutral phos-
phatidylcholine membranes, the pores reseal and their lifetime is
typically in the range of a few tens of milliseconds.10
The overall behavior of the vesicles exposed to electric pulses
depends strongly on the material properties of the constituting
lipid bilayer. It is well known that the mechanical and rheological
properties of membranes in the gel phase differ drastically from
those in fluid state; for a concise comparison see ref. 15. For
example, the bending stiffness and the shear surface viscosity of
gel-phase membranes are orders of magnitude higher than those
reported for membranes in the fluid phase,21–24 and membranes in
the gel phase are thicker.25 Such features can be expected to leave
a signature on the response of gel-phase membranes to electric
fields. However, only a scarce number of studies in the literature
have considered this problem. Among them, electroporation of
100 nm gel-phase vesicles was reported as transient and fully
reversible with lifetime of the nanometre pores in the millisecond
range.26 On the other hand, micrometre pores induced in giant
vesicles were observed as long-living.16,27 Electric fields were also
shown to affect the phase transition of certain lipids,28 support-
ing an earlier theory by Sugar.29
A convenient lipid to investigate the response of gel-phase
membranes to electric pulses is dipalmitoylphosphatidylcholine
(DPPC). DPPC is the primary component of the lung surfac-
tant30 and is found in large amounts in the cell nuclei.31 The main
phase transition of this lipid is at 41.6 �C.32 Thus, at room
temperature DPPC membranes are in the gel phase.
We used DPPC giant vesicles to investigate the response of gel-
phase membranes to DC pulses in the submillisecond range.
Confocal and phase contrast microscopy in combination with
fast digital imaging were employed to shed light on the behavior
of gel-phase vesicles. The dynamics of deformation and poration
This journal is ª The Royal Society of Chemistry 2010
of these vesicles differ significantly from the response of vesicles
in the fluid phase. The electroporation of the gel-phase
membranes appears to be an irreversible process. Surprisingly,
we observe intra-pulse shape relaxation for non-porated gel-
phase vesicles. This process is associated with membrane wrin-
kling. The vesicle surface corrugates during the pulse, forming
wrinkles parallel to the field direction. This membrane behavior
is analogous to wrinkling of elastic sheets.33 Wrinkling of lipid
membranes has not been previously reported.
Materials and methods
Vesicle preparation
GUVs were prepared from DPPC and palmitoyloleoylphos-
phatidylcholine (POPC) (Avanti Polar Lipids, Birmingham AL)
using the electroformation method34 as described in detail in
ref. 10. The main phase transition of POPC occurs at �2 �C.
Thus, at room temperature POPC vesicles are in the fluid phase.
For fluorescence imaging, 0.1 mol% dipalmitoylphosphatidyle-
thanolamine-Rhodamine (DPPE-Rh) from Avanti Polar Lipids
was added to some of the lipid solutions.
The vesicles were grown from a lipid film deposited on the
conductive side of glasses coated with indium tin oxide (ITO). The
film was prepared by spreading a chloroform solution of the lipid,
followed by 2 h evaporation under vacuum. Two ITO glasses were
assembled to form a chamber sandwiching a 2 mm thick Teflon
frame. The chamber was filled with 0.2 M sucrose solution and
closed by binder clips. The conductive sides of the ITO glasses
were connected to a function generator and the chamber placed in
an oven at 60 �C. Alternating current at 1 V and 10 Hz was applied
for 1 h, after which the field was changed to 1.5 V, 5 Hz for 2 h.
Afterward, the chamber was slowly cooled down to room
temperature with cooling rate lower than 0.5 �C min�1. The vesi-
cles were diluted more than 10 times in 0.2 M glucose solution to
create sugar asymmetry between the vesicle interior and exterior.
Because of the density difference, the vesicles settle at the bottom
of the observation chamber. The difference in refractive indices of
the solutions improves the vesicle contrast when observed with
phase contrast microscopy. Loss of contrast in vesicles is an
indication that pores, allowing the exchange of the encapsulated
solution, have been or are present in the bilayer. Freshly prepared
vesicles in the fluid phase exhibit good contrast, which is main-
tained for days after their formation. However, in suspensions of
gel-phase vesicles, one often observes vesicles with poor contrast
indicating compromised membrane integrity, e.g. presence of
disclinations, holes, or grain boundaries. Such membrane defects
were shown to lead to lower lysis tension as compared to
membranes in the fluid phase.35 In our experiments, we chose
vesicles with good contrast, i.e. without or with very few and small
defects in the membrane. Presumably, the number of such defects
depends on the rate at which the fluid vesicles are brought to the
gel phase. As pointed out above, in our procedure this rate is low.
Vesicle observation and experimental procedures
The vesicles were exposed to square-wave DC pulses with
a duration of 300 ms and different field strengths. The working
chamber (Eppendorf, Hamburg, Germany) consists of two
parallel electrode wires, 0.2 mm in diameter and at a gap distance
This journal is ª The Royal Society of Chemistry 2010
of 0.5 mm, fixed to a Teflon frame, and confined from above and
below by two glass slides. The electrodes are situated close to the
lower glass. The chamber was connected to a Multiporator
(Eppendorf), which can generate DC and AC fields. Prior to the
application of the DC pulses, AC field (3 V, 2 MHz) was applied
for 10 s, which resulted in a negative dielectrophoretic motion of
the vesicles towards the middle between the electrodes and away
from the bottom glass. Such repositioning of the vesicle in the
middle between the electrodes and away from the chamber
bottom ensures homogeneous field distribution during the
applied pulse. Note that in contrast to vesicles in the gel phase,
vesicles in the fluid phase deform when subjected to AC fields27,36
and may exhibit a membrane flow in inhomogeneous AC fields.37
The deformation response of the vesicles under DC pulses was
observed with high temporal resolution under phase contrast by
an inverted Zeiss microscope, Axiovert 135 (Jena, Germany),
equipped with a 20� Ph2 objective and a fast digital camera,
HG-100 K (Redlake, San Diego, CA). Image sequences were
acquired either at 20 000 or 50 000 frames per second (fps). For
routine observation and vesicle selection, the sample was illu-
minated with a halogen lamp. A mercury lamp (HBO W/2) was
used only for a few seconds during recordings with the fast
camera. Under this condition, sample heating from the illumi-
nation is less than 2 �C11 and does not influence the phase state of
the lipids used.
Confocal and differential interference contrast (DIC) images
with higher spatial resolution were recorded using a Leica DM
IRE2 SP5 system (Leica Microsystems Heidelberg GmbH,
Germany), with a 40� HCX Plan APO objective (N.A. ¼ 0.75).
The fluorescently labeled vesicles were imaged with excitation at
561 nm (DPSS laser). Emission light was detected by a photo-
multiplier tube in the spectral range 575–650 nm. Vesicles labeled
with dyes did not exhibit any difference in their dynamics of
deformation and electroporation as compared to dye-free vesicles.
Image analysis
The beginning of the DC pulse, indicated as time zero in the data
presented in this work, was assigned to the frame before the
snapshot in which detectable vesicle deformation were observed.
This procedure can lead to a certain offset error in time, which is up
to 20 ms or 50 ms for acquisition speeds of 50 000 fps or 20 000 fps,
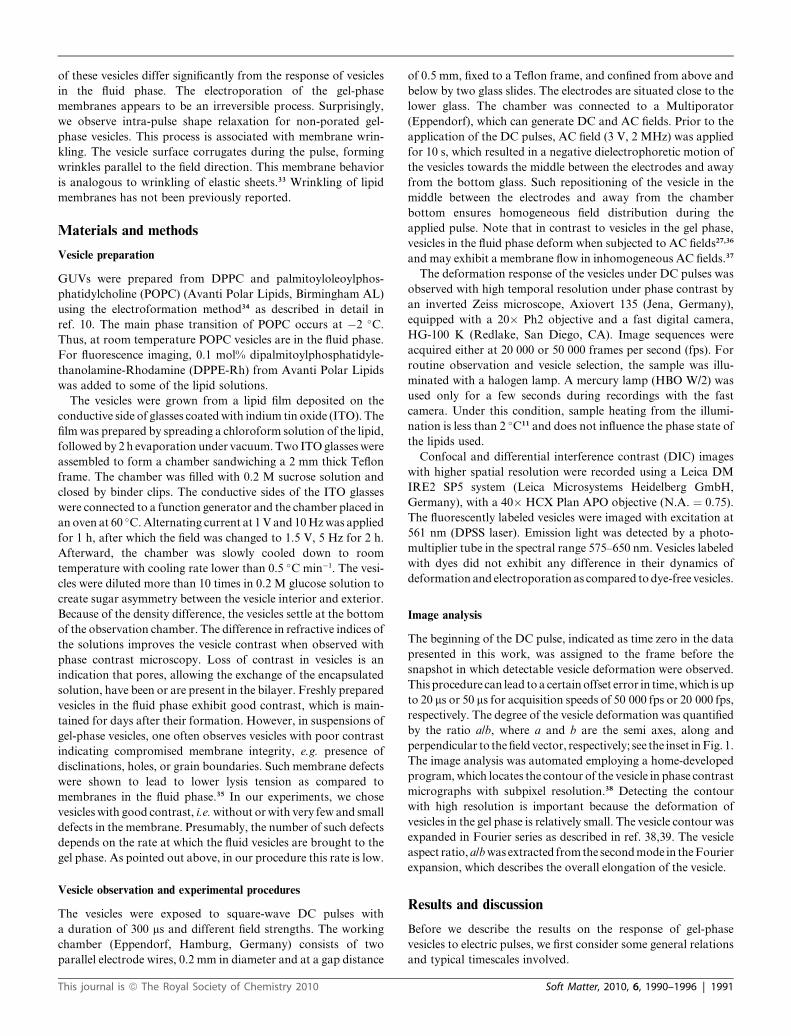
respectively. The degree of the vesicle deformation was quantified
by the ratio a/b, where a and b are the semi axes, along and
perpendicular to the field vector, respectively; see the inset in Fig. 1.
The image analysis was automated employing a home-developed
program, which locates the contour of the vesicle in phase contrast
micrographs with subpixel resolution.38 Detecting the contour
with high resolution is important because the deformation of
vesicles in the gel phase is relatively small. The vesicle contour was
expanded in Fourier series as described in ref. 38,39. The vesicle
aspect ratio, a/b was extracted from the second mode in the Fourier
expansion, which describes the overall elongation of the vesicle.
Results and discussion
Before we describe the results on the response of gel-phase
vesicles to electric pulses, we first consider some general relations
and typical timescales involved.
Soft Matter, 2010, 6, 1990–1996 | 1991
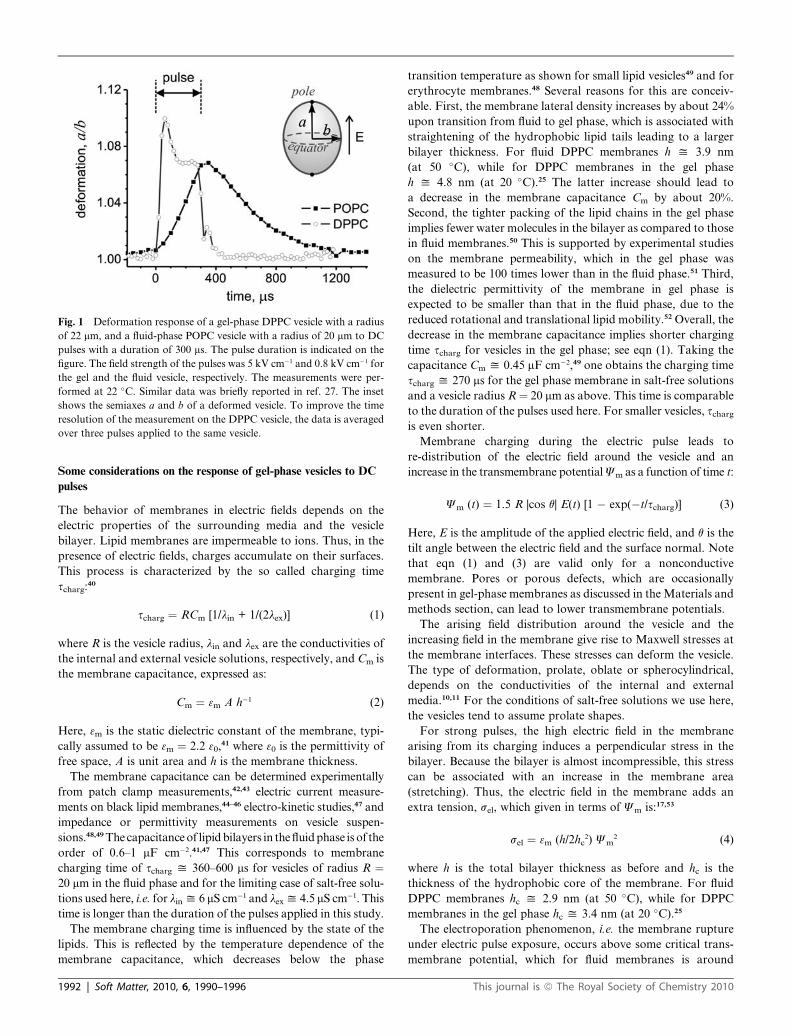
Fig. 1 Deformation response of a gel-phase DPPC vesicle with a radius
of 22 mm, and a fluid-phase POPC vesicle with a radius of 20 mm to DC
pulses with a duration of 300 ms. The pulse duration is indicated on the
figure. The field strength of the pulses was 5 kV cm�1 and 0.8 kV cm�1 for
the gel and the fluid vesicle, respectively. The measurements were per-
formed at 22 �C. Similar data was briefly reported in ref. 27. The inset
shows the semiaxes a and b of a deformed vesicle. To improve the time
resolution of the measurement on the DPPC vesicle, the data is averaged
over three pulses applied to the same vesicle.
Some considerations on the response of gel-phase vesicles to DC
pulses
The behavior of membranes in electric fields depends on the
electric properties of the surrounding media and the vesicle
bilayer. Lipid membranes are impermeable to ions. Thus, in the
presence of electric fields, charges accumulate on their surfaces.
This process is characterized by the so called charging time
scharg:40
scharg ¼ RCm [1/lin + 1/(2lex)] (1)
where R is the vesicle radius, lin and lex are the conductivities of
the internal and external vesicle solutions, respectively, and Cm is
the membrane capacitance, expressed as:
Cm ¼ 3m A h�1 (2)
Here, 3m is the static dielectric constant of the membrane, typi-
cally assumed to be 3m ¼ 2.2 30,41 where 30 is the permittivity of
free space, A is unit area and h is the membrane thickness.
The membrane capacitance can be determined experimentally
from patch clamp measurements,42,43 electric current measure-
ments on black lipid membranes,44–46 electro-kinetic studies,47 and
impedance or permittivity measurements on vesicle suspen-
sions.48,49 The capacitance of lipid bilayers in the fluid phase is of the
order of 0.6–1 mF cm�2.41,47 This corresponds to membrane
charging time of scharg y 360–600 ms for vesicles of radius R ¼20 mm in the fluid phase and for the limiting case of salt-free solu-
tions used here, i.e. for lin y 6 mS cm�1 and lex y 4.5 mS cm�1. This
time is longer than the duration of the pulses applied in this study.
The membrane charging time is influenced by the state of the
lipids. This is reflected by the temperature dependence of the
membrane capacitance, which decreases below the phase
1992 | Soft Matter, 2010, 6, 1990–1996
transition temperature as shown for small lipid vesicles49 and for
erythrocyte membranes.48 Several reasons for this are conceiv-
able. First, the membrane lateral density increases by about 24%
upon transition from fluid to gel phase, which is associated with
straightening of the hydrophobic lipid tails leading to a larger
bilayer thickness. For fluid DPPC membranes h y 3.9 nm
(at 50 �C), while for DPPC membranes in the gel phase
h y 4.8 nm (at 20 �C).25 The latter increase should lead to
a decrease in the membrane capacitance Cm by about 20%.
Second, the tighter packing of the lipid chains in the gel phase
implies fewer water molecules in the bilayer as compared to those
in fluid membranes.50 This is supported by experimental studies
on the membrane permeability, which in the gel phase was
measured to be 100 times lower than in the fluid phase.51 Third,
the dielectric permittivity of the membrane in gel phase is
expected to be smaller than that in the fluid phase, due to the
reduced rotational and translational lipid mobility.52 Overall, the
decrease in the membrane capacitance implies shorter charging
time scharg for vesicles in the gel phase; see eqn (1). Taking the
capacitance Cm y 0.45 mF cm�2,49 one obtains the charging time
scharg y 270 ms for the gel phase membrane in salt-free solutions
and a vesicle radius R¼ 20 mm as above. This time is comparable
to the duration of the pulses used here. For smaller vesicles, scharg
is even shorter.
Membrane charging during the electric pulse leads to
re-distribution of the electric field around the vesicle and an
increase in the transmembrane potential Jm as a function of time t:
Jm (t) ¼ 1.5 R |cos q| E(t) [1 � exp(�t/scharg)] (3)
Here, E is the amplitude of the applied electric field, and q is the
tilt angle between the electric field and the surface normal. Note
that eqn (1) and (3) are valid only for a nonconductive
membrane. Pores or porous defects, which are occasionally
present in gel-phase membranes as discussed in the Materials and
methods section, can lead to lower transmembrane potentials.
The arising field distribution around the vesicle and the
increasing field in the membrane give rise to Maxwell stresses at
the membrane interfaces. These stresses can deform the vesicle.
The type of deformation, prolate, oblate or spherocylindrical,
depends on the conductivities of the internal and external
media.10,11 For the conditions of salt-free solutions we use here,
the vesicles tend to assume prolate shapes.
For strong pulses, the high electric field in the membrane
arising from its charging induces a perpendicular stress in the
bilayer. Because the bilayer is almost incompressible, this stress
can be associated with an increase in the membrane area
(stretching). Thus, the electric field in the membrane adds an
extra tension, sel, which given in terms of Jm is:17,53
sel ¼ 3m (h/2hc2) Jm
2 (4)
where h is the total bilayer thickness as before and hc is the
thickness of the hydrophobic core of the membrane. For fluid
DPPC membranes hc y 2.9 nm (at 50 �C), while for DPPC
membranes in the gel phase hc y 3.4 nm (at 20 �C).25
The electroporation phenomenon, i.e. the membrane rupture
under electric pulse exposure, occurs above some critical trans-
membrane potential, which for fluid membranes is around
This journal is ª The Royal Society of Chemistry 2010
1 V.4,54 This threshold can also be understood in terms of critical
or lysis tension, slys, above which the membrane ruptures. For
fluid membranes, slys varies between 2 and 10 mN m�1 depending
on the lipid.
Fig. 2 Time dependence of the amplitudes of the second and fourth
modes in the Fourier expansion of the shape of the DPPC vesicle from
Fig. 1. The second mode shows the overall elongation of the vesicle. The
black solid line is an exponential fit to the after-pulse relaxation of
the second mode yielding 50 ms for the characteristic decay time of the
elliptical deformation. Non-zero values of the fourth mode indicate
spherocylinder-like vesicle deformation. The shaded area indicates the
scattering in the data for the fourth mode measured for the vesicle in the
absence of field. The deviation of the fourth mode away from this zone
correlates with the period when wrinkles are observed in the vesicle.
Timescales involved in the deformation response of fluid- and gel-
phase vesicles
In this section, we compare the deformation responses of fluid-
and gel-phase vesicles subjected to DC pulses below the electro-
poration threshold. Some results from this section were briefly
introduced in ref. 27. Here, we discuss in detail the various features
of the deformation response of the gel-phase membranes, which
compared to fluid ones is still poorly understood.
In the experiments we used POPC giant vesicles, which are in
the fluid phase at room temperature, and DPPC vesicles, which
are in the gel phase. We selected vesicles with similar sizes to
ensure comparable charging times, which depend on the vesicle
radius; see eqn (1). The vesicles were exposed to a single square-
wave pulse with duration of 300 ms and pulse strength, adjusted
to induce a similar degree of deformation in both vesicle types
without causing poration. It must be noted that it is difficult to
adjust the degree of deformation of a selected vesicle because it
depends on the initial vesicle tension or excess area10 (the excess
area is defined as the excess with respect to the area of a spherical
vesicles with the same volume). Both are unknown a priori. Gel-
phase vesicles required pulses with much larger field strengths to
attain an optically detectable deformation. To produce similar
degree in the two vesicle types, we used pulse strengths of 0.8 and
5 kV cm�1 for the fluid- and gel-phase vesicles, respectively.
Whereas pulses of 5 kV cm�1 readily cause electroporation in
fluid vesicles, the membrane in the gel vesicles remains intact. For
the degree of deformation attained by the gel-phase vesicles at
lower field strength see Fig. S1 in the ESI.†
The dynamics of deformation response of vesicles in the fluid
and gel phase differ significantly as shown in Fig. 1. The fluid
vesicle gradually responds, reaching a maximal deformation at
the end of the pulse. This behavior arises from the longer
membrane charging time (see previous section) as compared to
the pulse duration, which results in a gradual increase of the
Maxwell stresses throughout the pulse. At the beginning of the
pulse, the weak Maxwell surface stresses overcome the bilayer
bending rigidity and membrane fluctuations are pulled out; in
terms of membrane tensions, this regime is also known as
entropic.55 Later during the pulse, the stronger electric stresses
cause stretching of the membrane. In both, the entropic and the
stretching regime, the apparent vesicle area increases. After the
end of the pulse, the fluid vesicle relaxes gradually back to
a sphere, a/b ¼ 1, with a characteristic decay time of 0.4 ms. This
value is within the range of 0.1–0.5 ms reported for fluid, non-
porated egg PC vesicles and is related to the relaxation of the
bilayer stretching.10
Gel-phase vesicles respond faster and in a more complex
fashion; see Fig. 1. The maximal deformation is already reached
60 ms after the onset of the electric field. This is not surprising
bearing in mind that the field strength is six times larger than in
the experiments with the fluid-phase vesicles. Furthermore, the
charging time of the membrane in the gel phase is shorter than
that in fluid phase; see previous section. Following eqn (3), the
This journal is ª The Royal Society of Chemistry 2010
transmembrane potential reached in the first 60 ms in the gel-
phase vesicle is 5–10 times higher than that reached in the fluid-
phase vesicle. This is confirmed by the deformation of the two
vesicle types in the first 60 ms in Fig. 1 when comparing a/b � 1,
which characterizes out-of-sphere deformations.
What is intriguing in the response of the gel-phase vesicle is the
decrease of the deformation already during the pulse. Measure-
ments on different DPPC vesicles show that the decay time of this
intra-pulse relaxation is in the range 30–60 ms. During the intra-
pulse relaxation, a/b attains a plateau value, which can be
different for every vesicle. Pulses of different field strength
applied to the same vesicle change only the maximum degree of
deformation, but not the value of a/b at the end of the intra-pulse
relaxation; see Fig. S1 in the ESI.†
After the end of the pulse, gel-phase vesicles relax back to their
initial spherical shape with a decay time of 50 � 10 ms; see also
Fig. 2. This relaxation time is 10 times shorter than that of the
fluid-phase vesicles.
The intra-pulse relaxation is a very surprising phenomenon.
Since the gel-phase vesicles are exposed to much stronger fields as
compared to the fluid ones, one would intuitively expect
membrane electroporation. However, in the example given in
Fig. 1, no microscopic pores were optically detected and the
vesicle contrast was preserved. This implies the absence of stable
pores with sizes in the sub-micron range, which could allow the
exchange of sucrose and glucose molecules between the vesicle
interior and the surrounding media. We cannot exclude forma-
tion of nanometre-sized transient pores, since their presence
would not change the vesicle contrast significantly.
Shape response and membrane wrinkling in gel-phase vesicles
To resolve the mechanism involved in the intra-pulse relaxation
and the overall deformation response of the gel-phase vesicles,
Soft Matter, 2010, 6, 1990–1996 | 1993
we analyzed the recorded image sequences in detail. For this
purpose, the vesicle contour was detected and expanded in
Fourier series. The modes in this expansion describe the vesicle
shape. We found that during the pulse the vesicle shape changes
slightly from an ellipsoid to a morphology resembling a spher-
ocylinder with a symmetry axis oriented parallel to the field
direction. Non-elliptical deformations are described by higher
modes in the Fourier expansion and in the case of spherocy-
linders, by the fourth mode. Fig. 2 shows the time dependence of
both the second and the fourth modes during the pulse. The non-
zero deviation of the fourth mode (shaded area in Fig. 2) reveals
a non-elliptical vesicle shape transformation, which occurs
around 50 ms after the beginning of the pulse and lasts until the
pulse end.
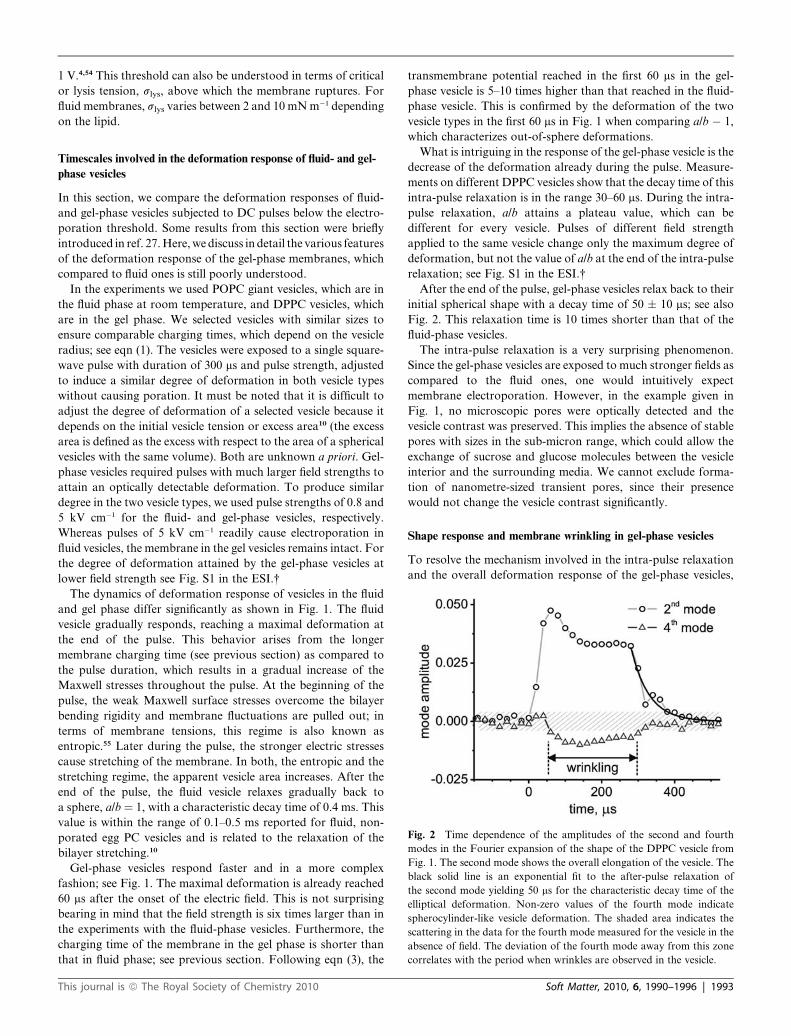
A careful inspection of the vesicle images revealed another
interesting phenomenon, namely the presence of stripe-like
shades on the surface of the DPPC vesicle. The stripes were
oriented parallel to the direction of the electric field; see the inset
in Fig. 3. In microscopy images, such stripes arise from the
wrinkling of the inspected surface.56 The wavelength of the
wrinkles, measured on different vesicles in our experiments,
varies between 5 and 8 mm.
Similar non-elliptical deformations and wrinkled surfaces have
been previously observed on polymer microcapsules in shear
flow56 but never on phospholipid membranes in the gel phase.
Vesicles in the fluid phase were reported to exhibit transient
wrinkling in a pulsatile elongation flow.57 However, this behavior
is of different nature, resulting from the adjustment of the
negative surface tension of the membrane to alternating stress.
Wrinkling of elastic sheets has been considered theoreti-
cally.33,58,59 According to Finken and Seifert,59 wrinkling occurs
above a certain membrane tension threshold sw ¼ (1/R)(Kak)1/2,
Fig. 3 Wrinkling of a DPPC vesicle during a DC pulse with field
strength of 4 kV cm�1, and duration of 300 ms. The inset shows a phase
contrast snapshot of the vesicle 200 ms after the beginning of the pulse.
The field direction is indicated with an arrow. A magnified and enhanced
section of the image is given in the upper left part of the inset, showing the
membrane wrinkling parallel to the electric field. The grey value intensity
from such a section is plotted and fitted with a sinusoidal function (black
solid curve). The corresponding wavelength of the wrinkles is about
6.6 mm as indicated on the plot.
1994 | Soft Matter, 2010, 6, 1990–1996
where Ka is the stretching elasticity modulus and k is the bending
rigidity of the lipid bilayer. Membranes in the gel phase are
characterized by Ka y 850 mN m�1,60 and a high bending
rigidity, k in the range of 15–20� 10�19 J.15,22–24 For a vesicle with
radius R ¼ 20 mm, the membrane should wrinkle at tension s $
sw y 6 � 10�2 mN m�1. The wrinkling wavelength l following
the estimates for flat sheets33 is l ¼ 2 (p2L2k/s)1/4, where L is the
characteristic length of the system, in our case L y 2R and s is
the membrane tension. For s ¼ sw, we obtain l y 9 mm. During
the pulse, the membrane tension increases; see eqn (3) and (4).
Thus, the wrinkles wavelength should decrease. In order of
magnitude, this estimate corresponds excellently to the wave-
lengths we measure. This suggests that the mechanism of vesicle
wrinkling is similar to that in elastic sheets subjected to stretch-
ing33 or in microcapsules exposed to shear flow.56
The amplitude of the wrinkles cannot be measured experi-
mentally. We can only speculate that it should be in the order of
the wavelength of the visible light, e.g. around 400–600 nm, for
the wrinkles to produce a pattern in the microscopy image.
Theoretically, the amplitude of the wrinkles, A, can be estimated
following the expression:33 A ¼ (l/p)(2D/W)1/2, where D is the
compressive transverse displacement and W is the width of
the stretched sheet. For our system D/W y 1 � b/a, which yields
the amplitude A y 0.5–1 mm for the wrinkles shown in Fig. 3.
The deformation mechanism of the vesicles in the gel phase can
be understood in view of the material properties of their
membranes. As indicated above, the bending rigidity of lipid
bilayers in the gel-phase is almost two orders of magnitude
higher than that of fluid-phase membranes.21–24 Thus, gel-phase
vesicles deform under much higher stresses and their membranes
do not fluctuate. The latter implies that the unperturbed gel-
phase membranes store only limited amounts of excess area, e.g.
in existing corrugations or out-of-plane ridges. The vesicle
elongation exhibited at the beginning of the pulse probably
results from straightening these corrugations and is, thus, rela-
tively weak. In comparison, fluid vesicles exposed to strong
pulses can exhibit deformations of up to 20% in a/b.10
Additionally, the stretching elasticity modulus of gel-phase
membranes is much higher than that of fluid membranes.60 This
implies that even larger stress is required to stretch the
membrane. Despite the increasing Maxwell stresses developed
during the pulse, the high stretching elasticity of the gel-phase
vesicle impedes further expansion of the apparent area by
stretching as observed for fluid vesicles.10 Instead of further
elongating, the gel-phase vesicle prefers to wrinkle in response to
the pulse.
Irreversible vesicle rupture at high field strength
We also explored the behavior of gel-phase vesicles exposed to
stronger DC pulses, which induce optically detectable poration.
The membrane rupture was identified by the loss of contrast of
the vesicles in the phase contrast images or detected membrane
integrity failure.
The example given in Fig. 4, illustrates a typical case of gel-
phase vesicle rupture. The GUV is initially spherical and with
good contrast, i.e. defect-free, as observed in phase contrast
microscopy (images not shown). With the pulse, the vesicle
cracks open expulsing part of the membrane away. At the same
This journal is ª The Royal Society of Chemistry 2010
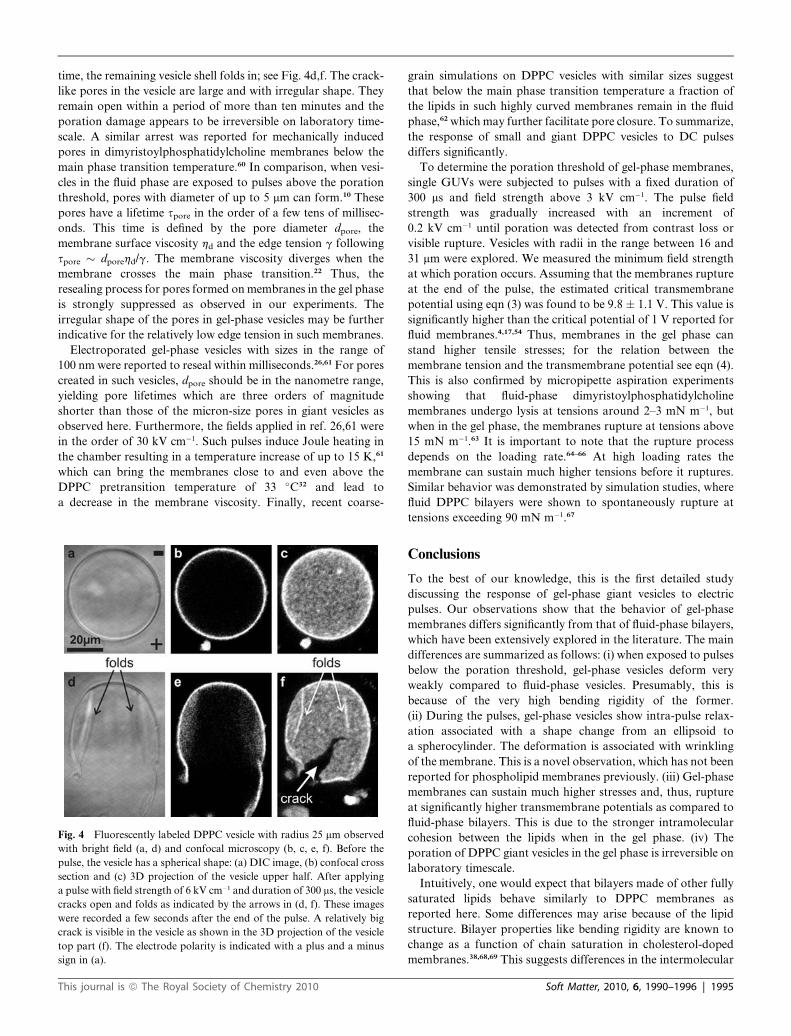
time, the remaining vesicle shell folds in; see Fig. 4d,f. The crack-
like pores in the vesicle are large and with irregular shape. They
remain open within a period of more than ten minutes and the
poration damage appears to be irreversible on laboratory time-
scale. A similar arrest was reported for mechanically induced
pores in dimyristoylphosphatidylcholine membranes below the
main phase transition temperature.60 In comparison, when vesi-
cles in the fluid phase are exposed to pulses above the poration
threshold, pores with diameter of up to 5 mm can form.10 These
pores have a lifetime spore in the order of a few tens of millisec-
onds. This time is defined by the pore diameter dpore, the
membrane surface viscosity hd and the edge tension g following
spore � dporehd/g. The membrane viscosity diverges when the
membrane crosses the main phase transition.22 Thus, the
resealing process for pores formed on membranes in the gel phase
is strongly suppressed as observed in our experiments. The
irregular shape of the pores in gel-phase vesicles may be further
indicative for the relatively low edge tension in such membranes.
Electroporated gel-phase vesicles with sizes in the range of
100 nm were reported to reseal within milliseconds.26,61 For pores
created in such vesicles, dpore should be in the nanometre range,
yielding pore lifetimes which are three orders of magnitude
shorter than those of the micron-size pores in giant vesicles as
observed here. Furthermore, the fields applied in ref. 26,61 were
in the order of 30 kV cm�1. Such pulses induce Joule heating in
the chamber resulting in a temperature increase of up to 15 K,61
which can bring the membranes close to and even above the
DPPC pretransition temperature of 33 �C32 and lead to
a decrease in the membrane viscosity. Finally, recent coarse-
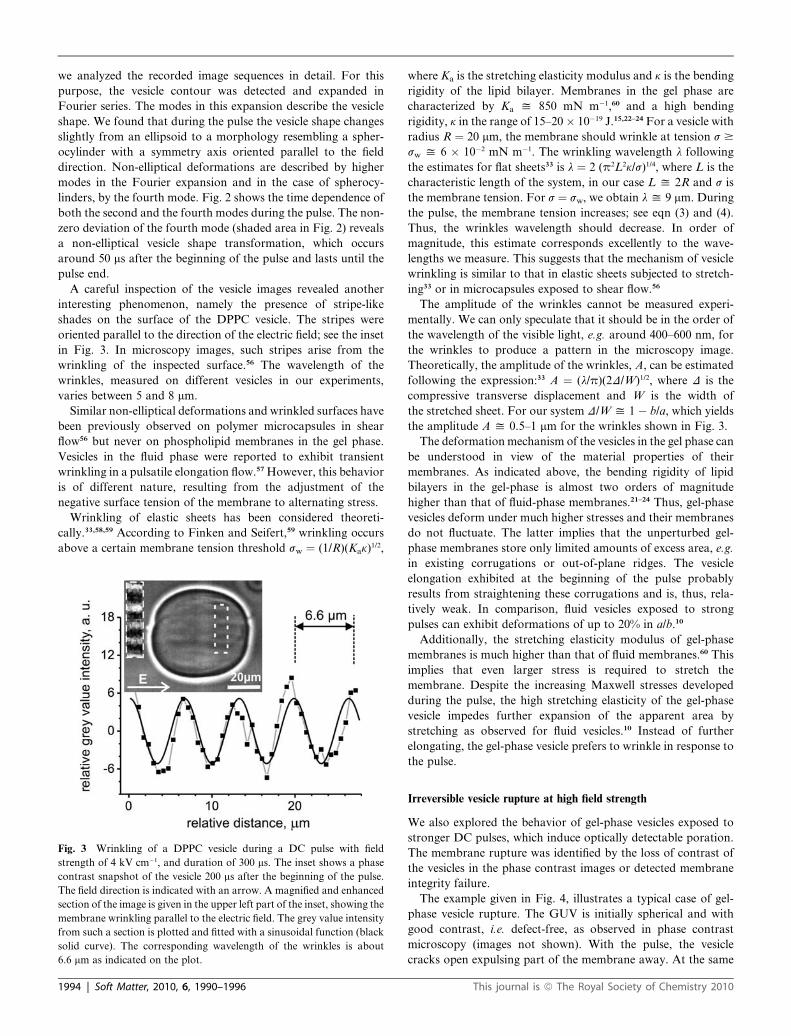
Fig. 4 Fluorescently labeled DPPC vesicle with radius 25 mm observed
with bright field (a, d) and confocal microscopy (b, c, e, f). Before the
pulse, the vesicle has a spherical shape: (a) DIC image, (b) confocal cross
section and (c) 3D projection of the vesicle upper half. After applying
a pulse with field strength of 6 kV cm�1 and duration of 300 ms, the vesicle
cracks open and folds as indicated by the arrows in (d, f). These images
were recorded a few seconds after the end of the pulse. A relatively big
crack is visible in the vesicle as shown in the 3D projection of the vesicle
top part (f). The electrode polarity is indicated with a plus and a minus
sign in (a).
This journal is ª The Royal Society of Chemistry 2010
grain simulations on DPPC vesicles with similar sizes suggest
that below the main phase transition temperature a fraction of
the lipids in such highly curved membranes remain in the fluid
phase,62 which may further facilitate pore closure. To summarize,
the response of small and giant DPPC vesicles to DC pulses
differs significantly.
To determine the poration threshold of gel-phase membranes,
single GUVs were subjected to pulses with a fixed duration of
300 ms and field strength above 3 kV cm�1. The pulse field
strength was gradually increased with an increment of
0.2 kV cm�1 until poration was detected from contrast loss or
visible rupture. Vesicles with radii in the range between 16 and
31 mm were explored. We measured the minimum field strength
at which poration occurs. Assuming that the membranes rupture
at the end of the pulse, the estimated critical transmembrane
potential using eqn (3) was found to be 9.8 � 1.1 V. This value is
significantly higher than the critical potential of 1 V reported for
fluid membranes.4,17,54 Thus, membranes in the gel phase can
stand higher tensile stresses; for the relation between the
membrane tension and the transmembrane potential see eqn (4).
This is also confirmed by micropipette aspiration experiments
showing that fluid-phase dimyristoylphosphatidylcholine
membranes undergo lysis at tensions around 2–3 mN m�1, but
when in the gel phase, the membranes rupture at tensions above
15 mN m�1.63 It is important to note that the rupture process
depends on the loading rate.64–66 At high loading rates the
membrane can sustain much higher tensions before it ruptures.
Similar behavior was demonstrated by simulation studies, where
fluid DPPC bilayers were shown to spontaneously rupture at
tensions exceeding 90 mN m�1.67
Conclusions
To the best of our knowledge, this is the first detailed study
discussing the response of gel-phase giant vesicles to electric
pulses. Our observations show that the behavior of gel-phase
membranes differs significantly from that of fluid-phase bilayers,
which have been extensively explored in the literature. The main
differences are summarized as follows: (i) when exposed to pulses
below the poration threshold, gel-phase vesicles deform very
weakly compared to fluid-phase vesicles. Presumably, this is
because of the very high bending rigidity of the former.
(ii) During the pulses, gel-phase vesicles show intra-pulse relax-
ation associated with a shape change from an ellipsoid to
a spherocylinder. The deformation is associated with wrinkling
of the membrane. This is a novel observation, which has not been
reported for phospholipid membranes previously. (iii) Gel-phase
membranes can sustain much higher stresses and, thus, rupture
at significantly higher transmembrane potentials as compared to
fluid-phase bilayers. This is due to the stronger intramolecular
cohesion between the lipids when in the gel phase. (iv) The
poration of DPPC giant vesicles in the gel phase is irreversible on
laboratory timescale.
Intuitively, one would expect that bilayers made of other fully
saturated lipids behave similarly to DPPC membranes as
reported here. Some differences may arise because of the lipid
structure. Bilayer properties like bending rigidity are known to
change as a function of chain saturation in cholesterol-doped
membranes.38,68,69 This suggests differences in the intermolecular
Soft Matter, 2010, 6, 1990–1996 | 1995
interactions as a function of the lipid architecture. Whether this
would have an effect on the electro-deformation and -poration of
vesicles remains to be clarified.
Acknowledgements
We acknowledge P. Vlahovska, U. Seifert and V. Knecht for the
helpful and stimulating discussions.
Notes and references
1 E. Neumann, A. E. Sowers and C. Jordan, Electroporation andelectrofusion in cell biology, Plenum, New York, 1989.
2 D. C. Chang, B. M. Chassy, J. A. Saunders and A. E. Sowers, Guide toelectroporation and electrofusion, Academic Press, San Diego, 1992.
3 U. Zimmermann and G. A. Neil, Electromanipulation of cells, CRCPress, Boca Raton, 1996.
4 J. C. Weaver and Y. A. Chizmadzhev, Bioelectrochem. Bioenerg.,1996, 41, 135–160.
5 J. Teissie, M. Golzio and M. P. Rols, Biochim. Biophys. Acta, Gen.Subj., 2005, 1724, 270–280.
6 R. Dimova, in Advanced electroporation techniques in biology andmedicine, ed. A. G. Pakhomov, D. Miklavcic and M. S. Markov,CRC Press, Boca Raton, Chapter 5, in press.
7 E. Neumann, K. Toensing, S. Kakorin, P. Budde and J. Frey,Biophys. J., 1998, 74, 98–108.
8 T. Griese, S. Kakorin and E. Neumann, Phys. Chem. Chem. Phys.,2002, 4, 1217–1227.
9 S. Kakorin and E. Neumann, Colloids Surf., A, 2002, 209, 147–165.10 K. A. Riske and R. Dimova, Biophys. J., 2005, 88, 1143–1155.11 K. A. Riske and R. Dimova, Biophys. J., 2006, 91, 1778–1786.12 W. Harbich and W. Helfrich, Z. Naturforsch., A: Phys. Sci., 1979, 34,
1063–1065.13 D. V. Zhelev and D. Needham, Biochim. Biophys. Acta, Biomembr.,
1993, 1147, 89–104.14 E. Tekle, R. D. Astumian, W. A. Friauf and P. B. Chock, Biophys. J.,
2001, 81, 960–968.15 R. Dimova, S. Aranda, N. Bezlyepkina, V. Nikolov, K. A. Riske and
R. Lipowsky, J. Phys.: Condens. Matter, 2006, 18, S1151–S1176.16 R. Dimova, K. A. Riske, S. Aranda, N. Bezlyepkina, R. L. Knorr and
R. Lipowsky, Soft Matter, 2007, 3, 817–827.17 D. Needham and R. M. Hochmuth, Biophys. J., 1989, 55, 1001–1009.18 K. T. Powell and J. C. Weaver, Bioelectrochem. Bioenerg., 1986, 15,
211–227.19 T. Portet, F. C. I. Febrer, J. M. Escoffre, C. Favard, M. P. Rols and
D. S. Dean, Biophys. J., 2009, 96, 4109–4121.20 K. A. Riske, R. L. Knorr and R. Dimova, Soft Matter, 2009, 5, 1983–
1986.21 T. Heimburg, Biochim. Biophys. Acta, Biomembr., 1998, 1415, 147–
162.22 R. Dimova, B. Pouligny and C. Dietrich, Biophys. J., 2000, 79, 340–
356.23 C. H. Lee, W. C. Lin and J. P. Wang, Phys. Rev. E: Stat., Nonlinear,
Soft Matter Phys., 2001, 64, 020901.24 K. R. Mecke, T. Charitat and F. Graner, Langmuir, 2003, 19, 2080–
2087.25 J. F. Nagle and S. Tristram-Nagle, Biochim. Biophys. Acta, 2000,
1469, 159–195.26 J. Teissie and T. Y. Tsong, Biochemistry, 1981, 20, 1548–1554.27 R. Dimova, N. Bezlyepkina, M. D. Jordo, R. L. Knorr, K. A. Riske,
M. Staykova, P. M. Vlahovska, T. Yamamoto, P. Yang andR. Lipowsky, Soft Matter, 2009, 5, 3201–3212.
28 M. Thurk and D. Porschke, Biochim. Biophys. Acta, Biomembr., 1991,1067, 153–158.
1996 | Soft Matter, 2010, 6, 1990–1996
29 I. P. Sugar, Biochim. Biophys. Acta, Biomembr., 1979, 556, 72–85.30 J. Goerke, Biochim. Biophys. Acta, 1998, 1408, 79–89.31 A. N. Hunt, G. T. Clark, G. S. Attard and A. D. Postle, J. Biol.
Chem., 2001, 276, 8492–8499.32 C. B. Fox, R. H. Uibel and J. M. Harris, J. Phys. Chem. B, 2007, 111,
11428–11436.33 E. Cerda and L. Mahadevan, Phys. Rev. Lett., 2003, 90, 074302.34 M. I. Angelova and D. S. Dimitrov, Faraday Discuss. Chem. Soc.,
1986, 81, 303–311.35 H. V. Ly and M. L. Longo, Macromol. Symp., 2005, 219, 97–122.36 S. Aranda, K. A. Riske, R. Lipowsky and R. Dimova, Biophys. J.,
2008, 95, L19–L21.37 M. Staykova, R. Lipowsky and R. Dimova, Soft Matter, 2008, 4,
2168–2171.38 R. S. Gracia, N. Bezlyepkina, R. L. Knorr, R. Lipowsky and
R. Dimova, Soft Matter, in press, DOI: 10.1039/B920629A.39 J. Pecreaux, H. G. Dobereiner, J. Prost, J. F. Joanny and
P. Bassereau, Eur. Phys. J. E, 2004, 13, 277–290.40 K. Kinosita, I. Ashikawa, N. Saita, H. Yoshimura, H. Itoh,
K. Nagayama and A. Ikegami, Biophys. J., 1988, 53, 1015–1019.41 R. Pethig and D. B. Kell, Phys. Med. Biol., 1987, 32, 933–970.42 E. Neher and A. Marty, Proc. Natl. Acad. Sci. U. S. A., 1982, 79,
6712–6716.43 N. Fidler and J. M. Fernandez, Biophys. J., 1989, 56, 1153–1162.44 R. Benz and K. Janko, Biochim. Biophys. Acta, Biomembr., 1976, 455,
721–738.45 S. Ohki, Biophys. J., 1969, 9, 1195–1205.46 A. G. Petrov and V. S. Sokolov, Eur. Biophys. J., 1986, 13, 139–155.47 K. L. Chan, P. R. C. Gascoyne, F. F. Becker and R. Pethig, Biochim.
Biophys. Acta, Lipids Lipid Metab., 1997, 1349, 182–196.48 J. Z. Bao, C. C. Davis and R. E. Schmukler, Biophys. J., 1992, 61,
1427–1434.49 M. A. Stuchly, S. S. Stuchly, R. P. Liburdy and D. A. Rousseau, Phys.
Med. Biol., 1988, 33, 1309–1324.50 K. Tu, D. J. Tobias, J. K. Blasie and M. L. Klein, Biophys. J., 1996,
70, 595–608.51 A. Carruthers and D. L. Melchior, Biochemistry, 1983, 22, 5797–5807.52 D. B. Kell and C. M. Harris, Eur. Biophys. J., 1985, 12, 181–197.53 I. G. Abidor, V. B. Arakelyan, L. V. Chernomordik,
Y. A. Chizmadzhev, V. F. Pastushenko and M. R. Tarasevich,Bioelectrochem. Bioenerg., 1979, 6, 37–52.
54 T. Y. Tsong, Biophys. J., 1991, 60, 297–306.55 E. Evans and W. Rawicz, Phys. Rev. Lett., 1990, 64, 2094–2097.56 A. Walter, H. Rehage and H. Leonhard, Colloids Surf., A, 2001,
183–185, 123–132.57 V. Kantsler, E. Segre and V. Steinberg, Phys. Rev. Lett., 2007, 99,
178102.58 E. Cerda, K. Ravi-Chandar and L. Mahadevan, Nature, 2002, 419,
579–580.59 R. Finken and U. Seifert, J. Phys.: Condens. Matter, 2006, 18, L185–
L191.60 D. Needham and E. Evans, Biochemistry, 1988, 27, 8261–8269.61 E. M. Elmashak and T. Y. Tsong, Biochemistry, 1985, 24, 2884–2888.62 H. J. Risselada and S. J. Marrink, Soft Matter, 2009, 5, 4531–4541.63 E. Evans and D. Needham, J. Phys. Chem., 1987, 91, 4219–4228.64 E. Evans, V. Heinrich, F. Ludwig and W. Rawicz, Biophys. J., 2003,
85, 2342–2350.65 E. Evans and V. Heinrich, C. R. Phys., 2003, 4, 265–274.66 P. A. Boucher, B. Joos, M. J. Zuckermann and L. Fournier, Biophys.
J., 2007, 92, 4344–4355.67 H. Leontiadou, A. E. Mark and S. J. Marrink, Biophys. J., 2004, 86,
2156–2164.68 J. Pan, S. Tristram-Nagle, N. Kucerka and J. F. Nagle, Biophys. J.,
2008, 94, 117–124.69 J. J. Pan, T. T. Mills, S. Tristram-Nagle and J. F. Nagle, Phys. Rev.
Lett., 2008, 100, 198103.
This journal is ª The Royal Society of Chemistry 2010