Development of advanced phospholipid vesicles loaded with ...
41
1 Development of advanced phospholipid vesicles loaded with Lippia citriodora pressurized liquid extract for the treatment of gastrointestinal disorders Names: Francisco-Javier Leyva-Jiménez a , Maria Letizia Manca b , Maria Manconi b , Carla Caddeo b , José Antonio Vázquez c , Claudia Carbone d , Jesús Lozano-Sánchez a,e , David Arráez-Román a,f , Antonio Segura-Carretero a,f a Functional Food Research and Development Center, Health Science Technological Park, Avenida del Conocimiento 37, E-18100 Granada, Spain b Department Scienze della Vita e dell’Ambiente, University of Cagliari, via Ospedale 72, 09124 Cagliari, Italy c Group of Recycling and Valorization of Waste Materials (REVAL), Marine Research Institute (IIM-CSIC), C/Eduardo Cabello, 6, CP36208, Vigo, Spain d Department of Drug Sciences, University of Catania, viale A. Doria 6, 95125 Catania, Italy e Department of Food Science and Nutrition, University of Granada, Campus of Cartuja, 18071 Granada, Spain f Department of Analytical Chemistry, Faculty of Sciences, University of Granada, Fuentenueva s/n, E-18071 Granada, Spain * Author to whom correspondence should be addressed: E-mail: [email protected] Mailing Address: Department of Food Science and Nutrition, University of Granada, Campus of Cartuja, 18071 Granada, Spain Tel.: +34-958-637083
-
Upload
khangminh22 -
Category
Documents
-
view
0 -
download
0
Transcript of Development of advanced phospholipid vesicles loaded with ...
1
Development of advanced phospholipid vesicles loaded with Lippia citriodora
pressurized liquid extract for the treatment of gastrointestinal disorders
Names: Francisco-Javier Leyva-Jiménez a, Maria Letizia Manca b, Maria Manconi b,
Carla Caddeo b, José Antonio Vázquez c, Claudia Carbone d, Jesús Lozano-Sánchez a,e,
David Arráez-Román a,f, Antonio Segura-Carretero a,f
a Functional Food Research and Development Center, Health Science Technological
Park, Avenida del Conocimiento 37, E-18100 Granada, Spain
b Department Scienze della Vita e dell’Ambiente, University of Cagliari, via Ospedale
72, 09124 Cagliari, Italy
c Group of Recycling and Valorization of Waste Materials (REVAL), Marine Research
Institute (IIM-CSIC), C/Eduardo Cabello, 6, CP36208, Vigo, Spain
d Department of Drug Sciences, University of Catania, viale A. Doria 6, 95125 Catania,
Italy
e Department of Food Science and Nutrition, University of Granada, Campus of
Cartuja, 18071 Granada, Spain
f Department of Analytical Chemistry, Faculty of Sciences, University of Granada,
Fuentenueva s/n, E-18071 Granada, Spain
* Author to whom correspondence should be addressed:
E-mail: [email protected]
Mailing Address: Department of Food Science and Nutrition, University of Granada,
Campus of Cartuja, 18071 Granada, Spain
Tel.: +34-958-637083

2
Declarations of interest: none
Abstract
Pressurized liquid extraction was performed to obtain a phytocomplex from Lippia
citriodora leaves rich in bioactive compounds. The extract was loaded in phospholipid
vesicles to improve its protective effect against oxidative stress in the intestine. The
phytochemicals were identified and quantified by HPLC-ESI-TOF-MS. The extract was
incorporated in liposomes and penetration enhancer-containing vesicles (PEVs) modified
with glucidex, a dextrin, and a biopolymer obtained from Chimaera monstrosa. The PEVs
were smaller than liposomes (~150 vs 370 nm) and more stable, according to accelerated
aging tests. The integrity of the vesicles in acidic or neutral pH and high ionic strength or
in milk whey was assessed. The cytocompatibility of the formulations and their ability to
protect Caco-2 cells against oxidative stress were confirmed in vitro and compared with
two commercial extracts of L. citriodora. The results confirmed the suitability of
formulations to be used in functional foods to protect the intestine from oxidative stress.
Keywords: Lippia citriodora, green extracts, phospholipid vesicles, antioxidant
activity, Caco-2 cells, oral delivery.

3
1. Introduction
For centuries, oral administration has been the preferred route for drugs, since it is
safe, easy, effective and well accepted by patients. Similarly, in traditional medicine,
herbal formulations have been widely orally administered to exert systemic or local effect
at the gastro-intestinal level. Herbal formulations are usually rich in phenolic compounds,
which are being claimed as a therapeutic alternative to synthetic drugs in the prevention
or amelioration of several disorders (Melo et al., 2018; Yelumalai, Giribabu, Karim,
Omar, & Salleh, 2019). Phenolic compounds are secondary metabolites produced by
plants as a defence mechanism against diverse stress conditions (Bravo, Sources, &
Significance, 2009). They can address several beneficial effects at local and systemic
level after oral administration. However, their actual efficacy is hampered by some
limitations (Chandrasekara & Shahidi, 2012; Crozier, Del Rio, & Clifford, 2010; Liazid,
Palma, Brigui, & Barroso, 2007). Moreover, the amounts found in plants are generally
much lower than those necessary to produce a beneficial effect in humans, because most
of them are poor water soluble and consequently low bioavailable. In addition, some
phenolic compounds, such as tannins, can provide undesirable organoleptic properties as
a result of hydrogen bonding with lubricant salivary proteins and induced astringent
flavour (Gombau et al., 2019).
Aiming at improving the extraction yield and efficacy of phenolic compounds,
advanced technological strategies have been developed (Gilbert-López, Barranco,
Herrero, Cifuentes, & Ibáñez, 2017; Mendes et al., 2016). In order to optimize the
extraction procedure, several alternative methods have been proposed, such as
microwave-assisted extraction, ultrasound-assisted extraction or supercritical fluid
extraction (Ameer, Shahbaz, & Kwon, 2017; Pimentel-Moral et al., 2018). In recent years,
pressurized liquid extraction (PLE) has been considered as a fast-advanced extraction

4
technique. It is based on the application of high temperatures and high pressures that lead
to a modification of the dielectric constant of solvents and the production of high-quality
enriched extracts (Gonçalves et al., 2018). This technology is broadly used to obtain
phenolic compounds from botanical sources, since it allows the extraction of a wide range
of compounds with different polarities (Gomes et al., 2017; Pereira, Tarone, Cazarin,
Barbero, & Martínez, 2019).
At the same time, several delivery systems have been developed to overcome the poor
bioavailability of phenolic compounds (Fang & Bhandari, 2010) by loading in micro- or
nano-particles (González et al., 2019). In previous studies, liposomes or modified
phospholipid vesicles showed promising performances in improving the local and
systemic efficacy of phenolic compounds after oral administration (Manconi et al., 2019).
In addition, they are highly biocompatible given their similarity to cell membranes, and
can simultaneously load hydrophobic and hydrophilic compounds, either in the lipid
bilayer or in the aqueous core (He et al., 2019). Recently, penetration enhancer-containing
vesicles (PEVs) were developed by adding a penetration enhancer that is expected to
promote the diffusion of the vesicles through the biological barriers (Manconi et al., 2011)
and the uptake of payload by the cells (Manca et al., 2013). Gastro-intestinal fluids, such
as gastric acid, bile salts and pancreatic juice, may destabilise the structure of liposomes,
which in turn can cause an early release of the loaded phenolic compounds with a
consequent reduction in absorption and constraining their bioactivity (Hu et al., 2013).
Phospholipid vesicles can be modified by adding fibres or polymers to improve their
stability and mucoadhesion (Hosny, Ahmed, & Al-Abdali, 2013; Rezvani et al., 2019).
Therefore, the aim of this work was to load an optimized extract of L. citriodora
obtained by PLE in modified phospholipid vesicles to enhance its protective effect in the
intestine against oxidative stress. To achieve this goal, the extract was incorporated in

5
liposomes (used as a reference) and PEVs modified with glucidex, a maltodextrin, and a
biopolymer obtained from Chimaera monstrosa, a Mediterranean species of fish in the
Chimaeridae family. The physico-chemical characterization of the vesicles was
performed to estimate the average size, homogeneity and surface charge. Moreover, the
integrity of the vesicles was assessed in media at acidic and neutral pH, as well as in milk
whey. Finally, the protective effects of the formulations against oxidative stress was
evaluated in Caco-2 cells, in comparison with the raw PLE extract and two commercial
extracts of L. citriodora.
2. Material and methods
2.1. Reagents
The extraction process was performed using a mixture of Milli-Q water and ethanol
(VWR chemicals, Radnor, PA, US). The HPLC-ESI-TOF/MS analysis was carried out
using formic acid and acetonitrile LC-MS grade provided by Sigma-Aldrich (Steinheim,
Germany) and Fisher chemicals (Waltham, MA, US), respectively. Loganic acid,
kaempferol-3-glucoside, quercetin and verbascoside were used as standards to build
calibration curves; apigenin was used as an internal standard. They were purchased from
Extrasynthese (Genay Cedex, France), Fluka or Sigma-Aldrich (Steinheim, Germany).
2,2-diphenyl-1-picrylhydrazyl (DPPH) was purchased from Sigma-Aldrich (Milan,
Italy). Commercial extract of L. citriodora, called PLX enriched with 10 and 30% of
verbascoside, were provided by Monteloeder (Elche, Spain).
For the preparation of the vesicles, soy phosphatidylcholine (Phospholipon® P90G,
P90G) was purchased from Lipoid GmbH (Ludwigshafen, Germany); propylene glycol
was purchased from Galeno (Carmignano, PO, Italy); glucidex®9 (a maltodextrin, 9
dextrose equivalent) was kindly provided by Roquette (Lestrem, France) and chondroitin

6
sulphate was obtained from cartilage by-product of rabbit fish (Chimaera monstrosa)
according to the processes described by Vázquez et al. (Vázquez et al., 2019). The cell
medium, foetal bovine serum, penicillin, and streptomycin were purchased from Life
Technologies Europe (Monza, Italy).
2.2. Optimal extraction by using pressurized liquid extraction
The dried botanical matrix, L. citriodora kunth, was provided by Monteloeder (Alicante,
Spain) and grounded by an ultra-centrifugal mill ZM200 (Retsch GmbH, Haan, Germany)
to enhance the recovery of phenolic compounds. Grounded leaves were stored and
protected from humidity and light until extraction processes. An Accelerate Solvent
Extraction (ASE™ 350, Dionex, Sunnyvale, CA, USA) system equipped with a solvent
controller was used to recover the phenolic fraction from L. citriodora. The pressurized
liquid extraction procedure was performed as previously reported by Leyva-Jimenez et
al., 2018 (Leyva-Jiménez, Lozano-Sánchez, Borrás-Linares, Arráez-Román, & Segura-
Carretero, 2018). The extraction parameters were set as follows: 177 ºC, 77% ethanol and
3 min of static cycle in order to obtain the maximum recovery of polar compounds from
L. citriodora.
2.3. Quantitative analysis by HPLC-ESI-TOF/MS
The analytical assay was performed on PLE extract in comparison with two
commercial extracts of L. citriodora, called PLX: one enriched with 10% verbascoside
and another with 30% verbascoside (Monteloeder, Spain). The analytical characterization
of the polar compounds was carried out preparing a stock solution of each extract (5
mg/mL): PLE was dissolved in 50:50 water/ethanol (v/v) and commercial extracts were
dissolved in water. The solutions were vortexed for 1 min and filtered through a 0.2 µm
PTFE or cellulose filter.

7
Chromatographic analyses were carried out by a RRLC 1200 series (Agilent
Technologies, Palo Alto, CA, US) equipped with four different modules: a vacuum
degasser, an autosampler, a binary pump and a DAD detector. A Zorbax Eclipse Plus C18
(150 x 4.6 mm id, 1.8 µm; Agilent Technologies, Palo Alto, CA, US) was used. The
chromatographic separations of polar compounds were made by means of a previously
validated multistep gradient where the mobile phase consisted of water: acetonitrile
(90:10 v:v) with 0.1% formic acid (A) and acetonitrile (B), for 35 min. The injection
volume was 10 µL (Leyva-Jiménez et al., 2018). The LC was coupled to a TOF mass
spectrometer (Bruker Daltonik, Bremen, Germany) equipped with an orthogonal
electrospray (ESI) interface (model G1607 from Agilent Technologies, Palo Alto, CA,
US) working in negative ionization mode. The mass detection was performed in a 50-
1000 m/z range. The source parameters were fitted to a previous work (Leyva-Jiménez et
al., 2018).
The information provided by the HPLC-ESI-TOF-MS was evaluated using
DataAnalysis 4.0 software (Bruker Daltonics, Bremen, Germany), which enhanced the
qualitative and quantitative characterization of polar compound of extracts. On one hand,
the qualitative characterization was determined by an interpretation of their mass spectra
provided by the analytical platform and the information available in the literature. On the
other hand, the quantitative analyses were made developing four different calibration
curves using the standards previously mentioned. It is necessary to remark that apigenin
was used as internal standard (25 µg/mL), for this reason the calibration curves were built
by plotting the standard concentration as a function of the peak area given by the
analytical platform (area standard/ area internal standard). The concentration of the
compounds contained in the extracts was calculated by interpolation of their areas/area
internal standard ratio in the corresponding calibration curve. Phenylpropanoids were

8
quantified using the verbascoside curve and loganic acid curve was used to quantify all
iridoids glycosides. Kaempferol-3-glucoside curve was used to determine the
concentration of luteolin-7-diglucuronide, chrysoeriol-7-diglucuronide, apigenin-7-
diglucuronide, acacetin-7-diglucuronide and methyl quercetin glucuronide and finally,
quercetin curve was used to quantify the other flavonoids. The quantitation was
performed according to similar structures, wherefore the concentration (mg of analyte per
g of L. citriodora extract) was only an estimation of their real concentration.
2.4. Vesicle formulation
Different formulations were prepared by using P90G (180 mg/mL), L. citriodora
extract (50 mg/mL), glucidex (100 mg/mL) and chondroitin (10 mg/mL), according to
the compositions reported in Supporting information Table 1. The solid components were
weighed in a glass vial and dispersed in 2 mL of water to prepare liposomes, or 2 mL of
a mixture of water and propylene glycol (75:25 v/v) to prepare PG-PEVs. The dispersions
were sonicated with a Soniprep 150 ultrasonic disintegrator (MSE Crowley, London, UK)
at an amplitude of 14 microns (25 cycles, 5 s ON and 2 s OFF). Each formulation was
prepared in triplicate and kept in the dark at 4 ºC. As references, empty vesicles were also
prepared.
2.5. Vesicle characterization
The vesicles were analysed by using a Zetasizer nano (Malvern Instruments,
Worcestershire, UK) in order to determine the average diameter and polydispersity index.
These parameters were evaluated by Photon Correlation Spectroscopy, whereas Zeta
potential was estimated by Electrophoretic Light Scattering, which measures the
electrophoretic mobility of particles in dispersion. Prior to the analyses, the samples (100
µL) were diluted with water up to 10 mL.

9
In order to determine the entrapment efficiency, the formulations were dialyzed
loading 1 mL of each formulation in Spectra/Por® membranes (12-14kDa MW cut-off,
Spectrum Laboratories Inc., Rancho Dominguez, USA) and dialysing against water (2 L)
for 2 h at 25 ºC, refreshing water after 1 h. The volume of water used (4 L in total) was
theoretically able to dissolve and remove the unentrapped components of the extract. The
experiment was done in triplicate. Thereafter, the DPPH test was performed with the
purpose of determining the antioxidant activity (AA) in dialyzed and non-dialyzed
samples. Each sample was diluted with methanol (1:50), and 60 l of the diluted samples
was mixed with 1940 l of a DPPH methanolic solution (40 g/ml), and incubated for 30
min at room temperature, in the dark. The absorbance (ABS) was measured at 517 nm
against blank. The antioxidant activity was calculated according to Equation 1:
𝐴𝐴% =𝐴𝐵𝑆 − 𝐴𝐵𝑆
𝐴𝐵𝑆 𝑥 100
Eq.1
Percentage of entrapment efficiency (EE%) was calculated as a function of AA%
according to Equation 2:
𝐸𝐸% =𝐴𝐴%
𝐴𝐴% 𝑥 100
Eq. 2
2.6. Accelerated stability by Turbiscan® Ageing Station
The Turbiscan® Ageing Station (Formulaction, l’Union, France) was used to evaluate
the physical stability of the vesicle dispersions, which were placed in a cylindrical glass
cell in the Ageing Station for 30 days at 25 ± 1 °C. The detection head is composed of a
pulsed near-infrared light source (λ = 880 nm) and two synchronous transmission and
back scattering detectors. The transmission detector receives the light, which crosses the

10
sample (at 180° from the incident beam), while the back scattering detector takes the light
scattered backwards by the sample (at 45° from the incident beam). The detection head
scans the entire length of the sample cell (65 mm), acquiring transmission and back
scattering each 40 mm (1625 acquisitions per scan). In our experiments, the stability of
the samples was compared by means of the Turbiscan Stability Index, which gives
information about destabilization kinetics.
2.7. Vesicle stability in acid and neutral media with high ionic strength
Two different media, acidic (pH 1.2) and neutral (pH 7.0), with high ionic strength,
were prepared to simulate the gastro-intestinal environment of stomach and small
intestine. The vesicle dispersions were diluted with the media (1:100 v/v) and incubated
for 2 h with the acidic medium, and for 6 h with the neutral medium, at 37 ºC, in the
presence of sodium chloride (0.3 M), which was added to increase the ionic strength. The
changes in size, polydispersity index and zeta potential were monitored immediately after
dilution and at the end of the experiments.
2.8. Biocompatibility tests in Caco-2 cells
The biocompatibility of extract formulations was evaluated in Caco-2 cells and
compared with that of PLE and two commercial extracts in solution. With the purpose of
achieving an exponential growth of cells, Dulbecco’s Modified Eagle Medium (DMEM)
with high glucose and L-glutamine, and supplemented with penicillin-streptomycin (1%),
and foetal bovine serum (10%) was used. The cells were incubated in 75 cm2 flasks in
5% CO2 and 100% humidity atmosphere at 37 ºC until confluence was reached.
Caco-2 cells were seeded in 96-well plates (7.5x10³ cells/well) and incubated for 24 h.
The cells were exposed for 48 h to the extract solutions or vesicle formulations properly
diluted to achieve the desired concentrations (50, 5, 0.5 and 0.05 µg/mL of extract). The
3(4,5-dimethylthiazolyl-2)-2, 5-diphenyltetrazolium bromide (MTT) colorimetric assay
11
was performed to determine cell viability. The cells were washed with fresh medium, 100
µL of MTT (0.5 mg/mL final concentration) was added and removed after 3 h. Then, 100
µL of dimethyl sulfoxide was added to dissolve the formazan crystals and the absorbance
was read spectrophotometrically at 570 nm with a microplate reader (Synergy 4, Reader
BioTek Instruments, AHSI S.P.A, Bernareggio, Italy). The results are shown as a
percentage of live cells in comparison with untreated control cells (100% viability).
2.9. Antioxidant activity in Caco-2 cells
The protective effect of L. citriodora extract loaded vesicles against oxidative stress
was assessed in Caco-2 cells. The cells (7.5x10³ cells/well) were seeded in 96-well plates
and after 24 h, oxidative stress was induced by adding hydrogen peroxide (1:50000 v/v
dilution in PBS) in the absence (positive control) or presence of extract solutions or
extract loaded vesicles at the final concentrations of 5 and 0.5 µg/mL. After 4 h, the cells
were washed with fresh medium and the MTT assay was performed to assess cell survival
following the treatment with the samples. Untreated cells (100% viability) were used as
a negative control, and cells exposed to hydrogen peroxide only were used as a positive
control. The cell viability was expressed as a percentage of untreated cells (100%
viability).
2.10. Statistical analysis
SPSS v. 15 was used to analyse data by a one-way analysis of variance (ANOVA) at
a 95% confidence level (p ≤ 0.05) with the purpose of determining the statistically
significant differences among the samples.
3. Results
3.1. Comparative characterization of pressurized liquid extract and commercial
extracts by HPLC-ESI-TOF-MS

12
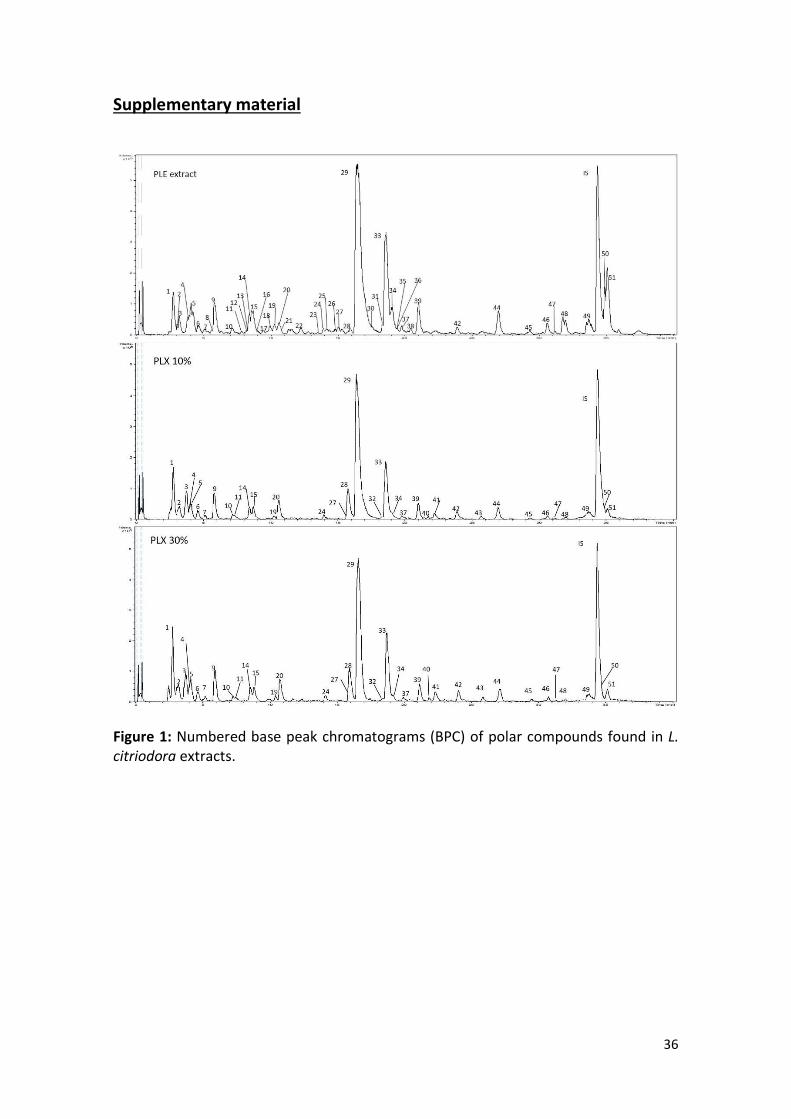
The L. citriodora extract obtained under optimized conditions reported by Leyva et
al. (Leyva-Jiménez et al., 2018) was analysed by HPLC-ESI-TOF-MS and compared with
two commercial L. citriodora extracts containing 10% and 30% of verbascoside. The base
peak chromatograms (BPC) are shown in Supplementary Material Figure 1. The
identification of the extract components was based on the combination of the
interpretation of mass spectroscopy data and the information available in the literature, as
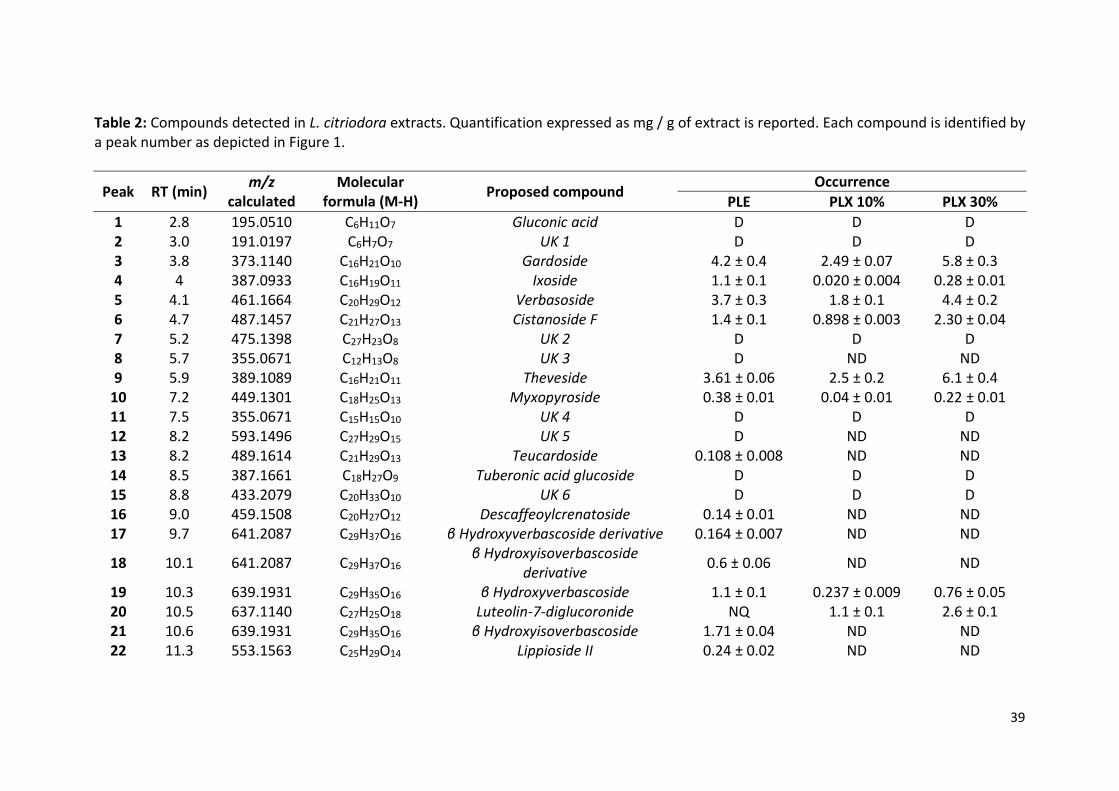
shown in Supplementary material Table 2. The table summarizes the retention times
(min), calculated m/z, deprotonated molecular formula, the amounts found in the extracts,
and a tentative identification of the components. The numbering of the compounds was
made according to the elution order.
A total of 51 different compounds were detected: 8 were not identified (unknown;
UK) and the other 43 compounds were classified into four different groups according to
their chemical structures: iridoid glycosides, flavonoids, phenylpropanoids and other
polar compounds.
Twelve iridoid glycosides were found in PLE. Teucardoside (peak 13), lippioside II
(peak 22), lippioside I and its derivative (peak 26 and 25, respectively),
hydroxycampsiside (peak 35), lippianoside B (peak 36) and durantoside A (peak 38) were
not detected in the commercial extracts. On the other hand, ixoside (peak 4) and
myxospyroside (peak 10) were identified for the first time in the commercial extracts.
Manuleoside H (peak 47) was found in all the extracts. In quantitative terms, theveside
(peak 9) and gardoside (peak 3) were the most abundant iridoid glycosides, especially in
PLX 30% (6.1 and 5.8 mg /g extract, respectively). The total iridoid glycosides content
varied as a function of the extract: it was 12.4 mg/g for commercial extract containing
30% of verbascoside, 10.8 mg/g for PLE and 5.1 mg/g for commercial extract containing
30% of verbascoside.

13
Flavonoids were a heterogeneous group including two classes: glucuronic derivatives
and aglycones. A total of eight flavonoids were tentatively identified, five of which were
glucuronic derivatives (peaks 20, 24, 28, 32 and 42) and three were aglycones (peaks 48,
50 and 51). Most of the flavonoids were identified in previous works (Cádiz-Gurrea et
al., 2018; Leyva-Jiménez et al., 2018; Quirantes-Piné, Arráez-Román, Segura-Carretero,
& Fernández-Gutiérrez, 2010). On the other hand, peak 32, which gave a deprotonated
molecular formula C22H19O13, was tentatively identified for the first time in L. citriodora
as methyl quercetin glucuronide. It was found in both commercial extracts containing
10% and 30% of verbascoside. It has to be noted that glucuronic derivatives were found
in higher amounts in the commercial extracts, whereas aglycones were predominant in
PLE. Chrysoeriol-7-diglucuronide was the most abundant glucuronic derivative in
commercial extracts containing 10% and 30% of verbascoside (2 and 4.6 mg/g of extract,
respectively). On the other hand, given the extraction conditions used to obtain PLE,
dimethyl quercetin was the most abundant flavonoid (3.2 mg/g of extract). The total
flavonoids content varied as a function of the extract: it was 8.0, 5.4 and 3.3 mg/g in
commercial extract containing 30% of verbascoside, PLE and extract containing 10% of
verbascoside, respectively, thus showing the same trend as for iridoid glycosides.
Phenylpropanoids were the widest chemical group, as they included 19 compounds,
all of which found in PLE, and only 12 in the commercial extracts. Compounds originated
because of PLE process (Leyva-Jiménez et al., 2018), such as β-hydroxyverbascoside
derivatives (peaks 17 and 18) and oxoverbascoside (peak 23) as well as
descaffeoylcrenatoside (peak 16), β-hydroxyisoverbascoside (peak 21), lariciresinol
glucopyranoside (peak 30) and verbascoside A (peak 31), were not detected in the
commercial extracts. As expected, verbascoside (peak 29) was the most abundant
compound in the three extracts. Unexpectedly, PLE contained the highest amount of
14
verbascoside: 238 mg/g vs. 188 and 88 mg/g for the commercial extracts containing 30%
and 10% of verbascoside. Similar results were found for isoverbascoside (peak 33), which
ranged from 10 to 40 mg/g of extract, thus being the second major compound in the
extracts. Another verbascoside isomer was detected (peak 34). It was identified as
forsythoside A and was the third major compound in PLE (4.71 mg/g of extract). This
compound was quantified in the commercial extracts as well, but in lower concentrations.
Verbasoside (peak 5), cistanoside F (peak 6), leucoseptoside A (peak39) and martynoside
(peak 44) were also found in relevant amounts in PLE and the extract containing 30% of
verbascoside. The rest of the phenylpropanoids (peaks 19, 27, 37, 45 and 46) were
detected in lower concentrations in all the extracts. It is worthy to note that PLE provided
a significantly high recovery of phenylpropanoids (304 mg /g of extract). Commercial
extracts containing 30% and 10% of verbascoside contained lower amounts: 228 and 106
mg/g, respectively. These results point to the fact that the innovative extraction method
used to produce PLE favoured the recovery of bioactive compounds, such as verbascoside
(Amin, Poureshagh, & Hosseinzadeh, 2016; Cádiz-Gurrea et al., 2018; Y. Zhang et al.,
2018). Additionally, two polar compounds were identified in the extract: gluconic acid
(peak 1) and tuberonic acid glucoside (peak 14), which presented the same elution order
as previously reported (Cádiz-Gurrea et al., 2018; Leyva-Jiménez et al., 2018).
3.2. Vesicle characterization
Considering the promising composition of the extract obtained by pressurized liquid
method, PLE extract was loaded in phospholipid vesicles modified by adding propylene
glycol in the water solution (25:75 v/v), thus obtaining PG-PEVs. Furthermorey, the latter
were modified with glucidex, a maltodextrin, and/or a biopolymer obtained from
Chimaera monstrosa, a Mediterranean species of fish in the Chimaeridae family.
Previous studies disclosed that the addition of these macromolecules to vesicle
15
formulations can ameliorate the local and systemic bioavailability of the payload after
oral administration (Catalán-Latorre et al., 2018). Liposomes were also prepared and used
as a reference. All the vesicles were prepared by a simple procedure that involved the
dispersion of the components (Supplementary material Table 2) in water or in a mixture
of water and propylene glycol, followed by sonication to reduce their mean diameter
thanks to the small number of cavitation events which cause strong physical disturbance
(Yamaguchi, Nomura, Matsuoka, & Koda, 2009). The main physico-chemical
characteristics of the vesicles were measured (Table 1). The corresponding empty vesicles
were prepared and characterized to evaluate the effect of PLE extract on vesicle assembly.
Empty liposomes were the smallest (~97 nm) followed by empty glucidex-chondroitin-
PG-PEVs (~130 nm), PG-PEVs and empty chondroitin-PG-PEVs (~210 nm), and empty
glucidex-PG-PEVs (~375 nm), which indicates that the combination of glucidex,
chondroitin and propylene glycol ensure an optimal arrangement of the phospholipid.
When the extract was loaded, the mean diameter of liposomes increased dramatically
from 97 to 374 nm, in parallel with the polydispersity index (from 0.23 to 0.45). The
loading of the extract in PG-PEVs induced a decrease in mean diameter (~221 vs. ~158
nm) and an improvement of homogeneity of the dispersion, indicating a positive
contribution of the extract to the bilayer packing. The same behaviour was observed in
glucidex-PG-PEVs or chondroitin-PG-PEVs, as a reduction in vesicle size was detected
when the extract was loaded. The simultaneous addition of glucidex and chondroitin in
glucidex-chondroitin-PG-PEVs allowed only a slight increase in the mean diameter (~150
nm). In general, the combination of propylene glycol, chondroitin and the L. citriodora
phytochemicals seem to facilitate the formation of smaller and more homogeneous
vesicles.
16
Overall, the zeta potential of formulations assessed was negative. However, the zeta
potential of PG-PEVs and chondroitin-PG-PEVs became less negative after the loading
of the extract (from -34 to -21 mV and from -34 to -26 mV, respectively), while that of
glucidex-chondroitin-PG-PEVs became more negative (from -21 to -29 mV), and that of
liposomes and glucidex-PG-PEVs was unchanged. Overall, it can be concluded that the
extract had a marginal effect on the surface charge of the vesicles, proving their main
location inside the vesicles and not on the vesicle surface.
Moreover, results confirmed that polysaccharides can affect the formation of particles
due to sugar-phospholipid interactions (Crowe & Crowe, 1991; Major, Prieur, Tocanne,
Betbeder, & Sautereau, 1997), as an enlargement of the vesicles (375 vs. 221 nm for PG-
PEVs) and a reduction of zeta potential (-16.5 vs. -34 mV for PG-PEVs) were detected
when glucidex was added to the formulation. On the contrary, the presence of the polymer
(chondroitin) caused a decrease in size of PG-PEVs (197 vs. 221 nm), without affecting
the zeta potential.
The entrapment efficiency was assessed by comparing the antioxidant activity of the
formulations before and after dialysis. Liposomes, which were the largest vesicles,
provided the highest entrapment efficiency of L. citriodora extract (84%). For the other
vesicles, the values were lower, ranging from 50 to 76%. The entrapment efficiency of
PG-PEVs (76%) was slightly lower than that of liposomes, and the effect of glucidex was
negligible. The addition of the biopolymer negatively impacted the loading process,
reducing the entrapment efficiency to ~50%. This may be explained by the assumption
that chondroitin may interact with phospholipid and intercalate in the bilayer, reducing
the internal space of the vesicles available for the loading of the extract.
3.3. Physical stability of the vesicles in dispersion

17
The physical stability of the formulations was evaluated by the Turbiscan®
technology, which allows the detection of instability phenomena related to particle
migration and/or aggregation (Carbone et al., 2018; Rezvani et al., 2019).
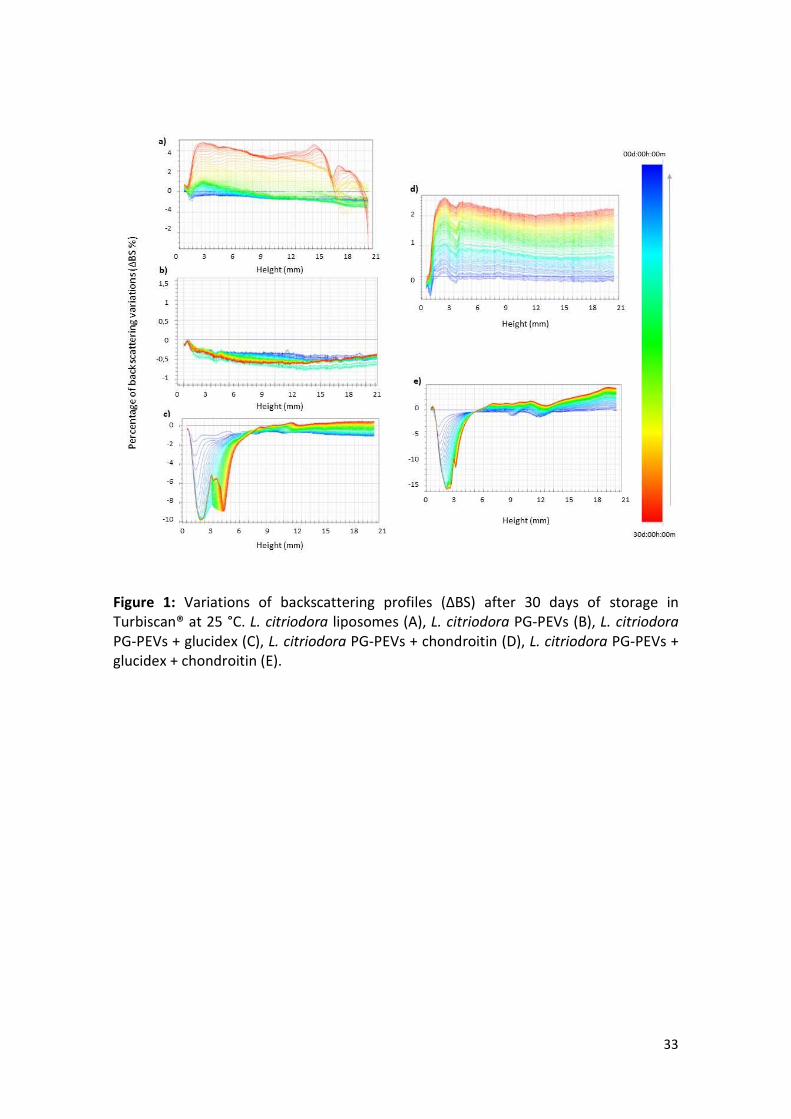
The backscattering variations (ΔBS; Figure 1) show that all the formulations were
stable in terms of particle aggregation, since insignificant changes were detected in the
middle of the test cuvette. However, different behaviours were observed as a function of
the vesicles’ composition. In particular, L. citriodora liposomes (Figure 1a) and PG-PEVs
(Figure 1b) showed high long-term stability, without the occurrence of significant
instability phenomena, in terms of both particle aggregation and migration. However, it
is worthy to note that liposomes showed good stability for 15 days of storage, after which
particle migration to the top of the cuvette occurred, as depicted in Figure 1a, probably
related to a creaming phenomenon.
A certain instability phenomenon related to particle migration at the bottom of the
cuvette (sedimentation) was apparent for glucidex-PG-PEVs (Figure 1c), probably
connected to aggregation and fusion phenomena that can undergo in colloidal dispersions.
With regards to the formulations prepared with chondroitin, a greater physical
stability of chondroitin-PG-PEVs was evident (Figure 1d) in comparison with glucidex-
chondroitin-PG-PEVs (Figure 1e), which underwent sedimentation (particle migration)
similar to that observed for glucidex-PG-PEVs.
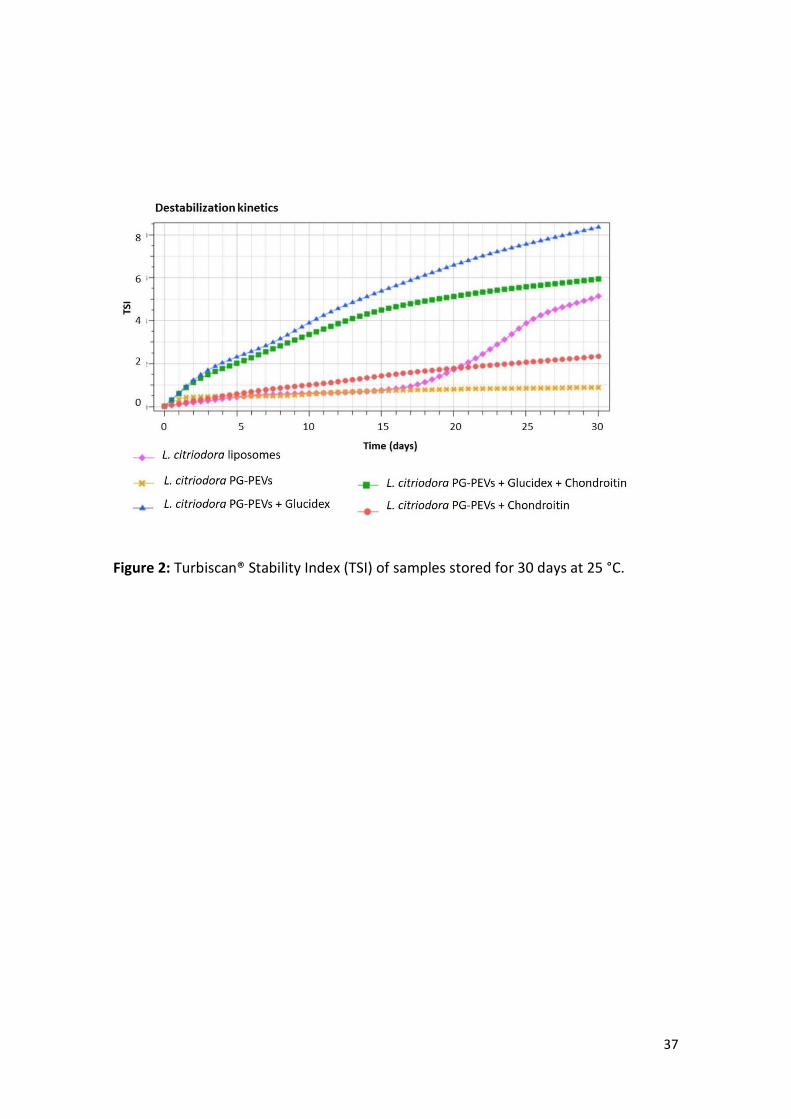
As shown by Turbiscan Stability Index (TSI) profiles (Supplementary material Figure
2), the following decreasing stability ranking can be defined: PG-PEVs ≥ chondroitin-
PG-PEVs> liposomes >> glucidex-PG-PEVs> glucidex-chondroitin-PG-PEVs.
Therefore, we can conclude that propylene glycol stabilizes the vesicle dispersion as well
as chondroitin, while glucidex led to a destabilizing effect.

18
3.4. Vesicle stability in acidic and neutral media at high ionic strength
The stability of the vesicles was tested in simulated gastro-intestinal fluids by diluting
and incubating the formulations at pH 1.2 for 2 h and pH 7.0 for 6 h, in the presence of
sodium chloride (0.3 M) at 37 ºC. The physico-chemical characteristics of the vesicles
were analysed immediately after dilution (t0) and after 2 (t2) or 6 h (t6) of incubation. The
results are summarized in Table 2.
As expected, immediately after dilution at pH 1.2, liposomes increased in size (from
374 to 445 nm) and the homogeneity was reduced (from 0.45 to 0.86), suggesting a high
instability of these vesicles in acidic medium. No further changes occurred after 2 h of
incubation. These findings are in agreement with previous results reporting the instability
of liposomes in acidic medium (Hu et al., 2013; Rezvani et al., 2019). A much worse
effect was observed in chondroitin-PG-PEVs, which lost their structure after dilution with
the acidic medium (Table 2). This can be caused by a protonation and depolymerization
of chondroitin, since previous studies have reported that a possible O-desulfation and a
slight depolymerisation of polysaccharides may occur at acidic pH above 30 ºC (Volpi,
Mucci, & Schenetti, 1999). According to the physico-chemical characterization, the
chondroitin partially intercalated inside the bilayer and its protonation and
depolymerization caused a loss of vesicle integrity leading to new aggregation in large
vesicles (mean diameter ~4000 nm) with a concomitant increase in polydispersity (from
0.29 to 0.70). The addition of glucidex mitigated the effect of the acidic medium, as both
vesicle size and polydispersity index increased but to a lesser extent, from 150 to ~2800
nm and from 0.24 to ~0.50, respectively. The positive effect of glucidex was confirmed
by the behaviour of glucidex-PG-PEVs, which preserved their structure showing no
alterations of mean diameter and polydispersity index (Table 2). A similar behaviour was
observed for PG-PEVs. Hence, glucidex and propylene glycol favoured the stabilization

19
of the vesicles avoiding their rupture in acidic medium (Venkatesan & Vyas, 2000).
Furthermore, in the acidic medium, the zeta potential of all the formulations turned to
positive values due to the protonation of the phospholipid.
The incubation of the formulations with the fluid at neutral pH did not affect the
vesicle structure, as the mean size was unchanged. The only exception were liposomes,
which increased in size (from 374 to 540 nm) and inhomogeneity, even more than upon
incubation with the acidic medium. With regards to the zeta potential, the values
approached neutrality for all the formulations tested.
3.5. Vesicle stability in milk whey
The stability of the vesicles was tested also in a food matrix, such as milk whey, with
the purpose of determining the feasibility of the prepared formulations to produce
functional foods. Milk whey was obtained from yogurt production. The whey was
centrifuged at 8000 rpm and the supernatant was collected and stored until use. The
obtained milk whey had an acidic pH of 4.8.
The milk whey was analysed in order to determine the mean size of particles in
dispersion, such as protein and fat micelles, as well as polydispersity index and zeta
potential. The results are summarized in Table 3. The mean size was approximately 260
nm, polydispersity index was 0.36 and zeta potential was slightly negative (-4.2 mV).
These results are related to the presence of proteins, fat globules and minerals (Pereira,
2014).
The stability of the vesicles in milk whey was assessed as follows: the formulations
were diluted with milk whey (1:100) and analysed immediately after dilution (t0) and after
24 h (t24) of incubation at 4 ºC, which is the recommended storage temperature for dairy
products. As expected, liposomes aggregated after dilution with acidic milk whey,

20
showing increased size (from 374 to 508 nm) and polydispersity index (from 0.45 to
0.58). However, after 24 h of incubation, the initial conditions were restored. This can be
related to the composition of milk whey, which contains fat micelles in the form of
bilamellar layers of phospholipids (Angulo, Mahecha, & Olivera, 2009). This may induce
a re-arrangement of the liposomes in smaller structures. Similarly, chondroitin-PG-PEVs
and glucidex-chondroitin-PG-PEVs showed an increase in size and polydispersity index
(Table 3), but the increase was less pronounced when glucidex was present. The positive
effect of glucidex was evident in glucidex-PG-PEVs, as they were not affected by the
milk whey, similar to PG-PEVs which maintain their physico-chemical properties.
According to these findings, glucidex-PG-PEVs and PG-PEVs might be used as an
interesting functional ingredient, since the vesicles can resist acidic pH and can protect
the payload from degradation.
3.6. In vitro assays in Caco-2 cells
3.6.1. Biocompatibility tests
With the aim of assessing the effect of L. citriodora extract on intestinal Caco-2 cells,
viability studies were performed by incubating the cells with the formulations at different
dilutions for 48 h. The extract solutions were used to evaluate the positive effect provided
by the vesicle loading (Figure 2). The results point to a slight reduction of cell viability
when the highest concentration of extract (50 µg/mL) was applied. When the other
concentrations were used (5, 0.5 and 0.05 µg/mL), a high viability (~ 90-100%) was
found, regardless the vesicle composition. No statistically significant differences were
observed between our PLE extract and the two commercial extracts, except at the higher
concentration: the highest cytotoxicity was detected for PLE extract (61% viability vs. 75

21
for commercial extract containing 10% of verbascoside and 82% and commercial extract
containing 30% of verbascoside).
When the liposomes were used, the highest viability was achieved at 50 and 0.05
µg/mL (~95%). In the case of PG-PEVs, the viability increased as the concentration
decreased, from 72 (50 µg/mL) to 94% (0.05 µg/mL). The addition of glucidex did not
impact cell viability. On the other hand, the highest values of cell viability were achieved
when chondroitin was added to the formulations. A proliferative effect was observed (up
to 118% viability), especially in the cells incubated with chondroitin-PG-PEVs.
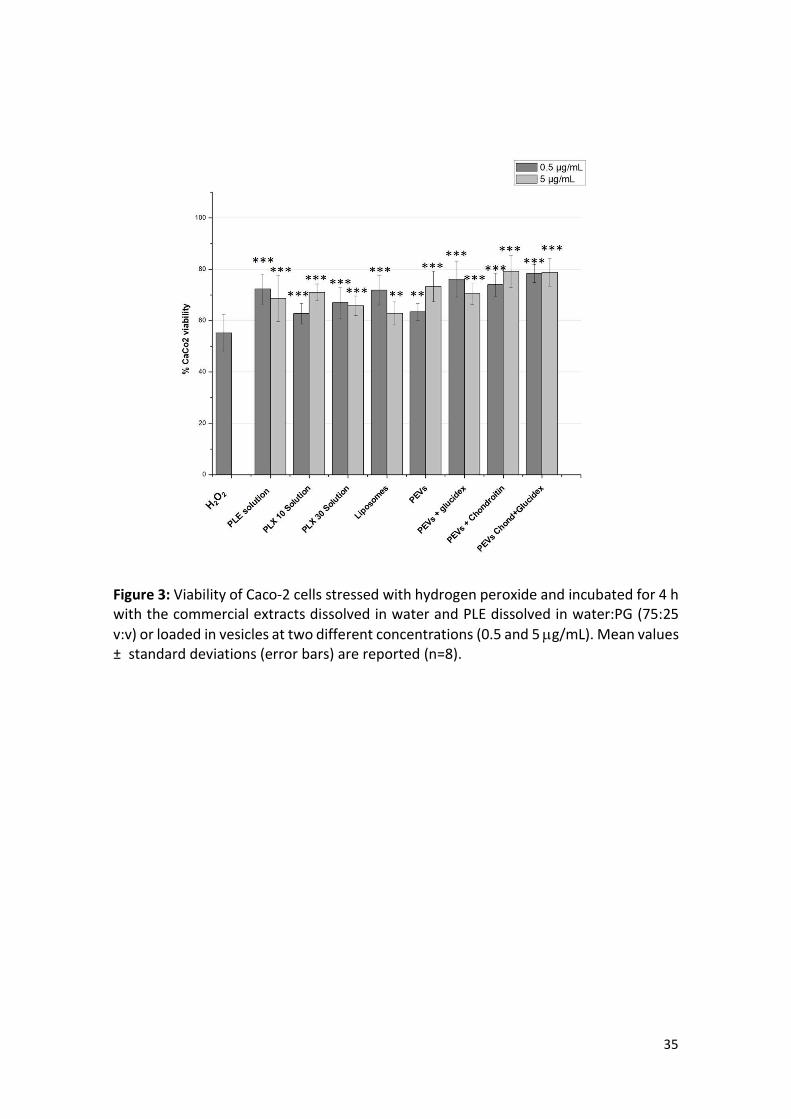
3.6.2. Protective effect of the vesicle formulations against oxidative stress
The ability of the L. citriodora loaded vesicles to protect intestinal cells from
oxidative stress was assessed. Based on the biocompatibility results, 5 and 0.5 µg/mL
were chosen as non-cytotoxic concentrations and used in the antioxidant tests. The
exposure of Caco2-cells to hydrogen peroxide induces an increase in ROS (Reactive
Oxygen Species) levels that can alter metabolic pathways leading to cell death (Koláček
et al., 2013). This explains the 55% viability obtained in our tests (Figure 3). Interestingly,
all the formulations provided a protective effect, as compared to the positive control at a
95% confidence level (p ≤ 0.05). The aqueous solutions of the three extracts provided a
similar antioxidant effect (~70% viability), which can be ascribed to the presence of the
phenolic compounds. The commercial extracts used at 5 µg/mL provided a cell viability
around 70%, whereas the aqueous solution of PLE extract reached the same results at the
lower concentration (0.5 µg/mL), suggesting a slightly higher protection against
hydrogen peroxide (72%) among the used extracts. However, no significant differences
in antioxidant activity were detected, suggesting that the different composition of polar
compounds did not have a relevant influence on Caco2-cells viability. These outcomes

22
differ from a previous work that showed the cytotoxic effect of high concentration of
verbascoside in adipocytes (Cádiz-Gurrea et al., 2018).
The incorporation of PLE extract in liposomes and PG-PEVs did not affect its
antioxidant activity (~70% viability). The addition of glucidex and chondroitin slightly
enhanced the protective effect of the extract, as can be seen in Figure 3. Indeed, the cell
viability approached 80%. It should be pointed out that chondroitin was majorly
responsible for this enhancement, which is in line with the proliferative effect observed
in the biocompatibility tests. These findings suggest that the biopolymer favours the
proliferation of cells and the interaction of the vesicles with cells, promoting the release
of L. citriodora bioactive compounds inside Caco-2 cells.
4. Conclusions
PLE was demonstrated to be a powerful technique to recover a large number of
phytochemicals from L. citriodora leaves with beneficial properties. The extract
contained bioactive compounds, such as verbascoside, isoverbascoside and forsythoside
A, in higher amounts than the commercial extracts. The PLE extract loaded phospholipid
vesicles, especially glucidex- and chondroitin-PG-PEVs, were able to decrease the
damaging effect of oxidative stress protecting intestinal cells, thus highlighting the
beneficial properties of these herbal formulations. Additionally, the great stability of PG-
PEVs and glucidex-PG-PEVs in acidic medium and in milk whey suggest that these
vesicles could be used in functional foods as an attractive option to improve intestinal
health. According to the results obtained PG-PEVs has demonstrated great results in all
assays performed being appropriate to formulate functional foods to prevent
gastrointestinal diseases. However it is necessary to evaluate their stability and integrity
during yogurt fermentation processes to evaluate its adequacy in this food matrix.
23
Acknowledgments
This work was funded by projects AGL2015-67995-C3-2-R (Spanish Ministry of
Science and Innovation), P11-CTS-7625 (Andalusian Regional Government Council of
Innovation and Science) and RTI2018-096724-B-C22 (Ministry of science, Innovation
and Universities). The author Leyva-Jimenez gratefully acknowledges the Spanish
Ministry of Economy and Competitiveness (MINECO) for the FPI grant BES-2016-
076618 given to develop this work.
References
Ameer, K., Shahbaz, H. M., & Kwon, J. H. (2017). Green Extraction Methods for
Polyphenols from Plant Matrices and Their Byproducts: A Review. Comprehensive
Reviews in Food Science and Food Safety, Vol. 16, pp. 295–315.
https://doi.org/10.1111/1541-4337.12253
Amin, B., Poureshagh, E., & Hosseinzadeh, H. (2016). The Effect of Verbascoside in
Neuropathic Pain Induced by Chronic Constriction Injury in Rats. Phytotherapy
Research, 30(1), 128–135. https://doi.org/10.1002/ptr.5512
Angulo, J., Mahecha, L., & Olivera, M. (2009). Síntesis, composición y modificación de
la grasa de la leche bovina: Un nutriente valioso para la salud humana. Revista MVZ
Córdoba. https://doi.org/10.21897/rmvz.346
Bravo, L., Sources, D., & Significance, N. (2009). Polyphenols: Chemistry, Dietary
Sources, Metabolism, and Nutritional Significance. Nutrition Reviews, 56(11), 317–
333. https://doi.org/10.1111/j.1753-4887.1998.tb01670.x
Cádiz-Gurrea, M. de la L., Olivares-Vicente, M., Herranz-López, M., Román-Arráez, D.,
Fernández-Arroyo, S., Micol, V., & Segura-Carretero, A. (2018). Bioassay-guided
24
purification of Lippia citriodora polyphenols with AMPK modulatory activity.
Journal of Functional Foods, 46, 514–520. https://doi.org/10.1016/j.jff.2018.05.026
Carbone, C., Martins-Gomes, C., Caddeo, C., Silva, A. M., Musumeci, T., Pignatello, R.,
… Souto, E. B. (2018). Mediterranean essential oils as precious matrix components
and active ingredients of lipid nanoparticles. International Journal of
Pharmaceutics, 548(1), 217–226. https://doi.org/10.1016/j.ijpharm.2018.06.064
Catalán-Latorre, A., Pleguezuelos-Villa, M., Castangia, I., Manca, M. L., Caddeo, C.,
Nácher, A., … Manconi, M. (2018). Nutriosomes: prebiotic delivery systems
combining phospholipids, a soluble dextrin and curcumin to counteract intestinal
oxidative stress and inflammation. Nanoscale, 10(4), 1957–1969.
https://doi.org/10.1039/C7NR05929A
Chandrasekara, A., & Shahidi, F. (2012). Bioaccessibility and antioxidant potential of
millet grain phenolics as affected by simulated in vitro digestion and microbial
fermentation. Journal of Functional Foods, 4(1), 226–237.
https://doi.org/10.1016/j.jff.2011.11.001
Crowe, L. M., & Crowe, J. H. (1991). Solution effects on the thermotropic phase
transition of unilamellar liposomes. Biochimica et Biophysica Acta (BBA) -
Biomembranes, 1064(2), 267–274. https://doi.org/10.1016/0005-2736(91)90311-U
Crozier, A., Del Rio, D., & Clifford, M. N. (2010). Bioavailability of dietary flavonoids
and phenolic compounds. Molecular Aspects of Medicine, 31(6), 446–467.
https://doi.org/10.1016/j.mam.2010.09.007
Fang, Z., & Bhandari, B. (2010). Encapsulation of polyphenols - A review. Trends in
Food Science and Technology, 21(10), 510–523.
https://doi.org/10.1016/j.tifs.2010.08.003
25
Gilbert-López, B., Barranco, A., Herrero, M., Cifuentes, A., & Ibáñez, E. (2017).
Development of new green processes for the recovery of bioactives from
Phaeodactylum tricornutum. https://doi.org/10.1016/j.foodres.2016.04.022
Gombau, J., Nadal, P., Canela, N., Gómez-Alonso, S., García-Romero, E., Smith, P., …
Zamora, F. (2019). Measurement of the interaction between mucin and oenological
tannins by Surface Plasmon Resonance (SPR); relationship with astringency. Food
Chemistry, 275, 397–406. https://doi.org/10.1016/j.foodchem.2018.09.075
Gomes, S. V. F., Portugal, L. A., dos Anjos, J. P., de Jesus, O. N., de Oliveira, E. J.,
David, J. P., & David, J. M. (2017). Accelerated solvent extraction of phenolic
compounds exploiting a Box-Behnken design and quantification of five flavonoids
by HPLC-DAD in Passiflora species. Microchemical Journal, 132, 28–35.
https://doi.org/10.1016/j.microc.2016.12.021
Gonçalves, E. C. B. A., Lozano-Sanchez, J., Gomes, S., Ferreira, M. S. L., Cameron, L.
C., & Segura-Carretero, A. (2018). Byproduct Generated During the Elaboration
Process of Isotonic Beverage as a Natural Source of Bioactive Compounds. Journal
of Food Science, 83(10), 2478–2488. https://doi.org/10.1111/1750-3841.14336
González, E., Gómez-Caravaca, A. M., Giménez, B., Cebrián, R., Maqueda, M.,
Martínez-Férez, A., … Robert, P. (2019). Evolution of the phenolic compounds
profile of olive leaf extract encapsulated by spray-drying during in vitro
gastrointestinal digestion. Food Chemistry, 279, 40–48.
https://doi.org/10.1016/j.foodchem.2018.11.127
He, H., Lu, Y., Qi, J., Zhu, Q., Chen, Z., & Wu, W. (2019). Adapting liposomes for oral
drug delivery. Acta Pharmaceutica Sinica B, 9(1), 36–48.
https://doi.org/10.1016/j.apsb.2018.06.005

26
Hosny, K. M., Ahmed, O. A. A., & Al-Abdali, R. T. (2013). Enteric-coated alendronate
sodium nanoliposomes: a novel formula to overcome barriers for the treatment of
osteoporosis. Expert Opinion on Drug Delivery, 10(6), 741–746.
https://doi.org/10.1517/17425247.2013.799136
Hu, S., Niu, M., Hu, F., Lu, Y., Qi, J., Yin, Z., & Wu, W. (2013). Integrity and stability
of oral liposomes containing bile salts studied in simulated and ex vivo
gastrointestinal media. International Journal of Pharmaceutics, 441(1–2), 693–700.
https://doi.org/10.1016/j.ijpharm.2012.10.025
Koláček, M., Muchová, J., Dvořáková, M., Paduchová, Z., Žitňanová, I., Čierna, I., …
Ďuračková, Z. (2013). Effect of natural polyphenols (Pycnogenol) on oxidative
stress markers in children suffering from Crohn’s disease – a pilot study. Free
Radical Research, 47(8), 624–634. https://doi.org/10.3109/10715762.2013.807508
Leyva-Jiménez, F. J., Lozano-Sánchez, J., Borrás-Linares, I., Arráez-Román, D., &
Segura-Carretero, A. (2018). Comparative study of conventional and pressurized
liquid extraction for recovering bioactive compounds from Lippia citriodora leaves.
Food Research International, 109, 213–222.
https://doi.org/10.1016/j.foodres.2018.04.035
Liazid, A., Palma, M., Brigui, J., & Barroso, C. G. (2007). Investigation on phenolic
compounds stability during microwave-assisted extraction. Journal of
Chromatography A, 1140(1–2), 29–34.
https://doi.org/10.1016/j.chroma.2006.11.040
Major, M., Prieur, E., Tocanne, J. F., Betbeder, D., & Sautereau, A. M. (1997).
Characterisation and phase behaviour of phospholipid bilayers adsorbed on spherical
polysaccharidic nanoparticles. Biochimica et Biophysica Acta - Biomembranes,
27
1327(1), 32–40. https://doi.org/10.1016/S0005-2736(97)00041-2
Manca, M. L., Manconi, M., Falchi, A. M., Castangia, I., Valenti, D., Lampis, S., &
Fadda, A. M. (2013). Close-packed vesicles for diclofenac skin delivery and
fibroblast targeting. Colloids and Surfaces B: Biointerfaces, 111, 609–617.
https://doi.org/10.1016/j.colsurfb.2013.07.014
Manconi, M., Manca, M. L., Escribano-Ferrer, E., Coma-Cros, E. M., Biosca, A.,
Lantero, E., … Caddeo, C. (2019). Nanoformulation of curcumin-loaded eudragit-
nutriosomes to counteract malaria infection by a dual strategy: Improving
antioxidant intestinal activity and systemic efficacy. International Journal of
Pharmaceutics, 556, 82–88. https://doi.org/10.1016/j.ijpharm.2018.11.073
Manconi, M., Sinico, C., Caddeo, C., Vila, A. O., Valenti, D., & Fadda, A. M. (2011).
Penetration enhancer containing vesicles as carriers for dermal delivery of tretinoin.
International Journal of Pharmaceutics, 412(1–2), 37–46.
https://doi.org/10.1016/j.ijpharm.2011.03.068
Melo, M. N. de O., Oliveira, A. P., Wiecikowski, A. F., Carvalho, R. S., Castro, J. de L.,
de Oliveira, F. A. G., … Holandino, C. (2018). Phenolic compounds from Viscum
album tinctures enhanced antitumor activity in melanoma murine cancer cells. Saudi
Pharmaceutical Journal, 26(3), 311–322.
https://doi.org/10.1016/j.jsps.2018.01.011
Mendes, M., Carvalho, A. P., Magalhães, J. M. C. S., Moreira, M., Guido, L., Gomes, A.
M., & Delerue-Matos, C. (2016). Response surface evaluation of microwave-
assisted extraction conditions for Lycium barbarum bioactive compounds.
Innovative Food Science & Emerging Technologies, 33, 319–326.
https://doi.org/10.1016/j.ifset.2015.12.025

28
Pereira, D. T. V., Tarone, A. G., Cazarin, C. B. B., Barbero, G. F., & Martínez, J. (2019).
Pressurized liquid extraction of bioactive compounds from grape marc. Journal of
Food Engineering, 240, 105–113. https://doi.org/10.1016/j.jfoodeng.2018.07.019
Pereira, P. C. (2014). Milk nutritional composition and its role in human health. Nutrition,
Vol. 30, pp. 619–627. https://doi.org/10.1016/j.nut.2013.10.011
Pimentel-Moral, S., Borrás-Linares, I., Lozano-Sánchez, J., Arráez-Román, D., Martínez-
Férez, A., & Segura-Carretero, A. (2018). Supercritical CO2 extraction of bioactive
compounds from Hibiscus sabdariffa. The Journal of Supercritical Fluids,
(November), 0–1. https://doi.org/10.1016/j.supflu.2018.11.005
Quirantes-Piné, R., Arráez-Román, D., Segura-Carretero, A., & Fernández-Gutiérrez, A.
(2010). Characterization of phenolic and other polar compounds in a lemon verbena
extract by capillary electrophoresis-electrospray ionization-mass spectrometry.
Journal of Separation Science, 33(17–18), 2818–2827.
https://doi.org/10.1002/jssc.201000228
Rezvani, M., Manca, M. L., Caddeo, C., Escribano-Ferrer, E., Carbone, C., Peris, J. E.,
… Manconi, M. (2019). Co-Loading of Ascorbic Acid and Tocopherol in Eudragit-
Nutriosomes to Counteract Intestinal Oxidative Stress. Pharmaceutics, 11(1), 13.
https://doi.org/10.3390/pharmaceutics11010013
Vázquez, J. A., Fraguas, J., Novoa-Carballal, R., Reis, R. L., Pérez-Martín, R. I., &
Valcarcel, J. (2019). Optimal isolation and characterisation of chondroitin sulfate
from rabbit fish (Chimaera monstrosa). Carbohydrate Polymers, 210, 302–313.
https://doi.org/10.1016/j.carbpol.2019.01.075
Venkatesan, N., & Vyas, S. P. (2000). Polysaccharide coated liposomes for oral
immunization - Development and characterization. International Journal of
29
Pharmaceutics. https://doi.org/10.1016/S0378-5173(00)00442-7
Volpi, N., Mucci, A., & Schenetti, L. (1999). Stability studies of chondroitin sulfate.
Carbohydrate Research, 315(3–4), 345–349. https://doi.org/10.1016/S0008-
6215(99)00034-8
Yamaguchi, T., Nomura, M., Matsuoka, T., & Koda, S. (2009). Effects of frequency and
power of ultrasound on the size reduction of liposome. Chemistry and Physics of
Lipids, 160(1), 58–62. https://doi.org/10.1016/j.chemphyslip.2009.04.002
Yelumalai, S., Giribabu, N., Karim, K., Omar, S. Z., & Salleh, N. Bin. (2019). In vivo
administration of quercetin ameliorates sperm oxidative stress, inflammation,
preserves sperm morphology and functions in streptozotocin-nicotinamide induced
adult male diabetic rats. Archives of Medical Science, 15(1), 240–249.
https://doi.org/10.5114/aoms.2018.81038
Zhang, L., Han, Y.-J., Zhang, X., Wang, X., Bao, B., Qu, W., & Liu, J. (2016). Luteolin
reduces obesity-associated insulin resistance in mice by activating AMPKα1
signalling in adipose tissue macrophages. Diabetologia.
https://doi.org/10.1007/s00125-016-4039-8
Zhang, Y., Yuan, Y., Wu, H., Xie, Z., Wu, Y., Song, X., … Wang, L. (2018). Effect of
verbascoside on apoptosis and metastasis in human oral squamous cell carcinoma.
International Journal of Cancer, 143(4), 980–991. https://doi.org/10.1002/ijc.31378

30
Table 1: Vesicle characterization including mean diameter (MD), polydispersity index (PDI), zeta potential (ZP) and entrapment efficiency (EE). Mean values ± standard deviations from at least 6 replicates are reported.
Formulation MD (nm)
PDI
ZP (mV)
EE (%)
Empty liposomes 97 ± 8 0.23 -22 ± 1 Empty PG-PEVs 221 ± 2 0.41 -34 ± 2
Empty glucidex-PG-PEVs 375 ± 18 0.56 -16.5 ± 0.4
Empty chondroitin-PG-PEVs 197 ± 8 0.33 -34 ± 2
Empty glucidex-chondroitin-PG-PEVs 130 ± 8 0.14 -21.0 ± 0.3
L. citriodora liposomes 374 ± 21 0.45 -23 ± 2 84 ± 1 L. citriodora PG-PEVs 158 ± 13 0.30 -21 ± 3 76 ± 4 L. citriodora glucidex-PG-PEVs 208 ± 15 0.30 -15 ± 2 68 ± 4 L. citriodora chondroitin-PG-PEVs 132 ± 17 0.29 -26 ± 1 50 ± 6 L. citriodora glucidex-chondroitin-PG-PEVs 150 ± 6 0.24 -29 ± 2 58 ± 4

31
1 Table 2: Mean diameter (MD), polydispersity index (PDI) and zeta potential (ZP) of L. citriodora loaded vesicles diluted and incubated at 37 °C at 2 pH 1.2 for 2 h and pH 7.0 for 6 h. Mean values ± standard deviations are reported (n = 3). 3 4
Formulation Time pH 1.2 pH 7.0
Size (nm) PDI ZP (mV) Size (nm) PDI ZP (mV)
L. citriodora liposomes
Initial 374 ± 21 0.45 -23 ± 2 374 ± 21 0.45 -23 ± 2 t0 445 ± 41 0.86 16 ± 1 434 ± 27 0.93 -1.9 ± 0.2
t2/t6 371 ± 19 0.85 15 ± 1 540 ± 32 0.97 -1.74 ± 0.02
L. citriodora PG-PEVs
Initial 158 ± 13 0.30 -21 ± 3 158 ± 13 0.30 -21 ± 3 t0 154 ± 3 0.32 14 ± 1 167 ± 6 0.33 -1.5 ± 0.2
t2/t6 160 ± 7 0.31 16 ± 1 177 ± 2 0.42 -1.46 ± 0.05
L. citriodora glucidex-PG-PEVs
Initial 208 ± 15 0.30 -15 ± 2 208 ± 15 0.30 -15 ± 2 t0 183 ± 5 0.30 13 ± 2 205 ± 6 0.42 -1,2 ± 0.2
t2/t6 188 ± 23 0.29 12.3 ± 0.4 188 ± 3 0.38 -2.0 ± 0.8 L. citriodora
chondroitin-PG-PEVs
Initial 132 ± 17 0.29 -26 ± 1 132 ± 17 0.29 -26 ± 1 t0 4185 ± 580 0.70 10.1 ± 0.1 136 ± 11 0.29 -3.5 ± 0.6
t2/t6 4015 ± 746 0.64 10 ± 1 132 ± 11 0.27 -3 ± 1 L. citriodora
glucidex-chondroitin-PG-
PEVs
Initial 150 ± 6 0.24 -29 ± 2 150 ± 6 0.24 -29 ± 2 t0 2772 ± 106 0.53 10 ± 1 154 ± 7 0.22 -2.5 ± 0.1
t2/t6 2804 ± 125 0.48 13 ± 1 149 ± 5 0.20 -3 ± 1
5
32
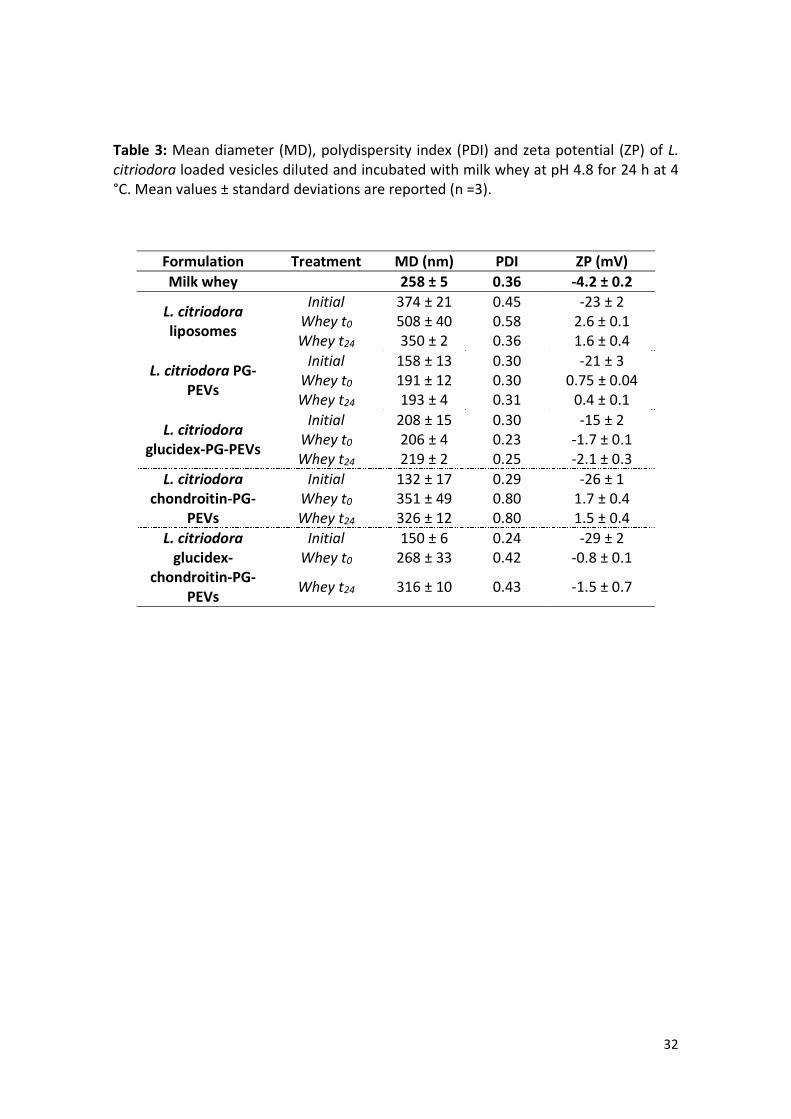
Table 3: Mean diameter (MD), polydispersity index (PDI) and zeta potential (ZP) of L. citriodora loaded vesicles diluted and incubated with milk whey at pH 4.8 for 24 h at 4 °C. Mean values ± standard deviations are reported (n =3).
Formulation Treatment MD (nm) PDI ZP (mV) Milk whey 258 ± 5 0.36 -4.2 ± 0.2
L. citriodora liposomes
Initial 374 ± 21 0.45 -23 ± 2 Whey t0 508 ± 40 0.58 2.6 ± 0.1 Whey t24 350 ± 2 0.36 1.6 ± 0.4
L. citriodora PG-PEVs
Initial 158 ± 13 0.30 -21 ± 3 Whey t0 191 ± 12 0.30 0.75 ± 0.04 Whey t24 193 ± 4 0.31 0.4 ± 0.1
L. citriodora glucidex-PG-PEVs
Initial 208 ± 15 0.30 -15 ± 2 Whey t0 206 ± 4 0.23 -1.7 ± 0.1 Whey t24 219 ± 2 0.25 -2.1 ± 0.3
L. citriodora chondroitin-PG-
PEVs
Initial 132 ± 17 0.29 -26 ± 1 Whey t0 351 ± 49 0.80 1.7 ± 0.4 Whey t24 326 ± 12 0.80 1.5 ± 0.4
L. citriodora glucidex-
chondroitin-PG-PEVs
Initial 150 ± 6 0.24 -29 ± 2 Whey t0 268 ± 33 0.42 -0.8 ± 0.1
Whey t24 316 ± 10 0.43 -1.5 ± 0.7
33
Figure 1: Variations of backscattering profiles (ΔBS) after 30 days of storage in Turbiscan® at 25 °C. L. citriodora liposomes (A), L. citriodora PG-PEVs (B), L. citriodora PG-PEVs + glucidex (C), L. citriodora PG-PEVs + chondroitin (D), L. citriodora PG-PEVs + glucidex + chondroitin (E).

34
Figure 2: Viability of Caco-2 cells incubated for 48 h with the commercial extracts dissolved in water and PLE dissolved in water:PG (75:25 v:v) or loaded in vesicles at different concentrations. The mean values ± standard deviations (error bars) are reported.
35
Figure 3: Viability of Caco-2 cells stressed with hydrogen peroxide and incubated for 4 h with the commercial extracts dissolved in water and PLE dissolved in water:PG (75:25 v:v) or loaded in vesicles at two different concentrations (0.5 and 5 g/mL). Mean values ± standard deviations (error bars) are reported (n=8).
36
Supplementary material
Figure 1: Numbered base peak chromatograms (BPC) of polar compounds found in L. citriodora extracts.
37
Figure 2: Turbiscan® Stability Index (TSI) of samples stored for 30 days at 25 °C.

38
Table 1: Composition of the vesicle formulations.
Formulation Extract
(mg) P90G (mg)
Chondroitin (mg)
Glucidex (mg)
Water (mL)
PG (mL)
Empty liposomes - 180 - - 1 - Empty PG-PEVs - 180 - - 0.75 0.25 Empty glucidex-PG-PEVs - 180 - 100 0.75 0.25 Empty chondroitin-PG-PEVs - 180 10 - 0.75 0.25 Empty glucidex-chondroitin-PG-PEVs - 180 10 100 0.75 0.25 L. citriodora liposomes 50 180 - - 1 - L. citriodora PG-PEVs 50 180 - - 0.75 0.25 L. citriodora glucidex-PG-PEVs 50 180 - 100 0.75 0.25 L. citriodora chondroitin-PG-PEVs 50 180 10 - 0.75 0.25 L. citriodora glucidex-chondroitin-PG-PEVs 50 180 10 100 0.75 0.25
39
Table 2: Compounds detected in L. citriodora extracts. Quantification expressed as mg / g of extract is reported. Each compound is identified by a peak number as depicted in Figure 1.
Peak RT (min) m/z
calculated Molecular
formula (M-H) Proposed compound
Occurrence PLE PLX 10% PLX 30%
1 2.8 195.0510 C6H11O7 Gluconic acid D D D 2 3.0 191.0197 C6H7O7 UK 1 D D D 3 3.8 373.1140 C16H21O10 Gardoside 4.2 ± 0.4 2.49 ± 0.07 5.8 ± 0.3 4 4 387.0933 C16H19O11 Ixoside 1.1 ± 0.1 0.020 ± 0.004 0.28 ± 0.01 5 4.1 461.1664 C20H29O12 Verbasoside 3.7 ± 0.3 1.8 ± 0.1 4.4 ± 0.2 6 4.7 487.1457 C21H27O13 Cistanoside F 1.4 ± 0.1 0.898 ± 0.003 2.30 ± 0.04 7 5.2 475.1398 C27H23O8 UK 2 D D D 8 5.7 355.0671 C12H13O8 UK 3 D ND ND 9 5.9 389.1089 C16H21O11 Theveside 3.61 ± 0.06 2.5 ± 0.2 6.1 ± 0.4
10 7.2 449.1301 C18H25O13 Myxopyroside 0.38 ± 0.01 0.04 ± 0.01 0.22 ± 0.01 11 7.5 355.0671 C15H15O10 UK 4 D D D 12 8.2 593.1496 C27H29O15 UK 5 D ND ND 13 8.2 489.1614 C21H29O13 Teucardoside 0.108 ± 0.008 ND ND 14 8.5 387.1661 C18H27O9 Tuberonic acid glucoside D D D 15 8.8 433.2079 C20H33O10 UK 6 D D D 16 9.0 459.1508 C20H27O12 Descaffeoylcrenatoside 0.14 ± 0.01 ND ND 17 9.7 641.2087 C29H37O16 β Hydroxyverbascoside derivative 0.164 ± 0.007 ND ND
18 10.1 641.2087 C29H37O16 β Hydroxyisoverbascoside
derivative 0.6 ± 0.06 ND ND
19 10.3 639.1931 C29H35O16 β Hydroxyverbascoside 1.1 ± 0.1 0.237 ± 0.009 0.76 ± 0.05 20 10.5 637.1140 C27H25O18 Luteolin-7-diglucoronide NQ 1.1 ± 0.1 2.6 ± 0.1 21 10.6 639.1931 C29H35O16 β Hydroxyisoverbascoside 1.71 ± 0.04 ND ND 22 11.3 553.1563 C25H29O14 Lippioside II 0.24 ± 0.02 ND ND

40
23 13.5 637.1774 C29H33O16 Oxoverbascoside 0.097 ± 0.005 ND ND 24 14 621.1097 C27H25O17 Apigenin-7-diglucoronide NQ NQ NQ 25 14.3 535.1457 C25H27O13 Lippioside I Derivative 0.18 ± 0.02 ND ND 26 14.7 537.1614 C25H29O13 Lippioside I 0.31 ± 0.01 ND ND 27 15.0 653.2087 C30H37O16 Campneoside I NQ NQ NQ 28 15.7 651.1355 C28H27O18 Chrysoeriol-7-diglucuronide 0.70 ± 0.02 2.00 ± 0.04 4.6 ± 0.3 29 16.4 623.1981 C29H35O15 Verbascoside 238 ± 10 88 ± 2 188 ± 2 30 17.5 521.2028 C26H33O11 Lariciresinol glucopyranoside 1.12 ± 0.01 ND ND 31 18.3 667.2244 C31H39O16 Verbascoside A 1.49 ± 0.04 ND ND 32 18.4 491.0831 C22H19O13 Methyl quercetin glucuronide ND NQ NQ 33 18.6 623.1981 C29H35O15 Isoverbascoside 40 ± 1 10.0 ± 0.3 21.9 ± 0.9 34 19.1 623.1981 C29H35O15 Forsythoside A 4.71 ± 0.01 1.5 ± 0.1 1.4 ± 0.2 35 19.4 521.1664 C25H29O12 Hydroxycampsiside 0.29 ± 0.02 ND ND 36 19.4 549.1614 C26H29O13 Lippianoside B 0.156 ± 0.002 ND ND 37 19.8 607.2032 C29H35O14 Lipedoside A I 0.22 ± 0.03 NQ 0.016 ± 0.004 38 20.3 551.1770 C26H31O13 Durantoside I 0.31 ± 0.01 ND ND 39 20.9 637.2138 C30H37O15 Leucoseptoside A 4.40 ± 0.06 1.90 ± 0.05 4.3 ± 0.2 40 21.7 417.2130 C20H33O9 UK 5 ND D D 41 22.2 187.0976 C9H15O4 UK 6 ND D D 42 23.9 635.1254 C28H27O17 Acacetin-7-diglucoronide NQ 0.187 ± 0.004 0.78± 0.05 43 25.6 467.2075 C27H31O7 UK 7 ND D D 44 26.9 651.2294 C31H39O15 Martynoside 3.2 ± 0.3 1.52 ± 0.03 3.6 ± 0.2 45 29.2 651.2294 C31H39O15 Martynoside or isomer 0.38 ± 0.02 0.018± 0.008 0.25 ± 0.05 46 30.7 591.2083 C29H35O13 Osmanthuside B 1.45 ± 0.07 0.33 ±0.02 0.679± 0.009 47 31.2 569.2240 C27H37O13 Manuleoside H NQ NQ NQ 48 32 315.0510 C16H11O7 Methyl quercetin NQ NQ NQ 49 33.7 327.2177 C18H31O5 UK 8 D D D 50 34.6 299.0561 C16H11O6 Dimethyl kaempferol 1.49 ± 0.03 NQ NQ

41
51 35.1 329.0667 C17H13O7 Dimethyl quercetin 3.2 ± 0.2 NQ NQ ND: compound not detected; NQ: not quantified: compound between detection and quantification limits; D: compound detected but not quantified.