Towards Solid Tumor Treatment by Irreversible Electroporation: Intrinsic Redistribution of Fields...
14
Technology in Cancer Research and Treatment ISSN 1533-0346 Volume 6, Number 4, August 2007 ©Adenine Press (2007) Towards Solid Tumor Treatment by Irreversible Electroporation: Intrinsic Redistribution of Fields and Currents in Tissue www.tcrt.org Local and drug-free tissue treatment by irreversible electroporation (IRE) involves the creation of aqueous pores in a cell’s plasma membrane (PM) and leads to non-thermal cell death by necrosis. To investigate explicit pore-based effects we use two-dimensional system models with different spatial scales. The first is a multicellular system model (spa- tial scale 100 μm) that has irregularly shaped cells, and quantitatively describes dynamic (creation and destruction, evolution in pore size) pore behavior at the PM. The second is a tissue model (spatial scale 200 mm) that is constructed from a unit cell and uses the as- ymptotic (fixed pore size) electroporation model. Both system models show that significant redistribution of fields and currents occurs through transient PM pores. Pore histograms for the multicellular model demonstrate the simultaneous presence of small and large pores during IRE pulses. The associated significant increase of PM permeability may prove to be essential to understanding how cell death by necrosis occurs. The averaged tissue conductivity in both models increases during IRE pulses because of electropora- tion. This leads to greater electrical dissipation (heating) and, thus, to larger temperature increases than suggested by tissue models with passive and static electrical properties. Key words: Irreversible electroporation; Multicellular and tissue model; Dynamic pore behav- ior; Pore histogram; Membrane permeability; and Thermal effects. Background and Introduction Cancer treatment often fails at the cellular and tumor levels. At the cellular level, cancer cells frequently do not respond to pharmaceutical treatments be- cause of acquired multiple drug resistance (1), inhibitors of apoptosis (2, 3), and inhibition of signaling molecules (4). Molecular mechanisms inhibiting apoptosis pathways can also hinder physical therapies such as localized ionizing radiation as well as systemic pharmaceutical interventions (5-7). At the multi- cellular level there are additional barriers within solid tumors to drug therapies that arise from the inability of drugs to fully penetrate abnormal, heterogeneous, and irregularly vascularized tumor tissue and thereby not reach all of the cancer cells at therapeutic levels (8-11). Accordingly, local physical therapies that uni- versally kill all cells within a selected tissue volume are of great interest. With this as motivation, we consider some fundamental mechanistic aspects of tissue ablation by IRE (12-15) that are relevant to solid tumor treatment. Axel T. Esser, Ph.D. 1 Kyle C. Smith, S.M. 1,2 Thiruvallur R. Gowrishankar, Ph.D. 1 James C. Weaver, Ph.D. 1,* 1 Harvard-MIT Division of Health Sciences and Technology 2 Department of Electrical Engineering and Computer Science Massachusetts Institute of Technology 77 Massachusetts Avenue 16-318 Cambridge, MA 02139, USA * Corresponding Author: James C. Weaver, Ph.D. Email: [email protected] 261 Abbreviations: IRE, Irreversible electroporation; PM, Plasma membrane; REB, Reversible elec- trical breakdown; ECT, Electrochemotherapy; TL, Transport lattice; SE, Smoluchowski equation; SAR, Specific absorption rate. Open Access Article The authors, the publisher, and the right holders grant the right to use, reproduce, and disseminate the work in digital form to all users.
Transcript of Towards Solid Tumor Treatment by Irreversible Electroporation: Intrinsic Redistribution of Fields...

Technology in Cancer Research and TreatmentISSN 1533-0346Volume 6, Number 4, August 2007©Adenine Press (2007)
Towards Solid Tumor Treatment by Irreversible Electroporation: Intrinsic Redistribution
of Fields and Currents in Tissue
www.tcrt.org
Local and drug-free tissue treatment by irreversible electroporation (IRE) involves the
creation of aqueous pores in a cell’s plasma membrane (PM) and leads to non-thermal
cell death by necrosis. To investigate explicit pore-based effects we use two-dimensional
system models with different spatial scales. The first is a multicellular system model (spa-
tial scale 100 μm) that has irregularly shaped cells, and quantitatively describes dynamic
(creation and destruction, evolution in pore size) pore behavior at the PM. The second is
a tissue model (spatial scale 200 mm) that is constructed from a unit cell and uses the as-
ymptotic (fixed pore size) electroporation model. Both system models show that significant
redistribution of fields and currents occurs through transient PM pores. Pore histograms
for the multicellular model demonstrate the simultaneous presence of small and large
pores during IRE pulses. The associated significant increase of PM permeability may
prove to be essential to understanding how cell death by necrosis occurs. The averaged
tissue conductivity in both models increases during IRE pulses because of electropora-
tion. This leads to greater electrical dissipation (heating) and, thus, to larger temperature
increases than suggested by tissue models with passive and static electrical properties.
Key words: Irreversible electroporation; Multicellular and tissue model; Dynamic pore behav-
ior; Pore histogram; Membrane permeability; and Thermal effects.
Background and Introduction
Cancer treatment often fails at the cellular and tumor levels. At the cellular level, cancer cells frequently do not respond to pharmaceutical treatments be-cause of acquired multiple drug resistance (1), inhibitors of apoptosis (2, 3), and inhibition of signaling molecules (4). Molecular mechanisms inhibiting apoptosis pathways can also hinder physical therapies such as localized ionizing radiation as well as systemic pharmaceutical interventions (5-7). At the multi-cellular level there are additional barriers within solid tumors to drug therapies that arise from the inability of drugs to fully penetrate abnormal, heterogeneous, and irregularly vascularized tumor tissue and thereby not reach all of the cancer cells at therapeutic levels (8-11). Accordingly, local physical therapies that uni-versally kill all cells within a selected tissue volume are of great interest. With this as motivation, we consider some fundamental mechanistic aspects of tissue ablation by IRE (12-15) that are relevant to solid tumor treatment.
Axel T. Esser, Ph.D.1Kyle C. Smith, S.M.1,2
Thiruvallur R. Gowrishankar, Ph.D.1James C. Weaver, Ph.D.1,*
1Harvard-MIT Division of Health Sciences and Technology2Department of Electrical Engineering and Computer Science Massachusetts Institute of Technology77 Massachusetts Avenue 16-318Cambridge, MA 02139, USA
*Corresponding Author:James C. Weaver, Ph.D.Email: [email protected]
261
Abbreviations: IRE, Irreversible electroporation; PM, Plasma membrane; REB, Reversible elec-trical breakdown; ECT, Electrochemotherapy; TL, Transport lattice; SE, Smoluchowski equation; SAR, Specific absorption rate.
Open Access ArticleThe authors, the publisher, and the right holders grant the right to use, reproduce, and disseminate the work in digital form to all users.
262 Esseretal.
Technology in Cancer Research & Treatment, Volume 6, Number 4, August 2007
At the outset, it is important to recognize that electropora-tion is not simply punching small holes in a cell membrane. Instead, a widely accepted hypothesis of electroporation involves dynamic transient pores (16, 17). These pores are created electrically, expand and contract agilely in response to elevated values of the time-dependent PM transmembrane voltage, ΔψPM, and are destroyed randomly with a mean life-time estimated to range from milliseconds to even minutes or hours. Electroporation involves highly non-linear local electrical interactions with membranes. This results in rapid redistribution of electrical currents and fields by feedback through heterogeneous, time-dependent local populations of conducting pores, mediated through pathways within the fixed intra- and extra-cellular electrolytes. Thus, the entire cell system interacts and exhibits emergent behavior. Exam-ples of emerging pore sites include the polar regions of spher-ical cells (18-20), the analogs to polar regions of cylindrical cells (21-23), and local sites in closely spaced cells within the irregular geometry of a solid tissue (24). These membrane models assume neither where electroporation will occur nor the magnitude of ΔψPM at which significant numbers of pores will be created. Instead electroporation emerges on the basis of the underlying physics-based electroporation model and as the result of the electric interaction throughout the whole system model. Previously, dynamic pore distributions could be described only for the simple geometry of artificial planar bilayer membranes (25-27), two faces of a cubic cell model (28, 29), or the membrane of an isolated spherical cell (20). As demonstrated here, conventional electroporation of irreg-ular cell membranes in a multicellular environment can now also be described, giving new insights in microdosimetric conditions, and leading towards a mechanistic understanding of tissue electroporation properties.
Pores may form in virtually any cell for strong but brief (nanoseconds to milliseconds) exposures to electric fields ranging from about 100 V/cm (longest pulses) to 100,000 V/cm (shortest pulses). PM electroporation itself is essentially universal because electroporation within the phospholipid regions of cell membranes appears inescapable once ΔψPM reaches several hundred millivolts. The ΔψPM value at which pore creation increases depends not only on the rate at which ΔψPM rises, but primarily on a complex kinetic behavior within the energetic landscape of pore states leading to hy-drophilic pores (27). Contrary to many literature statements, there is, therefore, no fixed voltage threshold for electropora-tion (27). The resulting pore densities can provide a mem-brane conductivity well beyond that of all ion channels. This high-conductivity state protects the membrane, and although this is often termed reversible electrical breakdown (REB), it actually reflects an agile but gentle structural rearrangement of the phospholipids (16, 17), as demonstrated in molecular dynamics simulations (30, 31). Significantly, both reversible and irreversible electroporation have been observed in bilay-
er membranes (32). Irreversible behavior is attributed to bi-layer rupture by uncontrolled pore growth and the outcome is governed by the local ΔψPM behavior (magnitude, shape, and duration), and the relatively large membrane tension (25).
The earliest reports known to the present authors of irrevers-ible (33) and reversible (34) electroporation in cells were observed in the nodes of Ranvier of myelinated nerves. Sub-sequent studies of microorganisms showed cell killing at-tributable to irreversible membrane changes (35-37). These early reports are consistent with experimental observations of a non-thermal contribution to electrical injury. The lat-ter led to the hypothesis of electroporation-induced necrosis within living tissue by Lee and co-workers (38-40). Their motivation was the recognition that electrical injury is often characterized by the preferential death of large mammalian cells (skeletal muscle, nerves) in tissue regions where insig-nificant temperature rise occurs.
PM permeabilization and the resulting pore sizes in cells are fundamental to understanding necrotic cell death by IRE. However, a basic distinction needs to be made as there ap-pear two distinct mechanisms that can lead to necrotic cell death and, thus, irreversibility: (i) evolution of a pore popula-tion such that a significant number or size of pores become trapped or held open for sufficiently long times such that a lethal biochemical imbalance is created, and (ii) evolution of pores such that a lethal biochemical change happens within the cellular compartment, even if pores vanish in a relatively short time (17) and, thus, electroporation itself is reversible. It is presently unknown which mechanism is most relevant for necrotic cell death by IRE.
With this background and motivation it is gratifying that purposeful tissue ablation by IRE is being pursued for clini-cal use as a promising approach to solid tumor therapy (13). Significantly, the electric field pulse waveforms (magnitude, shape, and timescale) may be different from those generally used in tissue ablation by electrochemotherapy (ECT) (41-43). For example, Miller et al. reported cancer cell ablation by IRE using three repetitions of 1,500 V/cm pulses with 300 μs duration (12). A further description of IRE was provided by Edd et al. (14) by using a single 20 ms square pulse of 1,000 V/cm. Clinical implications of IRE and relevant wave-forms, as described by Rubinsky et al. (15), use a train of up to eight 100 μs trapezoidal pulses, temporal conditions similar to those applied in ECT.
Methods
We use the transport lattice (TL) method, which allows for a convenient description of electrical, chemical, and thermal behavior in a complex biological geometry that may contain inhomogeneities and anisotropies. Basic features of the TL

Technology in Cancer Research & Treatment, Volume 6, Number 4, August 2007
IntrinsicRedistribution 263
method have been presented elsewhere (21-24, 44, 45). Here we describe two system models, a multicellular model of ir-regular cells and a tissue model, and consider their electri-cal and thermal responses to some characteristic IRE pulses. Each system model represents rabbit liver tissue but on a dif-ferent spatial scale. The modeling methods described here might also be useful in describing conventional electropora-tion in cell pellets (46, 47) and in dense cell suspension (48).
Multicellular Model
The system geometry, shown in Figure 1A, is based on a drawing motivated by a tissue section image. It features a layer of 20 liver cells with 14% interstitial fluid volume (49). The hepatocytes have an average cell size diameter of 21.7 μm (42). A corresponding TL (101 nodes × 101 nodes) was constructed as a large electric circuit comprising ~ 104 local models for passive charge transport and storage (re-sistors, capacitors) within electrolytes and active elements (pumps, electroporation) at the membrane (Fig. 1B). The linked local membrane and electrolyte models are distrib-uted spatially and are connected to their nearest neighbors on a Cartesian lattice (21, 44). The local membrane models are interconnected at the regularly spaced nodes, with sub-models that represent the PM and two contacting regions of electrolyte (Fig. 1B) (21, 44). There is no transport in the z-direction in this two-dimensional model. The lattice spacing, as well as the depth of the system model, is 1 μm, leading to a spatial scale of 100 μm × 100 μm. Voltages applied along the top and bottom boundary of the system model provide the applied uniform field.
Multiscale Tissue Model
The tissue system comprises a large tissue region and two ideal cylindrical electrodes, each with radius re = 0.25 mm, separated by Le = 10 mm (Fig. 1C) (50). The nominal ap-plied electric field, Eapp is defined here as the voltage differ-ence between the electrodes, Vapp, divided by the electrode spacing, Le. Although needle electrodes actually have spa-tially varying fields, the term nominal electric field may be used for convenience, and it is also in line with the original definition in the limit of infinite needle radii (i.e., planar electrodes) (51). The tissue system with scale 200 mm × 200 mm is symmetric about y=0. Thus, a no-flux boundary was placed at y=0 and only the region y ≥ 0 was actually meshed and simulated. Nodes were optimally distributed throughout the tissue system using a meshing algorithm developed by Persson and Strang (52). Figure 1D shows the mesh near the electrodes. The multiscale tissue model accounts for the electrical response at both the microscopic (e.g., PM electroporation) and macroscopic (e.g., needle geometry) scales and the interplay between the two (50). The scale of the tissue system is orders of magnitude larger
than the scale of the cells and therefore a discretization of the system could not realistically resolve individual cells and membranes. The multiscale model uses representa-tive simple cell models distributed throughout the system model to calculate the local cell and membrane response, and the macroscopic electrical transport properties are de-termined by the distributed models.
(A) Multicellular model (B) Circuits
(C) Tissue system dimensions (D) Tissue system mesh
(E) Tissue model cell unit (F) Passive tissue conductivity
Eapp
20µm
Le
re
43210
-1-2-3-4
y (m
m)
x (mm)-8 -6 -4 -2 0 2 4 6 8
ModelRaicu et al.
1
0.8
0.6
0.4
0.2
0
σ (S
/m)
f (Hz)102 103 104 105 106 107 108
Figure 1: (A) Geometry of the multicellular model of a region of liver tissue with 14% interstitial space. The extracellular electrolyte is shown in blue, the cells in red. (B) Circuits: Functional local models that represent electrolyte (Mel), membrane (Mm), and the PM-electrolyte interface in the 101 × 101 TL; details described elsewhere (21, 22, 44). The equivalent circuit representing the asymptotic electroporation model (left gray box) (21) and its extension to the SE (right gray box) (54) is solved at every local membrane site. The pore distribution is discretized, and pore drift and diffusion in pore-radius space determine the associated non-Ohmic pore conductance that is input for the membrane current Im in module Mm. (C) The tissue system model contains two circular electrodes in a 200 mm × 100 mm tissue region (only a small subregion of the entire simulation region is shown). The electrodes have radii re = 0.25 mm and separation Le = 10 mm (edge-to-edge). (D) The tissue system mesh (only a small subregion of the mesh close to the needle electrodes is shown). (E) The tissue model cell unit comprises extracellular (e), membrane (m), and intracellular (i) regions in series and a parallel shunt region. The spatial and electrical parameters of the regions are labeled. (F) The passive tissue conductivity of the tissue model, obtained from an ac frequency sweep in SPICE, is compared with experimental measurements on rat liver by Raicu et al. (53).
264 Esseretal.
Technology in Cancer Research & Treatment, Volume 6, Number 4, August 2007
Tissue Level: The impedance of a region of tissue is equal to the impedance of a cell scaled to have the same relative dimensions, assuming that tissue comprises a uniform grid of such cells. Thus, we use the simple cell model shown in Figure 1E, which has a membrane enclosed region of intra-cellular electrolyte surrounded by extracellular electrolyte (50). This simple model can be straightforwardly translated into an equivalent circuit. The membrane and each region of electrolyte have an associated conductivity σ and permit-tivity ε (Table I). Additionally, each electrolyte region has a tortuosity ν to account for the structural complexity of tissue not otherwise represented by the model. The relative sizes were chosen such that 14% of the total volume was extracel-lular. The tortuosities ν were used as free parameters in fit-ting the frequency-dependent rat liver tissue conductivity to that measured experimentally by Raicu et al. (53). By this choice of electrical and geometrical parameters, the model reproduces the static conductivity value and approximate-ly the same trend in the frequency dependence (Fig. 1F). The equivalent circuit for the simple cell model (Fig. 1E) is placed between each pair of adjacent nodes in the mesh with electrical components scaled to the local mesh geometry. The effective conductivity of the membrane changes in ac-cordance with the local degree of membrane electroporation as determined by the distributed cell models.
Cell Level: An equivalent circuit for a single cell is created for each node in the tissue level mesh to determine the cel-lular response to the local electric field. Each of these circuits is distinct from the primary, macroscopic tissue-level circuit network, but all of the circuits are solved simultaneously. The asymptotic model of electroporation is used as described below. The voltage across the cell unit is equal to the lo-cal electric field magnitude, as determined from the electric potential of the nodes in the mesh, multiplied by the cell unit length lu. The distributed cell models determine the trans-membrane voltage and pore density throughout the tissue do-main as functions of time. The pore density then determines the membrane conductivity used in the macroscopic transport
network. Thus, there is continual feedback between the mac-roscopic (tissue level) and microscopic (cellular level) mod-els: the macroscopic behavior determines the local electric field in the microscopic model and the subsequent behavior at the microscopic scale (e.g., electroporation) then determines the local electrical properties at the macroscopic scale.
Electrolyte and Membrane Models
The passive electric components for the electrolyte are resis-tors and capacitors (44) (Fig. 1B). The membrane circuits (Fig. 1B) include components for charge storage and con-duction, resting potential, and the asymptotic or SE model of electroporation (21). This provides a convenient means for combining the dm = 5 nm thick membrane with a TL of much larger scale. The dielectric constant of the extra- and intra-cellular electrolytes, εe, is 72. Close to a pore the membrane dielectric is treated as pure lipid and assigned a dielectric con-stant, εl, of 2.1. This choice recognizes that local membrane properties are relevant to pore formation. In contrast, the PM capacitance involves a spatial average over membrane lipid and protein regions resulting in a relative permittivity, εm, of 5. The extracellular electrolyte has a conductivity, σe, of 1.2 S/m while the medium inside the cell has a conductiv-ity, σi, of 0.4 S/m. These conductivity values are identical to the validated macroscopic model. Following Läuger (54) we use a simplified, single resting potential source model (Fig. 1B) comprised of an active voltage source, Vip, and source series resistance, Rip (21). Here, the fixed quantities Vip and Rip, together with a negligible conductivity of the equilib-rium pores (27), determine the membrane resting potential, ψPM,rest, in the absence of applied fields.
Electroporation Models
The transient aqueous pore hypothesis of electroporation is based on continuum models of membrane pores, mechani-cal and electrostatic energy differences W, and thermal fluc-tuations, usually in the form of the Smoluchowski equation (SE) (25-27, 55-57):
The SE describes the evolution of the local PM pore distri-bution n in terms of the number of hydrophilic pores and pore radius rp, given by the diffusion constant Dp. The as-ymptotic model (56) is an approximation to the SE-based models that disregards pore size change, and can be used to describe cell and tissue responses to nanosecond time scale pulses (22, 24). For longer ECT and IRE pulses, the asymptotic model approximates the system electrical re-sponse. These pores readily transport Na+, Cl-, and K+ ions that dominate extracellular and cytosolic conductivity, but
Table I Tissue model parameters.
Parameter Description Value re electrode radius [mm] 0.25 Le electrode distance (edge-to-edge) [mm] 10 e= i electrolyte conductivity [S/m] 1.2
m membrane conductivity [S/m] 9.5 10-9
e= i electrolyte permittivity 72 0
dm membrane thickness [nm] 5 e tortuosity (external) 1 i tortuosity (internal) 3
fe extracellular volume fraction 0.14 c=lc cell dimensions [μm] 21.7 u=lu unit cell dimensions [μm] 23.4 l multicellular system node spacing [μm] 1
[ ( )]∂n∂t = .∂
∂rpDp ∂n
∂rp+ nkBT
∂W∂rp
[1]

Technology in Cancer Research & Treatment, Volume 6, Number 4, August 2007
IntrinsicRedistribution 265
not significantly larger molecules. The implementation of the asymptotic electroporation model in terms of an equiv-alent circuit is described in detail elsewhere (21). It has been recently generalized to include dynamic pore expan-sion and contraction based on the SE electroporation model (57). The extended equivalent circuit is given in Figure 1B and represents drift and diffusion in pore radius space from the minimum pore radius (rmin = 0.8 nm) to a maximal pore radius (considered here as rmax = 3 nm). From the pore distribution, we find the local non-Ohmic membrane con-ductivity σm (27), that, together with the local ΔψPM, deter-mines the membrane current Im as input into the membrane circuit Mm. This approach describes the PM response to conventional electroporation, for which the pulse duration may be much longer than the PM charging time, typically 0.2 to 1 μs for isolated cells. Irregular shaped cells close together in a tissue have a heterogeneous and generally lon-ger PM charging time due to long and often tortuous aque-ous pathways within the interstitial space. Pore lifetimes reported in the literature vary over many orders of time (from milliseconds to hours) (17) and there is presently no mechanistic understanding of this large range; we use an illustrative experimental value, 3 ms (58), but note that this paper only considers electric conditions during the pulse for which the value of the pore lifetime is not relevant. All electroporation parameters are given in Ref. (27).
TL Solution
The system model circuits are solved for the electric poten-tial φ by means of Kirchhoff’s laws using Berkeley SPICE 3f5. SPICE generates solutions that are processed and dis-played in Matlab as equipotentials and distributions of elec-troporated regions (21-24).
Specific Absorption Rate
The specific absorption rate (SAR), defined as Joule heating σ|∇φ|2 divided by the tissue (electrolyte) mass density ρ, is traditionally used in the electrical characterization of tissue to time-varying electromagnetic fields (e.g., cell phones and MRI exposures). At a given time point, SAR is calculated as follows (44). In a local volume of electrolyte, represented by model Mel (Fig. 1A), a SAR contribution of V(t)2σel/(ρl2)/2 is added at the two nodes (in the SAR array) between which the model is connected. Here, σel is either the intracellular or extracellular electrolyte conductivity, l is the lattice spacing, and V=Δφ is the voltage difference between the two nodes at time t. In the case of a membrane model (Mm; Fig. 1A), the SAR contribution is (V1(t)2σe/(ρl2))/2 + ΔψPM(t)2σm(t)/(ρdm
2) + (V2(t)2σi/(ρl2))/2 where V1(t) and V2(t) are the volt-ages across the two resistors that represent the extracellular and intracellular electrolytes contacting the membrane, and the membrane thickness dm << l.
Results
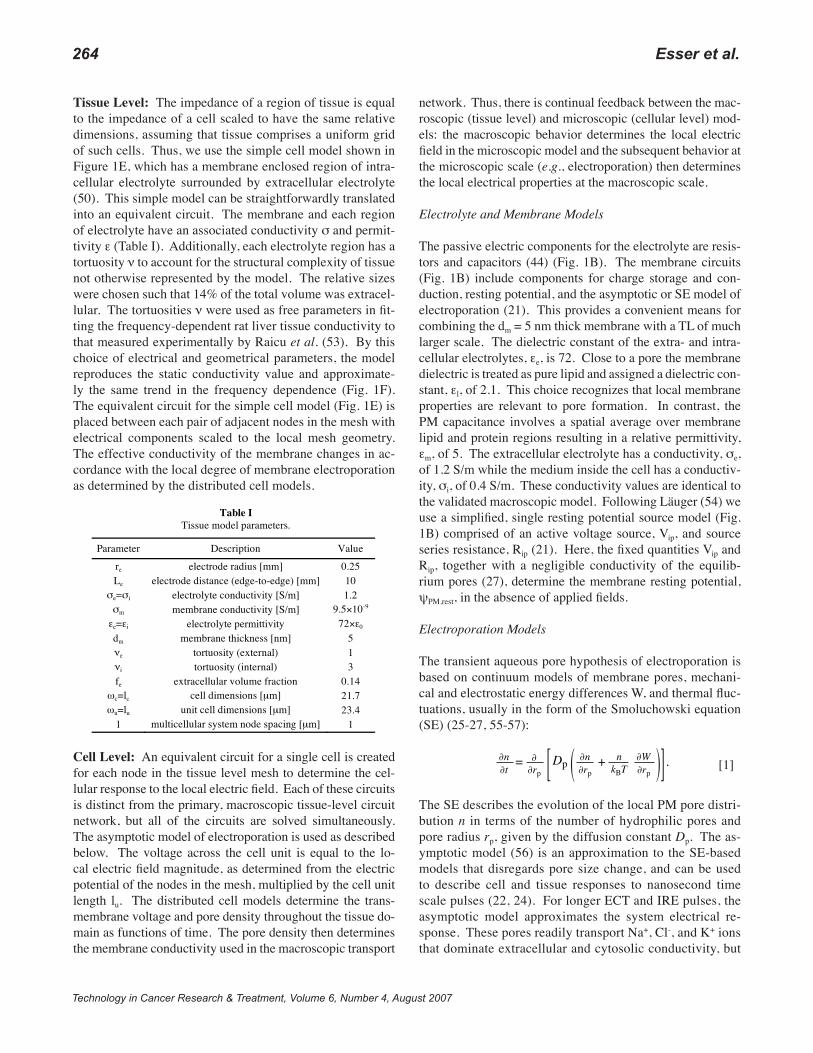
First, we consider a single 100 μs trapezoidal pulse with 1 μs rise and fall times that represent widely used ECT pulses and some IRE pulses. We consider both 400 V/cm and 700 V/cm magnitudes, corresponding for those pulse waveforms, respectively, to the recently reported thresholds for reversible and irreversible electroporation in liver tissue (42, 59). Figure 2 shows the multicellular responses to a 700 V/cm pulse at the end of the pulse (t = 99 μs) for a passive membrane (without electroporation) and a membrane with the SE electroporation model. For the passive response, the current is entirely driven through the interstitial space, and the voltage contours are concentrated around the cells, indicating elevated transmembrane voltages at the PM. In striking contrast, electroporation leads to local high-con-ductivity transients that cause a strong redistribution of the current being driven partially through the cell interior. The voltage contours are still concentrated around the cells, but to a smaller extent. This reflects electroporation limiting the magnitude of the PM transmembrane voltage to values ΔψPM < 1.5 V (not shown).
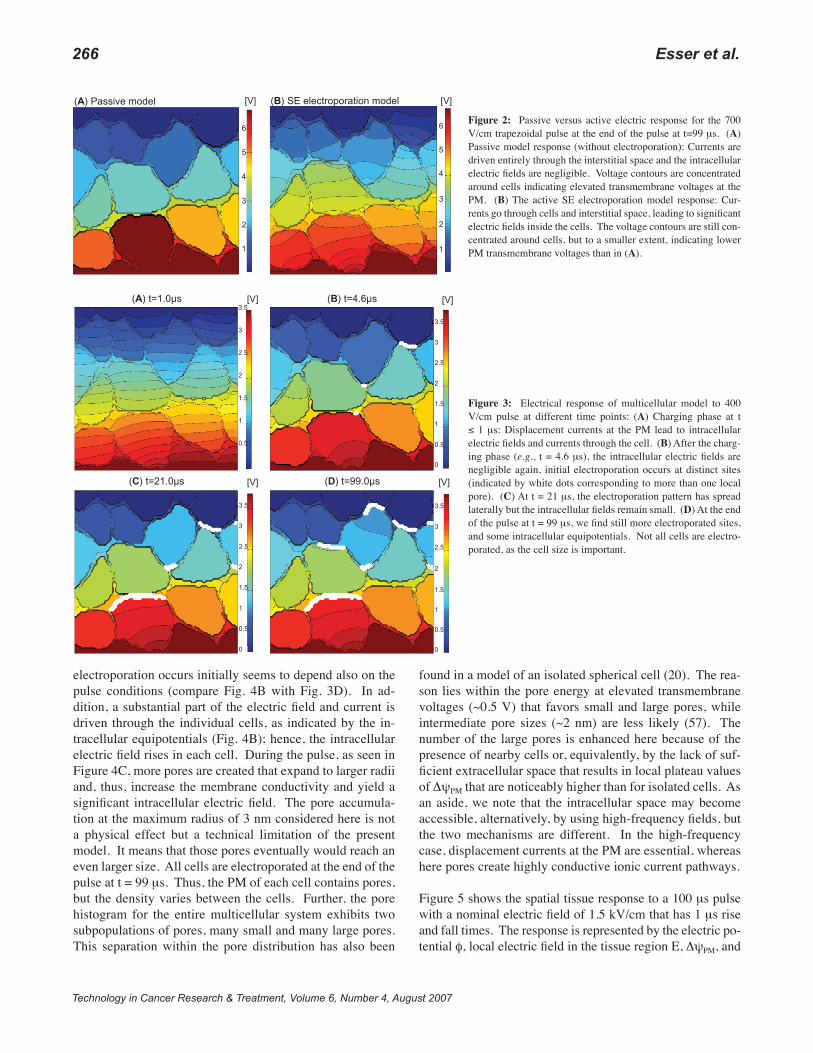
Figure 3 shows the distributed response to the 400 V/cm pulse with the SE electroporation model at different time points during the pulse. White dots correspond to local membrane areas with at least one local pore. Prior to the end of the pulse rise time (t ≤ 1 μs), we find the electric field penetrating the entire multicellular region due to membrane displacement currents. Intracellular electric fields decline substantially after the initial charging phase, and it requires electroporation to re-establish significant intracellular fields. Initial electroporation is seen at t = 4.6 μs at distinct sites. The electroporation pattern evolves with time and includes more and more membrane sites. At the end of the pulse, not all the cells are found to be electroporated; smaller cells are spared as conventional electroporation is strongly cell-size dependent. Significantly, however, our results agree with the notion of a minimum field strength that is needed to revers-ibly electroporate all cells in liver tissue (42).
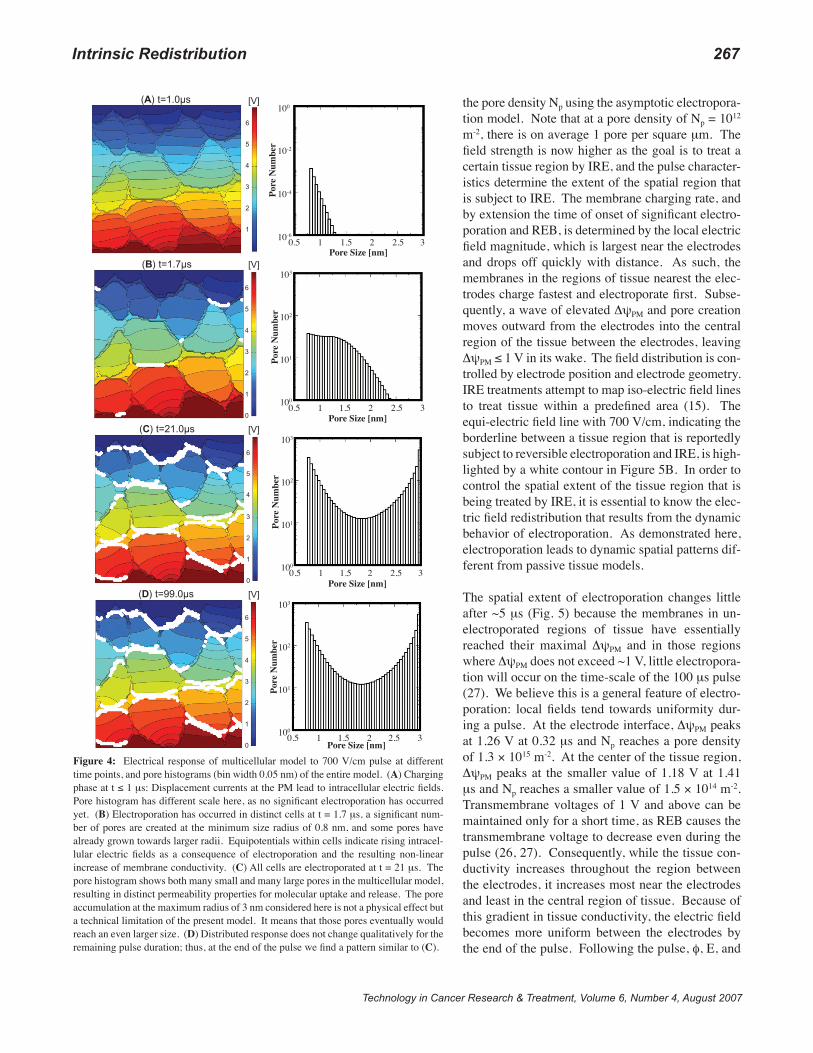
In Figure 4, we present the distributed response to the 700 V/cm pulse. In addition to the distributed electrical behav-ior, pore histograms give the resulting pores in the whole model as functions of pore size and time. Again, there is no substantial electroporation at the end of the pulse rise time, and the pore histogram reflects the equilibrium pore distribution’s response to higher transmembrane voltage values. At t = 1.0 μs there is, thus, much less than one lo-cal pore present (see histogram scale) while displacement currents penetrate all cells, and the maximum ΔψPM is 0.75 V. At t = 1.7 μs, electroporation has occurred in distinct cells, and the pore histograms demonstrate that some pores already had time to expand. Interestingly, local sites where
266 Esseretal.
Technology in Cancer Research & Treatment, Volume 6, Number 4, August 2007
electroporation occurs initially seems to depend also on the pulse conditions (compare Fig. 4B with Fig. 3D). In ad-dition, a substantial part of the electric field and current is driven through the individual cells, as indicated by the in-tracellular equipotentials (Fig. 4B); hence, the intracellular electric field rises in each cell. During the pulse, as seen in Figure 4C, more pores are created that expand to larger radii and, thus, increase the membrane conductivity and yield a significant intracellular electric field. The pore accumula-tion at the maximum radius of 3 nm considered here is not a physical effect but a technical limitation of the present model. It means that those pores eventually would reach an even larger size. All cells are electroporated at the end of the pulse at t = 99 μs. Thus, the PM of each cell contains pores, but the density varies between the cells. Further, the pore histogram for the entire multicellular system exhibits two subpopulations of pores, many small and many large pores. This separation within the pore distribution has also been
found in a model of an isolated spherical cell (20). The rea-son lies within the pore energy at elevated transmembrane voltages (~0.5 V) that favors small and large pores, while intermediate pore sizes (~2 nm) are less likely (57). The number of the large pores is enhanced here because of the presence of nearby cells or, equivalently, by the lack of suf-ficient extracellular space that results in local plateau values of ΔψPM that are noticeably higher than for isolated cells. As an aside, we note that the intracellular space may become accessible, alternatively, by using high-frequency fields, but the two mechanisms are different. In the high-frequency case, displacement currents at the PM are essential, whereas here pores create highly conductive ionic current pathways.
Figure 5 shows the spatial tissue response to a 100 μs pulse with a nominal electric field of 1.5 kV/cm that has 1 μs rise and fall times. The response is represented by the electric po-tential φ, local electric field in the tissue region E, ΔψPM, and
(A) Passive model (B) SE electroporation model [V][V]
6
5
4
3
2
1
6
5
4
3
2
1
Figure 2: Passive versus active electric response for the 700 V/cm trapezoidal pulse at the end of the pulse at t=99 μs. (A) Passive model response (without electroporation): Currents are driven entirely through the interstitial space and the intracellular electric fields are negligible. Voltage contours are concentrated around cells indicating elevated transmembrane voltages at the PM. (B) The active SE electroporation model response: Cur-rents go through cells and interstitial space, leading to significant electric fields inside the cells. The voltage contours are still con-centrated around cells, but to a smaller extent, indicating lower PM transmembrane voltages than in (A).
(A) t=1.0µs (B) t=4.6µs
(C) t=21.0µs (D) t=99.0µs
[V] [V]
[V] [V]
3.5
3
2.5
2
1.5
1
0.5
3.5
3
2.5
2
1.5
1
0.5
0
3.5
3
2.5
2
1.5
1
0.5
0
3.5
3
2.5
2
1.5
1
0.5
0
Figure 3: Electrical response of multicellular model to 400 V/cm pulse at different time points: (A) Charging phase at t ≤ 1 μs: Displacement currents at the PM lead to intracellular electric fields and currents through the cell. (B) After the charg-ing phase (e.g., t = 4.6 μs), the intracellular electric fields are negligible again, initial electroporation occurs at distinct sites (indicated by white dots corresponding to more than one local pore). (C) At t = 21 μs, the electroporation pattern has spread laterally but the intracellular fields remain small. (D) At the end of the pulse at t = 99 μs, we find still more electroporated sites, and some intracellular equipotentials. Not all cells are electro-porated, as the cell size is important.
Technology in Cancer Research & Treatment, Volume 6, Number 4, August 2007
IntrinsicRedistribution 267
the pore density Np using the asymptotic electropora-tion model. Note that at a pore density of Np = 1012 m-2, there is on average 1 pore per square μm. The field strength is now higher as the goal is to treat a certain tissue region by IRE, and the pulse character-istics determine the extent of the spatial region that is subject to IRE. The membrane charging rate, and by extension the time of onset of significant electro-poration and REB, is determined by the local electric field magnitude, which is largest near the electrodes and drops off quickly with distance. As such, the membranes in the regions of tissue nearest the elec-trodes charge fastest and electroporate first. Subse-quently, a wave of elevated ΔψPM and pore creation moves outward from the electrodes into the central region of the tissue between the electrodes, leaving ΔψPM ≤ 1 V in its wake. The field distribution is con-trolled by electrode position and electrode geometry. IRE treatments attempt to map iso-electric field lines to treat tissue within a predefined area (15). The equi-electric field line with 700 V/cm, indicating the borderline between a tissue region that is reportedly subject to reversible electroporation and IRE, is high-lighted by a white contour in Figure 5B. In order to control the spatial extent of the tissue region that is being treated by IRE, it is essential to know the elec-tric field redistribution that results from the dynamic behavior of electroporation. As demonstrated here, electroporation leads to dynamic spatial patterns dif-ferent from passive tissue models.
The spatial extent of electroporation changes little after ~5 μs (Fig. 5) because the membranes in un-electroporated regions of tissue have essentially reached their maximal ΔψPM and in those regions where ΔψPM does not exceed ~1 V, little electropora-tion will occur on the time-scale of the 100 μs pulse (27). We believe this is a general feature of electro-poration: local fields tend towards uniformity dur-ing a pulse. At the electrode interface, ΔψPM peaks at 1.26 V at 0.32 μs and Np reaches a pore density of 1.3 × 10¹⁵ m-2. At the center of the tissue region, ΔψPM peaks at the smaller value of 1.18 V at 1.41 μs and Np reaches a smaller value of 1.5 × 10¹⁴ m-2. Transmembrane voltages of 1 V and above can be maintained only for a short time, as REB causes the transmembrane voltage to decrease even during the pulse (26, 27). Consequently, while the tissue con-ductivity increases throughout the region between the electrodes, it increases most near the electrodes and least in the central region of tissue. Because of this gradient in tissue conductivity, the electric field becomes more uniform between the electrodes by the end of the pulse. Following the pulse, φ, E, and
(A) t=1.0µs
(B) t=1.7µs
(C) t=21.0µs
(D) t=99.0µs
[V]
[V]
[V]
[V]
6
5
4
3
2
1
6
5
4
3
2
1
0
6
5
4
3
2
1
0
6
5
4
3
2
1
0
Pore
Num
ber
Pore
Num
ber
Pore
Num
ber
Pore
Num
ber
Pore Size [nm]
Pore Size [nm]
Pore Size [nm]
Pore Size [nm]
0.5 1 1.5 2 2.5 3
0.5 1 1.5 2 2.5 3
0.5 1 1.5 2 2.5 3
0.5 1 1.5 2 2.5 3
100
10-2
10-4
10-6
103
102
101
100
103
102
101
100
103
102
101
100
Figure 4: Electrical response of multicellular model to 700 V/cm pulse at different time points, and pore histograms (bin width 0.05 nm) of the entire model. (A) Charging phase at t ≤ 1 μs: Displacement currents at the PM lead to intracellular electric fields. Pore histogram has different scale here, as no significant electroporation has occurred yet. (B) Electroporation has occurred in distinct cells at t = 1.7 μs, a significant num-ber of pores are created at the minimum size radius of 0.8 nm, and some pores have already grown towards larger radii. Equipotentials within cells indicate rising intracel-lular electric fields as a consequence of electroporation and the resulting non-linear increase of membrane conductivity. (C) All cells are electroporated at t = 21 μs. The pore histogram shows both many small and many large pores in the multicellular model, resulting in distinct permeability properties for molecular uptake and release. The pore accumulation at the maximum radius of 3 nm considered here is not a physical effect but a technical limitation of the present model. It means that those pores eventually would reach an even larger size. (D) Distributed response does not change qualitatively for the remaining pulse duration; thus, at the end of the pulse we find a pattern similar to (C).

268 Esseretal.
Technology in Cancer Research & Treatment, Volume 6, Number 4, August 2007
ΔψPM rapidly decrease (Fig. 5E-G) with a complex discharge pattern. Np remains elevated (Fig. 5H), and decays with an assumed 3 ms time-constant. As such, the perturbation of the tissue is long-lived, lasting much longer than the dura-tion of the applied pulse, and molecular uptake or release may persist long after the pulse.
Figure 6 presents the total current (per system depth) through the entire tissue. We compare the passive tissue model with the active (electroporation-based) tissue model. The current is approximately twice as large for the asymp-totic electroporation model (solid line) than for the passive model (dashed line) because electroporation in the active
model increases the tissue conductivity by that factor. This is an average factor, as there are gradients in tissue conduc-tivity as discussed in Figure 5. This means that the Joule heating is about two times bigger than in the passive model. After the initial current spike due to displacement currents that also coincides with the maximum in pore creation rate (REB), the passive model has an essentially flat current pla-teau, whereas the asymptotic electroporation model shows a characteristic slope in the current that indicates the slower creation of additional pores. We speculate here that the SE electroporation model would tend to increase this slope even more as pore expansion during the pulse leads to fur-ther membrane conductivity increases (57).
Dur
ing
Puls
eA
fter P
ulse
(A) Electric potential
φ (V)
(B) Electric fieldmagnitudeE (Vm-1)
(C) TransmembranevoltageΔψPM (V)
(D) Pore density
Np (m-2)-500 0 500 104 105 0.2 0.4 0.6 0.8 1 1.2 108 1010 1012 1014
1 μs
4.6 μs
21 μs
99 μs
(E) Electric potential
φ (V)
(F) Electric fieldmagnitudeE (Vm-1)
(G) TransmembranevoltageΔψPM (V)
(H) Pore density
Np (m-2)-50 0 50 103 104 105 0.1 0.2 0.3 0.4 0.5 0.6 108 1010 1012 1014
0 μs
0.5 μs
5 μs
Figure 5: Spatial tissue response based on the asymptotic electroporation model to a 1,500 V/cm trapezoidal pulse with 100 μs duration. Electric potential, electric field magnitude, transmembrane voltage, and pore density, as calculated from the asymptotic electroporation model, near the electrodes (A)-(D) during and (E)-(F) after the pulse. On each plot, 21 (for φ) or 11 (for E, ψPM, and Np) contour lines are spaced evenly between the extreme values of the associated colorscale bar. Spatial response along centerline: (A) Electric field magnitude, (B) transmembrane voltage, and (C) pore density along the centerline (y = 0 mm). Times shown (from black to light gray) are 1, 4.6, 21, and 99 μs during the pulse, as well as 0.5 and 5 μs after the pulse. The white contour in (B) changes with time and denotes a field strength of 700 V/cm that indicates a reported borderline region between tissue that experiences IRE and reversible electroporation conditions (15).

Technology in Cancer Research & Treatment, Volume 6, Number 4, August 2007
IntrinsicRedistribution 269
From the spatially distributed electrical response we can pro-ceed to estimate local SAR values. Figure 7 shows the spatial-ly distributed SAR in the multicellular model for the 700 V/cm pulse at the end of the pulse. Two different situations are com-pared, (i) passive membranes, and (ii) membranes described by the SE electroporation model. SAR is highly heteroge-neous and localized, with large values around the membranes and the interstitial space. Within the intracellular space, SAR contribution is much stronger when electroporation occurs, as the current is partially driven through the cells.
With the local SAR at our disposal, we can estimate the tem-perature change in the multicellular model. Many bioheat transfer problems in the context of pulsed electric fields have
been modeled using the Pennes equation, which accounts for the ability of tissue to remove heat by both passive conduction (diffusion) and perfusion of tissue by blood (13, 60). Perfu-sion can be defined in a tissue region if a sufficient number of capillaries are present such that an average flow description is reasonable, and therefore a spatial scale of more than ~100 μm must be considered. The multicellular model is below that scale. In addition, on the short pulse time scale we consider here, thermal diffusion would not be fast enough on a 100 μm length scale to reach nearby capillaries. Indeed, a simple estimate for the diffusional spreading length on a 100 μs time scale is ~3 μm. For these conditions, we, therefore, can ne-glect perfusion (61) (as well as the metabolic heat generation) and consider the diffusion dominated bioheat equation:
Here, ρ, c, κ are the density, specific heat, and thermal con-ductivity of tissue, respectively, T is local tissue tempera-ture, and t is time.
Figure 8 gives the spatial distributed temperature increase ΔT in the multicellular model as calculated using Eq. [2] for the passive and SE electroporation model. The thermal properties were assumed to be uniform (c = 3600 J/kg K; κ = 0.512 W/m K; ρ = 1060 kg/m3) (13). The boundar-ies of the model were treated as thermal sinks. This ~100 μm separation of thermal sinks is about 2.5× the spacing of capillaries. The SAR was input into Eq. [2] to calculate the temperature at the corresponding time point. When the time interval between successive time steps (obtained from the electrical model) was larger than the minimum value to guarantee numerical stability, the SAR was interpolated to finer time intervals (0.1 l2cρ/κ). Without thermal diffusion the maximum temperature rise would be 0.4 ºC for 700 V/cm in the passive model compared to 0.8 ºC for the SE elec-
troporation model (not shown). However, with thermal diffusion, the temperature increase that is initially mostly confined to the interstitial regions spreads out throughout the multicellular system and decreases the local temperature spikes. In the SE electroporation model, even the intracellular regions showed an initial increase in temperature from baseline by local SAR before thermal diffu-sion leads to an intracellular temperature rise. We believe that this behavior, i.e., local temperature rise in the interstitial volume around the mem-branes and then thermal diffusion into the 86% in-tracellular space that contributed less to the Joule heating, is an effect not captured in any present bioheat equation, and leads to a reduced average temperature increase in tissue by electric field pulses. Comparing the electroporation with the passive thermal response we find that the tempera-
Figure 6: The total current (per system depth) flowing through the tissue system is shown as a function of time for the pulse of Figure 5. The current is approximately twice as large for the asymptotic electroporation model (solid line) than for the passive model (dashed line) because electroporation in the active model, on average, shows an increased tissue conductivity by that factor. After the initial current spike due to displacement currents, the passive model has an essentially flat current plateau, whereas the asymptotic electroporation model shows a slight upward slope in the current that indi-cates the slow creation of additional pores.
ρc ∂T∂t = ∇ ⋅ (κ∇T) + SAR (x,y,t)ρ [2]
(A) Passive model (B) SE electroporation[W/kg]×105 [W/kg]×105
10
8
6
4
2
0
10
8
6
4
2
0
Figure 7: Distributed SAR in the multicellular model, shown at the end of the 100 μs pulse with 700 V/cm, is concentrated at the PM and within “hot” stripes along the field direction (perpendicular currents are much less pronounced); membrane sites are significant for temperature increase. Differences between (A) passive and (B) SE elec-troporation models are significant, in particular the intracellular region contributes to (B) as intracellular Joule heating occurs. The SAR scale is chosen to best compare the intracellular contribution to Joule heating, the maximum local SAR is about two orders of magnitude higher.

270 Esseretal.
Technology in Cancer Research & Treatment, Volume 6, Number 4, August 2007
ture rise can be more than a factor of 2 larger in most regions and more than 2 orders of magnitude larger in some intracel-lular regions. But overall these temperature rises are small and are not expected to cause thermal damage. However, IRE protocols apply trains of pulses, not a single pulse, and the field strength is usually higher than 700 V/cm considered here. Hence larger temperature increases are expected.
The local electropermeability, Pm(rs,t), of the PM for mol-ecule/ion (solute “s”) of radius rs depends on the time-depen-dent ΔψPM and, in order to quantify molecular transport, can be computed for the membrane of each cell according to
In here, Ds is the solute’s diffusion coefficient. The permea-bilization depends on the local pore distribution n(rp,t) and contains all the relevant information on available pore sizes, and, thus, depends on field strength, field duration, number of pulses, but also resealing dynamics and pore lifetime. Each solute experiences a geometric hindrance inside the pore that is given by H(rp,rs), and, if electrically charged, is subject to the partition factor K(rp, ΔψPM) that is governed by the electrostatic interactions (Born energy) inside a pore (27). The overall cell permeability may be obtained from Eq. [3] by integrating over the entire cell. As an example, we will consider the membrane permeability Pm(rs,t) to calcium, ATP, and propidium iodide in future work. One motivation is that uptake or release of certain biochemically important mole-cules may be relevant for their role in IRE-induced necrosis.
Discussion and Conclusion
We have presented multicellular and tissue models and their electric and thermal responses to representative IRE pulses.
Such increasingly realistic models involve complex electrical interactions throughout the system on a sub-microsecond time scale and nanometer to micrometer length scale. The passive electrical properties of tissue are frequency-dependent (62), as higher frequencies allow for access to subcellular com-partments. Tissue exposure by conventional electroporation pulses typically involves a broad band of frequencies (up to ~1 MHz). However, most tissue models assume only a time- or frequency-independent passive tissue conductivity (13, 63), or spatial variation in tissue conductivity that is based on a series of static models and requires a mapping between electric field and conductivity, based on the very experimental results (42, 59) these models seek to predict. They, therefore, lack a mechanistic hypothesis of what is causing the dynamic conductivity changes, and do not provide predictive power, for example, with respect to tissue transport or if different pulse conditions are considered. Here, we have estimated the response of tissue to pulsed electric fields by taking into account dynamic displacement and dynamic conduction cur-rents. Both of our models demonstrate strong redistribution of fields and currents that are electroporation-driven.
A full description of electroporation leads to three major con-sequences with respect to IRE applications: First, a time-de-pendent pore population exhibits dynamic pore size changes during and after the pulse, thereby altering the transport of molecules of different size and charge into and out of each cell, which should be important to future understanding of why IRE leads to necrotic cell death. Second, the associ-ated change in effective membrane electrical conductivity leads to intrinsic field redistributions that elevate the intra-cellular electric field. This itself may cause a biochemical effect inside the cell and lead to cell death by necrosis. And third, a tissue conductivity change leads to greater electric dissipation by Joule heating. Hence, a thermal threshold for the amount of tissue heating caused by IRE pulses cannot
(A) Passive model (B) SE electroporation model
(C) Ratio (D) Ratio (limited scale)
[ºC] [ºC]
0.06
0.05
0.04
0.03
0.02
0.01
0
0.08
0.06
0.04
0.02
250
200
150
100
50
10
8
6
4
2
0
Figure 8: Distributed temperature increase ΔT, shown at the end of the 100 μs pulse with 700 V/cm in the multicellular model. The temperature increase is initially concentrated within “hot” stripes along the PM and the interstitial space due to local SAR; Membrane sites are significant for temperature increase. Differences between (A) passive model and (B) SE electroporation model: Intracellular SAR’s contribute in (B) and lead to tem-perature increase there by Joule heating. The ratio between the temperature increase ΔT of the SE electroporation model and the passive model is shown in (C). The largest differences occur within the cells. Same ratio in (D) on a limited scale, indicating a factor of 2 difference around membranes and the interstitial space. Note that none of these localized temperature rises are sufficient to cause thermal damage.
Pm(rs,t) = πDsdm
n(rp,t)r2pK(rp,ΔψPM)H(rp,rs)drprmin
rmax
∫ [3]

Technology in Cancer Research & Treatment, Volume 6, Number 4, August 2007
IntrinsicRedistribution 271
be obtained by passive models alone. Instead, an increase in electrical conductivity by PM electroporation must be in-cluded and is significant. Post-pulse conductivity measure-ments (14) do not show the full conductivity increase that is obtained during the pulses as pores will shrink and some may have decayed by that time.
Effective conductivity changes and local electric fields are not the only parameters relevant to understanding the tis-sue response to strong field pulses. In addition, and even more importantly, the local permeability Pm(rs) with respect to a certain type of molecules “s” is a relevant quantity that distinguishes different pulse parameter and waveforms. For example, nanosecond electric field pulses (64, 65) cause large changes in tissue conductivity and strong local elec-tric fields, but the membrane permeability to molecules like propidium iodide or DNA may remain small. In contrast, conventional electroporation electric field pulses as dis-cussed here for IRE will lead to much less dramatic con-ductivity changes, and smaller local electric fields, but the electropermeability Pm(rs) for large molecules is significant. Previous tissue models that do not consider electroporation explicitly (13, 42, 59, 63) cannot assess molecular transport and thus biochemical tissue change.
Electropermeabilization is, thus, a major consequence of electroporation. Accumulation of pores often increases the PM permeability dramatically and is essential for cell uptake of external molecules, the main application of electropora-tion. A striking example is transfection of cells in vitro by electroporation-based DNA delivery, which was a seminal development (66), so much so that “electroporation” is often incorrectly used to mean the complete process of successful delivery of DNA into the cytoplasm, transport to and into the nucleus, followed by expression. This multistep process is complex and has been optimized substantially in recent years, leading to electroporation-based non-viral gene transfer that appear superior to other transfection techniques (67-69).
Temperature estimates are crucial to limiting the IRE field parameters to a non-thermal intervention. The temperature increase in the tissue that results from IRE pulses can be found from local SAR values, and the bioheat equation (13, 60). For the time and length scales of the multicellular model considered here, a diffusion dominated bioheat Equation [2] may be employed. Most importantly, local SAR values as input from the SE electroporation model lead to higher local temperatures rises than with the passive model. These local hot stripes spread out throughout the whole system, and this process is limited by the thermal diffusion time scale.
Usually, ECT and IRE protocols employ trains of identical electric pulses. In terms of electroporation properties, it can be shown that a second pulse does not give rise to more pores,
irrespective of pulse repetition frequency and pore lifetime. This is due to a memory effect of electroporation. In particu-lar, the associated high-conductivity state, i.e., the specific number of pores and their size, is determined by the pulse amplitude and duration. A second pulse will interact with a higher conductivity membrane and add only as many pores to the pre-existing number of pores (that persist from the first pulse) such that the same total number of pores are created as with the first pulse, or even fewer if pore expansion is ac-counted for (Esser, unpublished).
The goal of tissue ablation by IRE is to cause complete ne-crotic cell death within a predefined and restricted local tis-sue volume. It is important to remember that ECT causes cell death predominantly by drug-induced apoptosis. This cell death mechanism may be more desirable “in order not to produce large instantaneous necrosis, which would re-sult in massive tumor necrosis and possible ulceration and wound appearance” (42). Advantages and disadvantages of the suggested methods must therefore be considered in a clinical setting and treatment.
Finally, conventional electroporation is cell-size dependent. In general, larger or more extended cells require smaller electric fields than smaller cells to cause a similar PM ef-fect. In homogeneous tissue such as liver, it can be expected that all cells experience similar pore densities for a given field strength. However, cell size is heterogeneous in solid tumors, and here the smallest cell will dictate the field pa-rameters that need to be employed. The cell size limitation is minimized (21-24) for the local and drug-free tumor treat-ment of tissue by nanosecond electric fields pulses that were recently reported to cause self-destruction of skin melano-mas (64) and to affect other human malignancies (65). Pulse trains at 0.5 Hz, each with field strengths of 40 kV/cm and 300 ns duration, reportedly caused tumor cell nuclei to rap-idly shrink (electropyknosis) and tumor blood supply to stop (64). The non-thermal mechanism by which the melanoma cells die is unknown yet, but the sub-microsecond pulses are expected to cause nearly homogeneous supra-electroporation of all cells and their nuclear membranes (24).
Acknowledgments
Supported by NIH grant RO1-GM63857, and a Graduate Fel-lowship from the Whitaker Foundation to K.C.S. We thank K. G. Weaver for computer support.
References
1.
2.
3.
Szakácas, G., Paterson, J. K., Ludwig, J. A., Booth-Genthe, C., and Gottesman, M. M. Targeting multidrug resistance in cancer. Nat Rev Drug Discov 5, 219-234 (2006). Dean, M., Fojo, T., and Bates, S. Tumour stem cells and drug resis-tance. Nature Reviews Cancer 5, 275-284 (2005). Putt, K. S., Chen, G. W., Pearson, J. M., Sandhorst, J. S., Hoagland,

272 Esseretal.
Technology in Cancer Research & Treatment, Volume 6, Number 4, August 2007
4.
5.
6.
7.
8.
9.
10.
11.
12.
13.
14.
15.
16.
17.
18.
19.
20.
21.
22.
23.
24.
25.
M. S., Kwon, J.-T., Hwang, S.-K., Jin, H., Churchwell, M. I., Cho, M.-H., Doerge, D. R., Helferich, W. G., and Hergenrogher, P. J. Small-molecule activation of procaspase-3 to caspase-3 as a person-alized anticancer strategy. Nat Rev Biol 2, 543-550 (2006). Sebolt-Lepold, J. S. and English, J. M. Mechanisms of drug inhibition of signalling molecules. Nature 441, 457-462 (2006). Reed, J. C. Drug insight: cancer therapy strategies based on restora-tion of endogenous cell death mechanism. Nat Clin Pract Oncol 3, 388-398 (2006). Galluzzi, L., Larochette, N., Zamzami, N., and Kroemer, G. Mito-chondria as therapeutic targets for cancer chemotherapy. Oncogene 25, 4812-4830 (2006). Reed, J. C. Proapoptotic multidomain Bcl-2/Bax-family proteins: mechanisms, physiological roles, and therapeutic opportunities. Cell Death Differ 13, 1378-1386 (2006). Jain, R. K. Delivery of molecular medicine to solid tumors. Science 271, 1079-1080 (1996). Jain, R. K. Delivery of molecular and cellular medicine to solid tu-mors. Adv Drug Deliv Rev 46, 149-168 (2001). Padera, T. P., Stoll, B. R., Tooredman, J. B., Capen, D., di Tomaso, E., and Jain, R. K. Cancer cells compress intratumour vessels. Nature 427, 695 (2004). Minchinton, A. I. and Tannock, I. F. Drug penetration in solid tumors. Nat Rev Cancer 6, 583-592 (2006). Miller, L., Leor, J., and Rubinsky, B. Cancer cells ablation with irre-versible electroporation. Technol Cancer Res Treat 4, 699-705 (2005).Davalos, R. V., Mir, L. M., and Rubinsky, B. Tissue ablation and ir-reversible electroporation. Ann Biomed Eng 33, 223-231 (2005).Edd, J. F., Horowitz, L., Davalos, R. V., Mir, L. M., and Rubinsky, B. In vivo results of a new focal tissue ablation technique: irreversible electroporation. IEEE Trans Biomed Eng 53, 1409-1415 (2006). Rubinsky, B., Onik, G., and Mikus, P. Irreversible electroporation: a new ablation modality – Clinical implications. Tech Cancer Res Treat 6, 37-48 (2007). Weaver, J. C. and Chizmadzhev, Y. A. Theory of electroporation: A review. Bioelectrochem Bioenerget 41, 135-160 (1996). Weaver, J. C. Electroporation of biological membranes from mul-ticellular to nano scales. IEEE Trans Dielect Elect Ins 10, 754- 768 (2003).DeBruin, K. A. and Krassowska, W. Modeling electroporation in a single cell: I. Effects of field strength and rest potential. Biophys J 77, 1213-1224 (1999). DeBruin, K. A. and Krassowska, W. Modeling electroporation in a single cell: II. Effects of ionic concentration. Biophys J 77, 1225-1233 (1999). Krassowska, W. and Filev, P. D. Modeling electroporation in a single cell. Biophys J 92, 404-417 (2007). Stewart, D. A., Gowrishankar, T. R., and Weaver, J. C. Transport lattice approach to describing cell electroporation: use of a local asymptotic model. IEEE Transactions on Plasma Science 32, 1696-1708 (2004). Gowrishankar, T. R., Esser, A. T., Vasilkoski, Z., Smith, K. C., and Weaver, J. C. Microdosimetry for conventional and supra-electro-poration in cells with organelles. Biochem Biophys Res Commun 341, 1266-1276 (2006). Smith, K. C., Gowrishankar, T. R., Esser, A. T., Stewart, D. A., and Weaver, J. C. Spatially distributed, dynamic transmembrane voltages of organelle and cell membranes due to 10 ns pulses: predictions of meshed and unmeshed transport network models. IEEE Transactions on Plasma Science 34, 1394-1404 (2006). Gowrishankar, T. R. and Weaver, J. C. Electrical behavior and pore ac-cumulation in a multicellular model for conventional and supra-elec-troporation. Biochem Biophys Res Commun 349, 643-653 (2006). Barnett, A. and Weaver, J. C. Electroporation: A unified, quantitative theory of reversible electrical breakdown and rupture. Bioelectro-chem and Bioenerg 25, 163-182 (1991).
26.
27.
28.
29.
30.
31.
32.
33.
34.
35.
36.
37.
38.
39.
40.
41.
42.
43.
44.
45.
46.
Freeman, S. A., Wang, M. A., and Weaver, J. C. Theory of electro-poration for a planar bilayer membrane: Predictions of the fractional aqueous area, change in capacitance and pore-pore separation. Bio-phys J 67, 42-56 (1994). Vasilkoski, Z., Esser, A. T., Gowrishankar, T. R., and Weaver, J. C. Membrane electroporation: The absolute rate equation and nanosec-ond timescale pore creation. Phys Rev E 74, 021904 (2006). Vaughan, T. E. and Weaver, J. C. A theoretical model for cell electro-poration: A quantitative description of electrical behavior. In Elec-tricity and Magnetism in Biology and Medicine, pp. 433-435. Ed., Bersani, F. Pleunum, New York (1999). Joshi, R. P. and Schoenbach, K. H. Electroporation dynamics in bio-logical cells subjected to ultrafast electrical pulses: a numerical simu-lation study. Phys Rev E 62, 1025-1033 (2000). Tieleman, D. P. The molecular basis of electroporation. BMC Bio-chemistry 5, 10 (2004). Gurtovenko, A. A. and Vattulaninen, L. Pore formation coupled to ion transport through lipid membrane as induced by transmembrane ionic charge imbalance: atomistic molecular dynamics study. J Am Chem Soc 127, 17570-17571 (2005). Benz, R., Beckers, F., and Zimmermann, U. Reversible electrical breakdown of lipid bilayer membranes: A charge-pulse relaxation study. J Membrane Biol 48, 181-204 (1979). Stämpfli, R. and Willi, M. Membrane potential of a Ranvier node measured after electrical destruction of its membrane. Experientia 8, 297-298 (1957). Stämpfli, R. Reversible electrical breakdown of the excitable mem-brane of a Ranvier node. An Acad Brasil Ciens 30, 57-63 (1958).Sale, A. J. H. and Hamilton, A. Effects of high electric fields on mi-crooranisms: I. killing of bacteria and yeasts. Biochem Biophys Acta 148, 781-788 (1967). Hamilton, W. A. and Sale, A. J. H. Effects of high electric fields on microoranisms: II. killing of bacteria and yeasts. Biochim Biophys Acta 148, 7789-800 (1967). Sale, A. J. H. and Hamilton, W. A. Effects of high electric fields on microoranisms: III. lysis of erythrocytes and protoplasts. Biochm Bio-phys Acta 163, 37-43 (1968). Bhatt, D. L., Gaylor, D. C., and Lee, R. C. Rhabdomyolysis due to pulsed electric fields. Plast Reconstr Surg 86, 1-11 (1990). Abramov, G. S., Bier, M., Capelli-Schellpfeffer, M., and Lee, R. C. Alteration in sensory nerve function following electrical shock. Burns 22, 602-606 (1996). Lee, R. C., Zhang, D., and Hannig, J. Biophysical injury mecha-nisms in electrical shock trauma. Ann Rev Biomedical Eng 2, 477-509 (2000). Belehradek, M., Domenge, C., Luboinski, B., Orlowski, S., Jr., J. B., and Mir, L. M. Electrochemotherapy, a new antitumor treatment. first clinical phase I-II trial. Cancer 72, 3694-3700 (1993). Miklavčič, D., Semrov, D., Mekid, H., and Mir, L. M. A validated model of in vivo electric field distribution in tissues for electrochemo-therapy and for DNA electrotransfer for gene therapy. Biochimica et Biophysica Acta 1523, 73-83 (2000). Gothelf, A., Mir, L. M., and Gehl, J. Electrochemotherapy: results of cancer treatment using enhanced delivery of bleomycin by electro-poration. Cancer Treat Rev 29, 371-387 (2003). Gowrishankar, T. R. and Weaver, J. C. An approach to electrical modeling of single and multiple cells. Proc Nat Acad Sci 100, 3203-3208 (2003). Gowrishankar, T. R., Stewart, D. A., Martin, G. T., and Weaver, J. C. Transport lattice models of heat transport in skin with spatially heterogeneous, temperature-dependent perfusion. Biomedical Eng Online 3, 42 (2004). Abidor, I. G., Barbul, A., Zhelev, D. V., Doinov, P., Bandrina, I. N., and Ospiova, E. M. Electrical properties of cell pellets and cell electrofu-sion in a centrifuge. Biochim Biophys Acta 1152, 207-218 (1993).
Technology in Cancer Research & Treatment, Volume 6, Number 4, August 2007
IntrinsicRedistribution 273
47.
48.
49.
50.
51.
52.
53.
54.
55.
56.
57.
58.
59.
Abidor, I. G., Li, L. H., and Hui, S. W. Studies of cell pellets: I. Elec-trical properties and porosity. Biophys J 67, 418-426 (1994).Pucihar, G., Kotnik, T., Teissie, J., and Miklavcic, D. Electropermeabi-lization of dense cell suspensions. Eur Biophys J 36, 173-185 (2007).Greenway, C. V. and Stark, R. D. Hepatic vascular bed. Physol. Rev. 51, 23-65 (1971). Smith, K. C. Modeling cell and tissue electroporation. Massachusetts Institute of Technology, (2006). SM Thesis(Online: http://hdl.handle.net/1721.1/35301). Pliquett, U., Gift, E. A., and Weaver, J. C. Determination of the elec-tric field and anomalous heating caused by exponential pulses with aluminum electrodes in electroporation experiments. Bioelectrochem Bioenerget 39, 39-53 (1996). Persson, P. O. and Strang, G. A simple mesh generator in MATLAB. Soc Individual App Math Rev 46 (2004). Raicu, V., Saibara, T., and Irimajiri, A. Dielectric properties of rat liver in vivo: a noninvasive approach using an open-ended coaxial probe at audio/radio frequencies. Bioelectrochem and Bioenerg 47, 325-332 (1998). Läuger, P. Electrogenic Ion Pumps. Sinauer Associates, Sunderland, (1991). Powell, K. T. and Weaver, J. C. Transient aqueous pores in bilayer membranes: A statistical theory. Bioelectrochem Bioelectroenerg 15, 211-227 (1986). Neu, J. C. and Krassowska, W. Asymptotic model of electroporation. Phys Rev E 59, 3471-3482 (1999). Esser, A. T., Smith, K. C., Gowrishankar, T. R., and Weaver, J. C. Conventional electroporation: cell and organelle permeabilization and non-equilibrium transport. submitted (2007). Melikov, K. C., Frolov, V. A., Shcherbakov, A., Samsonov, A. V., Chizmadzhev, Y. A., and Chernomordik, L. V. Voltage-induced non-conductive pre-pores and metastable pores in unmodified planar bi-layer. Biophys J 80, 1829-1836 (2001). Sěl, D., Cukjati, D., Batiuskaite, D., Slivnik, T., Mir, L. M., and Miklavčič, D. Sequential finite element model of tissue electroperme-abilization. IEEE Trans Biomed Eng 52, 816-827 (2005).
60.
61.
62.
63.
64.
65.
66.
67.
68.
69.
Davalos, R. V., Rubinsky, B., and Mir, L. M. Theoretical analysis of the thermal effects during in vivo tissue electroporation. Bioelectro-chemistry 61, 99-107 (2003). Riu, P. J., Foster, K. R., Blick, D. W., and Adair, E. R. A thermal model for human thresholds of microwave-evoked warmth sensa-tions. Bioelectromagnetics 18, 578-583 (1997). Foster, K. R. and Schwan, H. P. Dielectric properties of tissues. In Handbook of Biological Effects of Electromagnetic Fields, pp. 25-102. Eds., Polk, C. and Postow, E. CRC Press, Boca Raton 2nd edition (1996).Davalos, R. V., Rubinsky, B., Mir, L. M., and Otten, D. M. Electri-cal impedance tomography for imaging tissue electroporation. IEEE Trans BME 51, 761-767 (2004). Nuccitelli, R., Pliquett, U., Chen, X., Ford, W., Swanson, R. J., Beebe, S. J., Kolb, J. F., and Schoenbach, K. H. Nanosecond pulsed electric fields cause melanomas to self-destruct. Biochem Biophys Res Comm 343, 351-360 (2006). Garon, E. B., Sawcer, D., Vernier, P. T., Tang, T., Sun, Y., Marcu, L., Gundersen, M. A., and Koeffler, H. P. In vitro and in vivo evaluation and a case report of intense nanosecond pulsed electric field as a local therapy for human malignancies. Int J Cancer 121, 675-682 (2007). Neumann, E., Schaefer-Ridder, M., Wang, Y., and Hofschneider, P. H. Gene transfer into mouse lyoma cells by electroporation in high electric fields. EMBO J 1, 841-845 (1982). Hamm, A., Krott, N., Breibach, I., Blindt, R., and Bosserhoff, A. K. Efficient transfection method for primary cells. Tissue Engineering 8, 235-245 (2002). Siemen, H., Nix, M., Endl, E., Koch, P., Itskovitz-Eldor, J., and Brüs-tle, O. Nucleofection of human embryonic stem cells. Stem Cells Dev 14, 378-383 (2005). Cesnuleviciusa, K., Timmera, M., Wesemanna, M., Thomas, T., Barkhausenc, T., and Grothea, C. Nucleofection is the most efficient nonviral transfection method for neuronal stem cells derived from ventral mesencephali with no changes in cell composition or dopami-nergic fate. Stem Cells 24, 2776-2791 (2006).
Received: April 20, 2007; Revised: July 3, 2007; Accepted: July 5, 2007