
Organ-Specific Molecular Classification of Primary Lung, Colon, and Ovarian Adenocarcinomas Using...
8
Short Communication Organ-Specific Molecular Classification of Primary Lung, Colon, and Ovarian Adenocarcinomas Using Gene Expression Profiles Thomas J. Giordano,* Kerby A. Shedden, † Donald R. Schwartz, ‡ Rork Kuick, § Jeremy M. G. Taylor, ¶ Nana Lee, ‡ David E. Misek, § Joel K. Greenson,* Sharon L. R. Kardia, David G. Beer,** Gad Rennert, †† Kathleen R. Cho,* Stephen B. Gruber, ‡ Eric R. Fearon, ‡ and Samir Hanash § From the Departments of Pathology,* Statistics, † Internal Medicine, ‡ Pediatrics, § Biostatistics, ¶ Epidemiology, and Surgery,** The University of Michigan, Ann Arbor, Michigan; and the National Cancer Control Center, †† Clalit Health Services and Technion University, Haifa University, Haifa, Israel Molecular classification of tumors based on their gene expression profiles promises to significantly refine diagnosis and management of cancer patients. The establishment of organ-specific gene expression pat- terns represents a crucial first step in the clinical application of the molecular approach. Here, we re- port on the gene expression profiles of 154 primary adenocarcinomas of the lung, colon, and ovary. Us- ing high-density oligonucleotide arrays with 7129 gene probe sets, comprehensive gene expression pro- files of 57 lung, 51 colon, and 46 ovary adenocarcino- mas were generated and subjected to principle com- ponent analysis and to a cross-validated prediction analysis using nearest neighbor classification. These statistical analyses resulted in the classification of 152 of 154 of the adenocarcinomas in an organ-specific man- ner and identified genes expressed in a putative tissue- specific manner for each tumor type. Furthermore, two tumors were identified, one in the colon group and another in the ovarian group, that did not conform to their respective organ-specific cohorts. Investigation of these outlier tumors by immunohistochemical profiling revealed the ovarian tumor was consistent with a met- astatic adenocarcinoma of colonic origin and the co- lonic tumor was a pleomorphic mesenchymal tumor, probably a leiomyosarcoma, rather than an epithelial tumor. Our results demonstrate the ability of gene ex- pression profiles to classify tumors and suggest that determination of organ-specific gene expression pro- files will play a significant role in a wide variety of clinical settings, including molecular diagnosis and classification. (Am J Pathol 2001, 159:1231–1238) Molecular classification of tumors by high-throughput comprehensive technologies for assaying gene expres- sion, such as high-density oligonucleotide and cDNA microarrays, offers the potential to radically alter the practice of surgical pathology and oncology. Using these technologies, it may be possible to identify clinically rel- evant subsets of tumors that would otherwise be indistin- guishable by conventional histopathological assessment. In principle, expression-profiling analyses should identify tumors more likely to invade, recur, and/or metastasize, and the approach should allow improved prediction of response to specific therapeutic regimens and clinical outcome. Data from a recent study of a large cohort of lymphomas supports this view. Specifically, large B-cell lymphomas could be divided based on gene expression profiles into two subtypes associated with different sur- vival rates. 1 A similar study classified cutaneous malig- nant melanomas based on gene expression profiles. 2 Another major anticipated benefit of these technolo- gies is the establishment of organ- and tumor-specific profiles that, among other potential benefits, might assist with the diagnostic work-up of patients with metastatic cancer of unknown origin at the time of initial diagnosis. A comprehensive library of unique gene expression profiles of all of the major tumor types would permit a definitive diagnosis in the absence of pertinent clinical history, Supported by funds from the National Cancer Institute (NIH CA84952 and CA81488) and in part by the Tissue Core of the University of Michigan Comprehensive Cancer Center (NIH CA46952). Accepted for publication July 6, 2001. Address reprint requests to Thomas J Giordano, M.D., Ph.D., University of Michigan Health System, Department of Pathology, Room 2G332/Box 0054, 1500 E. Medical Center Dr., Ann Arbor, MI 48109-0054. E-mail: [email protected]. American Journal of Pathology, Vol. 159, No. 4, October 2001 Copyright © American Society for Investigative Pathology 1231
-
Upload
independent -
Category
Documents
-
view
1 -
download
0
Transcript of Organ-Specific Molecular Classification of Primary Lung, Colon, and Ovarian Adenocarcinomas Using...
Short CommunicationOrgan-Specific Molecular Classification of PrimaryLung, Colon, and Ovarian Adenocarcinomas UsingGene Expression Profiles
Thomas J. Giordano,* Kerby A. Shedden,†
Donald R. Schwartz,‡ Rork Kuick,§
Jeremy M. G. Taylor,¶ Nana Lee,‡
David E. Misek,§ Joel K. Greenson,*Sharon L. R. Kardia,� David G. Beer,**Gad Rennert,†† Kathleen R. Cho,*Stephen B. Gruber,‡ Eric R. Fearon,‡ andSamir Hanash§
From the Departments of Pathology,* Statistics,† Internal
Medicine,‡ Pediatrics,§ Biostatistics,¶ Epidemiology,� and
Surgery,** The University of Michigan, Ann Arbor, Michigan; and
the National Cancer Control Center,†† Clalit Health Services and
Technion University, Haifa University, Haifa, Israel
Molecular classification of tumors based on their geneexpression profiles promises to significantly refinediagnosis and management of cancer patients. Theestablishment of organ-specific gene expression pat-terns represents a crucial first step in the clinicalapplication of the molecular approach. Here, we re-port on the gene expression profiles of 154 primaryadenocarcinomas of the lung, colon, and ovary. Us-ing high-density oligonucleotide arrays with 7129gene probe sets, comprehensive gene expression pro-files of 57 lung, 51 colon, and 46 ovary adenocarcino-mas were generated and subjected to principle com-ponent analysis and to a cross-validated predictionanalysis using nearest neighbor classification. Thesestatistical analyses resulted in the classification of 152 of154 of the adenocarcinomas in an organ-specific man-ner and identified genes expressed in a putative tissue-specific manner for each tumor type. Furthermore, twotumors were identified, one in the colon group andanother in the ovarian group, that did not conform totheir respective organ-specific cohorts. Investigation ofthese outlier tumors by immunohistochemical profilingrevealed the ovarian tumor was consistent with a met-astatic adenocarcinoma of colonic origin and the co-lonic tumor was a pleomorphic mesenchymal tumor,probably a leiomyosarcoma, rather than an epithelial
tumor. Our results demonstrate the ability of gene ex-pression profiles to classify tumors and suggest thatdetermination of organ-specific gene expression pro-files will play a significant role in a wide variety ofclinical settings, including molecular diagnosis andclassification. (Am J Pathol 2001, 159:1231–1238)
Molecular classification of tumors by high-throughputcomprehensive technologies for assaying gene expres-sion, such as high-density oligonucleotide and cDNAmicroarrays, offers the potential to radically alter thepractice of surgical pathology and oncology. Using thesetechnologies, it may be possible to identify clinically rel-evant subsets of tumors that would otherwise be indistin-guishable by conventional histopathological assessment.In principle, expression-profiling analyses should identifytumors more likely to invade, recur, and/or metastasize,and the approach should allow improved prediction ofresponse to specific therapeutic regimens and clinicaloutcome. Data from a recent study of a large cohort oflymphomas supports this view. Specifically, large B-celllymphomas could be divided based on gene expressionprofiles into two subtypes associated with different sur-vival rates.1 A similar study classified cutaneous malig-nant melanomas based on gene expression profiles.2
Another major anticipated benefit of these technolo-gies is the establishment of organ- and tumor-specificprofiles that, among other potential benefits, might assistwith the diagnostic work-up of patients with metastaticcancer of unknown origin at the time of initial diagnosis. Acomprehensive library of unique gene expression profilesof all of the major tumor types would permit a definitivediagnosis in the absence of pertinent clinical history,
Supported by funds from the National Cancer Institute (NIH CA84952 andCA81488) and in part by the Tissue Core of the University of MichiganComprehensive Cancer Center (NIH CA46952).
Accepted for publication July 6, 2001.
Address reprint requests to Thomas J Giordano, M.D., Ph.D., Universityof Michigan Health System, Department of Pathology, Room 2G332/Box0054, 1500 E. Medical Center Dr., Ann Arbor, MI 48109-0054. E-mail:[email protected].
American Journal of Pathology, Vol. 159, No. 4, October 2001
Copyright © American Society for Investigative Pathology
1231
imaging studies, and/or surgical exploration, thus simpli-fying the diagnostic evaluation. For example, comparingthe gene expression profile of a patient’s brain lesion tothe gene expression library may be sufficient to establisha diagnosis of primary lung adenocarcinoma in the ab-sence of thoracic imaging studies. Furthermore, theseprofiles might assist in the diagnosis of histologicallysimilar primary tumor types, such as in distinguishingpoorly differentiated lung carcinoma from malignant me-sothelioma. However, at this point, it has not been estab-lished if it will be possible to define gene expressionprofiles that will discriminate the major tumor types in anorgan-specific manner. A crucial step in establishing thediagnostic relevance of gene expression profiles is tocompare profiles of histologically similar tumors, such asadenocarcinomas, from different organs. In this study, wecompared the gene expression profiles of 154 primaryadenocarcinomas of lung, colon, and ovary and demon-strated these profiles could discriminate the tumors in anorgan-specific manner. In addition, we identified genesthat are potentially useful as diagnostic markers for thesetumors.
Materials and Methods
Tumors and Histopathology
The primary tumors analyzed in this study were derivedfrom several sources. The lung adenocarcinomas wereprocured from the University of Michigan Health Systembetween 1994 and 1999. The colon adenocarcinomaswere procured from five Israeli hospitals as part of theMolecular Epidemiology of Colorectal Cancer Study, acollaborative project between the University of Michiganand the National Cancer Control Center, Haifa, Israel(NIH CA81488). The ovarian tumors were procured fromseveral sources, including the University of MichiganHealth System, the Cooperative Human Tissue Network,and Cornell New York Hospital. All procedures were ap-proved by the University of Michigan Institutional ReviewBoard (IRB-Medicine).
All tumors were processed in a similar manner. Frozentumor samples were embedded in OCT freezing media(Miles Scientific, Naperville, IL), cryotome sectioned (5�m), and evaluated by routine hematoxylin and eosin(H&E) stains by one of three surgical pathologists. When-ever possible, the corresponding H&E sections from par-affin blocks were also evaluated. Areas of relatively puretumor (at least 70% tumor cells) were selected for RNAisolation. All grades of differentiation were exhibited bythe tumors.
RNA Isolation
Single isolates of tumor samples were homogenized inthe presence of Trizol reagent (Life Technologies, Gaith-ersburg, MD) and total cellular RNA was purified accord-ing to manufacturer’s procedures. RNA samples werefurther purified using RNeasy spin columns (Qiagen, Va-lencia, CA) and used to prepare cRNA probes. RNA
quality of the lung and ovary tumors was assessed by 1%agarose gel electrophoresis in the presence of ethidiumbromide. Samples that did not reveal intact and approx-imately equal 18S and 28S ribosomal bands were ex-cluded from further study (5% of the lung and 17% of theovary cases).
cRNA Synthesis and Gene Expression Profiling
This study used commercially available high-density mi-croarrays (Affymetrix, Santa Clara, CA) that producegene expression levels on 7129 known genes and ex-pressed sequence tags (HuGeneFL Array). Preparationof cRNA, hybridization, and scanning of the arrays wereperformed according to manufacturer’s protocols. Briefly,5 �g of total RNA was used to generate double-strandedcDNA by reverse transcription using a cDNA synthesis kit(Superscript Choice System; Life Technologies, Inc.,Rockville, MD) that uses an oligo(dT)24 primer containinga T7 RNA polymerase promoter 3� to the poly T (Geneset,La Jolla, CA), followed by second-strand synthesis. La-beled cRNA was prepared from the double-strandedcDNA by in vitro transcription by T7 RNA polymerase inthe presence of biotin-11-CTP and biotin-16-UTP (Enzo,Farmington, NY). The labeled cRNA was purified overRNeasy columns. Fifteen �g of cRNA was fragmented at94°C for 35 minutes in 40 mmol/L of Tris-acetate, pH 8.1,100 mmol/L of potassium acetate, and 30 mmol/L ofmagnesium acetate. The cRNA was then used to prepare300 �l of hybridization cocktail (100 mmol/L MES, 1 mol/LNaCl, 20 mmol/L ethylenediaminetetraacetic acid, 0.01%Tween 20) containing 0.1 mg/ml of herring sperm DNA(Promega, Madison, WI) and 500 �g/ml of acetylatedbovine serum albumin (Life Technologies, Inc.). Beforehybridization, the cocktails were heated to 94°C for 5minutes, equilibrated at 45°C for 5 minutes, and thenclarified by centrifugation (16,000 � g) at room temper-ature for 5 minutes. Aliquots of this hybridization cocktailcontaining 10 �g of fragmented cRNA were hybridized toHuGeneFL arrays at 45°C for 16 hours in a rotisserie ovenat 60 rpm. The arrays were washed using nonstringentbuffer (6� SSPE) at 25°C, followed by stringent buffer(100 mmol/L MES, pH 6.7, 0.1 mol/L NaCl, 0.01% Tween20) at 50°C. The arrays were stained with streptavidin-phycoerythrin (Molecular Probes, Eugene, OR), washedwith 6� sodium chloride, sodium phosphate, EDTA(SSPE buffer), incubated with biotinylated anti-streptavi-din IgG, stained again with streptavidin-phycoerythrin,and washed again with 6� SSPE. The arrays werescanned using the GeneArray scanner (Affymetrix). Im-age analysis was performed with GeneChip software (Af-fymetrix).
Statistical Analysis
The HuGeneFL chip consists of 7129 probe sets, eachrepresenting a transcript. Each probe set typically con-sists of 20 perfectly complementary 25 base long probesas well as 20 mismatch probes that are identical exceptfor an altered central base. We subtract the mismatch
1232 Giordano et alAJP October 2001, Vol. 159, No. 4
probe values from the perfect match values and averagethe middle 50% of these differences as the expressionmeasure for that probe set.
A quantile normalization procedure was used to adjustfor differences in the probe intensity distribution acrossdifferent chips. We applied a monotone linear spline toeach chip that mapped quantiles 0.02 up to 0.98 (in incre-ments of 0.02) exactly to the corresponding median quan-tiles for all 154 samples. Then, the transform log(100 �max(X � 100; 0)) was applied to the data from each chip.
We built a classifier out of our 154 training samples asfollows. We selected N markers from each of the threetumor classes, giving 3N markers in all (a range of valuesfor N was considered, as discussed in the Results sec-tion). To classify a new sample of unknown tumor type,we compute the correlation coefficient between the 3Nmarkers on the unidentified sample and the same mark-ers on each of the 154 training samples. The class iden-tities of the five training samples having the greatestcorrelation with the unclassified sample are then consid-ered. If three or more of these samples belong to acommon class, then this is the predicted class for theunclassified sample. Otherwise, the prediction is consid-ered to be indeterminate. This strategy is known in theclassification literature as “five-nearest neighbors withmajority voting.”3
We used a cross-validation procedure to estimate theerror rate of our classifier. In the generic procedure, weset aside a single validation sample, leaving 153 samplesto train a classifier, as described above. Note that com-pared to the classifier that would be used in practice, thisnew classifier will use a slightly different set of markers aswell as having one fewer training sample. Moreover, thisclassifier does not have access to the expression valuesor tissue type of the single held-out sample. We then usethis classifier to predict the class of the held-out sample,and record whether this prediction is correct. This pro-cess is repeated 154 times, with each sample being heldout exactly once. The aggregate error rate across the 154predictions is used as an estimate for the error rate thatwould be expected to occur in practice.
Immunohistochemistry
Routine immunohistochemistry was performed using for-malin-fixed, paraffin-embedded sections using the avi-din-biotin complex method.4 The following antibodies,dilutions, and pretreatment conditions were used: anti-keratin (CAM 5.2, 1:10, trypsin pretreatment; Becton-Dickinson, San Jose, CA), anti-human epithelial keratins(AE1:AE3, 1:800, no pretreatment; Roche Diagnostics,Indianapolis, IN), anti-human melanoma (HMB45, 1:25,no pretreatment; DAKO, Carpinteria, CA), anti-cow S-100(1:500, no pretreatment; DAKO), anti-vimentin (1:800, nopretreatment; DAKO), anti-human cytokeratin 20 (CK20)(1:25, DAKO Protease 1 pretreatment; DAKO), anti-hu-man CK7 (1:25, DAKO Protease 2 pretreatment; DAKO),anti-CEA (monoclonal D-14, 1:8, DAKO Protease 1 pre-treatment: E-Z-EM, Westbury, NY), anti-� smooth muscleactin (1:1600, no pretreatment; Sigma Chemical Co., St.
Louis, MO), anti-human muscle actin (HHF35, 1:100,DAKO Protease 2 pretreatment; DAKO) and anti-c-KIT(1:100, citrate buffer pretreatment; DAKO).
Results
Gene Expression Profiles Distinguish Lung,Colon, and Ovary Adenocarcinomas andIdentify Differentially Expressed Genes
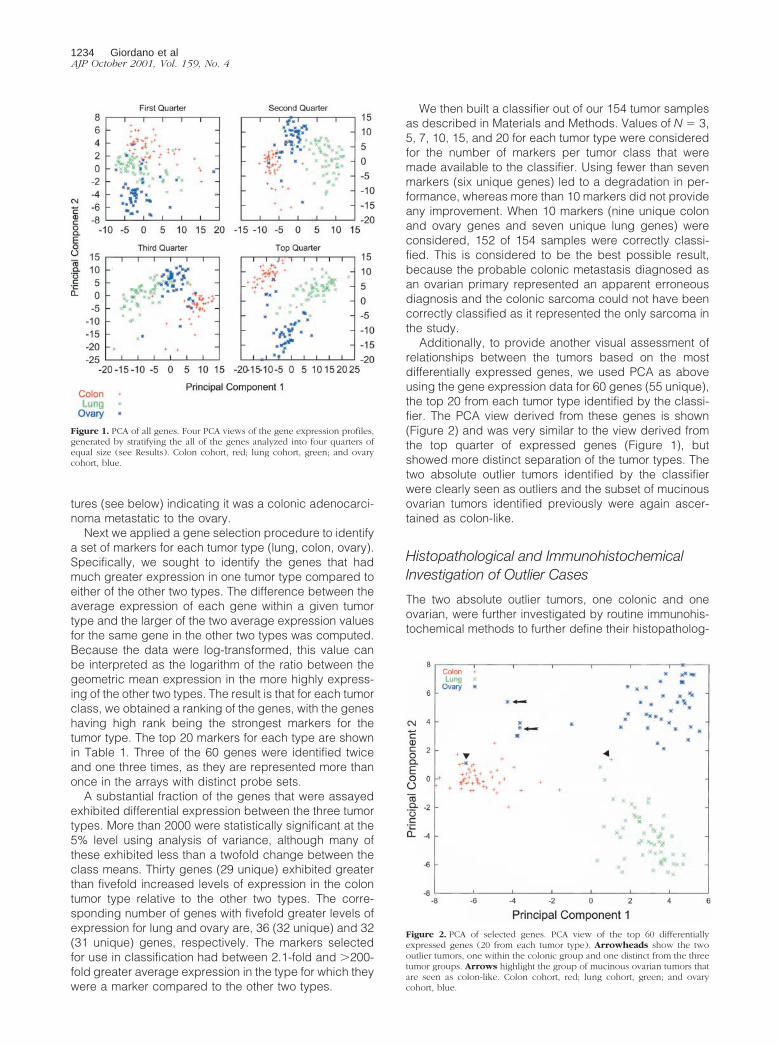
Comprehensive gene expression profiles of 57 lung, 51colon, and 46 ovary primary carcinomas were generatedusing high-density oligonucleotide arrays with 7129probe sets, which in total interrogated some 6800 genes.To provide a visual assessment of relationships betweenthe tumors based on gene expression, we consideredeach sample to be represented by a point in a 7129multidimensional space, with each coordinate given by agene expression level. Several views of this set of pointswere generated using principal component analysis(PCA), which locates the two-dimensional views that cap-ture the greatest amount of variability in the data. We notethat these views were based solely on aggregate expres-sion variation and no references to the tissue classifica-tions were made. We generated four views in all, bystratifying the genes into four quarters of equal size, andthen applying PCA to the measurements in each quarterseparately (Figure 1). The strata were formed based onthe average expression level of each transcript acrossthe 154 samples; the first stratum contained the 25% oftranscripts with the least average abundance, the secondstratum contained the next 25% of the genes, and so on.
The views determined by PCA (Figure 1) indicatedsubstantial differences in gene expression between thethree tumor types throughout the range of expressionmeasures. Thus, not only did genes with high averageexpression levels allow the three tumor types to be dis-tinguished from each other (Figure 1, top quarter), butgenes that were expressed at low average levels wereinformative as well (Figure 1, first quarter). Particularlynotable was the wide margin that separated lung andcolon tumors (Figure 1, top quarter). It was also evidentthat substantial heterogeneity occurred within each tumortype, with the ovarian tumors showing the greatest heter-ogeneity, and the colon tumors showing the least. Muchof the substructure in the various panels of Figure 1 wasattributed to identified differences in tumor histopathol-ogy. The ovarian tumors could be divided into two sub-sets. A minor subset highlighted in Figure 1 (top quarter)clustered separately from the major ovarian set, over-lapped with colon tumors in the second and third quar-terlies (Figure 1), and consisted exclusively of mucinousovarian tumors. However, some mucinous tumors alsoclustered with the major group. The colon tumor that wassubstantially separated from the remainder was a sar-coma (see below), in contrast to the remaining colontumors, all of which were adenocarcinomas. The ovariantumor most completely embedded within the colon cohortwas subsequently determined to have a number of fea-
Lung, Colon, and Ovary Adenocarcinoma Expression Profiles 1233AJP October 2001, Vol. 159, No. 4
tures (see below) indicating it was a colonic adenocarci-noma metastatic to the ovary.
Next we applied a gene selection procedure to identifya set of markers for each tumor type (lung, colon, ovary).Specifically, we sought to identify the genes that hadmuch greater expression in one tumor type compared toeither of the other two types. The difference between theaverage expression of each gene within a given tumortype and the larger of the two average expression valuesfor the same gene in the other two types was computed.Because the data were log-transformed, this value canbe interpreted as the logarithm of the ratio between thegeometric mean expression in the more highly express-ing of the other two types. The result is that for each tumorclass, we obtained a ranking of the genes, with the geneshaving high rank being the strongest markers for thetumor type. The top 20 markers for each type are shownin Table 1. Three of the 60 genes were identified twiceand one three times, as they are represented more thanonce in the arrays with distinct probe sets.
A substantial fraction of the genes that were assayedexhibited differential expression between the three tumortypes. More than 2000 were statistically significant at the5% level using analysis of variance, although many ofthese exhibited less than a twofold change between theclass means. Thirty genes (29 unique) exhibited greaterthan fivefold increased levels of expression in the colontumor type relative to the other two types. The corre-sponding number of genes with fivefold greater levels ofexpression for lung and ovary are, 36 (32 unique) and 32(31 unique) genes, respectively. The markers selectedfor use in classification had between 2.1-fold and �200-fold greater average expression in the type for which theywere a marker compared to the other two types.
We then built a classifier out of our 154 tumor samplesas described in Materials and Methods. Values of N � 3,5, 7, 10, 15, and 20 for each tumor type were consideredfor the number of markers per tumor class that weremade available to the classifier. Using fewer than sevenmarkers (six unique genes) led to a degradation in per-formance, whereas more than 10 markers did not provideany improvement. When 10 markers (nine unique colonand ovary genes and seven unique lung genes) wereconsidered, 152 of 154 samples were correctly classi-fied. This is considered to be the best possible result,because the probable colonic metastasis diagnosed asan ovarian primary represented an apparent erroneousdiagnosis and the colonic sarcoma could not have beencorrectly classified as it represented the only sarcoma inthe study.
Additionally, to provide another visual assessment ofrelationships between the tumors based on the mostdifferentially expressed genes, we used PCA as aboveusing the gene expression data for 60 genes (55 unique),the top 20 from each tumor type identified by the classi-fier. The PCA view derived from these genes is shown(Figure 2) and was very similar to the view derived fromthe top quarter of expressed genes (Figure 1), butshowed more distinct separation of the tumor types. Thetwo absolute outlier tumors identified by the classifierwere clearly seen as outliers and the subset of mucinousovarian tumors identified previously were again ascer-tained as colon-like.
Histopathological and ImmunohistochemicalInvestigation of Outlier Cases
The two absolute outlier tumors, one colonic and oneovarian, were further investigated by routine immunohis-tochemical methods to further define their histopatholog-
Figure 1. PCA of all genes. Four PCA views of the gene expression profiles,generated by stratifying the all of the genes analyzed into four quarters ofequal size (see Results). Colon cohort, red; lung cohort, green; and ovarycohort, blue.
Figure 2. PCA of selected genes. PCA view of the top 60 differentiallyexpressed genes (20 from each tumor type). Arrowheads show the twooutlier tumors, one within the colonic group and one distinct from the threetumor groups. Arrows highlight the group of mucinous ovarian tumors thatare seen as colon-like. Colon cohort, red; lung cohort, green; and ovarycohort, blue.
1234 Giordano et alAJP October 2001, Vol. 159, No. 4
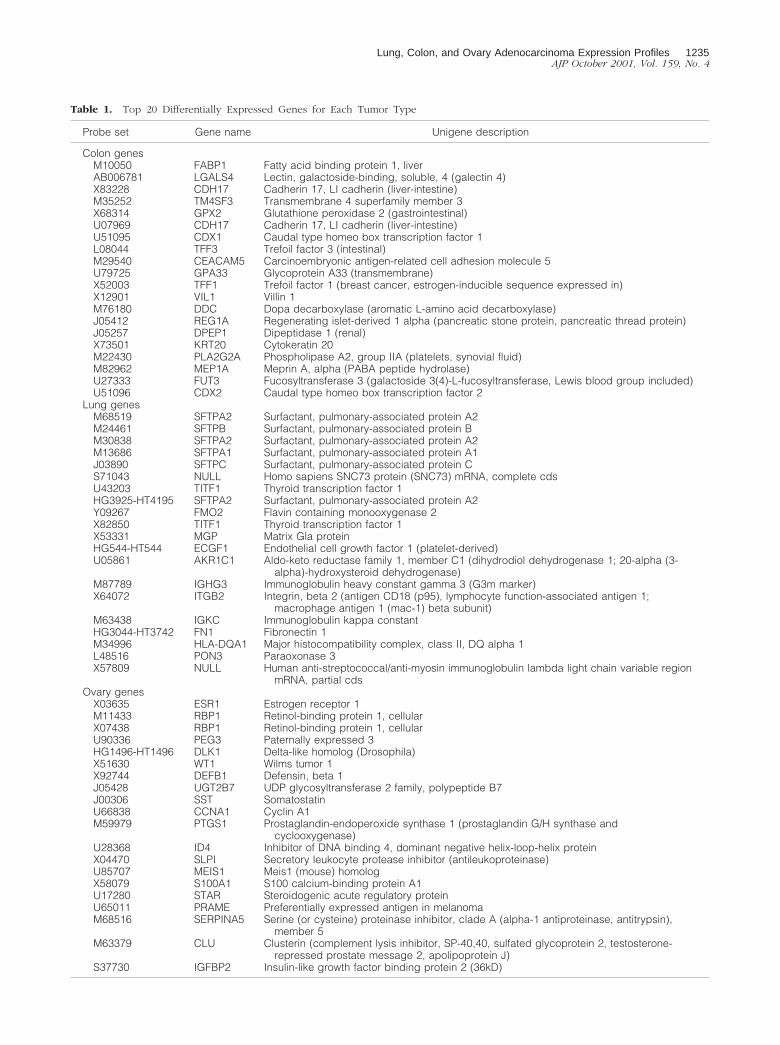
Table 1. Top 20 Differentially Expressed Genes for Each Tumor Type
Probe set Gene name Unigene description
Colon genesM10050 FABP1 Fatty acid binding protein 1, liverAB006781 LGALS4 Lectin, galactoside-binding, soluble, 4 (galectin 4)X83228 CDH17 Cadherin 17, LI cadherin (liver-intestine)M35252 TM4SF3 Transmembrane 4 superfamily member 3X68314 GPX2 Glutathione peroxidase 2 (gastrointestinal)U07969 CDH17 Cadherin 17, LI cadherin (liver-intestine)U51095 CDX1 Caudal type homeo box transcription factor 1L08044 TFF3 Trefoil factor 3 (intestinal)M29540 CEACAM5 Carcinoembryonic antigen-related cell adhesion molecule 5U79725 GPA33 Glycoprotein A33 (transmembrane)X52003 TFF1 Trefoil factor 1 (breast cancer, estrogen-inducible sequence expressed in)X12901 VIL1 Villin 1M76180 DDC Dopa decarboxylase (aromatic L-amino acid decarboxylase)J05412 REG1A Regenerating islet-derived 1 alpha (pancreatic stone protein, pancreatic thread protein)J05257 DPEP1 Dipeptidase 1 (renal)X73501 KRT20 Cytokeratin 20M22430 PLA2G2A Phospholipase A2, group IIA (platelets, synovial fluid)M82962 MEP1A Meprin A, alpha (PABA peptide hydrolase)U27333 FUT3 Fucosyltransferase 3 (galactoside 3(4)-L-fucosyltransferase, Lewis blood group included)U51096 CDX2 Caudal type homeo box transcription factor 2
Lung genesM68519 SFTPA2 Surfactant, pulmonary-associated protein A2M24461 SFTPB Surfactant, pulmonary-associated protein BM30838 SFTPA2 Surfactant, pulmonary-associated protein A2M13686 SFTPA1 Surfactant, pulmonary-associated protein A1J03890 SFTPC Surfactant, pulmonary-associated protein CS71043 NULL Homo sapiens SNC73 protein (SNC73) mRNA, complete cdsU43203 TITF1 Thyroid transcription factor 1HG3925-HT4195 SFTPA2 Surfactant, pulmonary-associated protein A2Y09267 FMO2 Flavin containing monooxygenase 2X82850 TITF1 Thyroid transcription factor 1X53331 MGP Matrix Gla proteinHG544-HT544 ECGF1 Endothelial cell growth factor 1 (platelet-derived)U05861 AKR1C1 Aldo-keto reductase family 1, member C1 (dihydrodiol dehydrogenase 1; 20-alpha (3-
alpha)-hydroxysteroid dehydrogenase)M87789 IGHG3 Immunoglobulin heavy constant gamma 3 (G3m marker)X64072 ITGB2 Integrin, beta 2 (antigen CD18 (p95), lymphocyte function-associated antigen 1;
macrophage antigen 1 (mac-1) beta subunit)M63438 IGKC Immunoglobulin kappa constantHG3044-HT3742 FN1 Fibronectin 1M34996 HLA-DQA1 Major histocompatibility complex, class II, DQ alpha 1L48516 PON3 Paraoxonase 3X57809 NULL Human anti-streptococcal/anti-myosin immunoglobulin lambda light chain variable region
mRNA, partial cdsOvary genes
X03635 ESR1 Estrogen receptor 1M11433 RBP1 Retinol-binding protein 1, cellularX07438 RBP1 Retinol-binding protein 1, cellularU90336 PEG3 Paternally expressed 3HG1496-HT1496 DLK1 Delta-like homolog (Drosophila)X51630 WT1 Wilms tumor 1X92744 DEFB1 Defensin, beta 1J05428 UGT2B7 UDP glycosyltransferase 2 family, polypeptide B7J00306 SST SomatostatinU66838 CCNA1 Cyclin A1M59979 PTGS1 Prostaglandin-endoperoxide synthase 1 (prostaglandin G/H synthase and
cyclooxygenase)U28368 ID4 Inhibitor of DNA binding 4, dominant negative helix-loop-helix proteinX04470 SLPI Secretory leukocyte protease inhibitor (antileukoproteinase)U85707 MEIS1 Meis1 (mouse) homologX58079 S100A1 S100 calcium-binding protein A1U17280 STAR Steroidogenic acute regulatory proteinU65011 PRAME Preferentially expressed antigen in melanomaM68516 SERPINA5 Serine (or cysteine) proteinase inhibitor, clade A (alpha-1 antiproteinase, antitrypsin),
member 5M63379 CLU Clusterin (complement lysis inhibitor, SP-40,40, sulfated glycoprotein 2, testosterone-
repressed prostate message 2, apolipoprotein J)S37730 IGFBP2 Insulin-like growth factor binding protein 2 (36kD)
Lung, Colon, and Ovary Adenocarcinoma Expression Profiles 1235AJP October 2001, Vol. 159, No. 4

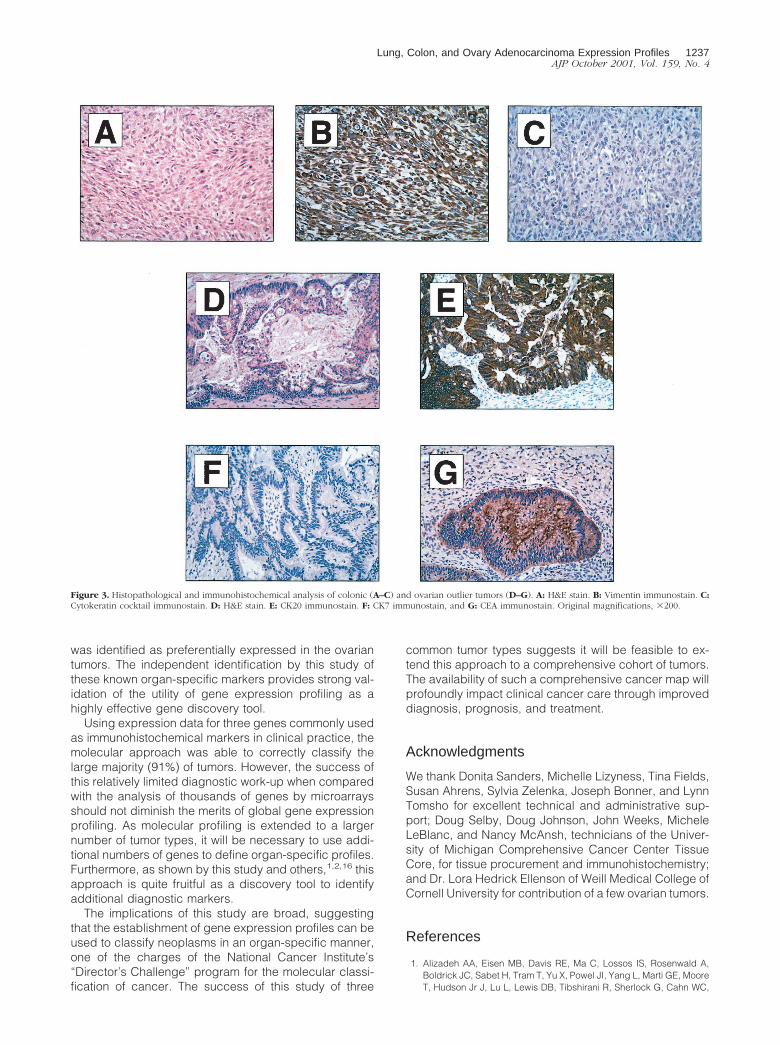
ical classification. This approach is typically used bypracticing surgical pathologists to determine the likelyorigin of tumors of uncertain primary site. The colonictumor, a pleomorphic spindle-cell neoplasm on routineH&E (Figure 3A), was correctly diagnosed at the contrib-uting hospital as a nonepithelial neoplasm, probablysarcoma, but was included in the colon cancer cohortbecause all of these tumors were derived from a popu-lation-based study of incident, invasive colorectalcancers, almost all of which are adenocarcinomas. Im-munostains for low- and high-molecular weight cytokera-tins, CK7 and CK20, S-100, HMB-45, vimentin, muscle-specific actin, and smooth muscle actin showed theneoplastic cells to be negative for cytokeratins (Figure3B), S-100 (not shown), and HMB-45 (not shown),strongly positive for vimentin (Figure 3C), and focallypositive for both actins (not shown). This immunohisto-chemical profile, together with the histopathology, is di-agnostic of high-grade leiomyosarcoma. Gastrointestinalstromal tumor was not an appropriate diagnosis basedon histopathology, a negative KIT immunostain (notshown), and no detectable expression of the c-kit geneon the array (not shown).
The outlier ovarian tumor was originally diagnosed as aprimary mucinous ovarian adenocarcinoma (Figure 3D).Review of the microarray expression data for CK7 andCK20 and CEA showed low levels of expression for CK7and high levels of expression for CK20, in sharp contrastto other tumors in the ovarian cohort (high CK7 and lowCK20). The CEA data were not informative. Immunohis-tochemical stains for CK7, CK20, and CEA, performed tovalidate the expression data and to investigate the pos-sibility that this tumor was metastatic to ovary, showedstrong and diffuse tumor immunoreactivity for CK20 (Fig-ure 3E), whereas CK7 showed no immunoreactivity (Fig-ure 3F). CEA showed strong and diffuse immunoreactivityof the tumor cells and associated mucin (Figure 3G).These results offered strong support for the view that thistumor was a colonic adenocarcinoma metastatic to ovaryrather than a primary ovarian adenocarcinoma.
Classification Using Known Diagnostic Markers
In practice, it is possible to discriminate most colon,ovary, and lung adenocarcinomas with histopathologyand a limited immunohistochemical profile that includesmarkers CK7, CK20, and thyroid transcription factor(TTF)-1, in which colon tumors are CK7 (�), CK20 (�),and TTF-1 (�), ovary tumors are CK7 (�), CK20 (�), andTTF-1 (�), and lung tumors are CK7 (�), CK20 (�), andTTF-1 (�). In our cohort of tumors, using the array ex-pression data for these three markers and using the samestatistical approach, these markers correctly classified138 of 154 samples, with 152 of 152 being the bestpossible outcome (see above).
Discussion
We have generated comprehensive gene expressionprofiles from 154 primary lung, colon, and ovarian ade-
nocarcinomas and used two statistical methods, PCAand cross-validated prediction based on differentially ex-pressed genes, to identify differences that allow discrim-ination of tumors in an organ-specific manner. Our resultsdemonstrate strong discrimination of these tumors basedsolely on gene expression profiles.
A previous proof of principle gene expression-profilingstudy reported molecular discrimination of acute myelog-enous leukemia from acute lymphoblastic leukemia.5 Al-though these leukemias can be separated on morpho-logical grounds in the majority of cases, there are tumorsthat require adjuvant methodologies, such as flow cytom-etry, for accurate diagnosis. Similarly, the current studycompares gene expression profiles of histologically sim-ilar tumors, ie, adenocarcinomas, from three commonsites that usually can be morphologically separated butsometimes pose diagnostic difficulties. For instance, thehistopathological separation of primary ovarian carcino-mas from metastases from a gastrointestinal source is acommon diagnostic dilemma, as is illustrated by the out-lier ovarian tumor in this study. This tumor, diagnosed asprimary ovarian mucinous adenocarcinoma, was shownto be of probable colonic origin by immunohistochemicalevaluation of low-molecular weight cytokeratin proteins 7and 20 and CEA, markers with demonstrated diagnosticutility.6 The ability of the expression profiles to identify thistumor as not belonging to the ovarian cohort further val-idates this approach. Thus, it would be interesting todetermine the utility of this approach to the evaluation ofmucinous tumors of the abdominal cavity of unknownorigin.
The other nonconforming case, a primary invasivecolorectal cancer, was similarly investigated and shownto be a colonic sarcoma by histopathology and immuno-histochemical profile. This case also provides further val-idation of the gene expression profiles. Comparison ofthe expression data from the sarcoma to the colonicadenocarcinoma cohort illustrates some of the differ-ences in specific gene expression. Examples of suchdifferentially expressed genes include vimentin and en-teric smooth muscle-�2 actin, genes previously shown tobe expressed in sarcomas and useful diagnostic immu-nohistochemical markers,7,8 and other genes not previ-ously shown to be expressed in sarcomas (for example,C-type lectin superfamily member 2; CLECSF2).
Many of the potential differentially expressed genesidentified by this method have previously been shown tobe either diagnostically useful and/or expressed in anorgan-specific manner. TTF-1 is a nuclear protein ex-pressed in pulmonary and thyroid epithelium,9 plays arole in lung and thyroid development,10 and is an immu-nohistochemical marker used to distinguish primary frommetastatic lung adenocarcinoma.11,12 TTF-1, as well asseveral surfactant-related genes, was identified as one ofthe genes whose expression is primarily restricted to lungadenocarcinomas. Similarly, the CDX1 and CDX2 genes,which encode intestine-specific transcription factors,13,14
were identified as preferentially expressed in the colontumors, as was CK20, a known marker of colonic adeno-carcinoma.6 Finally, the estrogen receptor 1 gene, knownas a marker of breast and gynecological malignancies,15
1236 Giordano et alAJP October 2001, Vol. 159, No. 4
was identified as preferentially expressed in the ovariantumors. The independent identification by this study ofthese known organ-specific markers provides strong val-idation of the utility of gene expression profiling as ahighly effective gene discovery tool.
Using expression data for three genes commonly usedas immunohistochemical markers in clinical practice, themolecular approach was able to correctly classify thelarge majority (91%) of tumors. However, the success ofthis relatively limited diagnostic work-up when comparedwith the analysis of thousands of genes by microarraysshould not diminish the merits of global gene expressionprofiling. As molecular profiling is extended to a largernumber of tumor types, it will be necessary to use addi-tional numbers of genes to define organ-specific profiles.Furthermore, as shown by this study and others,1,2,16 thisapproach is quite fruitful as a discovery tool to identifyadditional diagnostic markers.
The implications of this study are broad, suggestingthat the establishment of gene expression profiles can beused to classify neoplasms in an organ-specific manner,one of the charges of the National Cancer Institute’s“Director’s Challenge” program for the molecular classi-fication of cancer. The success of this study of three
common tumor types suggests it will be feasible to ex-tend this approach to a comprehensive cohort of tumors.The availability of such a comprehensive cancer map willprofoundly impact clinical cancer care through improveddiagnosis, prognosis, and treatment.
Acknowledgments
We thank Donita Sanders, Michelle Lizyness, Tina Fields,Susan Ahrens, Sylvia Zelenka, Joseph Bonner, and LynnTomsho for excellent technical and administrative sup-port; Doug Selby, Doug Johnson, John Weeks, MicheleLeBlanc, and Nancy McAnsh, technicians of the Univer-sity of Michigan Comprehensive Cancer Center TissueCore, for tissue procurement and immunohistochemistry;and Dr. Lora Hedrick Ellenson of Weill Medical College ofCornell University for contribution of a few ovarian tumors.
References
1. Alizadeh AA, Eisen MB, Davis RE, Ma C, Lossos IS, Rosenwald A,Boldrick JC, Sabet H, Tram T, Yu X, Powel JI, Yang L, Marti GE, MooreT, Hudson Jr J, Lu L, Lewis DB, Tibshirani R, Sherlock G, Cahn WC,
Figure 3. Histopathological and immunohistochemical analysis of colonic (A–C) and ovarian outlier tumors (D–G). A: H&E stain. B: Vimentin immunostain. C:Cytokeratin cocktail immunostain. D: H&E stain. E: CK20 immunostain. F: CK7 immunostain, and G: CEA immunostain. Original magnifications, �200.
Lung, Colon, and Ovary Adenocarcinoma Expression Profiles 1237AJP October 2001, Vol. 159, No. 4
Greiner TC, Weisenburger DD, Armitage JO, Warnke R, Levy R,Wilson W, Grever MR, Byrd JC, Botstein D, Brown PO, Staudt LM:Distinct types of diffuse large B-cell lymphoma identified by geneexpression profiling. Nature 2000, 403:503–511
2. Bittner M, Meltzer P, Chen Y, Jiang Y, Seftor E, Hendrix M, Radma-cher M, Simon R, Yakhini Z, Ben-Dor A, Sampas N, Dougherty E,Wang E, Marincola F, Gooden C, Lueders J, Glatfelter A, Pollock P,Carpten J, Gillanders E, Leja D, Dietrich K, Beaudry C, Berens M,Alberts D, Sondak V, Hayward N, Trent J: Molecular classification ofcutaneous malignant melanoma by gene expression profiling. Nature2000, 406:536–540
3. Ripley B: Pattern Recognition and Neural Networks. Cambridge Uni-versity Press, 1996
4. Sheibani K, Tubbs RR: Enzyme immunohistochemistry. Technicalaspects. Semin Diagn Pathol 1984, 1:235–250
5. Golub TR, Slonim DK, Tamayo P, Huard C, Gaasenbeek M, MesirovJP, Coller H, Loh ML, Downing JR, Caligiuri MA, Bloomfield CD,Lander ES: Molecular classification of cancer: class discovery andclass prediction by gene expression monitoring. Science 1999, 286:531–537
6. Chu P, Wu E, Weiss LM: Cytokeratin 7 and cytokeratin 20 expressionin epithelial neoplasms: a survey of 435 cases. Mod Pathol 2000,13:962–972
7. Leader M, Collins M, Patel J, Henry K: Vimentin. An evaluation of itsrole as a tumor marker. Histopathology 1987, 11:63–72
8. Skalli O, Gabbiani G, Babai F, Seemayer TA, Pizzolato G, Schurch W:Intermediate filament proteins and actin isoforms as markers for softtissue tumor differentiation and origin. Am J Pathol 1988, 130:515–531
9. Li C, Cai J, Pan Q, Minoo P: Two functionally distinct forms of NKX2.1
protein are expressed in the pulmonary epithelium. Biochem BiophysRes Comm 2000, 270:462–468
10. Lazzaro D, Price M, De Felice M, Di Lauro R: The transcription factorTTF-1 is expressed at the onset of thyroid and lung morphogenesisand in restricted regions of the foetal brain. Development 1996,113:673–678
11. Pelosi G, Fraggetta F, Pasini F, Maisonneuve P, Sonzogni A, IannucciA, Terzi A, Bresaola E, Valduga F, Lupo C, Viale G: Immunoreactivityfor thyroid transcription factor-1 in stage I non-small cell carcinomasof the lung. Am J Surg Pathol 2001, 25:363–372
12. Reis-Filho JS, Carrilho C, Valenti C, Leitao D, Ribeiro CA, Ribeiro SG,Schmidt FC: Is TTF1 a good immunohistochemical marker to distin-guish primary from metastatic lung adenocarcinomas? Pathol ResPract 2000, 196:835–840
13. Ee HC, Erler T, Bhathal PS, Young GP, James RJ: Cdx-2 homeodo-main protein expression in human and rat colorectal adenoma andcarcinoma. Am J Pathol 1995, 147:586–592
14. Silberg DG, Furth EE, Taylor JK, Schuck T, Chiou T, Traber PG: CDX1protein expression in normal, metaplastic, and neoplastic humanalimentary tract epithelium. Gastroenterology 1997, 113:478–486
15. Brandenberger AW, Tee MK, Jaffe RB: Estrogen receptor alpha andbeta mRBAs in normal ovary, ovarian serous cystadenocarcinomaand ovarian cell lines: down-regulation of ER-beta in neoplastic tis-sues. J Clin Endocrinol Metab 1998, 83:1025–1028
16. Welch JB, Zarrinkar PP, Sapinoso LM, Kern SG, Behling CA, MonkBJ, Lockhart DJ, Burger RA, Hampton GM: Analysis of gene expres-sion profiles in normal and neoplastic ovarian tissue samples identi-fied candidate molecular markers of epithelial ovarian cancer. ProcNatl Acad Sci USA 2001, 98:1176–1181
1238 Giordano et alAJP October 2001, Vol. 159, No. 4