Oracle CX Sales and B2B Service
192
Oracle CX Sales and B2B Service Creating and Administering Analytics 21D
-
Upload
khangminh22 -
Category
Documents
-
view
1 -
download
0
Transcript of Oracle CX Sales and B2B Service
Oracle CX Salesand B2B Service
Creating and AdministeringAnalytics
21D
Oracle CX Sales and B2B ServiceCreating and Administering Analytics
21DPart Number F46228-01Copyright © 2011, 2021, Oracle and/or its affiliates.
Authors: Writers: Brian Oden, Penny Anderson, Dan Hilldale. Essan Jirman. Product Managers: Anand DN, Technical Support: Priscila Terazawa Nakamura
This software and related documentation are provided under a license agreement containing restrictions on use and disclosure and are protectedby intellectual property laws. Except as expressly permitted in your license agreement or allowed by law, you may not use, copy, reproduce, translate,broadcast, modify, license, transmit, distribute, exhibit, perform, publish, or display any part, in any form, or by any means. Reverse engineering,disassembly, or decompilation of this software, unless required by law for interoperability, is prohibited.
The information contained herein is subject to change without notice and is not warranted to be error-free. If you find any errors, please reportthem to us in writing.
If this is software or related documentation that is delivered to the U.S. Government or anyone licensing it on behalf of the U.S. Government, thenthe following notice is applicable:
U.S. GOVERNMENT END USERS: Oracle programs (including any operating system, integrated software, any programs embedded, installed oractivated on delivered hardware, and modifications of such programs) and Oracle computer documentation or other Oracle data delivered to oraccessed by U.S. Government end users are "commercial computer software" or "commercial computer software documentation" pursuant to theapplicable Federal Acquisition Regulation and agency-specific supplemental regulations. As such, the use, reproduction, duplication, release, display,disclosure, modification, preparation of derivative works, and/or adaptation of i) Oracle programs (including any operating system, integratedsoftware, any programs embedded, installed or activated on delivered hardware, and modifications of such programs), ii) Oracle computerdocumentation and/or iii) other Oracle data, is subject to the rights and limitations specified in the license contained in the applicable contract. Theterms governing the U.S. Government's use of Oracle cloud services are defined by the applicable contract for such services. No other rights aregranted to the U.S. Government.
This software or hardware is developed for general use in a variety of information management applications. It is not developed or intended foruse in any inherently dangerous applications, including applications that may create a risk of personal injury. If you use this software or hardwarein dangerous applications, then you shall be responsible to take all appropriate fail-safe, backup, redundancy, and other measures to ensure its safeuse. Oracle Corporation and its affiliates disclaim any liability for any damages caused by use of this software or hardware in dangerous applications.
Oracle and Java are registered trademarks of Oracle and/or its affiliates. Other names may be trademarks of their respective owners.
Intel and Intel Inside are trademarks or registered trademarks of Intel Corporation. All SPARC trademarks are used under license and are trademarksor registered trademarks of SPARC International, Inc. AMD, Epyc, and the AMD logo are trademarks or registered trademarks of Advanced MicroDevices. UNIX is a registered trademark of The Open Group.
This software or hardware and documentation may provide access to or information about content, products, and services from third parties. OracleCorporation and its affiliates are not responsible for and expressly disclaim all warranties of any kind with respect to third-party content, products, andservices unless otherwise set forth in an applicable agreement between you and Oracle. Oracle Corporation and its affiliates will not be responsiblefor any loss, costs, or damages incurred due to your access to or use of third-party content, products, or services, except as set forth in an applicableagreement between you and Oracle.
The business names used in this documentation are fictitious, and are not intended to identify any real companies currently or previously in existence.
Oracle CX Sales and B2B ServiceCreating and Administering Analytics
Contents
Preface i
1 About This Guide 1Audience and Scope ..................................................................................................................................................................... 1
Related Guides for Analytics ....................................................................................................................................................... 1
Analytics Terminology .................................................................................................................................................................. 2
2 Best Practice and Performance 5Prerequisites for Working with Analytics ................................................................................................................................. 5
Best Practices and Analytics Resources .................................................................................................................................. 6
Queries and Performance ........................................................................................................................................................... 6
Diagnose Performance Using Subject Areas .......................................................................................................................... 9
How to Tune Performance for Reports ................................................................................................................................... 11
Row Limits in Analyses ............................................................................................................................................................... 11
Analysis and Report Limits ....................................................................................................................................................... 12
Localize Catalog Captions ........................................................................................................................................................ 20
3 Analytics Access, Currency, and Display 23Analytics for Your Sales Teams ................................................................................................................................................ 23
Business Intelligence Catalog ................................................................................................................................................... 25
Analytics Security and Permissions ........................................................................................................................................ 26
BI Administrator Permissions ................................................................................................................................................... 27
Optimize Analytics Display ....................................................................................................................................................... 29
Currency Settings for Analytics ............................................................................................................................................... 41
Oracle CX Sales and B2B ServiceCreating and Administering Analytics
4 Subject Areas 47Listing of Prebuilt Subject Areas ............................................................................................................................................. 47
Subject Area Updates ................................................................................................................................................................ 47
How Subject Areas Work .......................................................................................................................................................... 48
Choosing the Right Subject Area for Your Analytics .......................................................................................................... 49
What are Facts? ........................................................................................................................................................................... 51
Hierarchies in Analytics .............................................................................................................................................................. 51
View Subject Area Details ......................................................................................................................................................... 52
Subject Area Context And Analytic Results .......................................................................................................................... 53
About Creating Your Own Subject Areas .............................................................................................................................. 55
5 ESS Scheduled Processes for Analytics 57Scheduled Processes for Analytics ......................................................................................................................................... 57
View Status and Other Details for Scheduled Processes ................................................................................................... 59
View Output from Scheduled Processes ............................................................................................................................... 63
Cancel or Make Changes to Scheduled Processes .............................................................................................................. 63
Submit Scheduled Processes and Process Sets .................................................................................................................. 65
Create Job Definitions to Run Reports as Scheduled Processes ...................................................................................... 67
Define Parameters for Job Definitions .................................................................................................................................. 69
6 Application Adoption and Usage Reporting 71Managing Data for User Adoption and Application Usage Insights ................................................................................ 71
Set Up Adoption and Usage Tracking .................................................................................................................................... 71
Subject Areas for Adoption and Usage Reporting .............................................................................................................. 75
Configurations for User Adoption Reporting with OTBI .................................................................................................... 78
Click History Subject Area ........................................................................................................................................................ 80
How to Disable Data Processing and Collection for Adoption Reporting ...................................................................... 82
Adoption, Usage, and Object Reporting Metrics ................................................................................................................. 83
Adoption and Usage Reporting Dashboards ....................................................................................................................... 84
FAQs for Application Adoption and Usage ........................................................................................................................... 87
Application Usage Insights ....................................................................................................................................................... 89
7 Prebuilt Analytics 101Analytics for User Roles ........................................................................................................................................................... 101
Listing of Prebuilt Analytics .................................................................................................................................................... 102
Oracle CX Sales and B2B ServiceCreating and Administering Analytics
8 Create and Edit Analytics 105Data Structure for Analytics ................................................................................................................................................... 105
Create and Modify Analyses and Dashboards ................................................................................................................... 106
Edit Prebuilt Analytics .............................................................................................................................................................. 107
Review SQL Statements Used in Analyses .......................................................................................................................... 107
CX Sales Repository and Session Variables for Business Intelligence ........................................................................... 108
Create a Cross-Subject Area Analysis ................................................................................................................................... 110
Multiple Subject Area Reporting ............................................................................................................................................. 111
Create and Edit Analyses Using a Wizard ............................................................................................................................ 122
Manage Analytics with Advanced Features ........................................................................................................................ 124
Create an Activity Analysis for Your Sales Team ................................................................................................................ 125
Create an Opportunity Analysis ............................................................................................................................................. 126
Create and Filter an Historical Trending Analysis .............................................................................................................. 128
Create and Edit Dashboards ................................................................................................................................................... 129
Localize Catalog Captions ....................................................................................................................................................... 130
FAQs for Analytics and Dashboards ...................................................................................................................................... 131
9 Analytics on Interfaces 133Analytic Interfaces For Your Sales Teams ............................................................................................................................ 133
Embed Analyses and Dashboards ......................................................................................................................................... 134
Sandboxes ................................................................................................................................................................................... 135
Infolets ......................................................................................................................................................................................... 138
Analytics on Object Pages ...................................................................................................................................................... 144
Expose the Refresh, Export, and Print Links on Tabs ....................................................................................................... 148
Paths and Links to Analytics .................................................................................................................................................. 150
ADF Contextual Event Action ................................................................................................................................................. 150
USER_PARTY_ID Session Variable ......................................................................................................................................... 153
Deep Linking .............................................................................................................................................................................. 154
Embed Analyses and Dashboards ......................................................................................................................................... 162
10 Schedule and Share Analytics 165Create Briefing Books .............................................................................................................................................................. 165
Schedule Analytics, Dashboard Pages, and Briefing Books ............................................................................................ 165
Schedule Snapshots of Your Sales Historical Pipeline ...................................................................................................... 166
Oracle CX Sales and B2B ServiceCreating and Administering Analytics
11 Analytics Folders 171Where to Save Analytics and Reports ................................................................................................................................... 171
Manage Predefined Catalog Permission ............................................................................................................................... 171
How to Create OTBI Folders ................................................................................................................................................... 177
Set Folder Permissions and Attributes ................................................................................................................................. 177
Set Folder Permissions ............................................................................................................................................................ 178
Archive and Move Analytics ................................................................................................................................................... 178
What happens to modified analytics and reports when a release update is applied? ............................................... 179
Oracle CX Sales and B2B ServiceCreating and Administering Analytics
Preface
i
PrefaceThis preface introduces information sources that can help you use the application.
Using Oracle Applications
HelpUse help icons to access help in the application. If you don't see any help icons on your page, click your user imageor name in the global header and select Show Help Icons. Not all pages have help icons.
If you don't see Show Help Icons in the Settings and Actions menu, you can access the Oracle Help Center to findguides and videos.
Watch: This video tutorial shows you how to find and use help.
You can also read about it instead.
Additional Resources
• Community: Use Oracle Cloud Customer Connect to get information from experts at Oracle, the partnercommunity, and other users.
• Training: Take courses on Oracle Cloud from Oracle University.
ConventionsThe following table explains the text conventions used in this guide.
Convention Meaning
boldface Boldface type indicates user interface elements, navigation paths, or values you enter or select.
monospace Monospace type indicates file, folder, and directory names, code examples, commands, and URLs.
> Greater than symbol separates elements in a navigation path.
Oracle CX Sales and B2B ServiceCreating and Administering Analytics
Preface
ii
Documentation AccessibilityFor information about Oracle's commitment to accessibility, visit the Oracle Accessibility Program website.
Videos included in this guide are provided as a media alternative for text-based help topics also available in this guide.
Diversity and InclusionOracle is fully committed to diversity and inclusion. Oracle respects and values having a diverse workforce that increasesthought leadership and innovation. As part of our initiative to build a more inclusive culture that positively impacts ouremployees, customers, and partners, we're working to remove insensitive terms from our products and documentation.We're also mindful of the necessity to maintain compatibility with our customers' existing technologies and the need toensure continuity of service as Oracle's offerings and industry standards evolve. Because of these technical constraints,our effort to remove insensitive terms is ongoing and will take time and external cooperation.
Contacting Oracle
Access to Oracle SupportOracle customers that have purchased support have access to electronic support through My Oracle Support. Forinformation, visit My Oracle Support or visit Oracle Accessibility Learning and Support if you are hearing impaired.
Comments and SuggestionsPlease give us feedback about Oracle Applications Help and guides! You can send an e-mail to:[email protected].
Oracle CX Sales and B2B ServiceCreating and Administering Analytics
Chapter 1About This Guide
1
1 About This Guide
Audience and ScopeThis guide gets you off to a good start covering many primary tasks that sales administrators will do to set up analyticsfor their organization. The tasks covered here are:
• Edit analytics that come with the application.
• Edit subject areas that come with the application.
• Build new analytics.
• Build new subject areas.
• Enable the sales pages.
• Add analytics to the sales pages.
• Add analytics to the side and sub tabs of the edit and object landing pages.
Note:
With release 20A (11.13.20.01.0), "Oracle Engagement Cloud" is now known as Oracle CX Sales and Oracle B2B Service.Existing Oracle Engagement Cloud users will retain access to Oracle CX Sales and B2B Service features under theirpreexisting licensing agreements. Any new users created within your current Oracle Engagement Cloud license countwill also retain the same access to Oracle CX Sales and Oracle B2B Service. To obtain additional features or manage yoursubscription, refer to your Oracle Cloud Applications Console.
This document describes features available to users under Oracle CX Sales, Oracle B2B Service, and Oracle EngagementCloud licensing agreements.
Related Guides for AnalyticsHere's a list of guides that contain information related to what's covered in this guide.
Title Description
Getting Started with Your SalesImplementation
This guide provides you with the concepts and procedures you need to implement a salesautomation solution in a test environment. You learn how to quickly implement a simplesolution for a business selling to other businesses.
Implementing Sales This guide provides conceptual information and procedures used to implement salesapplication components and features. It's intended for sales application administrators, and insome cases, administrators as they implement, configure, and use administrative componentsof the sales applications.
User's Guide for Business IntelligenceEnterprise Edition
This guide provides detailed instruction on working with the broader set of BI tools, which ishelpful as you are working with data in your application.
Oracle CX Sales and B2B ServiceCreating and Administering Analytics
Chapter 1About This Guide
2
Title Description
Security Reference for CX Sales andB2B Service
You can review the information in this guide to decide how to assign roles and privileges tospecific users depending upon who you want to see what information in your analytics.
Related Topics• Get Started with Your Sales Implementation• Implementing Sales• Security Reference for CX Sales and B2B Service
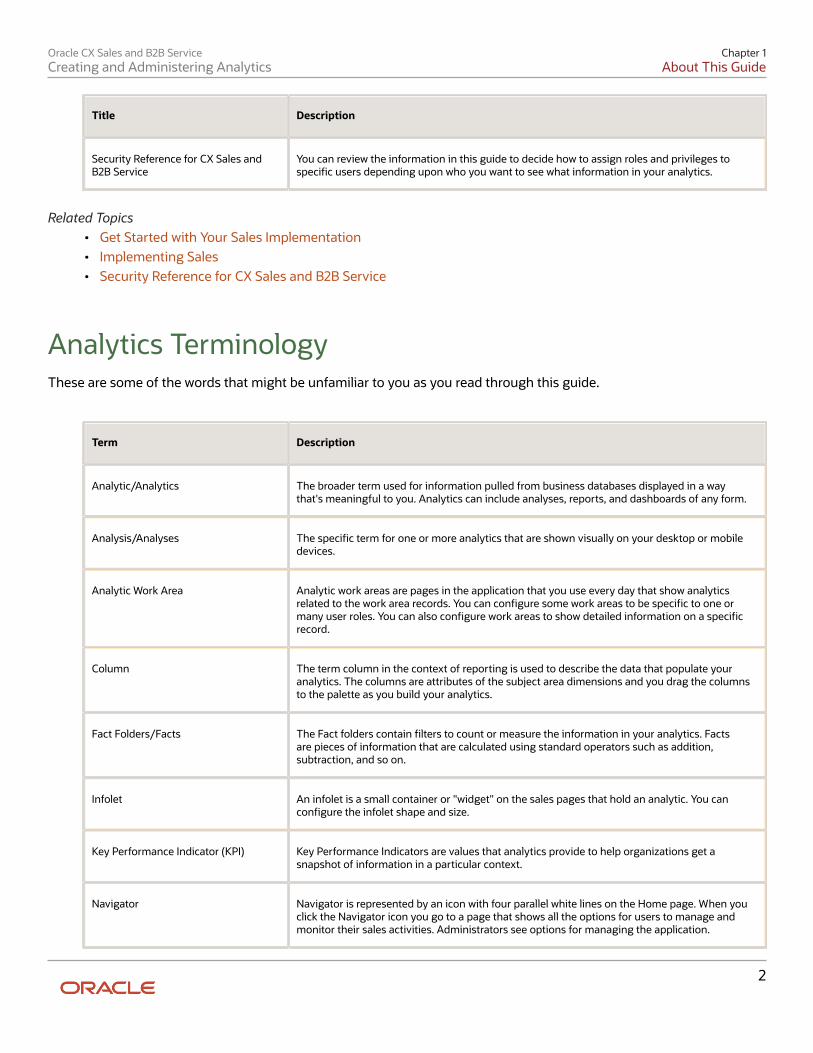
Analytics TerminologyThese are some of the words that might be unfamiliar to you as you read through this guide.
Term Description
Analytic/Analytics The broader term used for information pulled from business databases displayed in a waythat's meaningful to you. Analytics can include analyses, reports, and dashboards of any form.
Analysis/Analyses The specific term for one or more analytics that are shown visually on your desktop or mobiledevices.
Analytic Work Area Analytic work areas are pages in the application that you use every day that show analyticsrelated to the work area records. You can configure some work areas to be specific to one ormany user roles. You can also configure work areas to show detailed information on a specificrecord.
Column The term column in the context of reporting is used to describe the data that populate youranalytics. The columns are attributes of the subject area dimensions and you drag the columnsto the palette as you build your analytics.
Fact Folders/Facts The Fact folders contain filters to count or measure the information in your analytics. Factsare pieces of information that are calculated using standard operators such as addition,subtraction, and so on.
Infolet An infolet is a small container or "widget" on the sales pages that hold an analytic. You canconfigure the infolet shape and size.
Key Performance Indicator (KPI) Key Performance Indicators are values that analytics provide to help organizations get asnapshot of information in a particular context.
Navigator Navigator is represented by an icon with four parallel white lines on the Home page. When youclick the Navigator icon you go to a page that shows all the options for users to manage andmonitor their sales activities. Administrators see options for managing the application.
Oracle CX Sales and B2B ServiceCreating and Administering Analytics
Chapter 1About This Guide
3
Term Description
Oracle Business Intelligence Answers(BI)
BI is a major work area for analytics administrators. You view, edit, and create analytics andsubject areas in BI.
Report A report is a type of analytic used primarily for published presentation. Types of reports mightbe financial documents, human resource spreadsheets, and so on. The wizard for building areport walks you through a series of options for formatting the layout of the report.
Sandbox A sandbox is a testing stage you use to add and view changes to the interface without actuallyimplementing your changes to a live site.
Home Page The landing page for the application, also called the springboard.
Sales Icon The Sales Icon links to a page that contains icons with links to all of the major work areas forsales users.
Subject Area Subject areas are the building blocks of your analytics. You begin building your analytics bychoosing an appropriate subject area. Technically, subject areas are a grouping of databaseinputs called data objects that relate to each other in a particular context.

Oracle CX Sales and B2B ServiceCreating and Administering Analytics
Chapter 1About This Guide
4
Oracle CX Sales and B2B ServiceCreating and Administering Analytics
Chapter 2Best Practice and Performance
5
2 Best Practice and Performance
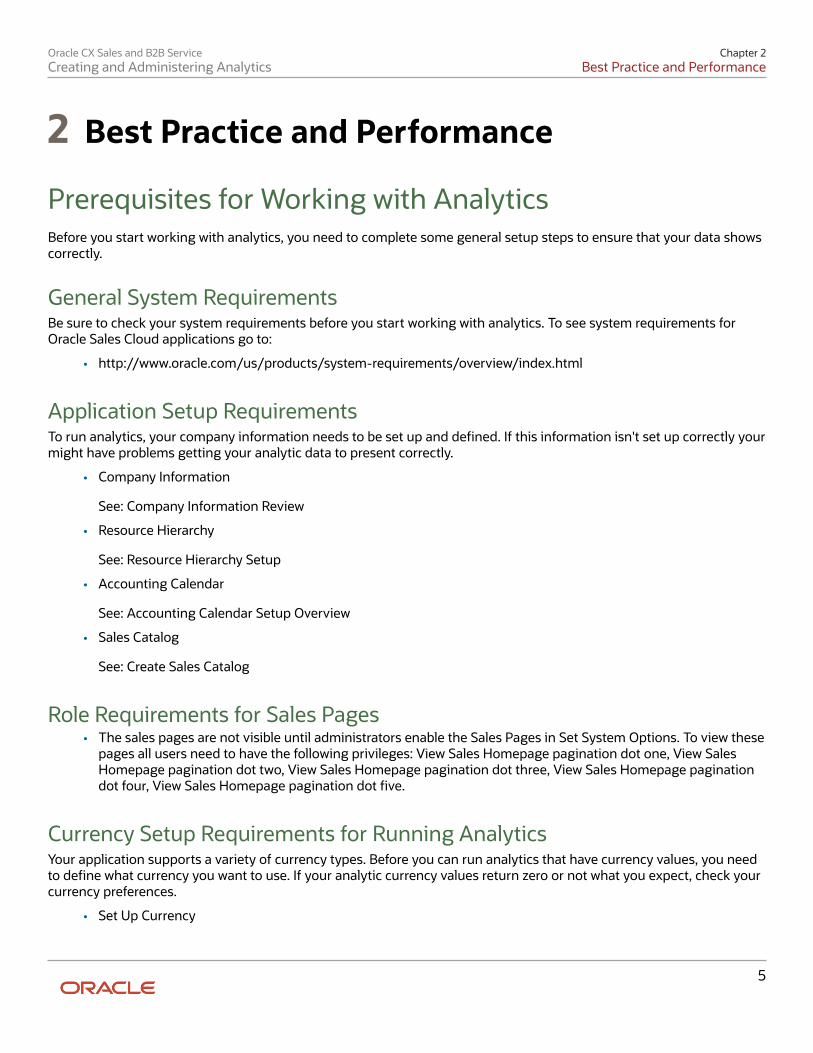
Prerequisites for Working with AnalyticsBefore you start working with analytics, you need to complete some general setup steps to ensure that your data showscorrectly.
General System RequirementsBe sure to check your system requirements before you start working with analytics. To see system requirements forOracle Sales Cloud applications go to:
• http://www.oracle.com/us/products/system-requirements/overview/index.html
Application Setup RequirementsTo run analytics, your company information needs to be set up and defined. If this information isn't set up correctly yourmight have problems getting your analytic data to present correctly.
• Company Information
See: Company Information Review
• Resource Hierarchy
See: Resource Hierarchy Setup
• Accounting Calendar
See: Accounting Calendar Setup Overview
• Sales Catalog
See: Create Sales Catalog
Role Requirements for Sales Pages• The sales pages are not visible until administrators enable the Sales Pages in Set System Options. To view these
pages all users need to have the following privileges: View Sales Homepage pagination dot one, View SalesHomepage pagination dot two, View Sales Homepage pagination dot three, View Sales Homepage paginationdot four, View Sales Homepage pagination dot five.
Currency Setup Requirements for Running AnalyticsYour application supports a variety of currency types. Before you can run analytics that have currency values, you needto define what currency you want to use. If your analytic currency values return zero or not what you expect, check yourcurrency preferences.
• Set Up Currency
Oracle CX Sales and B2B ServiceCreating and Administering Analytics
Chapter 2Best Practice and Performance
6
See: Currency and Exchange Rate Settings for Analytics
Related Topics
• System Requirements for Oracle Sales Cloud Applications
Best Practices and Analytics ResourcesHere are some links to best practice details. Some details might be already integrated in the guide. Some informationis hot off the press and will be added to this guide in the near future. Note that some linked resources require that yousign-in or sign-up for the site, such as Customer Connect, otherwise the link will not resolve.
Best Practices for Extending Subject Areas Using Joins in BIThere are many subject areas that come prebuilt with your application. These prebuilt subject areas are used in theprebuilt reports that also come with your application. You will likely want to extend existing subject areas or build yourown subject areas at some point to meet your particular business requirements. This link takes you to a documentthat you should read first to get started with extending subject areas in BI. You will need to login to access MOSsupport.. See MOS article 2348001.1 at https://mosemp.us.oracle.com/epmos/main/downloadattachmentprocessor?attachid=2348001.1%3AA1&action=inline
General Related Topic LinksThe links below take you to various best practice details that will help you when working with analytics in Sales Cloud.
Related Topics
• Reports and Analytics Resource Center
• Oracle Fusion Transactional Business Intelligence Performance Recommendations
• BI Reports and Dashboards - Best Practices Document
• Sample Sales Cloud Reports
Queries and PerformanceWhen an analysis runs, database aggregation and processing is prioritized so that there's as little data as possiblesent to the BI Server for more processing. When creating analyses, you should reinforce this principle to maximizeperformance.
Here's what happens when a query runs, in three phases:
1. SQL compiles2. Database SQL runs3. Data set is retrieved and displayed in an analysis
Oracle CX Sales and B2B ServiceCreating and Administering Analytics
Chapter 2Best Practice and Performance
7
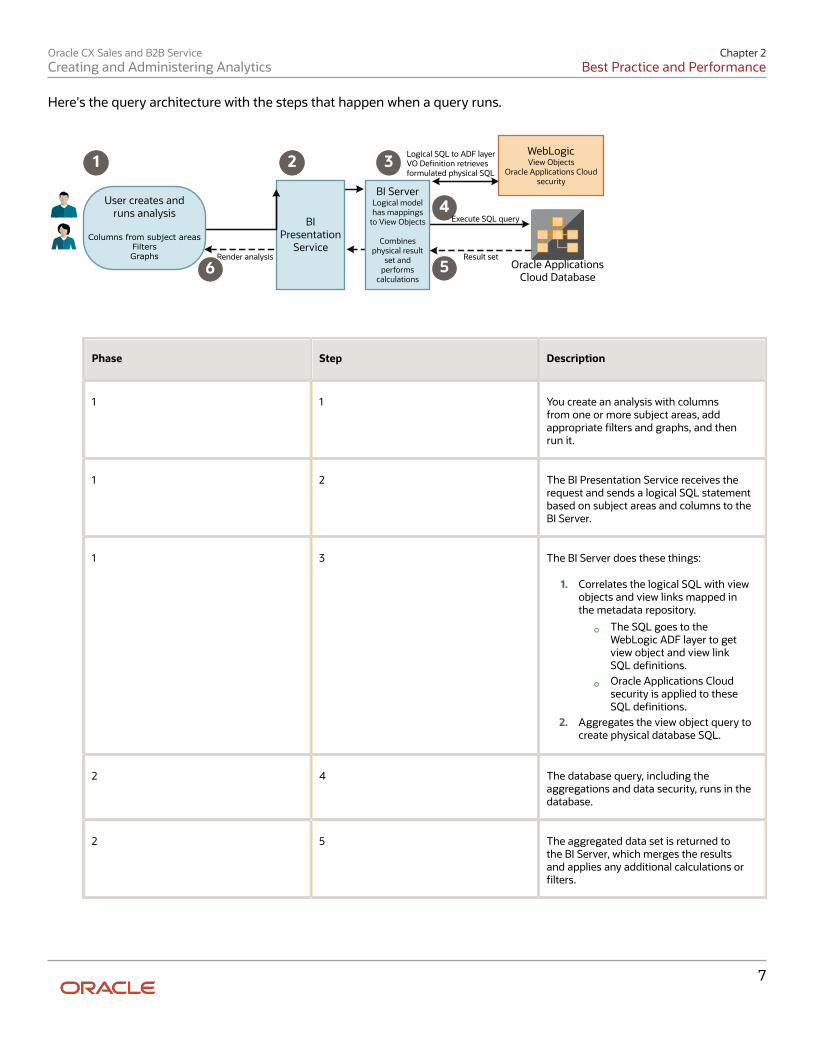
Here's the query architecture with the steps that happen when a query runs.
BI Presentation
Service
User creates andruns analysis
Columns from subject areasFiltersGraphs
WebLogicView Objects
Oracle Applications Cloud security
1 2
4
5 Oracle Applications Cloud Database
Execute SQL query
BI ServerLogical model has mappings
to View Objects
Combines physical result
set and performs
calculations
3
Result set
Logical SQL to ADF layerVO Denition retrievesformulated physical SQL
Render analysis
6
Phase Step Description
1 1 You create an analysis with columnsfrom one or more subject areas, addappropriate filters and graphs, and thenrun it.
1 2 The BI Presentation Service receives therequest and sends a logical SQL statementbased on subject areas and columns to theBI Server.
1 3 The BI Server does these things:
1. Correlates the logical SQL with viewobjects and view links mapped inthe metadata repository.
◦ The SQL goes to theWebLogic ADF layer to getview object and view linkSQL definitions.
◦ Oracle Applications Cloudsecurity is applied to theseSQL definitions.
2. Aggregates the view object query tocreate physical database SQL.
2 4 The database query, including theaggregations and data security, runs in thedatabase.
2 5 The aggregated data set is returned tothe BI Server, which merges the resultsand applies any additional calculations orfilters.
Oracle CX Sales and B2B ServiceCreating and Administering Analytics
Chapter 2Best Practice and Performance
8
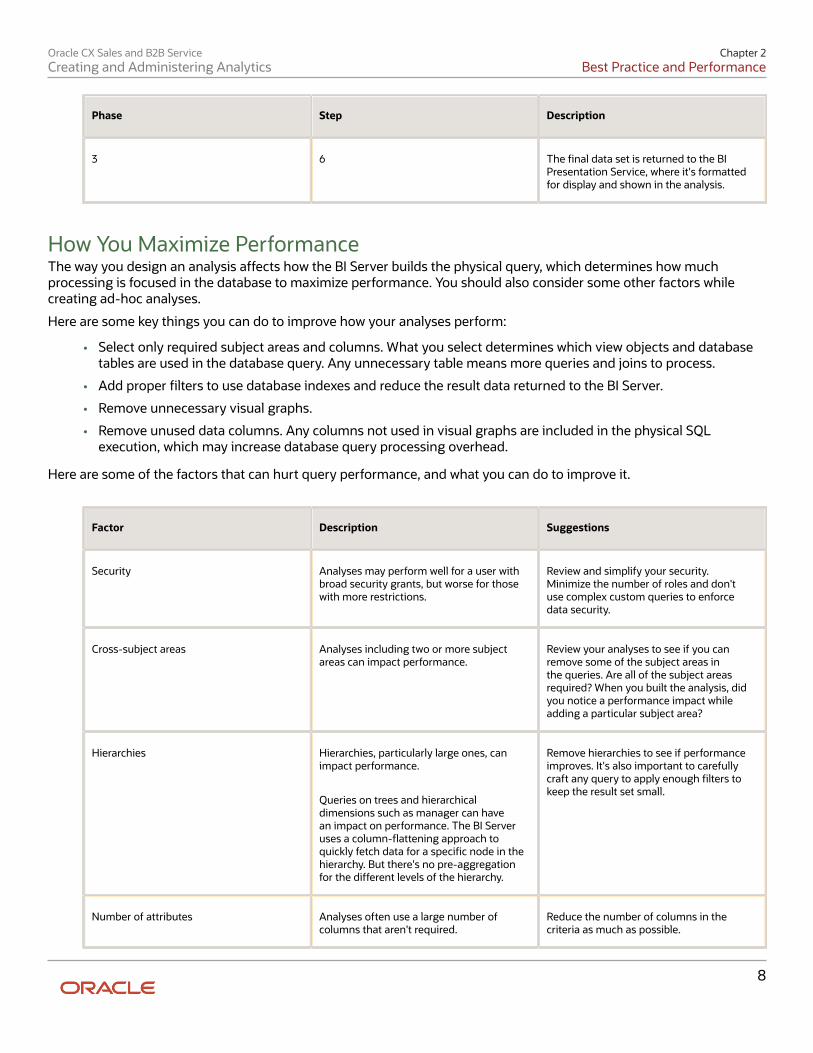
Phase Step Description
3 6 The final data set is returned to the BIPresentation Service, where it's formattedfor display and shown in the analysis.
How You Maximize PerformanceThe way you design an analysis affects how the BI Server builds the physical query, which determines how muchprocessing is focused in the database to maximize performance. You should also consider some other factors whilecreating ad-hoc analyses.
Here are some key things you can do to improve how your analyses perform:
• Select only required subject areas and columns. What you select determines which view objects and databasetables are used in the database query. Any unnecessary table means more queries and joins to process.
• Add proper filters to use database indexes and reduce the result data returned to the BI Server.
• Remove unnecessary visual graphs.
• Remove unused data columns. Any columns not used in visual graphs are included in the physical SQLexecution, which may increase database query processing overhead.
Here are some of the factors that can hurt query performance, and what you can do to improve it.
Factor Description Suggestions
Security Analyses may perform well for a user withbroad security grants, but worse for thosewith more restrictions.
Review and simplify your security.Minimize the number of roles and don'tuse complex custom queries to enforcedata security.
Cross-subject areas Analyses including two or more subjectareas can impact performance.
Review your analyses to see if you canremove some of the subject areas inthe queries. Are all of the subject areasrequired? When you built the analysis, didyou notice a performance impact whileadding a particular subject area?
Hierarchies Hierarchies, particularly large ones, canimpact performance.
Queries on trees and hierarchicaldimensions such as manager can havean impact on performance. The BI Serveruses a column-flattening approach toquickly fetch data for a specific node in thehierarchy. But there's no pre-aggregationfor the different levels of the hierarchy.
Remove hierarchies to see if performanceimproves. It's also important to carefullycraft any query to apply enough filters tokeep the result set small.
Number of attributes Analyses often use a large number ofcolumns that aren't required.
Reduce the number of columns in thecriteria as much as possible.
Oracle CX Sales and B2B ServiceCreating and Administering Analytics
Chapter 2Best Practice and Performance
9
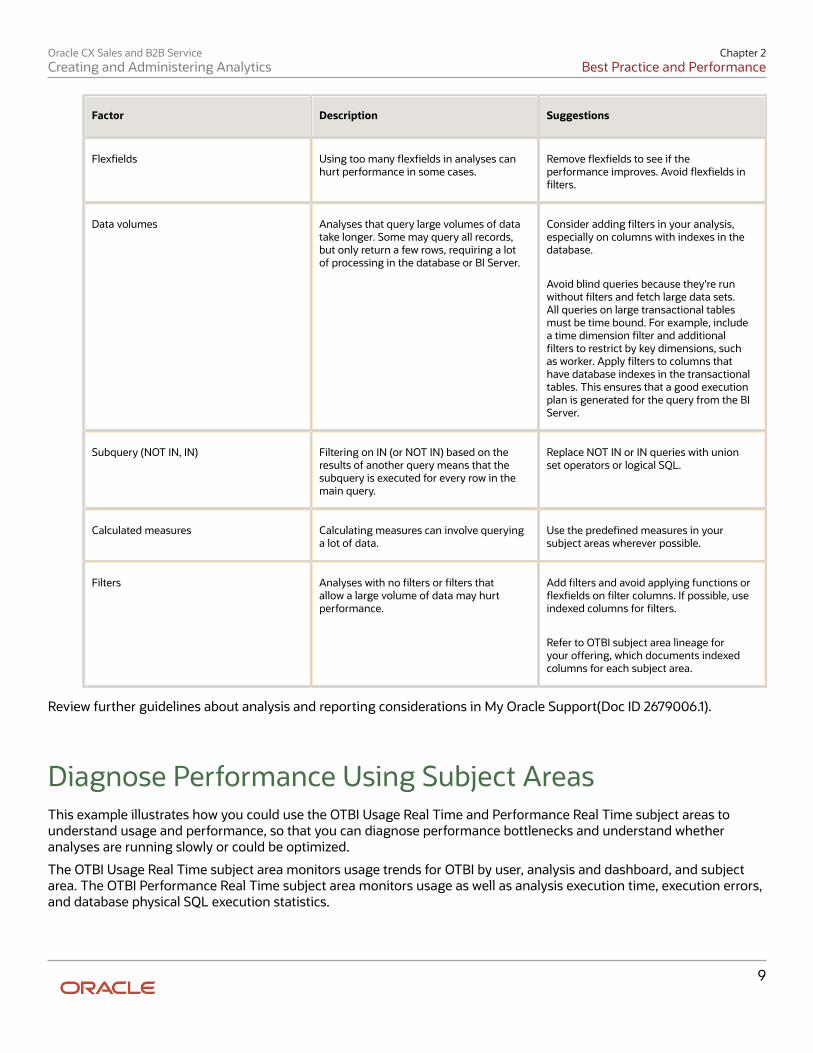
Factor Description Suggestions
Flexfields Using too many flexfields in analyses canhurt performance in some cases.
Remove flexfields to see if theperformance improves. Avoid flexfields infilters.
Data volumes Analyses that query large volumes of datatake longer. Some may query all records,but only return a few rows, requiring a lotof processing in the database or BI Server.
Consider adding filters in your analysis,especially on columns with indexes in thedatabase.
Avoid blind queries because they're runwithout filters and fetch large data sets.All queries on large transactional tablesmust be time bound. For example, includea time dimension filter and additionalfilters to restrict by key dimensions, suchas worker. Apply filters to columns thathave database indexes in the transactionaltables. This ensures that a good executionplan is generated for the query from the BIServer.
Subquery (NOT IN, IN) Filtering on IN (or NOT IN) based on theresults of another query means that thesubquery is executed for every row in themain query.
Replace NOT IN or IN queries with unionset operators or logical SQL.
Calculated measures Calculating measures can involve queryinga lot of data.
Use the predefined measures in yoursubject areas wherever possible.
Filters Analyses with no filters or filters thatallow a large volume of data may hurtperformance.
Add filters and avoid applying functions orflexfields on filter columns. If possible, useindexed columns for filters.
Refer to OTBI subject area lineage foryour offering, which documents indexedcolumns for each subject area.
Review further guidelines about analysis and reporting considerations in My Oracle Support(Doc ID 2679006.1).
Diagnose Performance Using Subject AreasThis example illustrates how you could use the OTBI Usage Real Time and Performance Real Time subject areas tounderstand usage and performance, so that you can diagnose performance bottlenecks and understand whetheranalyses are running slowly or could be optimized.
The OTBI Usage Real Time subject area monitors usage trends for OTBI by user, analysis and dashboard, and subjectarea. The OTBI Performance Real Time subject area monitors usage as well as analysis execution time, execution errors,and database physical SQL execution statistics.
Oracle CX Sales and B2B ServiceCreating and Administering Analytics
Chapter 2Best Practice and Performance
10
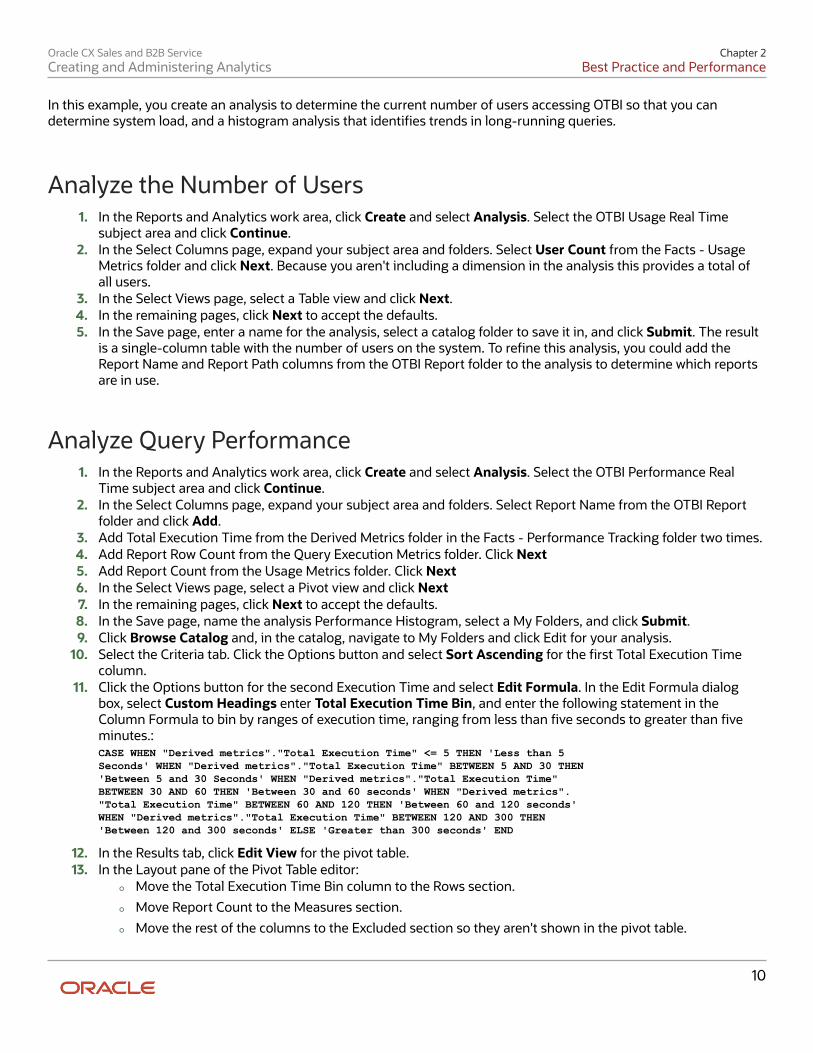
In this example, you create an analysis to determine the current number of users accessing OTBI so that you candetermine system load, and a histogram analysis that identifies trends in long-running queries.
Analyze the Number of Users1. In the Reports and Analytics work area, click Create and select Analysis. Select the OTBI Usage Real Time
subject area and click Continue.2. In the Select Columns page, expand your subject area and folders. Select User Count from the Facts - Usage
Metrics folder and click Next. Because you aren't including a dimension in the analysis this provides a total ofall users.
3. In the Select Views page, select a Table view and click Next.4. In the remaining pages, click Next to accept the defaults.5. In the Save page, enter a name for the analysis, select a catalog folder to save it in, and click Submit. The result
is a single-column table with the number of users on the system. To refine this analysis, you could add theReport Name and Report Path columns from the OTBI Report folder to the analysis to determine which reportsare in use.
Analyze Query Performance1. In the Reports and Analytics work area, click Create and select Analysis. Select the OTBI Performance Real
Time subject area and click Continue.2. In the Select Columns page, expand your subject area and folders. Select Report Name from the OTBI Report
folder and click Add.3. Add Total Execution Time from the Derived Metrics folder in the Facts - Performance Tracking folder two times.4. Add Report Row Count from the Query Execution Metrics folder. Click Next5. Add Report Count from the Usage Metrics folder. Click Next6. In the Select Views page, select a Pivot view and click Next7. In the remaining pages, click Next to accept the defaults.8. In the Save page, name the analysis Performance Histogram, select a My Folders, and click Submit.9. Click Browse Catalog and, in the catalog, navigate to My Folders and click Edit for your analysis.
10. Select the Criteria tab. Click the Options button and select Sort Ascending for the first Total Execution Timecolumn.
11. Click the Options button for the second Execution Time and select Edit Formula. In the Edit Formula dialogbox, select Custom Headings enter Total Execution Time Bin, and enter the following statement in theColumn Formula to bin by ranges of execution time, ranging from less than five seconds to greater than fiveminutes.:CASE WHEN "Derived metrics"."Total Execution Time" <= 5 THEN 'Less than 5Seconds' WHEN "Derived metrics"."Total Execution Time" BETWEEN 5 AND 30 THEN'Between 5 and 30 Seconds' WHEN "Derived metrics"."Total Execution Time"BETWEEN 30 AND 60 THEN 'Between 30 and 60 seconds' WHEN "Derived metrics"."Total Execution Time" BETWEEN 60 AND 120 THEN 'Between 60 and 120 seconds' WHEN "Derived metrics"."Total Execution Time" BETWEEN 120 AND 300 THEN 'Between 120 and 300 seconds' ELSE 'Greater than 300 seconds' END
12. In the Results tab, click Edit View for the pivot table.13. In the Layout pane of the Pivot Table editor:
◦ Move the Total Execution Time Bin column to the Rows section.
◦ Move Report Count to the Measures section.
◦ Move the rest of the columns to the Excluded section so they aren't shown in the pivot table.
Oracle CX Sales and B2B ServiceCreating and Administering Analytics
Chapter 2Best Practice and Performance
11
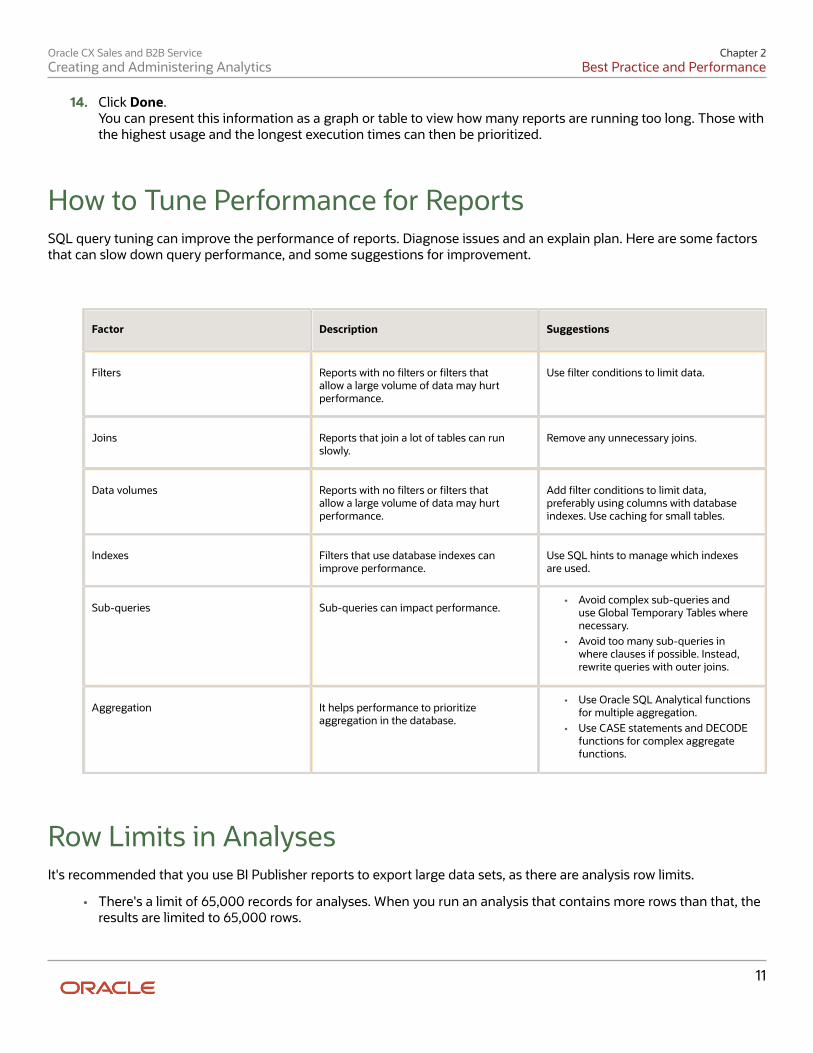
14. Click Done.You can present this information as a graph or table to view how many reports are running too long. Those withthe highest usage and the longest execution times can then be prioritized.
How to Tune Performance for ReportsSQL query tuning can improve the performance of reports. Diagnose issues and an explain plan. Here are some factorsthat can slow down query performance, and some suggestions for improvement.
Factor Description Suggestions
Filters Reports with no filters or filters thatallow a large volume of data may hurtperformance.
Use filter conditions to limit data.
Joins Reports that join a lot of tables can runslowly.
Remove any unnecessary joins.
Data volumes Reports with no filters or filters thatallow a large volume of data may hurtperformance.
Add filter conditions to limit data,preferably using columns with databaseindexes. Use caching for small tables.
Indexes Filters that use database indexes canimprove performance.
Use SQL hints to manage which indexesare used.
Sub-queries Sub-queries can impact performance.• Avoid complex sub-queries and
use Global Temporary Tables wherenecessary.
• Avoid too many sub-queries inwhere clauses if possible. Instead,rewrite queries with outer joins.
Aggregation It helps performance to prioritizeaggregation in the database.
• Use Oracle SQL Analytical functionsfor multiple aggregation.
• Use CASE statements and DECODEfunctions for complex aggregatefunctions.
Row Limits in AnalysesIt's recommended that you use BI Publisher reports to export large data sets, as there are analysis row limits.
• There's a limit of 65,000 records for analyses. When you run an analysis that contains more rows than that, theresults are limited to 65,000 rows.
Oracle CX Sales and B2B ServiceCreating and Administering Analytics
Chapter 2Best Practice and Performance
12
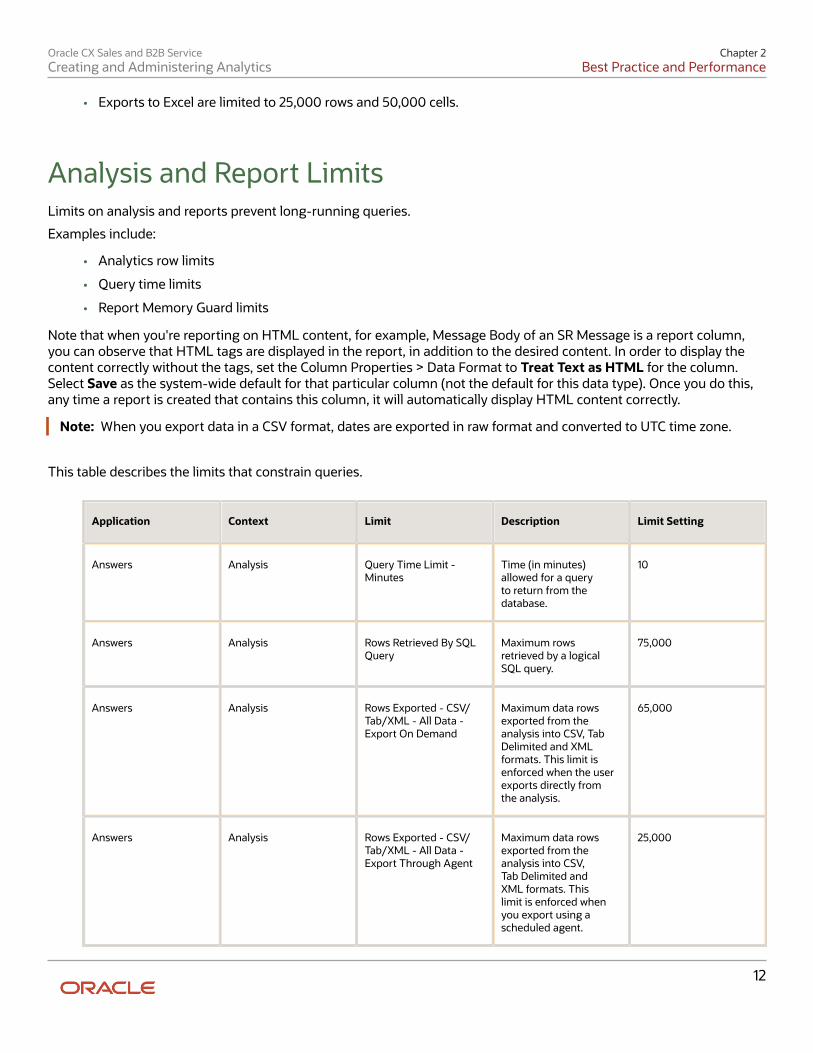
• Exports to Excel are limited to 25,000 rows and 50,000 cells.
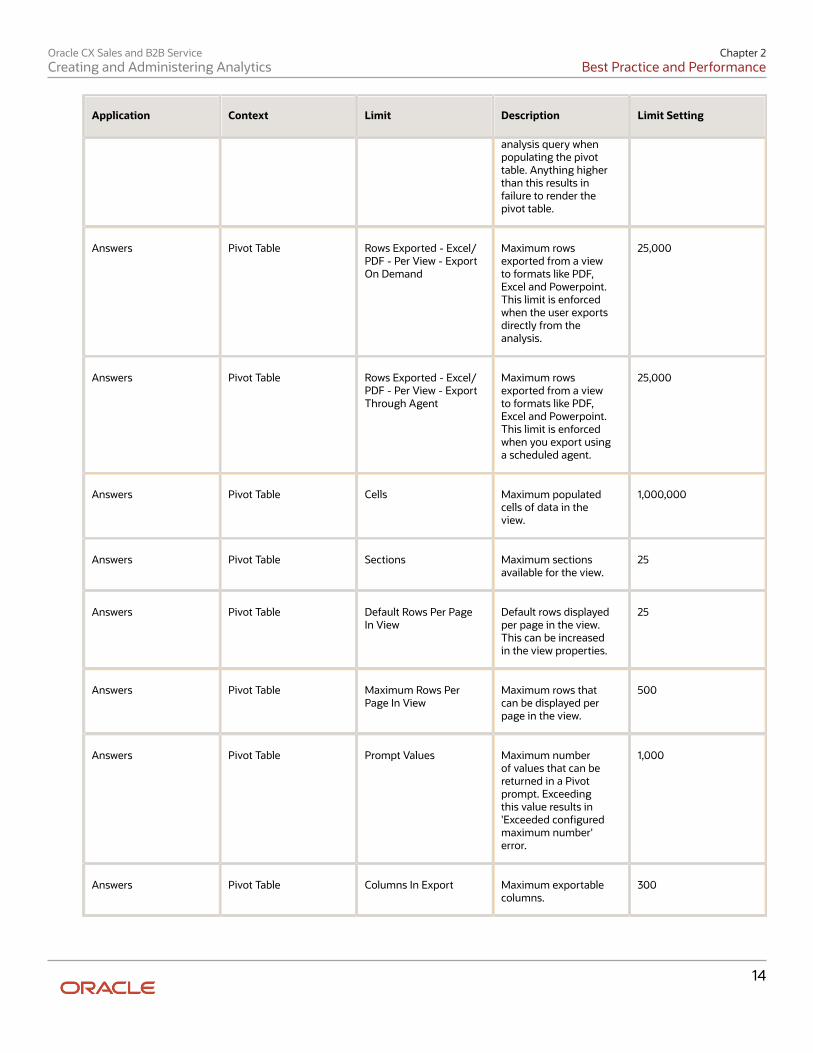
Analysis and Report LimitsLimits on analysis and reports prevent long-running queries.
Examples include:
• Analytics row limits
• Query time limits
• Report Memory Guard limits
Note that when you're reporting on HTML content, for example, Message Body of an SR Message is a report column,you can observe that HTML tags are displayed in the report, in addition to the desired content. In order to display thecontent correctly without the tags, set the Column Properties > Data Format to Treat Text as HTML for the column.Select Save as the system-wide default for that particular column (not the default for this data type). Once you do this,any time a report is created that contains this column, it will automatically display HTML content correctly.
Note: When you export data in a CSV format, dates are exported in raw format and converted to UTC time zone.
This table describes the limits that constrain queries.
Application Context Limit Description Limit Setting
Answers Analysis Query Time Limit -Minutes
Time (in minutes)allowed for a queryto return from thedatabase.
10
Answers Analysis Rows Retrieved By SQLQuery
Maximum rowsretrieved by a logicalSQL query.
75,000
Answers Analysis Rows Exported - CSV/Tab/XML - All Data -Export On Demand
Maximum data rowsexported from theanalysis into CSV, TabDelimited and XMLformats. This limit isenforced when the userexports directly fromthe analysis.
65,000
Answers Analysis Rows Exported - CSV/Tab/XML - All Data -Export Through Agent
Maximum data rowsexported from theanalysis into CSV,Tab Delimited andXML formats. Thislimit is enforced whenyou export using ascheduled agent.
25,000
Oracle CX Sales and B2B ServiceCreating and Administering Analytics
Chapter 2Best Practice and Performance
13
Application Context Limit Description Limit Setting
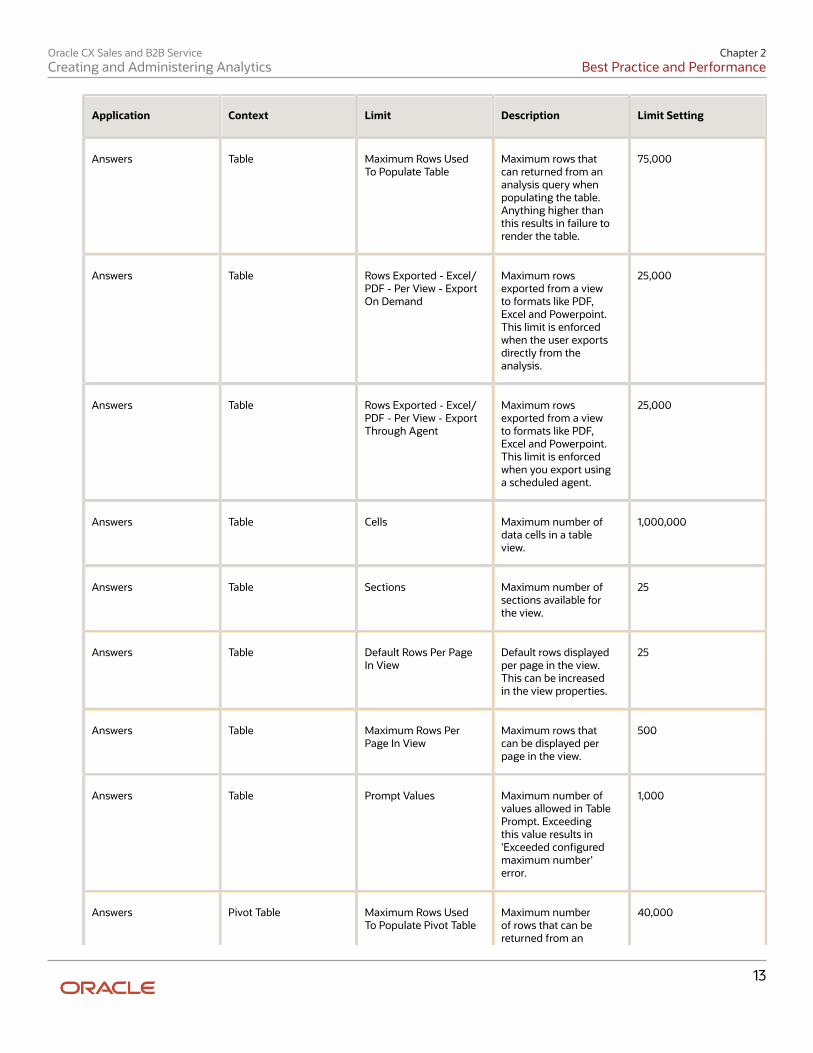
Answers Table Maximum Rows UsedTo Populate Table
Maximum rows thatcan returned from ananalysis query whenpopulating the table.Anything higher thanthis results in failure torender the table.
75,000
Answers Table Rows Exported - Excel/PDF - Per View - ExportOn Demand
Maximum rowsexported from a viewto formats like PDF,Excel and Powerpoint.This limit is enforcedwhen the user exportsdirectly from theanalysis.
25,000
Answers Table Rows Exported - Excel/PDF - Per View - ExportThrough Agent
Maximum rowsexported from a viewto formats like PDF,Excel and Powerpoint.This limit is enforcedwhen you export usinga scheduled agent.
25,000
Answers Table Cells Maximum number ofdata cells in a tableview.
1,000,000
Answers Table Sections Maximum number ofsections available forthe view.
25
Answers Table Default Rows Per PageIn View
Default rows displayedper page in the view.This can be increasedin the view properties.
25
Answers Table Maximum Rows PerPage In View
Maximum rows thatcan be displayed perpage in the view.
500
Answers Table Prompt Values Maximum number ofvalues allowed in TablePrompt. Exceedingthis value results in'Exceeded configuredmaximum number'error.
1,000
Answers Pivot Table Maximum Rows UsedTo Populate Pivot Table
Maximum numberof rows that can bereturned from an
40,000
Oracle CX Sales and B2B ServiceCreating and Administering Analytics
Chapter 2Best Practice and Performance
14
Application Context Limit Description Limit Setting
analysis query whenpopulating the pivottable. Anything higherthan this results infailure to render thepivot table.
Answers Pivot Table Rows Exported - Excel/PDF - Per View - ExportOn Demand
Maximum rowsexported from a viewto formats like PDF,Excel and Powerpoint.This limit is enforcedwhen the user exportsdirectly from theanalysis.
25,000
Answers Pivot Table Rows Exported - Excel/PDF - Per View - ExportThrough Agent
Maximum rowsexported from a viewto formats like PDF,Excel and Powerpoint.This limit is enforcedwhen you export usinga scheduled agent.
25,000
Answers Pivot Table Cells Maximum populatedcells of data in theview.
1,000,000
Answers Pivot Table Sections Maximum sectionsavailable for the view.
25
Answers Pivot Table Default Rows Per PageIn View
Default rows displayedper page in the view.This can be increasedin the view properties.
25
Answers Pivot Table Maximum Rows PerPage In View
Maximum rows thatcan be displayed perpage in the view.
500
Answers Pivot Table Prompt Values Maximum numberof values that can bereturned in a Pivotprompt. Exceedingthis value results in'Exceeded configuredmaximum number'error.
1,000
Answers Pivot Table Columns In Export Maximum exportablecolumns.
300
Oracle CX Sales and B2B ServiceCreating and Administering Analytics
Chapter 2Best Practice and Performance
15
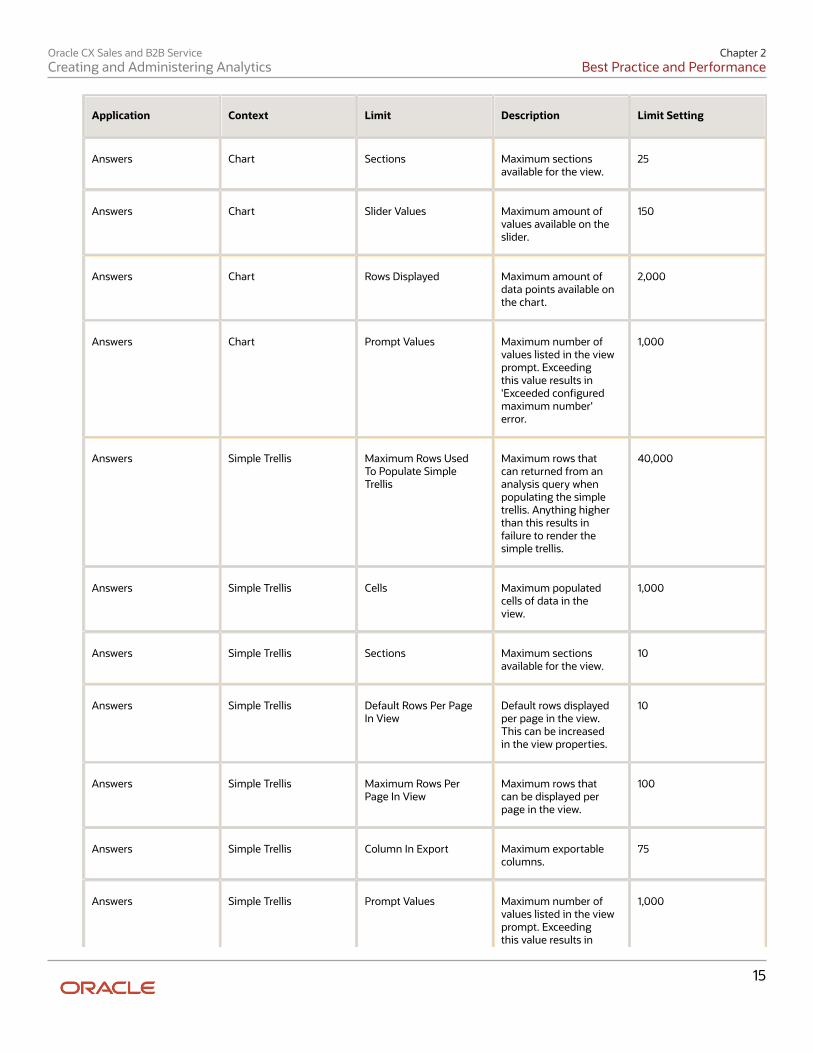
Application Context Limit Description Limit Setting
Answers Chart Sections Maximum sectionsavailable for the view.
25
Answers Chart Slider Values Maximum amount ofvalues available on theslider.
150
Answers Chart Rows Displayed Maximum amount ofdata points available onthe chart.
2,000
Answers Chart Prompt Values Maximum number ofvalues listed in the viewprompt. Exceedingthis value results in'Exceeded configuredmaximum number'error.
1,000
Answers Simple Trellis Maximum Rows UsedTo Populate SimpleTrellis
Maximum rows thatcan returned from ananalysis query whenpopulating the simpletrellis. Anything higherthan this results infailure to render thesimple trellis.
40,000
Answers Simple Trellis Cells Maximum populatedcells of data in theview.
1,000
Answers Simple Trellis Sections Maximum sectionsavailable for the view.
10
Answers Simple Trellis Default Rows Per PageIn View
Default rows displayedper page in the view.This can be increasedin the view properties.
10
Answers Simple Trellis Maximum Rows PerPage In View
Maximum rows thatcan be displayed perpage in the view.
100
Answers Simple Trellis Column In Export Maximum exportablecolumns.
75
Answers Simple Trellis Prompt Values Maximum number ofvalues listed in the viewprompt. Exceedingthis value results in
1,000
Oracle CX Sales and B2B ServiceCreating and Administering Analytics
Chapter 2Best Practice and Performance
16
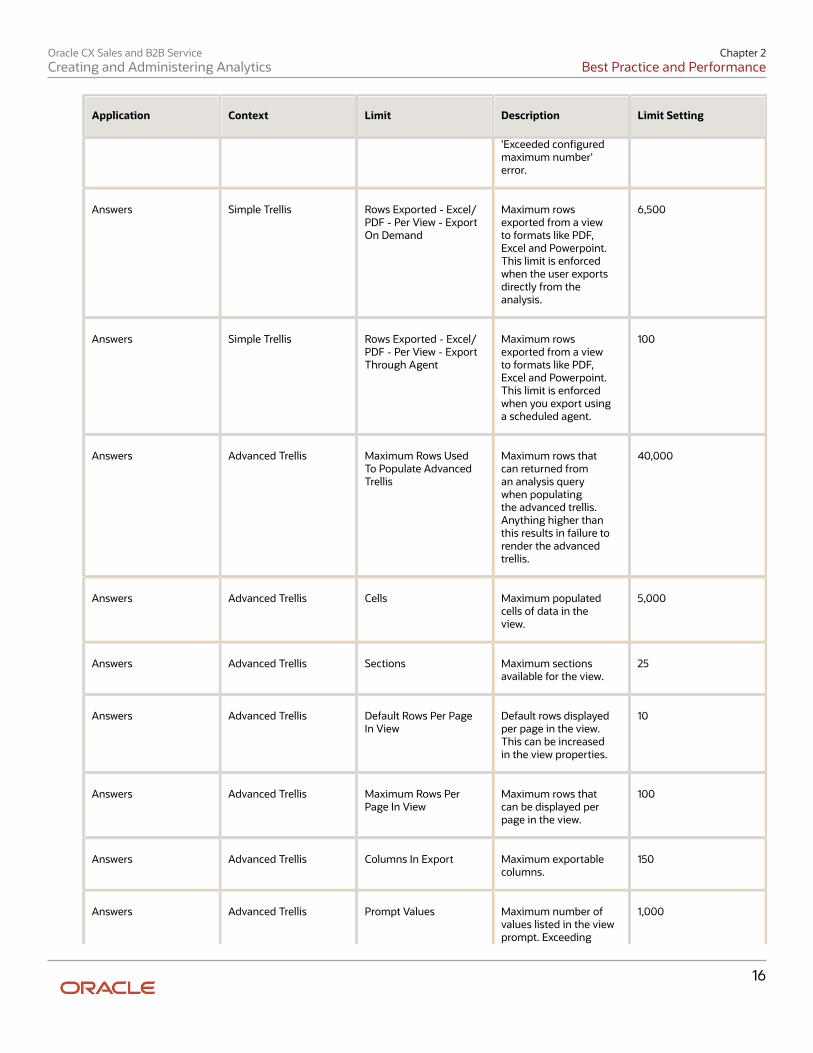
Application Context Limit Description Limit Setting
'Exceeded configuredmaximum number'error.
Answers Simple Trellis Rows Exported - Excel/PDF - Per View - ExportOn Demand
Maximum rowsexported from a viewto formats like PDF,Excel and Powerpoint.This limit is enforcedwhen the user exportsdirectly from theanalysis.
6,500
Answers Simple Trellis Rows Exported - Excel/PDF - Per View - ExportThrough Agent
Maximum rowsexported from a viewto formats like PDF,Excel and Powerpoint.This limit is enforcedwhen you export usinga scheduled agent.
100
Answers Advanced Trellis Maximum Rows UsedTo Populate AdvancedTrellis
Maximum rows thatcan returned froman analysis querywhen populatingthe advanced trellis.Anything higher thanthis results in failure torender the advancedtrellis.
40,000
Answers Advanced Trellis Cells Maximum populatedcells of data in theview.
5,000
Answers Advanced Trellis Sections Maximum sectionsavailable for the view.
25
Answers Advanced Trellis Default Rows Per PageIn View
Default rows displayedper page in the view.This can be increasedin the view properties.
10
Answers Advanced Trellis Maximum Rows PerPage In View
Maximum rows thatcan be displayed perpage in the view.
100
Answers Advanced Trellis Columns In Export Maximum exportablecolumns.
150
Answers Advanced Trellis Prompt Values Maximum number ofvalues listed in the viewprompt. Exceeding
1,000
Oracle CX Sales and B2B ServiceCreating and Administering Analytics
Chapter 2Best Practice and Performance
17
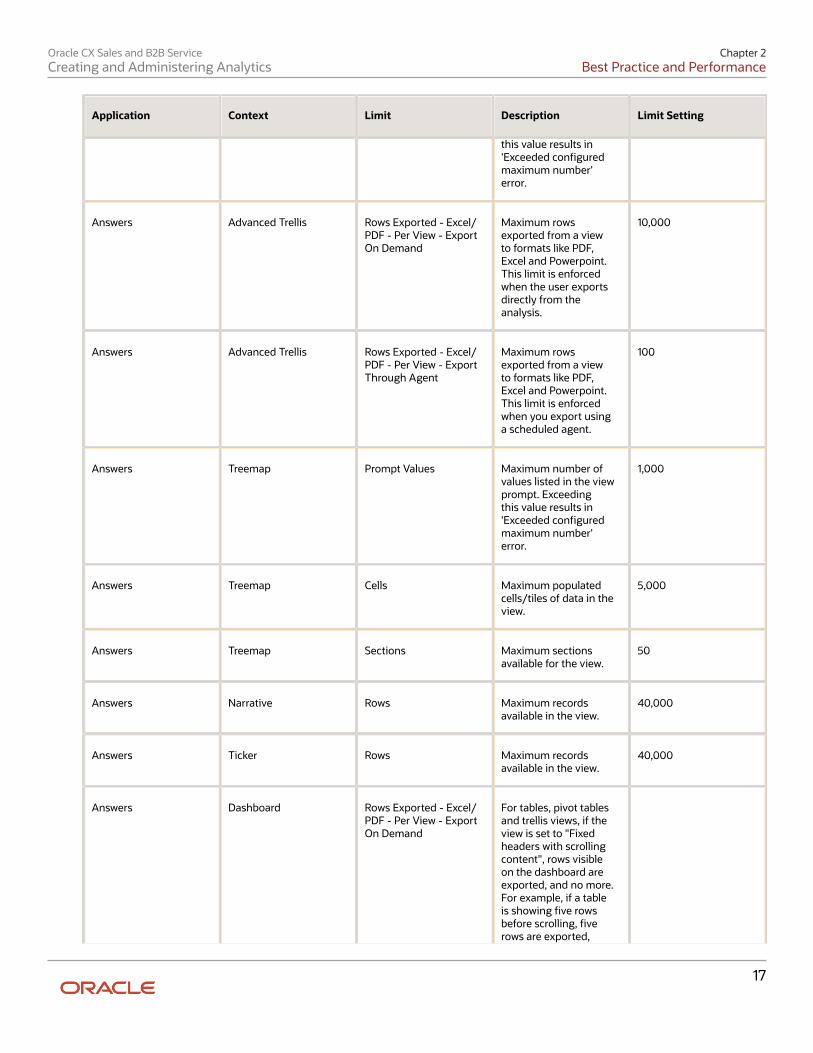
Application Context Limit Description Limit Setting
this value results in'Exceeded configuredmaximum number'error.
Answers Advanced Trellis Rows Exported - Excel/PDF - Per View - ExportOn Demand
Maximum rowsexported from a viewto formats like PDF,Excel and Powerpoint.This limit is enforcedwhen the user exportsdirectly from theanalysis.
10,000
Answers Advanced Trellis Rows Exported - Excel/PDF - Per View - ExportThrough Agent
Maximum rowsexported from a viewto formats like PDF,Excel and Powerpoint.This limit is enforcedwhen you export usinga scheduled agent.
100
Answers Treemap Prompt Values Maximum number ofvalues listed in the viewprompt. Exceedingthis value results in'Exceeded configuredmaximum number'error.
1,000
Answers Treemap Cells Maximum populatedcells/tiles of data in theview.
5,000
Answers Treemap Sections Maximum sectionsavailable for the view.
50
Answers Narrative Rows Maximum recordsavailable in the view.
40,000
Answers Ticker Rows Maximum recordsavailable in the view.
40,000
Answers Dashboard Rows Exported - Excel/PDF - Per View - ExportOn Demand
For tables, pivot tablesand trellis views, if theview is set to "Fixedheaders with scrollingcontent", rows visibleon the dashboard areexported, and no more.For example, if a tableis showing five rowsbefore scrolling, fiverows are exported,
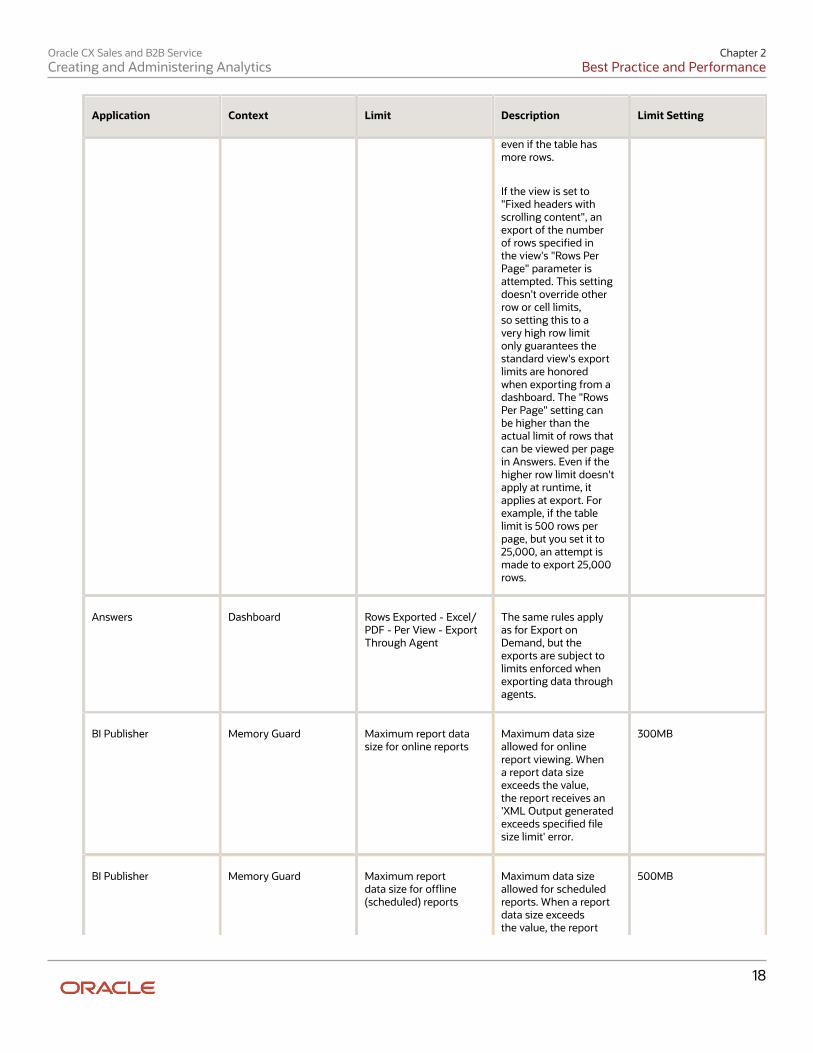
Oracle CX Sales and B2B ServiceCreating and Administering Analytics
Chapter 2Best Practice and Performance
18
Application Context Limit Description Limit Setting
even if the table hasmore rows.
If the view is set to"Fixed headers withscrolling content", anexport of the numberof rows specified inthe view's "Rows PerPage" parameter isattempted. This settingdoesn't override otherrow or cell limits,so setting this to avery high row limitonly guarantees thestandard view's exportlimits are honoredwhen exporting from adashboard. The "RowsPer Page" setting canbe higher than theactual limit of rows thatcan be viewed per pagein Answers. Even if thehigher row limit doesn'tapply at runtime, itapplies at export. Forexample, if the tablelimit is 500 rows perpage, but you set it to25,000, an attempt ismade to export 25,000rows.
Answers Dashboard Rows Exported - Excel/PDF - Per View - ExportThrough Agent
The same rules applyas for Export onDemand, but theexports are subject tolimits enforced whenexporting data throughagents.
BI Publisher Memory Guard Maximum report datasize for online reports
Maximum data sizeallowed for onlinereport viewing. Whena report data sizeexceeds the value,the report receives an'XML Output generatedexceeds specified filesize limit' error.
300MB
BI Publisher Memory Guard Maximum reportdata size for offline(scheduled) reports
Maximum data sizeallowed for scheduledreports. When a reportdata size exceedsthe value, the report
500MB
Oracle CX Sales and B2B ServiceCreating and Administering Analytics
Chapter 2Best Practice and Performance
19
Application Context Limit Description Limit Setting
receives an XMLOutput generatedexceeds specified filesize limit error.
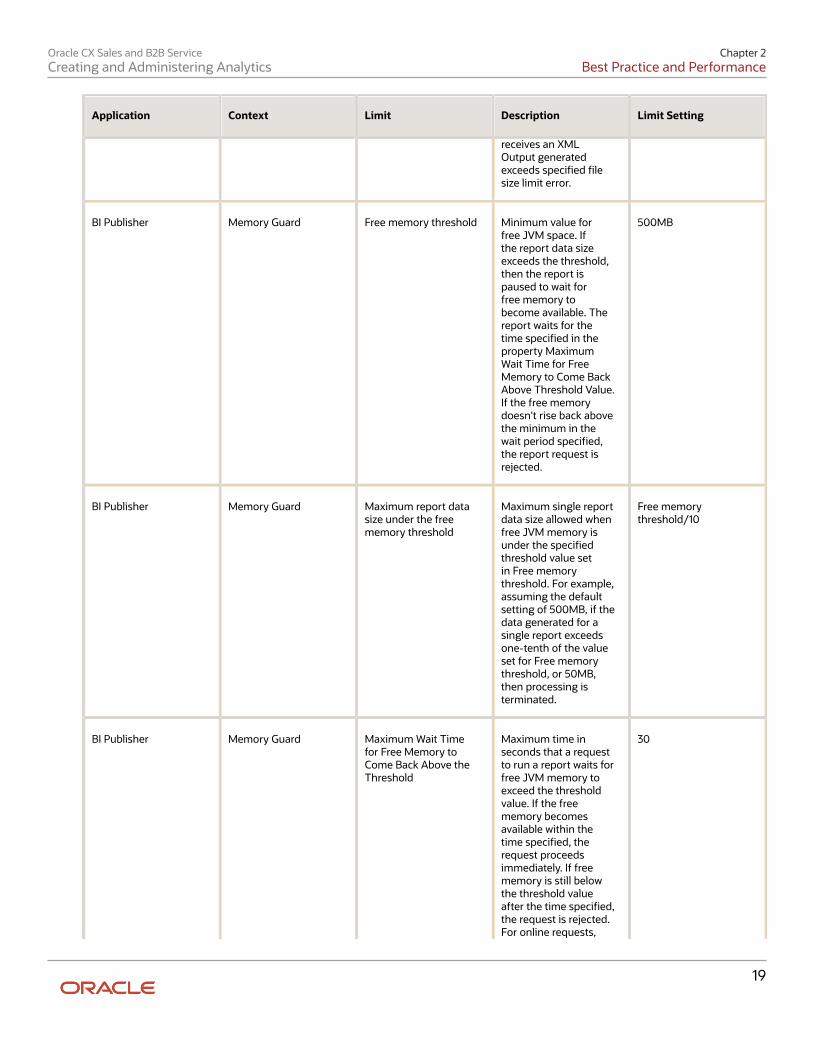
BI Publisher Memory Guard Free memory threshold Minimum value forfree JVM space. Ifthe report data sizeexceeds the threshold,then the report ispaused to wait forfree memory tobecome available. Thereport waits for thetime specified in theproperty MaximumWait Time for FreeMemory to Come BackAbove Threshold Value.If the free memorydoesn't rise back abovethe minimum in thewait period specified,the report request isrejected.
500MB
BI Publisher Memory Guard Maximum report datasize under the freememory threshold
Maximum single reportdata size allowed whenfree JVM memory isunder the specifiedthreshold value setin Free memorythreshold. For example,assuming the defaultsetting of 500MB, if thedata generated for asingle report exceedsone-tenth of the valueset for Free memorythreshold, or 50MB,then processing isterminated.
Free memorythreshold/10
BI Publisher Memory Guard Maximum Wait Timefor Free Memory toCome Back Above theThreshold
Maximum time inseconds that a requestto run a report waits forfree JVM memory toexceed the thresholdvalue. If the freememory becomesavailable within thetime specified, therequest proceedsimmediately. If freememory is still belowthe threshold valueafter the time specified,the request is rejected.For online requests,
30
Oracle CX Sales and B2B ServiceCreating and Administering Analytics
Chapter 2Best Practice and Performance
20
Application Context Limit Description Limit Setting
the larger this propertyvalue, the longer thebrowser will wait for arequest to run.
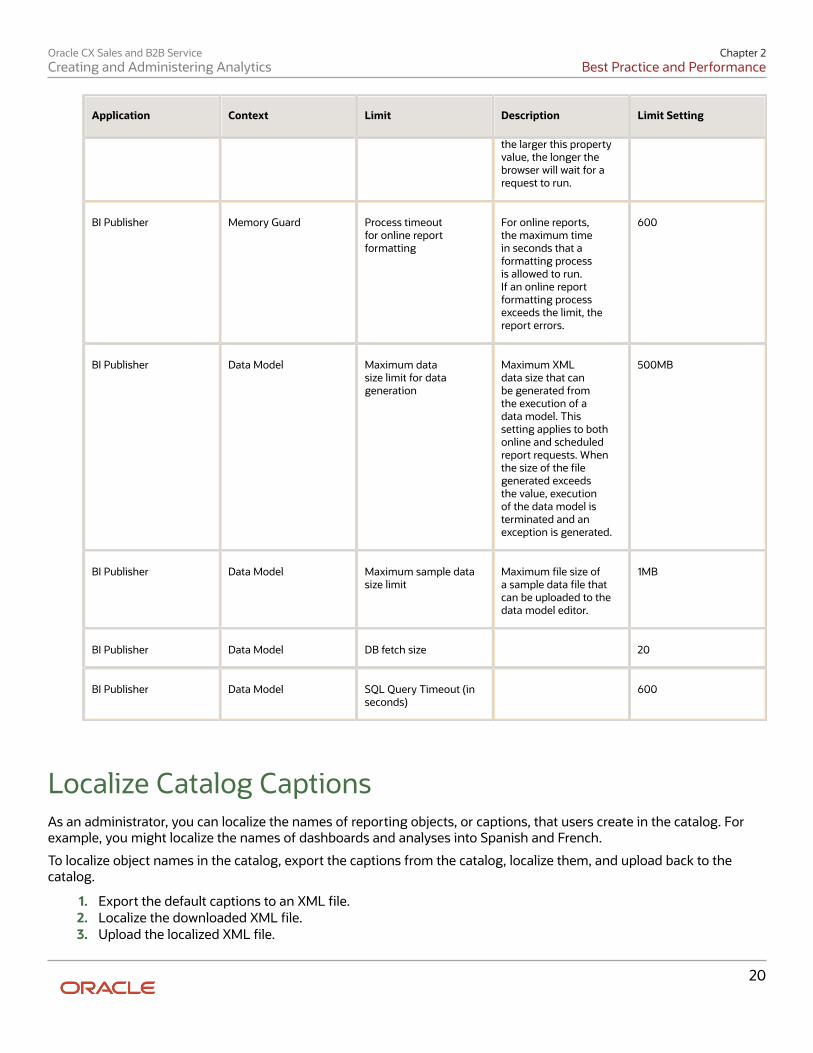
BI Publisher Memory Guard Process timeoutfor online reportformatting
For online reports,the maximum timein seconds that aformatting processis allowed to run.If an online reportformatting processexceeds the limit, thereport errors.
600
BI Publisher Data Model Maximum datasize limit for datageneration
Maximum XMLdata size that canbe generated fromthe execution of adata model. Thissetting applies to bothonline and scheduledreport requests. Whenthe size of the filegenerated exceedsthe value, executionof the data model isterminated and anexception is generated.
500MB
BI Publisher Data Model Maximum sample datasize limit
Maximum file size ofa sample data file thatcan be uploaded to thedata model editor.
1MB
BI Publisher Data Model DB fetch size 20
BI Publisher Data Model SQL Query Timeout (inseconds)
600
Localize Catalog CaptionsAs an administrator, you can localize the names of reporting objects, or captions, that users create in the catalog. Forexample, you might localize the names of dashboards and analyses into Spanish and French.
To localize object names in the catalog, export the captions from the catalog, localize them, and upload back to thecatalog.
1. Export the default captions to an XML file.2. Localize the downloaded XML file.3. Upload the localized XML file.
Oracle CX Sales and B2B ServiceCreating and Administering Analytics
Chapter 2Best Practice and Performance
21
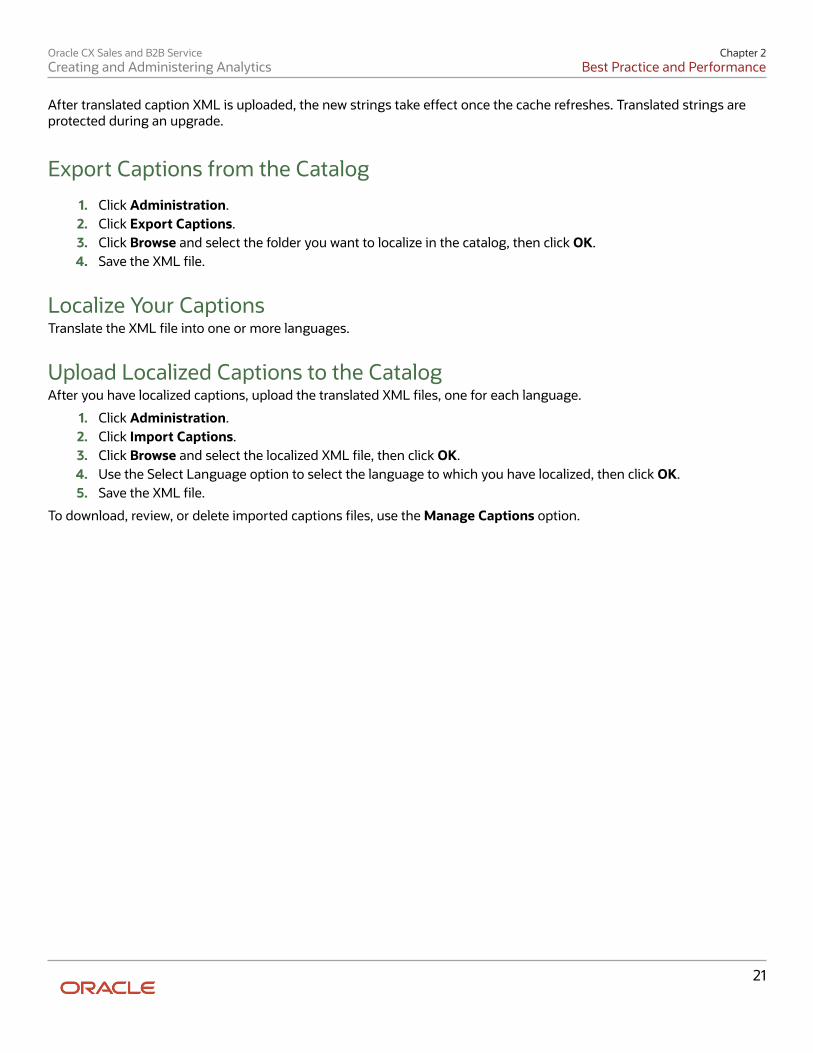
After translated caption XML is uploaded, the new strings take effect once the cache refreshes. Translated strings areprotected during an upgrade.
Export Captions from the Catalog
1. Click Administration.2. Click Export Captions.3. Click Browse and select the folder you want to localize in the catalog, then click OK.4. Save the XML file.
Localize Your CaptionsTranslate the XML file into one or more languages.
Upload Localized Captions to the CatalogAfter you have localized captions, upload the translated XML files, one for each language.
1. Click Administration.2. Click Import Captions.3. Click Browse and select the localized XML file, then click OK.4. Use the Select Language option to select the language to which you have localized, then click OK.5. Save the XML file.
To download, review, or delete imported captions files, use the Manage Captions option.
Oracle CX Sales and B2B ServiceCreating and Administering Analytics
Chapter 2Best Practice and Performance
22
Oracle CX Sales and B2B ServiceCreating and Administering Analytics
Chapter 3Analytics Access, Currency, and Display
23
3 Analytics Access, Currency, and Display
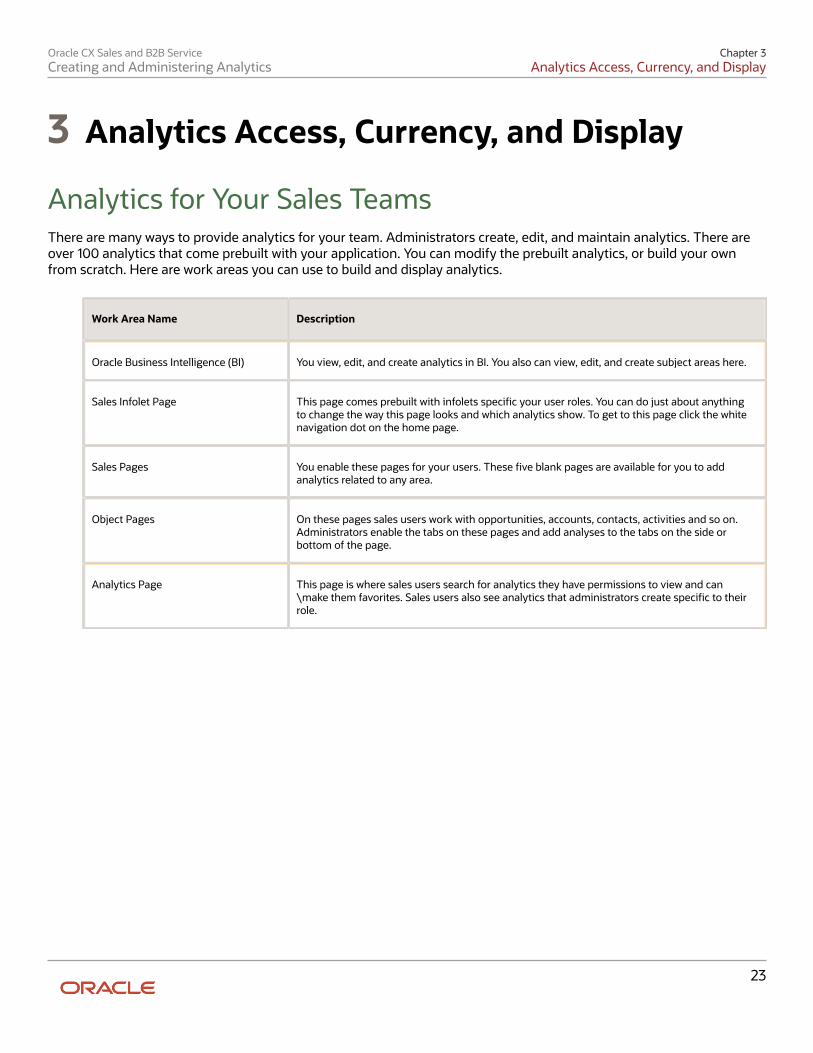
Analytics for Your Sales TeamsThere are many ways to provide analytics for your team. Administrators create, edit, and maintain analytics. There areover 100 analytics that come prebuilt with your application. You can modify the prebuilt analytics, or build your ownfrom scratch. Here are work areas you can use to build and display analytics.
Work Area Name Description
Oracle Business Intelligence (BI) You view, edit, and create analytics in BI. You also can view, edit, and create subject areas here.
Sales Infolet Page This page comes prebuilt with infolets specific your user roles. You can do just about anythingto change the way this page looks and which analytics show. To get to this page click the whitenavigation dot on the home page.
Sales Pages You enable these pages for your users. These five blank pages are available for you to addanalytics related to any area.
Object Pages On these pages sales users work with opportunities, accounts, contacts, activities and so on.Administrators enable the tabs on these pages and add analyses to the tabs on the side orbottom of the page.
Analytics Page This page is where sales users search for analytics they have permissions to view and can\make them favorites. Sales users also see analytics that administrators create specific to theirrole.
Oracle CX Sales and B2B ServiceCreating and Administering Analytics
Chapter 3Analytics Access, Currency, and Display
24
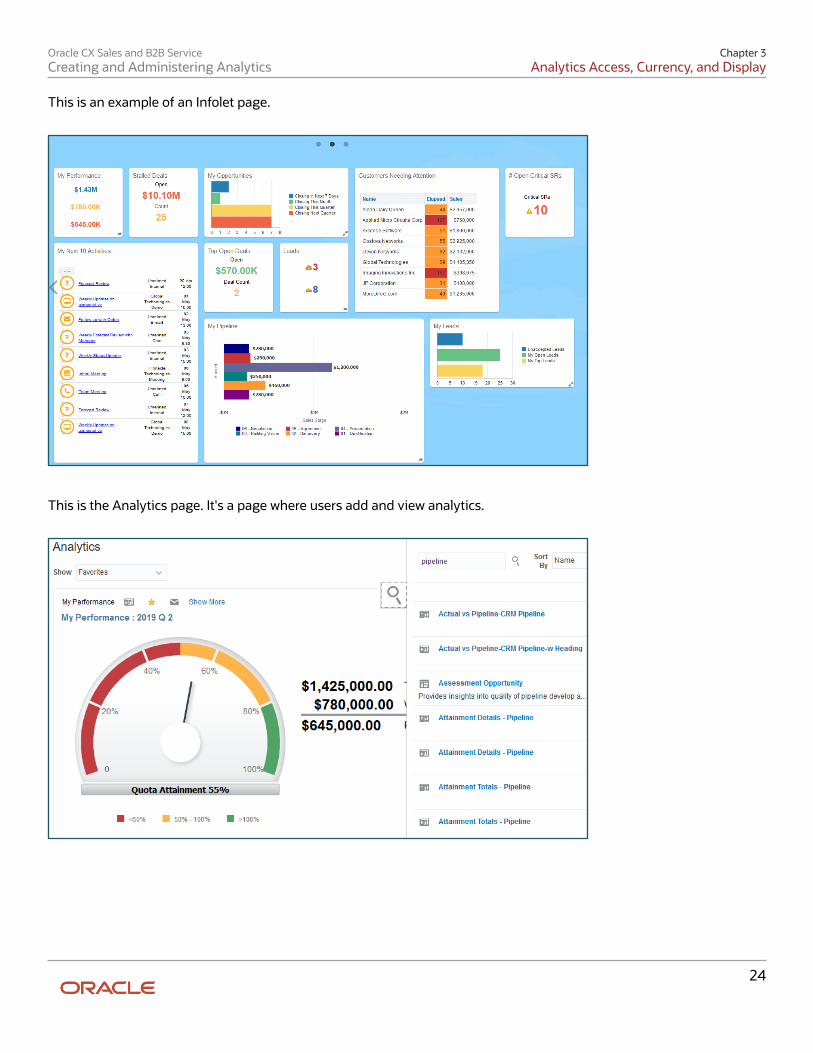
This is an example of an Infolet page.
This is the Analytics page. It's a page where users add and view analytics.
Oracle CX Sales and B2B ServiceCreating and Administering Analytics
Chapter 3Analytics Access, Currency, and Display
25
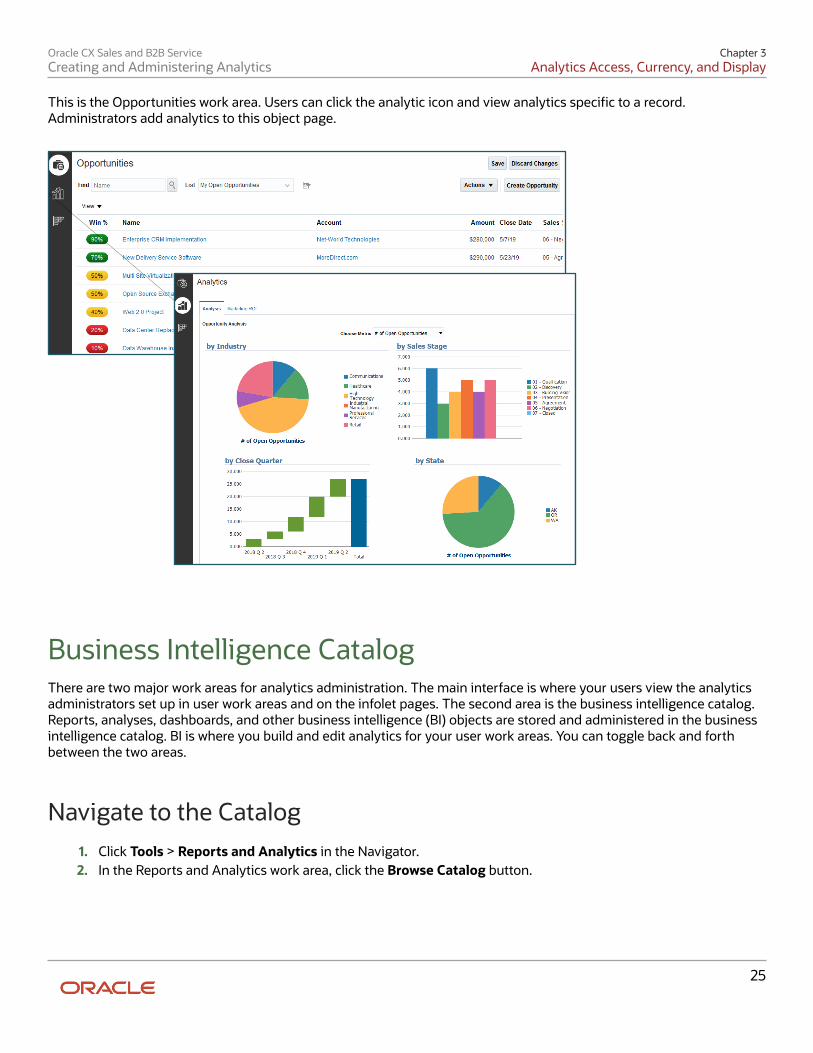
This is the Opportunities work area. Users can click the analytic icon and view analytics specific to a record.Administrators add analytics to this object page.
Business Intelligence CatalogThere are two major work areas for analytics administration. The main interface is where your users view the analyticsadministrators set up in user work areas and on the infolet pages. The second area is the business intelligence catalog.Reports, analyses, dashboards, and other business intelligence (BI) objects are stored and administered in the businessintelligence catalog. BI is where you build and edit analytics for your user work areas. You can toggle back and forthbetween the two areas.
Navigate to the Catalog1. Click Tools > Reports and Analytics in the Navigator.2. In the Reports and Analytics work area, click the Browse Catalog button.
Oracle CX Sales and B2B ServiceCreating and Administering Analytics
Chapter 3Analytics Access, Currency, and Display
26
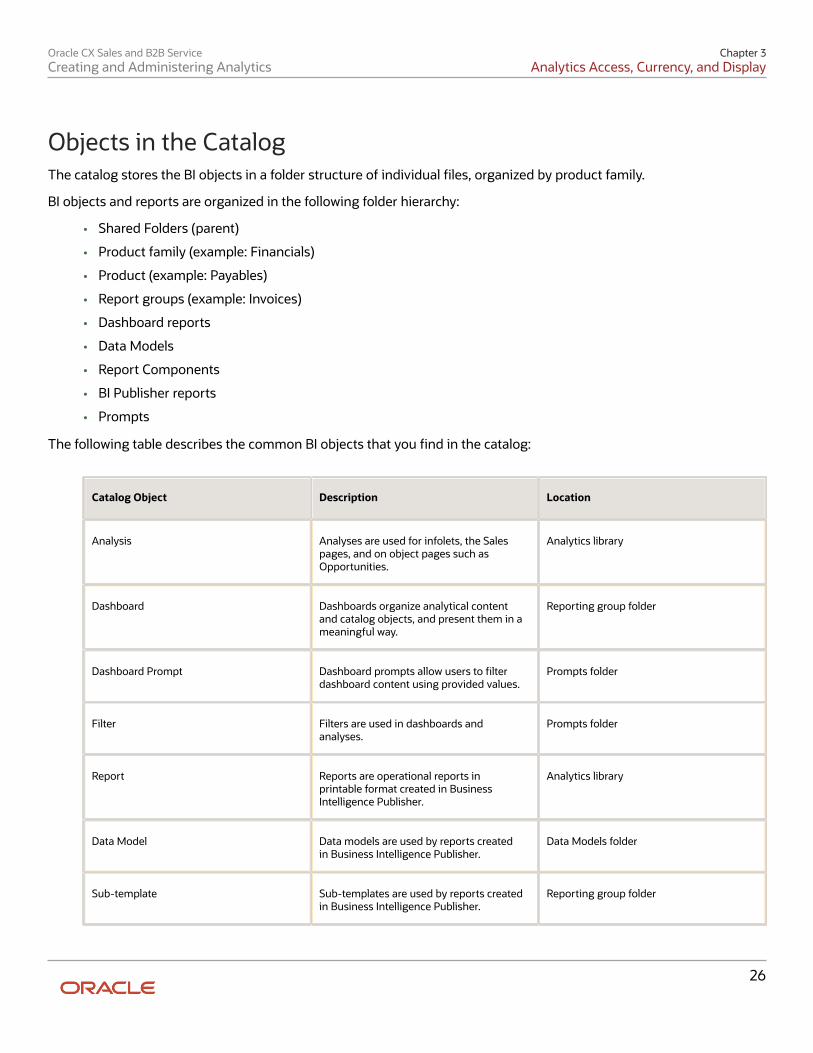
Objects in the CatalogThe catalog stores the BI objects in a folder structure of individual files, organized by product family.
BI objects and reports are organized in the following folder hierarchy:
• Shared Folders (parent)
• Product family (example: Financials)
• Product (example: Payables)
• Report groups (example: Invoices)
• Dashboard reports
• Data Models
• Report Components
• BI Publisher reports
• Prompts
The following table describes the common BI objects that you find in the catalog:
Catalog Object Description Location
Analysis Analyses are used for infolets, the Salespages, and on object pages such asOpportunities.
Analytics library
Dashboard Dashboards organize analytical contentand catalog objects, and present them in ameaningful way.
Reporting group folder
Dashboard Prompt Dashboard prompts allow users to filterdashboard content using provided values.
Prompts folder
Filter Filters are used in dashboards andanalyses.
Prompts folder
Report Reports are operational reports inprintable format created in BusinessIntelligence Publisher.
Analytics library
Data Model Data models are used by reports createdin Business Intelligence Publisher.
Data Models folder
Sub-template Sub-templates are used by reports createdin Business Intelligence Publisher.
Reporting group folder
Oracle CX Sales and B2B ServiceCreating and Administering Analytics
Chapter 3Analytics Access, Currency, and Display
27
Analytics Security and PermissionsSome analytics might contain information specific to job roles that you don't want everyone to see. An example mightbe analytics with salary information. Access to data in subject areas, which in turn are used to build analytics arecontrolled by permissions. Permissions are authorizations that determine who can see what. Permissions are a part ofthe security model, and how permissions are initially assigned is based on how users, roles, and groups were initially setup on your application.
The setup administrator has likely assigned you the role of Sales Administrator, or the Sales Administrator might havecreated a sub-role specifically for administering analytics, such as BI Administrator. As the person responsible foradministering analytics, your permissions enable you to access and edit all of the analytics and analytic work areas.You have access to the BI catalogs, dashboards, and tools to create, edit, and add analytics to your team work areas. Formore information, see Security Reference for Sales and Service.
Related Topics
• Expanded detail on security and reporting
• BI Administrator permissions
BI Administrator PermissionsIf you're a Sales Administrator you have lots of permissions already. But you likely want to perform high-level tasks inBI as well. To get these extra permissions you need the BI Administrator role. BI Administrators have access to theseadditional things:
• Catalog groups
• Privileges
• Sessions
• Publisher scheduling and delivery
Assign the BI Administrator Role
1. Sign in as a Security Manager. For example, IT_SECURITY_MANAGER.2. Click Tools > Security Console.3. Select the Roles.4. Click Create Role.5. Fill in the required information.
Oracle CX Sales and B2B ServiceCreating and Administering Analytics
Chapter 3Analytics Access, Currency, and Display
28
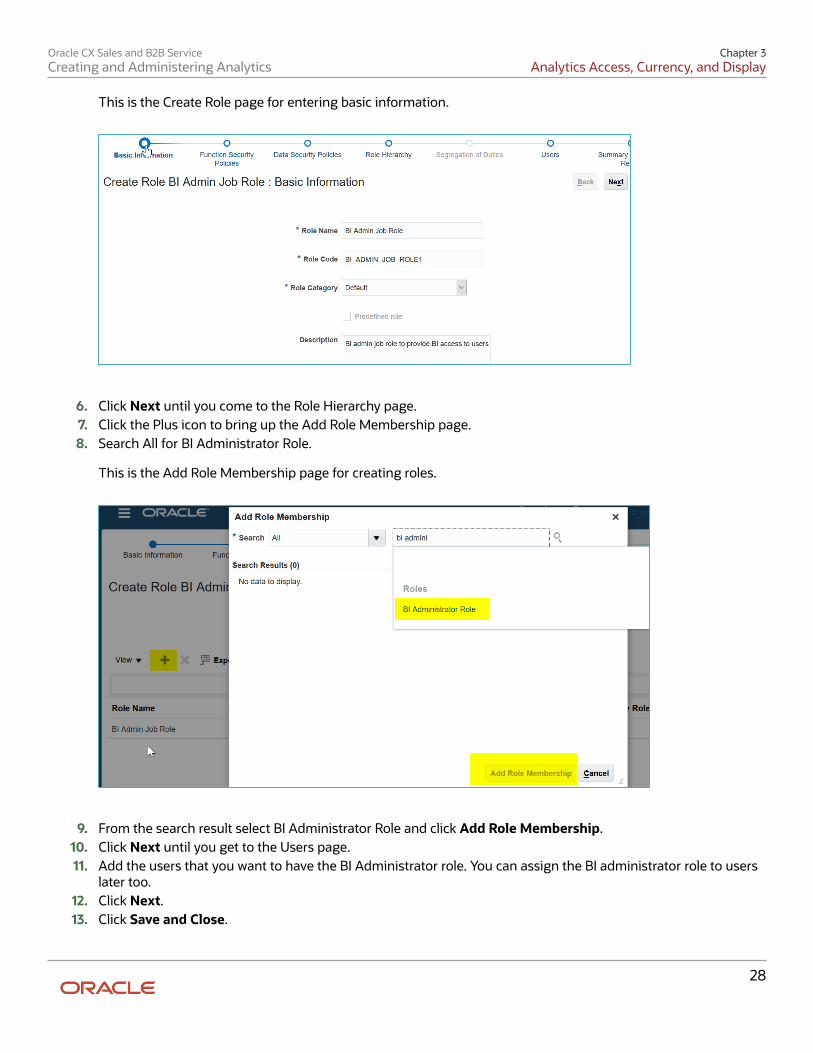
This is the Create Role page for entering basic information.
6. Click Next until you come to the Role Hierarchy page.7. Click the Plus icon to bring up the Add Role Membership page.8. Search All for BI Administrator Role.
This is the Add Role Membership page for creating roles.
9. From the search result select BI Administrator Role and click Add Role Membership.10. Click Next until you get to the Users page.11. Add the users that you want to have the BI Administrator role. You can assign the BI administrator role to users
later too.12. Click Next.13. Click Save and Close.
Oracle CX Sales and B2B ServiceCreating and Administering Analytics
Chapter 3Analytics Access, Currency, and Display
29
Assign Additional UsersAfter the BI Administrator role is created you can assign additional users to the same role.
1. Sign in as a Security Manager. For example, IT_SECURITY_MANAGER.2. Click Tools > Security Console3. Select the Users tab.4. Search for the user to be assigned the BI Administrator role.5. Select the user and choose Edit.6. Click Add Role.7. Search for the BI Administrator role you created in the steps for Assigning the BI Administrator Role.8. Click Done.9. Click Save and Close.
Optimize Analytics Display
Why Use Responsive Sizing?Responsive sizing ensures that analytics are displayed on your laptop, mobile, or tablet browser in the best possibleway. By default you can configure analytics to fit any format, but that doesn't make them responsive to your browserresolution.
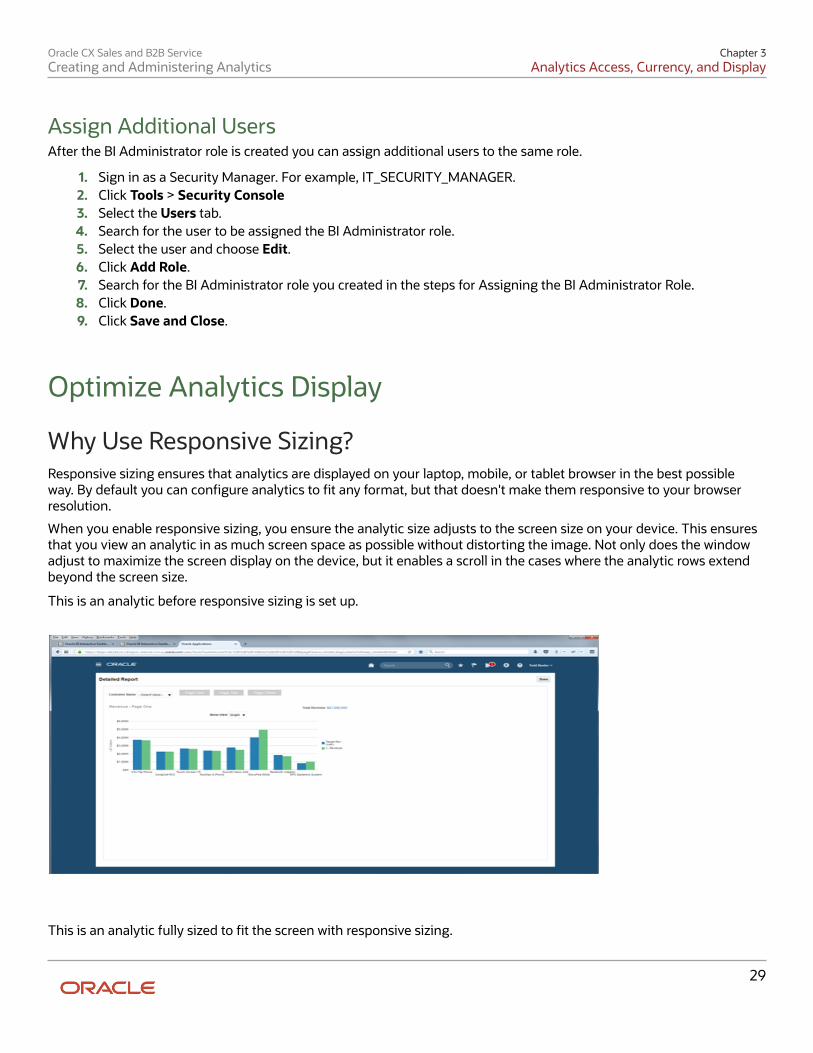
When you enable responsive sizing, you ensure the analytic size adjusts to the screen size on your device. This ensuresthat you view an analytic in as much screen space as possible without distorting the image. Not only does the windowadjust to maximize the screen display on the device, but it enables a scroll in the cases where the analytic rows extendbeyond the screen size.
This is an analytic before responsive sizing is set up.
This is an analytic fully sized to fit the screen with responsive sizing.
Oracle CX Sales and B2B ServiceCreating and Administering Analytics
Chapter 3Analytics Access, Currency, and Display
30
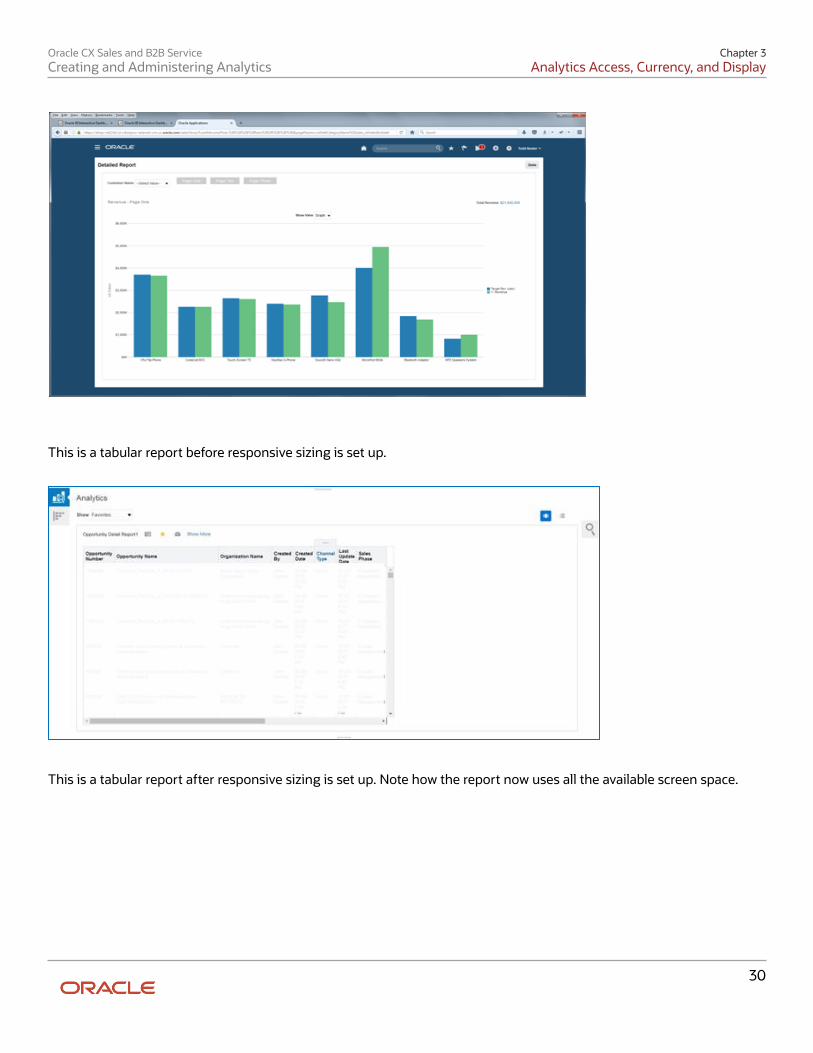
This is a tabular report before responsive sizing is set up.
This is a tabular report after responsive sizing is set up. Note how the report now uses all the available screen space.
Oracle CX Sales and B2B ServiceCreating and Administering Analytics
Chapter 3Analytics Access, Currency, and Display
31
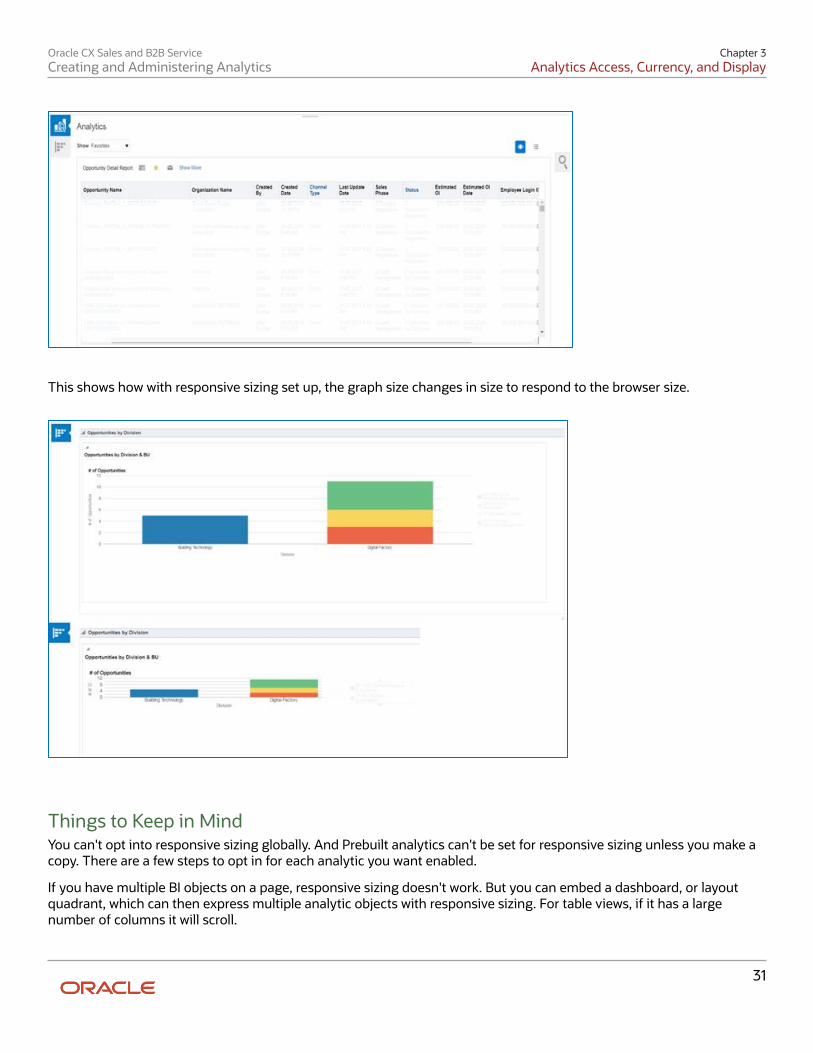
This shows how with responsive sizing set up, the graph size changes in size to respond to the browser size.
Things to Keep in MindYou can't opt into responsive sizing globally. And Prebuilt analytics can't be set for responsive sizing unless you make acopy. There are a few steps to opt in for each analytic you want enabled.
If you have multiple BI objects on a page, responsive sizing doesn't work. But you can embed a dashboard, or layoutquadrant, which can then express multiple analytic objects with responsive sizing. For table views, if it has a largenumber of columns it will scroll.
Oracle CX Sales and B2B ServiceCreating and Administering Analytics
Chapter 3Analytics Access, Currency, and Display
32
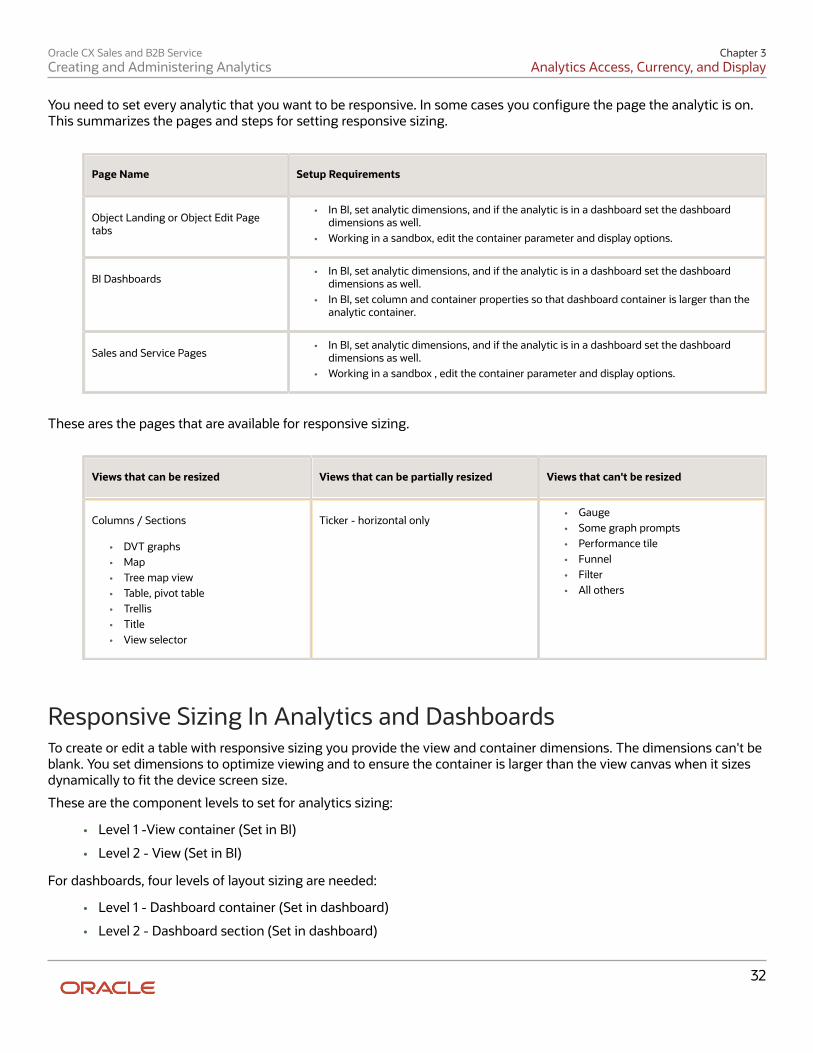
You need to set every analytic that you want to be responsive. In some cases you configure the page the analytic is on.This summarizes the pages and steps for setting responsive sizing.
Page Name Setup Requirements
Object Landing or Object Edit Pagetabs
• In BI, set analytic dimensions, and if the analytic is in a dashboard set the dashboarddimensions as well.
• Working in a sandbox, edit the container parameter and display options.
BI Dashboards• In BI, set analytic dimensions, and if the analytic is in a dashboard set the dashboard
dimensions as well.• In BI, set column and container properties so that dashboard container is larger than the
analytic container.
Sales and Service Pages• In BI, set analytic dimensions, and if the analytic is in a dashboard set the dashboard
dimensions as well.• Working in a sandbox , edit the container parameter and display options.
These ares the pages that are available for responsive sizing.
Views that can be resized Views that can be partially resized Views that can't be resized
Columns / Sections
• DVT graphs• Map• Tree map view• Table, pivot table• Trellis• Title• View selector
Ticker - horizontal only• Gauge• Some graph prompts• Performance tile• Funnel• Filter• All others
Responsive Sizing In Analytics and DashboardsTo create or edit a table with responsive sizing you provide the view and container dimensions. The dimensions can't beblank. You set dimensions to optimize viewing and to ensure the container is larger than the view canvas when it sizesdynamically to fit the device screen size.
These are the component levels to set for analytics sizing:
• Level 1 -View container (Set in BI)
• Level 2 - View (Set in BI)
For dashboards, four levels of layout sizing are needed:
• Level 1 - Dashboard container (Set in dashboard)
• Level 2 - Dashboard section (Set in dashboard)
Oracle CX Sales and B2B ServiceCreating and Administering Analytics
Chapter 3Analytics Access, Currency, and Display
33
• Level 3 - View container (Set in BI)
• Level 4 - View (Set in BI)
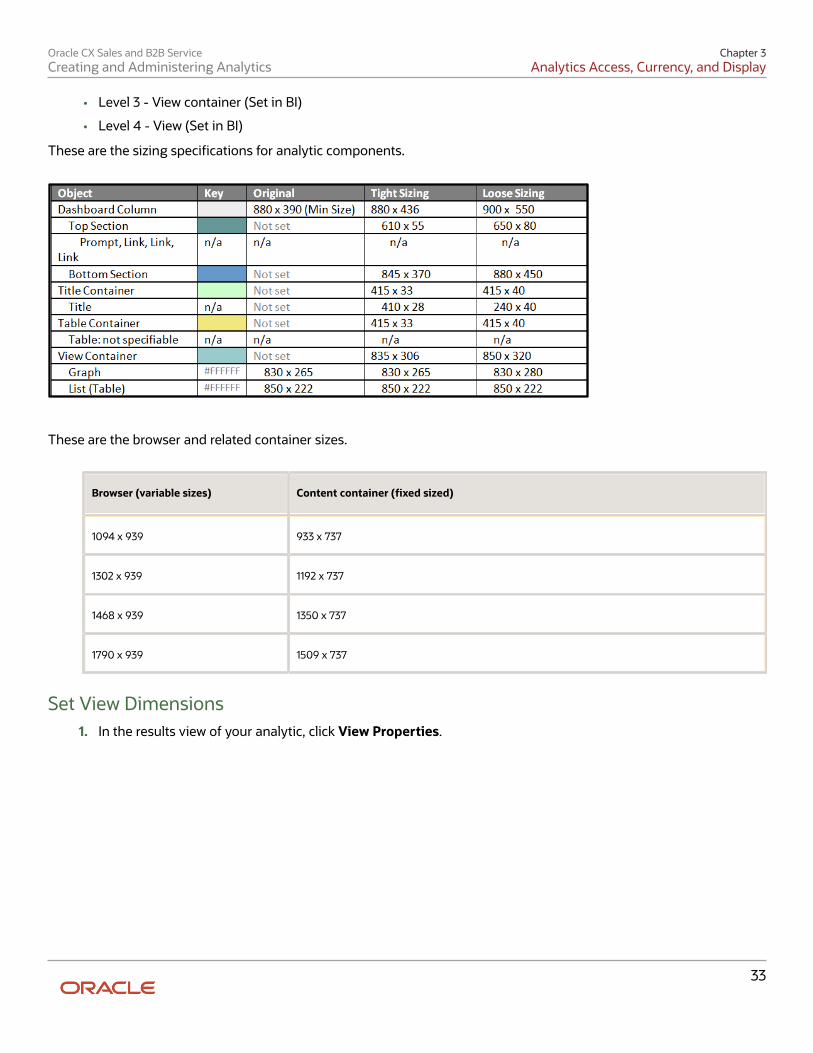
These are the sizing specifications for analytic components.
These are the browser and related container sizes.
Browser (variable sizes) Content container (fixed sized)
1094 x 939 933 x 737
1302 x 939 1192 x 737
1468 x 939 1350 x 737
1790 x 939 1509 x 737
Set View Dimensions1. In the results view of your analytic, click View Properties.
Oracle CX Sales and B2B ServiceCreating and Administering Analytics
Chapter 3Analytics Access, Currency, and Display
34
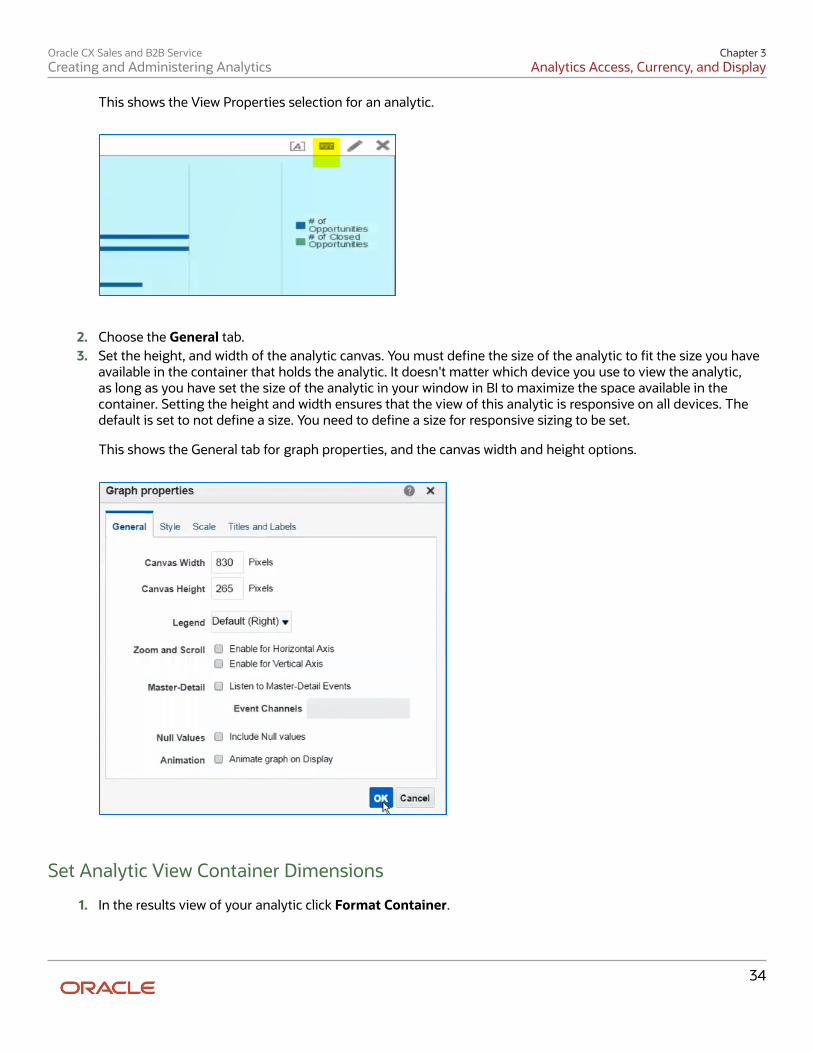
This shows the View Properties selection for an analytic.
2. Choose the General tab.3. Set the height, and width of the analytic canvas. You must define the size of the analytic to fit the size you have
available in the container that holds the analytic. It doesn't matter which device you use to view the analytic,as long as you have set the size of the analytic in your window in BI to maximize the space available in thecontainer. Setting the height and width ensures that the view of this analytic is responsive on all devices. Thedefault is set to not define a size. You need to define a size for responsive sizing to be set.
This shows the General tab for graph properties, and the canvas width and height options.
Set Analytic View Container Dimensions
1. In the results view of your analytic click Format Container.
Oracle CX Sales and B2B ServiceCreating and Administering Analytics
Chapter 3Analytics Access, Currency, and Display
35
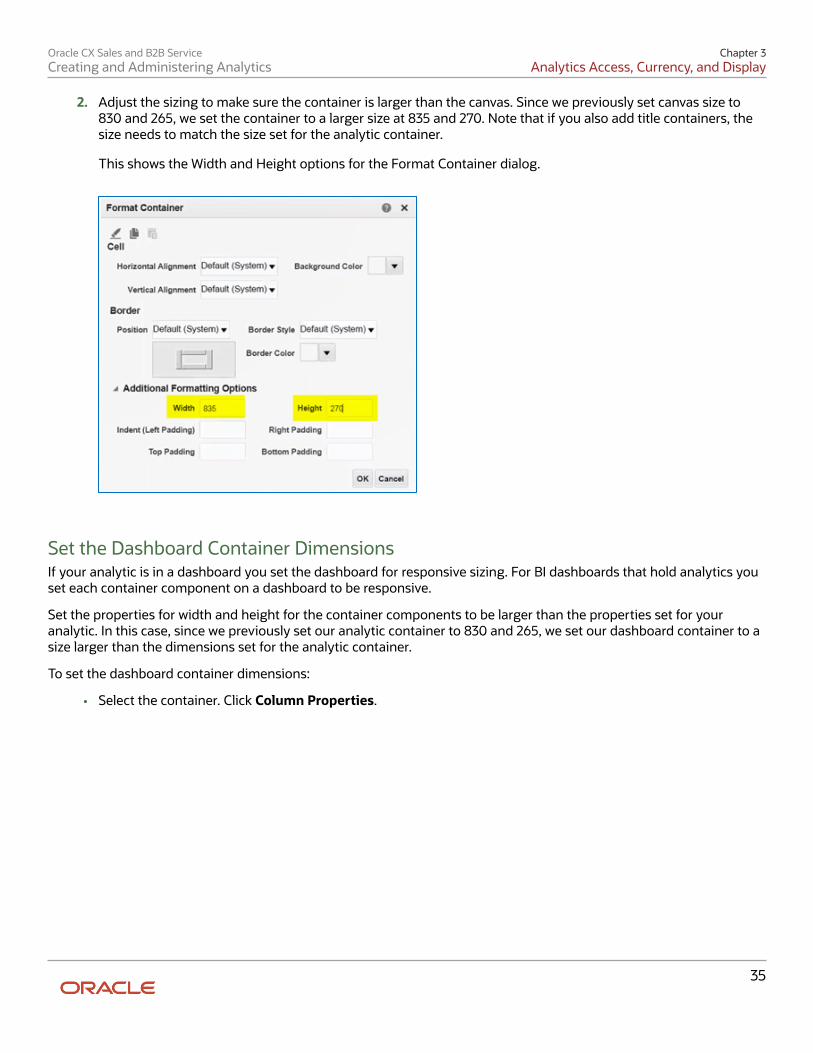
2. Adjust the sizing to make sure the container is larger than the canvas. Since we previously set canvas size to830 and 265, we set the container to a larger size at 835 and 270. Note that if you also add title containers, thesize needs to match the size set for the analytic container.
This shows the Width and Height options for the Format Container dialog.
Set the Dashboard Container DimensionsIf your analytic is in a dashboard you set the dashboard for responsive sizing. For BI dashboards that hold analytics youset each container component on a dashboard to be responsive.
Set the properties for width and height for the container components to be larger than the properties set for youranalytic. In this case, since we previously set our analytic container to 830 and 265, we set our dashboard container to asize larger than the dimensions set for the analytic container.
To set the dashboard container dimensions:
• Select the container. Click Column Properties.
Oracle CX Sales and B2B ServiceCreating and Administering Analytics
Chapter 3Analytics Access, Currency, and Display
36
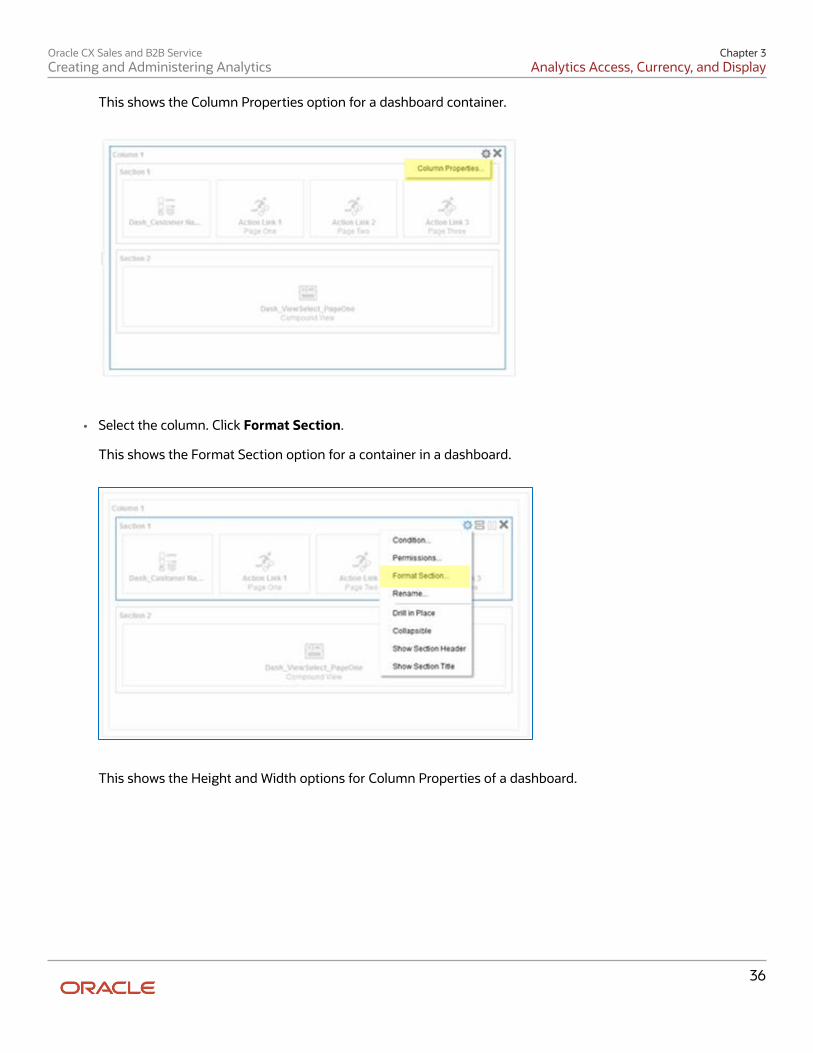
This shows the Column Properties option for a dashboard container.
• Select the column. Click Format Section.
This shows the Format Section option for a container in a dashboard.
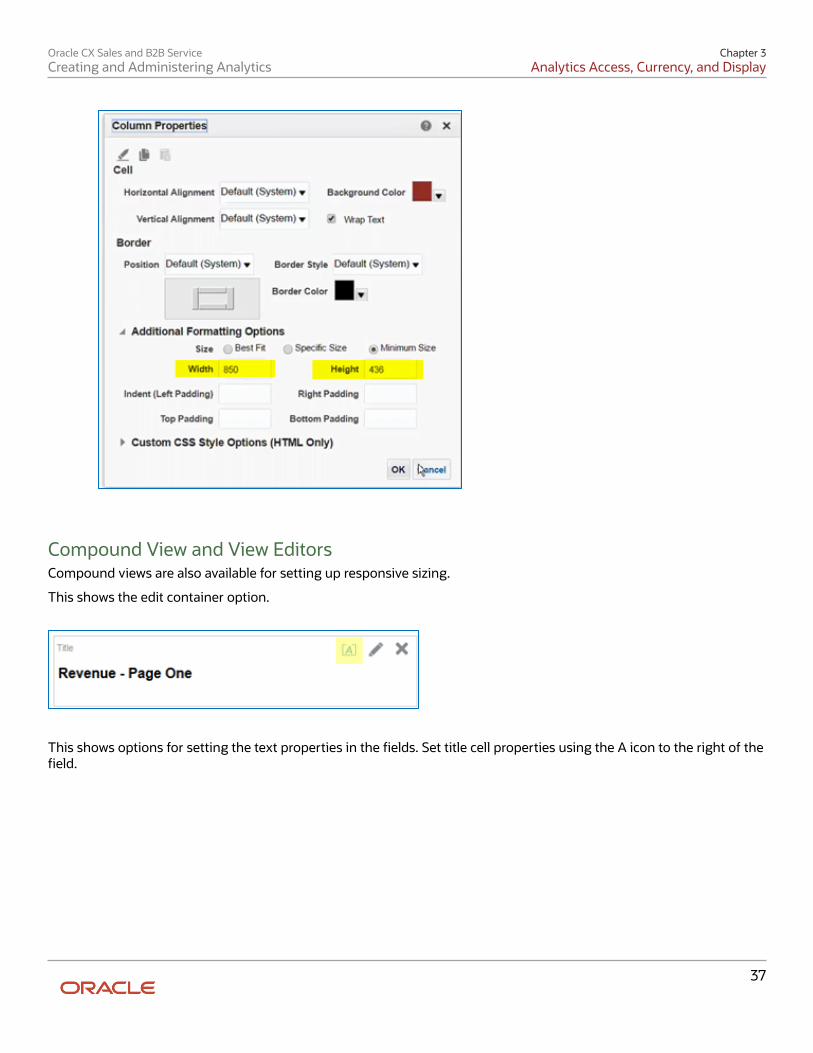
This shows the Height and Width options for Column Properties of a dashboard.
Oracle CX Sales and B2B ServiceCreating and Administering Analytics
Chapter 3Analytics Access, Currency, and Display
37
Compound View and View EditorsCompound views are also available for setting up responsive sizing.
This shows the edit container option.
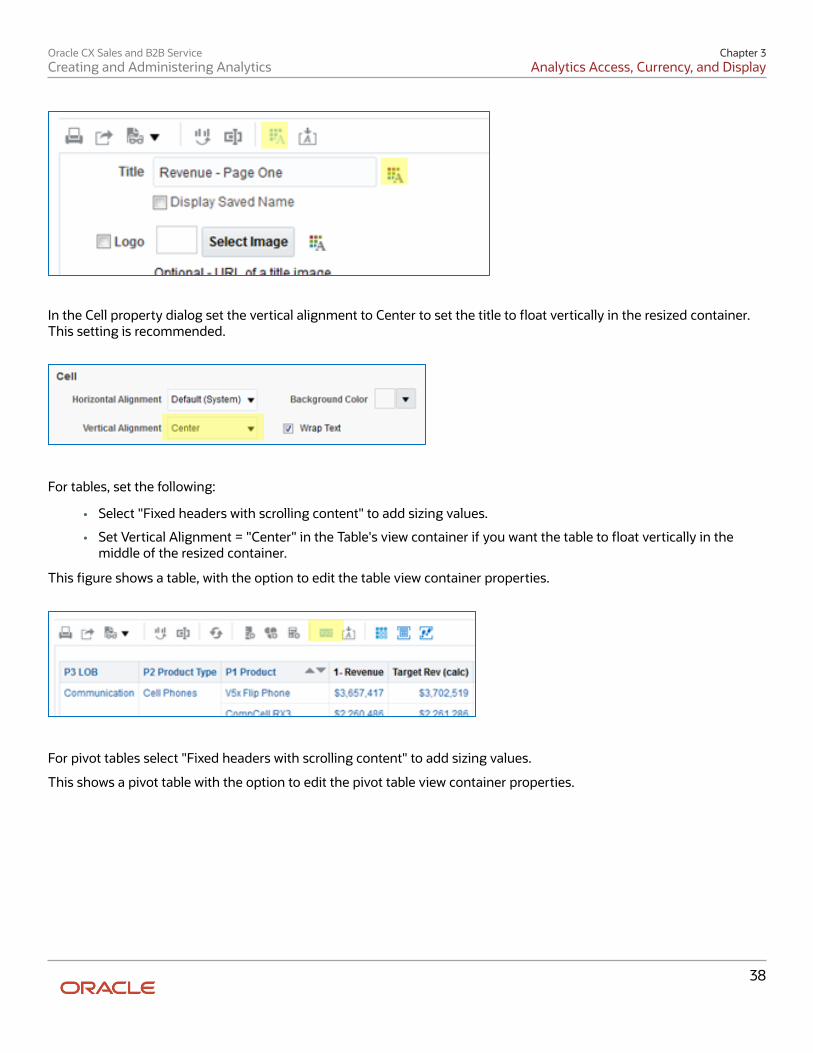
This shows options for setting the text properties in the fields. Set title cell properties using the A icon to the right of thefield.
Oracle CX Sales and B2B ServiceCreating and Administering Analytics
Chapter 3Analytics Access, Currency, and Display
38
In the Cell property dialog set the vertical alignment to Center to set the title to float vertically in the resized container.This setting is recommended.
For tables, set the following:
• Select "Fixed headers with scrolling content" to add sizing values.
• Set Vertical Alignment = "Center" in the Table's view container if you want the table to float vertically in themiddle of the resized container.
This figure shows a table, with the option to edit the table view container properties.
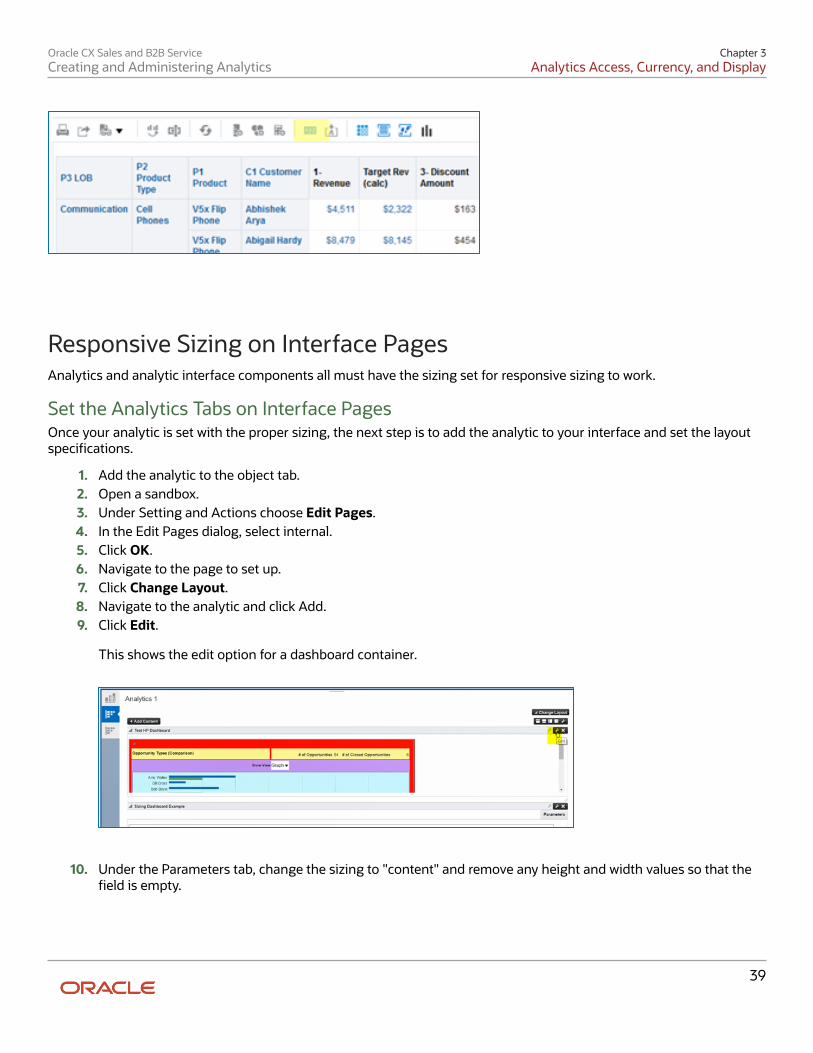
For pivot tables select "Fixed headers with scrolling content" to add sizing values.
This shows a pivot table with the option to edit the pivot table view container properties.
Oracle CX Sales and B2B ServiceCreating and Administering Analytics
Chapter 3Analytics Access, Currency, and Display
39
Responsive Sizing on Interface PagesAnalytics and analytic interface components all must have the sizing set for responsive sizing to work.
Set the Analytics Tabs on Interface PagesOnce your analytic is set with the proper sizing, the next step is to add the analytic to your interface and set the layoutspecifications.
1. Add the analytic to the object tab.2. Open a sandbox.3. Under Setting and Actions choose Edit Pages.4. In the Edit Pages dialog, select internal.5. Click OK.6. Navigate to the page to set up.7. Click Change Layout.8. Navigate to the analytic and click Add.9. Click Edit.
This shows the edit option for a dashboard container.
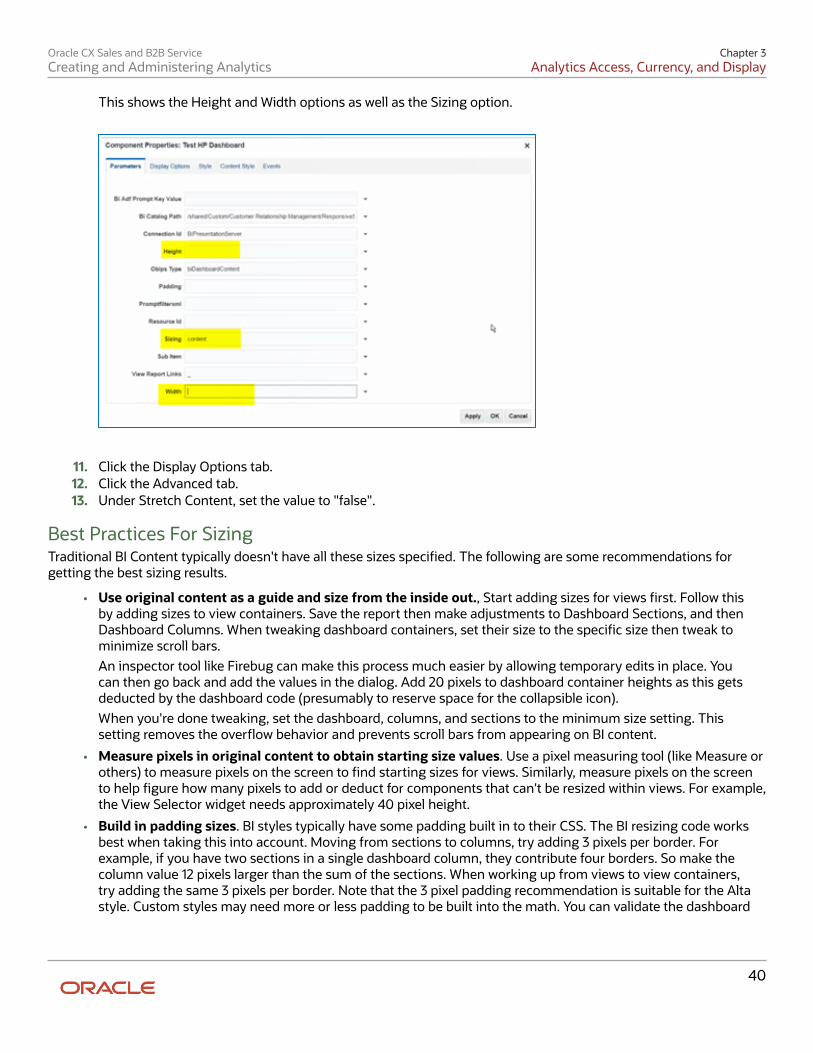
10. Under the Parameters tab, change the sizing to "content" and remove any height and width values so that thefield is empty.
Oracle CX Sales and B2B ServiceCreating and Administering Analytics
Chapter 3Analytics Access, Currency, and Display
40
This shows the Height and Width options as well as the Sizing option.
11. Click the Display Options tab.12. Click the Advanced tab.13. Under Stretch Content, set the value to "false".
Best Practices For SizingTraditional BI Content typically doesn't have all these sizes specified. The following are some recommendations forgetting the best sizing results.
• Use original content as a guide and size from the inside out., Start adding sizes for views first. Follow thisby adding sizes to view containers. Save the report then make adjustments to Dashboard Sections, and thenDashboard Columns. When tweaking dashboard containers, set their size to the specific size then tweak tominimize scroll bars.An inspector tool like Firebug can make this process much easier by allowing temporary edits in place. Youcan then go back and add the values in the dialog. Add 20 pixels to dashboard container heights as this getsdeducted by the dashboard code (presumably to reserve space for the collapsible icon).When you're done tweaking, set the dashboard, columns, and sections to the minimum size setting. Thissetting removes the overflow behavior and prevents scroll bars from appearing on BI content.
• Measure pixels in original content to obtain starting size values. Use a pixel measuring tool (like Measure orothers) to measure pixels on the screen to find starting sizes for views. Similarly, measure pixels on the screento help figure how many pixels to add or deduct for components that can't be resized within views. For example,the View Selector widget needs approximately 40 pixel height.
• Build in padding sizes. BI styles typically have some padding built in to their CSS. The BI resizing code worksbest when taking this into account. Moving from sections to columns, try adding 3 pixels per border. Forexample, if you have two sections in a single dashboard column, they contribute four borders. So make thecolumn value 12 pixels larger than the sum of the sections. When working up from views to view containers,try adding the same 3 pixels per border. Note that the 3 pixel padding recommendation is suitable for the Altastyle. Custom styles may need more or less padding to be built into the math. You can validate the dashboard
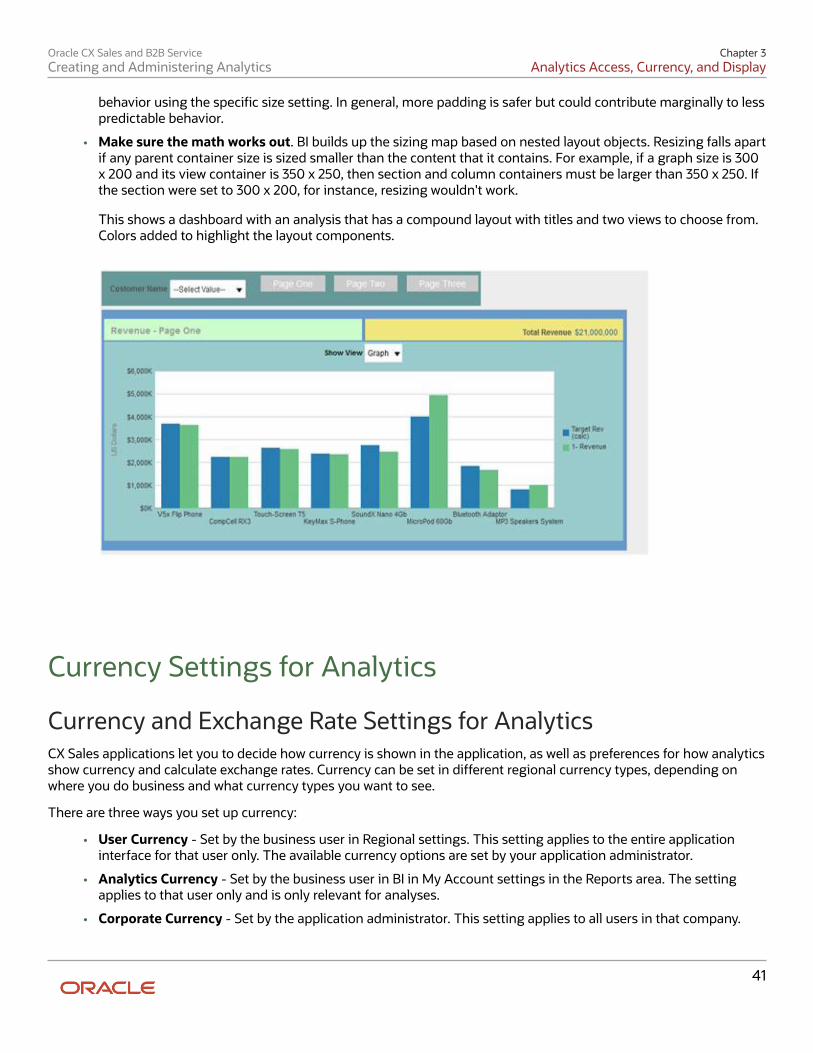
Oracle CX Sales and B2B ServiceCreating and Administering Analytics
Chapter 3Analytics Access, Currency, and Display
41
behavior using the specific size setting. In general, more padding is safer but could contribute marginally to lesspredictable behavior.
• Make sure the math works out. BI builds up the sizing map based on nested layout objects. Resizing falls apartif any parent container size is sized smaller than the content that it contains. For example, if a graph size is 300x 200 and its view container is 350 x 250, then section and column containers must be larger than 350 x 250. Ifthe section were set to 300 x 200, for instance, resizing wouldn't work.
This shows a dashboard with an analysis that has a compound layout with titles and two views to choose from.Colors added to highlight the layout components.
Currency Settings for Analytics
Currency and Exchange Rate Settings for AnalyticsCX Sales applications let you to decide how currency is shown in the application, as well as preferences for how analyticsshow currency and calculate exchange rates. Currency can be set in different regional currency types, depending onwhere you do business and what currency types you want to see.
There are three ways you set up currency:
• User Currency - Set by the business user in Regional settings. This setting applies to the entire applicationinterface for that user only. The available currency options are set by your application administrator.
• Analytics Currency - Set by the business user in BI in My Account settings in the Reports area. The settingapplies to that user only and is only relevant for analyses.
• Corporate Currency - Set by the application administrator. This setting applies to all users in that company.
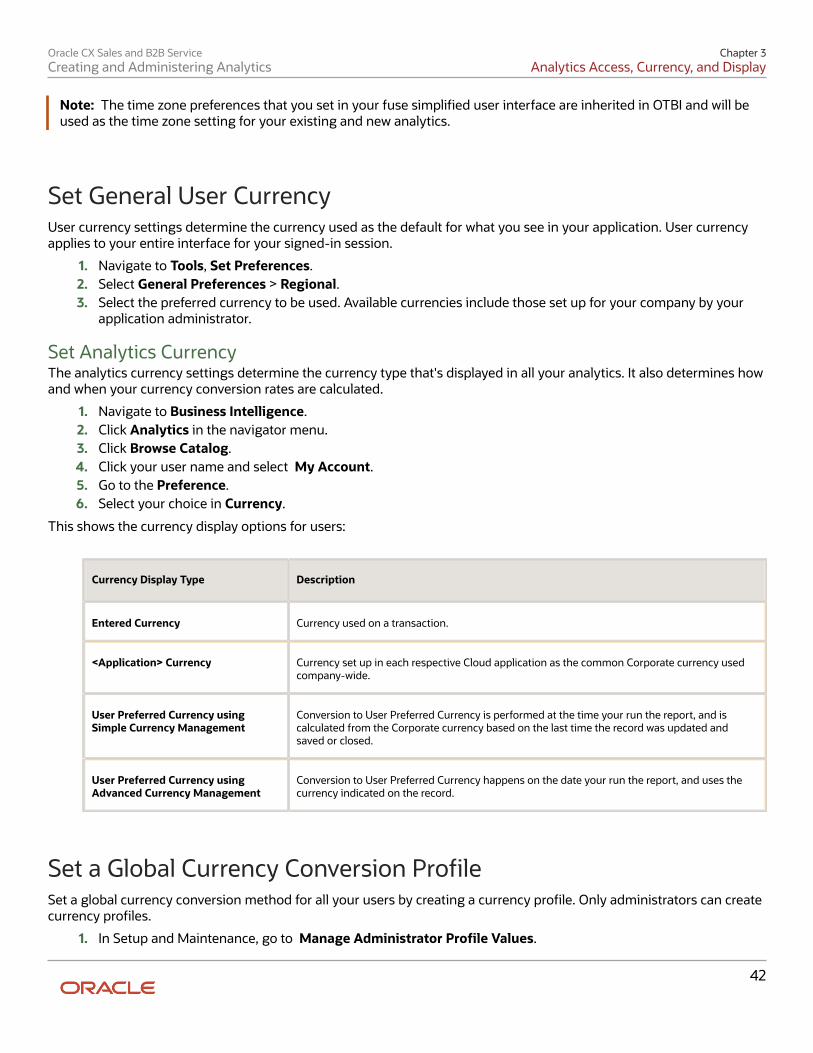
Oracle CX Sales and B2B ServiceCreating and Administering Analytics
Chapter 3Analytics Access, Currency, and Display
42
Note: The time zone preferences that you set in your fuse simplified user interface are inherited in OTBI and will beused as the time zone setting for your existing and new analytics.
Set General User CurrencyUser currency settings determine the currency used as the default for what you see in your application. User currencyapplies to your entire interface for your signed-in session.
1. Navigate to Tools, Set Preferences.2. Select General Preferences > Regional.3. Select the preferred currency to be used. Available currencies include those set up for your company by your
application administrator.
Set Analytics CurrencyThe analytics currency settings determine the currency type that's displayed in all your analytics. It also determines howand when your currency conversion rates are calculated.
1. Navigate to Business Intelligence.2. Click Analytics in the navigator menu.3. Click Browse Catalog.4. Click your user name and select My Account.5. Go to the Preference.6. Select your choice in Currency.
This shows the currency display options for users:
Currency Display Type Description
Entered Currency Currency used on a transaction.
<Application> Currency Currency set up in each respective Cloud application as the common Corporate currency usedcompany-wide.
User Preferred Currency usingSimple Currency Management
Conversion to User Preferred Currency is performed at the time your run the report, and iscalculated from the Corporate currency based on the last time the record was updated andsaved or closed.
User Preferred Currency usingAdvanced Currency Management
Conversion to User Preferred Currency happens on the date your run the report, and uses thecurrency indicated on the record.
Set a Global Currency Conversion ProfileSet a global currency conversion method for all your users by creating a currency profile. Only administrators can createcurrency profiles.
1. In Setup and Maintenance, go to Manage Administrator Profile Values.
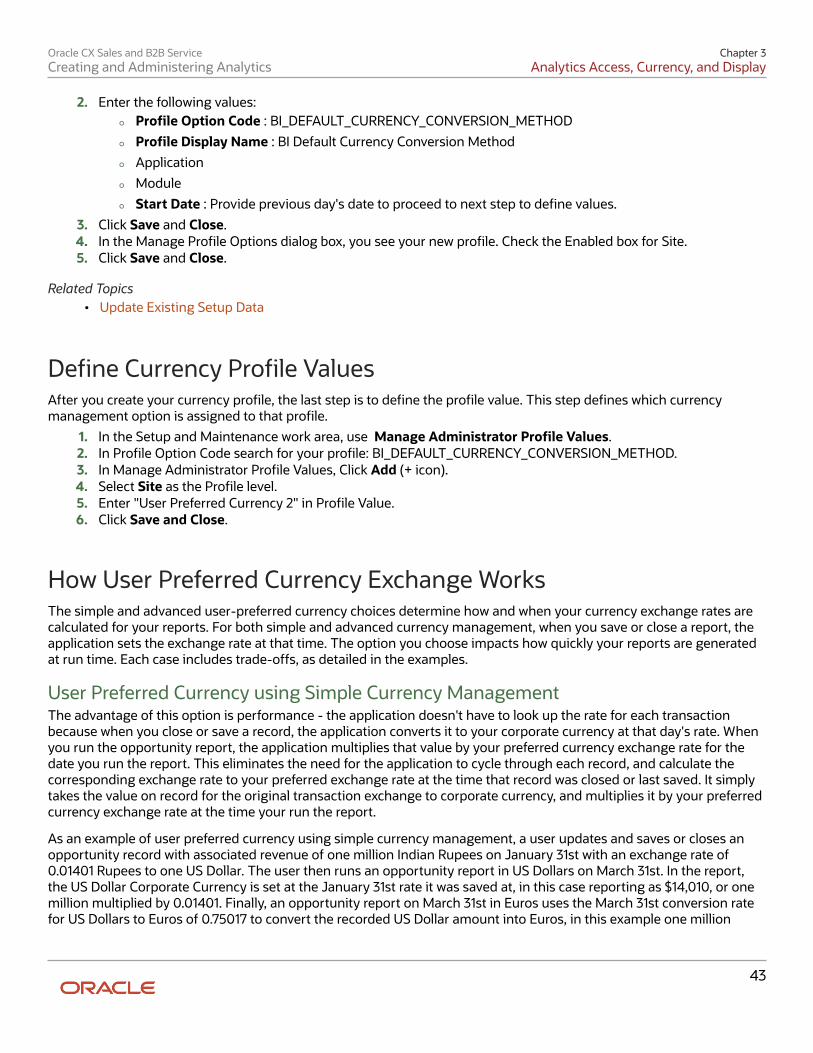
Oracle CX Sales and B2B ServiceCreating and Administering Analytics
Chapter 3Analytics Access, Currency, and Display
43
2. Enter the following values:
◦ Profile Option Code : BI_DEFAULT_CURRENCY_CONVERSION_METHOD
◦ Profile Display Name : BI Default Currency Conversion Method
◦ Application
◦ Module
◦ Start Date : Provide previous day's date to proceed to next step to define values.
3. Click Save and Close.4. In the Manage Profile Options dialog box, you see your new profile. Check the Enabled box for Site.5. Click Save and Close.
Related Topics• Update Existing Setup Data
Define Currency Profile ValuesAfter you create your currency profile, the last step is to define the profile value. This step defines which currencymanagement option is assigned to that profile.
1. In the Setup and Maintenance work area, use Manage Administrator Profile Values.2. In Profile Option Code search for your profile: BI_DEFAULT_CURRENCY_CONVERSION_METHOD.3. In Manage Administrator Profile Values, Click Add (+ icon).4. Select Site as the Profile level.5. Enter "User Preferred Currency 2" in Profile Value.6. Click Save and Close.
How User Preferred Currency Exchange WorksThe simple and advanced user-preferred currency choices determine how and when your currency exchange rates arecalculated for your reports. For both simple and advanced currency management, when you save or close a report, theapplication sets the exchange rate at that time. The option you choose impacts how quickly your reports are generatedat run time. Each case includes trade-offs, as detailed in the examples.
User Preferred Currency using Simple Currency ManagementThe advantage of this option is performance - the application doesn't have to look up the rate for each transactionbecause when you close or save a record, the application converts it to your corporate currency at that day's rate. Whenyou run the opportunity report, the application multiplies that value by your preferred currency exchange rate for thedate you run the report. This eliminates the need for the application to cycle through each record, and calculate thecorresponding exchange rate to your preferred exchange rate at the time that record was closed or last saved. It simplytakes the value on record for the original transaction exchange to corporate currency, and multiplies it by your preferredcurrency exchange rate at the time your run the report.
As an example of user preferred currency using simple currency management, a user updates and saves or closes anopportunity record with associated revenue of one million Indian Rupees on January 31st with an exchange rate of0.01401 Rupees to one US Dollar. The user then runs an opportunity report in US Dollars on March 31st. In the report,the US Dollar Corporate Currency is set at the January 31st rate it was saved at, in this case reporting as $14,010, or onemillion multiplied by 0.01401. Finally, an opportunity report on March 31st in Euros uses the March 31st conversion ratefor US Dollars to Euros of 0.75017 to convert the recorded US Dollar amount into Euros, in this example one million
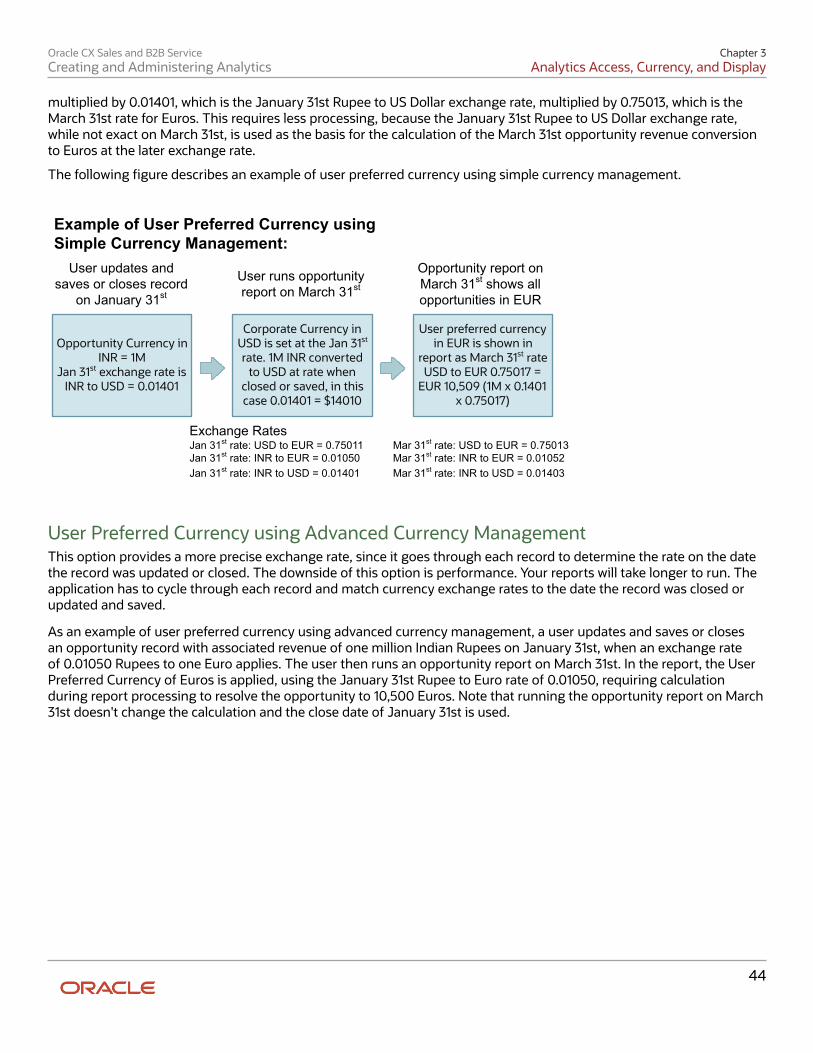
Oracle CX Sales and B2B ServiceCreating and Administering Analytics
Chapter 3Analytics Access, Currency, and Display
44
multiplied by 0.01401, which is the January 31st Rupee to US Dollar exchange rate, multiplied by 0.75013, which is theMarch 31st rate for Euros. This requires less processing, because the January 31st Rupee to US Dollar exchange rate,while not exact on March 31st, is used as the basis for the calculation of the March 31st opportunity revenue conversionto Euros at the later exchange rate.
The following figure describes an example of user preferred currency using simple currency management.
Opportunity Currency in INR = 1M
Jan 31st exchange rate is INR to USD = 0.01401
Corporate Currency in USD is set at the Jan 31st rate. 1M INR converted
to USD at rate when closed or saved, in this case 0.01401 = $14010
User preferred currency in EUR is shown in
report as March 31st rate USD to EUR 0.75017 =
EUR 10,509 (1M x 0.1401 x 0.75017)
Example of User Preferred Currency using Simple Currency Management:
User updates and saves or closes record
on January 31st
User runs opportunity report on March 31st
Opportunity report on March 31st shows all opportunities in EUR
Exchange RatesJan 31st rate: USD to EUR = 0.75011Jan 31st rate: INR to EUR = 0.01050Jan 31st rate: INR to USD = 0.01401
Mar 31st rate: USD to EUR = 0.75013Mar 31st rate: INR to EUR = 0.01052Mar 31st rate: INR to USD = 0.01403
User Preferred Currency using Advanced Currency ManagementThis option provides a more precise exchange rate, since it goes through each record to determine the rate on the datethe record was updated or closed. The downside of this option is performance. Your reports will take longer to run. Theapplication has to cycle through each record and match currency exchange rates to the date the record was closed orupdated and saved.
As an example of user preferred currency using advanced currency management, a user updates and saves or closesan opportunity record with associated revenue of one million Indian Rupees on January 31st, when an exchange rateof 0.01050 Rupees to one Euro applies. The user then runs an opportunity report on March 31st. In the report, the UserPreferred Currency of Euros is applied, using the January 31st Rupee to Euro rate of 0.01050, requiring calculationduring report processing to resolve the opportunity to 10,500 Euros. Note that running the opportunity report on March31st doesn't change the calculation and the close date of January 31st is used.
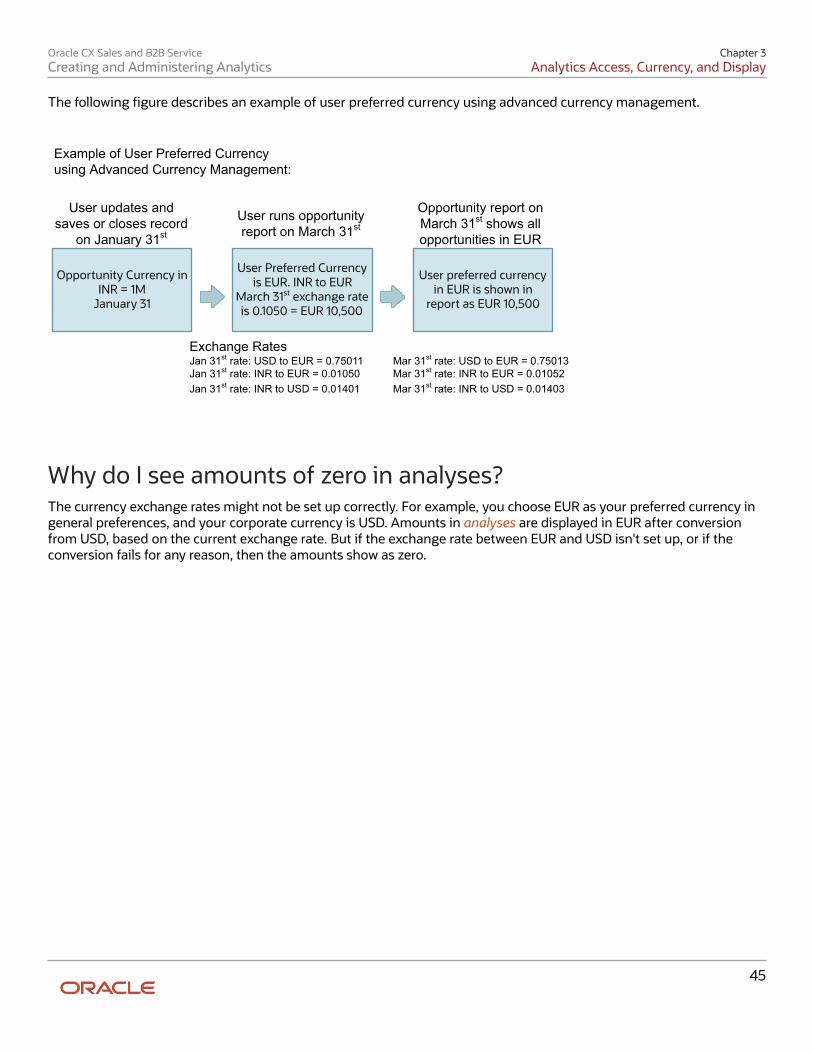
Oracle CX Sales and B2B ServiceCreating and Administering Analytics
Chapter 3Analytics Access, Currency, and Display
45
The following figure describes an example of user preferred currency using advanced currency management.
Opportunity Currency in INR = 1M
January 31
User Preferred Currency is EUR. INR to EUR
March 31st exchange rate is 0.1050 = EUR 10,500
User preferred currency in EUR is shown in
report as EUR 10,500
Example of User Preferred Currencyusing Advanced Currency Management:
User updates and saves or closes record
on January 31st
User runs opportunity report on March 31st
Opportunity report on March 31st shows all opportunities in EUR
Exchange RatesJan 31st rate: USD to EUR = 0.75011Jan 31st rate: INR to EUR = 0.01050Jan 31st rate: INR to USD = 0.01401
Mar 31st rate: USD to EUR = 0.75013Mar 31st rate: INR to EUR = 0.01052Mar 31st rate: INR to USD = 0.01403
Why do I see amounts of zero in analyses?The currency exchange rates might not be set up correctly. For example, you choose EUR as your preferred currency ingeneral preferences, and your corporate currency is USD. Amounts in analyses are displayed in EUR after conversionfrom USD, based on the current exchange rate. But if the exchange rate between EUR and USD isn't set up, or if theconversion fails for any reason, then the amounts show as zero.
Oracle CX Sales and B2B ServiceCreating and Administering Analytics
Chapter 3Analytics Access, Currency, and Display
46
Oracle CX Sales and B2B ServiceCreating and Administering Analytics
Chapter 4Subject Areas
47
4 Subject Areas
Listing of Prebuilt Subject AreasThere are a variety of standard subject areas that you can use right out of the box to build your analytics. This listincludes subject areas for other applications as well. See the Related Topics for a link to the subject area listing.
Related Topics
• List of Standard Subject Areas
Subject Area UpdatesWe add and update subject areas as we build new features for you. Here are the new CX Sales and B2B Service subjectareas for recent releases.
New Subject Area Description
CRM - CRM Reporting Usage New for 21A. The Reporting Usage subject area lets you see how your users and teams useOTBI in CRM. This subject area exposes execution metrics around subject areas, analytics, anddashboards. These metrics proving reporting on details like the most popular and unpopularreports and which analytics are important to your users. Use this subject area to understandyour user interests in terms of reporting and analytic insights.
Sales - CRM Object Activity Although this subject area has been around for a few releases, for 21A we have now extendedits reach to the latest CX Sales mobile applications in the mobile channel. The mobile channelnow provides reporting for all versions of the CX Sales Mobile application.
CRM - CRM Click History Released in 20D the Click History subject area allows reporting on user clicks. Click Historyreporting reveals the areas of the application that individuals, teams, and organizations areusing, or not using in CX Sales and B2B Service.
Sales - CRM Resource System Usage This subject area provides data for reporting on CRM resource activity (a resource is a personor user).
Use this subject area to report on resource activity by channel, resource activity in timeperiods, and time periods with no resource activity.
Sales - CRM Object Activity This subject area provides data for reporting on object activity, specifically object creation andupdates.
Use this subject area to report on object activity by channel, object activity performed by users,object activity by channel, and time periods with no object activity.
Oracle CX Sales and B2B ServiceCreating and Administering Analytics
Chapter 4Subject Areas
48
New Subject Area Description
User System Usage This subject area provides the key user adoption metric at the application user level.
Service - CRM Service RequestLifecycle
SRs go through a life cycle, from the point they are created up until they are resolved, andfinally closed. Service personnel are interested in keeping this life cycle short while attemptinga timely, quality fix to issues. This subject area helps building analyses that helps keep a closewatch on the SRs, finding outliers and taking corrective steps pro-actively to avoid customerescalations and potential SLA violations. Useful measures such as actual time spent by anagent on an SR, customer wait times, SR duration with specific queues and assignees andnumber of queue transfers provide the much needed insight into potential issues before theyreach crisis proportions. The ability to analyze these measures in relation to key information ofan SR together with surrounding entities such as Agent, Account, Channel and Product makethe analyses even more powerful.
Service - CRM Survey Requests RealTime
Use this subject area to obtain insight into survey request activity in the context of a ServiceRequest. Build summary reports for a comparison of survey requests sent and SRs resolvedover a chosen periodicity such as monthly or quarterly. Analyze survey response percentagesagainst requests sent in relation to service categories, accounts, account regions, products,teams and other key business contexts. Examine request/response performance for surveytemplates used, to determine if any template changes are necessary.
How Subject Areas WorkSubject areas are the building blocks of your analytics. There are subject areas that come prebuilt with your application,and over 100 analytics built from the included subject areas. Let's look a little closer at how subject areas work.
All of the electronic activity that happens each day in your company is stored and can be used to look at current andhistorical data, as well as predict future trends and outcomes. This information is saved and grouped and packagedas objects. The objects hold information called attributes which are pieces of information related to that object. Forexample, an object called Customer would hold information related to that customer, such as name, address, phonenumber, company and so on.
Object attributes are organized in columns which are used to provide real-time transactional reporting.
You can use the prebuilt subject areas to build your own analytics. Or you can build your own subject areas and usethem for building or editing analytics. Most importantly, the focus of a subject area is to provide a way for you to gainaccess to key insights about your organization.
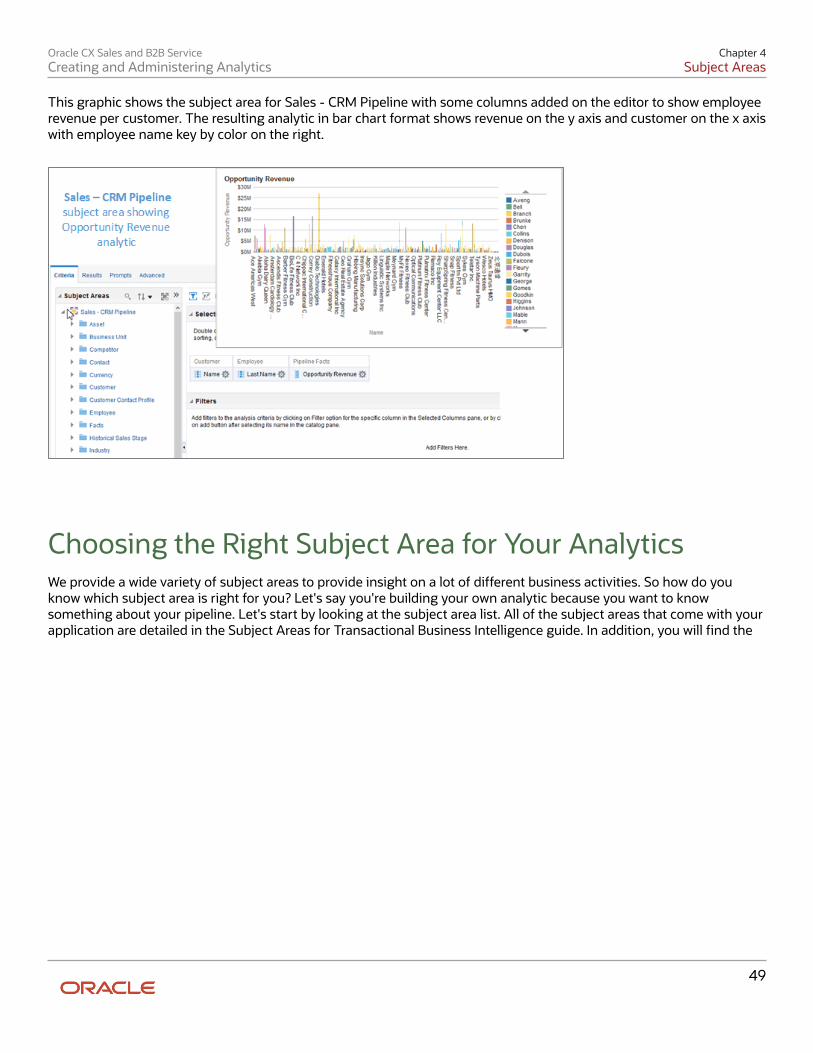
Oracle CX Sales and B2B ServiceCreating and Administering Analytics
Chapter 4Subject Areas
49
This graphic shows the subject area for Sales - CRM Pipeline with some columns added on the editor to show employeerevenue per customer. The resulting analytic in bar chart format shows revenue on the y axis and customer on the x axiswith employee name key by color on the right.
Choosing the Right Subject Area for Your AnalyticsWe provide a wide variety of subject areas to provide insight on a lot of different business activities. So how do youknow which subject area is right for you? Let's say you're building your own analytic because you want to knowsomething about your pipeline. Let's start by looking at the subject area list. All of the subject areas that come with yourapplication are detailed in the Subject Areas for Transactional Business Intelligence guide. In addition, you will find the
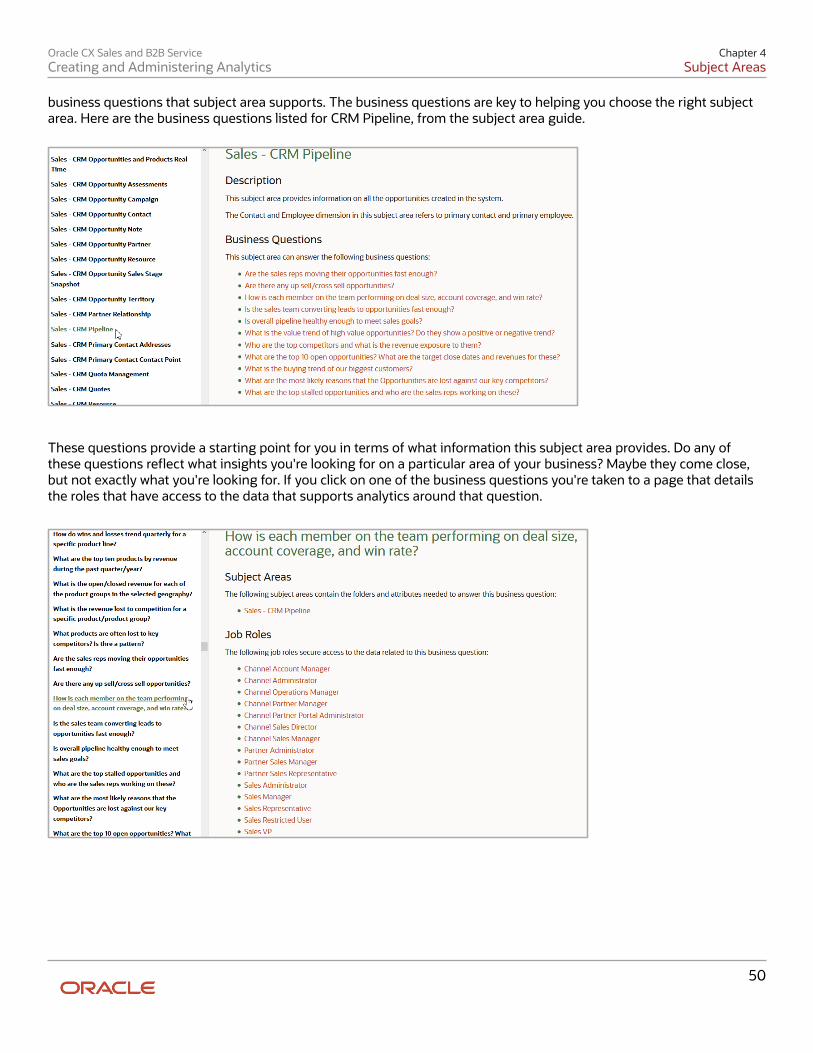
Oracle CX Sales and B2B ServiceCreating and Administering Analytics
Chapter 4Subject Areas
50
business questions that subject area supports. The business questions are key to helping you choose the right subjectarea. Here are the business questions listed for CRM Pipeline, from the subject area guide.
These questions provide a starting point for you in terms of what information this subject area provides. Do any ofthese questions reflect what insights you're looking for on a particular area of your business? Maybe they come close,but not exactly what you're looking for. If you click on one of the business questions you're taken to a page that detailsthe roles that have access to the data that supports analytics around that question.
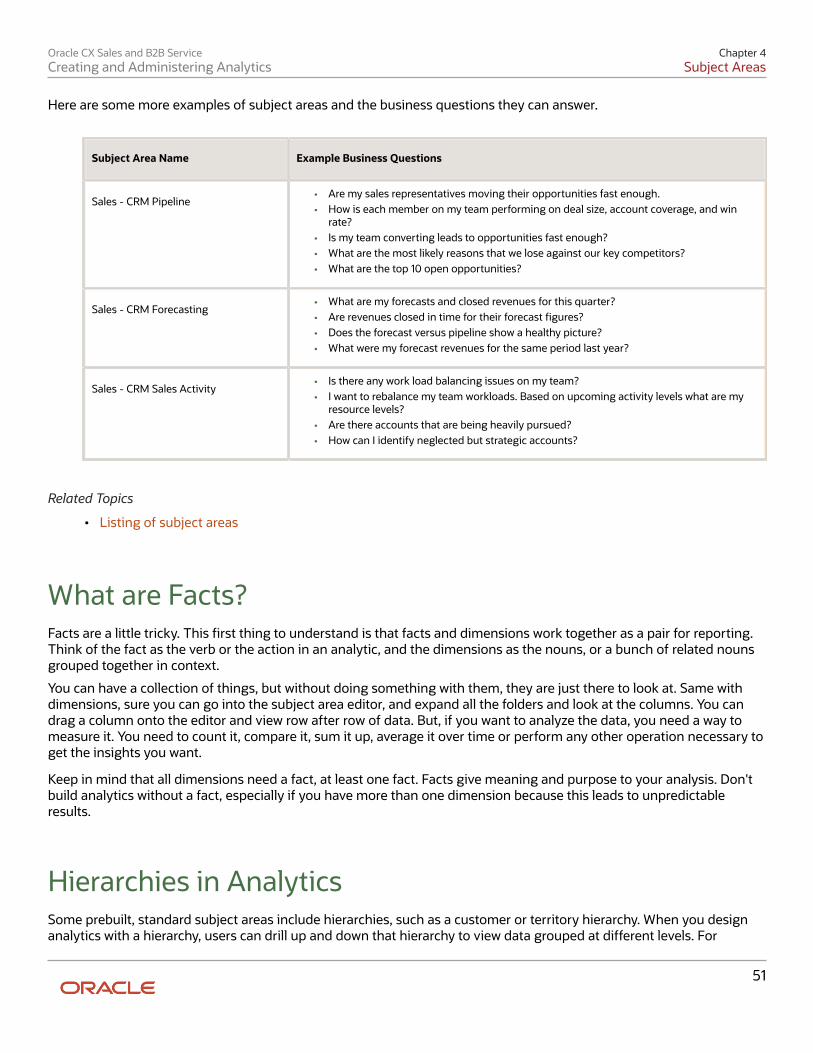
Oracle CX Sales and B2B ServiceCreating and Administering Analytics
Chapter 4Subject Areas
51
Here are some more examples of subject areas and the business questions they can answer.
Subject Area Name Example Business Questions
Sales - CRM Pipeline• Are my sales representatives moving their opportunities fast enough.• How is each member on my team performing on deal size, account coverage, and win
rate?• Is my team converting leads to opportunities fast enough?• What are the most likely reasons that we lose against our key competitors?• What are the top 10 open opportunities?
Sales - CRM Forecasting• What are my forecasts and closed revenues for this quarter?• Are revenues closed in time for their forecast figures?• Does the forecast versus pipeline show a healthy picture?• What were my forecast revenues for the same period last year?
Sales - CRM Sales Activity• Is there any work load balancing issues on my team?• I want to rebalance my team workloads. Based on upcoming activity levels what are my
resource levels?• Are there accounts that are being heavily pursued?• How can I identify neglected but strategic accounts?
Related Topics
• Listing of subject areas
What are Facts?Facts are a little tricky. This first thing to understand is that facts and dimensions work together as a pair for reporting.Think of the fact as the verb or the action in an analytic, and the dimensions as the nouns, or a bunch of related nounsgrouped together in context.
You can have a collection of things, but without doing something with them, they are just there to look at. Same withdimensions, sure you can go into the subject area editor, and expand all the folders and look at the columns. You candrag a column onto the editor and view row after row of data. But, if you want to analyze the data, you need a way tomeasure it. You need to count it, compare it, sum it up, average it over time or perform any other operation necessary toget the insights you want.
Keep in mind that all dimensions need a fact, at least one fact. Facts give meaning and purpose to your analysis. Don'tbuild analytics without a fact, especially if you have more than one dimension because this leads to unpredictableresults.
Hierarchies in AnalyticsSome prebuilt, standard subject areas include hierarchies, such as a customer or territory hierarchy. When you designanalytics with a hierarchy, users can drill up and down that hierarchy to view data grouped at different levels. For
Oracle CX Sales and B2B ServiceCreating and Administering Analytics
Chapter 4Subject Areas
52
example, with a territory hierarchy, users can drill up and down their data to look at information grouped by region,state, and city. Hierarchies are delivered with standard subject areas only; you can't add them to custom subject areas.What you can do, however, is join your custom subject area with a standard subject area that has the hierarchy youneed. This lets you create analytics with a hierarchy using data pulled from your custom subject area.
Supported HierarchiesThe following hierarchies are supported in some standard subject areas, such as Sales - CRM Pipeline:
• Resource
• Territory
• Customer
• Partner
Example of Adding a Hierarchy to AnalyticsIf you want to create analytics that include a hierarchy, and also pull data from a custom subject area, then here's howyou do it.
Let's say you have a custom object named Ticket that you want to report on. The Ticket object includes the Accountfield as a dynamic choice list. This means at runtime, your users can create tickets and assign accounts (customers) tothem.
Now you have 1,000 tickets in your database and it's time to report on them. Your users would like to view total numberof tickets up and down their customer hierarchy.
Here's how you can create a report to meet this need:
1. Create a custom subject area for Ticket and publish it.2. Create a report using a standard subject area, such as Sales - CRM Customer or Contacts Real Time. These
subject areas include the customer hierarchy.3. Add the account hierarchy from the subject area to your report.4. Next, add your Ticket custom subject area to the report. This "joins" the two subject areas.5. Finally, add the metric, such as Number of Tickets, from the custom subject area to your report.
Related Topics
• Reporting Using Data from More than One Subject Area
View Subject Area DetailsWe discussed that subject areas contain columns of information extracted from your transactional data sources. Thenext step would be to discover what columns of information are available in a particular subject area that you might beinterested in using for your analytics. To do this let's go to BI and open up a subject area and see what's there.
Explore a Subject Area in BIHere's how you view a subject area in BI:
1. From the Home page of your application go to Navigator.
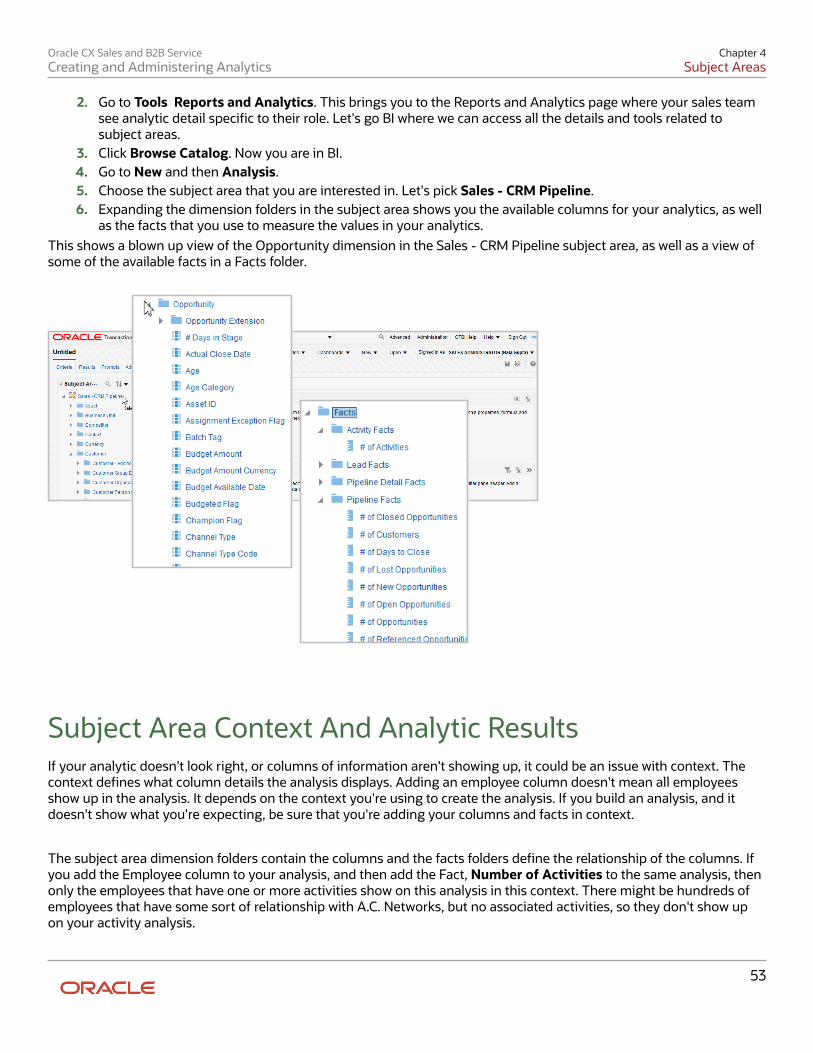
Oracle CX Sales and B2B ServiceCreating and Administering Analytics
Chapter 4Subject Areas
53
2. Go to Tools Reports and Analytics. This brings you to the Reports and Analytics page where your sales teamsee analytic detail specific to their role. Let's go BI where we can access all the details and tools related tosubject areas.
3. Click Browse Catalog. Now you are in BI.4. Go to New and then Analysis.5. Choose the subject area that you are interested in. Let's pick Sales - CRM Pipeline.6. Expanding the dimension folders in the subject area shows you the available columns for your analytics, as well
as the facts that you use to measure the values in your analytics.This shows a blown up view of the Opportunity dimension in the Sales - CRM Pipeline subject area, as well as a view ofsome of the available facts in a Facts folder.
Subject Area Context And Analytic ResultsIf your analytic doesn't look right, or columns of information aren't showing up, it could be an issue with context. Thecontext defines what column details the analysis displays. Adding an employee column doesn't mean all employeesshow up in the analysis. It depends on the context you're using to create the analysis. If you build an analysis, and itdoesn't show what you're expecting, be sure that you're adding your columns and facts in context.
The subject area dimension folders contain the columns and the facts folders define the relationship of the columns. Ifyou add the Employee column to your analysis, and then add the Fact, Number of Activities to the same analysis, thenonly the employees that have one or more activities show on this analysis in this context. There might be hundreds ofemployees that have some sort of relationship with A.C. Networks, but no associated activities, so they don't show upon your activity analysis.
Oracle CX Sales and B2B ServiceCreating and Administering Analytics
Chapter 4Subject Areas
54
The following is an example that might help explain this further.
In this exercise you will build an activity analysis, and add an additional subject area, then explore some differentscenarios.
1. Build an activity analysis as directed in "Create an Activity Analysis".2. With your activity analysis in edit mode, add the standard subject area Sales - CRM Quota Management.3. Both subject areas appear under Subject Areas. Expand Sales - CRM Sales Activity. Expand Customer. Expand
Sales Account Extension. Drag Level 1 Account Name onto the palette.4. Still in Sales Activity, expand Employee. Drag First Name and Last Name onto the palette.5. Expand Facts, then Activity Facts. Drag # of Activities onto the palette. This fact is key to this analysis because
the relationship of Employee to this subject area is dependent on the employee having one or more activitiesfor one or more accounts. If your employee has never entered activities for any given account, they don't tshow up on this report, even if they have another type of relationship with an account. Since the context of thissubject area has to do with sales activities, only employees with activities are included.
6. Now select the "Results" tab. You see four employees in the resulting analysis. Each of these employees has oneor more activities.
7. Now select the "Criteria" tab. Under Subject Areas expand Sales - CRM Quota Management. Expand Facts.Expand Pipeline Facts and drag Opportunity Revenue to the palette.
8. Go to the "Results" tab. Notice that now there are more employees. This result is because you have addedemployees that also have relationships to Quota Management. In this case, employees are added that havegenerated revenue.
9. Go back to "Criteria". Remove # of Activities. The results show only the three employees that have revenue.Helena has both revenue and activities so she shows up in both scenarios.
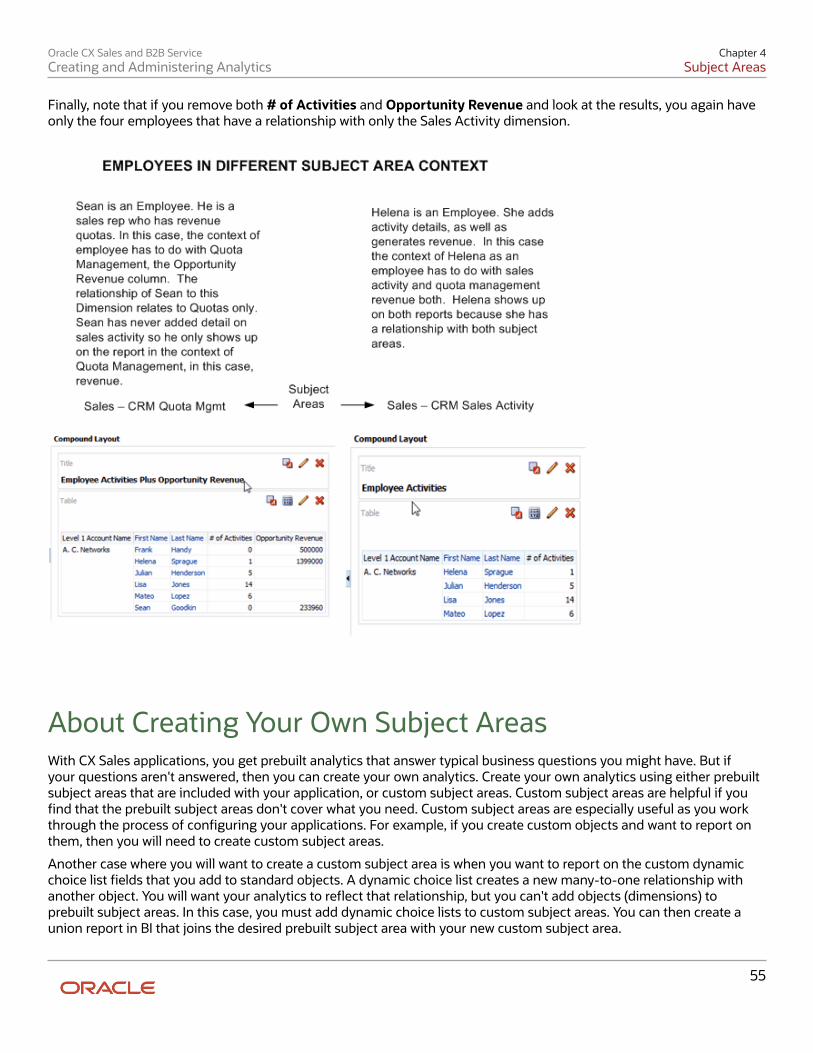
Oracle CX Sales and B2B ServiceCreating and Administering Analytics
Chapter 4Subject Areas
55
Finally, note that if you remove both # of Activities and Opportunity Revenue and look at the results, you again haveonly the four employees that have a relationship with only the Sales Activity dimension.
About Creating Your Own Subject AreasWith CX Sales applications, you get prebuilt analytics that answer typical business questions you might have. But ifyour questions aren't answered, then you can create your own analytics. Create your own analytics using either prebuiltsubject areas that are included with your application, or custom subject areas. Custom subject areas are helpful if youfind that the prebuilt subject areas don't cover what you need. Custom subject areas are especially useful as you workthrough the process of configuring your applications. For example, if you create custom objects and want to report onthem, then you will need to create custom subject areas.
Another case where you will want to create a custom subject area is when you want to report on the custom dynamicchoice list fields that you add to standard objects. A dynamic choice list creates a new many-to-one relationship withanother object. You will want your analytics to reflect that relationship, but you can't add objects (dimensions) toprebuilt subject areas. In this case, you must add dynamic choice lists to custom subject areas. You can then create aunion report in BI that joins the desired prebuilt subject area with your new custom subject area.
Oracle CX Sales and B2B ServiceCreating and Administering Analytics
Chapter 4Subject Areas
56
You create custom subject areas using a step-by-step train process in Application Composer. For more information, seethe Oracle Applications Cloud Configuring Applications Using Application Composer guide.
Related Topics
• About Custom Subject Areas
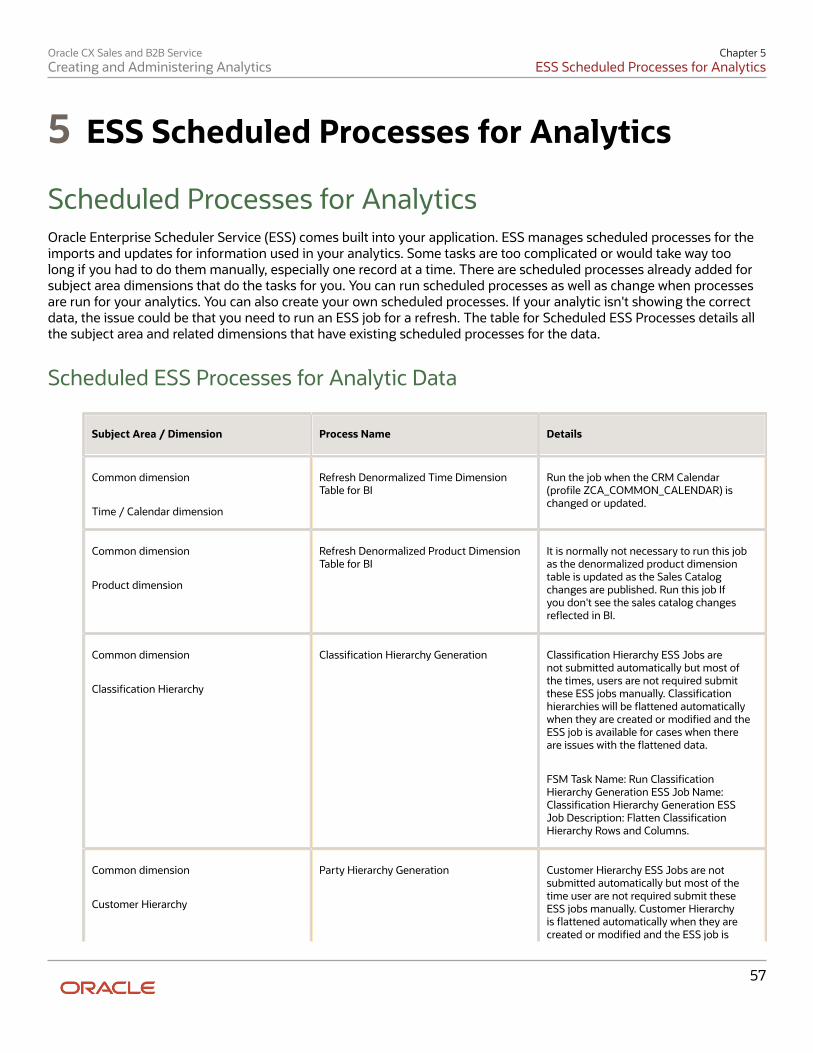
Oracle CX Sales and B2B ServiceCreating and Administering Analytics
Chapter 5ESS Scheduled Processes for Analytics
57
5 ESS Scheduled Processes for Analytics
Scheduled Processes for AnalyticsOracle Enterprise Scheduler Service (ESS) comes built into your application. ESS manages scheduled processes for theimports and updates for information used in your analytics. Some tasks are too complicated or would take way toolong if you had to do them manually, especially one record at a time. There are scheduled processes already added forsubject area dimensions that do the tasks for you. You can run scheduled processes as well as change when processesare run for your analytics. You can also create your own scheduled processes. If your analytic isn't showing the correctdata, the issue could be that you need to run an ESS job for a refresh. The table for Scheduled ESS Processes details allthe subject area and related dimensions that have existing scheduled processes for the data.
Scheduled ESS Processes for Analytic Data
Subject Area / Dimension Process Name Details
Common dimension
Time / Calendar dimension
Refresh Denormalized Time DimensionTable for BI
Run the job when the CRM Calendar(profile ZCA_COMMON_CALENDAR) ischanged or updated.
Common dimension
Product dimension
Refresh Denormalized Product DimensionTable for BI
It is normally not necessary to run this jobas the denormalized product dimensiontable is updated as the Sales Catalogchanges are published. Run this job Ifyou don't see the sales catalog changesreflected in BI.
Common dimension
Classification Hierarchy
Classification Hierarchy Generation Classification Hierarchy ESS Jobs arenot submitted automatically but most ofthe times, users are not required submitthese ESS jobs manually. Classificationhierarchies will be flattened automaticallywhen they are created or modified and theESS job is available for cases when thereare issues with the flattened data.
FSM Task Name: Run ClassificationHierarchy Generation ESS Job Name:Classification Hierarchy Generation ESSJob Description: Flatten ClassificationHierarchy Rows and Columns.
Common dimension
Customer Hierarchy
Party Hierarchy Generation Customer Hierarchy ESS Jobs are notsubmitted automatically but most of thetime user are not required submit theseESS jobs manually. Customer Hierarchyis flattened automatically when they arecreated or modified and the ESS job is
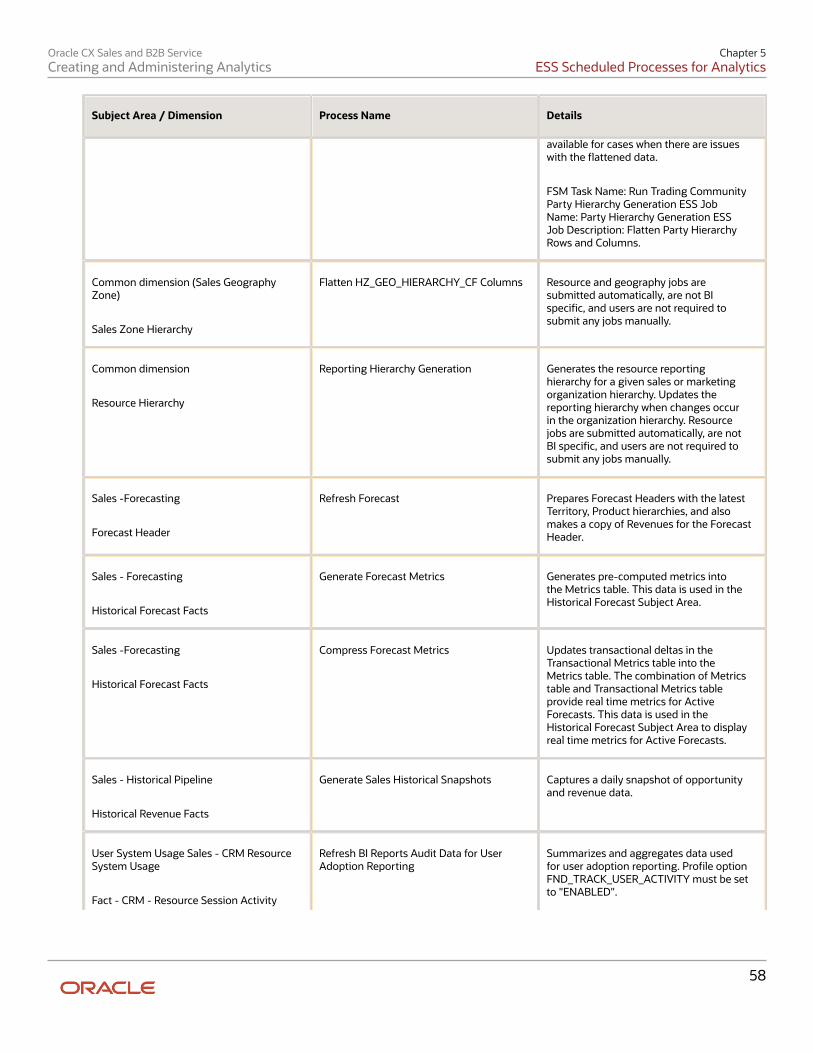
Oracle CX Sales and B2B ServiceCreating and Administering Analytics
Chapter 5ESS Scheduled Processes for Analytics
58
Subject Area / Dimension Process Name Details
available for cases when there are issueswith the flattened data.
FSM Task Name: Run Trading CommunityParty Hierarchy Generation ESS JobName: Party Hierarchy Generation ESSJob Description: Flatten Party HierarchyRows and Columns.
Common dimension (Sales GeographyZone)
Sales Zone Hierarchy
Flatten HZ_GEO_HIERARCHY_CF Columns Resource and geography jobs aresubmitted automatically, are not BIspecific, and users are not required tosubmit any jobs manually.
Common dimension
Resource Hierarchy
Reporting Hierarchy Generation Generates the resource reportinghierarchy for a given sales or marketingorganization hierarchy. Updates thereporting hierarchy when changes occurin the organization hierarchy. Resourcejobs are submitted automatically, are notBI specific, and users are not required tosubmit any jobs manually.
Sales -Forecasting
Forecast Header
Refresh Forecast Prepares Forecast Headers with the latestTerritory, Product hierarchies, and alsomakes a copy of Revenues for the ForecastHeader.
Sales - Forecasting
Historical Forecast Facts
Generate Forecast Metrics Generates pre-computed metrics intothe Metrics table. This data is used in theHistorical Forecast Subject Area.
Sales -Forecasting
Historical Forecast Facts
Compress Forecast Metrics Updates transactional deltas in theTransactional Metrics table into theMetrics table. The combination of Metricstable and Transactional Metrics tableprovide real time metrics for ActiveForecasts. This data is used in theHistorical Forecast Subject Area to displayreal time metrics for Active Forecasts.
Sales - Historical Pipeline
Historical Revenue Facts
Generate Sales Historical Snapshots Captures a daily snapshot of opportunityand revenue data.
User System Usage Sales - CRM ResourceSystem Usage
Fact - CRM - Resource Session Activity
Refresh BI Reports Audit Data for UserAdoption Reporting
Summarizes and aggregates data usedfor user adoption reporting. Profile optionFND_TRACK_USER_ACTIVITY must be setto "ENABLED".
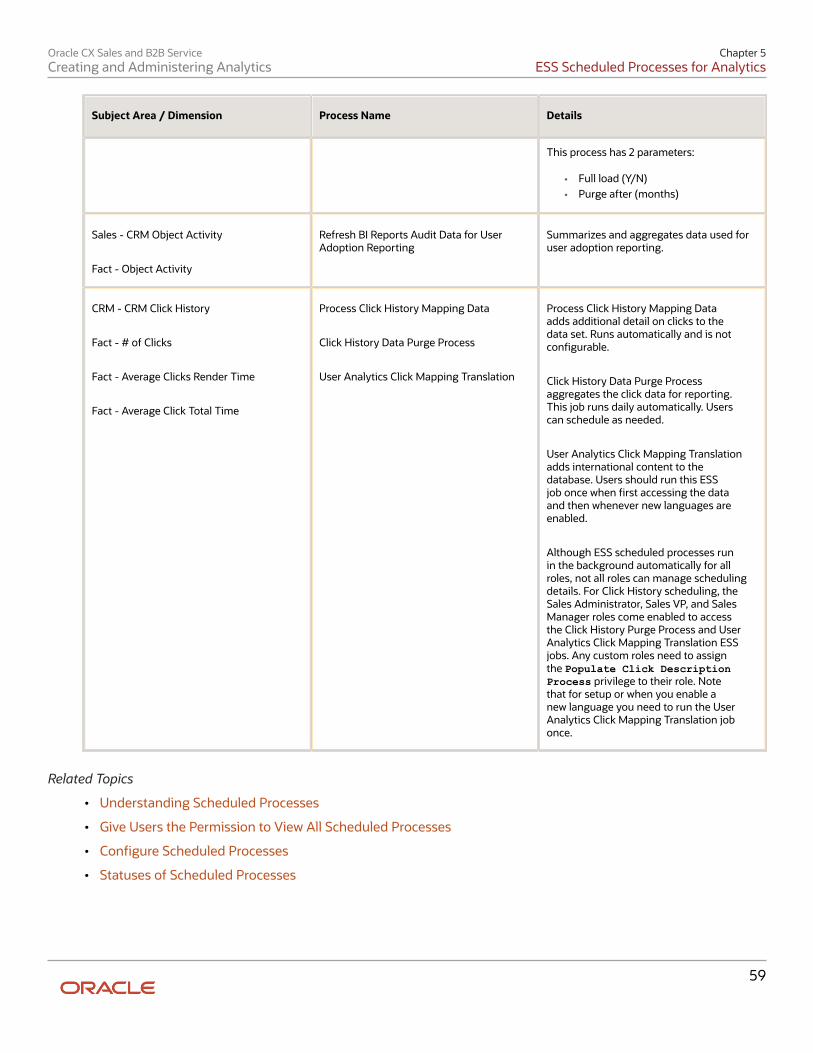
Oracle CX Sales and B2B ServiceCreating and Administering Analytics
Chapter 5ESS Scheduled Processes for Analytics
59
Subject Area / Dimension Process Name Details
This process has 2 parameters:
• Full load (Y/N)• Purge after (months)
Sales - CRM Object Activity
Fact - Object Activity
Refresh BI Reports Audit Data for UserAdoption Reporting
Summarizes and aggregates data used foruser adoption reporting.
CRM - CRM Click History
Fact - # of Clicks
Fact - Average Clicks Render Time
Fact - Average Click Total Time
Process Click History Mapping Data
Click History Data Purge Process
User Analytics Click Mapping Translation
Process Click History Mapping Dataadds additional detail on clicks to thedata set. Runs automatically and is notconfigurable.
Click History Data Purge Processaggregates the click data for reporting.This job runs daily automatically. Userscan schedule as needed.
User Analytics Click Mapping Translationadds international content to thedatabase. Users should run this ESSjob once when first accessing the dataand then whenever new languages areenabled.
Although ESS scheduled processes runin the background automatically for allroles, not all roles can manage schedulingdetails. For Click History scheduling, theSales Administrator, Sales VP, and SalesManager roles come enabled to accessthe Click History Purge Process and UserAnalytics Click Mapping Translation ESSjobs. Any custom roles need to assignthe Populate Click DescriptionProcess privilege to their role. Notethat for setup or when you enable anew language you need to run the UserAnalytics Click Mapping Translation jobonce.
Related Topics
• Understanding Scheduled Processes
• Give Users the Permission to View All Scheduled Processes
• Configure Scheduled Processes
• Statuses of Scheduled Processes
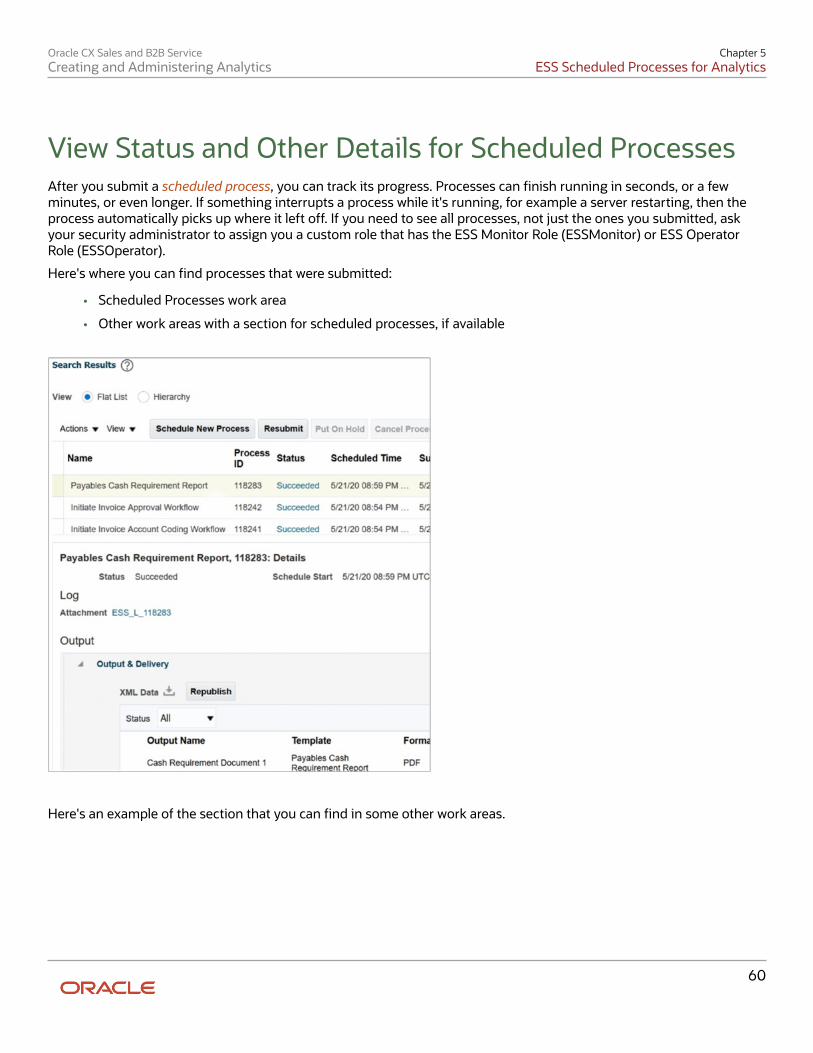
Oracle CX Sales and B2B ServiceCreating and Administering Analytics
Chapter 5ESS Scheduled Processes for Analytics
60
View Status and Other Details for Scheduled ProcessesAfter you submit a scheduled process, you can track its progress. Processes can finish running in seconds, or a fewminutes, or even longer. If something interrupts a process while it's running, for example a server restarting, then theprocess automatically picks up where it left off. If you need to see all processes, not just the ones you submitted, askyour security administrator to assign you a custom role that has the ESS Monitor Role (ESSMonitor) or ESS OperatorRole (ESSOperator).
Here's where you can find processes that were submitted:
• Scheduled Processes work area
• Other work areas with a section for scheduled processes, if available
Here's an example of the section that you can find in some other work areas.
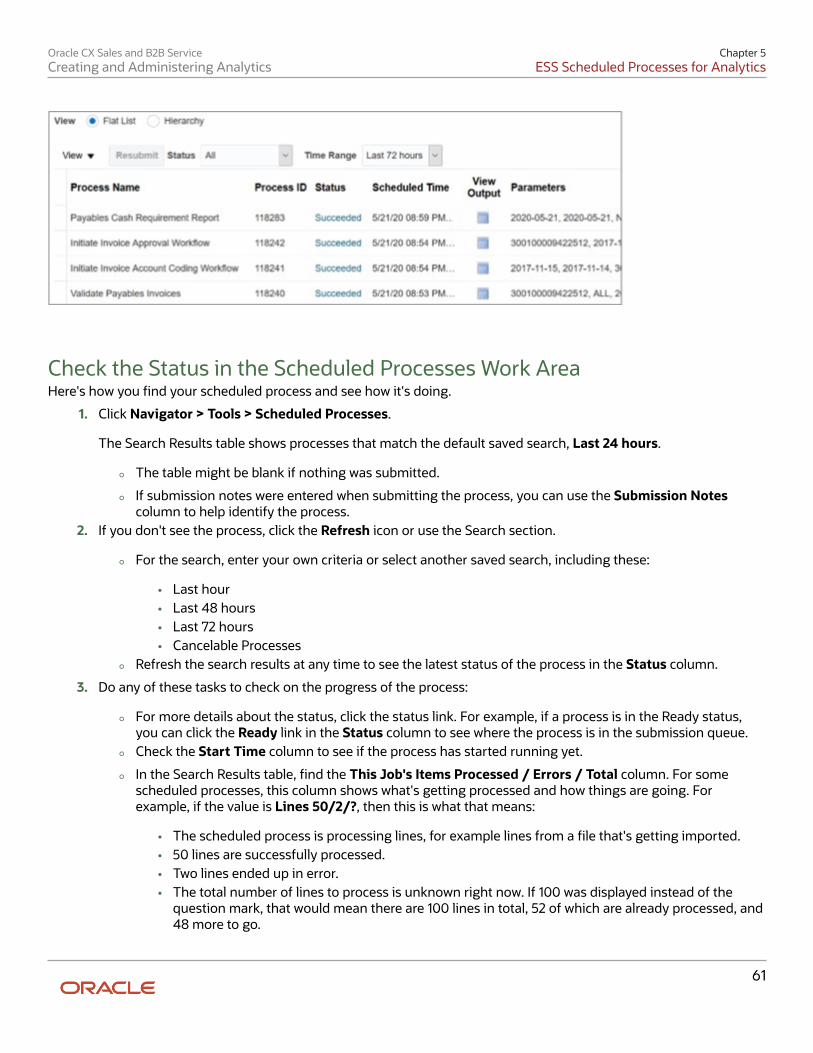
Oracle CX Sales and B2B ServiceCreating and Administering Analytics
Chapter 5ESS Scheduled Processes for Analytics
61
Check the Status in the Scheduled Processes Work AreaHere's how you find your scheduled process and see how it's doing.
1. Click Navigator > Tools > Scheduled Processes.
The Search Results table shows processes that match the default saved search, Last 24 hours.
◦ The table might be blank if nothing was submitted.
◦ If submission notes were entered when submitting the process, you can use the Submission Notescolumn to help identify the process.
2. If you don't see the process, click the Refresh icon or use the Search section.
◦ For the search, enter your own criteria or select another saved search, including these:
• Last hour• Last 48 hours• Last 72 hours• Cancelable Processes
◦ Refresh the search results at any time to see the latest status of the process in the Status column.
3. Do any of these tasks to check on the progress of the process:
◦ For more details about the status, click the status link. For example, if a process is in the Ready status,you can click the Ready link in the Status column to see where the process is in the submission queue.
◦ Check the Start Time column to see if the process has started running yet.
◦ In the Search Results table, find the This Job's Items Processed / Errors / Total column. For somescheduled processes, this column shows what's getting processed and how things are going. Forexample, if the value is Lines 50/2/?, then this is what that means:
• The scheduled process is processing lines, for example lines from a file that's getting imported.• 50 lines are successfully processed.• Two lines ended up in error.• The total number of lines to process is unknown right now. If 100 was displayed instead of the
question mark, that would mean there are 100 lines in total, 52 of which are already processed, and48 more to go.

Oracle CX Sales and B2B ServiceCreating and Administering Analytics
Chapter 5ESS Scheduled Processes for Analytics
62
Even after the scheduled process reaches a final state, the first two numbers might not add up to thetotal, for many reasons. For example, if you cancel the process before it's done, then not all items gotprocessed. Or, you have set a process parameter to end the process if at least 50% of the items gettingprocessed ends in error. In which case, the scheduled process itself could still successfully end, but noteverything was actually processed.
◦ Click the View Log button, especially if your process has a blank This Job's Items Processed / Errors /Total column. The type of information in the log varies, depending on the process. You can open the logfrom here only for if the process is currently running. When the process is done, you might want to alsotake a look at the final log, if any, from the Details section.
View Other Details in the Scheduled Processes Work AreaTo get more information about a scheduled process, select it in the Search Results table and see the Details section thatappears after the table. These are some of the details you might find:
• Completion text, which is automatically generated when the process reaches a final state. What you seedepends on the process. For example, it might say that the process finished 1792 records in less than a second.
• The log attachment, for example for details about why the process ended in error.
• Report output that the process generated, if any.
• Parameters for the scheduled process.
◦ Open the Parameter Names with Values subsection to see the parameters from the Process Details dialogbox and the values that were entered when the process was submitted.
◦ Use the All Parameter Values subsection for troubleshooting purposes, if you need to see the parametersand values in their actual, technical format. This subsection might have more parameters. For example,some processes run with additional parameter values that are derived from the parameter values youentered when you submitted the process.
Monitor Scheduled Processes in Other Work AreasSome work areas have a section where you can monitor the scheduled processes that were already submitted.
1. Go to the section if it's available, usually on the landing page of the work area.2. Click the Refresh icon if you don't see any processes or need to see the latest status.
◦ If you still don't see the process you're looking for, try changing the filters. If that doesn't help, use theScheduled Processes work area instead.
◦ If submission notes were entered when submitting the process, you can use the Submission Notescolumn to help identify the process.
3. Do either of these things to check on the progress of the process:
◦ For more details about the status, click the status link. For example, if a process is in the Ready status,you can click the Ready link in the Status column to see where the process is in the submission queue.
◦ Check the Start Time column to see if the process has started running yet. If it has, you can click the linkin the View Log column to get information about how the process is running.
Related Topics
• Statuses of Scheduled Processes
• Why are scheduled processes shown in a hierarchy
• Resubmit Scheduled Processes and Process Sets
Oracle CX Sales and B2B ServiceCreating and Administering Analytics
Chapter 5ESS Scheduled Processes for Analytics
63
View Output from Scheduled ProcessesOther than processing records, some scheduled processes also give you output. When you submit the process, you canselect the output layout and format, and set other output options. In the Scheduled Processes work area, you can viewthe output and even republish it in a different format without resubmitting the process. You might be able to see theoutput from other work areas too.
When You're In the Scheduled Processes Work AreaHere's what you do:
1. Click Navigator > Tools > Scheduled Process.2. Find your scheduled process and, if you need to, refresh the search results to see the latest status.3. Select the scheduled process.4. Go to the Output subsection in the Details section.5. Click the link in the Output Name column to view or download the output, which you can then print.6. To view or export the output in a different format:
a. Click the Republish button.b. Click the Actions icon.c. Select Export, and then select a format.
Tip: If you want the Data format, you can just click the XML Data icon instead.
When You're In Other Work AreasSome other work areas have a section, usually on the landing page of the work area, where you can monitor thescheduled processes that were already submitted. In the table there, find your process and click the Output icon in theView Output column.
Cancel or Make Changes to Scheduled ProcessesLife is full of second chances! After a schedule process is submitted, you can still cancel it or make other changes inthe Scheduled Processes work area. What you can do to the process depends on its status. Also, depending on whatyou have access to, you can even work on processes that someone else submitted. If you need to cancel processes thatsomeone else submitted, ask your security administrator to assign you a custom role that has the ESS AdministratorRole (ESSAdmin).
Make Changes to ProcessesSelect the scheduled process in the Search Results table.
• If the process hasn't started running yet, you can still use the Actions menu to change the schedule or output.
◦ Edit Schedule: Change the submission schedule, for example to submit it biweekly instead of weekly.
Oracle CX Sales and B2B ServiceCreating and Administering Analytics
Chapter 5ESS Scheduled Processes for Analytics
64
◦ Edit Output: If the process generates output, you can change output options, for example from HTMLformat to PDF.
• If the process is running, you can click Put On Hold to pause it, or Release Process so that a process that's onhold continues to run.
Cancel a ProcessSelect the scheduled process in the Search Results table, and click Cancel Process.
If you submitted a process to run on a schedule, for example once a day, you can cancel the scheduled runs evenif some of the runs already happened. Find the original submission, the row with the process ID you got when yousubmitted the process. The status should be Wait. When you cancel this original submission, you cancel any current andfuture runs based on the schedule you had set.
Sometimes it takes a while for a process to finish canceling. So, you can use the Actions menu to end it. The option youget depends on the process.
• Hard Cancel: To end the process shortly after you canceled it, without waiting for the cancellation to finish byitself.
• Force Cancel: To end a process that has been canceling for over 30 minutes but isn't done yet.
Some processes run on a remote server. When you click Force Cancel, even though the status is changed to Canceled,the process might still be running on the remote server. With the scheduled process still selected in the Search Resultstable, you check the status of the remote process in the Details section that appears after the table. The Remote Statusfield might display any of these statuses for the remote process (not for your scheduled process):
• Completed Successfully: The remote process was successfully canceled within the 30 minute grace period.
• Running/Unknown: Your scheduled process is in a Canceled state, but the remote process is still running.
• Terminated: Your scheduled process is in a Canceled state, and the remote process is successfully canceledafter the 30 minute grace period.
Cancel Processes in BulkYou can cancel up to 100 processes at once, as long as the processes haven't reached a final state.
1. Click Navigator > Tools > Scheduled Processes.2. In the Search section, select Cancelable Processes from the Saved Search list.3. Make sure that what you get in the Search Results table meets these requirements:
◦ No more than 100 processes
◦ Only processes with a cancelable status:
• Wait• Ready• Running• Completed• Blocked• Hold• Paused• Pending Validation• Schedule Ended
Oracle CX Sales and B2B ServiceCreating and Administering Analytics
Chapter 5ESS Scheduled Processes for Analytics
65
• Error Auto-Retry4. Use the Search section to change your search results, if you need to.5. Select Cancel Processes in Bulk from the Actions menu.
Submit Scheduled Processes and Process SetsWatch video
Use the Scheduled Processes work area to run all the scheduled processes that you have access to, including processsets. You can also submit many processes from other work areas. Some of the processes that give you output are alsoreports that you can view from the Reports and Analytics work area or panel tab. You can find that panel tab in somework areas
It's quick to submit a scheduled process with the bare minimum steps. But there are many additional options you canset, for example, if you want to run the process on a schedule.
Select the Scheduled Process and Define ParametersHere's what you do:
1. Click Navigator > Tools > Scheduled Processes.2. On the Scheduled Processes Overview page, click Schedule New Process.3. Leave the type as Job, select the process that you want to submit, and click OK.4. In the Process Details dialog box, enter at least the required parameters, if any.
◦ Some processes have no parameters at all.
◦ Some parameters depend on other parameters. For example, date range parameters might appear onlyafter you select By Date for another parameter.
5. Click the Advanced button if you want to define the schedule, notifications, or output. Continue to the nextsteps. Or, just skip to the steps for finishing the submission, to run the process once as soon as possible withthe default output.
Define the ScheduleSet up a schedule to run the process on a recurring basis or at a specific time. Use the Process Details dialog box inAdvanced mode.
1. Open the Schedule tab and select Using a schedule for the Run option.2. Select a frequency.
◦ Select User-Defined if you want to enter the exact dates and times to run the process.
◦ You can select Use a Saved Schedule to use an existing schedule, if there are any.
3. Depending on the frequency, define when the process should run.
Some processes can't be run more often than a certain frequency, for example more than every 10 minutes. But thereare some situations where that validation doesn't apply, for example, when different users run that same process lessthan 10 minutes apart. Or, if you use a saved schedule that has an individual run in addition to the regular frequency, forexample a schedule that runs every 10 minutes and once at five minutes after the first run.
Oracle CX Sales and B2B ServiceCreating and Administering Analytics
Chapter 5ESS Scheduled Processes for Analytics
66
Define the OutputYou can choose the layout, format, and destination for your output. Use the Process Details dialog box in Advancedmode.
1. Open the Output tab, if available.2. Click Add Output Document.3. Change the name if you want. The name identifies this output document when you go to view output later.4. Select a layout if you have more than one to choose from.5. Select a format, for example one of these:
◦ PDF: Is the best option if you want to print the output.
◦ Excel: Supports embedded images, such as charts and logos, but can be opened only in Excel 2003 orhigher.
◦ Data: Gives you report data in an XML file, which is used mainly for editing the report layout.6. Click Add Destination to send the output somewhere, for example to a printer or email address. You can add
many destinations and send the output to all of them at the same time.
Tip: You can also print the output as part of the steps for finishing the submission, instead ofadding a printer destination here.
7. To add more output documents, repeat steps 2 to 6.
Set Up NotificationsYou can have notifications sent out depending on how the process ends. Use the Process Details dialog box in Advancedmode to set that up.
1. Open the Notification tab.2. Click Create Notification.3. In the Recipient field, enter the user ID of the person you want to send the notification to.4. In the Condition list, select when to send the notification, for example when the process ends in error.5. Click OK.6. To send notifications to more people, repeat steps 2 to 5.
Finish the SubmissionFollow these steps in the Process Details dialog box:
1. Click the Process Options button if you want to define settings that affect the data to be processed.2. If the process gives you output and you want to print it, select the Print output check box and a printer.3. Select the Notify me when this process ends check box if you want to get an email notification.4. Enter submission notes to capture any information you want to associate with this submission. You can use
your notes to find this submission later.5. Click Submit.6. Click OK to confirm.
Tip: Note down the process ID for your submission so you can easily find it later. For example, let'ssay you set the process to run once a week. If you later want to cancel all runs on this schedule, youneed to cancel this original submission with the process ID you see.
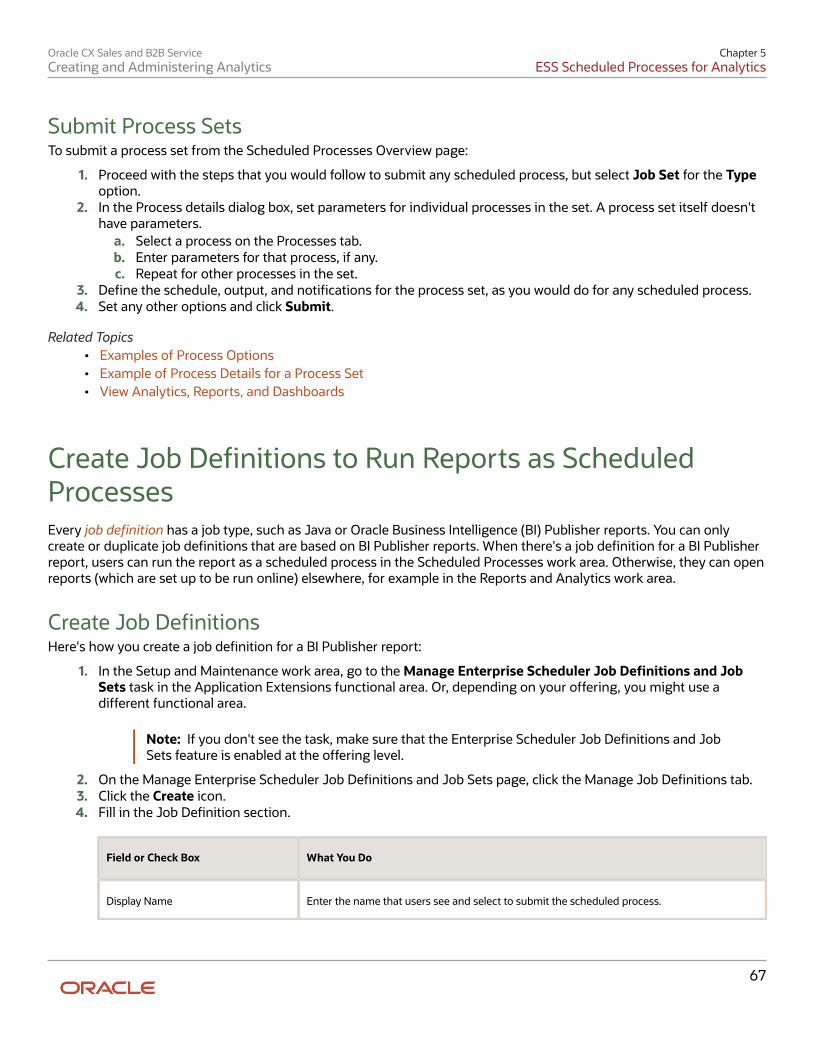
Oracle CX Sales and B2B ServiceCreating and Administering Analytics
Chapter 5ESS Scheduled Processes for Analytics
67
Submit Process SetsTo submit a process set from the Scheduled Processes Overview page:
1. Proceed with the steps that you would follow to submit any scheduled process, but select Job Set for the Typeoption.
2. In the Process details dialog box, set parameters for individual processes in the set. A process set itself doesn'thave parameters.
a. Select a process on the Processes tab.b. Enter parameters for that process, if any.c. Repeat for other processes in the set.
3. Define the schedule, output, and notifications for the process set, as you would do for any scheduled process.4. Set any other options and click Submit.
Related Topics• Examples of Process Options• Example of Process Details for a Process Set• View Analytics, Reports, and Dashboards
Create Job Definitions to Run Reports as ScheduledProcessesEvery job definition has a job type, such as Java or Oracle Business Intelligence (BI) Publisher reports. You can onlycreate or duplicate job definitions that are based on BI Publisher reports. When there's a job definition for a BI Publisherreport, users can run the report as a scheduled process in the Scheduled Processes work area. Otherwise, they can openreports (which are set up to be run online) elsewhere, for example in the Reports and Analytics work area.
Create Job DefinitionsHere's how you create a job definition for a BI Publisher report:
1. In the Setup and Maintenance work area, go to the Manage Enterprise Scheduler Job Definitions and JobSets task in the Application Extensions functional area. Or, depending on your offering, you might use adifferent functional area.
Note: If you don't see the task, make sure that the Enterprise Scheduler Job Definitions and JobSets feature is enabled at the offering level.
2. On the Manage Enterprise Scheduler Job Definitions and Job Sets page, click the Manage Job Definitions tab.3. Click the Create icon.4. Fill in the Job Definition section.
Field or Check Box What You Do
Display Name Enter the name that users see and select to submit the scheduled process.
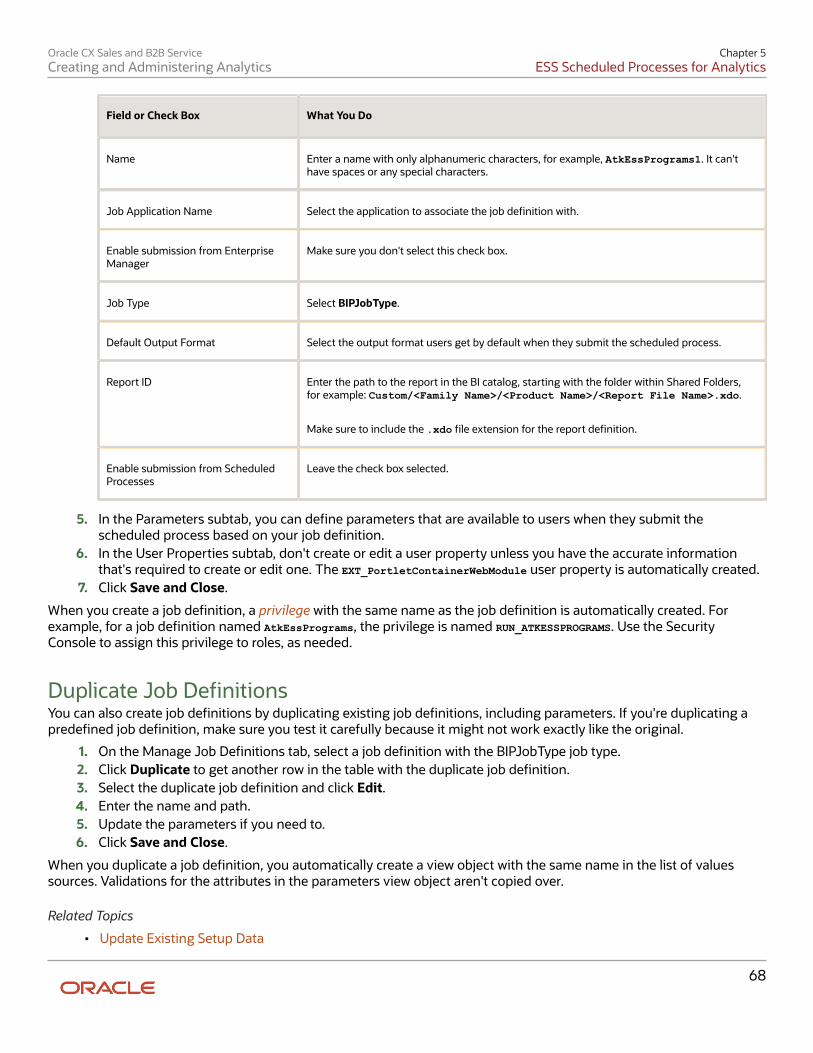
Oracle CX Sales and B2B ServiceCreating and Administering Analytics
Chapter 5ESS Scheduled Processes for Analytics
68
Field or Check Box What You Do
Name Enter a name with only alphanumeric characters, for example, AtkEssPrograms1. It can'thave spaces or any special characters.
Job Application Name Select the application to associate the job definition with.
Enable submission from EnterpriseManager
Make sure you don't select this check box.
Job Type Select BIPJobType.
Default Output Format Select the output format users get by default when they submit the scheduled process.
Report ID Enter the path to the report in the BI catalog, starting with the folder within Shared Folders,for example: Custom/<Family Name>/<Product Name>/<Report File Name>.xdo.
Make sure to include the .xdo file extension for the report definition.
Enable submission from ScheduledProcesses
Leave the check box selected.
5. In the Parameters subtab, you can define parameters that are available to users when they submit thescheduled process based on your job definition.
6. In the User Properties subtab, don't create or edit a user property unless you have the accurate informationthat's required to create or edit one. The EXT_PortletContainerWebModule user property is automatically created.
7. Click Save and Close.
When you create a job definition, a privilege with the same name as the job definition is automatically created. Forexample, for a job definition named AtkEssPrograms, the privilege is named RUN_ATKESSPROGRAMS. Use the SecurityConsole to assign this privilege to roles, as needed.
Duplicate Job DefinitionsYou can also create job definitions by duplicating existing job definitions, including parameters. If you're duplicating apredefined job definition, make sure you test it carefully because it might not work exactly like the original.
1. On the Manage Job Definitions tab, select a job definition with the BIPJobType job type.2. Click Duplicate to get another row in the table with the duplicate job definition.3. Select the duplicate job definition and click Edit.4. Enter the name and path.5. Update the parameters if you need to.6. Click Save and Close.
When you duplicate a job definition, you automatically create a view object with the same name in the list of valuessources. Validations for the attributes in the parameters view object aren't copied over.
Related Topics
• Update Existing Setup Data
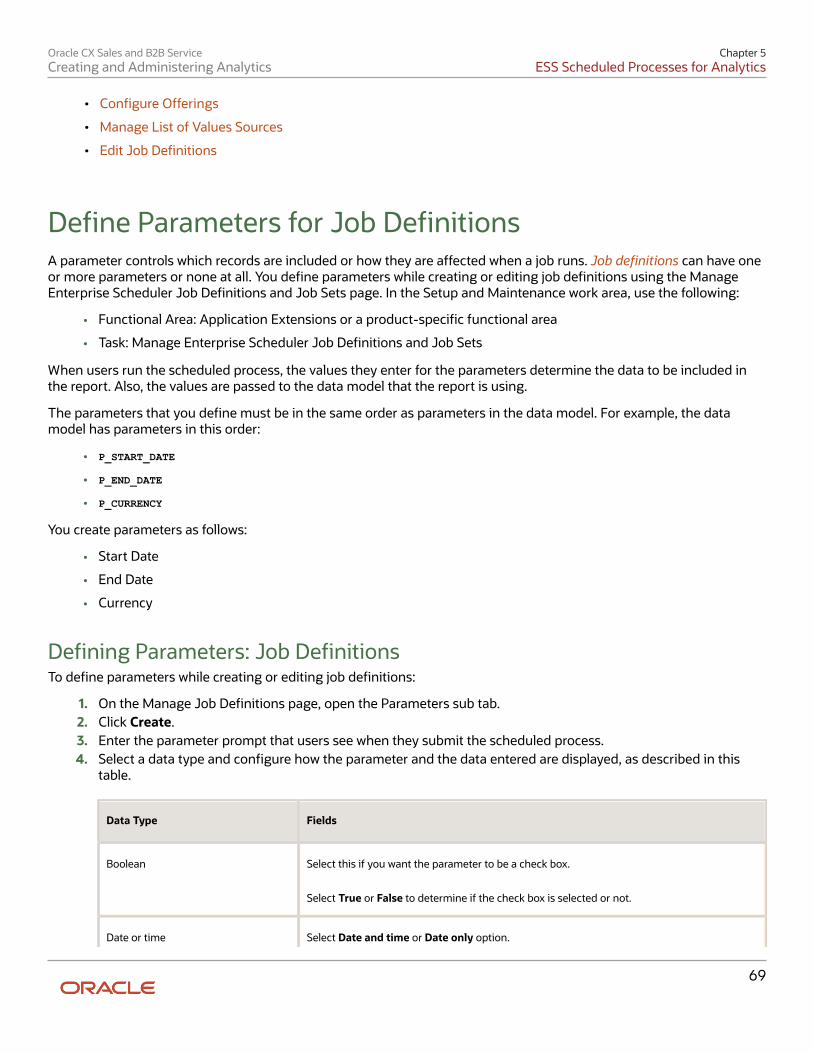
Oracle CX Sales and B2B ServiceCreating and Administering Analytics
Chapter 5ESS Scheduled Processes for Analytics
69
• Configure Offerings
• Manage List of Values Sources
• Edit Job Definitions
Define Parameters for Job DefinitionsA parameter controls which records are included or how they are affected when a job runs. Job definitions can have oneor more parameters or none at all. You define parameters while creating or editing job definitions using the ManageEnterprise Scheduler Job Definitions and Job Sets page. In the Setup and Maintenance work area, use the following:
• Functional Area: Application Extensions or a product-specific functional area
• Task: Manage Enterprise Scheduler Job Definitions and Job Sets
When users run the scheduled process, the values they enter for the parameters determine the data to be included inthe report. Also, the values are passed to the data model that the report is using.
The parameters that you define must be in the same order as parameters in the data model. For example, the datamodel has parameters in this order:
• P_START_DATE
• P_END_DATE
• P_CURRENCY
You create parameters as follows:
• Start Date
• End Date
• Currency
Defining Parameters: Job DefinitionsTo define parameters while creating or editing job definitions:
1. On the Manage Job Definitions page, open the Parameters sub tab.2. Click Create.3. Enter the parameter prompt that users see when they submit the scheduled process.4. Select a data type and configure how the parameter and the data entered are displayed, as described in this
table.
Data Type Fields
Boolean Select this if you want the parameter to be a check box.
Select True or False to determine if the check box is selected or not.
Date or time Select Date and time or Date only option.
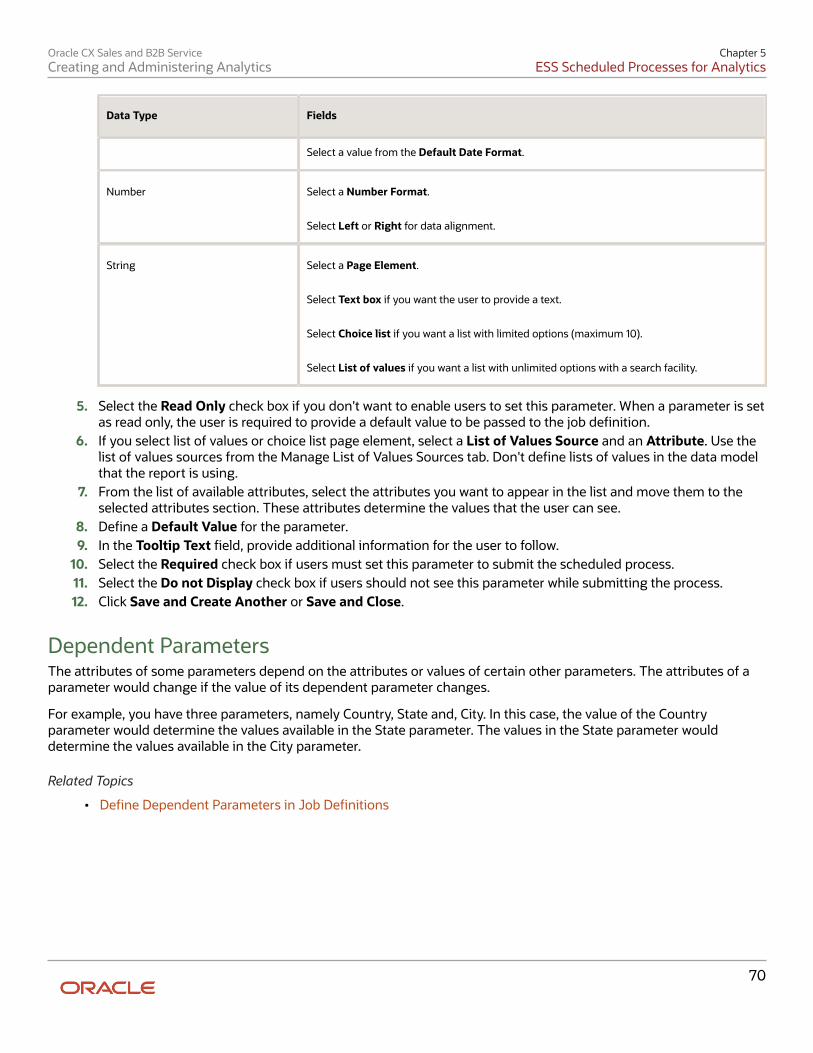
Oracle CX Sales and B2B ServiceCreating and Administering Analytics
Chapter 5ESS Scheduled Processes for Analytics
70
Data Type Fields
Select a value from the Default Date Format.
Number Select a Number Format.
Select Left or Right for data alignment.
String Select a Page Element.
Select Text box if you want the user to provide a text.
Select Choice list if you want a list with limited options (maximum 10).
Select List of values if you want a list with unlimited options with a search facility.
5. Select the Read Only check box if you don't want to enable users to set this parameter. When a parameter is setas read only, the user is required to provide a default value to be passed to the job definition.
6. If you select list of values or choice list page element, select a List of Values Source and an Attribute. Use thelist of values sources from the Manage List of Values Sources tab. Don't define lists of values in the data modelthat the report is using.
7. From the list of available attributes, select the attributes you want to appear in the list and move them to theselected attributes section. These attributes determine the values that the user can see.
8. Define a Default Value for the parameter.9. In the Tooltip Text field, provide additional information for the user to follow.
10. Select the Required check box if users must set this parameter to submit the scheduled process.11. Select the Do not Display check box if users should not see this parameter while submitting the process.12. Click Save and Create Another or Save and Close.
Dependent ParametersThe attributes of some parameters depend on the attributes or values of certain other parameters. The attributes of aparameter would change if the value of its dependent parameter changes.
For example, you have three parameters, namely Country, State and, City. In this case, the value of the Countryparameter would determine the values available in the State parameter. The values in the State parameter woulddetermine the values available in the City parameter.
Related Topics
• Define Dependent Parameters in Job Definitions
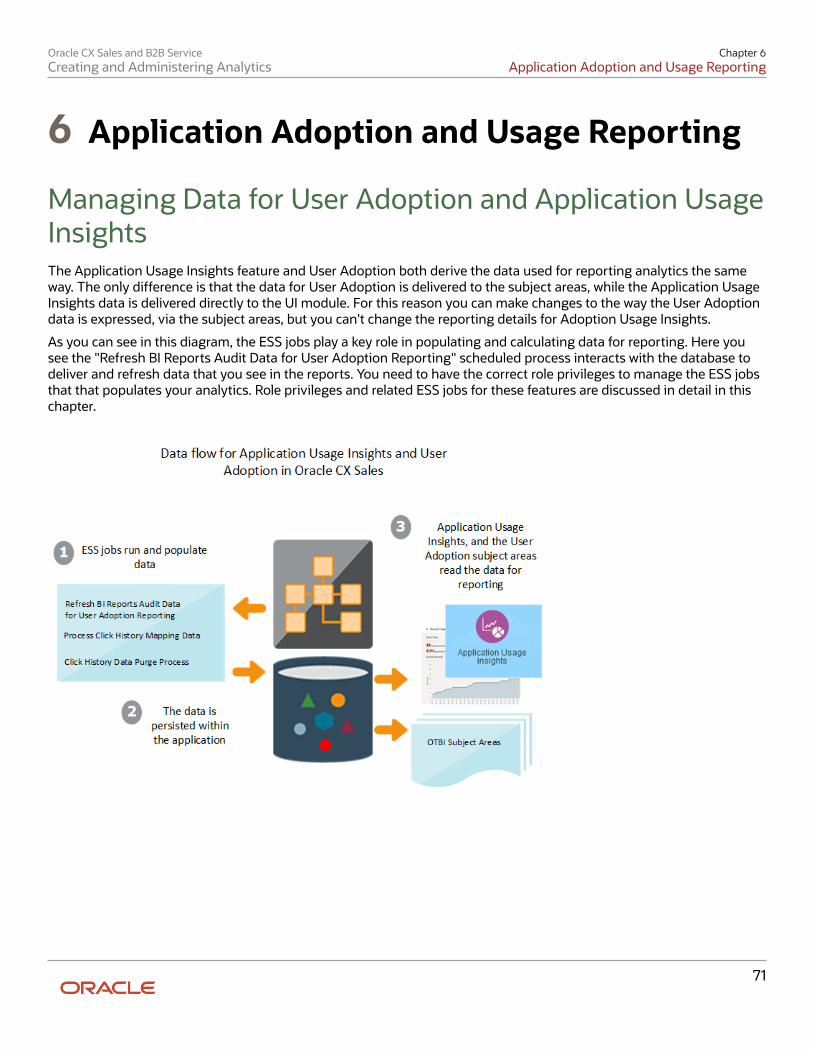
Oracle CX Sales and B2B ServiceCreating and Administering Analytics
Chapter 6Application Adoption and Usage Reporting
71
6 Application Adoption and Usage Reporting
Managing Data for User Adoption and Application UsageInsightsThe Application Usage Insights feature and User Adoption both derive the data used for reporting analytics the sameway. The only difference is that the data for User Adoption is delivered to the subject areas, while the Application UsageInsights data is delivered directly to the UI module. For this reason you can make changes to the way the User Adoptiondata is expressed, via the subject areas, but you can't change the reporting details for Adoption Usage Insights.
As you can see in this diagram, the ESS jobs play a key role in populating and calculating data for reporting. Here yousee the "Refresh BI Reports Audit Data for User Adoption Reporting" scheduled process interacts with the database todeliver and refresh data that you see in the reports. You need to have the correct role privileges to manage the ESS jobsthat that populates your analytics. Role privileges and related ESS jobs for these features are discussed in detail in thischapter.
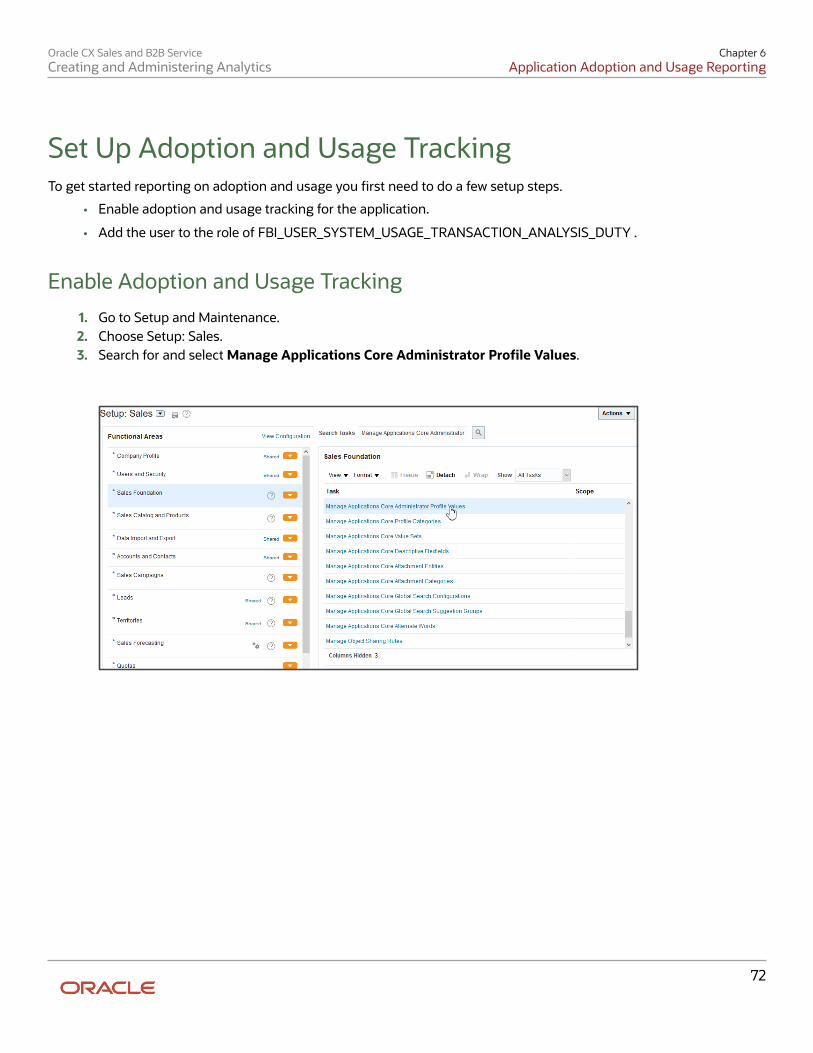
Oracle CX Sales and B2B ServiceCreating and Administering Analytics
Chapter 6Application Adoption and Usage Reporting
72
Set Up Adoption and Usage TrackingTo get started reporting on adoption and usage you first need to do a few setup steps.
• Enable adoption and usage tracking for the application.
• Add the user to the role of FBI_USER_SYSTEM_USAGE_TRANSACTION_ANALYSIS_DUTY .
Enable Adoption and Usage Tracking
1. Go to Setup and Maintenance.2. Choose Setup: Sales.3. Search for and select Manage Applications Core Administrator Profile Values.
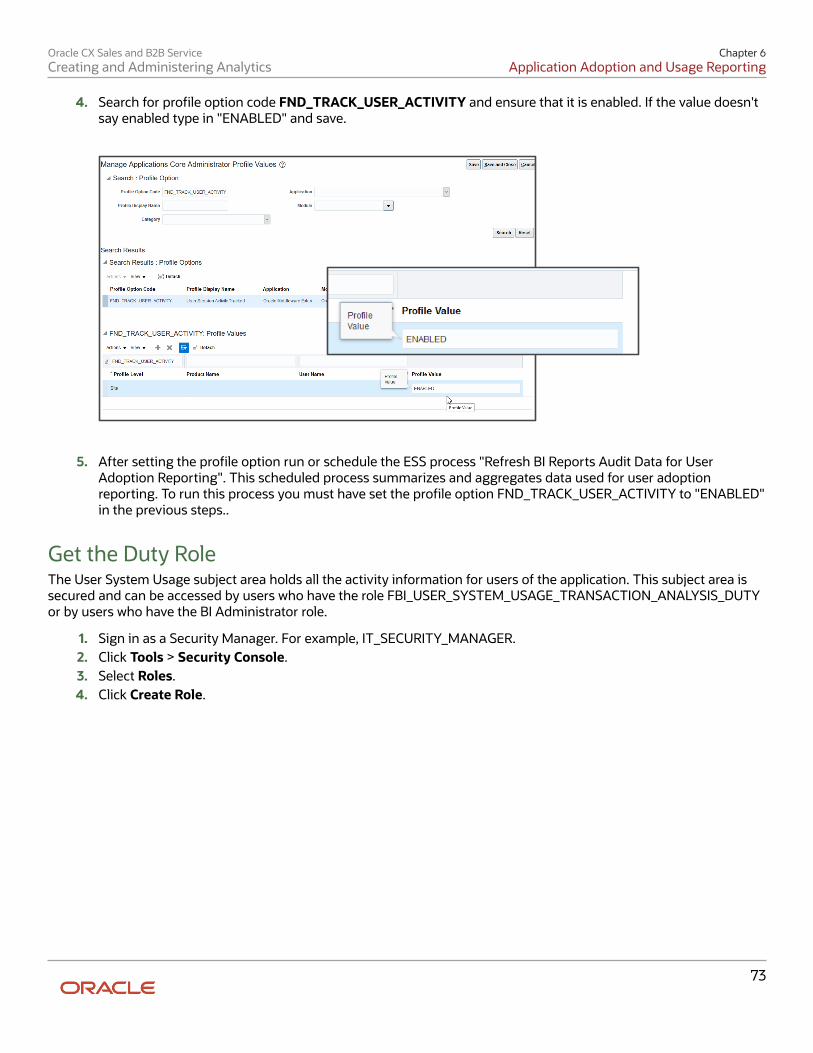
Oracle CX Sales and B2B ServiceCreating and Administering Analytics
Chapter 6Application Adoption and Usage Reporting
73
4. Search for profile option code FND_TRACK_USER_ACTIVITY and ensure that it is enabled. If the value doesn'tsay enabled type in "ENABLED" and save.
5. After setting the profile option run or schedule the ESS process "Refresh BI Reports Audit Data for UserAdoption Reporting". This scheduled process summarizes and aggregates data used for user adoptionreporting. To run this process you must have set the profile option FND_TRACK_USER_ACTIVITY to "ENABLED"in the previous steps..
Get the Duty RoleThe User System Usage subject area holds all the activity information for users of the application. This subject area issecured and can be accessed by users who have the role FBI_USER_SYSTEM_USAGE_TRANSACTION_ANALYSIS_DUTYor by users who have the BI Administrator role.
1. Sign in as a Security Manager. For example, IT_SECURITY_MANAGER.2. Click Tools > Security Console.3. Select Roles.4. Click Create Role.
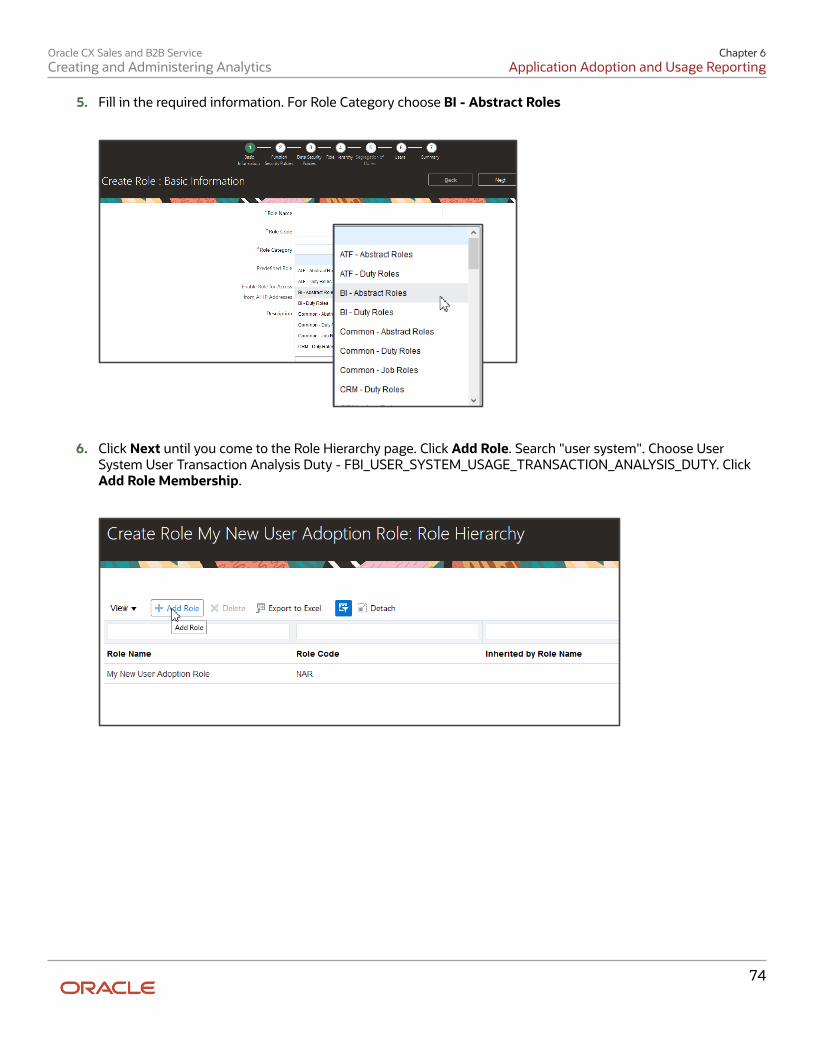
Oracle CX Sales and B2B ServiceCreating and Administering Analytics
Chapter 6Application Adoption and Usage Reporting
74
5. Fill in the required information. For Role Category choose BI - Abstract Roles
6. Click Next until you come to the Role Hierarchy page. Click Add Role. Search "user system". Choose UserSystem User Transaction Analysis Duty - FBI_USER_SYSTEM_USAGE_TRANSACTION_ANALYSIS_DUTY. ClickAdd Role Membership.
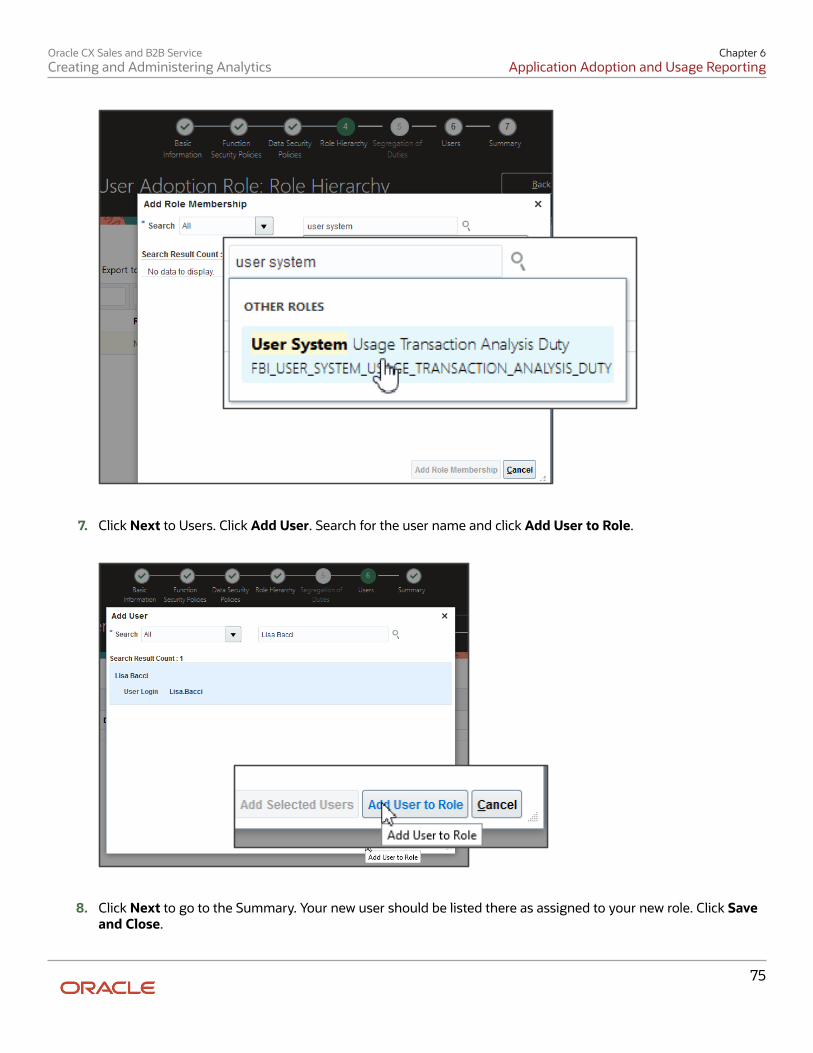
Oracle CX Sales and B2B ServiceCreating and Administering Analytics
Chapter 6Application Adoption and Usage Reporting
75
7. Click Next to Users. Click Add User. Search for the user name and click Add User to Role.
8. Click Next to go to the Summary. Your new user should be listed there as assigned to your new role. Click Saveand Close.
Oracle CX Sales and B2B ServiceCreating and Administering Analytics
Chapter 6Application Adoption and Usage Reporting
76
Subject Areas for Adoption and Usage ReportingReporting on CX sales application usage gives you analytic data to evaluate user activity in terms of logging in and outof the application, as well as what they are doing when they are logged in.
There are prebuilt reports that you can use as a starting point for user adoption. Use these as a template and modifythem to suite your business needs. Download the catalog at https://cloudcustomerconnect.oracle.com/files/d9dadc510e/UserAdoption.catalog. Note that to get the catalog you need to sign-up or sign-in to the site.
Here are some of the business benefits of user adoption analytics:
• See the relationship between being signed into the application and interaction with objects.
• Leverage usage patterns and behaviors from successful users as best practice guidelines for other users.
• Gain insight on usage and trends for potential future investment opportunities.
• Identify improvements that can increase adoption and usage.
Note: Adoption and usage reporting applies to CX sales and B2B service and does not apply to the BI application interms of reporting.
Adoption and Usage Subject AreasThere are five subject areas to use when you build application tracking analytics.
• Sales - CRM Resource System Usage: This subject area supports reporting on the interaction with theapplication by the user.
• Sales - CRM Object Activity: This subject area supports reporting on object activity metrics such as number ofrecords created and number of records updated.
• User System Usage: This subject area supports reporting on whether a user was active or not for a particularday, and what channel they used, and when they were active.
• CRM - CRM Click History: This subject area helps you understand individual, team, and organization usage inyour application: It gives you data on the most and least used flows and helps you discover usage patterns thatimpact adoption.
• CRM - CRM Reporting Usage: This subject area let's you see how much your users are looking at theiranalytics in OTBI. This subject area exposes metrics on usage for subject areas, analyses, and dashboards.
Application Usage Insights contains similar data provided in these subject areas. You can find the Application Insightsicon on the Sales home page. Or you can use the subject areas above to build your own application usage analytics.
Resource System UsageResource system usage reporting makes it possible for you to analyze many different aspects of user interaction withyour application such as:
• Adoption and usage from different channels over a period of time.
• User log-ins, sessions, and active days by channel, such as web, mobile, mail.
Here are some of the details on usage tracking values:
• An important metric used in this subject areas is # of Active Days.
Oracle CX Sales and B2B ServiceCreating and Administering Analytics
Chapter 6Application Adoption and Usage Reporting
77
• An Active Day is a day in which a user logged into CX Sales. It is not a count of log-ins by a user on a day: ifa user logs in once or more, it is considered an Active Day for that user. # of Active Days is helpful metric forunderstanding usage trends.
• The day value is based on the server time zone.
• Sessions can be reported for the web and mobile channels.
• Tracking differentiates between user activities made directly by the user, or through a proxy user.
• Two additional Metrics are used in these subject areas, they are # of Active Users/Resource and # of Users/Resource.
Object ActivityThe primary metrics used for object activity subject area is Insert Action Count and Update Action Count. Thesemetrics provide information on the number of records added, and the number of records updated. In addition thissubject area now supports reporting on object activity for the latest CX Sales mobile and Microsoft 365 applications.
Here is the information you can analyze using the object activity subject area:
• Track the type of object that was updated.
• Name of the employee who did the update.
• Manager of the employee that did the update.
• Number of records that were added.
• Number of records that were updated.
• Date the record update was made.
• Month the update report is produced.
User System UsageThis subject area provides information on user activities. Use this subject area to determine whether or not a user wasactive for a particular day, what channel they used, and when they were active.
Here is the information you can analyze using the User System Usage subject area:
• How is the user activity split across channels: web/mobile/email?
• Which department has the highest number of active users?
• User with which job titles are the most active?
• Who are the top 10 active users?
• Who are the users who have not logged into the application in the last week?
Click HistorySee the topic "Click History Subject Area".
CRM - CRM Reporting UsageThis subject area exposes metrics around reporting. There are dozens of analytics that come out of the box foryour users. You likely have many available for users to view in different interfaces. They might look at analyticsin infolets, they might look at dashboards that hold analytic detail, or they may have analytics on their Analytics
Oracle CX Sales and B2B ServiceCreating and Administering Analytics
Chapter 6Application Adoption and Usage Reporting
78
page. Whenever they view an analytic the application keeps track of that activity. The CRM - CRM ReportingSubject area pulls all that data together and makes it available for your reporting insights. Knowing which reportsare being used by your team helps you focus on what's important. You can use your valuable resources to buildon those analytics, and save resources by eliminating less used reporting tools. Like the other user adoptionsubject areas, this subject area also requires that users intending to access this subject area need to have duty roleFBI_USER_SYSTEM_USAGE_TRANSACTIONAL_DUTY.
Reporting GuidelinesSetting up the time parameters for user adoption reporting can be tricky. For best results follow these guidelines:
• To be sure the analytics you created in R12 work after you upgrade to 18A+, you should apply the # of ActiveDays > 0 filter.
• Add a filter for a specific year. The Resource User System Usage subject area shows usage for all Time Periodsand Users/Resources. This reporting method tracks when the user is actively using the application and themonths where there were no activities/system usage. For this reason you should define specific time filters.Without time filters, the report shows results for the complete 100 years Time dimension.
• Avoid reporting by date. Instead use Month or Quarter.
• Filter by group of users, instead of individual users.
• Apply a filter on the # of Active Days fact > than 0 to ensure the analytic shows positive reporting values.
Related Topics
• User adoption dashboard prebuilt reports catalog to download
• Reports and Analytics Resource Center
Configurations for User Adoption Reporting with OTBIThis table provides a list of the ESS jobs used to manage and refresh the data for User Adoption subject areas.
ESS Scheduled Process Name Details
Process Click History Mapping Data This process adds flow names to clicks; "stamps" the click information to the click informationfrom the logs. Both the Click area and Application Usage Insights use this data.
This job requires that use user have the privilege ofORA_ZCA_POPULATE_CLICK_DESCRIPTIONS_PRIV
This job runs automatically by the hour. Users can change the run schedule.
For 21C or earlier this process requires the profile option enabled for BI_CH_SA_ENABLED
After 21C this process runs automatically.
Click History Aggregation This process aggregates click history data older than 90 days. Both the Click History subjectarea and Application Usage Insights use this data.
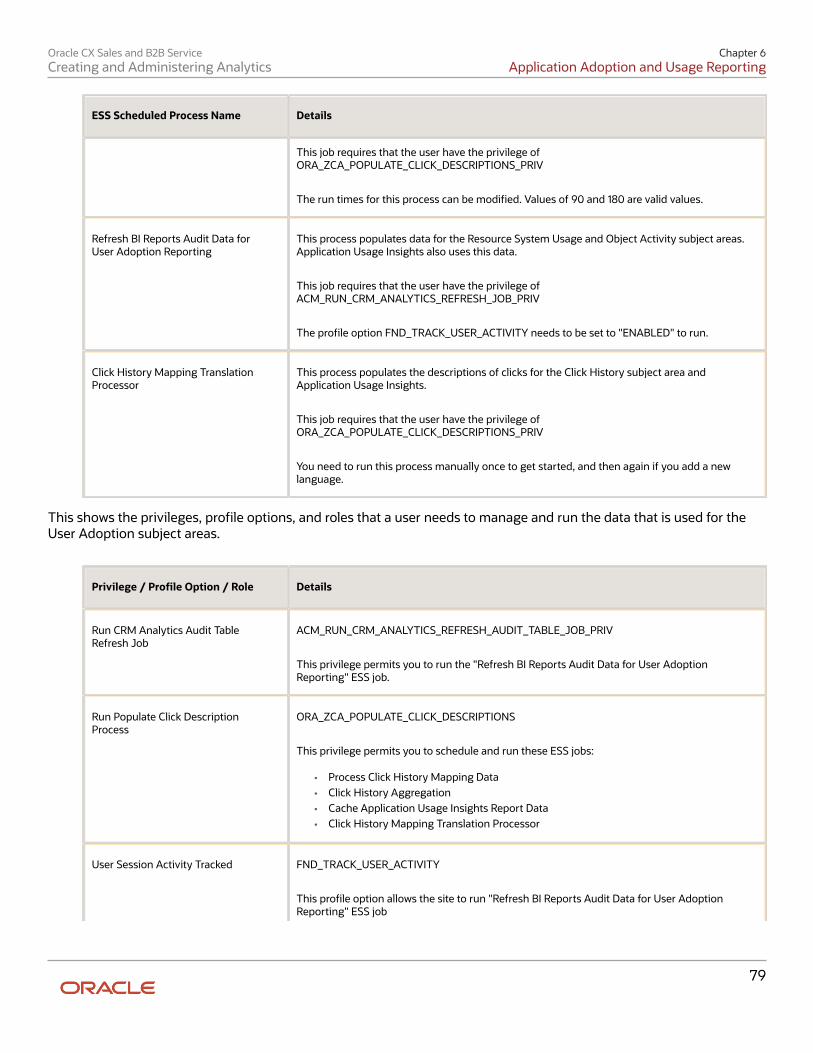
Oracle CX Sales and B2B ServiceCreating and Administering Analytics
Chapter 6Application Adoption and Usage Reporting
79
ESS Scheduled Process Name Details
This job requires that the user have the privilege ofORA_ZCA_POPULATE_CLICK_DESCRIPTIONS_PRIV
The run times for this process can be modified. Values of 90 and 180 are valid values.
Refresh BI Reports Audit Data forUser Adoption Reporting
This process populates data for the Resource System Usage and Object Activity subject areas.Application Usage Insights also uses this data.
This job requires that the user have the privilege ofACM_RUN_CRM_ANALYTICS_REFRESH_JOB_PRIV
The profile option FND_TRACK_USER_ACTIVITY needs to be set to "ENABLED" to run.
Click History Mapping TranslationProcessor
This process populates the descriptions of clicks for the Click History subject area andApplication Usage Insights.
This job requires that the user have the privilege ofORA_ZCA_POPULATE_CLICK_DESCRIPTIONS_PRIV
You need to run this process manually once to get started, and then again if you add a newlanguage.
This shows the privileges, profile options, and roles that a user needs to manage and run the data that is used for theUser Adoption subject areas.
Privilege / Profile Option / Role Details
Run CRM Analytics Audit TableRefresh Job
ACM_RUN_CRM_ANALYTICS_REFRESH_AUDIT_TABLE_JOB_PRIV
This privilege permits you to run the "Refresh BI Reports Audit Data for User AdoptionReporting" ESS job.
Run Populate Click DescriptionProcess
ORA_ZCA_POPULATE_CLICK_DESCRIPTIONS
This privilege permits you to schedule and run these ESS jobs:
• Process Click History Mapping Data• Click History Aggregation• Cache Application Usage Insights Report Data• Click History Mapping Translation Processor
User Session Activity Tracked FND_TRACK_USER_ACTIVITY
This profile option allows the site to run "Refresh BI Reports Audit Data for User AdoptionReporting" ESS job
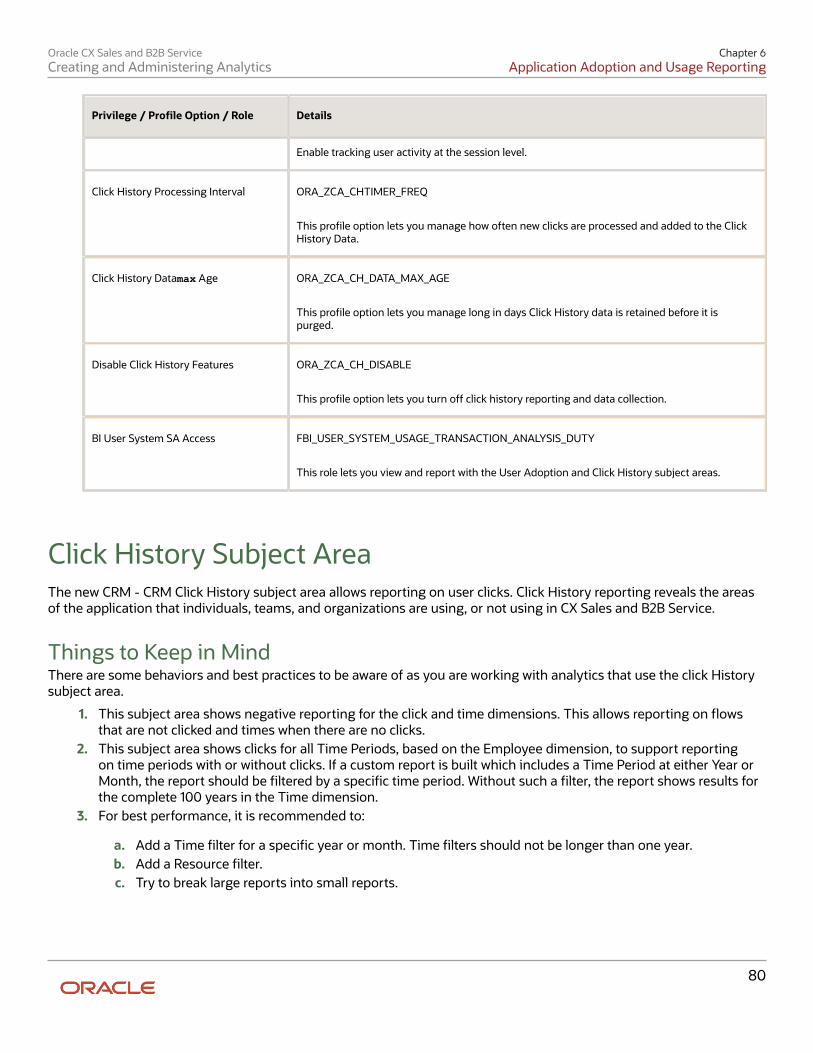
Oracle CX Sales and B2B ServiceCreating and Administering Analytics
Chapter 6Application Adoption and Usage Reporting
80
Privilege / Profile Option / Role Details
Enable tracking user activity at the session level.
Click History Processing Interval ORA_ZCA_CHTIMER_FREQ
This profile option lets you manage how often new clicks are processed and added to the ClickHistory Data.
Click History Datamax Age ORA_ZCA_CH_DATA_MAX_AGE
This profile option lets you manage long in days Click History data is retained before it ispurged.
Disable Click History Features ORA_ZCA_CH_DISABLE
This profile option lets you turn off click history reporting and data collection.
BI User System SA Access FBI_USER_SYSTEM_USAGE_TRANSACTION_ANALYSIS_DUTY
This role lets you view and report with the User Adoption and Click History subject areas.
Click History Subject AreaThe new CRM - CRM Click History subject area allows reporting on user clicks. Click History reporting reveals the areasof the application that individuals, teams, and organizations are using, or not using in CX Sales and B2B Service.
Things to Keep in MindThere are some behaviors and best practices to be aware of as you are working with analytics that use the click Historysubject area.
1. This subject area shows negative reporting for the click and time dimensions. This allows reporting on flowsthat are not clicked and times when there are no clicks.
2. This subject area shows clicks for all Time Periods, based on the Employee dimension, to support reportingon time periods with or without clicks. If a custom report is built which includes a Time Period at either Year orMonth, the report should be filtered by a specific time period. Without such a filter, the report shows results forthe complete 100 years in the Time dimension.
3. For best performance, it is recommended to:
a. Add a Time filter for a specific year or month. Time filters should not be longer than one year.b. Add a Resource filter.c. Try to break large reports into small reports.
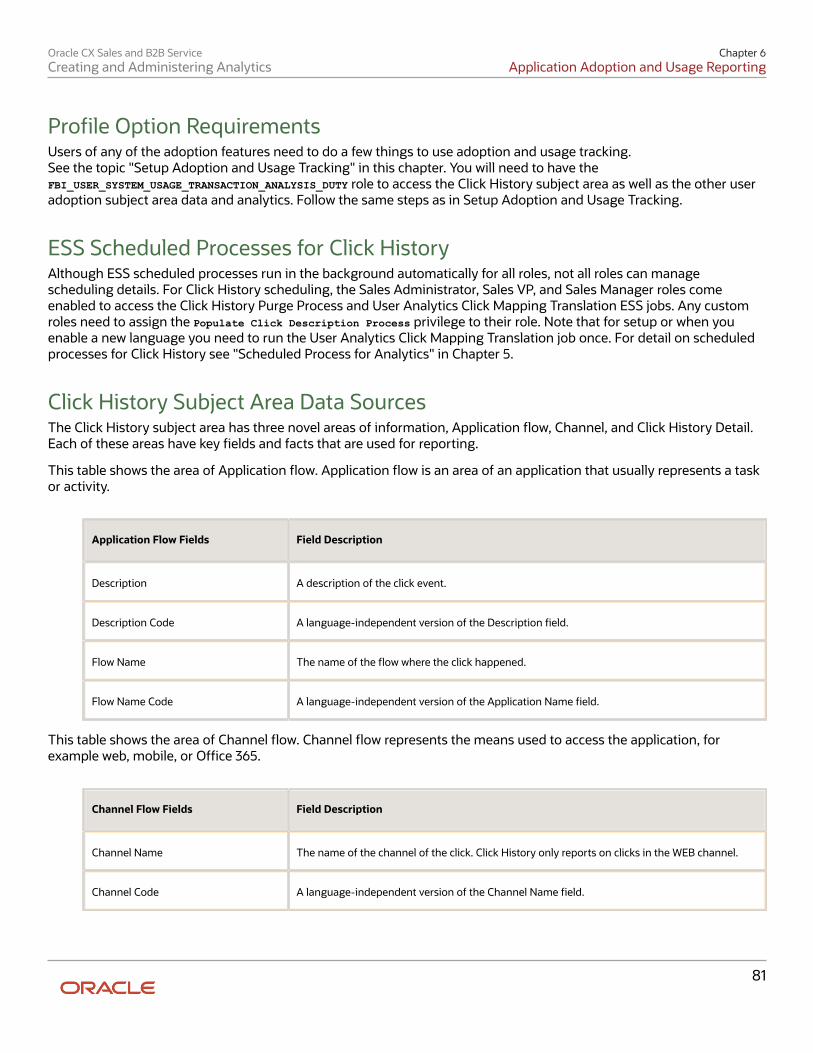
Oracle CX Sales and B2B ServiceCreating and Administering Analytics
Chapter 6Application Adoption and Usage Reporting
81
Profile Option RequirementsUsers of any of the adoption features need to do a few things to use adoption and usage tracking.See the topic "Setup Adoption and Usage Tracking" in this chapter. You will need to have theFBI_USER_SYSTEM_USAGE_TRANSACTION_ANALYSIS_DUTY role to access the Click History subject area as well as the other useradoption subject area data and analytics. Follow the same steps as in Setup Adoption and Usage Tracking.
ESS Scheduled Processes for Click HistoryAlthough ESS scheduled processes run in the background automatically for all roles, not all roles can managescheduling details. For Click History scheduling, the Sales Administrator, Sales VP, and Sales Manager roles comeenabled to access the Click History Purge Process and User Analytics Click Mapping Translation ESS jobs. Any customroles need to assign the Populate Click Description Process privilege to their role. Note that for setup or when youenable a new language you need to run the User Analytics Click Mapping Translation job once. For detail on scheduledprocesses for Click History see "Scheduled Process for Analytics" in Chapter 5.
Click History Subject Area Data SourcesThe Click History subject area has three novel areas of information, Application flow, Channel, and Click History Detail.Each of these areas have key fields and facts that are used for reporting.
This table shows the area of Application flow. Application flow is an area of an application that usually represents a taskor activity.
Application Flow Fields Field Description
Description A description of the click event.
Description Code A language-independent version of the Description field.
Flow Name The name of the flow where the click happened.
Flow Name Code A language-independent version of the Application Name field.
This table shows the area of Channel flow. Channel flow represents the means used to access the application, forexample web, mobile, or Office 365.
Channel Flow Fields Field Description
Channel Name The name of the channel of the click. Click History only reports on clicks in the WEB channel.
Channel Code A language-independent version of the Channel Name field.
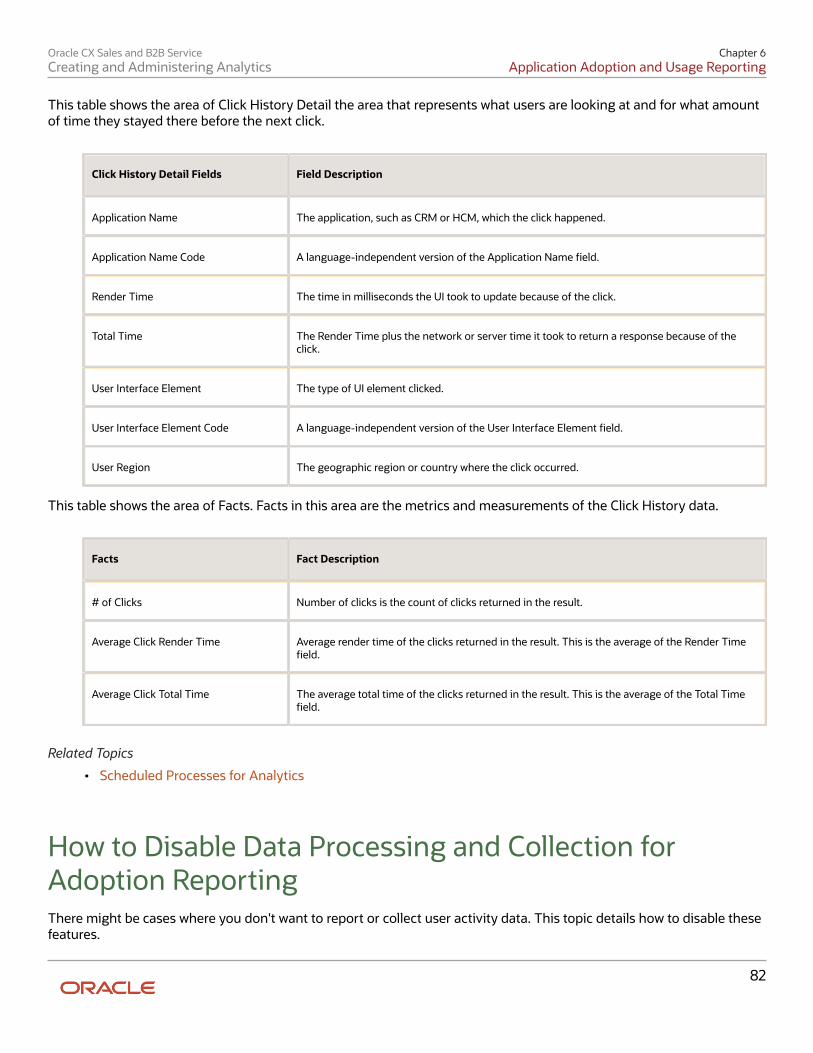
Oracle CX Sales and B2B ServiceCreating and Administering Analytics
Chapter 6Application Adoption and Usage Reporting
82
This table shows the area of Click History Detail the area that represents what users are looking at and for what amountof time they stayed there before the next click.
Click History Detail Fields Field Description
Application Name The application, such as CRM or HCM, which the click happened.
Application Name Code A language-independent version of the Application Name field.
Render Time The time in milliseconds the UI took to update because of the click.
Total Time The Render Time plus the network or server time it took to return a response because of theclick.
User Interface Element The type of UI element clicked.
User Interface Element Code A language-independent version of the User Interface Element field.
User Region The geographic region or country where the click occurred.
This table shows the area of Facts. Facts in this area are the metrics and measurements of the Click History data.
Facts Fact Description
# of Clicks Number of clicks is the count of clicks returned in the result.
Average Click Render Time Average render time of the clicks returned in the result. This is the average of the Render Timefield.
Average Click Total Time The average total time of the clicks returned in the result. This is the average of the Total Timefield.
Related Topics
• Scheduled Processes for Analytics
How to Disable Data Processing and Collection forAdoption ReportingThere might be cases where you don't want to report or collect user activity data. This topic details how to disable thesefeatures.
Oracle CX Sales and B2B ServiceCreating and Administering Analytics
Chapter 6Application Adoption and Usage Reporting
83
Disable Click History Data CollectionThere might be cases when you don't want your application to collect click history usage data on your employees. Clickhistory data is used both for Application Usage Insights as well as for reporting that uses the Click History subject areain OTBI.
The processing of click history data runs automatically by default. To disable the processing of click history data followthe steps to enable adoption usage tracking, and then search for the profile option ORA_ZCA_CH_DISABLE. By defaultthis profile option is set to OFF. Setting this option to ON disables the processing of click history data.
The processing of click history data can only be disabled on the pod for all users. It can't be disabled for individual users.
Disable Login, Session, and Object Activity Data CollectionThere might be cases when you don't want your application to collect login and object activity data on your employees.Login and object activity data are used both for Application Usage Insights as well as for reporting that uses the Sales -CRM Resource System Usage, and the Sales - CRM Object Activity subject areas. Disabling this profile option completelystops this data collection.
The collection of object activity, log in and session data process runs automatically by default. To disable data collectionfollow the steps to enable adoption usage tracking, and then turn off the ESS job "Refresh BI Reports Audit Data forUser Adoption Reporting".
The collection of object activity, log in, and session data can only be disabled on the pod for all users. It can't be disabledfor individual users.
Adoption, Usage, and Object Reporting MetricsApplication adoption, usage, and object metrics help CX sales stakeholders continuously measure the success of theirCX Sales implementation. You get metrics on how often users login, as well as what tools they use in the application.Using these metrics, CRM business leaders can obtain critical insights on how well the tools are used, and if user actionsare resulting in desired business outcomes. This topic details the metrics used in the adoption, usage and objecttracking.
Login Sessions, and Active DaysReporting on user (resource) login sessions, and active days is done using the Sales - CRM Resource System Usagesubject area. Analytics build with the subject area provide information on how much your users are using yourapplication and the channels used to access the application. With the reporting you can get insights on:
• Top active users across teams, job roles, and channels, over a period of time.
• Login count and session duration across different channels.
• Which users are inactive, or rarely using the application.
Note: The Sales - CRM Resource System Usage subject area provides similar reporting for User objects. The Sales -CRM Resource System Usage subject area provides reporting for User and Resource objects, in addition to enterprisetime.
Oracle CX Sales and B2B ServiceCreating and Administering Analytics
Chapter 6Application Adoption and Usage Reporting
84
Object ActivityObject activity reporting is done using the Sales - CRM Object Activity subject area.
Analytics built with this subject area provide information on what objects are used the most or used the least. Objectactivity reporting lets you track when users create or update records or "objects". With this reporting you can getinsights on:
• Usage of object types by user.
• Most and least used objects.
• Number of objects updated and created by object type, over a period of time. The subject area supports allparent objects, including Opportunity, Leads, Accounts, Activities, and Contacts.
• Object usage across channels. In release 20B, the subject area was updated to support reporting across Emailand Mobile channels. Five additional measures were added to help and understand object activity patternsacross channels: Insert Count via Mobile, Insert Count via Email, Insert Count via Web, Update Count via Mobile,and Update Count via Email.
Object Reporting ConsiderationsWhen you are using the subject area Sales - CRM Object Activity you should consider the following:
• Object creates (inserts) are supported across all three channels (Web, Email, and Mobile).
• Object updates are supported for the Email and Mobile channels.
• Object updates are not yet supported for the Web channel. For the Web channel, the application records thelatest time an object is updated; it does not record the total number of times it was updated. For example, if anobject is updated 5 times in one day, only the latest update is available for reporting.
Adoption and Usage Reporting DashboardsUser adoption analytics can be added to dashboards to create different views of user activity and usage. The analyticsshown here are a simple implementation of the User Adoption subject areas and give you an idea of show how salesorganizations can report on these metrics. There are prebuilt reports that you can use as a starting point for useradoption. Download the catalog from the Related Links after this section.
The dashboards shown here are built using these user adoption subject areas:
• User login - Uses subject area Sales - CRM Resource System Usage.
• Active and inactive user reporting - Uses subject area Sales - CRM Resource System Usage.
• Team level metrics - Uses subject area Sales - CRM Object Activity
• Object activity reporting - Uses subject area Sales - CRM Object Activity
User Login DashboardThis dashboard shows analytics related to user activity. Detail is shown for:
• User login activity across different channels.
• User activity by job role.
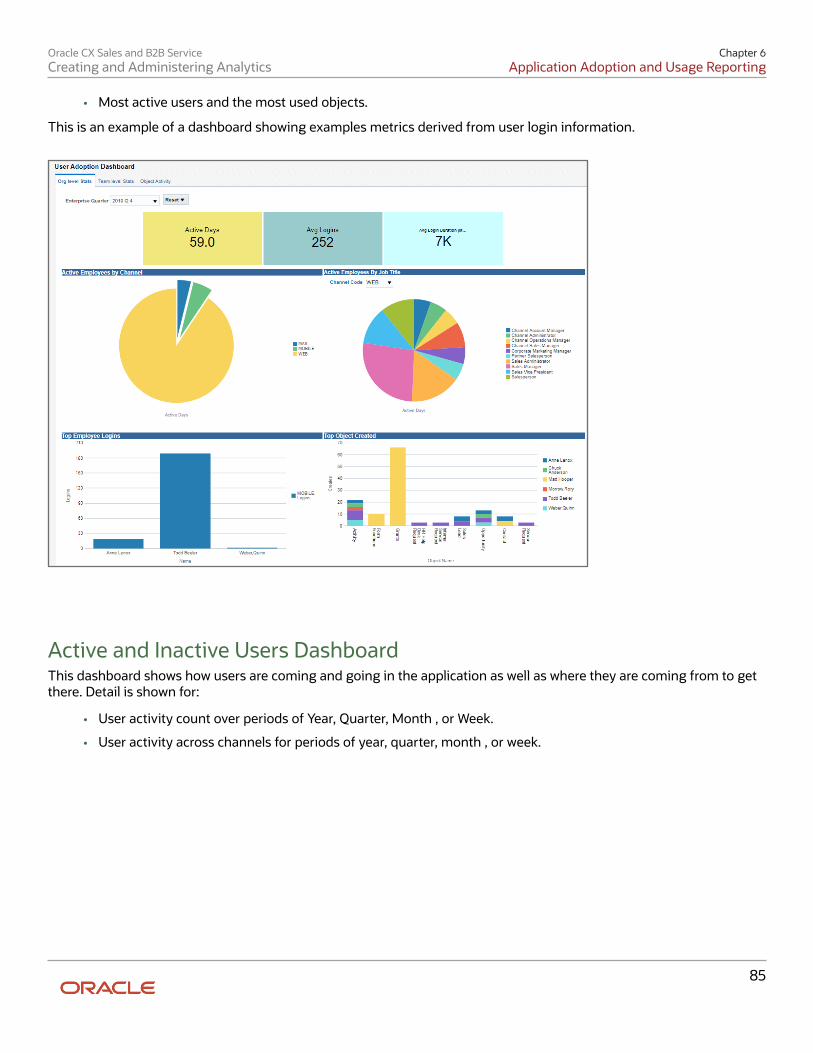
Oracle CX Sales and B2B ServiceCreating and Administering Analytics
Chapter 6Application Adoption and Usage Reporting
85
• Most active users and the most used objects.
This is an example of a dashboard showing examples metrics derived from user login information.
Active and Inactive Users DashboardThis dashboard shows how users are coming and going in the application as well as where they are coming from to getthere. Detail is shown for:
• User activity count over periods of Year, Quarter, Month , or Week.
• User activity across channels for periods of year, quarter, month , or week.
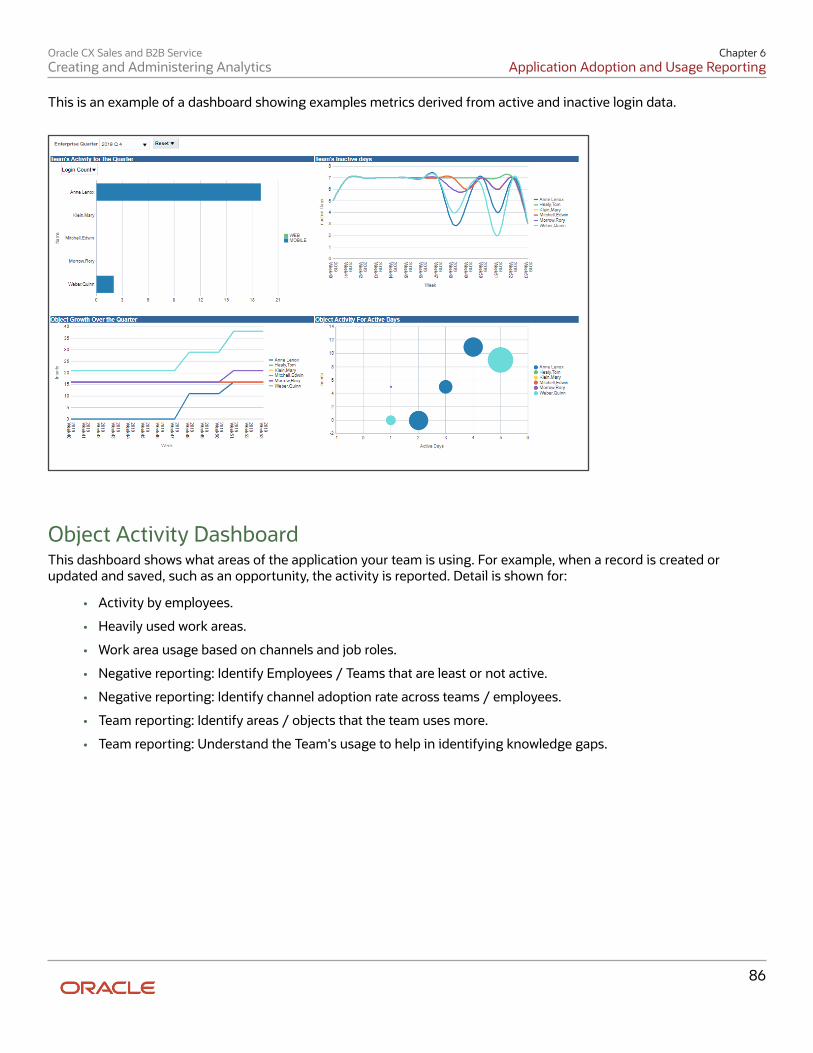
Oracle CX Sales and B2B ServiceCreating and Administering Analytics
Chapter 6Application Adoption and Usage Reporting
86
This is an example of a dashboard showing examples metrics derived from active and inactive login data.
Object Activity DashboardThis dashboard shows what areas of the application your team is using. For example, when a record is created orupdated and saved, such as an opportunity, the activity is reported. Detail is shown for:
• Activity by employees.
• Heavily used work areas.
• Work area usage based on channels and job roles.
• Negative reporting: Identify Employees / Teams that are least or not active.
• Negative reporting: Identify channel adoption rate across teams / employees.
• Team reporting: Identify areas / objects that the team uses more.
• Team reporting: Understand the Team's usage to help in identifying knowledge gaps.
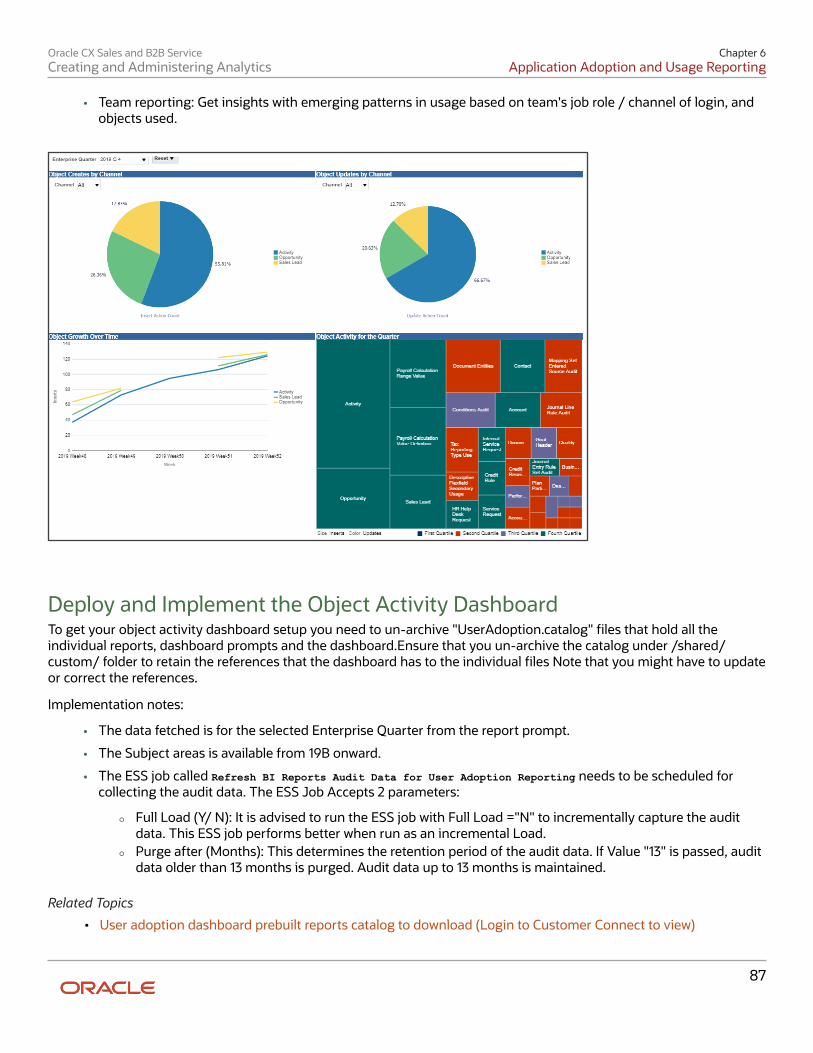
Oracle CX Sales and B2B ServiceCreating and Administering Analytics
Chapter 6Application Adoption and Usage Reporting
87
• Team reporting: Get insights with emerging patterns in usage based on team's job role / channel of login, andobjects used.
Deploy and Implement the Object Activity DashboardTo get your object activity dashboard setup you need to un-archive "UserAdoption.catalog" files that hold all theindividual reports, dashboard prompts and the dashboard.Ensure that you un-archive the catalog under /shared/custom/ folder to retain the references that the dashboard has to the individual files Note that you might have to updateor correct the references.
Implementation notes:
• The data fetched is for the selected Enterprise Quarter from the report prompt.
• The Subject areas is available from 19B onward.
• The ESS job called Refresh BI Reports Audit Data for User Adoption Reporting needs to be scheduled forcollecting the audit data. The ESS Job Accepts 2 parameters:
◦ Full Load (Y/ N): It is advised to run the ESS job with Full Load ="N" to incrementally capture the auditdata. This ESS job performs better when run as an incremental Load.
◦ Purge after (Months): This determines the retention period of the audit data. If Value "13" is passed, auditdata older than 13 months is purged. Audit data up to 13 months is maintained.
Related Topics
• User adoption dashboard prebuilt reports catalog to download (Login to Customer Connect to view)
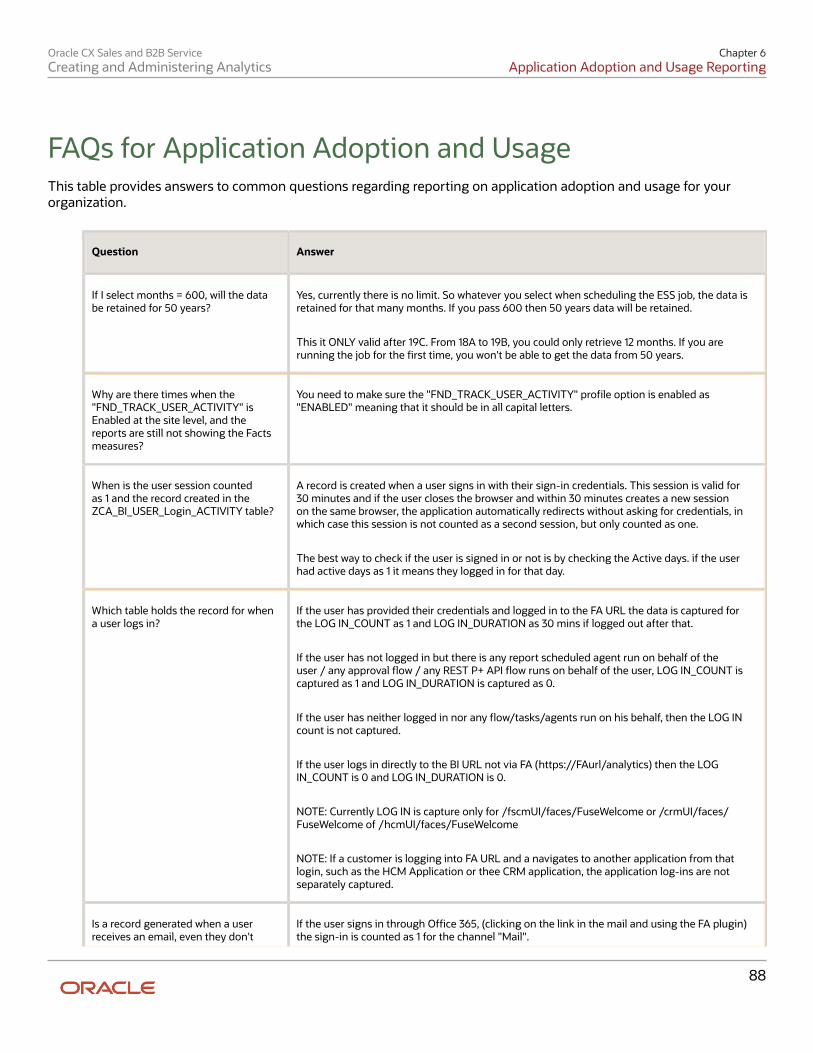
Oracle CX Sales and B2B ServiceCreating and Administering Analytics
Chapter 6Application Adoption and Usage Reporting
88
FAQs for Application Adoption and UsageThis table provides answers to common questions regarding reporting on application adoption and usage for yourorganization.
Question Answer
If I select months = 600, will the databe retained for 50 years?
Yes, currently there is no limit. So whatever you select when scheduling the ESS job, the data isretained for that many months. If you pass 600 then 50 years data will be retained.
This it ONLY valid after 19C. From 18A to 19B, you could only retrieve 12 months. If you arerunning the job for the first time, you won't be able to get the data from 50 years.
Why are there times when the"FND_TRACK_USER_ACTIVITY" isEnabled at the site level, and thereports are still not showing the Factsmeasures?
You need to make sure the "FND_TRACK_USER_ACTIVITY" profile option is enabled as"ENABLED" meaning that it should be in all capital letters.
When is the user session countedas 1 and the record created in theZCA_BI_USER_Login_ACTIVITY table?
A record is created when a user signs in with their sign-in credentials. This session is valid for30 minutes and if the user closes the browser and within 30 minutes creates a new sessionon the same browser, the application automatically redirects without asking for credentials, inwhich case this session is not counted as a second session, but only counted as one.
The best way to check if the user is signed in or not is by checking the Active days. if the userhad active days as 1 it means they logged in for that day.
Which table holds the record for whena user logs in?
If the user has provided their credentials and logged in to the FA URL the data is captured forthe LOG IN_COUNT as 1 and LOG IN_DURATION as 30 mins if logged out after that.
If the user has not logged in but there is any report scheduled agent run on behalf of theuser / any approval flow / any REST P+ API flow runs on behalf of the user, LOG IN_COUNT iscaptured as 1 and LOG IN_DURATION is captured as 0.
If the user has neither logged in nor any flow/tasks/agents run on his behalf, then the LOG INcount is not captured.
If the user logs in directly to the BI URL not via FA (https://FAurl/analytics) then the LOGIN_COUNT is 0 and LOG IN_DURATION is 0.
NOTE: Currently LOG IN is capture only for /fscmUI/faces/FuseWelcome or /crmUI/faces/FuseWelcome of /hcmUI/faces/FuseWelcome
NOTE: If a customer is logging into FA URL and a navigates to another application from thatlogin, such as the HCM Application or thee CRM application, the application log-ins are notseparately captured.
Is a record generated when a userreceives an email, even they don't
If the user signs in through Office 365, (clicking on the link in the mail and using the FA plugin)the sign-in is counted as 1 for the channel "Mail".
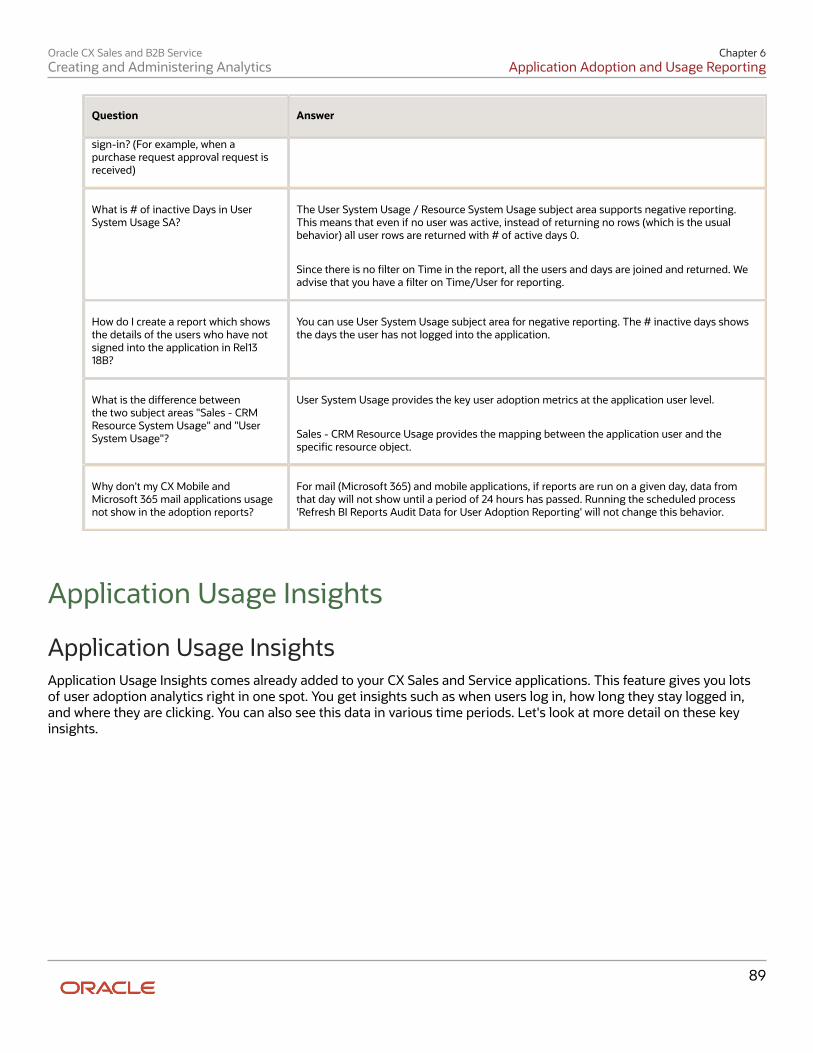
Oracle CX Sales and B2B ServiceCreating and Administering Analytics
Chapter 6Application Adoption and Usage Reporting
89
Question Answer
sign-in? (For example, when apurchase request approval request isreceived)
What is # of inactive Days in UserSystem Usage SA?
The User System Usage / Resource System Usage subject area supports negative reporting.This means that even if no user was active, instead of returning no rows (which is the usualbehavior) all user rows are returned with # of active days 0.
Since there is no filter on Time in the report, all the users and days are joined and returned. Weadvise that you have a filter on Time/User for reporting.
How do I create a report which showsthe details of the users who have notsigned into the application in Rel1318B?
You can use User System Usage subject area for negative reporting. The # inactive days showsthe days the user has not logged into the application.
What is the difference betweenthe two subject areas "Sales - CRMResource System Usage" and "UserSystem Usage"?
User System Usage provides the key user adoption metrics at the application user level.
Sales - CRM Resource Usage provides the mapping between the application user and thespecific resource object.
Why don't my CX Mobile andMicrosoft 365 mail applications usagenot show in the adoption reports?
For mail (Microsoft 365) and mobile applications, if reports are run on a given day, data fromthat day will not show until a period of 24 hours has passed. Running the scheduled process'Refresh BI Reports Audit Data for User Adoption Reporting' will not change this behavior.
Application Usage Insights
Application Usage InsightsApplication Usage Insights comes already added to your CX Sales and Service applications. This feature gives you lotsof user adoption analytics right in one spot. You get insights such as when users log in, how long they stay logged in,and where they are clicking. You can also see this data in various time periods. Let's look at more detail on these keyinsights.
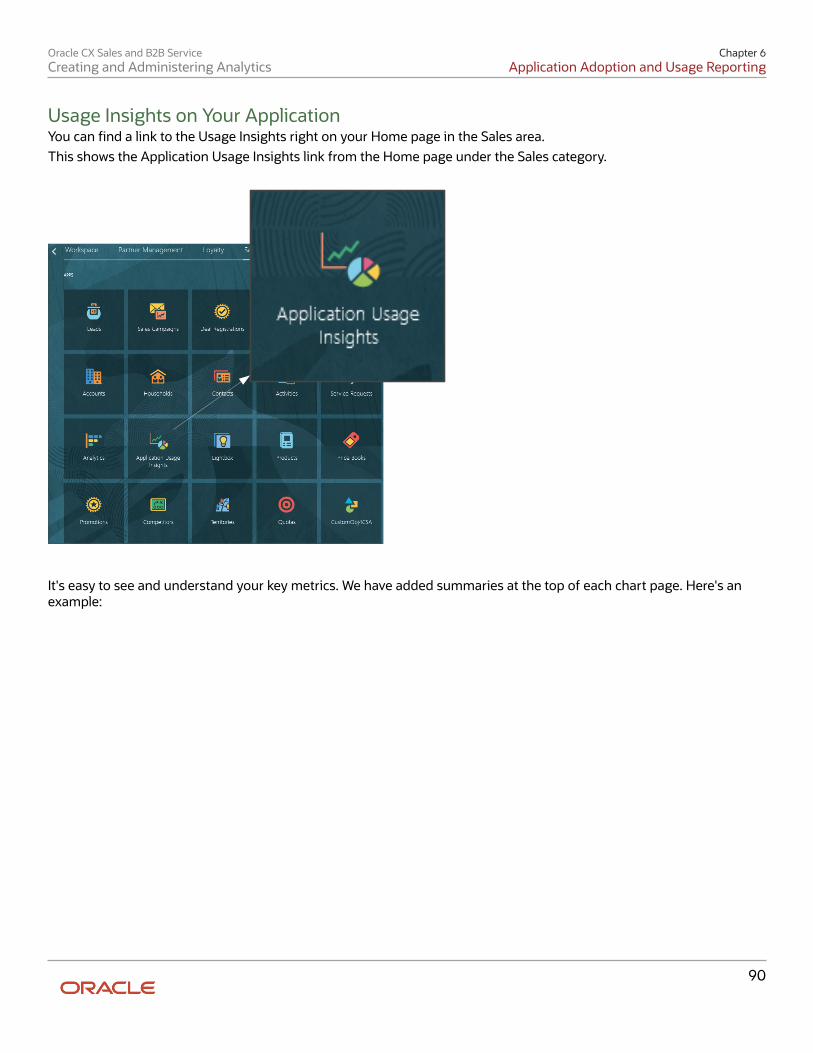
Oracle CX Sales and B2B ServiceCreating and Administering Analytics
Chapter 6Application Adoption and Usage Reporting
90
Usage Insights on Your ApplicationYou can find a link to the Usage Insights right on your Home page in the Sales area.This shows the Application Usage Insights link from the Home page under the Sales category.
It's easy to see and understand your key metrics. We have added summaries at the top of each chart page. Here's anexample:
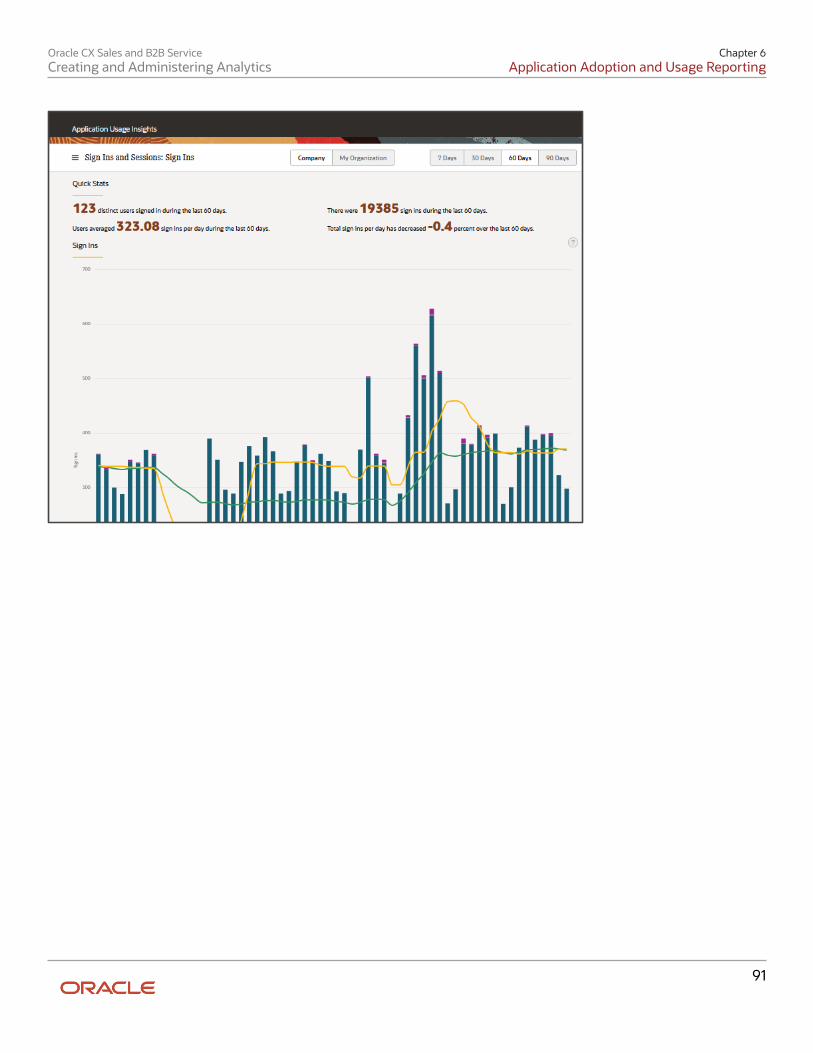
Oracle CX Sales and B2B ServiceCreating and Administering Analytics
Chapter 6Application Adoption and Usage Reporting
91
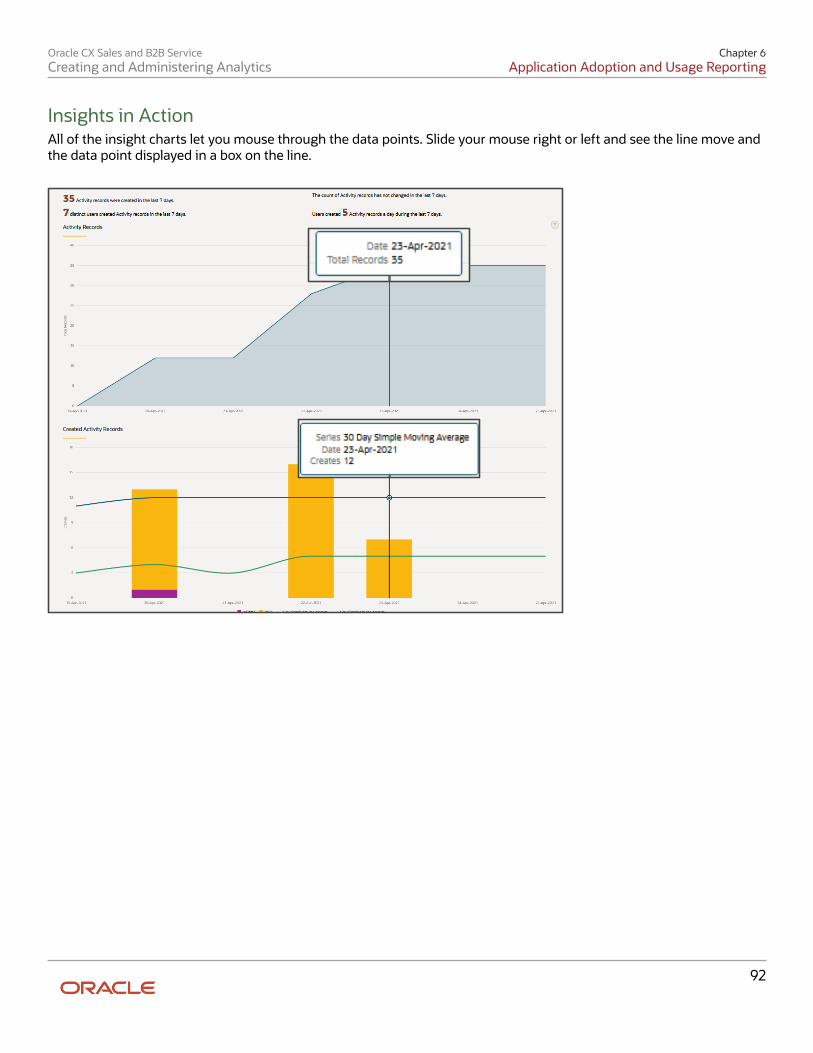
Oracle CX Sales and B2B ServiceCreating and Administering Analytics
Chapter 6Application Adoption and Usage Reporting
92
Insights in ActionAll of the insight charts let you mouse through the data points. Slide your mouse right or left and see the line move andthe data point displayed in a box on the line.
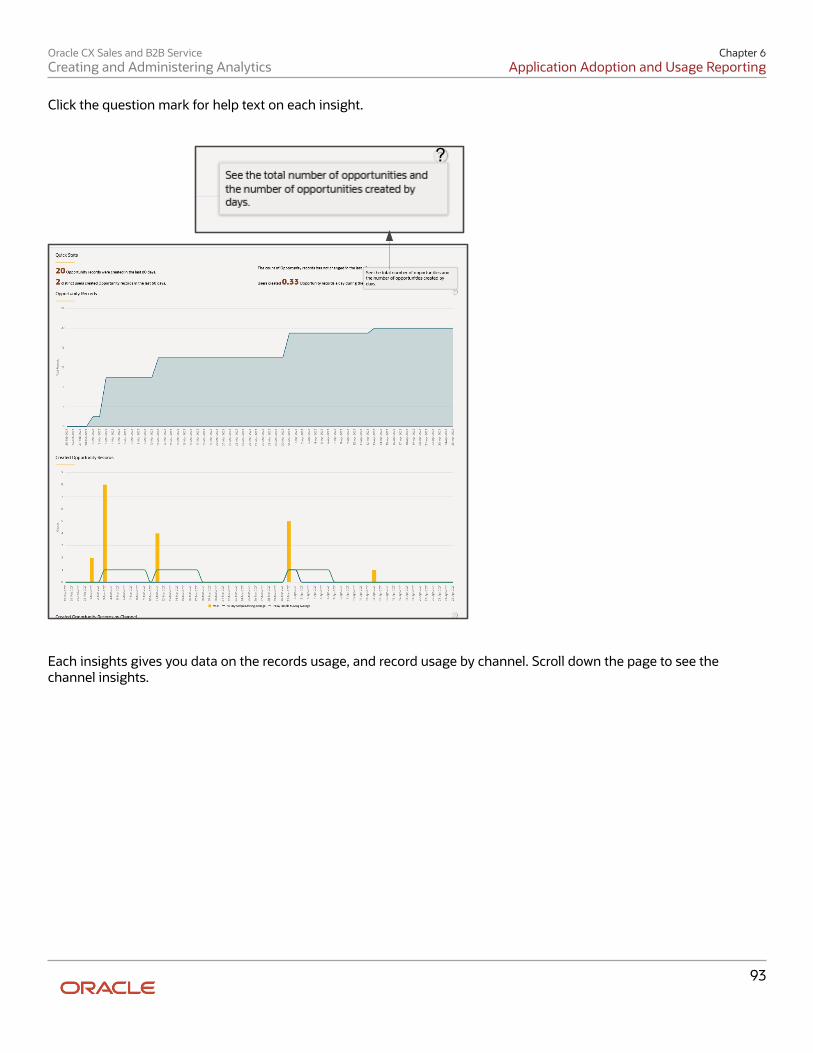
Oracle CX Sales and B2B ServiceCreating and Administering Analytics
Chapter 6Application Adoption and Usage Reporting
93
Click the question mark for help text on each insight.
?
Each insights gives you data on the records usage, and record usage by channel. Scroll down the page to see thechannel insights.
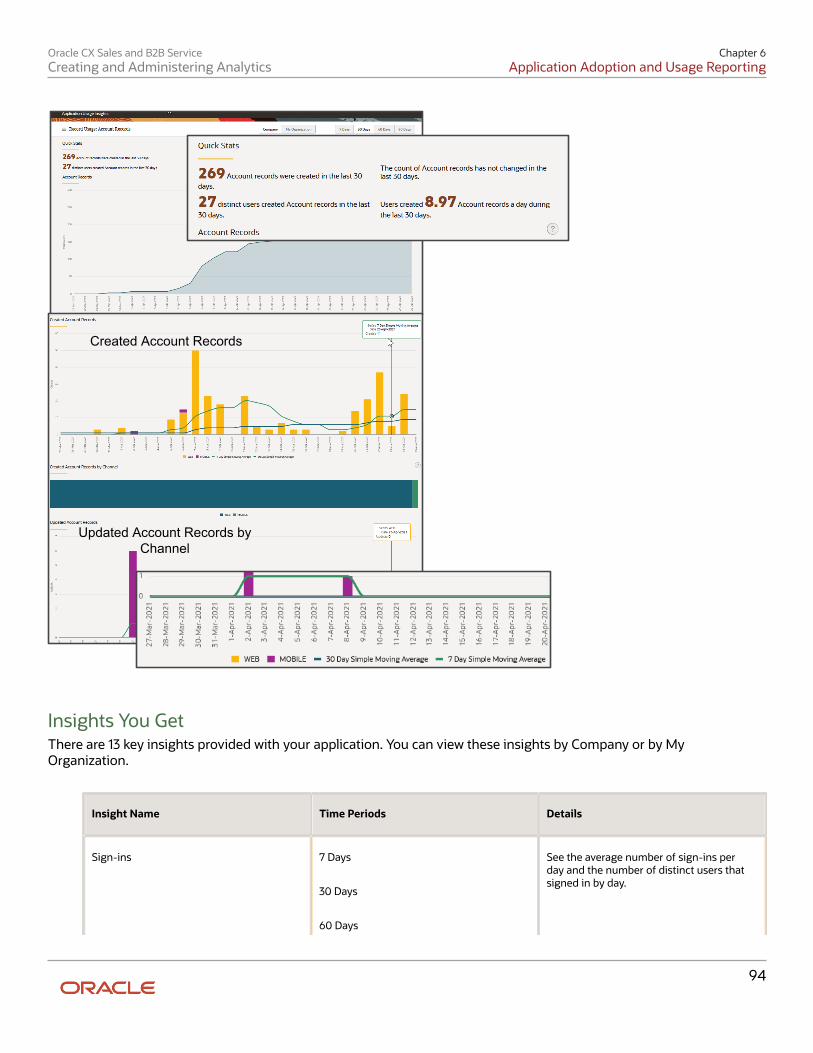
Oracle CX Sales and B2B ServiceCreating and Administering Analytics
Chapter 6Application Adoption and Usage Reporting
94
Updated Account Records by Channel
Created Account Records
Insights You GetThere are 13 key insights provided with your application. You can view these insights by Company or by MyOrganization.
Insight Name Time Periods Details
Sign-ins 7 Days
30 Days
60 Days
See the average number of sign-ins perday and the number of distinct users thatsigned in by day.
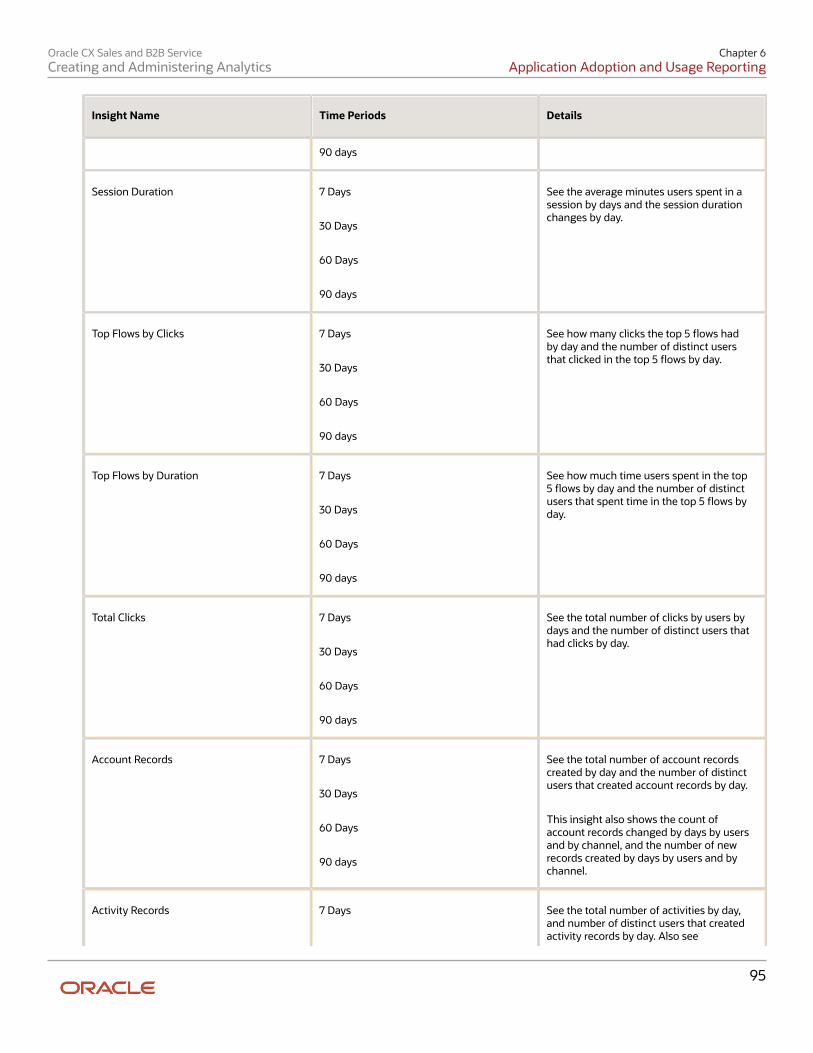
Oracle CX Sales and B2B ServiceCreating and Administering Analytics
Chapter 6Application Adoption and Usage Reporting
95
Insight Name Time Periods Details
90 days
Session Duration 7 Days
30 Days
60 Days
90 days
See the average minutes users spent in asession by days and the session durationchanges by day.
Top Flows by Clicks 7 Days
30 Days
60 Days
90 days
See how many clicks the top 5 flows hadby day and the number of distinct usersthat clicked in the top 5 flows by day.
Top Flows by Duration 7 Days
30 Days
60 Days
90 days
See how much time users spent in the top5 flows by day and the number of distinctusers that spent time in the top 5 flows byday.
Total Clicks 7 Days
30 Days
60 Days
90 days
See the total number of clicks by users bydays and the number of distinct users thathad clicks by day.
Account Records 7 Days
30 Days
60 Days
90 days
See the total number of account recordscreated by day and the number of distinctusers that created account records by day.
This insight also shows the count ofaccount records changed by days by usersand by channel, and the number of newrecords created by days by users and bychannel.
Activity Records 7 Days See the total number of activities by day,and number of distinct users that createdactivity records by day. Also see
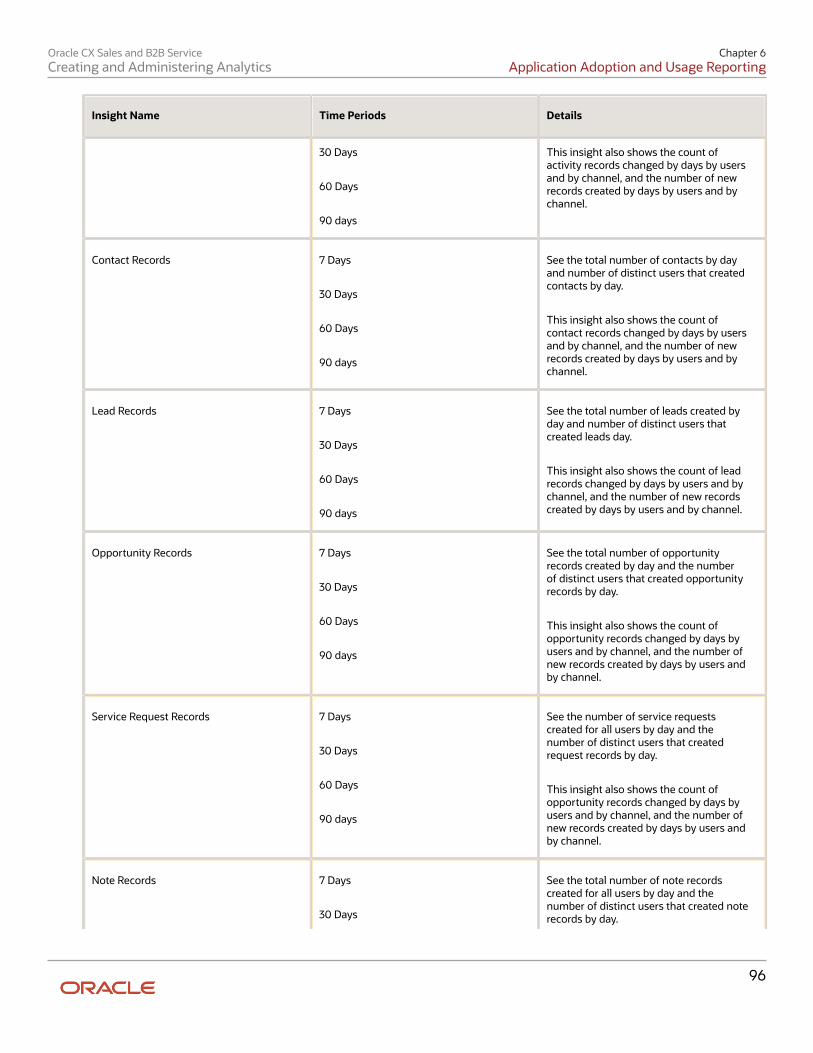
Oracle CX Sales and B2B ServiceCreating and Administering Analytics
Chapter 6Application Adoption and Usage Reporting
96
Insight Name Time Periods Details
30 Days
60 Days
90 days
This insight also shows the count ofactivity records changed by days by usersand by channel, and the number of newrecords created by days by users and bychannel.
Contact Records 7 Days
30 Days
60 Days
90 days
See the total number of contacts by dayand number of distinct users that createdcontacts by day.
This insight also shows the count ofcontact records changed by days by usersand by channel, and the number of newrecords created by days by users and bychannel.
Lead Records 7 Days
30 Days
60 Days
90 days
See the total number of leads created byday and number of distinct users thatcreated leads day.
This insight also shows the count of leadrecords changed by days by users and bychannel, and the number of new recordscreated by days by users and by channel.
Opportunity Records 7 Days
30 Days
60 Days
90 days
See the total number of opportunityrecords created by day and the numberof distinct users that created opportunityrecords by day.
This insight also shows the count ofopportunity records changed by days byusers and by channel, and the number ofnew records created by days by users andby channel.
Service Request Records 7 Days
30 Days
60 Days
90 days
See the number of service requestscreated for all users by day and thenumber of distinct users that createdrequest records by day.
This insight also shows the count ofopportunity records changed by days byusers and by channel, and the number ofnew records created by days by users andby channel.
Note Records 7 Days
30 Days
See the total number of note recordscreated for all users by day and thenumber of distinct users that created noterecords by day.
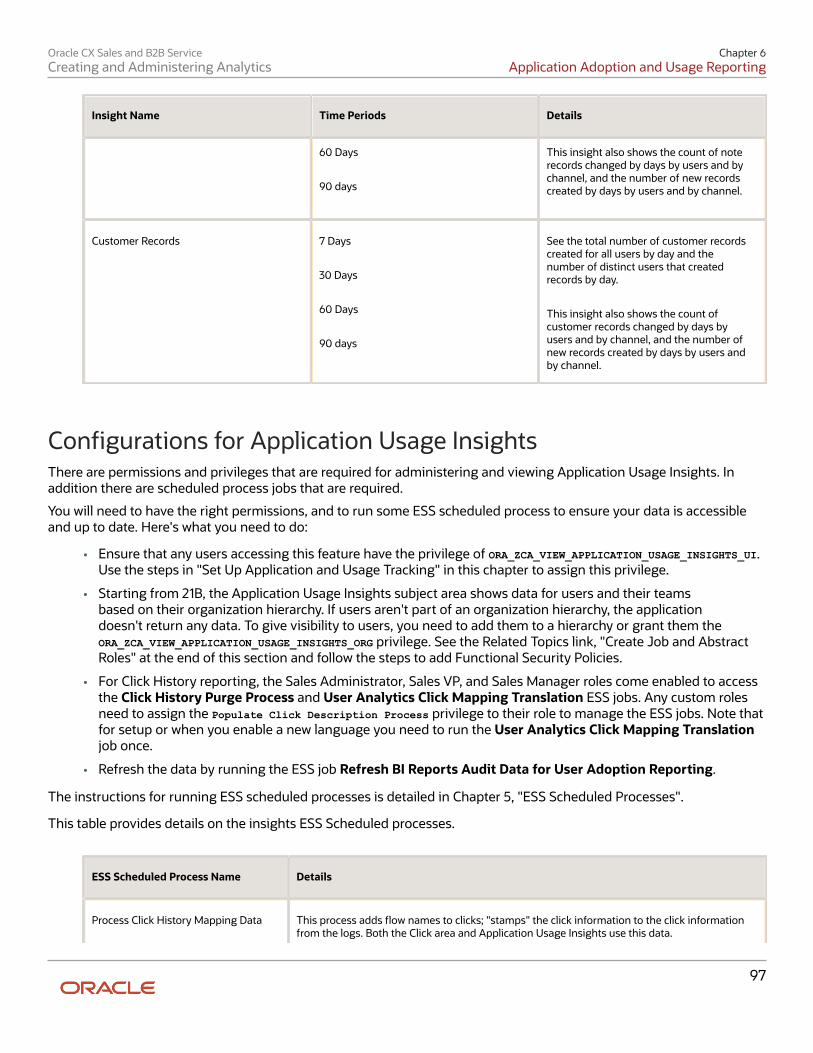
Oracle CX Sales and B2B ServiceCreating and Administering Analytics
Chapter 6Application Adoption and Usage Reporting
97
Insight Name Time Periods Details
60 Days
90 days
This insight also shows the count of noterecords changed by days by users and bychannel, and the number of new recordscreated by days by users and by channel.
Customer Records 7 Days
30 Days
60 Days
90 days
See the total number of customer recordscreated for all users by day and thenumber of distinct users that createdrecords by day.
This insight also shows the count ofcustomer records changed by days byusers and by channel, and the number ofnew records created by days by users andby channel.
Configurations for Application Usage InsightsThere are permissions and privileges that are required for administering and viewing Application Usage Insights. Inaddition there are scheduled process jobs that are required.
You will need to have the right permissions, and to run some ESS scheduled process to ensure your data is accessibleand up to date. Here's what you need to do:
• Ensure that any users accessing this feature have the privilege of ORA_ZCA_VIEW_APPLICATION_USAGE_INSIGHTS_UI.Use the steps in "Set Up Application and Usage Tracking" in this chapter to assign this privilege.
• Starting from 21B, the Application Usage Insights subject area shows data for users and their teamsbased on their organization hierarchy. If users aren't part of an organization hierarchy, the applicationdoesn't return any data. To give visibility to users, you need to add them to a hierarchy or grant them theORA_ZCA_VIEW_APPLICATION_USAGE_INSIGHTS_ORG privilege. See the Related Topics link, "Create Job and AbstractRoles" at the end of this section and follow the steps to add Functional Security Policies.
• For Click History reporting, the Sales Administrator, Sales VP, and Sales Manager roles come enabled to accessthe Click History Purge Process and User Analytics Click Mapping Translation ESS jobs. Any custom rolesneed to assign the Populate Click Description Process privilege to their role to manage the ESS jobs. Note thatfor setup or when you enable a new language you need to run the User Analytics Click Mapping Translationjob once.
• Refresh the data by running the ESS job Refresh BI Reports Audit Data for User Adoption Reporting.
The instructions for running ESS scheduled processes is detailed in Chapter 5, "ESS Scheduled Processes".
This table provides details on the insights ESS Scheduled processes.
ESS Scheduled Process Name Details
Process Click History Mapping Data This process adds flow names to clicks; "stamps" the click information to the click informationfrom the logs. Both the Click area and Application Usage Insights use this data.
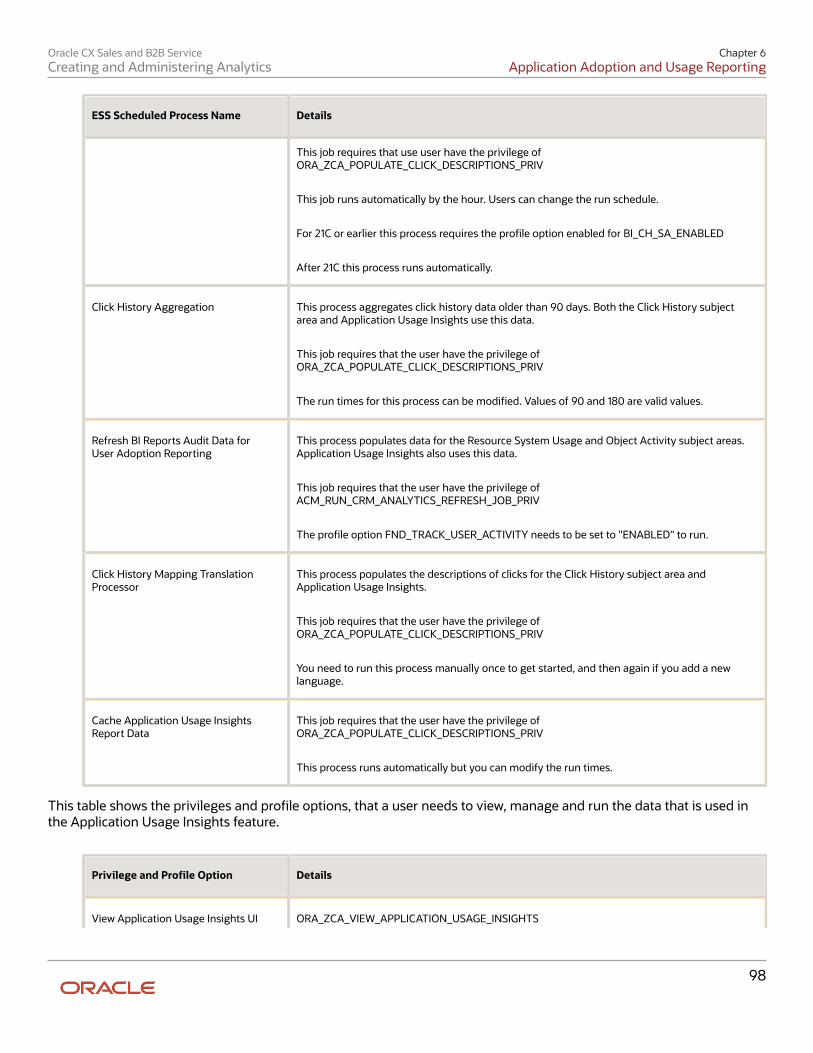
Oracle CX Sales and B2B ServiceCreating and Administering Analytics
Chapter 6Application Adoption and Usage Reporting
98
ESS Scheduled Process Name Details
This job requires that use user have the privilege ofORA_ZCA_POPULATE_CLICK_DESCRIPTIONS_PRIV
This job runs automatically by the hour. Users can change the run schedule.
For 21C or earlier this process requires the profile option enabled for BI_CH_SA_ENABLED
After 21C this process runs automatically.
Click History Aggregation This process aggregates click history data older than 90 days. Both the Click History subjectarea and Application Usage Insights use this data.
This job requires that the user have the privilege ofORA_ZCA_POPULATE_CLICK_DESCRIPTIONS_PRIV
The run times for this process can be modified. Values of 90 and 180 are valid values.
Refresh BI Reports Audit Data forUser Adoption Reporting
This process populates data for the Resource System Usage and Object Activity subject areas.Application Usage Insights also uses this data.
This job requires that the user have the privilege ofACM_RUN_CRM_ANALYTICS_REFRESH_JOB_PRIV
The profile option FND_TRACK_USER_ACTIVITY needs to be set to "ENABLED" to run.
Click History Mapping TranslationProcessor
This process populates the descriptions of clicks for the Click History subject area andApplication Usage Insights.
This job requires that the user have the privilege ofORA_ZCA_POPULATE_CLICK_DESCRIPTIONS_PRIV
You need to run this process manually once to get started, and then again if you add a newlanguage.
Cache Application Usage InsightsReport Data
This job requires that the user have the privilege ofORA_ZCA_POPULATE_CLICK_DESCRIPTIONS_PRIV
This process runs automatically but you can modify the run times.
This table shows the privileges and profile options, that a user needs to view, manage and run the data that is used inthe Application Usage Insights feature.
Privilege and Profile Option Details
View Application Usage Insights UI ORA_ZCA_VIEW_APPLICATION_USAGE_INSIGHTS
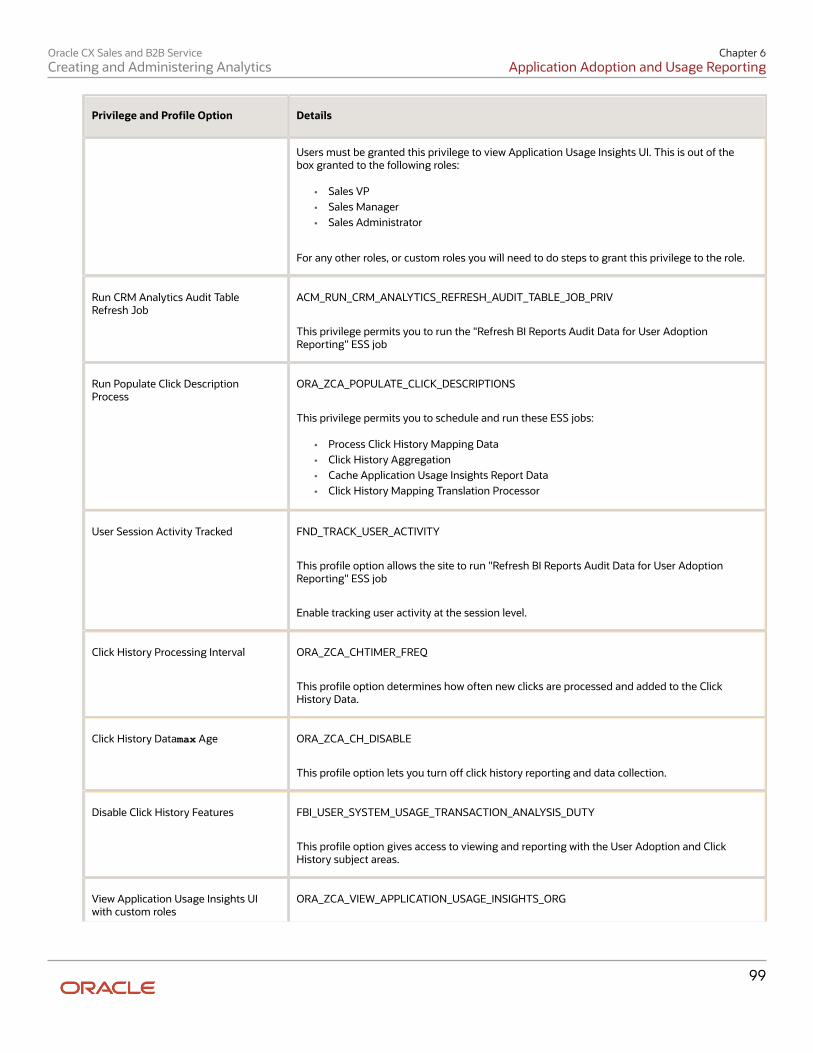
Oracle CX Sales and B2B ServiceCreating and Administering Analytics
Chapter 6Application Adoption and Usage Reporting
99
Privilege and Profile Option Details
Users must be granted this privilege to view Application Usage Insights UI. This is out of thebox granted to the following roles:
• Sales VP• Sales Manager• Sales Administrator
For any other roles, or custom roles you will need to do steps to grant this privilege to the role.
Run CRM Analytics Audit TableRefresh Job
ACM_RUN_CRM_ANALYTICS_REFRESH_AUDIT_TABLE_JOB_PRIV
This privilege permits you to run the "Refresh BI Reports Audit Data for User AdoptionReporting" ESS job
Run Populate Click DescriptionProcess
ORA_ZCA_POPULATE_CLICK_DESCRIPTIONS
This privilege permits you to schedule and run these ESS jobs:
• Process Click History Mapping Data• Click History Aggregation• Cache Application Usage Insights Report Data• Click History Mapping Translation Processor
User Session Activity Tracked FND_TRACK_USER_ACTIVITY
This profile option allows the site to run "Refresh BI Reports Audit Data for User AdoptionReporting" ESS job
Enable tracking user activity at the session level.
Click History Processing Interval ORA_ZCA_CHTIMER_FREQ
This profile option determines how often new clicks are processed and added to the ClickHistory Data.
Click History Datamax Age ORA_ZCA_CH_DISABLE
This profile option lets you turn off click history reporting and data collection.
Disable Click History Features FBI_USER_SYSTEM_USAGE_TRANSACTION_ANALYSIS_DUTY
This profile option gives access to viewing and reporting with the User Adoption and ClickHistory subject areas.
View Application Usage Insights UIwith custom roles
ORA_ZCA_VIEW_APPLICATION_USAGE_INSIGHTS_ORG
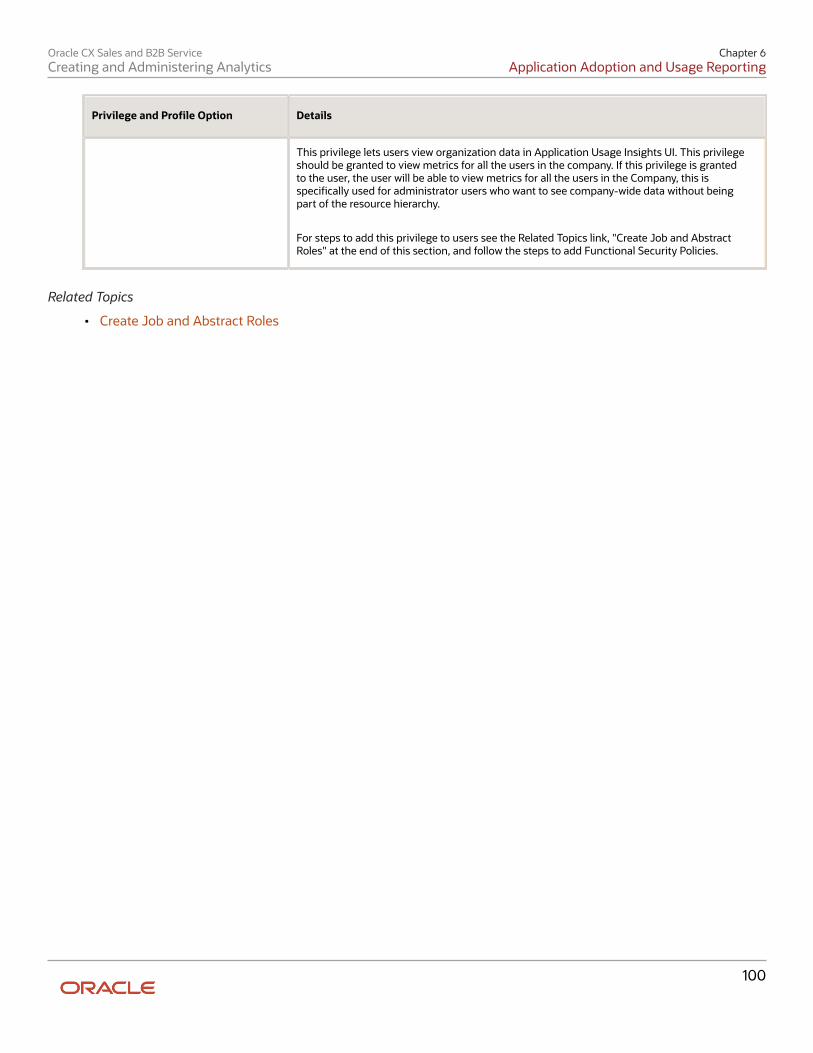
Oracle CX Sales and B2B ServiceCreating and Administering Analytics
Chapter 6Application Adoption and Usage Reporting
100
Privilege and Profile Option Details
This privilege lets users view organization data in Application Usage Insights UI. This privilegeshould be granted to view metrics for all the users in the company. If this privilege is grantedto the user, the user will be able to view metrics for all the users in the Company, this isspecifically used for administrator users who want to see company-wide data without beingpart of the resource hierarchy.
For steps to add this privilege to users see the Related Topics link, "Create Job and AbstractRoles" at the end of this section, and follow the steps to add Functional Security Policies.
Related Topics
• Create Job and Abstract Roles
Oracle CX Sales and B2B ServiceCreating and Administering Analytics
Chapter 7Prebuilt Analytics
101
7 Prebuilt Analytics
Analytics for User RolesPrebuilt analytics let you get analytics out to your users right away. You can set up these analytics so that your sales orservice user roles see their own data when they log in. There are dozens of analytics for specific user roles, as well asanalytics relevant to all roles in your organization.
Here are some analytics for sales roles:
• Sales Representatives - performance, opportunities, pipeline, leads, and quota analytics
• Sales Managers - team analytics including activities, leads, performance, opportunities, quota, andperformance
• Channel Account Managers - MDF Requests, deal registration, partner status, opportunities, pipeline, partnerperformance, and quota analytics
• Sales Executive - team leads and executive analytics including, actual vs. quota, forecast vs. quota, top openopportunities, sales stage by age, forecasting, performance, and service request
• Channel Sales Manager - MDF requests, open pipeline, stalled opportunities, partner business plan objectives,partner hierarchy analytics.
• Partner Sales Representative - stalled opportunities and top open opportunities analytics

Oracle CX Sales and B2B ServiceCreating and Administering Analytics
Chapter 7Prebuilt Analytics
102
Here are some analytics examples for specific user roles. These are for Sales Representatives to see their opportunitiesand pipeline.
Here are some analytics for service roles:
• Customer Service Representative - personal performance, pending tasks, compliance, queues, action plans,work order analytics.
• Customer Service Manager - agent performance, compliance, interactions, queues, channels, action plans,work orders, email, social post analytics.
• Human Resource Help Desk Agent - personal performance, pending tasks, compliance, queue analytics.
• Human Resource Help Desk Manager - agent performance, compliance interaction, queues, email analytics.
Oracle CX Sales and B2B ServiceCreating and Administering Analytics
Chapter 7Prebuilt Analytics
103
Listing of Prebuilt AnalyticsYour CX Sales applications come with a variety of different prebuilt analytics for your sales users. Use the prebuiltanalytics right out of the box, or make a copy and modify them however you like. This list includes analytics and reportsfrom CX Sales, Incentive Compensation, and Partner Management.
Related Topics
• CX Sales analytics listing in downloadable spreadsheet format.

Oracle CX Sales and B2B ServiceCreating and Administering Analytics
Chapter 7Prebuilt Analytics
104
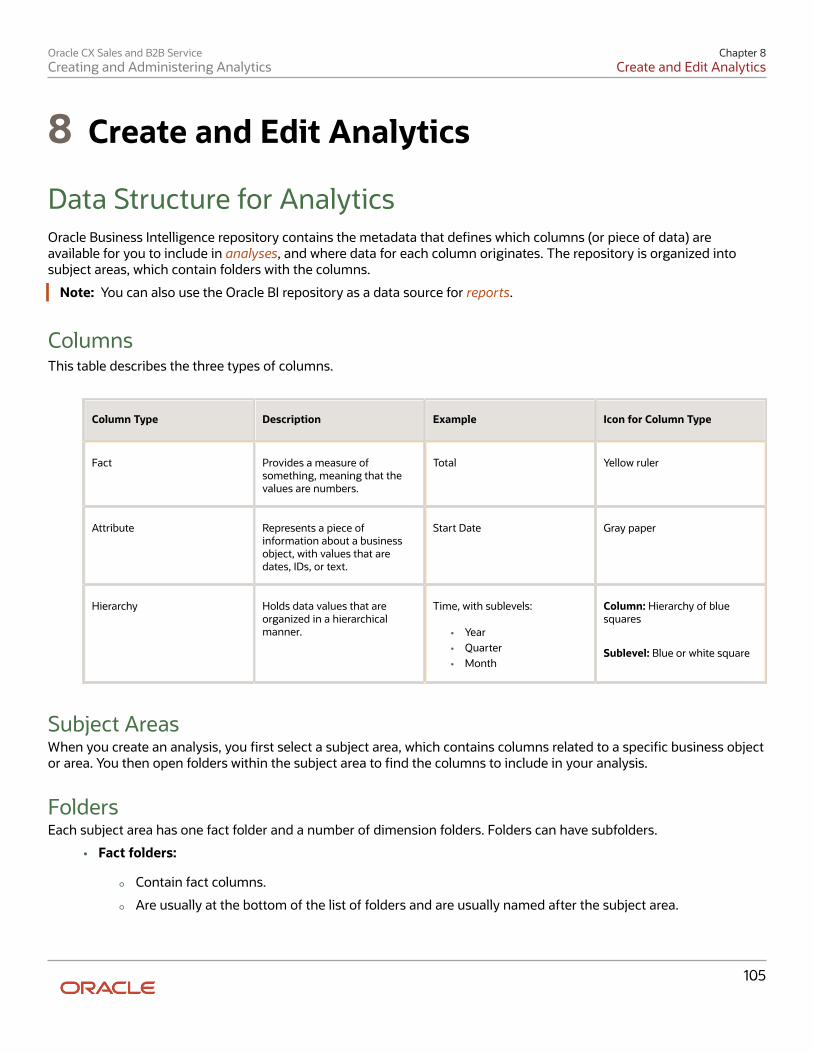
Oracle CX Sales and B2B ServiceCreating and Administering Analytics
Chapter 8Create and Edit Analytics
105
8 Create and Edit Analytics
Data Structure for AnalyticsOracle Business Intelligence repository contains the metadata that defines which columns (or piece of data) areavailable for you to include in analyses, and where data for each column originates. The repository is organized intosubject areas, which contain folders with the columns.
Note: You can also use the Oracle BI repository as a data source for reports.
ColumnsThis table describes the three types of columns.
Column Type Description Example Icon for Column Type
Fact Provides a measure ofsomething, meaning that thevalues are numbers.
Total Yellow ruler
Attribute Represents a piece ofinformation about a businessobject, with values that aredates, IDs, or text.
Start Date Gray paper
Hierarchy Holds data values that areorganized in a hierarchicalmanner.
Time, with sublevels:
• Year• Quarter• Month
Column: Hierarchy of bluesquares
Sublevel: Blue or white square
Subject AreasWhen you create an analysis, you first select a subject area, which contains columns related to a specific business objector area. You then open folders within the subject area to find the columns to include in your analysis.
FoldersEach subject area has one fact folder and a number of dimension folders. Folders can have subfolders.
• Fact folders:
◦ Contain fact columns.
◦ Are usually at the bottom of the list of folders and are usually named after the subject area.
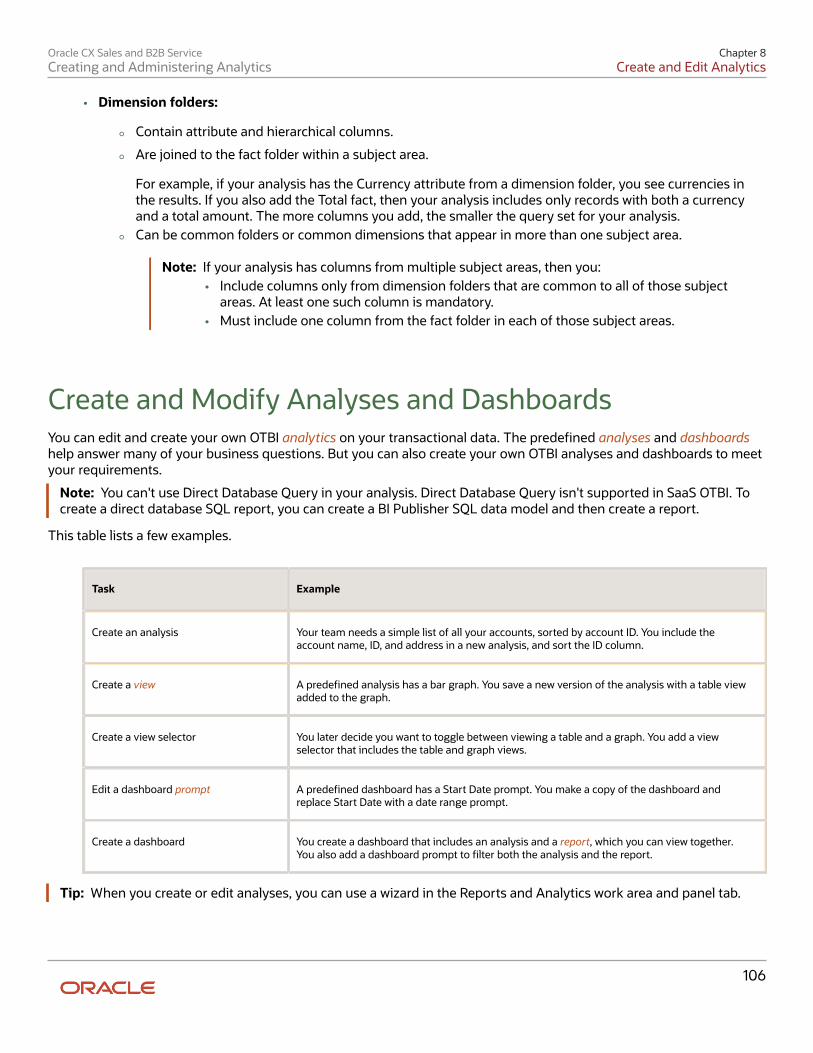
Oracle CX Sales and B2B ServiceCreating and Administering Analytics
Chapter 8Create and Edit Analytics
106
• Dimension folders:
◦ Contain attribute and hierarchical columns.
◦ Are joined to the fact folder within a subject area.
For example, if your analysis has the Currency attribute from a dimension folder, you see currencies inthe results. If you also add the Total fact, then your analysis includes only records with both a currencyand a total amount. The more columns you add, the smaller the query set for your analysis.
◦ Can be common folders or common dimensions that appear in more than one subject area.
Note: If your analysis has columns from multiple subject areas, then you:• Include columns only from dimension folders that are common to all of those subject
areas. At least one such column is mandatory.• Must include one column from the fact folder in each of those subject areas.
Create and Modify Analyses and DashboardsYou can edit and create your own OTBI analytics on your transactional data. The predefined analyses and dashboardshelp answer many of your business questions. But you can also create your own OTBI analyses and dashboards to meetyour requirements.
Note: You can't use Direct Database Query in your analysis. Direct Database Query isn't supported in SaaS OTBI. Tocreate a direct database SQL report, you can create a BI Publisher SQL data model and then create a report.
This table lists a few examples.
Task Example
Create an analysis Your team needs a simple list of all your accounts, sorted by account ID. You include theaccount name, ID, and address in a new analysis, and sort the ID column.
Create a view A predefined analysis has a bar graph. You save a new version of the analysis with a table viewadded to the graph.
Create a view selector You later decide you want to toggle between viewing a table and a graph. You add a viewselector that includes the table and graph views.
Edit a dashboard prompt A predefined dashboard has a Start Date prompt. You make a copy of the dashboard andreplace Start Date with a date range prompt.
Create a dashboard You create a dashboard that includes an analysis and a report, which you can view together.You also add a dashboard prompt to filter both the analysis and the report.
Tip: When you create or edit analyses, you can use a wizard in the Reports and Analytics work area and panel tab.
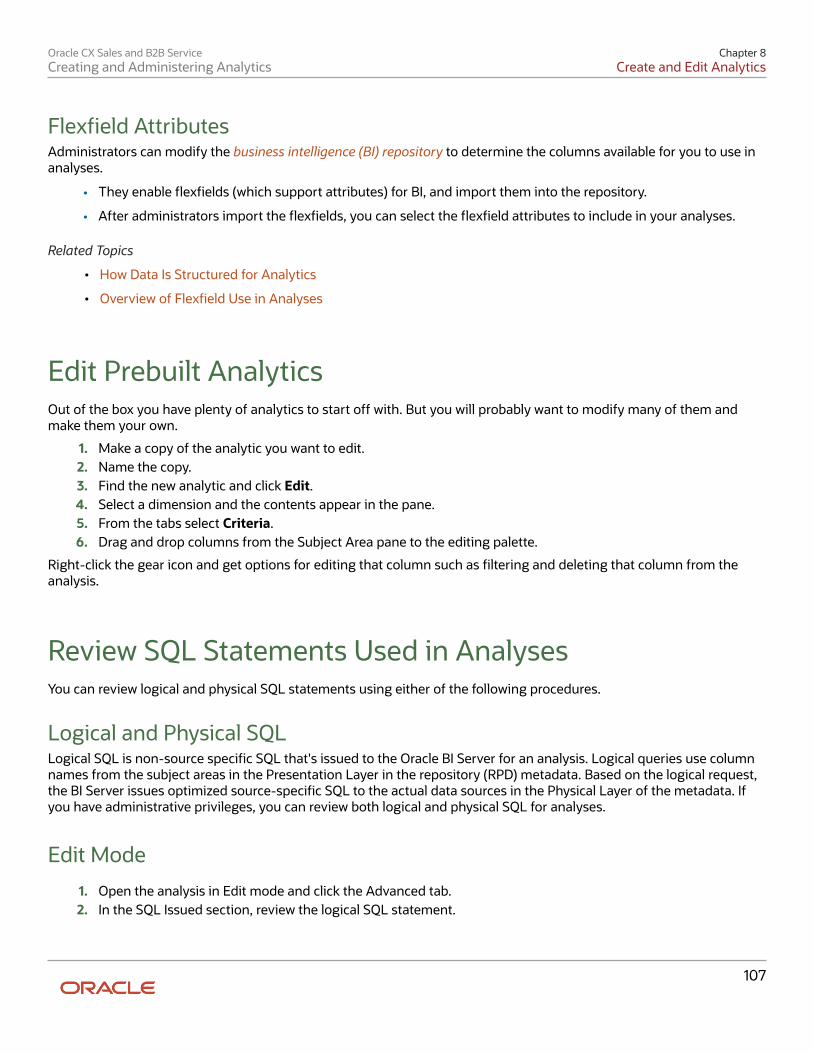
Oracle CX Sales and B2B ServiceCreating and Administering Analytics
Chapter 8Create and Edit Analytics
107
Flexfield AttributesAdministrators can modify the business intelligence (BI) repository to determine the columns available for you to use inanalyses.
• They enable flexfields (which support attributes) for BI, and import them into the repository.
• After administrators import the flexfields, you can select the flexfield attributes to include in your analyses.
Related Topics
• How Data Is Structured for Analytics
• Overview of Flexfield Use in Analyses
Edit Prebuilt AnalyticsOut of the box you have plenty of analytics to start off with. But you will probably want to modify many of them andmake them your own.
1. Make a copy of the analytic you want to edit.2. Name the copy.3. Find the new analytic and click Edit.4. Select a dimension and the contents appear in the pane.5. From the tabs select Criteria.6. Drag and drop columns from the Subject Area pane to the editing palette.
Right-click the gear icon and get options for editing that column such as filtering and deleting that column from theanalysis.
Review SQL Statements Used in AnalysesYou can review logical and physical SQL statements using either of the following procedures.
Logical and Physical SQLLogical SQL is non-source specific SQL that's issued to the Oracle BI Server for an analysis. Logical queries use columnnames from the subject areas in the Presentation Layer in the repository (RPD) metadata. Based on the logical request,the BI Server issues optimized source-specific SQL to the actual data sources in the Physical Layer of the metadata. Ifyou have administrative privileges, you can review both logical and physical SQL for analyses.
Edit Mode
1. Open the analysis in Edit mode and click the Advanced tab.2. In the SQL Issued section, review the logical SQL statement.
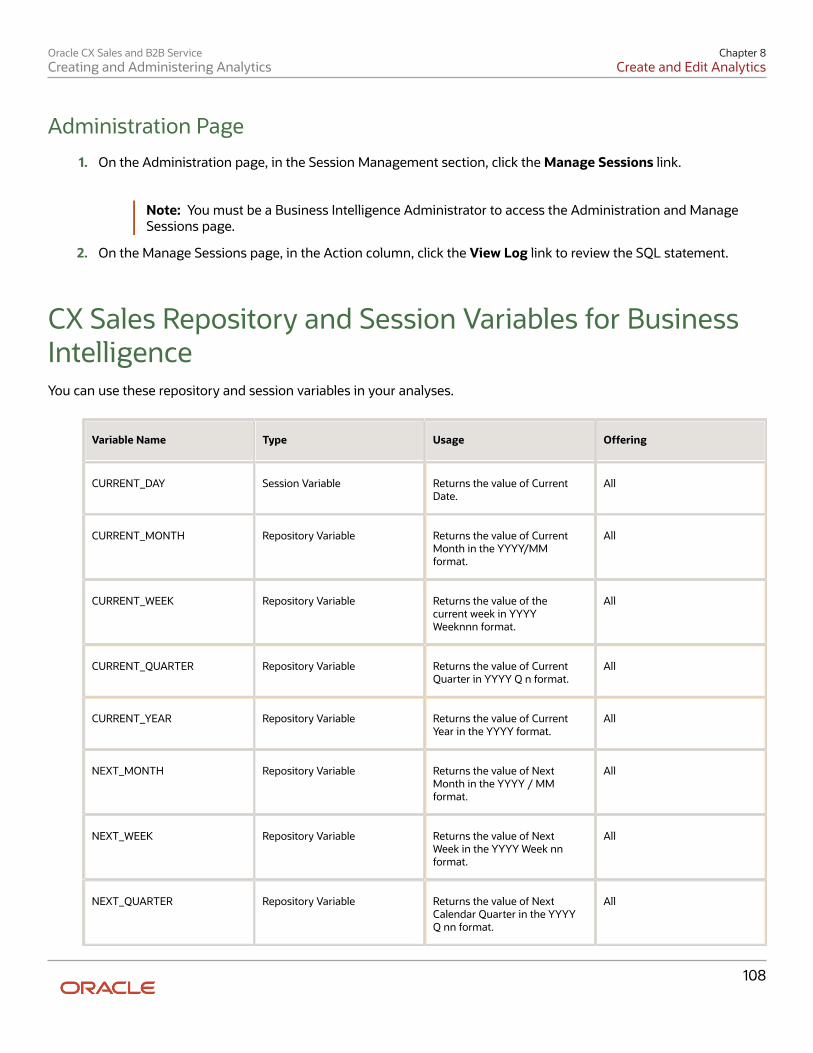
Oracle CX Sales and B2B ServiceCreating and Administering Analytics
Chapter 8Create and Edit Analytics
108
Administration Page
1. On the Administration page, in the Session Management section, click the Manage Sessions link.
Note: You must be a Business Intelligence Administrator to access the Administration and ManageSessions page.
2. On the Manage Sessions page, in the Action column, click the View Log link to review the SQL statement.
CX Sales Repository and Session Variables for BusinessIntelligenceYou can use these repository and session variables in your analyses.
Variable Name Type Usage Offering
CURRENT_DAY Session Variable Returns the value of CurrentDate.
All
CURRENT_MONTH Repository Variable Returns the value of CurrentMonth in the YYYY/MMformat.
All
CURRENT_WEEK Repository Variable Returns the value of thecurrent week in YYYYWeeknnn format.
All
CURRENT_QUARTER Repository Variable Returns the value of CurrentQuarter in YYYY Q n format.
All
CURRENT_YEAR Repository Variable Returns the value of CurrentYear in the YYYY format.
All
NEXT_MONTH Repository Variable Returns the value of NextMonth in the YYYY / MMformat.
All
NEXT_WEEK Repository Variable Returns the value of NextWeek in the YYYY Week nnformat.
All
NEXT_QUARTER Repository Variable Returns the value of NextCalendar Quarter in the YYYYQ nn format.
All
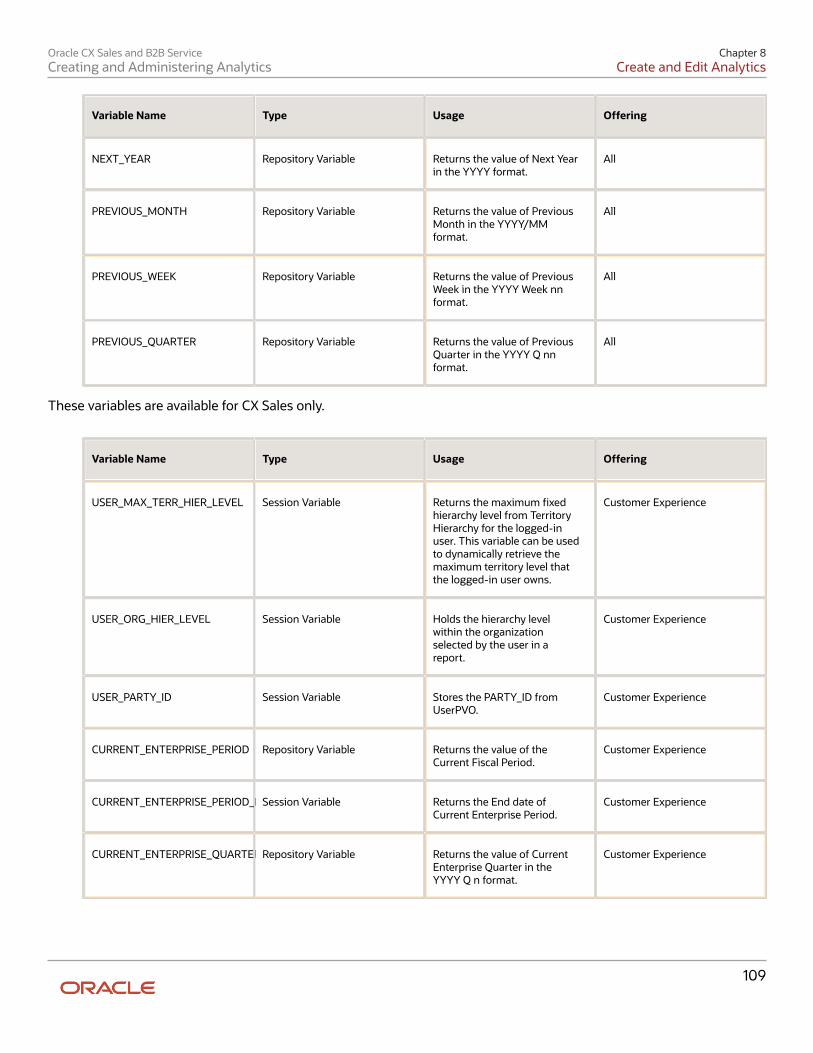
Oracle CX Sales and B2B ServiceCreating and Administering Analytics
Chapter 8Create and Edit Analytics
109
Variable Name Type Usage Offering
NEXT_YEAR Repository Variable Returns the value of Next Yearin the YYYY format.
All
PREVIOUS_MONTH Repository Variable Returns the value of PreviousMonth in the YYYY/MMformat.
All
PREVIOUS_WEEK Repository Variable Returns the value of PreviousWeek in the YYYY Week nnformat.
All
PREVIOUS_QUARTER Repository Variable Returns the value of PreviousQuarter in the YYYY Q nnformat.
All
These variables are available for CX Sales only.
Variable Name Type Usage Offering
USER_MAX_TERR_HIER_LEVEL Session Variable Returns the maximum fixedhierarchy level from TerritoryHierarchy for the logged-inuser. This variable can be usedto dynamically retrieve themaximum territory level thatthe logged-in user owns.
Customer Experience
USER_ORG_HIER_LEVEL Session Variable Holds the hierarchy levelwithin the organizationselected by the user in areport.
Customer Experience
USER_PARTY_ID Session Variable Stores the PARTY_ID fromUserPVO.
Customer Experience
CURRENT_ENTERPRISE_PERIOD Repository Variable Returns the value of theCurrent Fiscal Period.
Customer Experience
CURRENT_ENTERPRISE_PERIOD_END_DATESession Variable Returns the End date ofCurrent Enterprise Period.
Customer Experience
CURRENT_ENTERPRISE_QUARTER Repository Variable Returns the value of CurrentEnterprise Quarter in theYYYY Q n format.
Customer Experience
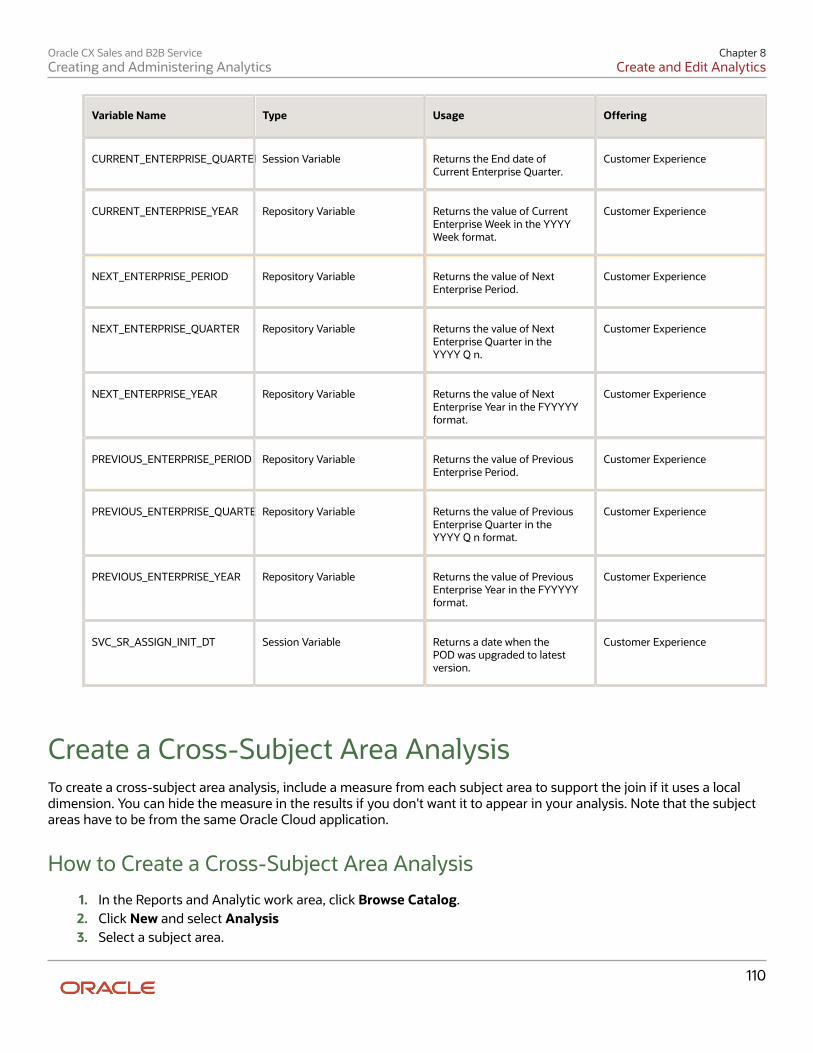
Oracle CX Sales and B2B ServiceCreating and Administering Analytics
Chapter 8Create and Edit Analytics
110
Variable Name Type Usage Offering
CURRENT_ENTERPRISE_QUARTER_END_DATESession Variable Returns the End date ofCurrent Enterprise Quarter.
Customer Experience
CURRENT_ENTERPRISE_YEAR Repository Variable Returns the value of CurrentEnterprise Week in the YYYYWeek format.
Customer Experience
NEXT_ENTERPRISE_PERIOD Repository Variable Returns the value of NextEnterprise Period.
Customer Experience
NEXT_ENTERPRISE_QUARTER Repository Variable Returns the value of NextEnterprise Quarter in theYYYY Q n.
Customer Experience
NEXT_ENTERPRISE_YEAR Repository Variable Returns the value of NextEnterprise Year in the FYYYYYformat.
Customer Experience
PREVIOUS_ENTERPRISE_PERIOD Repository Variable Returns the value of PreviousEnterprise Period.
Customer Experience
PREVIOUS_ENTERPRISE_QUARTERRepository Variable Returns the value of PreviousEnterprise Quarter in theYYYY Q n format.
Customer Experience
PREVIOUS_ENTERPRISE_YEAR Repository Variable Returns the value of PreviousEnterprise Year in the FYYYYYformat.
Customer Experience
SVC_SR_ASSIGN_INIT_DT Session Variable Returns a date when thePOD was upgraded to latestversion.
Customer Experience
Create a Cross-Subject Area AnalysisTo create a cross-subject area analysis, include a measure from each subject area to support the join if it uses a localdimension. You can hide the measure in the results if you don't want it to appear in your analysis. Note that the subjectareas have to be from the same Oracle Cloud application.
How to Create a Cross-Subject Area Analysis
1. In the Reports and Analytic work area, click Browse Catalog.2. Click New and select Analysis3. Select a subject area.
Oracle CX Sales and B2B ServiceCreating and Administering Analytics
Chapter 8Create and Edit Analytics
111
4. In the Criteria tab, expand the dimensions and add a column to the analysis.5. In the Subject Areas region, click Add/Remove Subject Areas.6. In the Subject Area region of the Criteria tab, expand the dimensions and add a column to the analysis.7. If the column is a local dimension, add a measure from the subject area. In any join query, you must add at
least one measure from all subject areas involved, otherwise unexpected results or errors might occur. If it'spreferable to hide the measure in your analysis, select its Column Properties, and in the Column Format tab ofthe Column Properties dialog box, select the Hide check box and click OK.
8. If you're using a local dimension, in the Advanced tab, navigate to the Advanced SQL Clauses section, selectShow Total value for all measures on unrelated dimensions, then click Apply SQL.
9. Click the Results tab to see the analysis results.10. Click the Criteria tab again to return to the analysis definition.
Related Topics
• Overview of Cross-Subject Area Joins
Multiple Subject Area Reporting
Reporting Using Data from More than One Subject AreaYou can create analyses that combine data from more than one subject area using three different methods. This sectiondiscusses these methods and how the results vary depending on which method you use.
Oracle Transactional Business Intelligence organizes reporting data elements such as dimensions and facts by businessfunction in subject areas. Each subject area contains a collection of dimensional attributes and measures relating to theone-dimensional STAR model and grouped into individual folders. The term STAR refers to the semantic model where asingle fact is joined to multiple dimensions.
You can combine results in reporting using one of the three following methods:
• Reporting that combines queries from multiple subject areas.
◦ Using common (conformed) dimensions.
◦ Using local and common (confirmed) dimensions.
• Reporting that uses set operations (Union or Union All for example) to combine more than one result set fromthe same or different subject areas.
• Reporting that uses logical SQL using the Advanced tab.
A Common dimension is a dimension that exists in all subject areas that are being joined in a report. For example, theCustomer dimension is the common dimension for the Sales - CRM Pipeline and Marketing - CRM Leads subjectareas.
A Local dimension is a dimension that is available in one or more of the subject areas, but is not available in all of thesubject areas being joined. For example, Product is a local dimension for the Sales - CRM Pipeline subject area, andActivity is a local dimension for the CRM - CRM Activity Real Time subject area.
Oracle CX Sales and B2B ServiceCreating and Administering Analytics
Chapter 8Create and Edit Analytics
112
Examples of Reporting Using Data from More than One SubjectAreaThe simplest and fastest way to generate a report is to use a single subject area. If the dimension attributes and factmetrics that you're interested in are all available from a single subject area, then you should use that subject area forreporting. Using single subject areas for reporting results in better performance and is much easier to maintain. But ifyour reporting requirements can't be met by any single subject area, the recommended option is to build a query usingdimensions common across subject areas.
Combining Queries from Multiple Subject AreasWhen you're reporting with multiple subject areas, keep in mind that if you use three subject areas for an analytic, yourcommon dimensions must exist in all three subject areas. Joining on common dimensions gives you the benefit ofincluding any metric from any of the subject areas in a single analysis.
While you can create an analysis joining any subject area to which you have access, only a cross subject area query thatuses common dimensions returns data that's at the same dimension grain. This happens so that the data is cleanlymerged, and the results is an analysis that returns exactly the data you want to see.
When a cross subject area analysis is generated, separate queries are executed for each subject area in the analysis andthe results are merged to generate the final analysis. The data that's returned from the different subject areas is mergedusing the common dimensions. When you use common dimensions, the result set returned by each subject area queryis at the same dimensional grain, so it can be cleanly merged and rendered in the analysis. The next topic shows anexample of reporting using different subject areas with common dimensions.
Common Dimension ReportingIn this case, to use multiple subject areas for reporting, we are using common dimensions. We want to pull the numberof Opportunities, number of Opportunity Revenue Lines, number of Leads, and number of Activities by Customer. Thecommon dimension in all three subject areas used for this analysis is Customer and different fact metrics are pulledfrom each subject area.
We're using these subject areas:
• "Marketing - CRM Leads"
• "Sales - CRM Pipeline"
• "CRM - CRM Activity Real Time"
Start by creating an analysis using the Marketing - CRM Leads Subject area. You add the second and third subject areaused in the cross-subject area analysis by clicking Add/Remove Subject Areas icon in the Subject Areas section.
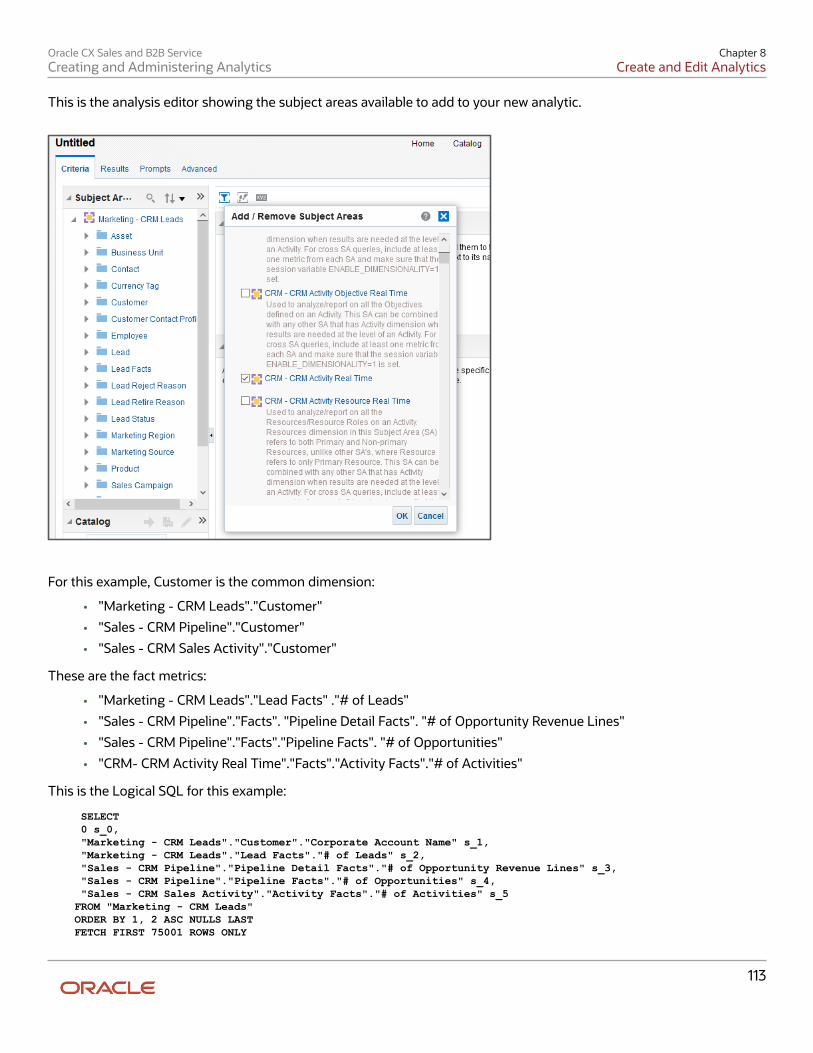
Oracle CX Sales and B2B ServiceCreating and Administering Analytics
Chapter 8Create and Edit Analytics
113
This is the analysis editor showing the subject areas available to add to your new analytic.
For this example, Customer is the common dimension:
• "Marketing - CRM Leads"."Customer"
• "Sales - CRM Pipeline"."Customer"
• "Sales - CRM Sales Activity"."Customer"
These are the fact metrics:
• "Marketing - CRM Leads"."Lead Facts" ."# of Leads"
• "Sales - CRM Pipeline"."Facts". "Pipeline Detail Facts". "# of Opportunity Revenue Lines"
• "Sales - CRM Pipeline"."Facts"."Pipeline Facts". "# of Opportunities"
• "CRM- CRM Activity Real Time"."Facts"."Activity Facts"."# of Activities"
This is the Logical SQL for this example:
SELECT 0 s_0, "Marketing - CRM Leads"."Customer"."Corporate Account Name" s_1, "Marketing - CRM Leads"."Lead Facts"."# of Leads" s_2, "Sales - CRM Pipeline"."Pipeline Detail Facts"."# of Opportunity Revenue Lines" s_3, "Sales - CRM Pipeline"."Pipeline Facts"."# of Opportunities" s_4, "Sales - CRM Sales Activity"."Activity Facts"."# of Activities" s_5FROM "Marketing - CRM Leads"ORDER BY 1, 2 ASC NULLS LASTFETCH FIRST 75001 ROWS ONLY
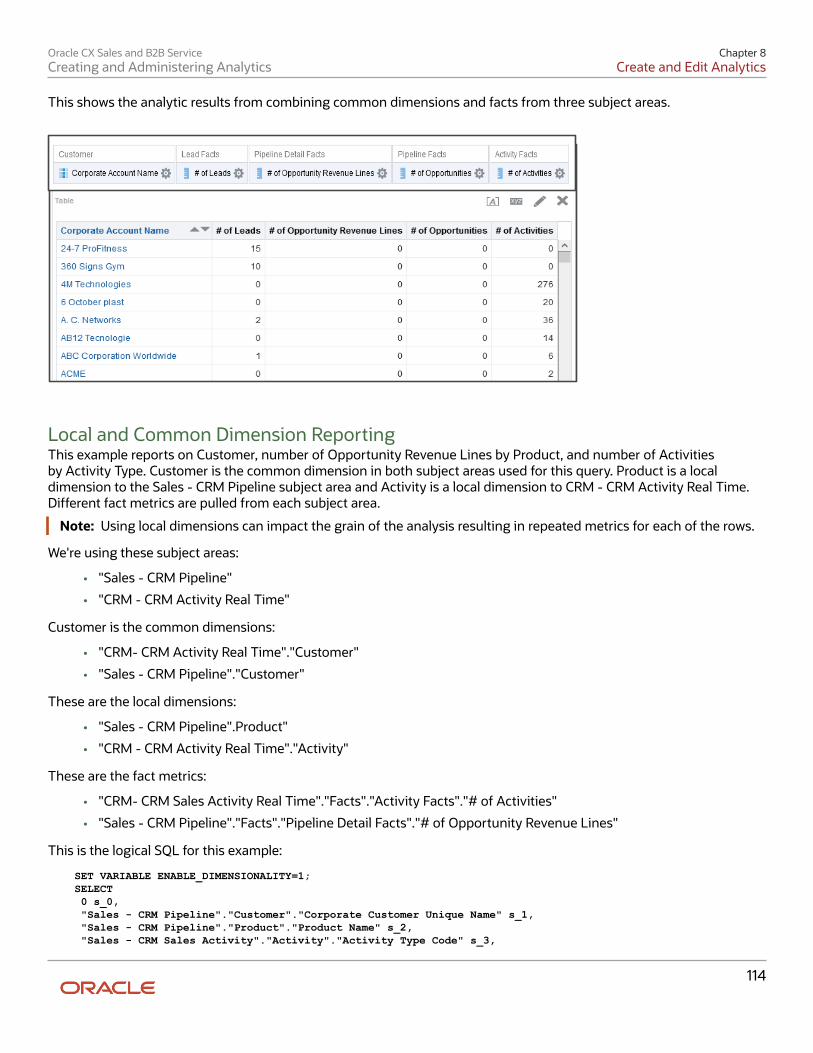
Oracle CX Sales and B2B ServiceCreating and Administering Analytics
Chapter 8Create and Edit Analytics
114
This shows the analytic results from combining common dimensions and facts from three subject areas.
Local and Common Dimension ReportingThis example reports on Customer, number of Opportunity Revenue Lines by Product, and number of Activitiesby Activity Type. Customer is the common dimension in both subject areas used for this query. Product is a localdimension to the Sales - CRM Pipeline subject area and Activity is a local dimension to CRM - CRM Activity Real Time.Different fact metrics are pulled from each subject area.
Note: Using local dimensions can impact the grain of the analysis resulting in repeated metrics for each of the rows.
We're using these subject areas:
• "Sales - CRM Pipeline"
• "CRM - CRM Activity Real Time"
Customer is the common dimensions:
• "CRM- CRM Activity Real Time"."Customer"
• "Sales - CRM Pipeline"."Customer"
These are the local dimensions:
• "Sales - CRM Pipeline".Product"
• "CRM - CRM Activity Real Time"."Activity"
These are the fact metrics:
• "CRM- CRM Sales Activity Real Time"."Facts"."Activity Facts"."# of Activities"
• "Sales - CRM Pipeline"."Facts"."Pipeline Detail Facts"."# of Opportunity Revenue Lines"
This is the logical SQL for this example:
SET VARIABLE ENABLE_DIMENSIONALITY=1; SELECT 0 s_0, "Sales - CRM Pipeline"."Customer"."Corporate Customer Unique Name" s_1, "Sales - CRM Pipeline"."Product"."Product Name" s_2, "Sales - CRM Sales Activity"."Activity"."Activity Type Code" s_3,
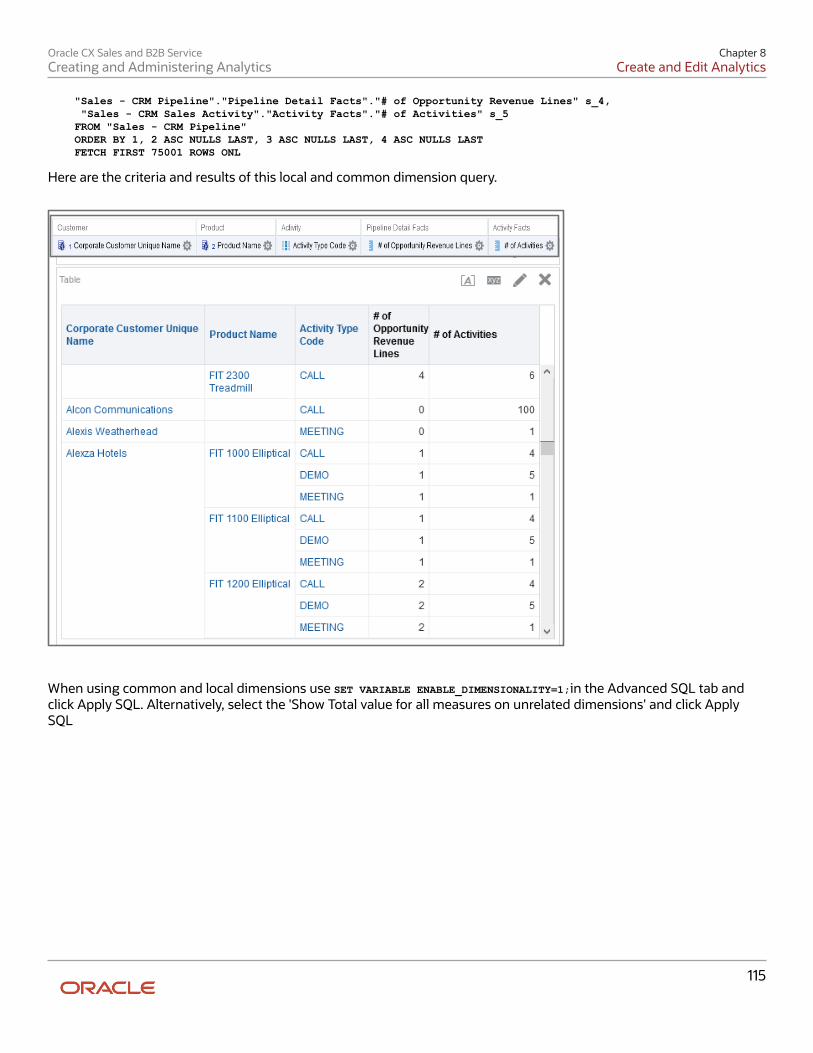
Oracle CX Sales and B2B ServiceCreating and Administering Analytics
Chapter 8Create and Edit Analytics
115
"Sales - CRM Pipeline"."Pipeline Detail Facts"."# of Opportunity Revenue Lines" s_4, "Sales - CRM Sales Activity"."Activity Facts"."# of Activities" s_5FROM "Sales - CRM Pipeline"ORDER BY 1, 2 ASC NULLS LAST, 3 ASC NULLS LAST, 4 ASC NULLS LASTFETCH FIRST 75001 ROWS ONL
Here are the criteria and results of this local and common dimension query.
When using common and local dimensions use SET VARIABLE ENABLE_DIMENSIONALITY=1;in the Advanced SQL tab andclick Apply SQL. Alternatively, select the 'Show Total value for all measures on unrelated dimensions' and click ApplySQL
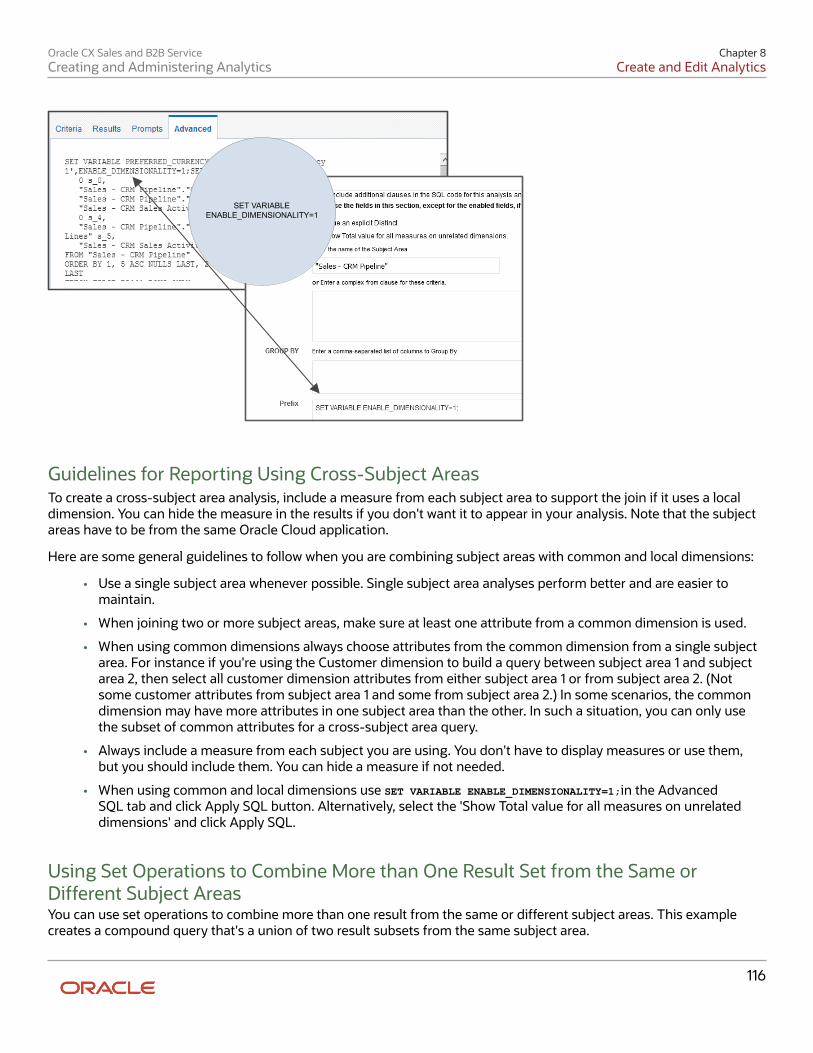
Oracle CX Sales and B2B ServiceCreating and Administering Analytics
Chapter 8Create and Edit Analytics
116
SET VARIABLE ENABLE_DIMENSIONALITY=1
Guidelines for Reporting Using Cross-Subject AreasTo create a cross-subject area analysis, include a measure from each subject area to support the join if it uses a localdimension. You can hide the measure in the results if you don't want it to appear in your analysis. Note that the subjectareas have to be from the same Oracle Cloud application.
Here are some general guidelines to follow when you are combining subject areas with common and local dimensions:
• Use a single subject area whenever possible. Single subject area analyses perform better and are easier tomaintain.
• When joining two or more subject areas, make sure at least one attribute from a common dimension is used.
• When using common dimensions always choose attributes from the common dimension from a single subjectarea. For instance if you're using the Customer dimension to build a query between subject area 1 and subjectarea 2, then select all customer dimension attributes from either subject area 1 or from subject area 2. (Notsome customer attributes from subject area 1 and some from subject area 2.) In some scenarios, the commondimension may have more attributes in one subject area than the other. In such a situation, you can only usethe subset of common attributes for a cross-subject area query.
• Always include a measure from each subject you are using. You don't have to display measures or use them,but you should include them. You can hide a measure if not needed.
• When using common and local dimensions use SET VARIABLE ENABLE_DIMENSIONALITY=1;in the AdvancedSQL tab and click Apply SQL button. Alternatively, select the 'Show Total value for all measures on unrelateddimensions' and click Apply SQL.
Using Set Operations to Combine More than One Result Set from the Same orDifferent Subject AreasYou can use set operations to combine more than one result from the same or different subject areas. This examplecreates a compound query that's a union of two result subsets from the same subject area.
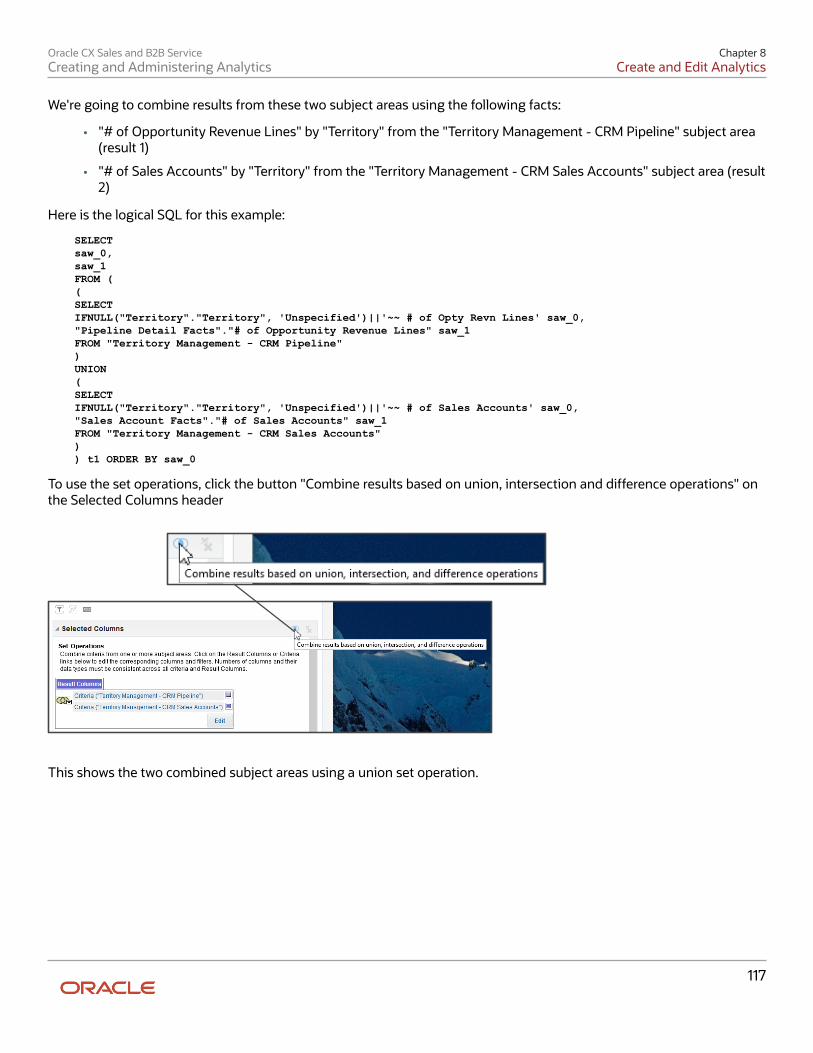
Oracle CX Sales and B2B ServiceCreating and Administering Analytics
Chapter 8Create and Edit Analytics
117
We're going to combine results from these two subject areas using the following facts:
• "# of Opportunity Revenue Lines" by "Territory" from the "Territory Management - CRM Pipeline" subject area(result 1)
• "# of Sales Accounts" by "Territory" from the "Territory Management - CRM Sales Accounts" subject area (result2)
Here is the logical SQL for this example:
SELECTsaw_0,saw_1FROM ((SELECTIFNULL("Territory"."Territory", 'Unspecified')||'~~ # of Opty Revn Lines' saw_0,"Pipeline Detail Facts"."# of Opportunity Revenue Lines" saw_1FROM "Territory Management - CRM Pipeline")UNION(SELECTIFNULL("Territory"."Territory", 'Unspecified')||'~~ # of Sales Accounts' saw_0,"Sales Account Facts"."# of Sales Accounts" saw_1FROM "Territory Management - CRM Sales Accounts")) t1 ORDER BY saw_0
To use the set operations, click the button "Combine results based on union, intersection and difference operations" onthe Selected Columns header
This shows the two combined subject areas using a union set operation.
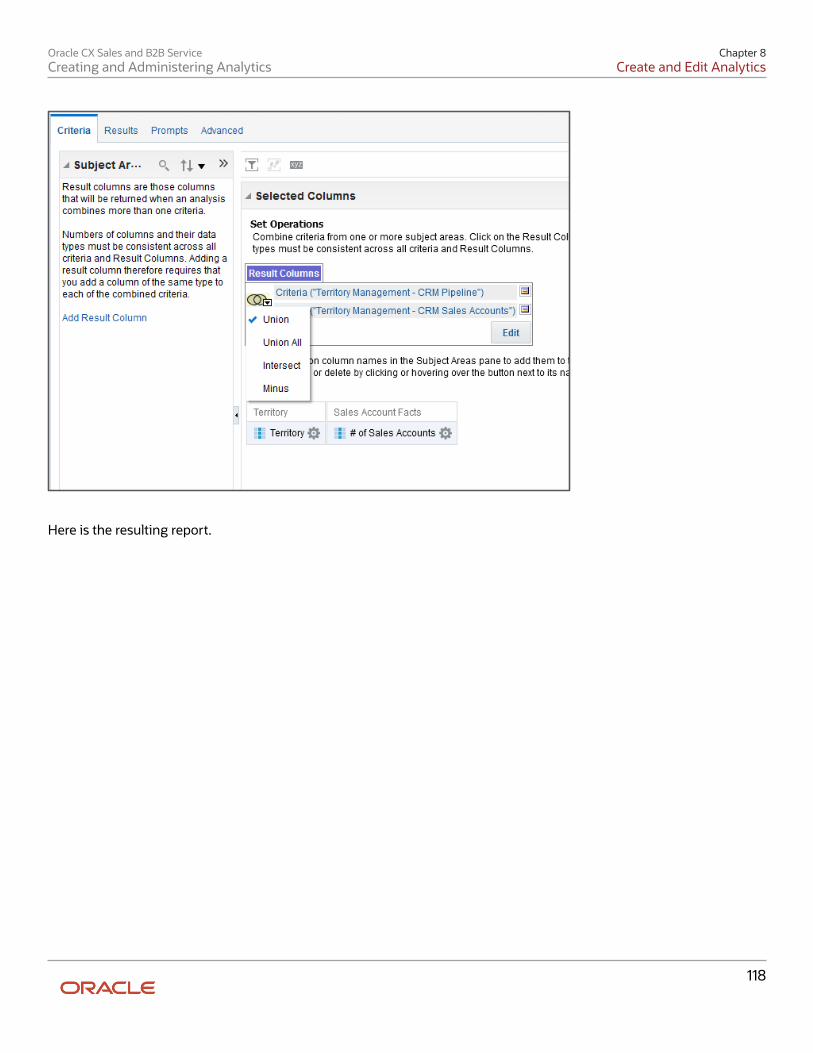
Oracle CX Sales and B2B ServiceCreating and Administering Analytics
Chapter 8Create and Edit Analytics
118
Here is the resulting report.
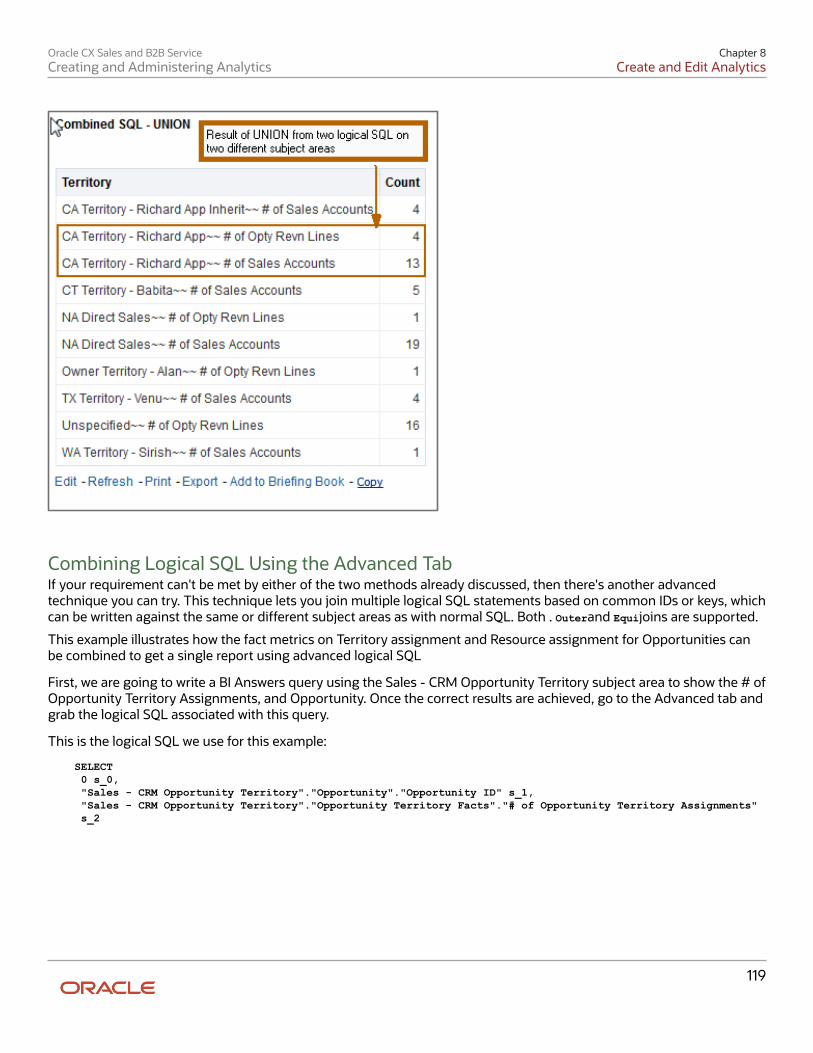
Oracle CX Sales and B2B ServiceCreating and Administering Analytics
Chapter 8Create and Edit Analytics
119
Combining Logical SQL Using the Advanced TabIf your requirement can't be met by either of the two methods already discussed, then there's another advancedtechnique you can try. This technique lets you join multiple logical SQL statements based on common IDs or keys, whichcan be written against the same or different subject areas as with normal SQL. Both . Outerand Equijoins are supported.
This example illustrates how the fact metrics on Territory assignment and Resource assignment for Opportunities canbe combined to get a single report using advanced logical SQL
First, we are going to write a BI Answers query using the Sales - CRM Opportunity Territory subject area to show the # ofOpportunity Territory Assignments, and Opportunity. Once the correct results are achieved, go to the Advanced tab andgrab the logical SQL associated with this query.
This is the logical SQL we use for this example:
SELECT 0 s_0, "Sales - CRM Opportunity Territory"."Opportunity"."Opportunity ID" s_1, "Sales - CRM Opportunity Territory"."Opportunity Territory Facts"."# of Opportunity Territory Assignments" s_2
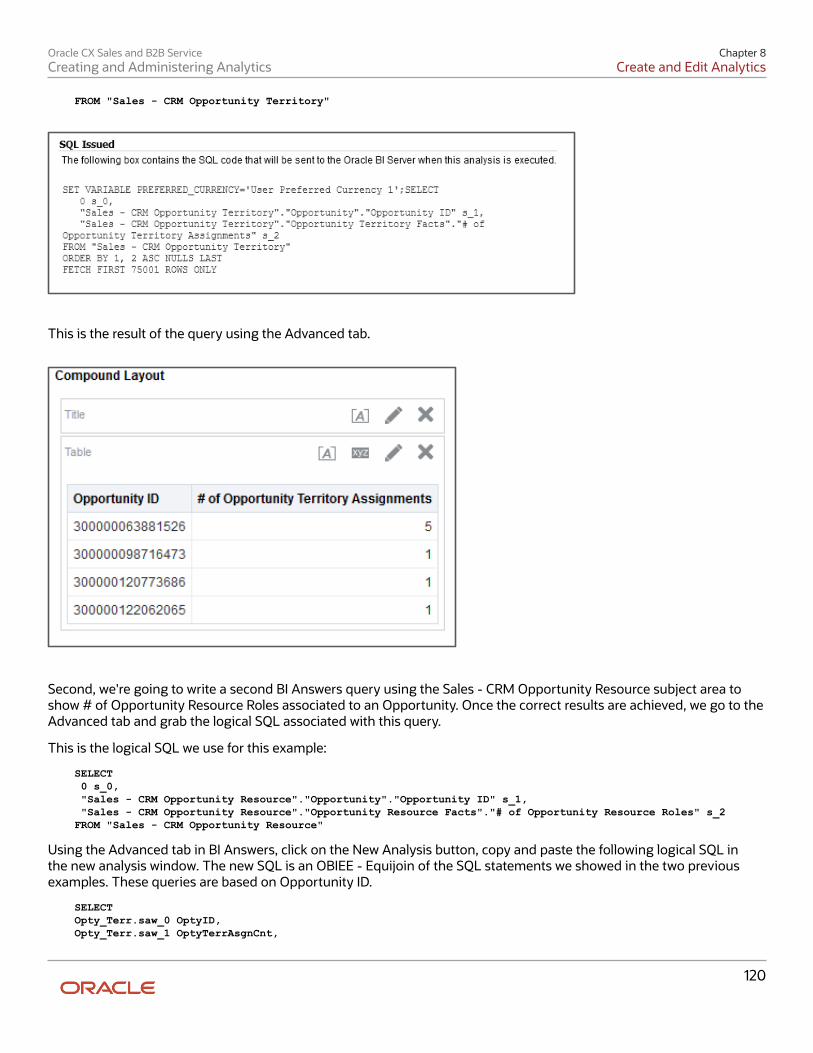
Oracle CX Sales and B2B ServiceCreating and Administering Analytics
Chapter 8Create and Edit Analytics
120
FROM "Sales - CRM Opportunity Territory"
This is the result of the query using the Advanced tab.
Second, we're going to write a second BI Answers query using the Sales - CRM Opportunity Resource subject area toshow # of Opportunity Resource Roles associated to an Opportunity. Once the correct results are achieved, we go to theAdvanced tab and grab the logical SQL associated with this query.
This is the logical SQL we use for this example:
SELECT 0 s_0, "Sales - CRM Opportunity Resource"."Opportunity"."Opportunity ID" s_1, "Sales - CRM Opportunity Resource"."Opportunity Resource Facts"."# of Opportunity Resource Roles" s_2FROM "Sales - CRM Opportunity Resource"
Using the Advanced tab in BI Answers, click on the New Analysis button, copy and paste the following logical SQL inthe new analysis window. The new SQL is an OBIEE - Equijoin of the SQL statements we showed in the two previousexamples. These queries are based on Opportunity ID.
SELECT Opty_Terr.saw_0 OptyID, Opty_Terr.saw_1 OptyTerrAsgnCnt,
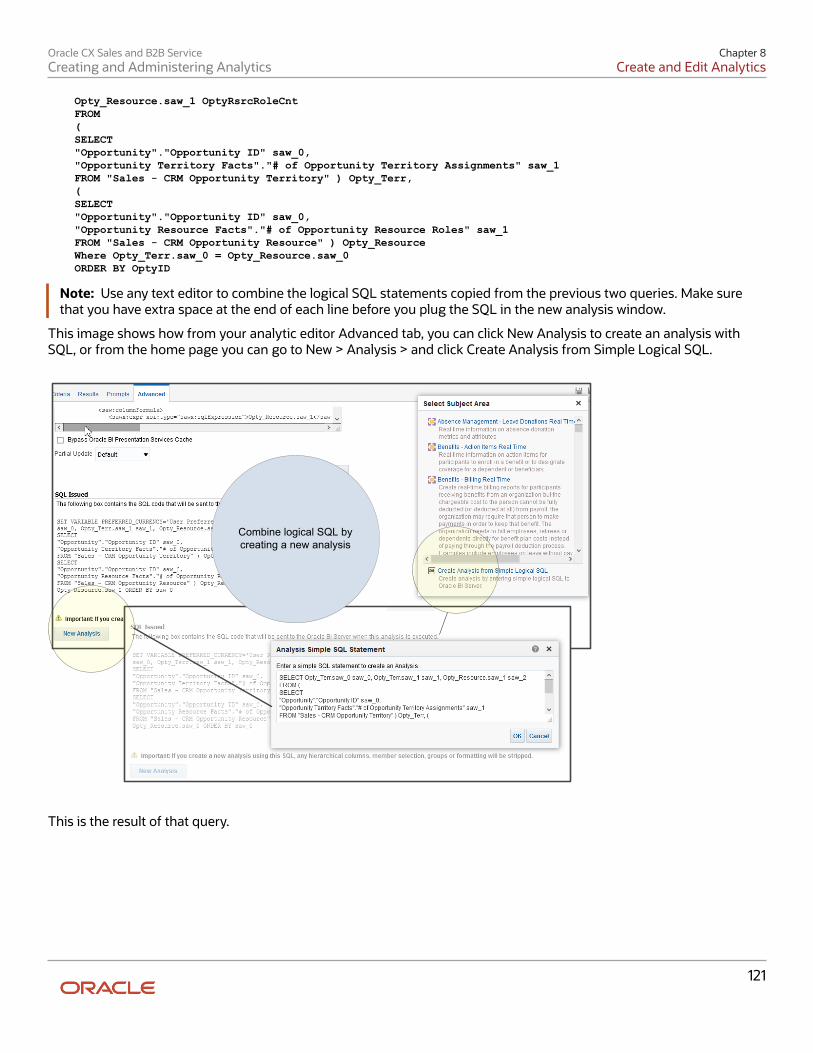
Oracle CX Sales and B2B ServiceCreating and Administering Analytics
Chapter 8Create and Edit Analytics
121
Opty_Resource.saw_1 OptyRsrcRoleCnt FROM ( SELECT "Opportunity"."Opportunity ID" saw_0, "Opportunity Territory Facts"."# of Opportunity Territory Assignments" saw_1 FROM "Sales - CRM Opportunity Territory" ) Opty_Terr, ( SELECT "Opportunity"."Opportunity ID" saw_0, "Opportunity Resource Facts"."# of Opportunity Resource Roles" saw_1 FROM "Sales - CRM Opportunity Resource" ) Opty_Resource Where Opty_Terr.saw_0 = Opty_Resource.saw_0 ORDER BY OptyID
Note: Use any text editor to combine the logical SQL statements copied from the previous two queries. Make surethat you have extra space at the end of each line before you plug the SQL in the new analysis window.
This image shows how from your analytic editor Advanced tab, you can click New Analysis to create an analysis withSQL, or from the home page you can go to New > Analysis > and click Create Analysis from Simple Logical SQL.
Combine logical SQL by creating a new analysis
This is the result of that query.
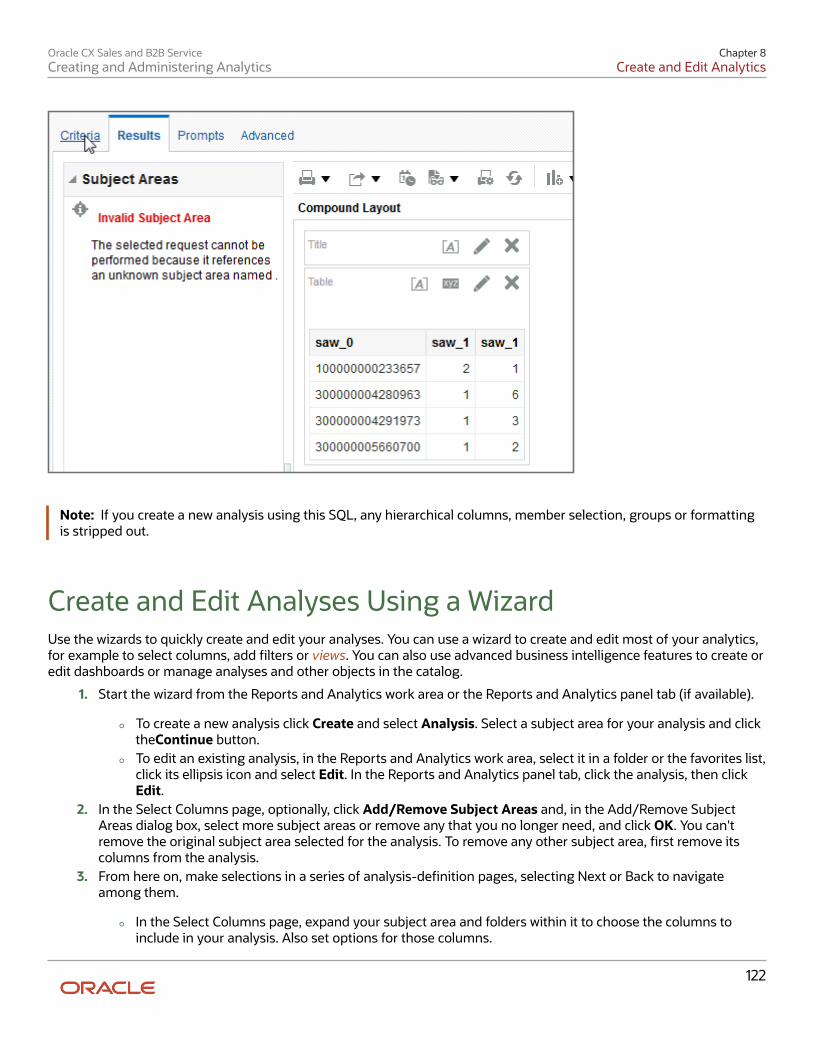
Oracle CX Sales and B2B ServiceCreating and Administering Analytics
Chapter 8Create and Edit Analytics
122
Note: If you create a new analysis using this SQL, any hierarchical columns, member selection, groups or formattingis stripped out.
Create and Edit Analyses Using a WizardUse the wizards to quickly create and edit your analyses. You can use a wizard to create and edit most of your analytics,for example to select columns, add filters or views. You can also use advanced business intelligence features to create oredit dashboards or manage analyses and other objects in the catalog.
1. Start the wizard from the Reports and Analytics work area or the Reports and Analytics panel tab (if available).
◦ To create a new analysis click Create and select Analysis. Select a subject area for your analysis and clicktheContinue button.
◦ To edit an existing analysis, in the Reports and Analytics work area, select it in a folder or the favorites list,click its ellipsis icon and select Edit. In the Reports and Analytics panel tab, click the analysis, then clickEdit.
2. In the Select Columns page, optionally, click Add/Remove Subject Areas and, in the Add/Remove SubjectAreas dialog box, select more subject areas or remove any that you no longer need, and click OK. You can'tremove the original subject area selected for the analysis. To remove any other subject area, first remove itscolumns from the analysis.
3. From here on, make selections in a series of analysis-definition pages, selecting Next or Back to navigateamong them.
◦ In the Select Columns page, expand your subject area and folders within it to choose the columns toinclude in your analysis. Also set options for those columns.
Oracle CX Sales and B2B ServiceCreating and Administering Analytics
Chapter 8Create and Edit Analytics
123
◦ In the Select Views page, determine whether your analysis is to include a table, a graph, or both. Foreither, select among several types. If you include both, select the order in which they appear.
◦ In Edit Table and Edit Graph pages, select options that apply to your table and graph layouts. Each ofthese pages is active only if you selected the item it applies to in the Select Views page.
◦ In the Sort and Filter page, optionally apply filters to columns to refine the selection of records in youranalysis, and apply sorts to them to order your results.
◦ In the Highlight page, optionally add color highlights based on numeric thresholds you set.
◦ In the Save page, enter a name for the analysis, select a catalog folder to save it in, and click Submit.
In general, these pages are designed so that procedures for using them are readily apparent. Even so, here are somethings you will want to know.
Select Columns PageFor each column in your analysis, you select an Interaction option.
• Two of the options, Default and Drill, do the same thing: If you click on a column header, the analysis adds acolumn displaying values at the next hierarchical level. (For example, if you click on Control Name, the analysisadds a Control ID column.) If you click on a column value, the analysis adds the subordinate column, but alsofilters to display only records containing the value you clicked.
• Navigate to Transaction: If you click on a value from a column for which this option is set, the analysis presentsa link to the record of an object the value applies to.
For such links to work, however, further configuration is required: You need to define paths to the recordsthat are to be opened. If you want to use this option, you're probably better off creating the analysis in the BICatalog. However, you can create it in the wizard, then edit it in the BI Catalog. See the topic titled Link Analysesto Application Pages.
• None: This option in effect turns the Default option off and turns nothing on. Nothing happens if you click on avalue in a column for which this option is set.
For each column, you can also select a Hidden option. This prevents the analysis from displaying the column, but leavesits values available for use behind the scenes, for example in filters.
Select Views PageYou can add a graph to your analysis only if it includes at least one column from a fact folder. (You can include a tablein your analysis no matter what columns you select for it.) A fact column contains numeric values, such as counts ofincidents returned by advanced controls. Other columns contain attributes of objects, such as names of advancedcontrols. Without numeric values, there's nothing to base a graph on.
You can create a title for the analysis in this page, but doing so is optional. You also create a name for the analysis in theSave page, and that one is required. If you create both, the analysis displays both; they don't have to be the same.
You can use a Preview option to ensure the analysis returns data you expect. Turn it on or off in this page or insubsequent wizard pages. Once it's on, the preview remains on in other wizard pages you navigate to, unless you turn itoff.
Oracle CX Sales and B2B ServiceCreating and Administering Analytics
Chapter 8Create and Edit Analytics
124
Edit Table PageHere are the layout options you can select for tables:
• Columns: This is the default. Each column you assign this value to appears as a column in the table.
• Prompt For: In a prompt field, you select among values from the column you're configuring. For example, youwould select a date if the column were Calendar Month Start Date. The table would then display only rowscontaining the value you selected.
• Section By: The table is divided into sections. Each value of the column you're configuring becomes a header,and the section beneath each header includes rows containing that value.
• Excluded: The column you select is no longer available to the view you're configuring. The column is hidden,and its values are unavailable for behind-the-scenes tasks such as filtering. However, the column remainsavailable to other views in your analysis.
Edit Graph PageYou can't apply layout options to fact columns. For other columns, graph layout options include Prompt For, Section By,and Excluded, which have the same effect as they do in tables. You can also apply these options in graphs:
• Vary Color By: Each value in the column you're configuring is represented by a distinct color in the graph.
• Group By: Values in the columns you assign this option to are combined in the graph. For example, if you selectthis option for the State and Calendar Month Start Date columns in a bar graph, each bar represents a particularstatus on a particular date.
Highlight PageYou can use this feature only if your analysis includes at least one fact column, and you can apply it only to factcolumns.
Related Topics• View Analytics, Reports, and Dashboards• Where to Save Analytics and Reports• How Data Is Structured for Analytics
Manage Analytics with Advanced FeaturesWizards are an easy way to create or edit analyses. But you might have to use advanced features for complicatedanalyses or specific requirements. For example, you can create view selectors so that users can toggle between viewswithin an analysis, or define criteria for filters using SQL statements.
You can also perform other actions on analyses, for example delete them or copy and paste them within the businessintelligence catalog.
How to Create and Edit Analytics1. In the Reports and Analytics work area or the Reports and Analytics panel tab (if available), click the Browse
Catalog button.
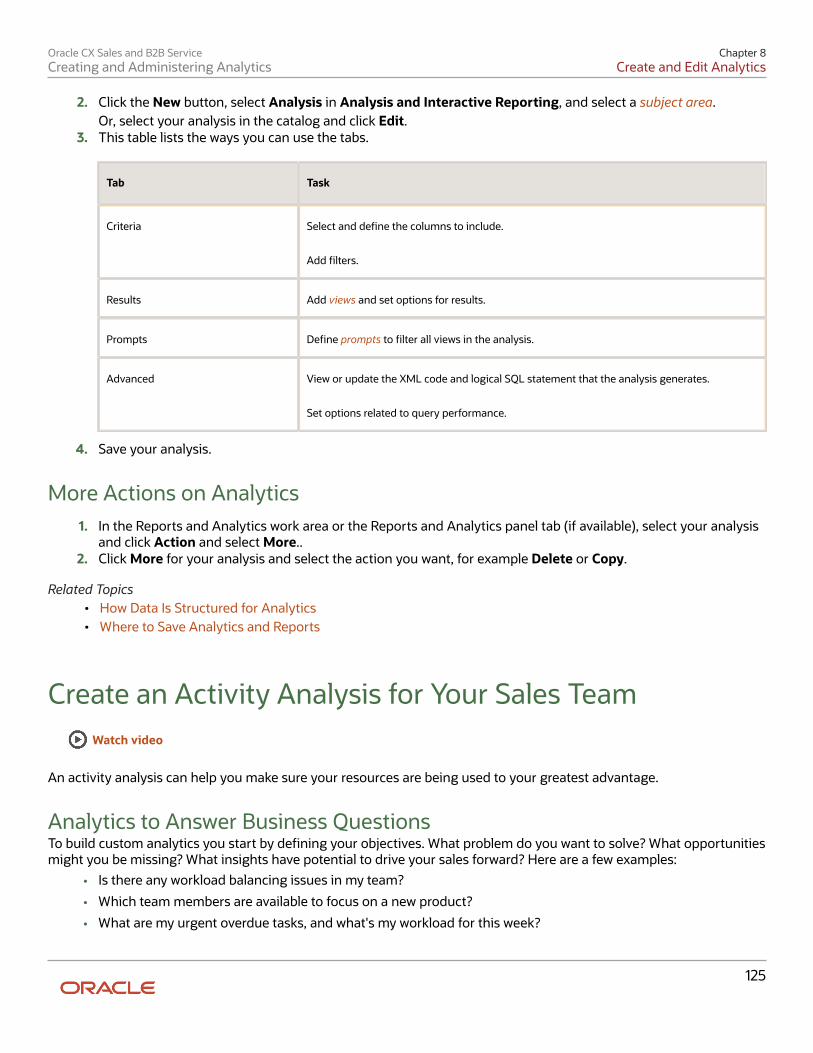
Oracle CX Sales and B2B ServiceCreating and Administering Analytics
Chapter 8Create and Edit Analytics
125
2. Click the New button, select Analysis in Analysis and Interactive Reporting, and select a subject area.Or, select your analysis in the catalog and click Edit.
3. This table lists the ways you can use the tabs.
Tab Task
Criteria Select and define the columns to include.
Add filters.
Results Add views and set options for results.
Prompts Define prompts to filter all views in the analysis.
Advanced View or update the XML code and logical SQL statement that the analysis generates.
Set options related to query performance.
4. Save your analysis.
More Actions on Analytics1. In the Reports and Analytics work area or the Reports and Analytics panel tab (if available), select your analysis
and click Action and select More..2. Click More for your analysis and select the action you want, for example Delete or Copy.
Related Topics• How Data Is Structured for Analytics• Where to Save Analytics and Reports
Create an Activity Analysis for Your Sales TeamWatch video
An activity analysis can help you make sure your resources are being used to your greatest advantage.
Analytics to Answer Business QuestionsTo build custom analytics you start by defining your objectives. What problem do you want to solve? What opportunitiesmight you be missing? What insights have potential to drive your sales forward? Here are a few examples:
• Is there any workload balancing issues in my team?
• Which team members are available to focus on a new product?
• What are my urgent overdue tasks, and what's my workload for this week?
Oracle CX Sales and B2B ServiceCreating and Administering Analytics
Chapter 8Create and Edit Analytics
126
• How is my team performing?
• Which accounts are my sales representative focusing on and does this align with business priorities?
• Which accounts can I focus on more to meet our business objectives?
Create Your Own Activity AnalysisYou Sales Manager wants to see how much their team is interacting with potential opportunities. How many times hasa potential customer been contacted? And how have they been contacted? Let's try creating an activity analysis to helpour Sales Manager figure things out.
1. In BI, Click New analysis.2. Select CRM - CRM Activity Real Time.
◦ From the dimension Customer, add Account Name.
◦ From the dimension Employee, add Last Name.
◦ From the Facts folder, add # of Activities.
3. You can filter Customer to see a specific account, select the properties on Account Name.4. You select the filter to show only A.C. Networks, for example, and click OK.5. Click Results. The Results tab shows your analysis at this point. Move back and forth from Criteria to Results at
any time to see your analysis.6. Name and save your analysis.
Now you can check out everything that has been going on with with A.C. Networks. Is it time to reach out to them againand tell them about some new stuff you're offering?
Create an Opportunity AnalysisYou can keep an eye on your revenue pipeline using Opportunity analytics. Opportunities can be looked at overdifferent time periods, or the current time period. You can examine each stage of an opportunity and the associatedrevenue for that stage.
How to Create an Opportunity Analysis
The simple analysis you build in this example shows Total Revenue, Open Pipeline, and Won Revenue for salesrepresentatives for the current quarter. Keep in mind you can add any columns you want from the CRM Pipeline subjectarea. You can even add columns from other subject areas. But for this exercise, let's keep it simple.
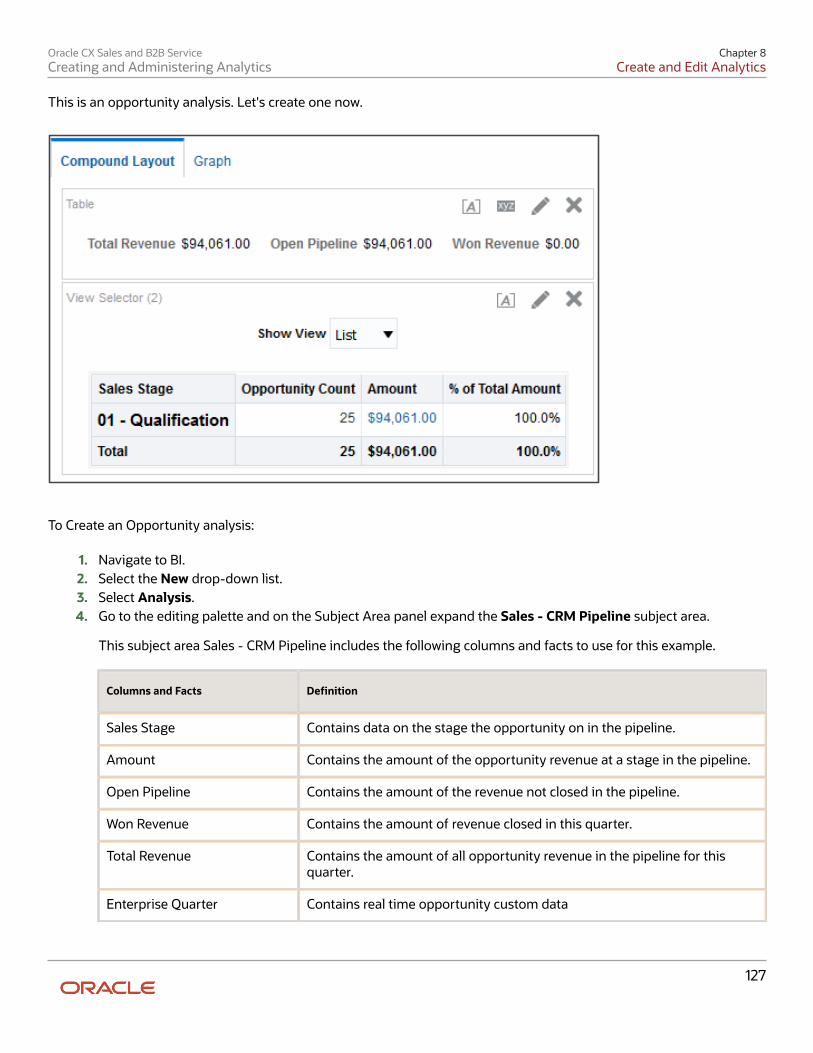
Oracle CX Sales and B2B ServiceCreating and Administering Analytics
Chapter 8Create and Edit Analytics
127
This is an opportunity analysis. Let's create one now.
To Create an Opportunity analysis:
1. Navigate to BI.2. Select the New drop-down list.3. Select Analysis.4. Go to the editing palette and on the Subject Area panel expand the Sales - CRM Pipeline subject area.
This subject area Sales - CRM Pipeline includes the following columns and facts to use for this example.
Columns and Facts Definition
Sales Stage Contains data on the stage the opportunity on in the pipeline.
Amount Contains the amount of the opportunity revenue at a stage in the pipeline.
Open Pipeline Contains the amount of the revenue not closed in the pipeline.
Won Revenue Contains the amount of revenue closed in this quarter.
Total Revenue Contains the amount of all opportunity revenue in the pipeline for thisquarter.
Enterprise Quarter Contains real time opportunity custom data
Oracle CX Sales and B2B ServiceCreating and Administering Analytics
Chapter 8Create and Edit Analytics
128
Columns and Facts Definition
Pipeline Facts: Number ofOpportunities
Contains real time revenue data
5. In the Subject Areas Panel, in the Sales - CRM Opportunities subject area, expand Historical Sales Stage. Addthe columns: Sales Stage, Sales Stage Name, and Sales Stage Row ID.
6. Expand Pipeline Detail Facts: Add Amount, Open Pipeline, , Won Revenue, % of Total Amount.7. Expand Pipeline Facts:# of Opportunities.8. Expand Employee. Add Employee Row ID.9. Expand Time. Add Enterprise Quarter.
10. Expand Employee. Add Employee Login. On the editing palette, on Employee Login, hover over the gear imageand from the drop-down list menu and select Filter. Under Add More Options select Session Variable. In theSession Variable add: USER_PARTY_ID. Select OK. From the drop-down list again, select Delete. You only addedthe column to add the variable. Adding this variable tells the application to show data for the signed in userspecific to her opportunities only.
11. That's it. Now let's see what it looks like. Select the Results tab and there it is. Don't forget to name and saveyour analytics.
Create and Filter an Historical Trending AnalysisLooking at a broad view of your pipeline helps you get a sense of what things might look like in the future. How does therevenue in your pipeline look this quarter, compared to previous quarters? Maybe there are potential problems downthe road you need get a jump on now. Let's build a historical trending analysis and see how things are shaping up.
How to Create an Historical Trending AnalysisHistorical Trending analytics use the subject area Sales - CRM Opportunity Sales Stage Snapshot. This subject area isspecifically designed for reporting on opportunities and revenues against their daily, weekly or monthly (depending onthe enterprise calendar period setup), quarterly and yearly trends or to compare opportunity and revenue data againstspecific points in time.
To Create an Historical Trending Analysis:
1. Navigate to BI.2. Choose New.3. Select Analysis.4. Select the Sales - CRM Historical Pipeline subject area. You may need to scroll down.5. In the regional area, expand Opportunity.6. Double-click Opportunity Name to add it to the Selected Columns section. You may need to scroll down to
locate Opportunity Name.7. Add Owner First Name.8. Add Owner Last Name.
Oracle CX Sales and B2B ServiceCreating and Administering Analytics
Chapter 8Create and Edit Analytics
129
9. Expand Customer and add Customer Name.10. Collapse Customer and expand Industry.11. Add Industry Name and collapse Industry.12. Expand Product and add Product Name.13. Collapse Product and expand Revenue.14. Add Revenue ID and collapse Revenue.15. Expand Pipeline Snapshot Date.
Notice that you can choose a pipeline date, period (week or month), quarter, or year.16. Add Pipeline Snapshot Date and collapse Pipeline Snapshot Date.17. Expand Historical Pipeline Detail Facts.
Notice that you can add facts on revenue lines, open or closed opportunities, or both.18. Add Opportunity Line Revenue.19. Verify your columns.
After you create a historical trending report, you should create filters for your report. The next section showsyou how.
Filtering Historical AnalyticsYou can filter your analytics to show open or closed opportunites, and more.
1. Click Create a filter for the current Subject Area, in the local area, under Filters.2. In the drop-down list, click More Columns.3. In the dialog box, expand Opportunity.4. Select Opportunity Status Category.5. Click OK.6. Verify that Operator = is equal to / is in.7. Select Value = OPEN.8. Click OK to close the New Filter dialog box.
After creating your filters for your historical trending report, name and save your analysis.
Create and Edit DashboardsYou can create and edit dashboards and define their content and layout to organize your analytics and other objects tocreate meaningful and navigable palettes of information. In addition to objects in the business intelligence (BI) catalog,such as analyses, reports, and prompts, you can add text, sections, and more to a dashboard.
Create a Dashboard1. Open the Reports and Analytics work area, or the Reports and Analytics panel tab (if available).2. Click Browse Catalog.3. Click New and select Dashboard.4. Enter the dashboard's name and description, and select a folder to save in.5. With the Add content now option selected, click OK.
Oracle CX Sales and B2B ServiceCreating and Administering Analytics
Chapter 8Create and Edit Analytics
130
6. Optionally, add more pages, or tabs, within the dashboard.7. Bring items from the Dashboard Objects or Catalog pane to add content to a page.8. Click Save.
Note: The first dashboard page is saved with the page 1 name by default. To rename this page:1. Click the Catalog link.2. In the Folders pane, select your dashboard.3. For page 1, click More and select Rename.4. Enter the new name and click OK.
Edit a Dashboard1. In the Reports and Analytics work area or the Reports and Analytics panel tab (if available) select your
dashboard in the pane and click More.2. Select your dashboard in the pane and click More.3. Click Edit.4. Perform steps 6 and 7 from the preceding Creating Dashboards task, and make other changes as needed, for
example:
◦ Remove content from the dashboard.
◦ Move content around.
◦ Change the layout of a page.
Related Topics• Where to Save Analytics and Reports
Localize Catalog CaptionsAs an administrator, you can localize the names of reporting objects, or captions, that users create in the catalog. Forexample, you might localize the names of dashboards and analyses into Spanish and French.
To localize object names in the catalog, export the captions from the catalog, localize them, and upload back to thecatalog.
1. Export the default captions to an XML file.2. Localize the downloaded XML file.3. Upload the localized XML file.
After translated caption XML is uploaded, the new strings take effect once the cache refreshes. Translated strings areprotected during an upgrade.
Export Captions from the Catalog1. Click Administration.2. Click Export Captions.3. Click Browse and select the folder you want to localize in the catalog, then click OK.4. Save the XML file.
Oracle CX Sales and B2B ServiceCreating and Administering Analytics
Chapter 8Create and Edit Analytics
131
Localize Your CaptionsTranslate the XML file into one or more languages.
Upload Localized Captions to the CatalogAfter you have localized captions, upload the translated XML files, one for each language.
1. Click Administration.2. Click Import Captions.3. Click Browse and select the localized XML file, then click OK.4. Use the Select Language option to select the language to which you have localized, then click OK.5. Save the XML file.
To download, review, or delete imported captions files, use the Manage Captions option.
FAQs for Analytics and Dashboards
What are subject areas, dimensions, attributes, facts, and metrics?Information for your analytics is grouped into related functional areas called subject areas that contain fact anddimension folders with metrics and columns you can add to your analyses.
Dimension folders include the grouping of dimensional attributes for the subject area. Columns (such as date of birthor name) that are grouped for a dimension are known as attributes. Fact folders contain formulas for getting calculatednumeric values, such as counts, sums, and percentages.
What's the relationship between dimensions and fact in a subjectarea?A subject area is based around a single fact. The dimensions are all related to each other through the fact only. The factis automatically included in any query that's created, even if none of the measures in the fact appear in the analysis.
What's a common dimension?A common dimension is shared across multiple subject areas. For example, Time, Department, and Location arecommon dimensions. When constructing a cross-subject area analysis, only common dimensions can be used.
Oracle CX Sales and B2B ServiceCreating and Administering Analytics
Chapter 8Create and Edit Analytics
132
How can I determine which dimensions are shared across twosubject areas?If the dimensions exist in both subject areas, they're common dimensions, and are often among the first folders in asubject area. You can join any subject areas you have access to in Answers, but analyses are subject to the normalizeddata structure. Unless the underlying tables are joined by design, joining subject areas in Answers results in errors.
What's a dashboard?A dashboard is a container page to display analyses, reports, and other objects. Administrators can create shareddashboards for groups of users with common responsibilities or job functions. Personalized views can be created basedon a user's permissions.
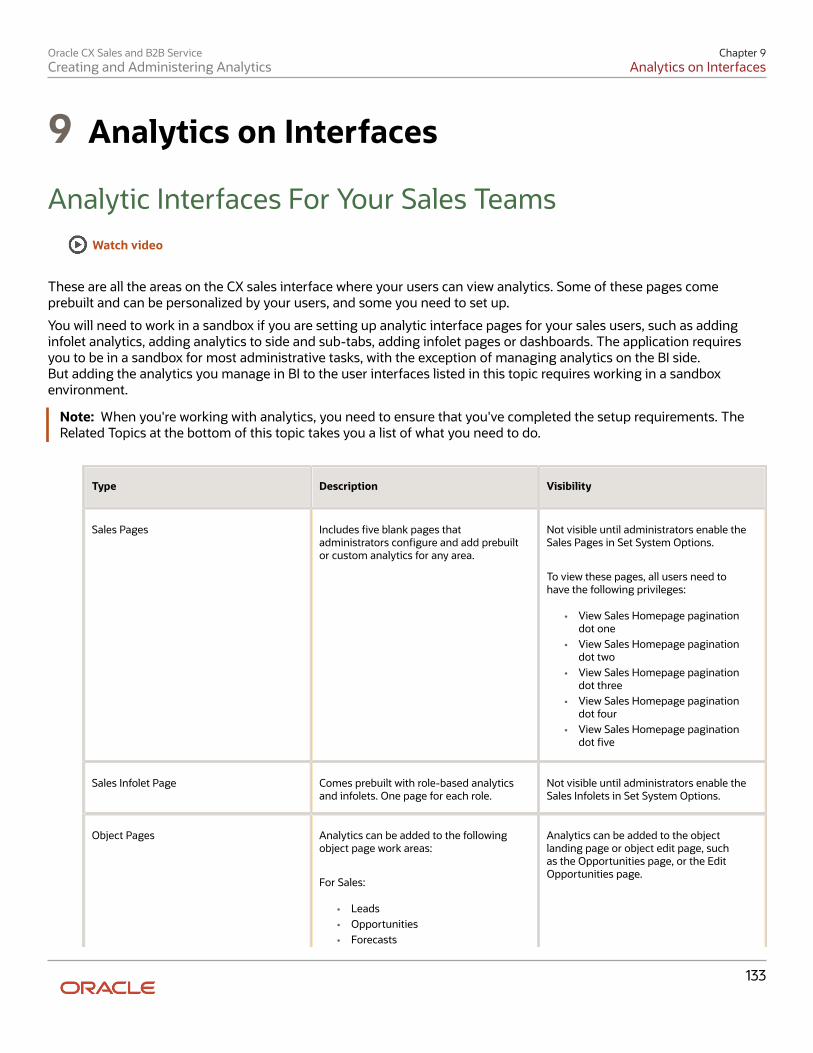
Oracle CX Sales and B2B ServiceCreating and Administering Analytics
Chapter 9Analytics on Interfaces
133
9 Analytics on Interfaces
Analytic Interfaces For Your Sales TeamsWatch video
These are all the areas on the CX sales interface where your users can view analytics. Some of these pages comeprebuilt and can be personalized by your users, and some you need to set up.
You will need to work in a sandbox if you are setting up analytic interface pages for your sales users, such as addinginfolet analytics, adding analytics to side and sub-tabs, adding infolet pages or dashboards. The application requiresyou to be in a sandbox for most administrative tasks, with the exception of managing analytics on the BI side.But adding the analytics you manage in BI to the user interfaces listed in this topic requires working in a sandboxenvironment.
Note: When you're working with analytics, you need to ensure that you've completed the setup requirements. TheRelated Topics at the bottom of this topic takes you a list of what you need to do.
Type Description Visibility
Sales Pages Includes five blank pages thatadministrators configure and add prebuiltor custom analytics for any area.
Not visible until administrators enable theSales Pages in Set System Options.
To view these pages, all users need tohave the following privileges:
• View Sales Homepage paginationdot one
• View Sales Homepage paginationdot two
• View Sales Homepage paginationdot three
• View Sales Homepage paginationdot four
• View Sales Homepage paginationdot five
Sales Infolet Page Comes prebuilt with role-based analyticsand infolets. One page for each role.
Not visible until administrators enable theSales Infolets in Set System Options.
Object Pages Analytics can be added to the followingobject page work areas:
For Sales:
• Leads• Opportunities• Forecasts
Analytics can be added to the objectlanding page or object edit page, suchas the Opportunities page, or the EditOpportunities page.
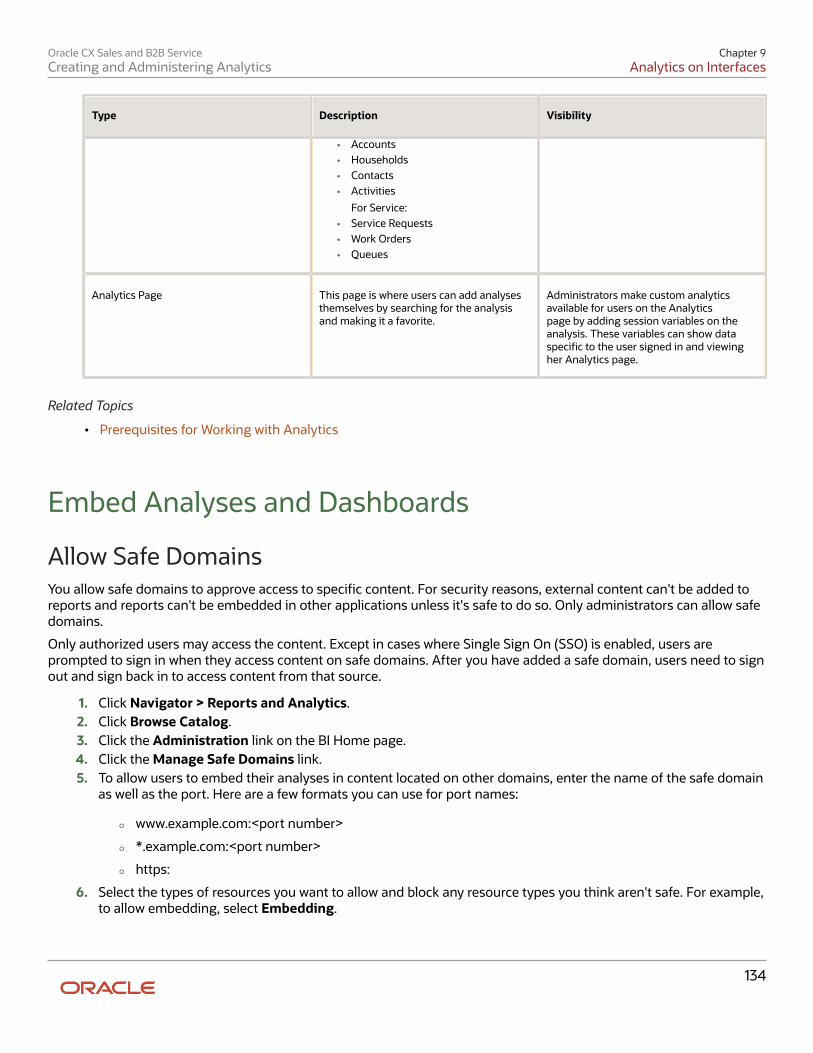
Oracle CX Sales and B2B ServiceCreating and Administering Analytics
Chapter 9Analytics on Interfaces
134
Type Description Visibility
• Accounts• Households• Contacts• Activities
For Service:• Service Requests• Work Orders• Queues
Analytics Page This page is where users can add analysesthemselves by searching for the analysisand making it a favorite.
Administrators make custom analyticsavailable for users on the Analyticspage by adding session variables on theanalysis. These variables can show dataspecific to the user signed in and viewingher Analytics page.
Related Topics
• Prerequisites for Working with Analytics
Embed Analyses and Dashboards
Allow Safe DomainsYou allow safe domains to approve access to specific content. For security reasons, external content can't be added toreports and reports can't be embedded in other applications unless it's safe to do so. Only administrators can allow safedomains.
Only authorized users may access the content. Except in cases where Single Sign On (SSO) is enabled, users areprompted to sign in when they access content on safe domains. After you have added a safe domain, users need to signout and sign back in to access content from that source.
1. Click Navigator > Reports and Analytics.2. Click Browse Catalog.3. Click the Administration link on the BI Home page.4. Click the Manage Safe Domains link.5. To allow users to embed their analyses in content located on other domains, enter the name of the safe domain
as well as the port. Here are a few formats you can use for port names:
◦ www.example.com:<port number>
◦ *.example.com:<port number>
◦ https:
6. Select the types of resources you want to allow and block any resource types you think aren't safe. For example,to allow embedding, select Embedding.
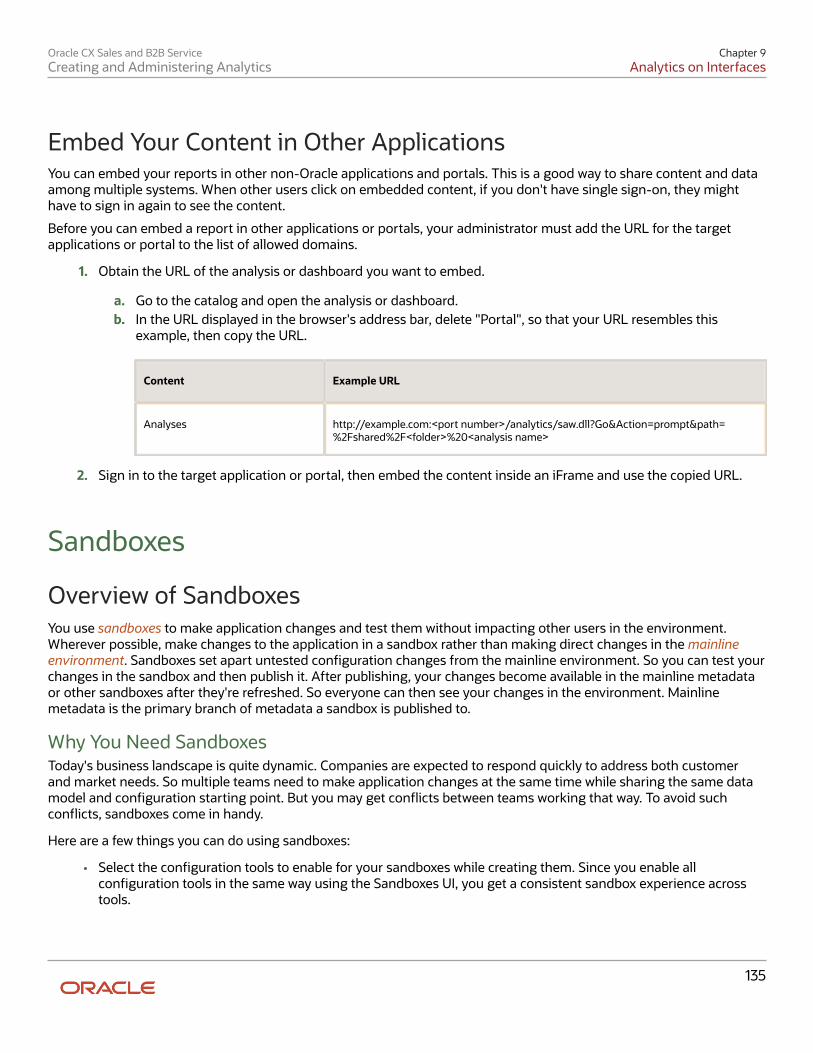
Oracle CX Sales and B2B ServiceCreating and Administering Analytics
Chapter 9Analytics on Interfaces
135
Embed Your Content in Other ApplicationsYou can embed your reports in other non-Oracle applications and portals. This is a good way to share content and dataamong multiple systems. When other users click on embedded content, if you don't have single sign-on, they mighthave to sign in again to see the content.
Before you can embed a report in other applications or portals, your administrator must add the URL for the targetapplications or portal to the list of allowed domains.
1. Obtain the URL of the analysis or dashboard you want to embed.
a. Go to the catalog and open the analysis or dashboard.b. In the URL displayed in the browser's address bar, delete "Portal", so that your URL resembles this
example, then copy the URL.
Content Example URL
Analyses http://example.com:<port number>/analytics/saw.dll?Go&Action=prompt&path=%2Fshared%2F<folder>%20<analysis name>
2. Sign in to the target application or portal, then embed the content inside an iFrame and use the copied URL.
Sandboxes
Overview of SandboxesYou use sandboxes to make application changes and test them without impacting other users in the environment.Wherever possible, make changes to the application in a sandbox rather than making direct changes in the mainlineenvironment. Sandboxes set apart untested configuration changes from the mainline environment. So you can test yourchanges in the sandbox and then publish it. After publishing, your changes become available in the mainline metadataor other sandboxes after they're refreshed. So everyone can then see your changes in the environment. Mainlinemetadata is the primary branch of metadata a sandbox is published to.
Why You Need SandboxesToday's business landscape is quite dynamic. Companies are expected to respond quickly to address both customerand market needs. So multiple teams need to make application changes at the same time while sharing the same datamodel and configuration starting point. But you may get conflicts between teams working that way. To avoid suchconflicts, sandboxes come in handy.
Here are a few things you can do using sandboxes:
• Select the configuration tools to enable for your sandboxes while creating them. Since you enable allconfiguration tools in the same way using the Sandboxes UI, you get a consistent sandbox experience acrosstools.
Oracle CX Sales and B2B ServiceCreating and Administering Analytics
Chapter 9Analytics on Interfaces
136
• Restrict access to various sandbox activities for users. For example, you can specify these access rights for yoursandboxes:
◦ Full access
◦ Edit and preview access
◦ View only access
• View just your application changes without having other context layers hide your content.
• Test your changes in a preview mode that shows you exactly how your application changes would appear in apublished sandbox.
• Refresh and merge sandboxes with latest changes in mainline metadata from other published sandboxes. Aftermerging all changes, you can publish your sandbox.
• If you register your target environment in your source environment, you can do these additional migrationtasks using the Migration UI:
◦ Migrate your changes from the test environment to the target environment without manuallydownloading and uploading the configuration set file.
◦ Move only new changes from the source environment to the target environment.
Sandbox UsageYou typically use sandboxes for either of these purposes:
• Test-Only: You can make application changes using test-only sandboxes, which you don't want to publish to themainline code.
• Publish: Once satisfied with the application changes made in the test-only sandbox, you can replicate thesechanges in a sandbox that you want to publish. And then publish your changes to the mainline code. Thissandbox type is also known as the integration sandbox, because teams working in parallel use this sandbox asthe final staging point before publication to the mainline code.
Note: Before each patch or upgrade, publish or delete your sandboxes. If you haven't yet completed your work,restart with a new sandbox.
Related Topics
• Migrate Your Configurations
Create and Activate SandboxesTo make changes to the application, you must first store the changes in an active sandbox. You can either create asandbox or select an existing one, and make it active. You must activate the configuration tools you want to use in yoursandbox. If you plan to use Page Composer in your sandbox and edit pages at a layer other than Site, you need to createa sandbox just for that layer, and activate only Page Composer in it.
Note: You can create up to 20 sandboxes. But, you can increase this limit using the Maximum Number of Sandboxesprofile option. In the Setup and Maintenance work area, use the Manage Applications Core Administrator ProfileValues task in the Application Extensions functional area.
Oracle CX Sales and B2B ServiceCreating and Administering Analytics
Chapter 9Analytics on Interfaces
137
Create and Activate SandboxesFollow these steps to create and activate sandboxes for most configuration tools. For flexfields, use the ManageDescriptive Flexfields task or the Manage Extensible Flexfields task instead.
1. Click Navigator > Configuration > Sandboxes.2. On the Sandboxes page, click Create Sandbox.3. Enter a name and description for your sandbox.4. In the Publishable field, select Yes or No. If you set this option as No, you can just use your sandbox for testing
purposes, but can never publish it.5. In the All Tools section, select the tools you want to activate for this sandbox. The context layers for all selected
tools are set as Site by default. So the changes you make using these tools affect all users.6. If you select Page Composer, you can click the Edit Sandbox Context icon and change the context layer from
Site to another layer, for example External. You can find the Edit Sandbox Context icon in the Support Contextcolumn.
Note: If you want to use other tools along with Page Composer in your sandbox, don't change the contextlayer for Page Composer, even though you can. That's because all tools except Page Composer supportonly a single context layer, Site. So if you change the context layer for Page Composer from Site to anyother layer, all other tools that you might have selected earlier will be deselected.
7. Click Create to just create the sandbox, or Create and Enter to enter or activate the sandbox after creating it.
Here are a few things to know about activating tools in your sandbox.
• If you try to use a configuration tool in a sandbox without activating the tool in it, you get a message promptingyou to activate the tool. You can add more tools to your sandbox later also.
• To create and manage saved searches and make UI adjustments (for example, change a table's column width)just for yourself, you must leave your sandbox before making these changes. But if you want to make thesechanges for others too, then make the changes with Page Composer open, in which case you also must be in asandbox.
Activate Existing SandboxesFollow these steps to activate a sandbox.
1. Click Navigator > Configuration > Sandboxes.2. From the list of sandboxes, if available, find the one you want to activate, and click the Enter Sandbox icon for
that sandbox. Your sandbox is activated, and you can see its name on the sandbox bar before the global header.You can use the options available on the sandbox bar to quickly do some activities, such as view sandboxdetails, publish the sandbox, or leave the sandbox.
Related Topics• Set Profile Option Values• Why doesn't the page I am editing with Page Composer work with the sandbox context• Considerations for Managing Flexfields
Publish SandboxesAfter you're done making changes to the application, publish the sandbox to make your changes available to allusers. You must have the Administer Sandbox (FND_ADMINISTER_SANDBOX_PRIV) privilege to publish sandboxes.Remember, you can't make further changes in the sandbox once you publish it.
Oracle CX Sales and B2B ServiceCreating and Administering Analytics
Chapter 9Analytics on Interfaces
138
Before you start, do these tasks:
• Test or validate your changes in the sandbox in preview mode before actually publishing it. If you madechanges using Page Composer, don't forget to close it before testing. To preview your changes, on the sandboxbar before the global header, click Sandbox Mode, and select Preview as if Published (Context: All).
Note: You can see the sandbox bar only when you're in an active sandbox.
• Resolve all conflicts flagged in the merge log of your sandbox.
To publish a sandbox:
1. Click Navigator > Configuration > Sandboxes.2. On the Sandboxes page, click the name of the sandbox you want to publish.3. Click Publish.
Note: You might not be able to publish your sandbox because of various reasons. For example,you haven't yet made any changes in your sandbox, or the Control Publish Sandbox Action inProduction Environment profile option (FND_ALLOW_PUBLISH_SANDBOX) is set to No.
4. Click Continue to Publish. The sandbox is published to the mainline metadata.5. Click Done.
Related Topics• How to Resolve Conflicts in Sandboxes• Why can't I publish my sandbox
Infolets
Overview of InfoletsAn infolet is a small interactive widget that gives you key information and shows you what's going on in the areas youwork on. You might also find something in an infolet that you need to follow up on. You can use infolets arranged in tabsin the Analytics section of your home page. If you're using a panel or banner layout, use the page control icons to usethe infolets.
Here are a few things to know about infolets.
• Infolets have a front view, and might have a back and expanded view. Use the Back View, Front View, andExpanded View icons at the bottom corners of an infolet to open these views.
• Your current infolet view persists as the default view the next time you sign in. For example, if you viewed aback view of the infolet in your last session, you will see the same infolet view by default in your next session.
• Some infolets might also contain links to detailed reports. You can click anywhere in the infolet area to drilldown to the detailed report.
• You can also personalize the infolets. For example, you can move or hide them on the infolets page.
• If you don't see infolet pages on your home page, then your administrators must have disabled them to showon the home page.
Note: Some SCM or Procurement Cloud infolets might function differently from other infolets.
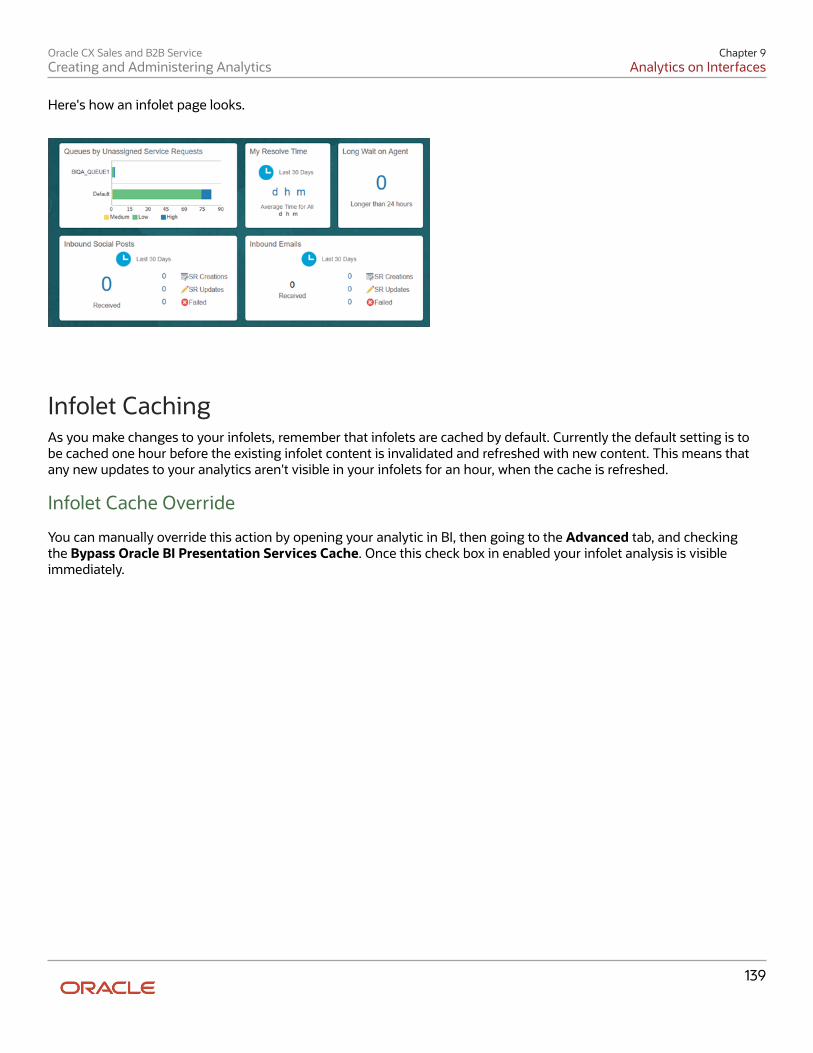
Oracle CX Sales and B2B ServiceCreating and Administering Analytics
Chapter 9Analytics on Interfaces
139
Here's how an infolet page looks.
Infolet CachingAs you make changes to your infolets, remember that infolets are cached by default. Currently the default setting is tobe cached one hour before the existing infolet content is invalidated and refreshed with new content. This means thatany new updates to your analytics aren't visible in your infolets for an hour, when the cache is refreshed.
Infolet Cache Override
You can manually override this action by opening your analytic in BI, then going to the Advanced tab, and checkingthe Bypass Oracle BI Presentation Services Cache. Once this check box in enabled your infolet analysis is visibleimmediately.
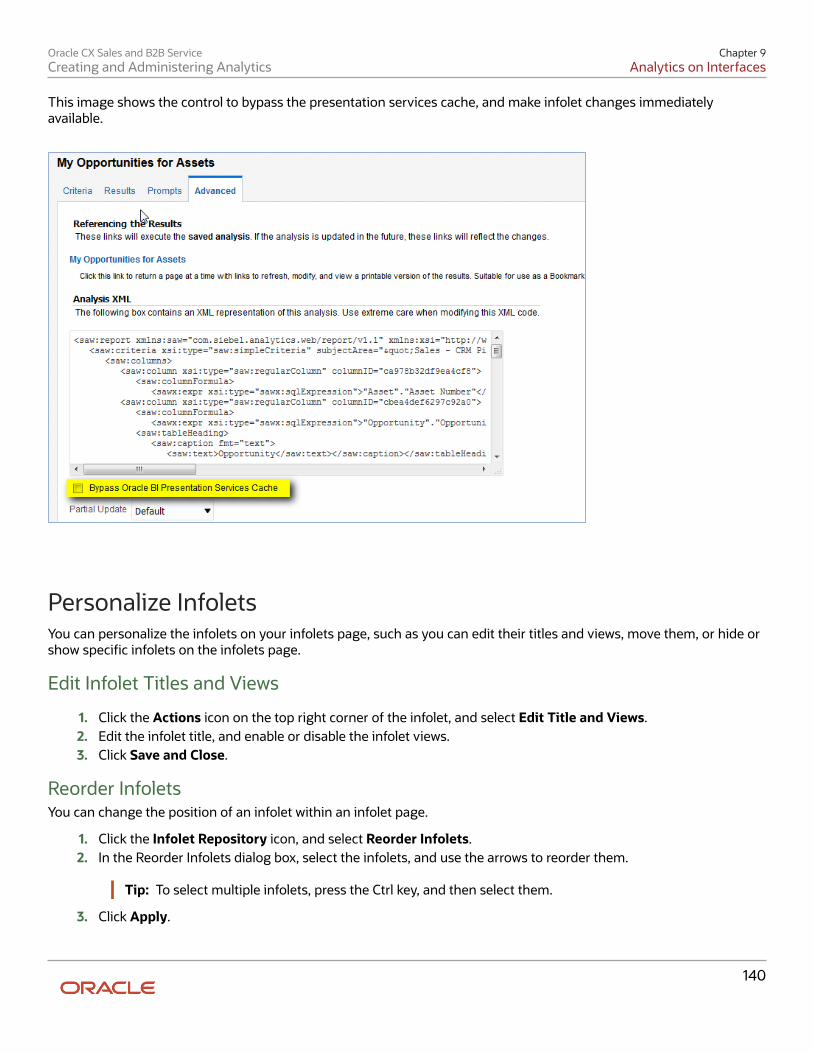
Oracle CX Sales and B2B ServiceCreating and Administering Analytics
Chapter 9Analytics on Interfaces
140
This image shows the control to bypass the presentation services cache, and make infolet changes immediatelyavailable.
Personalize InfoletsYou can personalize the infolets on your infolets page, such as you can edit their titles and views, move them, or hide orshow specific infolets on the infolets page.
Edit Infolet Titles and Views
1. Click the Actions icon on the top right corner of the infolet, and select Edit Title and Views.2. Edit the infolet title, and enable or disable the infolet views.3. Click Save and Close.
Reorder InfoletsYou can change the position of an infolet within an infolet page.
1. Click the Infolet Repository icon, and select Reorder Infolets.2. In the Reorder Infolets dialog box, select the infolets, and use the arrows to reorder them.
Tip: To select multiple infolets, press the Ctrl key, and then select them.
3. Click Apply.
Oracle CX Sales and B2B ServiceCreating and Administering Analytics
Chapter 9Analytics on Interfaces
141
Hide or Show InfoletsTo hide an infolet from an infolet page, click the Infolet Repository icon, and deselect the infolet from the list ofinfolets.
Tip: Alternatively, click the Actions icon on the top right corner of the infolet, and select Hide.
To show a hidden infolet on an infolet page, click the Infolet Repository icon, and select the infolet from the list ofinfolets.
Related Topics
• Configure Infolet Display
Configure Infolets
Overview of Configuring InfoletsYou can configure infolets that aggregate key information for a specific area, for example, social networking or personalprofile. Your users use infolets arranged in tabs in the Analytics section of the home page. Or, if it's a home page with apanel or banner layout, they use the page control icons.
If your users don't find infolet pages on the home page, you can enable them by using the Home Configuration tab inthe Structure work area. Let's look at some tasks you can do to configure infolets.
• Create infolets.
• Add content to infolets. For example, you can add a task flow or a performance tile report, and if an infoletcontains a performance tile report, then you can add a link to a detailed report in the same infolet.
Note: In the context of infolets, a report is an analysis, not a BI Publisher report.
• Edit infolets. For example, edit infolet content and add, change, or remove link to detailed report.
• Delete infolets.
But before you start creating and editing infolets, here are a few things to keep in mind:
• You can add analyses from the catalog to an infolet, but not BI Publisher reports, or other objects like filters orprompts.
• To create or edit infolets, you must first either create and activate a sandbox, or activate an existing one. Butmake sure the sandbox has the Page Composer tool selected. If you want to make changes in a context layerthat isn't the default layer, Site, you must create a separate sandbox just to use Page Composer in it. You canthen change the context layer from Site to the other layer. For example, to create or edit infolets for a user witha specific job role, you must select the Job Role context layer.
• You can validate your changes in the sandbox in preview mode before you publish it.
Related Topics
• Configure Infolet Display
• Best Practices for Using Page Composer in Sandboxes
Create Infolets
Oracle CX Sales and B2B ServiceCreating and Administering Analytics
Chapter 9Analytics on Interfaces
142
Watch video
Use infolet pages to create infolets. You can create an infolet, add content to it, and link detailed reports. For someproduct-specific infolet pages, you can't create infolets.
1. Activate a sandbox that has the Page Composer tool in it.2. Open an infolet page.3. Click your user image or name in the global header, and on the Settings and Actions menu, select Edit Pages.4. Click the Infolet Repository icon, and select Create Infolet.
Note: If you can't find the Create Infolet menu item, it means you can't create infolets for this page.
5. Enter a title for the infolet and set its views.
◦ Specify the dimensions for the front view.
◦ Enable or disable the back view.
◦ Enable or disable the expanded view, and specify its dimensions. The dimensions of the front and theback views must be the same, but the expanded view must be bigger because it displays more details.
6. Click Save and Close. You can now add content to infolets.
Add Content to InfoletsYou can add content to the infolet's front, back, or expanded view. You can't add a business intelligence dashboard to aninfolet because a dashboard report is generally bigger than an infolet.
1. Select the infolet's view that you want to add content to.
Note: To open infolet's back view, click the Back View icon on the bottom right corner of the infolet. Andto open expanded view, click the Expanded View icon on the bottom right corner of the infolet's back view.
2. Click Add Content on the infolet. You can find this button on any of the infolet's views, but only if you don'thave any existing content in that view.
3. Search and select a performance tile or a task flow, and click Add. You can browse the business intelligence (BI)catalog to find the analytics and reports that you want to add.
4. Close the Add Content dialog box. You can now add detailed reports to the infolet.
Link Detailed Reports to InfoletsTo provide detailed information about a subject matter on an infolet, you can add a link to a detailed report. After youadd the link, your users can click anywhere in the infolet area to drill down to that detailed report. The detailed reportdoesn't replace the existing infolet content.
First, add a performance tile report to the infolet content, and then follow these steps:
1. Click the Actions icon on the top right corner of the infolet, and select Link Detailed Report.2. On the Detailed Report page, click Add Content.3. Search and select a report, and click Add to add it to the infolet.4. Close the Add Content dialog box.5. Click Done. You can now publish the sandbox.
Publish the Sandbox
1. Preview the infolet's front view, drill down to the detailed report, and then preview the back and the expandedviews.
Oracle CX Sales and B2B ServiceCreating and Administering Analytics
Chapter 9Analytics on Interfaces
143
2. After you made changes, click Close to leave Page Composer.3. Test your changes and publish the sandbox to make the new infolet available to your users.
Related Topics
• Best Practices for Using Page Composer in Sandboxes
• Why can't I see application changes made in previously published sandboxes in my current sandbox
Edit and Delete InfoletsOn the infolet page, use the options available on each infolet to edit infolet content and delete infolets.
1. Activate a sandbox that has the Page Composer tool in it.2. Open an infolet page.3. Click your user image or name in the global header, and on the Settings and Actions menu, select Edit Pages.
Note: After you're done making changes, click Close to leave Page Composer, test your changes, andpublish the sandbox.
Edit Infolet Content1. Click the Actions icon on the top right corner of the infolet, and select Edit Content.
Note: To edit the infolet content of the back or expanded view, open the view and use the Actions icon onthat view.
2. Click Add Content to replace the existing content of the infolet.3. Search and select a performance tile or a task flow, and click Add. You can browse the business intelligence (BI)
catalog to find the analytics and reports that you want to add.4. Close the Add Content dialog box.
Edit Title and ViewsTo edit title and views of an infolet, click the Actions icon on the top right corner of the infolet, and select Edit Title andViews.
Edit or Remove Detailed ReportYou can edit or remove the detailed report.
1. Click the Actions icon on the top right corner of the infolet, and select Edit Detailed Report.2. On the Detailed Report page, you can edit or remove the detailed report.
◦ To edit, click Edit Report and make changes to the detailed report.
◦ To remove, click Remove Report.
3. Click Done.
Edit Infolet VisibilityYou can show or hide an infolet on the infolet page. To edit the visibility settings of an infolet, do these steps:
1. Click the Actions icon on the top right corner of the infolet, and select Edit Visibility.2. Select one of these options:
◦ Yes: The infolet appears on the infolet page.
◦ No: The infolet doesn't appear on the infolet page.
Oracle CX Sales and B2B ServiceCreating and Administering Analytics
Chapter 9Analytics on Interfaces
144
◦ EL Expression: The evaluation of the EL expression decides whether the infolet appears on the infoletpage.
Delete InfoletsTo delete an infolet, click the Actions icon on the top right corner of the infolet, and select Delete.
Caution: You can't easily retrieve an infolet once you delete it. But if you have accidentally deleted any infolet, don'tworry. Contact My Oracle Support at https://support.oracle.com.
FAQs for Infolets
Why don't I see infolets in the Analytics section of the home page?That's probably because the infolet page is hidden. Change the visibility setting of the infolet page using the HomeConfiguration page of the Structure work area. To open this page, click Navigator > Configuration > Structure, andthen click the Home Configuration tab.
Related Topics• Configure Infolet Display
How can I rename an icon for an infolet page in the page control on the home page?You can rename an icon for an infolet page using the Home Configuration page of the Structure work area. To open thispage, select Configuration > Structure from the Navigator menu, and then click the Home Configuration tab.
Related Topics• Configure Infolet Display
What's the difference between a performance tile report and a detailed report addedto the infolets content?Performance tile report shows data in the small infolet format. When you add a performance tile report to an infolet,users can see only the summary information about the subject matter. But this report doesn't provide detailedinformation.To provide detailed information about the subject matter on the same infolet, add a link to a detailed report. Users canclick this link to gather more information.
Analytics on Object Pages
Analytics on Object PagesAdministrators can add analytics to object landing and edit pages. The object landing pages are the pages sales teamsinteract with every day like the Opportunities, Accounts, or Contacts pages. When you add analytics to the tabs in thesepages users can see analytics specific to the record they select.
For the object landing pages there are two steps:
1. Enable the Analytics tab.2. Add an analytic to the enabled tab.
Oracle CX Sales and B2B ServiceCreating and Administering Analytics
Chapter 9Analytics on Interfaces
145
For the edit object pages, there are three steps:
1. Set the "Is "Prompted" filter on the analytic in BI.2. Enable the Analytics tab.3. Add the analytic to the enabled tab.
Note: The Service Request and Work Order landing pages don't have the option for adding analytics.
Enable Analytics Tabs for Object Landing PagesThe analytics on your object pages don't show by default. Administrators must enable the feature before they can addanalytics to object pages.
Enable Landing Page Analytics TabsThis uses the Opportunities object landing page as an example. The steps are the same for all of the object landingpages.
1. In Navigator click Structure.2. Choose Sales, then Opportunities.3. On the analytics row, change the value for visible column to "Yes."4. Click Save and Close.
Add an Analysis to the Object Landing PageAfter the analytics tab is enabled, administrators add the analytic to the landing page tab. This procedure uses theOpportunity landing page as an example. The procedure is the same for all object edit and landing pages.
Add an Analysis to the Opportunity Landing Page Tab
1. In a specific opportunity, select the Analytics tab. You enabled this tab in the previous section.2. At the top of the Home Page click the arrow next to your name and select Edit Pages.3. Select Job Role and choose the role to which your change should apply. Any analytics you add in this context
apply only to the role you define here.4. In Opportunities on the analytics tab click Add Content and navigate to the analysis you want to show on the
Opportunity page.5. Click Add next to the analysis and close the dialog. The analysis is now added to the Analytics tab.
Enable Sub Tabs and Add Analytics to Object Edit PagesThere are three steps to adding analytics to object edit pages.
1. Set the "Is Prompted" filter in the analytic in Business Intelligence. This step is used when the requirement is toview contextual data specific to the record selected.
2. Enable the sub tab on the object page.3. Add the analysis to the sub tab on the object page.
All of these steps are done using the Opportunities landing and edit pages. You can use these same steps for any of theobject pages listed as analytics work areas in the sub table at the start of this section.
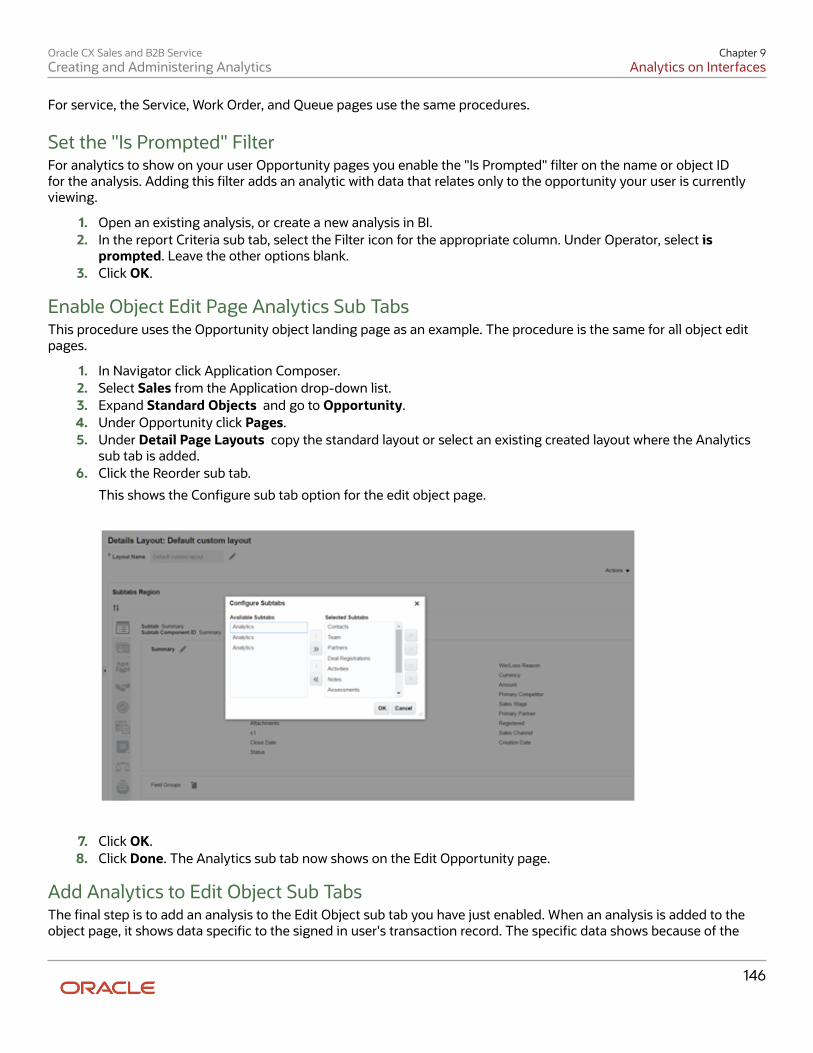
Oracle CX Sales and B2B ServiceCreating and Administering Analytics
Chapter 9Analytics on Interfaces
146
For service, the Service, Work Order, and Queue pages use the same procedures.
Set the "Is Prompted" FilterFor analytics to show on your user Opportunity pages you enable the "Is Prompted" filter on the name or object IDfor the analysis. Adding this filter adds an analytic with data that relates only to the opportunity your user is currentlyviewing.
1. Open an existing analysis, or create a new analysis in BI.2. In the report Criteria sub tab, select the Filter icon for the appropriate column. Under Operator, select is
prompted. Leave the other options blank.3. Click OK.
Enable Object Edit Page Analytics Sub TabsThis procedure uses the Opportunity object landing page as an example. The procedure is the same for all object editpages.
1. In Navigator click Application Composer.2. Select Sales from the Application drop-down list.3. Expand Standard Objects and go to Opportunity.4. Under Opportunity click Pages.5. Under Detail Page Layouts copy the standard layout or select an existing created layout where the Analytics
sub tab is added.6. Click the Reorder sub tab.
This shows the Configure sub tab option for the edit object page.
7. Click OK.8. Click Done. The Analytics sub tab now shows on the Edit Opportunity page.
Add Analytics to Edit Object Sub TabsThe final step is to add an analysis to the Edit Object sub tab you have just enabled. When an analysis is added to theobject page, it shows data specific to the signed in user's transaction record. The specific data shows because of the
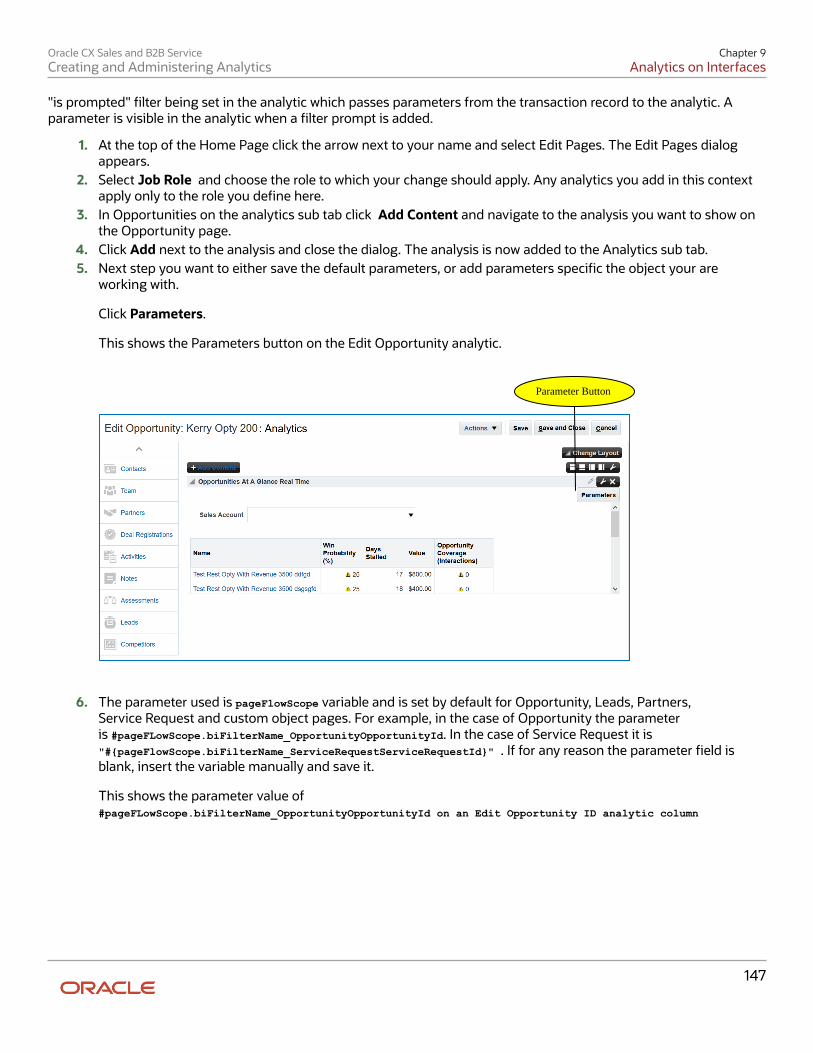
Oracle CX Sales and B2B ServiceCreating and Administering Analytics
Chapter 9Analytics on Interfaces
147
"is prompted" filter being set in the analytic which passes parameters from the transaction record to the analytic. Aparameter is visible in the analytic when a filter prompt is added.
1. At the top of the Home Page click the arrow next to your name and select Edit Pages. The Edit Pages dialogappears.
2. Select Job Role and choose the role to which your change should apply. Any analytics you add in this contextapply only to the role you define here.
3. In Opportunities on the analytics sub tab click Add Content and navigate to the analysis you want to show onthe Opportunity page.
4. Click Add next to the analysis and close the dialog. The analysis is now added to the Analytics sub tab.5. Next step you want to either save the default parameters, or add parameters specific the object your are
working with.
Click Parameters.
This shows the Parameters button on the Edit Opportunity analytic.
Parameter Button
6. The parameter used is pageFlowScope variable and is set by default for Opportunity, Leads, Partners,Service Request and custom object pages. For example, in the case of Opportunity the parameteris #pageFLowScope.biFilterName_OpportunityOpportunityId. In the case of Service Request it is"#{pageFlowScope.biFilterName_ServiceRequestServiceRequestId}" . If for any reason the parameter field isblank, insert the variable manually and save it.
This shows the parameter value of#pageFLowScope.biFilterName_OpportunityOpportunityId on an Edit Opportunity ID analytic column
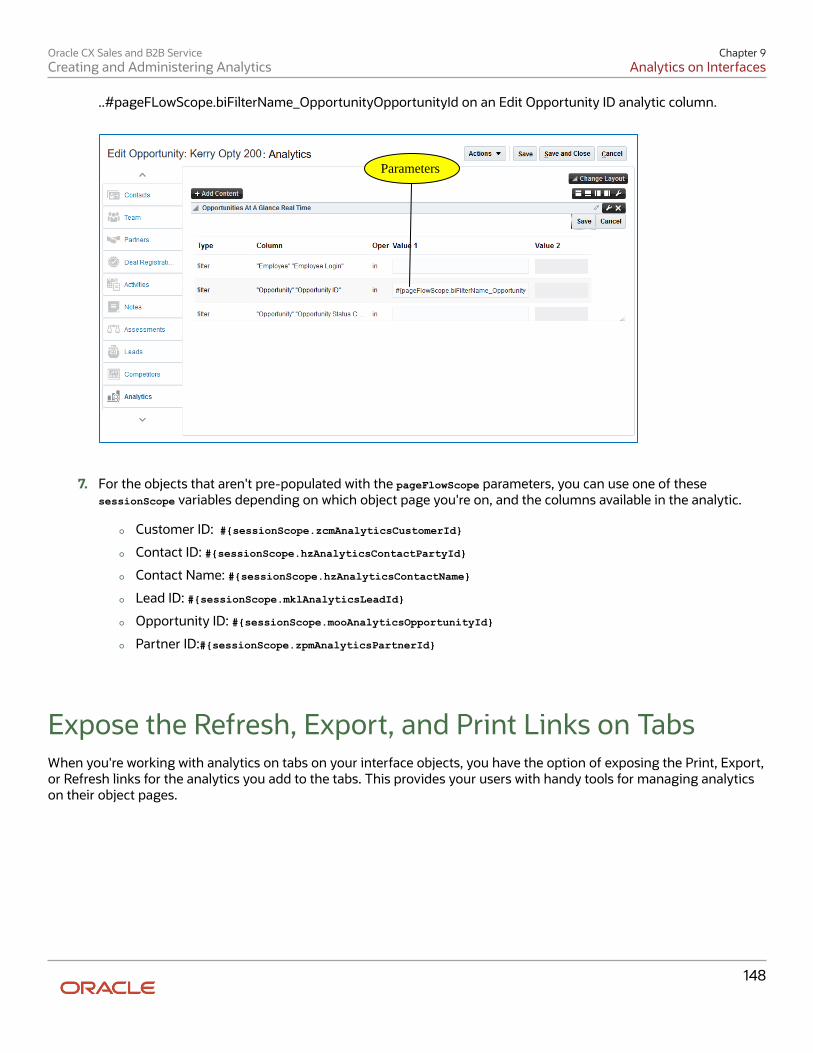
Oracle CX Sales and B2B ServiceCreating and Administering Analytics
Chapter 9Analytics on Interfaces
148
..#pageFLowScope.biFilterName_OpportunityOpportunityId on an Edit Opportunity ID analytic column.
Parameters
7. For the objects that aren't pre-populated with the pageFlowScope parameters, you can use one of thesesessionScope variables depending on which object page you're on, and the columns available in the analytic.
◦ Customer ID: #{sessionScope.zcmAnalyticsCustomerId}
◦ Contact ID: #{sessionScope.hzAnalyticsContactPartyId}
◦ Contact Name: #{sessionScope.hzAnalyticsContactName}
◦ Lead ID: #{sessionScope.mklAnalyticsLeadId}
◦ Opportunity ID: #{sessionScope.mooAnalyticsOpportunityId}
◦ Partner ID:#{sessionScope.zpmAnalyticsPartnerId}
Expose the Refresh, Export, and Print Links on TabsWhen you're working with analytics on tabs on your interface objects, you have the option of exposing the Print, Export,or Refresh links for the analytics you add to the tabs. This provides your users with handy tools for managing analyticson their object pages.
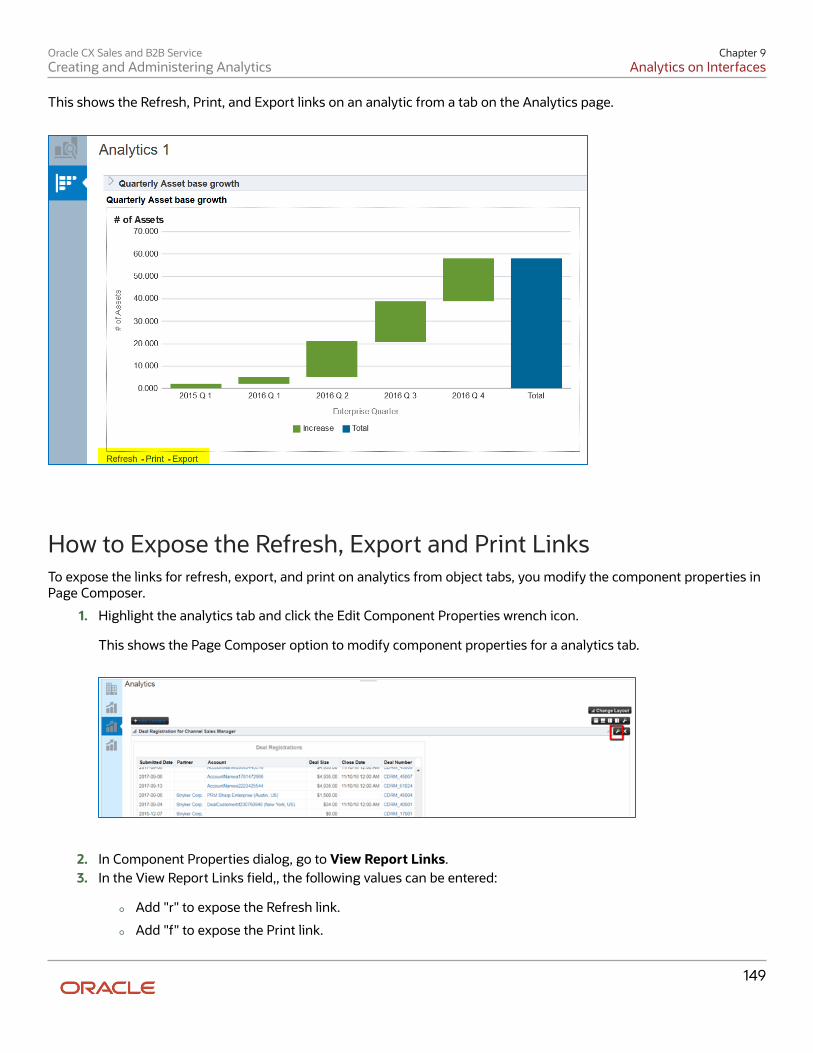
Oracle CX Sales and B2B ServiceCreating and Administering Analytics
Chapter 9Analytics on Interfaces
149
This shows the Refresh, Print, and Export links on an analytic from a tab on the Analytics page.
How to Expose the Refresh, Export and Print LinksTo expose the links for refresh, export, and print on analytics from object tabs, you modify the component properties inPage Composer.
1. Highlight the analytics tab and click the Edit Component Properties wrench icon.
This shows the Page Composer option to modify component properties for a analytics tab.
2. In Component Properties dialog, go to View Report Links.3. In the View Report Links field,, the following values can be entered:
◦ Add "r" to expose the Refresh link.
◦ Add "f" to expose the Print link.
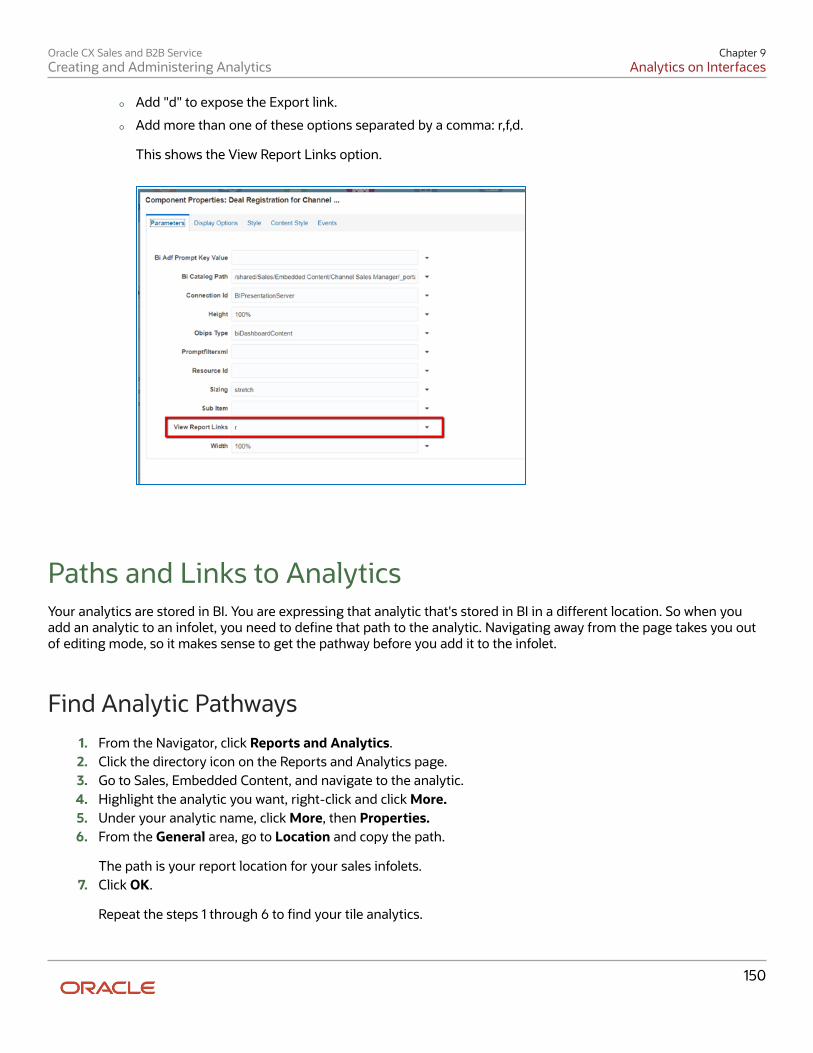
Oracle CX Sales and B2B ServiceCreating and Administering Analytics
Chapter 9Analytics on Interfaces
150
◦ Add "d" to expose the Export link.
◦ Add more than one of these options separated by a comma: r,f,d.
This shows the View Report Links option.
Paths and Links to AnalyticsYour analytics are stored in BI. You are expressing that analytic that's stored in BI in a different location. So when youadd an analytic to an infolet, you need to define that path to the analytic. Navigating away from the page takes you outof editing mode, so it makes sense to get the pathway before you add it to the infolet.
Find Analytic Pathways1. From the Navigator, click Reports and Analytics.2. Click the directory icon on the Reports and Analytics page.3. Go to Sales, Embedded Content, and navigate to the analytic.4. Highlight the analytic you want, right-click and click More.5. Under your analytic name, click More, then Properties.6. From the General area, go to Location and copy the path.
The path is your report location for your sales infolets.7. Click OK.
Repeat the steps 1 through 6 to find your tile analytics.
Oracle CX Sales and B2B ServiceCreating and Administering Analytics
Chapter 9Analytics on Interfaces
151
ADF Contextual Event ActionAdministrators can set the ADF Contextual Event action on the object name or other attribute columns of an objectto enable drilling down. When this action is set, the drilling down feature works on the analytics you add to the objecttabs, Sales Infolet pages, sales pages, or Analytic page. Users click the column name to see the details for that particularrecord.
These are the available objects:
• Opportunity
• Contact
• Account
• Activity
• Partner
• Deal
• MDF Budget
• MDF Request
• MDF Claim
• Business Plan
• Business Plan Objective
• Leads
• Queues
• Work Orders
• Service Requests
• Assets
Set the ADF Contextual EventYou can add this event to any analytic you build as long as it has an identifier for the record. In this case the identifier isCustomer ID. For this example you build an analytic that shows Account and Opportunity details.
1. Create a new analysis from the subject area Sales-CRM Pipeline.2. From the Subject Area pane, drag the following columns onto the Selected Columns editing palette:
◦ From the Customer dimension, select "Name".
◦ From the Customer dimension, select "Customer Row ID".
◦ From the Opportunity dimension select "Name".
◦ From the Opportunity dimension select "Opportunity ID".
◦ From the Facts folder, under Pipeline Facts, select "Opportunity Revenue".
3. Click the settings gear icon for Customer Name.4. Choose Column Properties.5. Choose the Interaction tab.
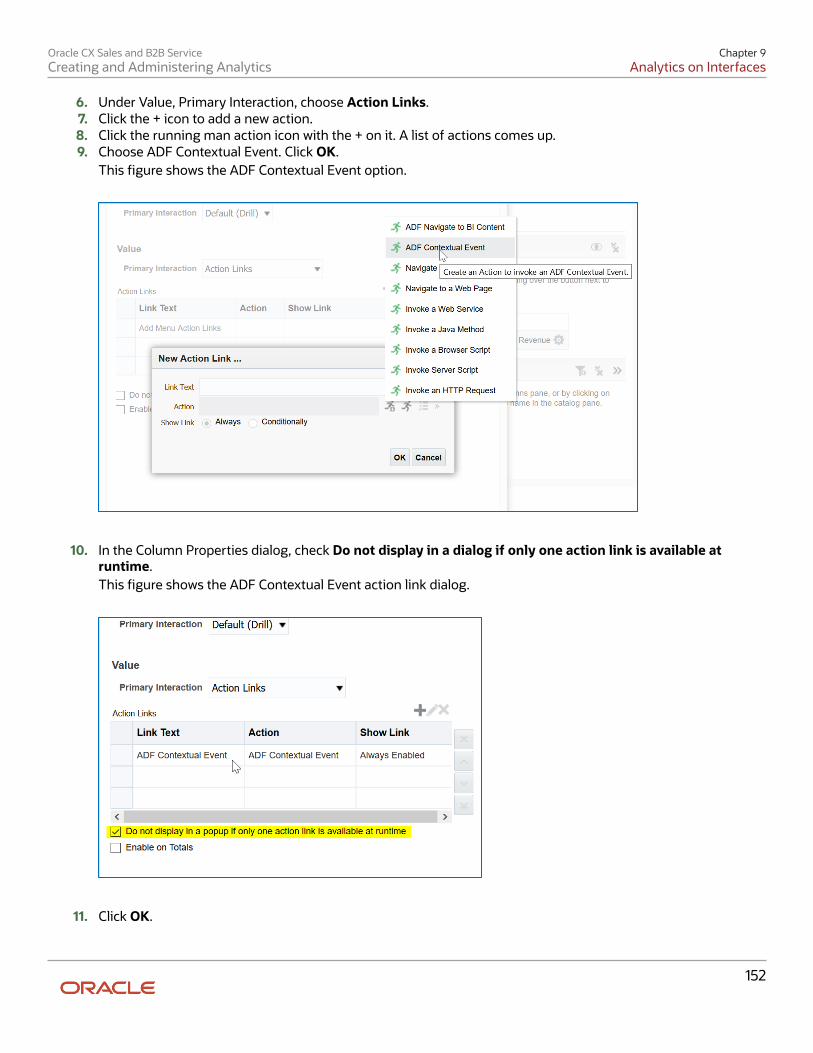
Oracle CX Sales and B2B ServiceCreating and Administering Analytics
Chapter 9Analytics on Interfaces
152
6. Under Value, Primary Interaction, choose Action Links.7. Click the + icon to add a new action.8. Click the running man action icon with the + on it. A list of actions comes up.9. Choose ADF Contextual Event. Click OK.
This figure shows the ADF Contextual Event option.
10. In the Column Properties dialog, check Do not display in a dialog if only one action link is available atruntime.This figure shows the ADF Contextual Event action link dialog.
11. Click OK.
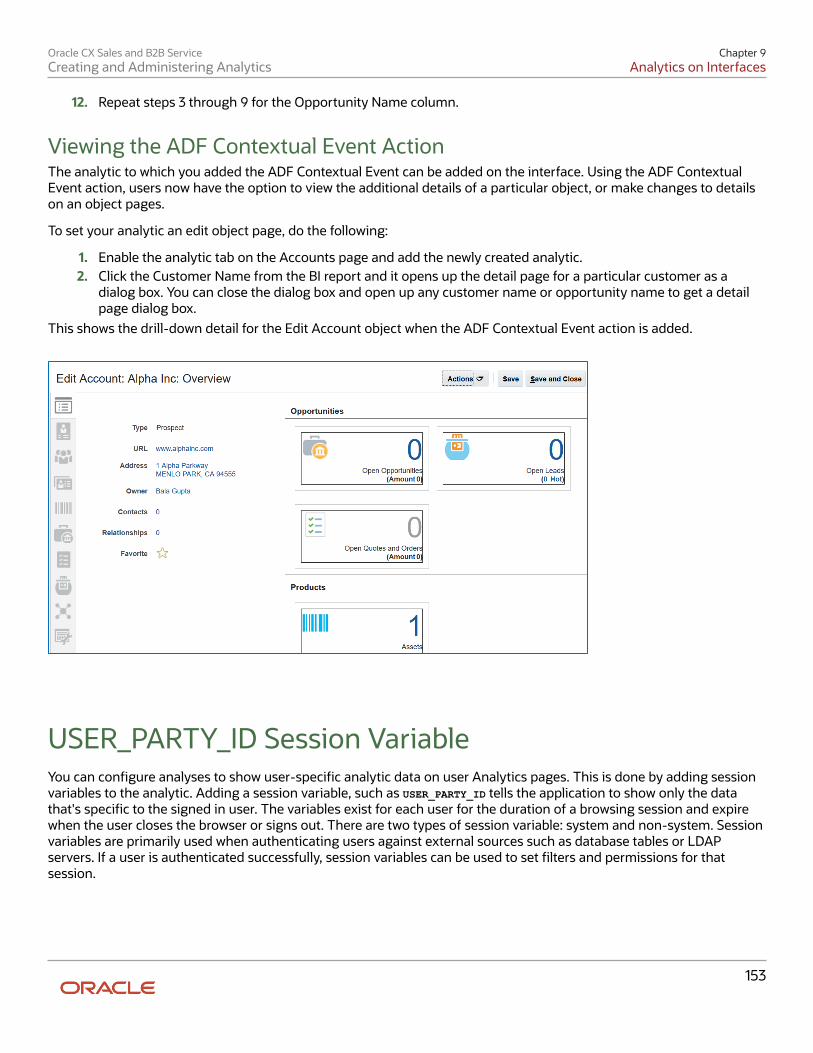
Oracle CX Sales and B2B ServiceCreating and Administering Analytics
Chapter 9Analytics on Interfaces
153
12. Repeat steps 3 through 9 for the Opportunity Name column.
Viewing the ADF Contextual Event ActionThe analytic to which you added the ADF Contextual Event can be added on the interface. Using the ADF ContextualEvent action, users now have the option to view the additional details of a particular object, or make changes to detailson an object pages.
To set your analytic an edit object page, do the following:
1. Enable the analytic tab on the Accounts page and add the newly created analytic.2. Click the Customer Name from the BI report and it opens up the detail page for a particular customer as a
dialog box. You can close the dialog box and open up any customer name or opportunity name to get a detailpage dialog box.
This shows the drill-down detail for the Edit Account object when the ADF Contextual Event action is added.
USER_PARTY_ID Session VariableYou can configure analyses to show user-specific analytic data on user Analytics pages. This is done by adding sessionvariables to the analytic. Adding a session variable, such as USER_PARTY_ID tells the application to show only the datathat's specific to the signed in user. The variables exist for each user for the duration of a browsing session and expirewhen the user closes the browser or signs out. There are two types of session variable: system and non-system. Sessionvariables are primarily used when authenticating users against external sources such as database tables or LDAPservers. If a user is authenticated successfully, session variables can be used to set filters and permissions for thatsession.
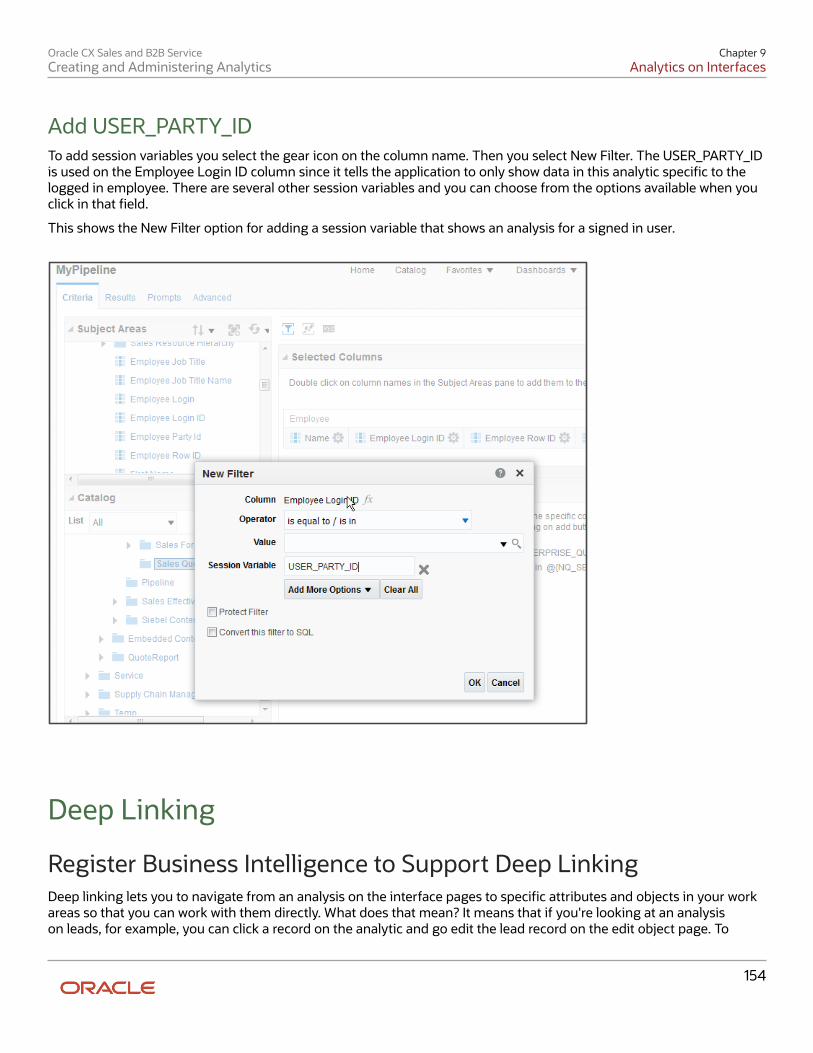
Oracle CX Sales and B2B ServiceCreating and Administering Analytics
Chapter 9Analytics on Interfaces
154
Add USER_PARTY_IDTo add session variables you select the gear icon on the column name. Then you select New Filter. The USER_PARTY_IDis used on the Employee Login ID column since it tells the application to only show data in this analytic specific to thelogged in employee. There are several other session variables and you can choose from the options available when youclick in that field.
This shows the New Filter option for adding a session variable that shows an analysis for a signed in user.
Deep Linking
Register Business Intelligence to Support Deep LinkingDeep linking lets you to navigate from an analysis on the interface pages to specific attributes and objects in your workareas so that you can work with them directly. What does that mean? It means that if you're looking at an analysison leads, for example, you can click a record on the analytic and go edit the lead record on the edit object page. To
Oracle CX Sales and B2B ServiceCreating and Administering Analytics
Chapter 9Analytics on Interfaces
155
support deep links, use the Setup and Maintenance work area to register the Business Intelligence Server as a third-party application.
Register Business Intelligence Server as a Third-Party ApplicationTo register the BI Server:
1. Use the Manage Third Party Applications page.2. Click Create.3. Enter AnalyticsApp as the application name.4. Enter the full URL for the BI Server (for example: http://host:port/analytics/saw.dll).5. Enter Analytics Server as the Partner Name.6. Click Save and Close.
Related Topics
• Manage Integration of Additional Applications
Set Up Deep Linking Using Business Intelligence FeaturesDeep page linking lets your users drill down on a record without leaving the page. You can add deep page linking forrecords in most custom objects in CX Sales in Business Intelligence. When users click the custom object name, or anyrecord with an associated ID value, it opens up a separate window to provide further detail on that record.
There are three parts to deep page linking:
1. Defining an action link.2. Constructing the deep link URL.3. Updating the deep link URL and parameters to navigate to a selected record.
Define an Action LinkYou can add a deep page URL to any column of an analysis created for a custom object by adding an action link fromcolumn properties. Note that the analysis must have a column that holds the identification of the record, such as RecordID in the case of a custom object.
1. Create or open an analytic that contains a column for the name of the document. Select the gear icon on thecolumn and then from the drop-down list choose Column Properties.
As an example of this, say there is a custom object called Product Documents. For deep page linking, we wantto add the deep URL/deep link to the column that holds the identification of the record. In the following figure,since there is a Product Document column, it would be the Document name that holds the ID of that record.
2. In Column Properties, select the Interaction tab.3. Under Value, for Primary Interaction choose Action Links from the drop-down list.4. Click the + icon to add an action link.
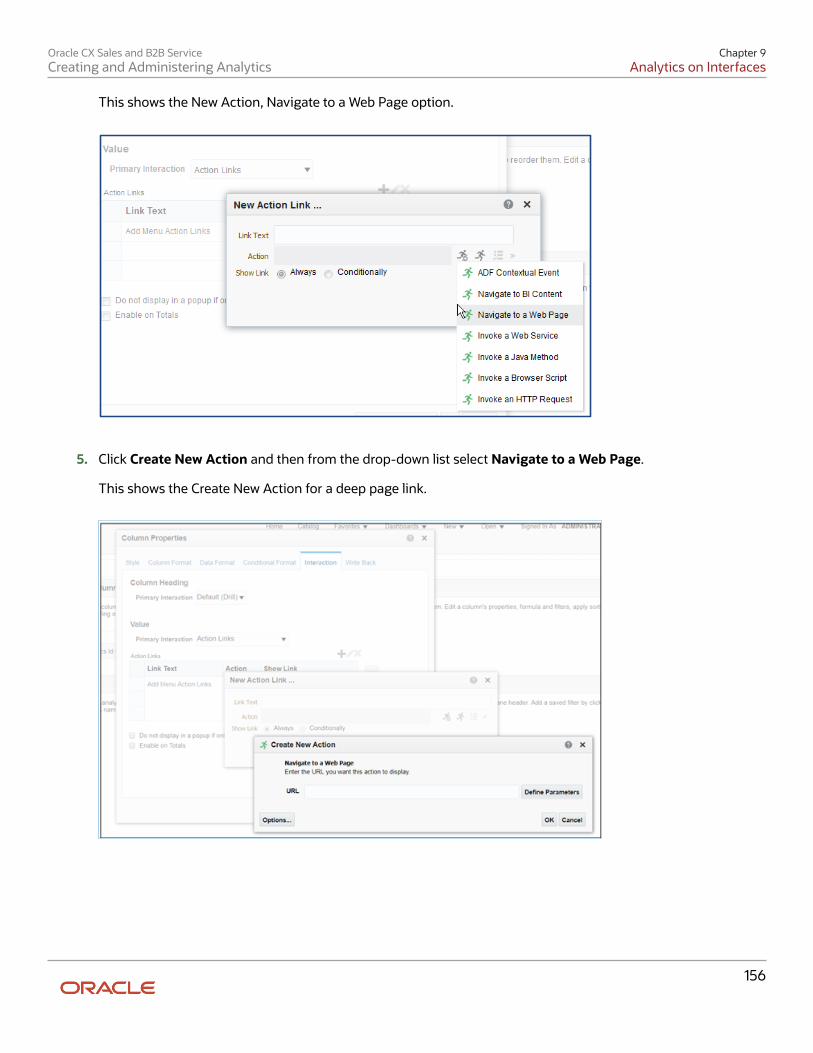
Oracle CX Sales and B2B ServiceCreating and Administering Analytics
Chapter 9Analytics on Interfaces
156
This shows the New Action, Navigate to a Web Page option.
5. Click Create New Action and then from the drop-down list select Navigate to a Web Page.
This shows the Create New Action for a deep page link.
Oracle CX Sales and B2B ServiceCreating and Administering Analytics
Chapter 9Analytics on Interfaces
157
Construct the deep Link URLYou add your specific URL to the action field. These steps show you how to determine the correct URL for yourenvironment. These URLs are examples only.
1. Add the deep link URL to the Create New Action field. There are deep page links patterns available for objectswhich can be found by going to Related Topics at the bottom of this section and clicking deep Page Links:Explained. In this example, you take the deep URL pattern for the Custom Object, which in this case is calledProduct Docs. To create a deep link to a default summary page tab for a custom object use the deep link URLpattern in the following example:
https://<hostname>:<port>/<application>/faces/FuseOverview?
fndGlobalItemNodeId=CRM_CUSTOM_CARD_<XXXX>&fndTaskItemNodeId=CRM_CUSTOM_TAB_<XXXX>&fnd=%3BsubTabName
%253DSUMMARY%253BObjectId%253D<YYYY>%253B%3B%3B%3Bfalse%3B256%3B%3B%3B
Replace XXXX with the custom object's API name, for example, ProductDocs_c. Obtain the API name from theobject overview page (click the object's node in the Custom Objects tree in Application Composer).
Replace the YYYY with the custom object's primary key in the database. In this case, the custom object primarykey .comes from the Record_Id column, as shown in the following example:
https://<hostname>:<port>/<application>/faces/FuseOverview?
fndGlobalItemNodeId=CRM_CUSTOM_CARD_ProductDocs_c&fndTaskItemNodeId=CRM_CUSTOM_TAB_ ProductDocs_c&fnd=
%3BsubTabName%253DSUMMARY%253BObjectId%253D300100057476089%253B%3B%3B%3Bfalse%3B256%3B%3B%3B
Note that you can test the URL by replacing the host name with your actual host name and using a valid recordvalue in place of <YYYY>. Put the URL in a browser to see if the record details page appears and the URL isvalid.
2. Once you have determined that the URL is valid, the next step is to embed this URL in the analytic and ensurethat the object ID, represented in these instructions as <YYYY> is dynamically retrieved from the analyticwhenever the Product Docs name is clicked. When you have added the URL click Define Parameters. The nextpart of these instructions is to construct the deep link URL.
Update the deep Link URL and ParametersThe define parameters fields are populated with some prompts and values already. The purpose of these steps is toensure that the object ID is defined as a parameter.
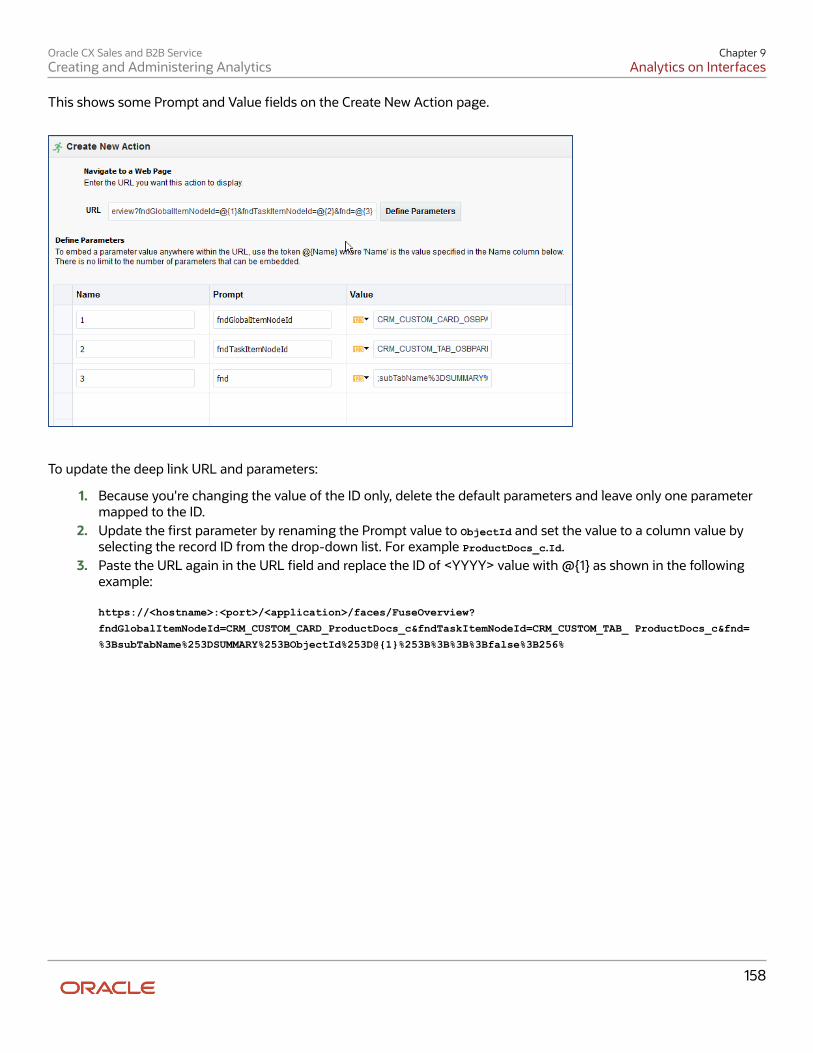
Oracle CX Sales and B2B ServiceCreating and Administering Analytics
Chapter 9Analytics on Interfaces
158
This shows some Prompt and Value fields on the Create New Action page.
To update the deep link URL and parameters:
1. Because you're changing the value of the ID only, delete the default parameters and leave only one parametermapped to the ID.
2. Update the first parameter by renaming the Prompt value to ObjectId and set the value to a column value byselecting the record ID from the drop-down list. For example ProductDocs_c.Id.
3. Paste the URL again in the URL field and replace the ID of <YYYY> value with @{1} as shown in the followingexample:
https://<hostname>:<port>/<application>/faces/FuseOverview?
fndGlobalItemNodeId=CRM_CUSTOM_CARD_ProductDocs_c&fndTaskItemNodeId=CRM_CUSTOM_TAB_ ProductDocs_c&fnd=
%3BsubTabName%253DSUMMARY%253BObjectId%253D@{1}%253B%3B%3B%3Bfalse%3B256%
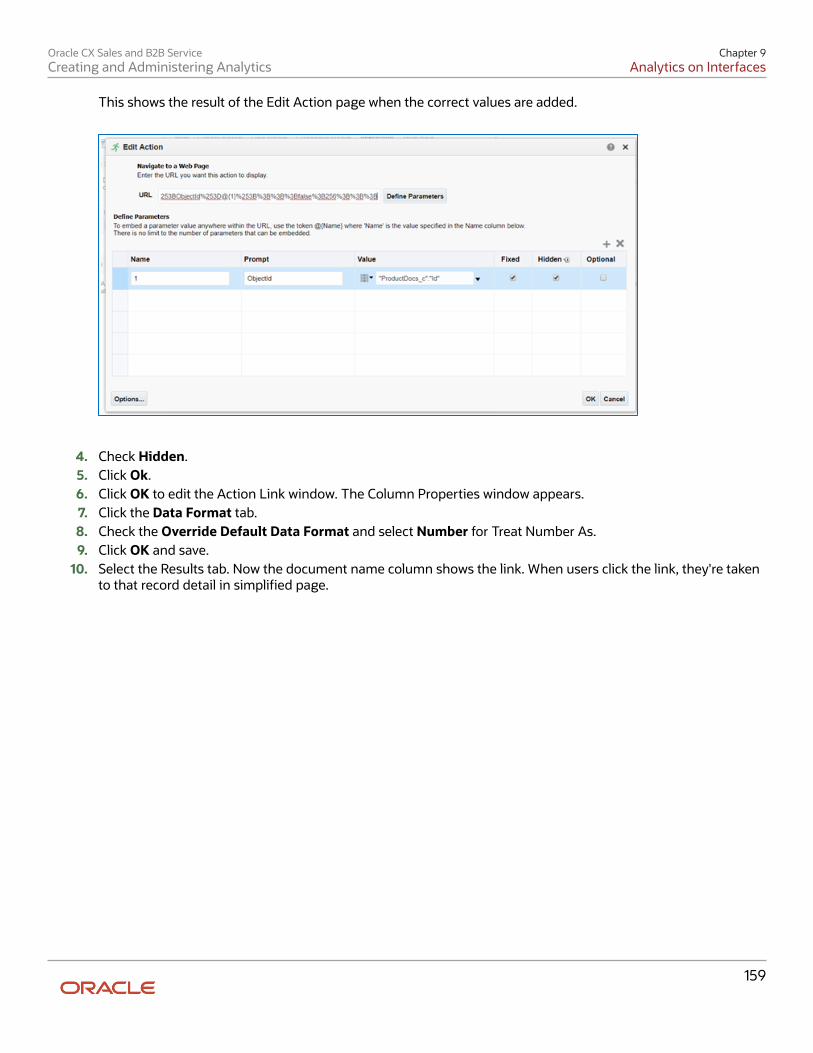
Oracle CX Sales and B2B ServiceCreating and Administering Analytics
Chapter 9Analytics on Interfaces
159
This shows the result of the Edit Action page when the correct values are added.
4. Check Hidden.5. Click Ok.6. Click OK to edit the Action Link window. The Column Properties window appears.7. Click the Data Format tab.8. Check the Override Default Data Format and select Number for Treat Number As.9. Click OK and save.
10. Select the Results tab. Now the document name column shows the link. When users click the link, they're takento that record detail in simplified page.
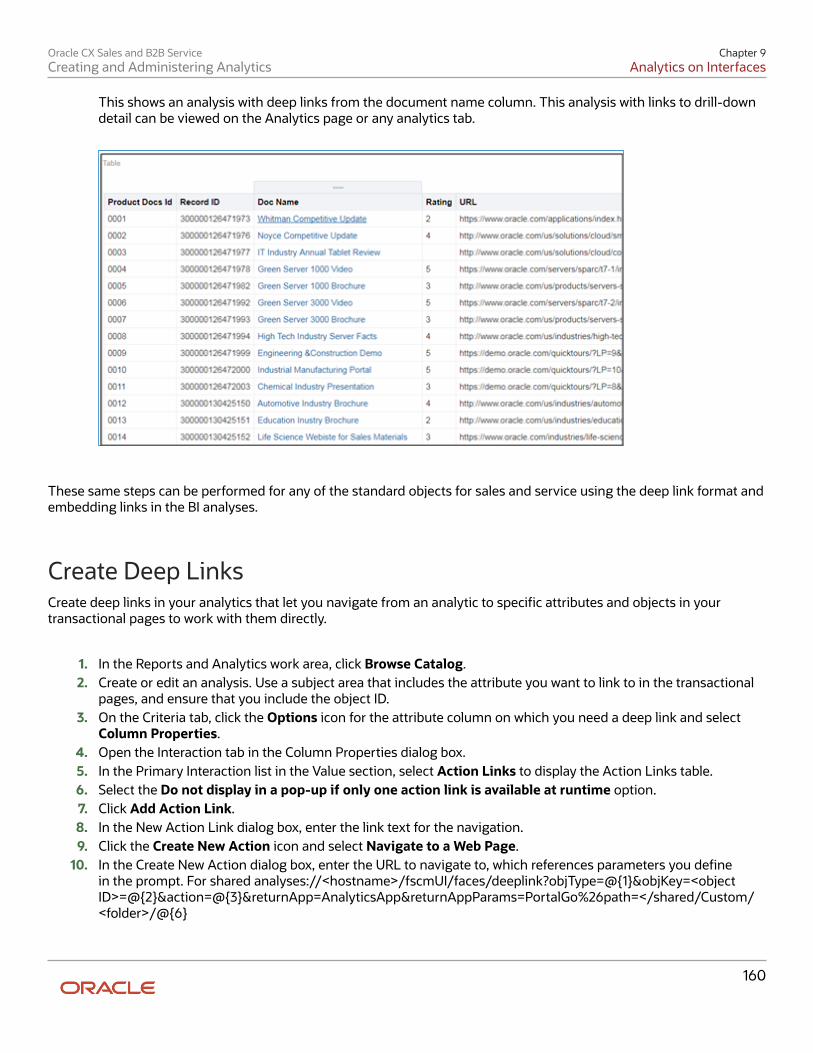
Oracle CX Sales and B2B ServiceCreating and Administering Analytics
Chapter 9Analytics on Interfaces
160
This shows an analysis with deep links from the document name column. This analysis with links to drill-downdetail can be viewed on the Analytics page or any analytics tab.
These same steps can be performed for any of the standard objects for sales and service using the deep link format andembedding links in the BI analyses.
Create Deep LinksCreate deep links in your analytics that let you navigate from an analytic to specific attributes and objects in yourtransactional pages to work with them directly.
1. In the Reports and Analytics work area, click Browse Catalog.2. Create or edit an analysis. Use a subject area that includes the attribute you want to link to in the transactional
pages, and ensure that you include the object ID.3. On the Criteria tab, click the Options icon for the attribute column on which you need a deep link and select
Column Properties.4. Open the Interaction tab in the Column Properties dialog box.5. In the Primary Interaction list in the Value section, select Action Links to display the Action Links table.6. Select the Do not display in a pop-up if only one action link is available at runtime option.7. Click Add Action Link.8. In the New Action Link dialog box, enter the link text for the navigation.9. Click the Create New Action icon and select Navigate to a Web Page.
10. In the Create New Action dialog box, enter the URL to navigate to, which references parameters you definein the prompt. For shared analyses://<hostname>/fscmUI/faces/deeplink?objType=@{1}&objKey=<objectID>=@{2}&action=@{3}&returnApp=AnalyticsApp&returnAppParams=PortalGo%26path=</shared/Custom/<folder>/@{6}
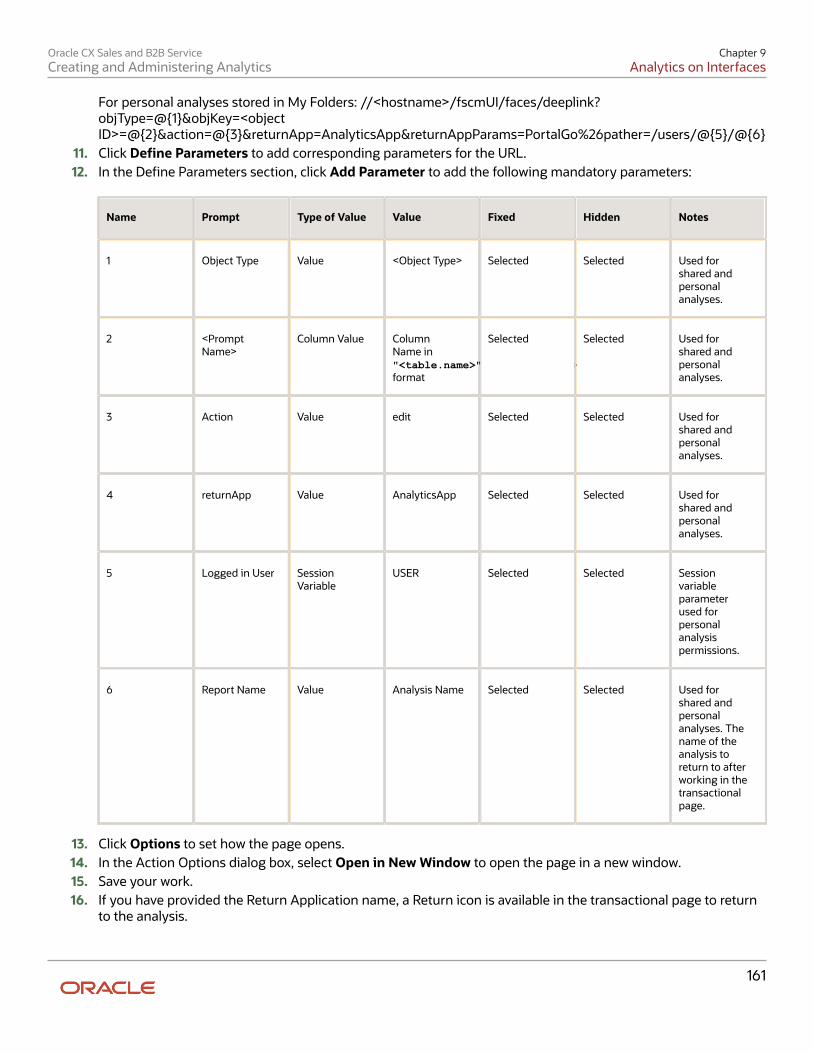
Oracle CX Sales and B2B ServiceCreating and Administering Analytics
Chapter 9Analytics on Interfaces
161
For personal analyses stored in My Folders: //<hostname>/fscmUI/faces/deeplink?objType=@{1}&objKey=<objectID>=@{2}&action=@{3}&returnApp=AnalyticsApp&returnAppParams=PortalGo%26pather=/users/@{5}/@{6}
11. Click Define Parameters to add corresponding parameters for the URL.12. In the Define Parameters section, click Add Parameter to add the following mandatory parameters:
Name Prompt Type of Value Value Fixed Hidden Notes
1 Object Type Value <Object Type> Selected Selected Used forshared andpersonalanalyses.
2 <PromptName>
Column Value ColumnName in"<table.name>"."<column.name>"format
Selected Selected Used forshared andpersonalanalyses.
3 Action Value edit Selected Selected Used forshared andpersonalanalyses.
4 returnApp Value AnalyticsApp Selected Selected Used forshared andpersonalanalyses.
5 Logged in User SessionVariable
USER Selected Selected Sessionvariableparameterused forpersonalanalysispermissions.
6 Report Name Value Analysis Name Selected Selected Used forshared andpersonalanalyses. Thename of theanalysis toreturn to afterworking in thetransactionalpage.
13. Click Options to set how the page opens.14. In the Action Options dialog box, select Open in New Window to open the page in a new window.15. Save your work.16. If you have provided the Return Application name, a Return icon is available in the transactional page to return
to the analysis.
Oracle CX Sales and B2B ServiceCreating and Administering Analytics
Chapter 9Analytics on Interfaces
162
Related Topics
• Manage Analytics with Advanced Features
Why did a deep link open to a blank page?You may not have access to the linked object, or the URL entered for the action is incorrect, for example lacking theenvironment or the Object ID name.
• Check the URL you entered for the action. It may be missing the environment name or the Object ID name.
• Check the URL parameters, the spelling of the action, and that you're using the correct key in the object'sanalysis.
Do I have to display the ID for my object?No, you can add it, format the column as a number with zero decimals, and then hide the column.
Can I display actions for some users and not others?Yes, you define conditions for the action to display.
Embed Analyses and Dashboards
Allow Safe DomainsYou allow safe domains to approve access to specific content. For security reasons, external content can't be added toreports and reports can't be embedded in other applications unless it's safe to do so. Only administrators can allow safedomains.
Only authorized users may access the content. Except in cases where Single Sign On (SSO) is enabled, users areprompted to sign in when they access content on safe domains. After you have added a safe domain, users need to signout and sign back in to access content from that source.
1. Click Navigator > Reports and Analytics.2. Click Browse Catalog.3. Click the Administration link on the BI Home page.4. Click the Manage Safe Domains link.5. To allow users to embed their analyses in content located on other domains, enter the name of the safe domain
as well as the port. Here are a few formats you can use for port names:
◦ www.example.com:<port number>
◦ *.example.com:<port number>
◦ https:
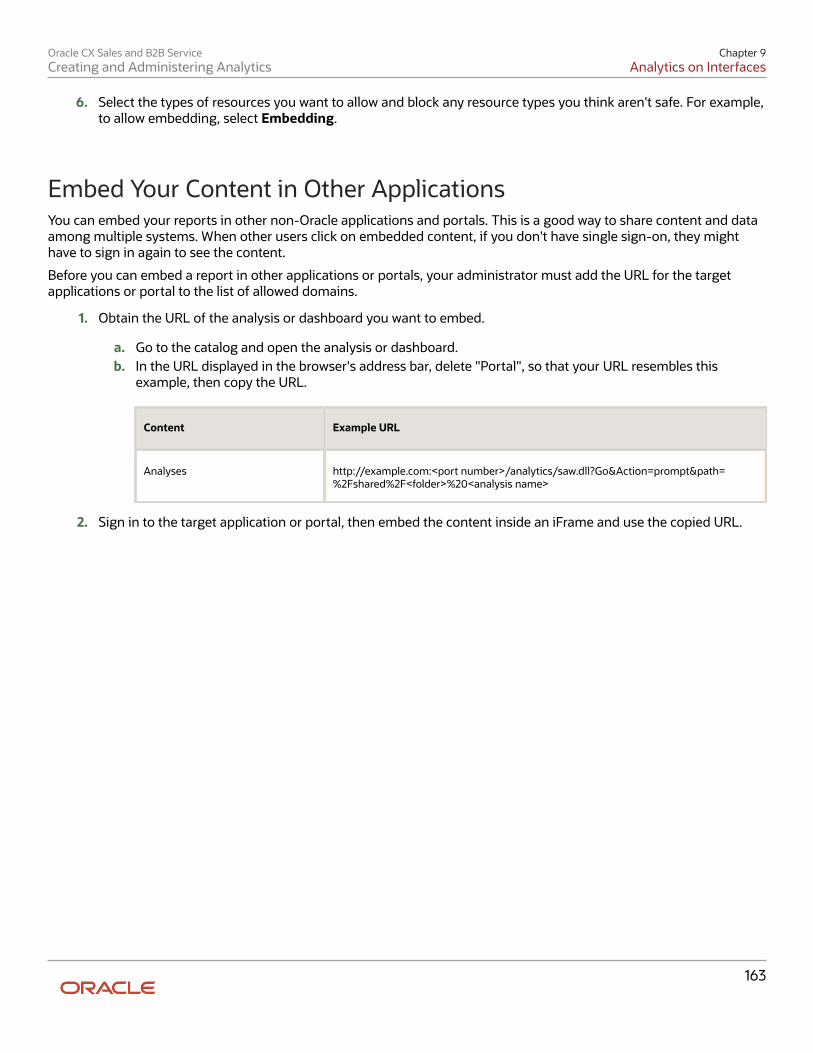
Oracle CX Sales and B2B ServiceCreating and Administering Analytics
Chapter 9Analytics on Interfaces
163
6. Select the types of resources you want to allow and block any resource types you think aren't safe. For example,to allow embedding, select Embedding.
Embed Your Content in Other ApplicationsYou can embed your reports in other non-Oracle applications and portals. This is a good way to share content and dataamong multiple systems. When other users click on embedded content, if you don't have single sign-on, they mighthave to sign in again to see the content.
Before you can embed a report in other applications or portals, your administrator must add the URL for the targetapplications or portal to the list of allowed domains.
1. Obtain the URL of the analysis or dashboard you want to embed.
a. Go to the catalog and open the analysis or dashboard.b. In the URL displayed in the browser's address bar, delete "Portal", so that your URL resembles this
example, then copy the URL.
Content Example URL
Analyses http://example.com:<port number>/analytics/saw.dll?Go&Action=prompt&path=%2Fshared%2F<folder>%20<analysis name>
2. Sign in to the target application or portal, then embed the content inside an iFrame and use the copied URL.
Oracle CX Sales and B2B ServiceCreating and Administering Analytics
Chapter 9Analytics on Interfaces
164
Oracle CX Sales and B2B ServiceCreating and Administering Analytics
Chapter 10Schedule and Share Analytics
165
10 Schedule and Share Analytics
Create Briefing BooksUse briefing books to hold a collection of analytic snapshots. These snapshots give you a picture of what's going onat the time the analytic is added, downloaded, or rerun. You can download briefing books as PDFs or MHTML to view,print, or share. The PDF file includes a table of contents. Briefing books are stored in the business intelligence (BI)catalog.
Add Content to New Briefing Books1. Open the Reports and Analytics work area.2. Click Browse Catalog.3. Select your analytic, then click More and select Add to Briefing Book.
Or, find your dashboard and click Open.
a. Go to the dashboard page you want to add.b. Click the Page Options button and select Add to Briefing Book.
4. Select Updatable if you want the analytic results refreshed whenever the briefing book is downloaded or rerun,or Snapshot to store it without updating.
5. Click Browse.6. Name your briefing book and save it in My Folders.
Add Content to Existing Briefing Books
1. Open the Reports and Analytics work area.2. Click Browse Catalog.3. Select your analysis, then click More and select Add to Briefing Book.
Or, find your dashboard and click Open.
a. Go to the dashboard page you want to add.b. Click the Page Options button and select Add to Briefing Book.
4. Select Updatable if you want the analytic results refreshed whenever the briefing book is downloaded or rerun,or Snapshot to store it without updating.
Download and Edit Briefing Books
1. Open the Reports and Analytics work area.2. Click Browse Catalog to locate your briefing book, and click PDF to download it.
Oracle CX Sales and B2B ServiceCreating and Administering Analytics
Chapter 10Schedule and Share Analytics
166
Schedule Analytics, Dashboard Pages, and BriefingBooksYou can schedule Analytics, dashboard pages, and briefing books to run when you need them. You can also scheduleother automated tasks, for example to deliver results to specific recipients, send notifications, or to generate a list ofchanges implemented today using the CURRENT_DATE repository variable. You create what's called an agent to set thisall up for an analysis, dashboard, or briefing book. The agent itself is saved as an object in the business intelligence (BI)catalog. Once run, analyses and other objects persist for four years.
Create an Agent1. Open the Reports and Analytics work area or the Reports and Analytics panel tab if available in other work
areas.2. Click Browse Catalog.3. Click the New icon and, from the Actionable Intelligence section, select Agent.4. Make sure you enter information on the Delivery Content tab to specify the analysis, dashboard page, or
briefing book to run. Browse for the analysis, dashboard page, or briefing book, which must be specified togenerate an attachment.
5. Click the Save this Agent icon and save it in My Folders.
Related Topics• Schedule Reports
Schedule Snapshots of Your Sales Historical PipelineKeep an eye on your bottom line using the Generates Sales Historical Snapshots scheduling process. You get dailysnapshots of your sales pipeline as well as snapshots of opportunity and revenue trends over time.
Snapshots are designed to work only when your enterprise calendar is configured to be either Monthly or Weekly. Soyou need to be sure to set up your calendar to be weekly or monthly before you start using snapshots.
The Generates Sales Historical Snapshots feature uses the Sales - CRM Historical Pipeline subject area to cullinformation on your key pipeline data.
Note: The snapshot data will be retained for the new value for parameter for the days starting from the day theprofile option was changed as long as the count of snapshot records (opportunity and revenue combined) does notcross 10 million records.
Configure Historical SnapshotsThe Generates Sales Historical Snapshots scheduled process captures opportunity and revenue snapshots for openopportunities and opportunities closed within the time period you specify. You can set up a snapshot to run once, orset it up to run daily, weekly, monthly, yearly, or on your own time frame. You can also choose the number of days afterwhich opportunities have been closed to continue to take a snapshot of the opportunity and its corresponding revenueinformation.
Oracle CX Sales and B2B ServiceCreating and Administering Analytics
Chapter 10Schedule and Share Analytics
167
To configure your Sales Historical Snapshots scheduled process:
1. Navigate to Setup and Maintenance, All Tasks.2. Under Name, search for Manage Opportunity Profile Options.
The search results returns the Manage Opportunity Profile Option in the bottom of the window.3. Click Go to Task on the row that holds the Manage Opportunity Profile Options search result. The Manage
Opportunity Profile Options page appears.4. Under Profile Option Code, enter MOO_MANAGE_SALES_HISTORICAL_SNAPSHOT_CONFIGURATION. Search for that profile.5. Under Profile Values on the right ensure that the value are C=120,D=120,W=58,M=14,Q=5.
The Profile Values are defined the following ways:
◦ C is number of create snapshots for closed opportunities closed within the last C days. This value must begreater than zero.
◦ D is number of days to retain daily snapshots. This value must be greater than zero.
◦ W is umber of weeks to retain weekly snapshots if the enterprise calendar is a week based calendar.
◦ M is number of months to retain monthly snapshots if the enterprise calendar is a month based calendar.
◦ Q is number of quarters to retain a quarterly snapshot.
Note: An upper limit of 10M snapshot records (opportunity and revenue records combined) is supported and oncethe record limit is reached, the snapshot process automatically purges records by oldest snapshot date until therecord count is brought under the limit. The snapshot process only supports capturing snapshots if the enterprisecalendar is configured to be either a Month or Week based calendar. No other calendar period frequencies aresupported. To use the snapshot feature you must configure your calendar first.
Schedule Historical SnapshotsYou can schedule your Sales Historical Snapshots processes either from the SUI, or from the desktop UI.
To schedule your sales historical snapshots processes:
1. From the menu options choose More then Scheduled Processes.2. Click the Schedule New Process tab.
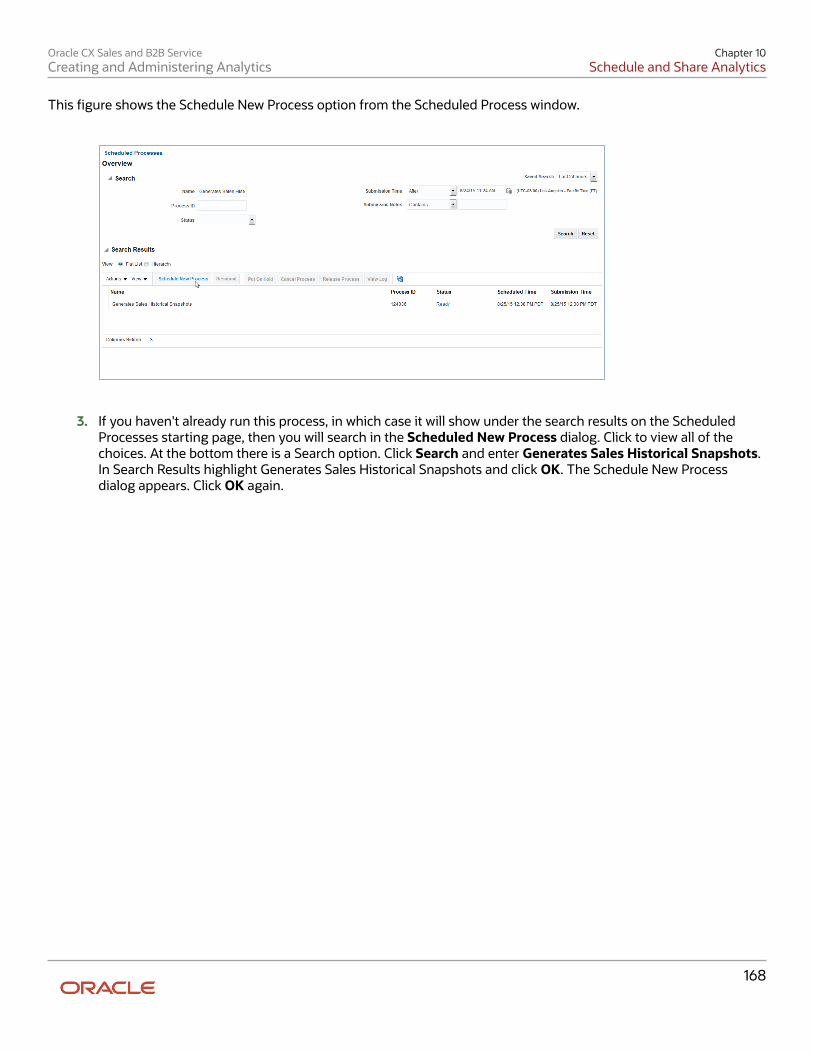
Oracle CX Sales and B2B ServiceCreating and Administering Analytics
Chapter 10Schedule and Share Analytics
168
This figure shows the Schedule New Process option from the Scheduled Process window.
3. If you haven't already run this process, in which case it will show under the search results on the ScheduledProcesses starting page, then you will search in the Scheduled New Process dialog. Click to view all of thechoices. At the bottom there is a Search option. Click Search and enter Generates Sales Historical Snapshots.In Search Results highlight Generates Sales Historical Snapshots and click OK. The Schedule New Processdialog appears. Click OK again.
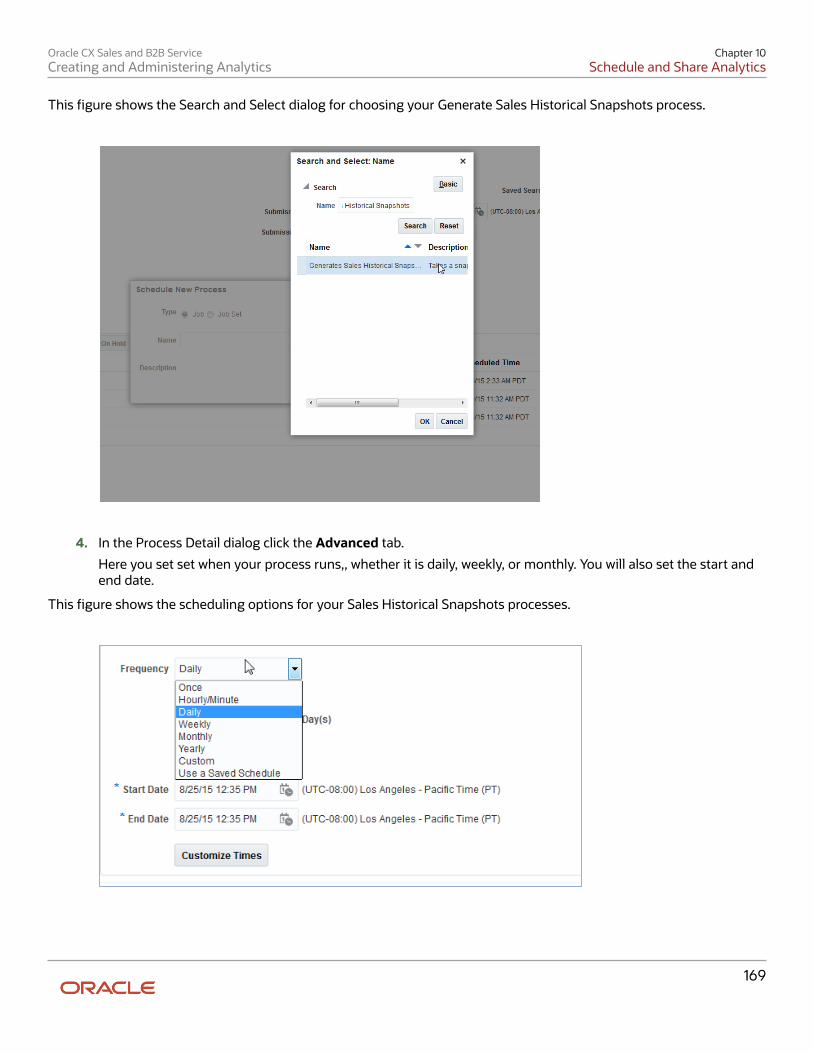
Oracle CX Sales and B2B ServiceCreating and Administering Analytics
Chapter 10Schedule and Share Analytics
169
This figure shows the Search and Select dialog for choosing your Generate Sales Historical Snapshots process.
4. In the Process Detail dialog click the Advanced tab.
Here you set set when your process runs,, whether it is daily, weekly, or monthly. You will also set the start andend date.
This figure shows the scheduling options for your Sales Historical Snapshots processes.
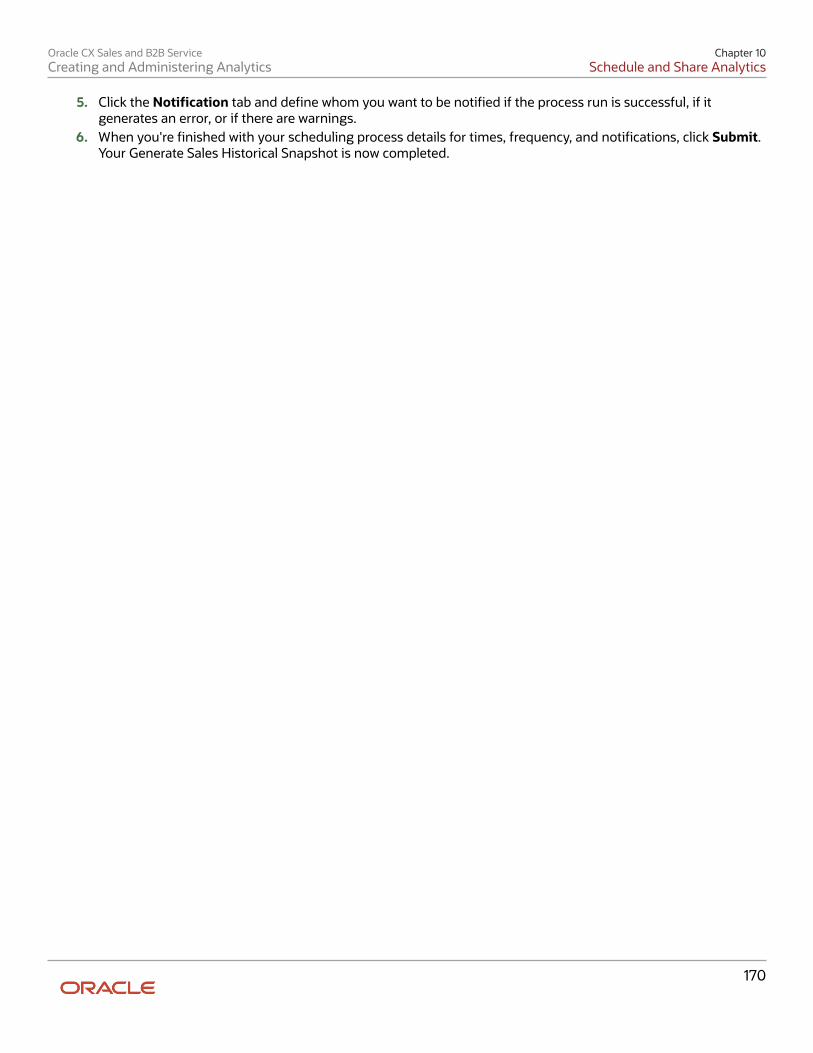
Oracle CX Sales and B2B ServiceCreating and Administering Analytics
Chapter 10Schedule and Share Analytics
170
5. Click the Notification tab and define whom you want to be notified if the process run is successful, if itgenerates an error, or if there are warnings.
6. When you're finished with your scheduling process details for times, frequency, and notifications, click Submit.Your Generate Sales Historical Snapshot is now completed.
Oracle CX Sales and B2B ServiceCreating and Administering Analytics
Chapter 11Analytics Folders
171
11 Analytics Folders
Where to Save Analytics and ReportsYou save analyses, dashboards, and reports in the catalog, along with other objects like prompts and filters. Besides thehierarchy of folders organized by product family, another important folder is Custom, found in Shared Folders. This iswhere you save the analytics and reports you create or edit for others to use.
Shared Folders and the Custom SubfolderAnyone with the correct access can get to objects stored in Shared Folders. If you have the appropriate roles, youcan save in Shared Folders so that your objects are available for other users. You should save objects in the Customsubfolder, and use the product family subfolders to organize and publish analytics and objects for the correct audiences.
Here are a few things to know while working with analytics in the catalog. Keep all modified analyses and reports inthe Custom folder. Directly edit predefined analytics only when it's necessary to make sure that any references to theanalysis or dashboard still work properly.
• Preserve modified predefined objects during updates, which can make changes to predefined analytics,reports, and other objects outside the Custom folder. You might lose changes saved outside the Custom folderduring updates.
• You can easily find modified objects if they're not spread around the catalog.
• You can edit objects in the Custom folder without compromising security on the original objects.
• For predefined reports only, you can use a special Customize option to copy the report and also the folderstructure and permissions. The copy is linked to the original, so editing the copy is like directly editing theoriginal.
When you copy an object into the Custom folder, the copied object inherits the permission settings of the Customfolder. An administrator can reset the permissions on the object and the folder that it's in.
Note: When you create folders in the catalog, don't use special characters (~, !, #, $, %, ^, &, *, +, `, |, :, ", \\, <, >, ?, ,, /)in their names.
My FoldersMy Folders is your personal storage; you're the only one who can access anything that you save there. What you savethere is available in the Reports and Analytics work area, but not in My Folders in the Reports and Analytics panel tab onany other work area. But an exception is when you create an analysis using the wizard in the Reports and Analytics workarea. If you save a wizard analysis in My Folders, it's available in any panel tab that appears in any work area.
Note: Don't store analyses or reports in the predefined Temp folder in My Folders. That folder is used by BI Publisherand purged automatically every 24 hours.
Related Topics• How You Create and Edit Reports• Create and Modify Analyses and Dashboards• How You Modify Copies of Predefined Reports
Oracle CX Sales and B2B ServiceCreating and Administering Analytics
Chapter 11Analytics Folders
172
Manage Predefined Catalog PermissionYou may want to remove access to predefined catalog folders so that those associated with offerings you don't usearen't displayed. You can hide the entire predefined catalog or selectively display root catalog folders for offerings.Offerings are controlled by the Custom BI Web cat Reporting Duty role and associated roles for each.
Using roles, you can manage folder access in a number of ways, depending on requirements and previous modificationsyou have made.
• Remove duty roles for parent folders from the Custom BI Web cat Reporting Duty role so that all users see asubset of the predefined catalog. Leave roles only for the offerings you want to retain access for.
• Delete all catalog reporting duty roles from the Custom BI Web cat Reporting Duty role to hide the entirepredefined catalog and display only /Shared/Custom folders. For example, you can remove BI catalog accessfor external users such as partners who have no access to reporting.
• Delete all catalog reporting duty roles from the Custom BI Web cat Reporting Duty role. Also, add catalogreporting duty roles to a new or existing job role so that job roles with BI access get default access to thepredefined catalog. For example, by default, Financial job roles have access to Financial reporting content butHuman Capital Management job roles don't have access to the predefined HCM BI catalog. You can grant theHuman Capital Management Folder Reporting Duty role to new job roles to allow access to predefined HCMreports.
Hide Predefined Catalog FoldersAll authenticated users have the Custom BI Web cat Reporting Duty role, which inherits all of the folder reporting rolesthat determine access and visibility of root level catalog folders. Administrators with IT Security Manager privileges canhide predefined folders by removing their associated roles from the duty role.
1. Open the Security Console.2. Search for Custom BI Web cat Reporting Duty.3. In the search results, click Actions > Edit Role.4. Click Next twice to navigate to the Role Hierarchy step.5. To hide all folders, remove all of the roles from the hierarchy. Leave any roles for offerings you want to retain
access for.6. Run the Import User and Role Application Security Data process to synchronize security changes.7. Click Browse Catalog in the Reports and Analytics work area and click Administration. In the Maintenance and
Troubleshooting section, select Reload Files and Metadata to refresh the the BI cache.
BI Reporting RolesThis table shows the mapping between shared root catalog folders, folder reporting roles, and job roles.
Catalog Folder Duty Role Duty Role Name Associated Job Roles
/Shared/Common Content BI_COMMON_CONTENT_REPORTING_DUTYCommon Content FolderReporting Duty
None
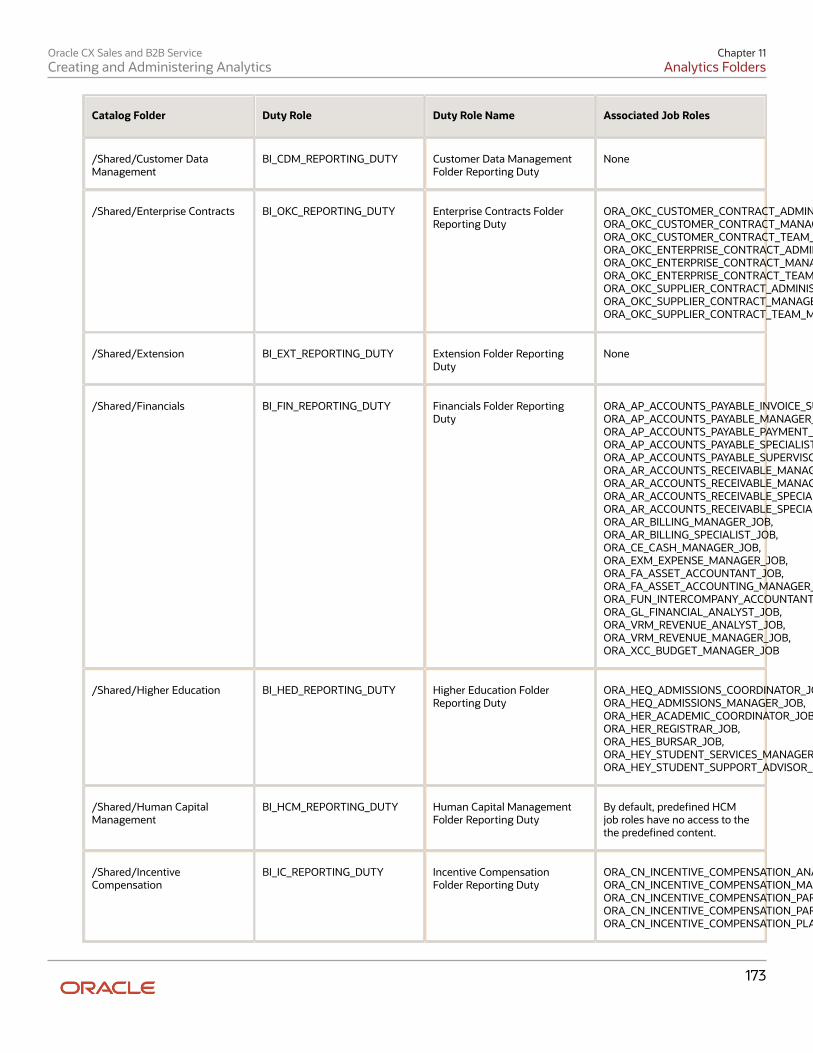
Oracle CX Sales and B2B ServiceCreating and Administering Analytics
Chapter 11Analytics Folders
173
Catalog Folder Duty Role Duty Role Name Associated Job Roles
/Shared/Customer DataManagement
BI_CDM_REPORTING_DUTY Customer Data ManagementFolder Reporting Duty
None
/Shared/Enterprise Contracts BI_OKC_REPORTING_DUTY Enterprise Contracts FolderReporting Duty
ORA_OKC_CUSTOMER_CONTRACT_ADMINISTRATOR_JOB,ORA_OKC_CUSTOMER_CONTRACT_MANAGER_JOB,ORA_OKC_CUSTOMER_CONTRACT_TEAM_MEMBER_ABSTRACT,ORA_OKC_ENTERPRISE_CONTRACT_ADMINISTRATOR_JOB,ORA_OKC_ENTERPRISE_CONTRACT_MANAGER_JOB,ORA_OKC_ENTERPRISE_CONTRACT_TEAM_MEMBER_ABSTRACT,ORA_OKC_SUPPLIER_CONTRACT_ADMINISTRATOR_JOB,ORA_OKC_SUPPLIER_CONTRACT_MANAGER_JOB,ORA_OKC_SUPPLIER_CONTRACT_TEAM_MEMBER_ABSTRACT
/Shared/Extension BI_EXT_REPORTING_DUTY Extension Folder ReportingDuty
None
/Shared/Financials BI_FIN_REPORTING_DUTY Financials Folder ReportingDuty
ORA_AP_ACCOUNTS_PAYABLE_INVOICE_SUPERVISOR_JOBORA_AP_ACCOUNTS_PAYABLE_MANAGER_JOB,ORA_AP_ACCOUNTS_PAYABLE_PAYMENT_SUPERVISOR_JOB,ORA_AP_ACCOUNTS_PAYABLE_SPECIALIST_JOB,ORA_AP_ACCOUNTS_PAYABLE_SUPERVISOR_JOB,ORA_AR_ACCOUNTS_RECEIVABLE_MANAGER_JOB,ORA_AR_ACCOUNTS_RECEIVABLE_MANAGER_SOD_JOB,ORA_AR_ACCOUNTS_RECEIVABLE_SPECIALIST_JOB,ORA_AR_ACCOUNTS_RECEIVABLE_SPECIALIST_SOD_JOB,ORA_AR_BILLING_MANAGER_JOB,ORA_AR_BILLING_SPECIALIST_JOB,ORA_CE_CASH_MANAGER_JOB,ORA_EXM_EXPENSE_MANAGER_JOB,ORA_FA_ASSET_ACCOUNTANT_JOB,ORA_FA_ASSET_ACCOUNTING_MANAGER_JOB,ORA_FUN_INTERCOMPANY_ACCOUNTANT_JOB,ORA_GL_FINANCIAL_ANALYST_JOB,ORA_VRM_REVENUE_ANALYST_JOB,ORA_VRM_REVENUE_MANAGER_JOB,ORA_XCC_BUDGET_MANAGER_JOB
/Shared/Higher Education BI_HED_REPORTING_DUTY Higher Education FolderReporting Duty
ORA_HEQ_ADMISSIONS_COORDINATOR_JOB,ORA_HEQ_ADMISSIONS_MANAGER_JOB,ORA_HER_ACADEMIC_COORDINATOR_JOB,ORA_HER_REGISTRAR_JOB,ORA_HES_BURSAR_JOB,ORA_HEY_STUDENT_SERVICES_MANAGER_JOB,ORA_HEY_STUDENT_SUPPORT_ADVISOR_JOB
/Shared/Human CapitalManagement
BI_HCM_REPORTING_DUTY Human Capital ManagementFolder Reporting Duty
By default, predefined HCMjob roles have no access to thethe predefined content.
/Shared/IncentiveCompensation
BI_IC_REPORTING_DUTY Incentive CompensationFolder Reporting Duty
ORA_CN_INCENTIVE_COMPENSATION_ANALYST_JOB,ORA_CN_INCENTIVE_COMPENSATION_MANAGER_JOB,ORA_CN_INCENTIVE_COMPENSATION_PARTICIPANT_ABSTRACT,ORA_CN_INCENTIVE_COMPENSATION_PARTICIPANT_MANAGER_ABSTRACT,ORA_CN_INCENTIVE_COMPENSATION_PLAN_ADMINISTRATOR_JOB
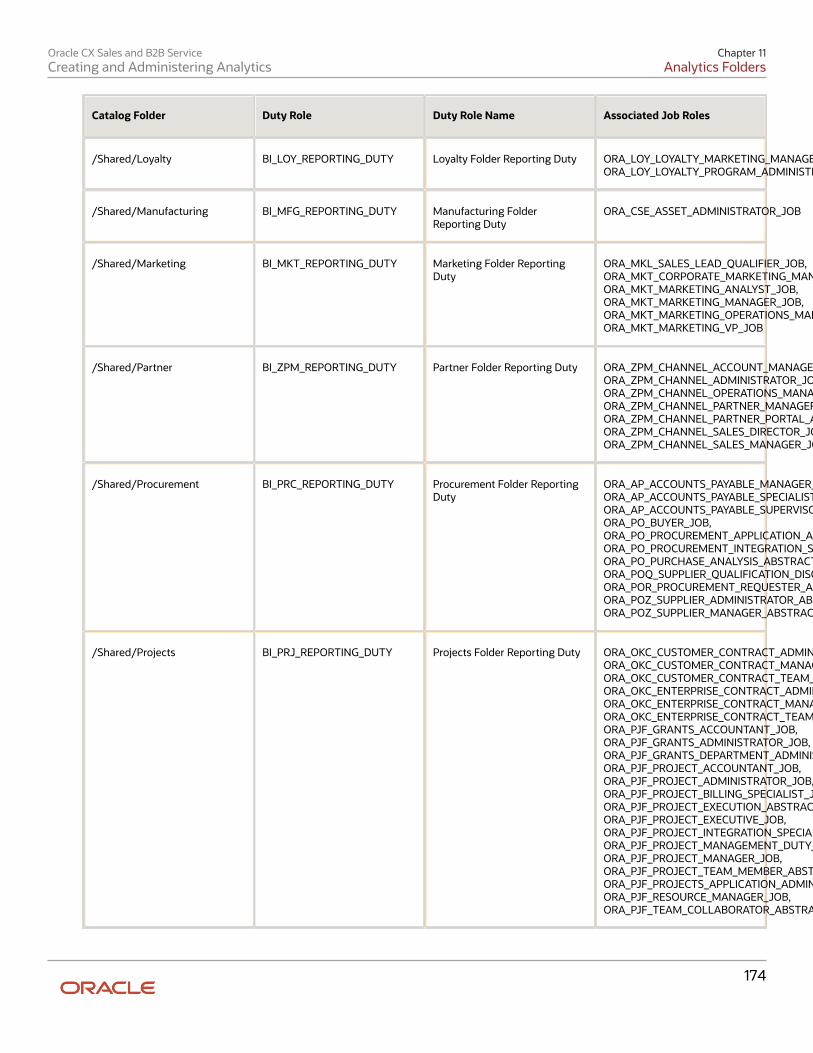
Oracle CX Sales and B2B ServiceCreating and Administering Analytics
Chapter 11Analytics Folders
174
Catalog Folder Duty Role Duty Role Name Associated Job Roles
/Shared/Loyalty BI_LOY_REPORTING_DUTY Loyalty Folder Reporting Duty ORA_LOY_LOYALTY_MARKETING_MANAGER_JOB,ORA_LOY_LOYALTY_PROGRAM_ADMINISTRATOR_JOB
/Shared/Manufacturing BI_MFG_REPORTING_DUTY Manufacturing FolderReporting Duty
ORA_CSE_ASSET_ADMINISTRATOR_JOB
/Shared/Marketing BI_MKT_REPORTING_DUTY Marketing Folder ReportingDuty
ORA_MKL_SALES_LEAD_QUALIFIER_JOB,ORA_MKT_CORPORATE_MARKETING_MANAGER_JOB,ORA_MKT_MARKETING_ANALYST_JOB,ORA_MKT_MARKETING_MANAGER_JOB,ORA_MKT_MARKETING_OPERATIONS_MANAGER_JOB,ORA_MKT_MARKETING_VP_JOB
/Shared/Partner BI_ZPM_REPORTING_DUTY Partner Folder Reporting Duty ORA_ZPM_CHANNEL_ACCOUNT_MANAGER_JOB,ORA_ZPM_CHANNEL_ADMINISTRATOR_JOB,ORA_ZPM_CHANNEL_OPERATIONS_MANAGER_JOB,ORA_ZPM_CHANNEL_PARTNER_MANAGER_JOB,ORA_ZPM_CHANNEL_PARTNER_PORTAL_ADMINISTRATOR_JOB,ORA_ZPM_CHANNEL_SALES_DIRECTOR_JOB,ORA_ZPM_CHANNEL_SALES_MANAGER_JOB
/Shared/Procurement BI_PRC_REPORTING_DUTY Procurement Folder ReportingDuty
ORA_AP_ACCOUNTS_PAYABLE_MANAGER_JOB,ORA_AP_ACCOUNTS_PAYABLE_SPECIALIST_JOB,ORA_AP_ACCOUNTS_PAYABLE_SUPERVISOR_JOB,ORA_PO_BUYER_JOB,ORA_PO_PROCUREMENT_APPLICATION_ADMIN_JOB,ORA_PO_PROCUREMENT_INTEGRATION_SPECIALIST_JOB,ORA_PO_PURCHASE_ANALYSIS_ABSTRACT,ORA_POQ_SUPPLIER_QUALIFICATION_DISCRETIONARY,ORA_POR_PROCUREMENT_REQUESTER_ABSTRACT,ORA_POZ_SUPPLIER_ADMINISTRATOR_ABSTRACT,ORA_POZ_SUPPLIER_MANAGER_ABSTRACT
/Shared/Projects BI_PRJ_REPORTING_DUTY Projects Folder Reporting Duty ORA_OKC_CUSTOMER_CONTRACT_ADMINISTRATOR_JOB,ORA_OKC_CUSTOMER_CONTRACT_MANAGER_JOB,ORA_OKC_CUSTOMER_CONTRACT_TEAM_MEMBER_ABSTRACT,ORA_OKC_ENTERPRISE_CONTRACT_ADMINISTRATOR_JOB,ORA_OKC_ENTERPRISE_CONTRACT_MANAGER_JOB,ORA_OKC_ENTERPRISE_CONTRACT_TEAM_MEMBER_ABSTRACT,ORA_PJF_GRANTS_ACCOUNTANT_JOB,ORA_PJF_GRANTS_ADMINISTRATOR_JOB,ORA_PJF_GRANTS_DEPARTMENT_ADMINISTRATOR_JOB,ORA_PJF_PROJECT_ACCOUNTANT_JOB,ORA_PJF_PROJECT_ADMINISTRATOR_JOB,ORA_PJF_PROJECT_BILLING_SPECIALIST_JOB,ORA_PJF_PROJECT_EXECUTION_ABSTRACT,ORA_PJF_PROJECT_EXECUTIVE_JOB,ORA_PJF_PROJECT_INTEGRATION_SPECIALIST_JOB,ORA_PJF_PROJECT_MANAGEMENT_DUTY_ABSTRACT,ORA_PJF_PROJECT_MANAGER_JOB,ORA_PJF_PROJECT_TEAM_MEMBER_ABSTRACT,ORA_PJF_PROJECTS_APPLICATION_ADMINISTRATOR_JOB,ORA_PJF_RESOURCE_MANAGER_JOB,ORA_PJF_TEAM_COLLABORATOR_ABSTRACT
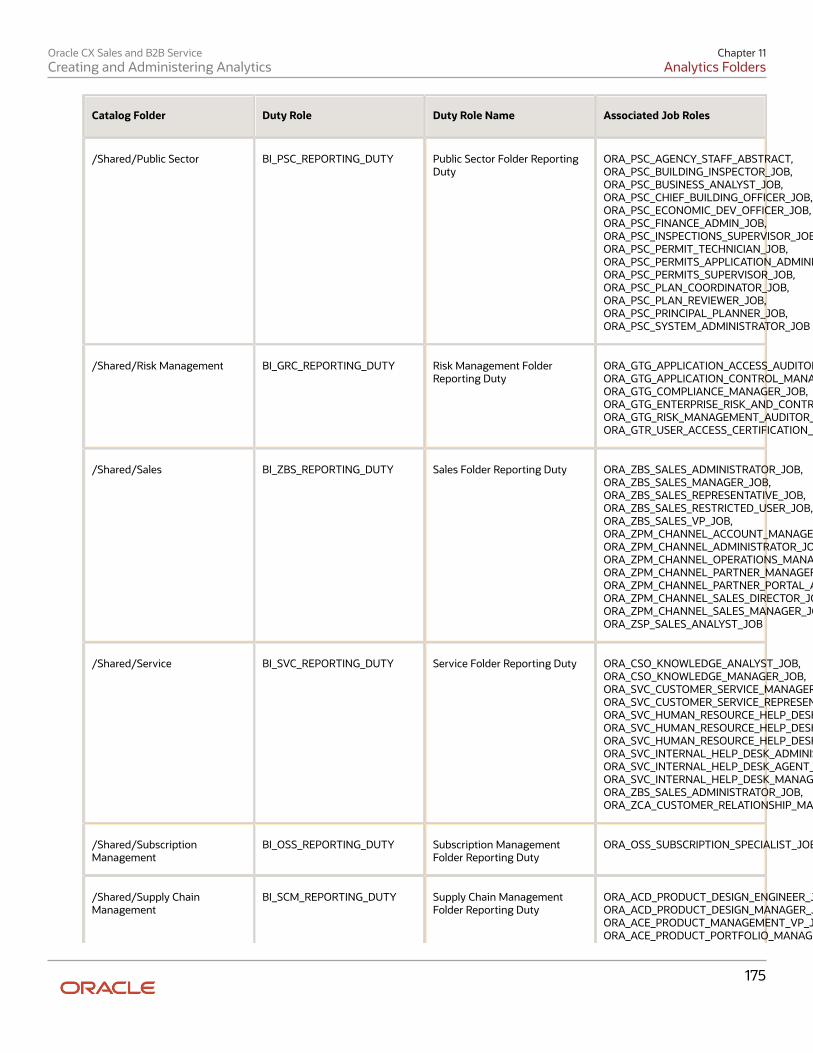
Oracle CX Sales and B2B ServiceCreating and Administering Analytics
Chapter 11Analytics Folders
175
Catalog Folder Duty Role Duty Role Name Associated Job Roles
/Shared/Public Sector BI_PSC_REPORTING_DUTY Public Sector Folder ReportingDuty
ORA_PSC_AGENCY_STAFF_ABSTRACT,ORA_PSC_BUILDING_INSPECTOR_JOB,ORA_PSC_BUSINESS_ANALYST_JOB,ORA_PSC_CHIEF_BUILDING_OFFICER_JOB,ORA_PSC_ECONOMIC_DEV_OFFICER_JOB,ORA_PSC_FINANCE_ADMIN_JOB,ORA_PSC_INSPECTIONS_SUPERVISOR_JOB,ORA_PSC_PERMIT_TECHNICIAN_JOB,ORA_PSC_PERMITS_APPLICATION_ADMINISTRATOR_JOB,ORA_PSC_PERMITS_SUPERVISOR_JOB,ORA_PSC_PLAN_COORDINATOR_JOB,ORA_PSC_PLAN_REVIEWER_JOB,ORA_PSC_PRINCIPAL_PLANNER_JOB,ORA_PSC_SYSTEM_ADMINISTRATOR_JOB
/Shared/Risk Management BI_GRC_REPORTING_DUTY Risk Management FolderReporting Duty
ORA_GTG_APPLICATION_ACCESS_AUDITOR_JOB,ORA_GTG_APPLICATION_CONTROL_MANAGER_JOB,ORA_GTG_COMPLIANCE_MANAGER_JOB,ORA_GTG_ENTERPRISE_RISK_AND_CONTROL_MANAGER_JOB,ORA_GTG_RISK_MANAGEMENT_AUDITOR_JOB,ORA_GTR_USER_ACCESS_CERTIFICATION_MANAGER_JOB
/Shared/Sales BI_ZBS_REPORTING_DUTY Sales Folder Reporting Duty ORA_ZBS_SALES_ADMINISTRATOR_JOB,ORA_ZBS_SALES_MANAGER_JOB,ORA_ZBS_SALES_REPRESENTATIVE_JOB,ORA_ZBS_SALES_RESTRICTED_USER_JOB,ORA_ZBS_SALES_VP_JOB,ORA_ZPM_CHANNEL_ACCOUNT_MANAGER_JOB,ORA_ZPM_CHANNEL_ADMINISTRATOR_JOB,ORA_ZPM_CHANNEL_OPERATIONS_MANAGER_JOB,ORA_ZPM_CHANNEL_PARTNER_MANAGER_JOB,ORA_ZPM_CHANNEL_PARTNER_PORTAL_ADMINISTRATOR_JOB,ORA_ZPM_CHANNEL_SALES_DIRECTOR_JOB,ORA_ZPM_CHANNEL_SALES_MANAGER_JOB,ORA_ZSP_SALES_ANALYST_JOB
/Shared/Service BI_SVC_REPORTING_DUTY Service Folder Reporting Duty ORA_CSO_KNOWLEDGE_ANALYST_JOB,ORA_CSO_KNOWLEDGE_MANAGER_JOB,ORA_SVC_CUSTOMER_SERVICE_MANAGER_JOB,ORA_SVC_CUSTOMER_SERVICE_REPRESENTATIVE_JOB,ORA_SVC_HUMAN_RESOURCE_HELP_DESK_ADMINISTRATOR_JOB,ORA_SVC_HUMAN_RESOURCE_HELP_DESK_AGENT_JOB,ORA_SVC_HUMAN_RESOURCE_HELP_DESK_MANAGER_JOB,ORA_SVC_INTERNAL_HELP_DESK_ADMINISTRATOR_JOB,ORA_SVC_INTERNAL_HELP_DESK_AGENT_JOB,ORA_SVC_INTERNAL_HELP_DESK_MANAGER_JOB,ORA_ZBS_SALES_ADMINISTRATOR_JOB,ORA_ZCA_CUSTOMER_RELATIONSHIP_MANAGEMENT_APPLICATION_ADMINISTRATOR_JOB
/Shared/SubscriptionManagement
BI_OSS_REPORTING_DUTY Subscription ManagementFolder Reporting Duty
ORA_OSS_SUBSCRIPTION_SPECIALIST_JOB
/Shared/Supply ChainManagement
BI_SCM_REPORTING_DUTY Supply Chain ManagementFolder Reporting Duty
ORA_ACD_PRODUCT_DESIGN_ENGINEER_JOB,ORA_ACD_PRODUCT_DESIGN_MANAGER_JOB,ORA_ACE_PRODUCT_MANAGEMENT_VP_JOB,ORA_ACE_PRODUCT_PORTFOLIO_MANAGER_JOB,
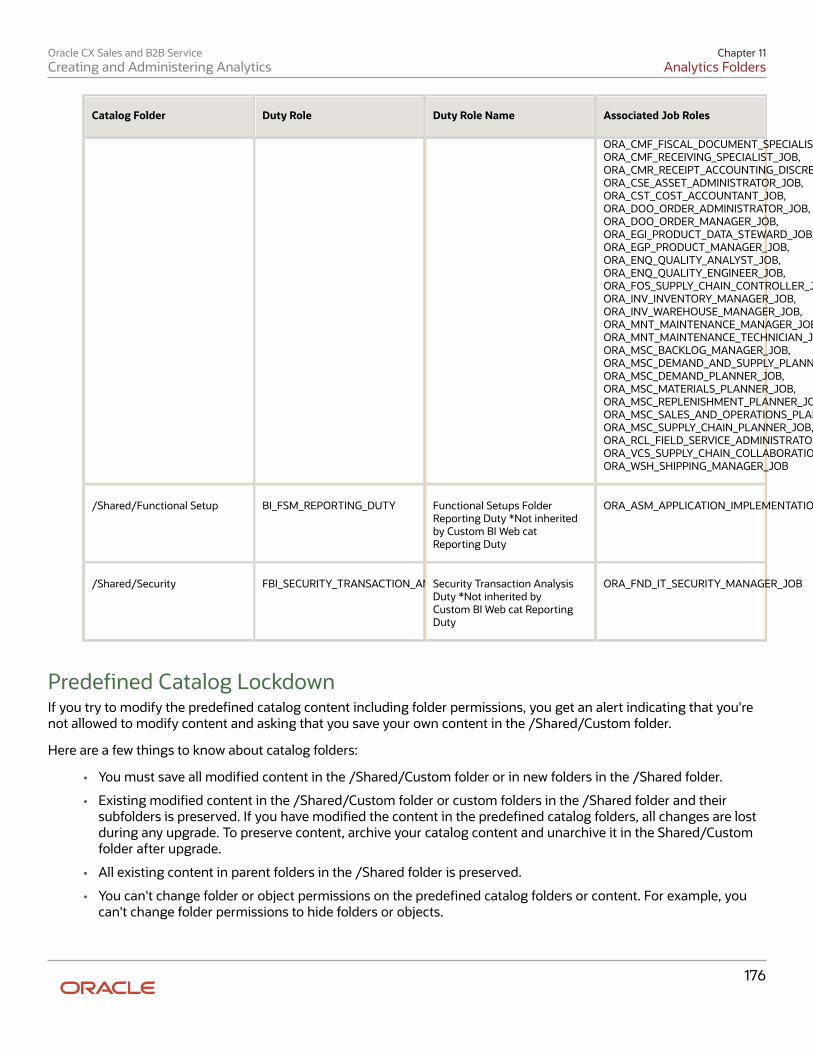
Oracle CX Sales and B2B ServiceCreating and Administering Analytics
Chapter 11Analytics Folders
176
Catalog Folder Duty Role Duty Role Name Associated Job Roles
ORA_CMF_FISCAL_DOCUMENT_SPECIALIST_JOB,ORA_CMF_RECEIVING_SPECIALIST_JOB,ORA_CMR_RECEIPT_ACCOUNTING_DISCRETIONARY,ORA_CSE_ASSET_ADMINISTRATOR_JOB,ORA_CST_COST_ACCOUNTANT_JOB,ORA_DOO_ORDER_ADMINISTRATOR_JOB,ORA_DOO_ORDER_MANAGER_JOB,ORA_EGI_PRODUCT_DATA_STEWARD_JOB,ORA_EGP_PRODUCT_MANAGER_JOB,ORA_ENQ_QUALITY_ANALYST_JOB,ORA_ENQ_QUALITY_ENGINEER_JOB,ORA_FOS_SUPPLY_CHAIN_CONTROLLER_JOB,ORA_INV_INVENTORY_MANAGER_JOB,ORA_INV_WAREHOUSE_MANAGER_JOB,ORA_MNT_MAINTENANCE_MANAGER_JOB,ORA_MNT_MAINTENANCE_TECHNICIAN_JOB,ORA_MSC_BACKLOG_MANAGER_JOB,ORA_MSC_DEMAND_AND_SUPPLY_PLANNER_JOB,ORA_MSC_DEMAND_PLANNER_JOB,ORA_MSC_MATERIALS_PLANNER_JOB,ORA_MSC_REPLENISHMENT_PLANNER_JOB,ORA_MSC_SALES_AND_OPERATIONS_PLANNER_JOB,ORA_MSC_SUPPLY_CHAIN_PLANNER_JOB,ORA_RCL_FIELD_SERVICE_ADMINISTRATOR_JOB,ORA_VCS_SUPPLY_CHAIN_COLLABORATION_PLANNER_JOB,ORA_WSH_SHIPPING_MANAGER_JOB
/Shared/Functional Setup BI_FSM_REPORTING_DUTY Functional Setups FolderReporting Duty *Not inheritedby Custom BI Web catReporting Duty
ORA_ASM_APPLICATION_IMPLEMENTATION_CONSULTANT_JOB
/Shared/Security FBI_SECURITY_TRANSACTION_ANALYSIS_DUTYSecurity Transaction AnalysisDuty *Not inherited byCustom BI Web cat ReportingDuty
ORA_FND_IT_SECURITY_MANAGER_JOB
Predefined Catalog LockdownIf you try to modify the predefined catalog content including folder permissions, you get an alert indicating that you'renot allowed to modify content and asking that you save your own content in the /Shared/Custom folder.
Here are a few things to know about catalog folders:
• You must save all modified content in the /Shared/Custom folder or in new folders in the /Shared folder.
• Existing modified content in the /Shared/Custom folder or custom folders in the /Shared folder and theirsubfolders is preserved. If you have modified the content in the predefined catalog folders, all changes are lostduring any upgrade. To preserve content, archive your catalog content and unarchive it in the Shared/Customfolder after upgrade.
• All existing content in parent folders in the /Shared folder is preserved.
• You can't change folder or object permissions on the predefined catalog folders or content. For example, youcan't change folder permissions to hide folders or objects.
Oracle CX Sales and B2B ServiceCreating and Administering Analytics
Chapter 11Analytics Folders
177
Related Topics
• Role Inheritance
• Submit Scheduled Processes and Process Sets
How to Create OTBI FoldersYou manage OTBI analyses and reports in the business intelligence catalog, where you create folders to organize them.
To create folders:
1. In the catalog, navigate to the desired location of the new folder in the Folders pane.2. In the catalog toolbar, click New, and select Folder.3. In the New Folder dialog box, enter the folder name, and click OK.
Automatically Created Folders
If conflicts are detected during upgrade, folders named backup_nnn are automatically created in the catalog. Afterreviewing and resolving any conflicts, Oracle recommends that you manually delete the backup folders from thecatalog. You can contact your help desk to request an automated removal if you have many folders to delete.
Set Folder Permissions and AttributesYou can access the properties of user objects or the Custom folder and any of its subfolders in the catalog to set folderpermissions and other attributes. You can view system information, and change attributes or ownership. Other userscan access and modify the properties of only the objects that they create or own.
Set Folder PropertiesFollow these steps:
1. In the catalog, click Shared Folders > Custom, and navigate to the custom folder you want to assign propertiesto.
Caution: Don't modify permissions on predefined catalog objects. Saving content in the Customfolder is the only way to make sure that it remains untouched during updates.
2. In the Tasks pane, click Properties.3. In the Properties dialog box, select any of the options in the Attributes section:
◦ Hidden: Hides the object.
◦ System: Makes the object a system object.
◦ Read Only: Makes the object read-only.
Oracle CX Sales and B2B ServiceCreating and Administering Analytics
Chapter 11Analytics Folders
178
◦ Do Not Index: Excludes the object from the index used by the full-text catalog search. Excluded objectsdon't display in the results of any full-text catalog search; the object can still be found using the basiccatalog search.
4. Use the Ownership section to take ownership of a folder or object in the catalog. This area displays only if theproper privileges were assigned to the user, group, or role. Note that the owner of an object or folder can'tautomatically access the object or folder.
◦ Set ownership of this item: Click to become the owner of the folder or object.
◦ Set ownership of this item and all subitems: Click to become the owner of the folder and any sub foldersor sub items contained within the item. For example, if you click this link for a dashboard folder, then youtake ownership of all of the dashboard's components.
Set Folder PermissionsYou can assign permissions on folders and other objects.
Access and Set PermissionsYou can set permissions or change ownership for any catalog object or folder. Nonadministrative users can access andmodify the permissions of the objects that they create or own.
To set folder permissions:
1. In the catalog, select the folder or object.2. In the Tasks pane click Permissions.3. In the Permissions dialog box, the owner and any other users, roles, or groups with permissions are listed in the
Permissions list.
◦ To add a user or role, click Add users/roles in the toolbar and search for users or roles to add them to theSelected Members list in the Add Application Roles, Catalog Groups and Users dialog box.
◦ To delete a user or role, select the account or role in the Permissions list and click Delete selected users/roles.
4. In the Permissions list, to set ownership for a user, select Custom in the Permissions list for the account, thenselect Set Ownership in the Custom Permissions dialog box and click OK. You can also select the Owner optionfor the user or role.
5. Use the Permissions list to set permissions for the object. Object permissions vary by object.6. Use the Apply permissions to sub-folders option to assign permissions to the folder's subfolders.7. Use the Apply permissions to items within a folder to assign them to objects in the folder but not to subfolders.
Archive and Move AnalyticsYou can archive your analytic objects and move them to a new location. You can bundle the whole catalog, specificfolders, or multi-component objects as a .catalog file and upload the file to unarchive its data in another location.
Note: It's important to note that folders that contain seeded content should not be changed. Moving or adding a childfolder to a seeded folder results in analytics not being visible in dashboards or infolets.
Oracle CX Sales and B2B ServiceCreating and Administering Analytics
Chapter 11Analytics Folders
179
Create an Archive
1. Locate the object in the catalog.2. Select More and then select Archive.3. In the Archive dialog box, select one or more of the following options:
◦ Keep Permissions: Maintain the object or folder's existing permissions. If you don't select this, thearchiving process doesn't include any permissions. Once unarchiving, the parent folder's permissions areassigned to all of the objects and folders.
◦ Keep Time stamps: Maintain the Creation Time, Last Modified, and Last Accessed times assigned tothe object or folder. Upon unarchiving, the Last Modified time is updated to indicate the time when theobject or folder is unarchived. If you select this option, the Old option in the Paste Overview area of thePreferences dialog box is available when unarchiving. Use the Old option to overwrite existing catalogitems older than the items in the archive.
If you don't select this option, then the archiving process doesn't include time information and the Oldoption in the Paste Overview area of the Preferences dialog box isn't available.
4. Click OK to download the archive file.
Move an Archived Object to a New Location
1. Select the folder in the catalog where you want to upload the archived file.2. In the Tasks pane click Unarchive.3. In the Unarchive dialog box, browse for and select the archive file.4. Use the Replace option to specify whether to replace an existing folder or object with the same name.
◦ All: Replace any existing folders or objects with the same names as folders or objects included in thearchive file that you're uploading.
◦ Old: Replace folders or objects except those folders or objects that exist, unless they're older than thesource.
◦ None: Add any new folders or objects, but preserve any existing folders or objects.
◦ Force: Add and replace all folders or objects.
5. Use the Access Control Lists option to specify how the folders or objects are assigned permissions using AccessControl Lists Access when unarchived.
◦ Inherit: Inherits the folder or object's permissions from its new parent folder.
◦ Preserve: Preserves the folder or object's permissions as it was in the original, mapping accounts asnecessary.
◦ Create: Preserves the folder or object's permissions as it was in the original, creating and mappingaccounts as necessary.
6. Click OK.
Oracle CX Sales and B2B ServiceCreating and Administering Analytics
Chapter 11Analytics Folders
180
What happens to modified analytics and reports when arelease update is applied?Updates don't affect the Custom folder or My Folder in the catalog. Anything saved there is preserved, including theanalytics and reports you edited or created. But anything saved outside those folders, in the predefined catalog, ispreserved only if the update doesn't include a new version of those BI objects.
If an update includes a new version of a predefined object that you edited outside the Custom folder, the changes youmade are saved as a new object. The new version from the update overwrites the existing predefined object. And a copyof the existing object (with your edits) is automatically created in the same folder, with a new name that indicates it's anew version.
If the update includes a new version of both the predefined object and a folder in its file path, the new folder name,along with the new version of the object, overwrites the existing predefined folder and object. And a copy of the existingfolder (along with your edited object) is automatically created. The folder is renamed to indicate that it's a new version,but your edited object isn't renamed.
Note: Future updates won't affect renamed objects or anything within a renamed folder.
Oracle CX Sales and B2B ServiceCreating and Administering Analytics
Glossary
181
Glossary
action
The kind of access, such as view or edit, named in a security policy.
analysis
A selection of data displayed in one or more views, such as a table or chart, to provide answers to business questions.
analytics
Business intelligence objects such as analyses and dashboards that provide meaningful data to help with decisionmaking.
briefing book
A collection of static or updatable analyses or dashboard pages that you can download, print, and share with others.
business intelligence catalog
The repository where all business intelligence objects, including analyses, reports, briefing books, and agents, arestored. The catalog contains separate folders for personal, shared, and modified objects.
business intelligence repository
The metadata that determines all of the columns, or pieces of data, that you can include in analytics. You can also usethe repository as a source of data for reports.
business object
A resource in an enterprise database, such as an invoice or purchase order.
dashboard
A collection of analyses and other content that gives in-depth insight to help with business decisions.
detailed report
A comprehensive report that provides detailed information about the subject matter. When you link a detailed report toan infolet, users can click anywhere in the infolet area to drill down to that detailed report.
global header
The uppermost region in the user interface that remains the same no matter which page you're on.
infolet
A small interactive widget on the home page that provides key information and actions for a specific area, for exampleyour personal profile. Each infolet can have multiple views.
Oracle CX Sales and B2B ServiceCreating and Administering Analytics
Glossary
182
job definition
The metadata that determines what a job does and what options are available to users when they submit the scheduledprocess. A job is the executable for a scheduled process.
mainline metadata
The primary branch of metadata that a sandbox is published to. Once published, changes made in the sandbox becomeavailable to all users.
panel tab
A tab that provides supplemental information or functionality for the page. Each panel tab is on the right side of thepage, has an icon as the tab label, and slides out when you open the tab.
performance tile
A single, summary measure value displayed prominently with, in some cases, a trend line.
performance tile report
A summary report that shows data in the small infolet format. When you add a performance tile report to an infolet,users can see summary information about the subject matter.
privilege
A grant of access to functions and data; a single, real world action on a single business object.
process set
A scheduled process that contains multiple individual processes or other process sets.
prompt
A parameter that you set when you use analytics, limiting the data in the analysis or in all analyses on the dashboard ordashboard page (tab).
report
An output of select data in a predefined format that's optimized for printing.
role
Controls access to application functions and data.
sandbox
A testing environment that isolates untested code changes from the mainline environment so that these changes don'taffect the mainline metadata or other sandboxes.
Oracle CX Sales and B2B ServiceCreating and Administering Analytics
Glossary
183
scheduled process
A program that you run to process data and, in some cases, generate output as a report.
subject area
A set of columns, or pieces of data, related to a specific business object or area.
task flow infolet
An infolet that displays summary information about a task.
view
A specific way to present the results of an analysis, for example as a table or graph. Other types of views, such as thetitle view, show other components of the analysis.
work area
A set of pages containing the tasks, searches, and other content you need to accomplish a business goal.

Oracle CX Sales and B2B ServiceCreating and Administering Analytics
Glossary
184