Nonlinear optics, chirality, magneto-optics: a serendipitous road
Upload
independentCategory
view
1download
0
Optics Optimization in High-Resolution Imaging Module with
Extended Depth of Field
Xi Chen*a, Dmitry Bakin
a, Changmeng Liu
a, Nicholas George
b
aAptina Imaging, 3080 North 1
st Street, San Jose, CA, USA 95134-5134
bThe Institute of Optics, University of Rochester, Rochester, New York, USA 14627
ABSTRACT
The standard imaging lens for a high resolution sensor was modified to achieve the extended depth of field (EDoF) from
300 mm to infinity. In the module the raw sensor outputs are digitally processed to obtain high contrast images. The
overall module is considered as an integrated computational imaging system (ICIS). The simulation results for
illustrative designs with different amount of spherical aberrations are provided and compared. Based on the results of
simulations we introduced the limiting value of the PSF Strehl ratio as the integral threshold criteria to be used during
EDoF lens optimization. A four-element standard lens was modified within the design constraints to achieve the EDoF
performance. Two EDoF designs created with different design methods are presented. The imaging modules were
compared in terms of Strehl ratios, limiting resolution, modulation frequencies at 50% contrast, and SNR. The output
images were simulated for EDoF modules, passed through the image processing pipeline, and compared against the
images obtained with the standard lens module.
Keywords: extended depth of field, lens optimization, image processing, integrated computational imaging system
1. INTRODUCTION
Today the overall quality of an image from a digital camera or a mobile phone camera is determined by the combined
performance of optics, imaging sensor and digital image processing. The intensive development of the CMOS imaging
technology, allowed creating high-resolution imaging module having pixel size as small as 1.75µm and less. When the
pixel size of a sensor is getting smaller, the lens has to have larger relative aperture to maintain and improve the SNR of
the system. One of the important characteristics of the camera, which affects the image quality, is its Depth-of-field
(DOF). In mobile phone cameras the DOF can be limited due to use of fast lens and small pixels. There have been a
number of publications addressing work on extending DOF in camera systems. Prior research includes such diverse
approaches as apodization by a weighted zone plate1, depth estimation2-5, light field photograhpy6, phase masks with
digital processing7-11. The weighted zone plate method allowed achieving a high Strehl ratio over large defocus region.
In this method the resolution could be further improved after applying digital image processing. Various depth
estimation methods are based on estimating high-order statistics (HOS) in an image, on edge detection and blur
measurement, on using multiple cameras to acquire images of a scene or on processing multiple defocused images. The
depth estimation method based on single image provides limited depth resolution. Also the accuracy of depth map could
be affected by scene contents. Use of multiple cameras or multiple defocused images would require more resources. In
the method based of light field photography the depth extension is achieved by inserting a microlens array between main
lens and sensor. Each microlens in the array produces an image of the exit pupil of the lens camera onto a unique area of
the sensor. The camera then extracts information about both horizontal and vertical parallax, which improves the
reliability of the depth estimates. The drawback of this camera is low overall resolution.
There have been several approaches to achieving extended depth of field using phase masks in combination with digital
processing. In such integrated computational imaging system, the optical transfer function (OTF) or point spread
function (PSF) is purposely blurred to become more invariant with object distance. The blurred images are then digitally
recovered using the invariant PSF. There is no light loss due to decreased aperture. Among these approaches, the
logarithmic asphere8, 10, 11 has circularly symmetry. The design of the logarithmic asphere is based on the Fermat’s
Principle which provides more invariant PSF. The logarithmic asphere profile could be expressed in terms of spherical
aberration which is easy to test.
*[email protected]; phone 1 408 660 2662; www.aptina.com
Novel Optical Systems Design and Optimization XI, edited by R. John Koshel, G. Groot Gregory,James D. Moore Jr., David H. Krevor, Proc. of SPIE Vol. 7061, 706103 · © 2008 SPIE
CCC code: 0277-786X/08/$18 · doi: 10.1117/12.795970
Proc. of SPIE Vol. 7061 706103-12008 SPIE Digital Library -- Subscriber Archive Copy
In this paper, we study how different optical design optimization methods affect EDoF performance of CMOS camera
when accounting for demosaicing and focus recovery (FR) post-processing. The overall image quality is characterized
against critical parameters of the optical system, such as spherical aberration, shape of PSF, and Strehl ratio. Two optical
design optimization methods for extending depth of field of ICIS are presented. The performance is compared against
that of a standard imaging module. A series of lenses were designed to introduce different amount of spherical
aberrations. Their performances are compared in terms of Strehl ratio, resolution before and after FR algorithm, MTF50
before and after FR, SNR before and after FR. Thresholds on Strehl ratios for imaging modules with 1.75µm pixel are
defined based on results of camera scene modeling (CSM) simulations. Further, we explore how modification of a
standard imaging lens for a specific 1.75µm 3 mega-pixel sensor extends the depth-of-field. Two EDoF designs are
presented and compared with the standard imaging module. The first EDoF lens is designed with logarithmic asphere
EDoF technology. The basic idea of logarithmic asphere is reviewed. The second EDoF lens is developed based on
optimization for achieving uniform PSFs over full field and range of object distances.
2. BASIC REQUIREMENTS TO PSF SHAPE AND STREHL RATIO
We used invariant PSF method to design lenses with EDoF properties over predefined range of object distances. The on-
axis PSF invariance was achieved by applying logarithmic asphere algorithm8, 10, 11. A series of lenses were generated
with the amount of spherical aberrations ranging from 0 to 6.824λ. The corresponding Strehl ratio was in the range from
1 to 0.1. All lenses have had the same first-order optics parameters values, such as F-number of 2.4, effective focal
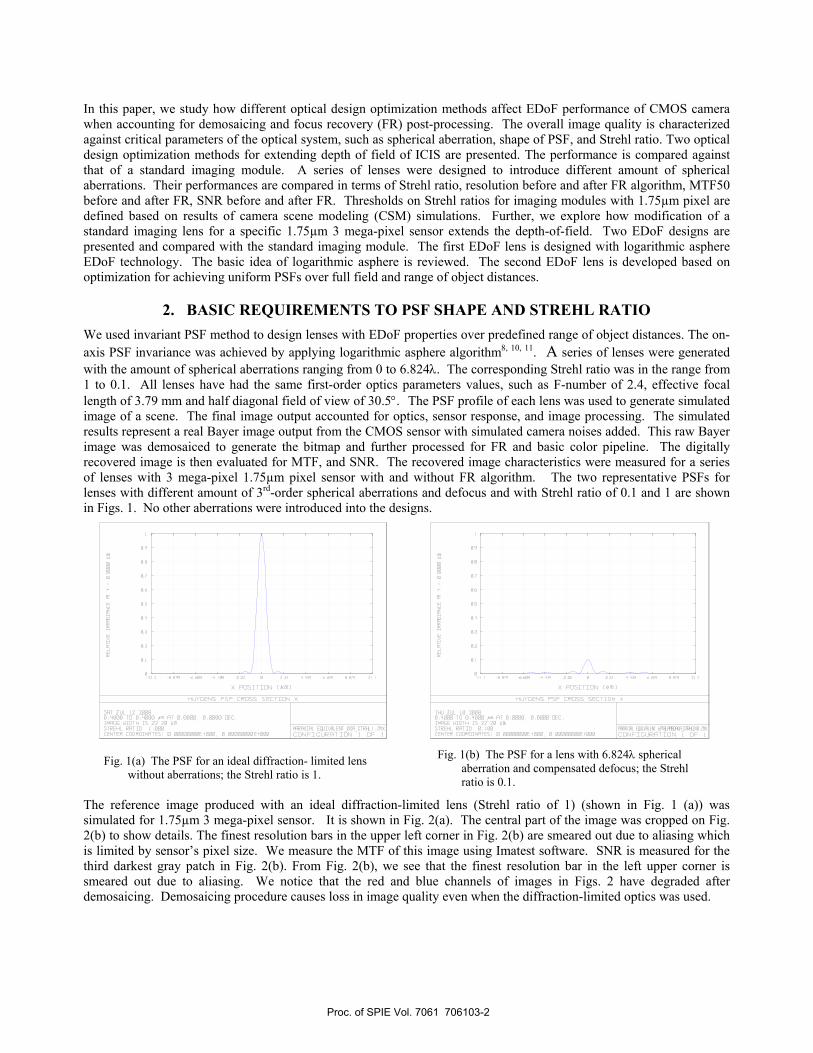
length of 3.79 mm and half diagonal field of view of 30.5°. The PSF profile of each lens was used to generate simulated
image of a scene. The final image output accounted for optics, sensor response, and image processing. The simulated
results represent a real Bayer image output from the CMOS sensor with simulated camera noises added. This raw Bayer
image was demosaiced to generate the bitmap and further processed for FR and basic color pipeline. The digitally
recovered image is then evaluated for MTF, and SNR. The recovered image characteristics were measured for a series
of lenses with 3 mega-pixel 1.75µm pixel sensor with and without FR algorithm. The two representative PSFs for
lenses with different amount of 3rd-order spherical aberrations and defocus and with Strehl ratio of 0.1 and 1 are shown
in Figs. 1. No other aberrations were introduced into the designs.
Fig. 1(a) The PSF for an ideal diffraction- limited lens
without aberrations; the Strehl ratio is 1.
Fig. 1(b) The PSF for a lens with 6.824λ spherical
aberration and compensated defocus; the Strehl
ratio is 0.1.
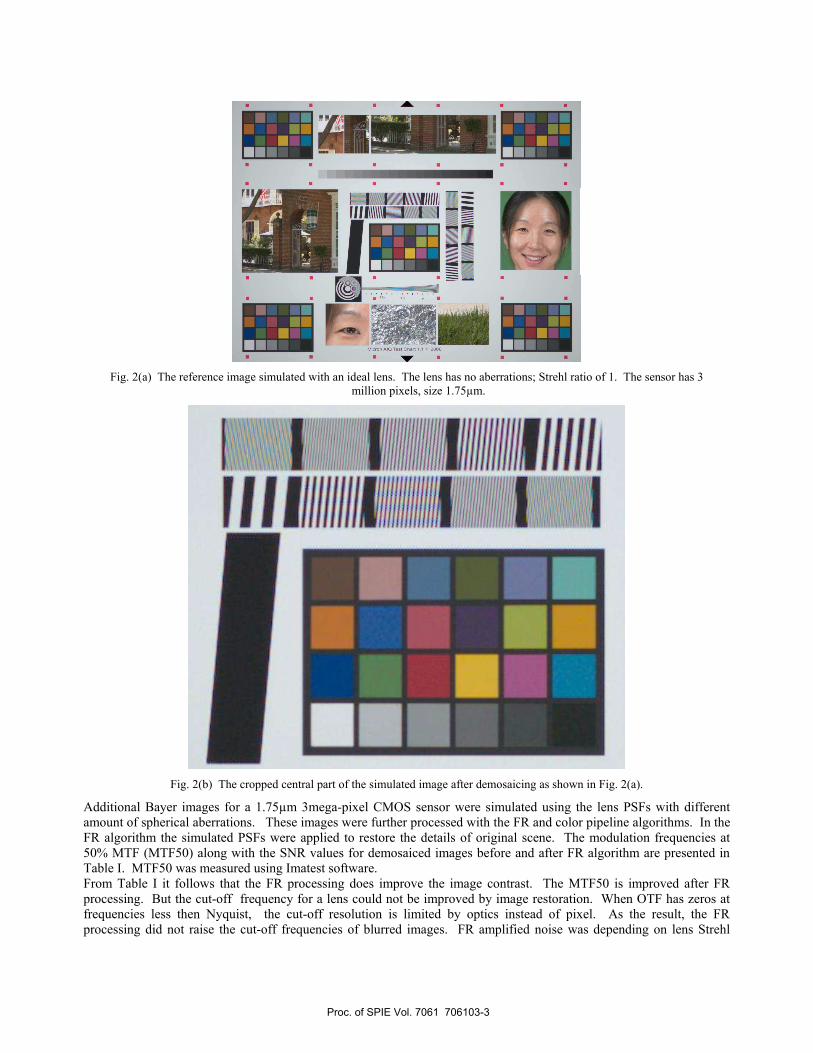
The reference image produced with an ideal diffraction-limited lens (Strehl ratio of 1) (shown in Fig. 1 (a)) was
simulated for 1.75µm 3 mega-pixel sensor. It is shown in Fig. 2(a). The central part of the image was cropped on Fig.
2(b) to show details. The finest resolution bars in the upper left corner in Fig. 2(b) are smeared out due to aliasing which
is limited by sensor’s pixel size. We measure the MTF of this image using Imatest software. SNR is measured for the
third darkest gray patch in Fig. 2(b). From Fig. 2(b), we see that the finest resolution bar in the left upper corner is
smeared out due to aliasing. We notice that the red and blue channels of images in Figs. 2 have degraded after
demosaicing. Demosaicing procedure causes loss in image quality even when the diffraction-limited optics was used.
Proc. of SPIE Vol. 7061 706103-2
U U U
U...• U.U..
Fig. 2(a) The reference image simulated with an ideal lens. The lens has no aberrations; Strehl ratio of 1. The sensor has 3
million pixels, size 1.75µm.
Fig. 2(b) The cropped central part of the simulated image after demosaicing as shown in Fig. 2(a).
Additional Bayer images for a 1.75µm 3mega-pixel CMOS sensor were simulated using the lens PSFs with different
amount of spherical aberrations. These images were further processed with the FR and color pipeline algorithms. In the
FR algorithm the simulated PSFs were applied to restore the details of original scene. The modulation frequencies at
50% MTF (MTF50) along with the SNR values for demosaiced images before and after FR algorithm are presented in
Table I. MTF50 was measured using Imatest software.
From Table I it follows that the FR processing does improve the image contrast. The MTF50 is improved after FR
processing. But the cut-off frequency for a lens could not be improved by image restoration. When OTF has zeros at
frequencies less then Nyquist, the cut-off resolution is limited by optics instead of pixel. As the result, the FR
processing did not raise the cut-off frequencies of blurred images. FR amplified noise was depending on lens Strehl
Proc. of SPIE Vol. 7061 706103-3
ratio. The perfect lens with Strehl ratio of 1 has the best image quality. After considering cut-off resolution, image
contrast, and SNR of the processed image, we choose the Strehl ratio of 0.3 as the limiting threshold for EDoF design
with 1.75 µm CMOS sensor.
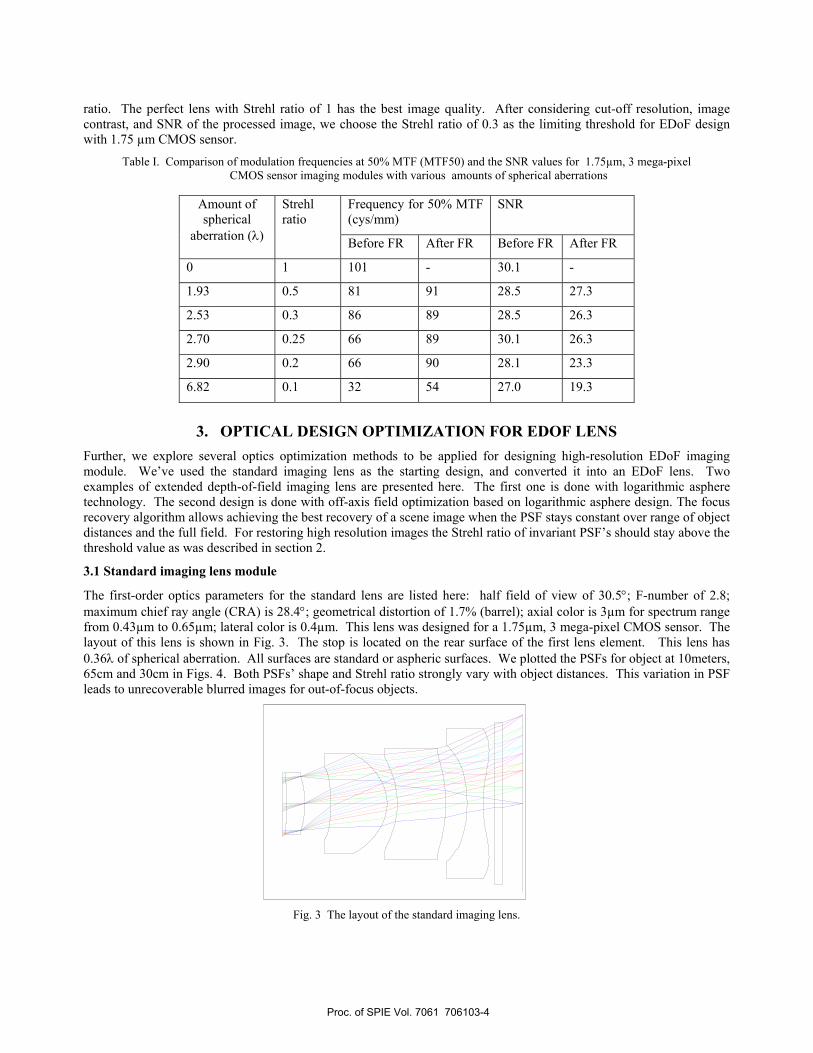
Table I. Comparison of modulation frequencies at 50% MTF (MTF50) and the SNR values for 1.75µm, 3 mega-pixel
CMOS sensor imaging modules with various amounts of spherical aberrations
3. OPTICAL DESIGN OPTIMIZATION FOR EDOF LENS
Further, we explore several optics optimization methods to be applied for designing high-resolution EDoF imaging
module. We’ve used the standard imaging lens as the starting design, and converted it into an EDoF lens. Two
examples of extended depth-of-field imaging lens are presented here. The first one is done with logarithmic asphere
technology. The second design is done with off-axis field optimization based on logarithmic asphere design. The focus
recovery algorithm allows achieving the best recovery of a scene image when the PSF stays constant over range of object
distances and the full field. For restoring high resolution images the Strehl ratio of invariant PSF’s should stay above the
threshold value as was described in section 2.
3.1 Standard imaging lens module
The first-order optics parameters for the standard lens are listed here: half field of view of 30.5°; F-number of 2.8;
maximum chief ray angle (CRA) is 28.4°; geometrical distortion of 1.7% (barrel); axial color is 3µm for spectrum range
from 0.43µm to 0.65µm; lateral color is 0.4µm. This lens was designed for a 1.75µm, 3 mega-pixel CMOS sensor. The
layout of this lens is shown in Fig. 3. The stop is located on the rear surface of the first lens element. This lens has
0.36λ of spherical aberration. All surfaces are standard or aspheric surfaces. We plotted the PSFs for object at 10meters,
65cm and 30cm in Figs. 4. Both PSFs’ shape and Strehl ratio strongly vary with object distances. This variation in PSF
leads to unrecoverable blurred images for out-of-focus objects.
Frequency for 50% MTF
(cys/mm)
SNR Amount of
spherical
aberration (λ)
Strehl
ratio
Before FR After FR Before FR After FR
0 1 101 - 30.1 -
1.93 0.5 81 91 28.5 27.3
2.53 0.3 86 89 28.5 26.3
2.70 0.25 66 89 30.1 26.3
2.90 0.2 66 90 28.1 23.3
6.82 0.1 32 54 27.0 19.3
Fig. 3 The layout of the standard imaging lens.
Proc. of SPIE Vol. 7061 706103-4
R11
MN' N'
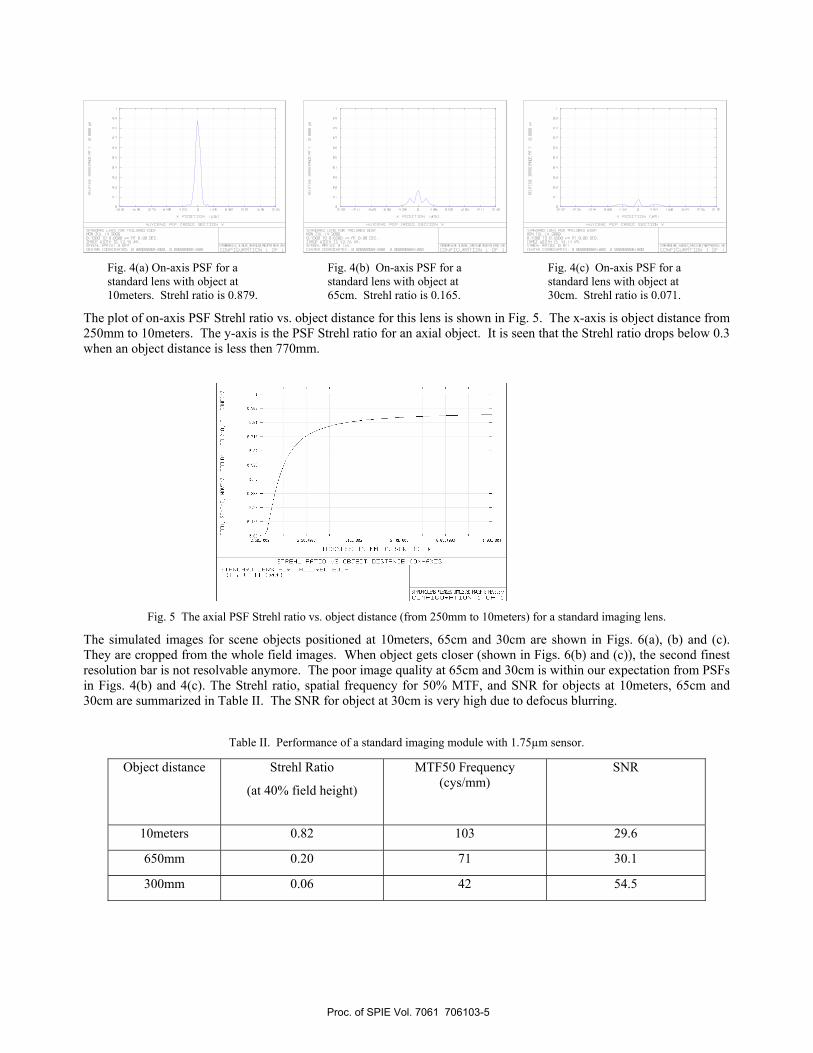
Fig. 4(a) On-axis PSF for a
standard lens with object at
10meters. Strehl ratio is 0.879.
Fig. 4(b) On-axis PSF for a
standard lens with object at
65cm. Strehl ratio is 0.165.
Fig. 4(c) On-axis PSF for a
standard lens with object at
30cm. Strehl ratio is 0.071.
The plot of on-axis PSF Strehl ratio vs. object distance for this lens is shown in Fig. 5. The x-axis is object distance from
250mm to 10meters. The y-axis is the PSF Strehl ratio for an axial object. It is seen that the Strehl ratio drops below 0.3
when an object distance is less then 770mm.
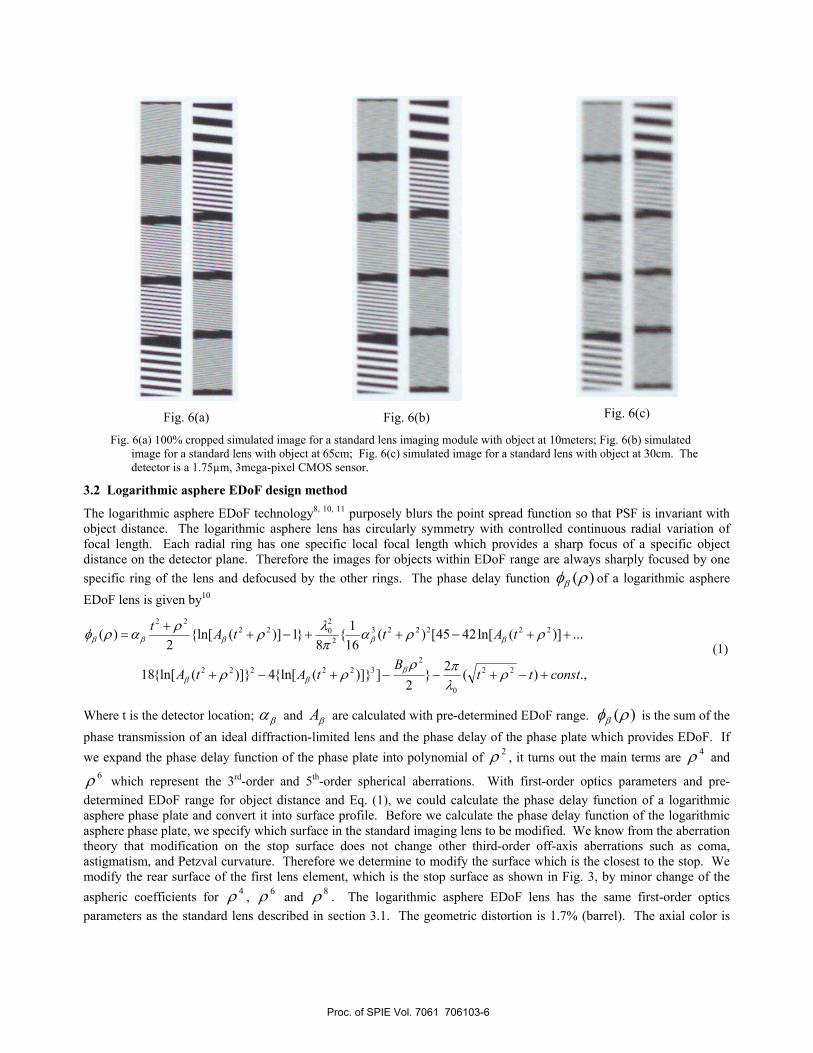
The simulated images for scene objects positioned at 10meters, 65cm and 30cm are shown in Figs. 6(a), (b) and (c).
They are cropped from the whole field images. When object gets closer (shown in Figs. 6(b) and (c)), the second finest
resolution bar is not resolvable anymore. The poor image quality at 65cm and 30cm is within our expectation from PSFs
in Figs. 4(b) and 4(c). The Strehl ratio, spatial frequency for 50% MTF, and SNR for objects at 10meters, 65cm and
30cm are summarized in Table II. The SNR for object at 30cm is very high due to defocus blurring.
Fig. 5 The axial PSF Strehl ratio vs. object distance (from 250mm to 10meters) for a standard imaging lens.
Table II. Performance of a standard imaging module with 1.75µm sensor.
Object distance Strehl Ratio
(at 40% field height)
MTF50 Frequency
(cys/mm)
SNR
10meters 0.82 103 29.6
650mm 0.20 71 30.1
300mm 0.06 42 54.5
Proc. of SPIE Vol. 7061 706103-5
I!IIIb
/llh/
I/llh
JIlll
lhII/
///lli
t I"
I
I?il!
JJ///
////J
Ifl;IJ
//////
//////
//,J/
//////
/J I I I
!!I!Ih
/llh/
Illllh
1 I
I I
I I
Iih//i
I/JII/
IIIIII
I I I
--ap
3.2 Logarithmic asphere EDoF design method
The logarithmic asphere EDoF technology8, 10, 11 purposely blurs the point spread function so that PSF is invariant with
object distance. The logarithmic asphere lens has circularly symmetry with controlled continuous radial variation of
focal length. Each radial ring has one specific local focal length which provides a sharp focus of a specific object
distance on the detector plane. Therefore the images for objects within EDoF range are always sharply focused by one
specific ring of the lens and defocused by the other rings. The phase delay function )(ρφβ of a logarithmic asphere
EDoF lens is given by10
.,)(2
}2
])]}({ln[4)]}({ln[18
...)](ln[4245[)(16
1{
8}1)]({ln[
2)(
22
0
2
322222
222223
2
2
02222
constttB
tAtA
tAttAt
+−+−−+−+++−++−++=
ρλπρρρ
ρραπλρραρφ
βββ
βββββ (1)
Where t is the detector location; βα and βA are calculated with pre-determined EDoF range. )(ρφβ is the sum of the
phase transmission of an ideal diffraction-limited lens and the phase delay of the phase plate which provides EDoF. If
we expand the phase delay function of the phase plate into polynomial of 2ρ , it turns out the main terms are
4ρ and
6ρ which represent the 3rd-order and 5th-order spherical aberrations. With first-order optics parameters and pre-
determined EDoF range for object distance and Eq. (1), we could calculate the phase delay function of a logarithmic
asphere phase plate and convert it into surface profile. Before we calculate the phase delay function of the logarithmic
asphere phase plate, we specify which surface in the standard imaging lens to be modified. We know from the aberration
theory that modification on the stop surface does not change other third-order off-axis aberrations such as coma,
astigmatism, and Petzval curvature. Therefore we determine to modify the surface which is the closest to the stop. We
modify the rear surface of the first lens element, which is the stop surface as shown in Fig. 3, by minor change of the
aspheric coefficients for 4ρ ,
6ρ and 8ρ . The logarithmic asphere EDoF lens has the same first-order optics
parameters as the standard lens described in section 3.1. The geometric distortion is 1.7% (barrel). The axial color is
Fig. 6(a)
Fig. 6(b)
Fig. 6(c)
Fig. 6(a) 100% cropped simulated image for a standard lens imaging module with object at 10meters; Fig. 6(b) simulated
image for a standard lens with object at 65cm; Fig. 6(c) simulated image for a standard lens with object at 30cm. The
detector is a 1.75µm, 3mega-pixel CMOS sensor.
Proc. of SPIE Vol. 7061 706103-6
'IIllh
hI///
//Illh
J II
I I
I I I
'IJIII
h/Iih
/ih/J
II/III
!//III
/IIIt I
I 1I
tII
IIIIII
IIIII/
IIIIII
II/I Il
l
IIII
!hi/i
//////
/II
I
I,:hl
I
1i//I
IIII
II/I
II/ti
hII/
////I
I/itI
II/I
/III
I I I
3µm for spectrum from 0.43µm to 0.65µm. The lateral color is 0.35µm. This minor modification introduces -2.31λ of
spherical aberrations to the standard imaging lens. Therefore the logarithmic asphere EDoF lens has -1.95λ of spherical
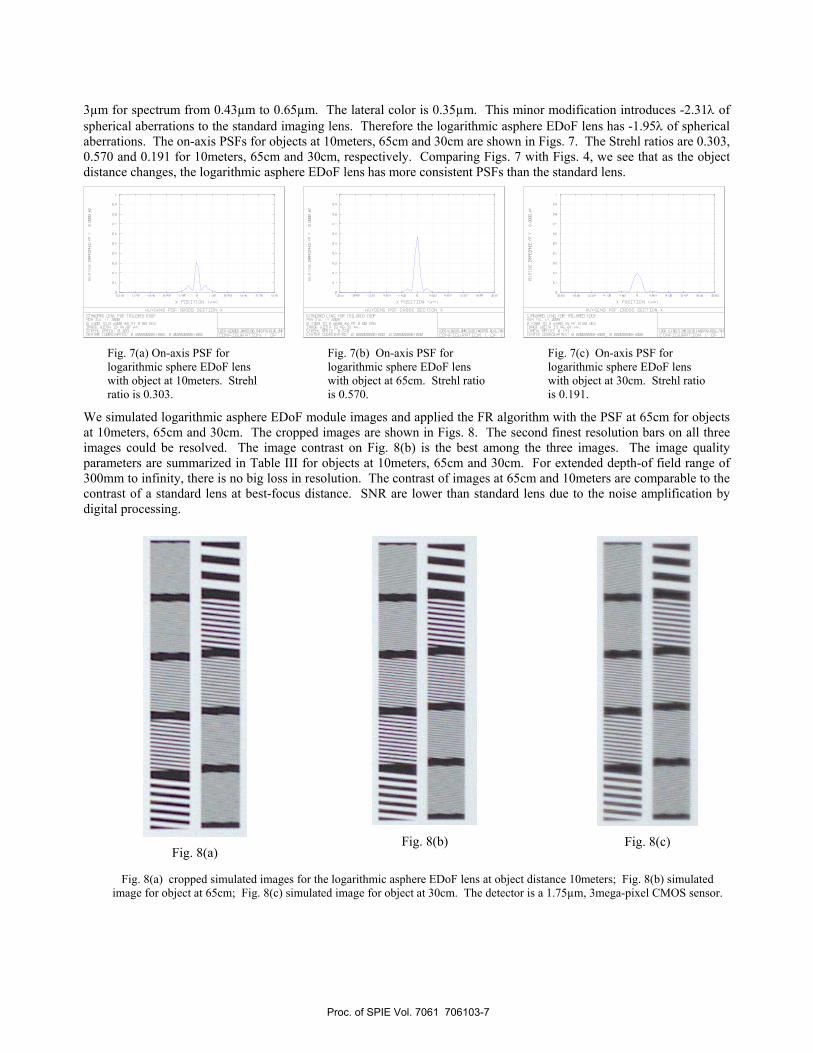
aberrations. The on-axis PSFs for objects at 10meters, 65cm and 30cm are shown in Figs. 7. The Strehl ratios are 0.303,
0.570 and 0.191 for 10meters, 65cm and 30cm, respectively. Comparing Figs. 7 with Figs. 4, we see that as the object
distance changes, the logarithmic asphere EDoF lens has more consistent PSFs than the standard lens.
Fig. 7(a) On-axis PSF for
logarithmic sphere EDoF lens
with object at 10meters. Strehl
ratio is 0.303.
Fig. 7(b) On-axis PSF for
logarithmic sphere EDoF lens
with object at 65cm. Strehl ratio
is 0.570.
Fig. 7(c) On-axis PSF for
logarithmic sphere EDoF lens
with object at 30cm. Strehl ratio
is 0.191.
We simulated logarithmic asphere EDoF module images and applied the FR algorithm with the PSF at 65cm for objects
at 10meters, 65cm and 30cm. The cropped images are shown in Figs. 8. The second finest resolution bars on all three
images could be resolved. The image contrast on Fig. 8(b) is the best among the three images. The image quality
parameters are summarized in Table III for objects at 10meters, 65cm and 30cm. For extended depth-of field range of
300mm to infinity, there is no big loss in resolution. The contrast of images at 65cm and 10meters are comparable to the
contrast of a standard lens at best-focus distance. SNR are lower than standard lens due to the noise amplification by
digital processing.
Fig. 8(a)
Fig. 8(b)
Fig. 8(c)
Fig. 8(a) cropped simulated images for the logarithmic asphere EDoF lens at object distance 10meters; Fig. 8(b) simulated
image for object at 65cm; Fig. 8(c) simulated image for object at 30cm. The detector is a 1.75µm, 3mega-pixel CMOS sensor.
Proc. of SPIE Vol. 7061 706103-7
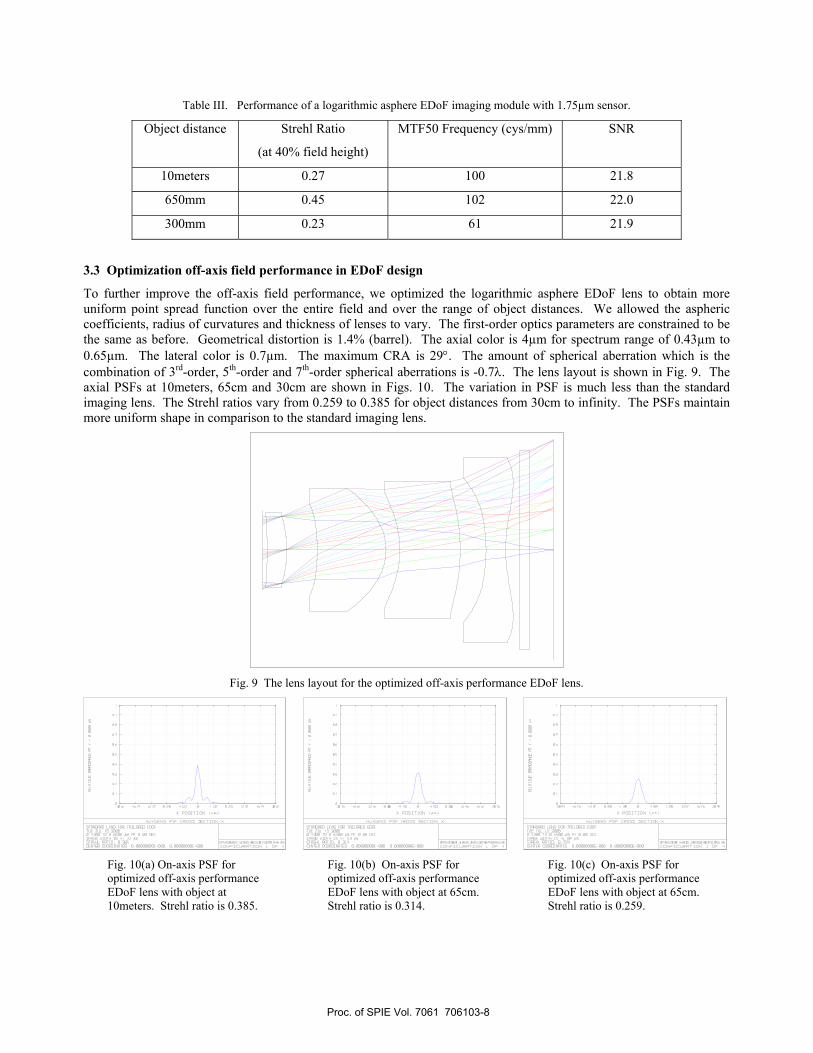
3.3 Optimization off-axis field performance in EDoF design
To further improve the off-axis field performance, we optimized the logarithmic asphere EDoF lens to obtain more
uniform point spread function over the entire field and over the range of object distances. We allowed the aspheric
coefficients, radius of curvatures and thickness of lenses to vary. The first-order optics parameters are constrained to be
the same as before. Geometrical distortion is 1.4% (barrel). The axial color is 4µm for spectrum range of 0.43µm to
0.65µm. The lateral color is 0.7µm. The maximum CRA is 29°. The amount of spherical aberration which is the
combination of 3rd-order, 5th-order and 7th-order spherical aberrations is -0.7λ. The lens layout is shown in Fig. 9. The
axial PSFs at 10meters, 65cm and 30cm are shown in Figs. 10. The variation in PSF is much less than the standard
imaging lens. The Strehl ratios vary from 0.259 to 0.385 for object distances from 30cm to infinity. The PSFs maintain
more uniform shape in comparison to the standard imaging lens.
Fig. 9 The lens layout for the optimized off-axis performance EDoF lens.
Fig. 10(a) On-axis PSF for
optimized off-axis performance
EDoF lens with object at
10meters. Strehl ratio is 0.385.
Fig. 10(b) On-axis PSF for
optimized off-axis performance
EDoF lens with object at 65cm.
Strehl ratio is 0.314.
Fig. 10(c) On-axis PSF for
optimized off-axis performance
EDoF lens with object at 65cm.
Strehl ratio is 0.259.
Table III. Performance of a logarithmic asphere EDoF imaging module with 1.75µm sensor.
Object distance Strehl Ratio
(at 40% field height)
MTF50 Frequency (cys/mm) SNR
10meters 0.27 100 21.8
650mm 0.45 102 22.0
300mm 0.23 61 21.9
Proc. of SPIE Vol. 7061 706103-8
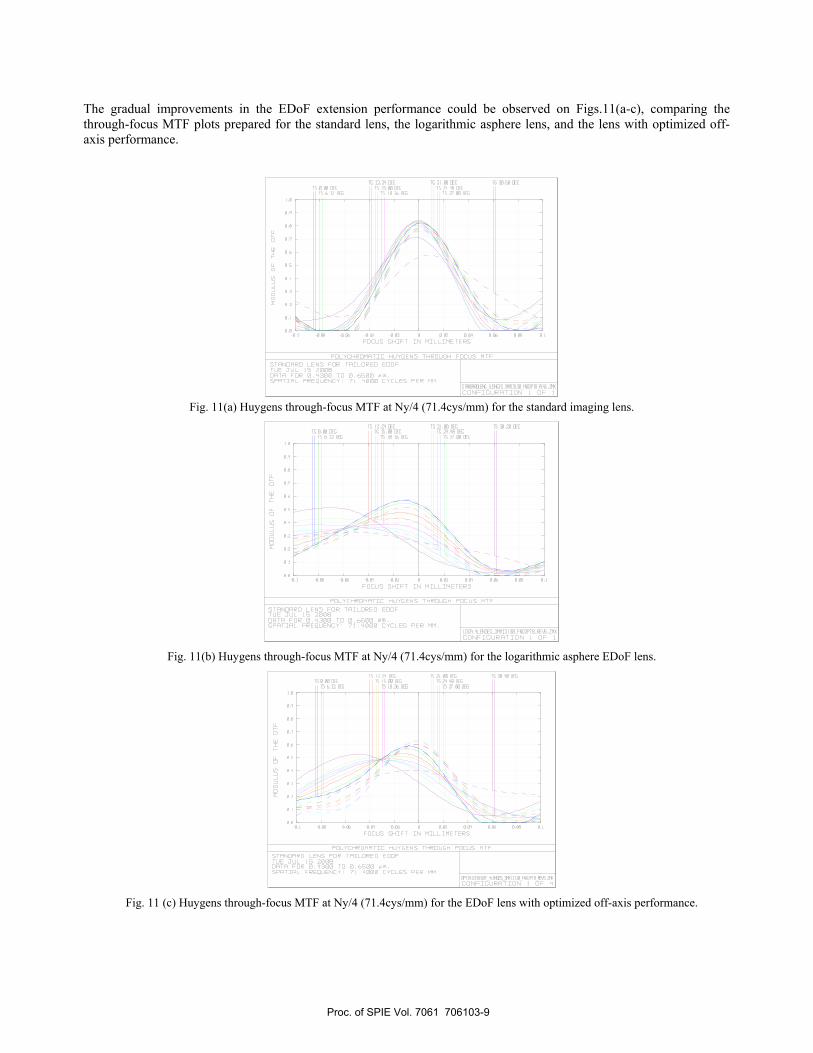
The gradual improvements in the EDoF extension performance could be observed on Figs.11(a-c), comparing the
through-focus MTF plots prepared for the standard lens, the logarithmic asphere lens, and the lens with optimized off-
axis performance.
Fig. 11(a) Huygens through-focus MTF at Ny/4 (71.4cys/mm) for the standard imaging lens.
Fig. 11(b) Huygens through-focus MTF at Ny/4 (71.4cys/mm) for the logarithmic asphere EDoF lens.
Fig. 11 (c) Huygens through-focus MTF at Ny/4 (71.4cys/mm) for the EDoF lens with optimized off-axis performance.
Proc. of SPIE Vol. 7061 706103-9
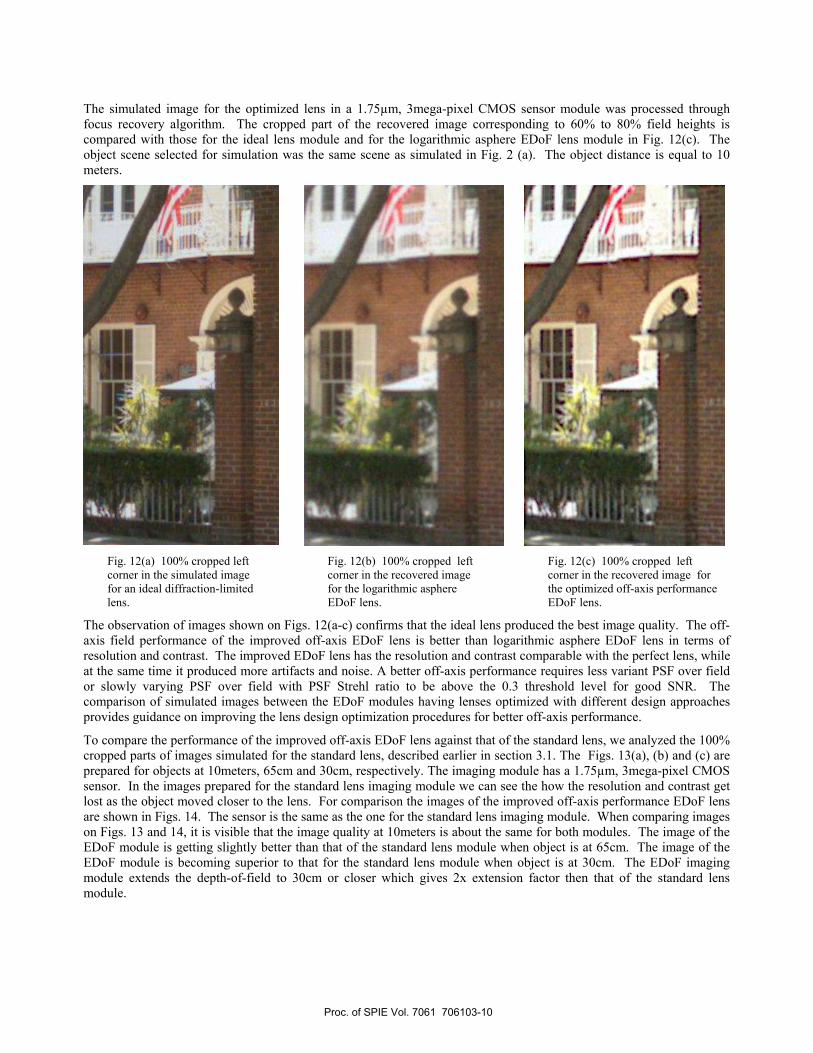
The simulated image for the optimized lens in a 1.75µm, 3mega-pixel CMOS sensor module was processed through
focus recovery algorithm. The cropped part of the recovered image corresponding to 60% to 80% field heights is
compared with those for the ideal lens module and for the logarithmic asphere EDoF lens module in Fig. 12(c). The
object scene selected for simulation was the same scene as simulated in Fig. 2 (a). The object distance is equal to 10
meters.
Fig. 12(a) 100% cropped left
corner in the simulated image
for an ideal diffraction-limited
lens.
Fig. 12(b) 100% cropped left
corner in the recovered image
for the logarithmic asphere
EDoF lens.
Fig. 12(c) 100% cropped left
corner in the recovered image for
the optimized off-axis performance
EDoF lens.
The observation of images shown on Figs. 12(a-c) confirms that the ideal lens produced the best image quality. The off-
axis field performance of the improved off-axis EDoF lens is better than logarithmic asphere EDoF lens in terms of
resolution and contrast. The improved EDoF lens has the resolution and contrast comparable with the perfect lens, while
at the same time it produced more artifacts and noise. A better off-axis performance requires less variant PSF over field
or slowly varying PSF over field with PSF Strehl ratio to be above the 0.3 threshold level for good SNR. The
comparison of simulated images between the EDoF modules having lenses optimized with different design approaches
provides guidance on improving the lens design optimization procedures for better off-axis performance.
To compare the performance of the improved off-axis EDoF lens against that of the standard lens, we analyzed the 100%
cropped parts of images simulated for the standard lens, described earlier in section 3.1. The Figs. 13(a), (b) and (c) are
prepared for objects at 10meters, 65cm and 30cm, respectively. The imaging module has a 1.75µm, 3mega-pixel CMOS
sensor. In the images prepared for the standard lens imaging module we can see the how the resolution and contrast get
lost as the object moved closer to the lens. For comparison the images of the improved off-axis performance EDoF lens
are shown in Figs. 14. The sensor is the same as the one for the standard lens imaging module. When comparing images
on Figs. 13 and 14, it is visible that the image quality at 10meters is about the same for both modules. The image of the
EDoF module is getting slightly better than that of the standard lens module when object is at 65cm. The image of the
EDoF module is becoming superior to that for the standard lens module when object is at 30cm. The EDoF imaging
module extends the depth-of-field to 30cm or closer which gives 2x extension factor then that of the standard lens
module.
Proc. of SPIE Vol. 7061 706103-10
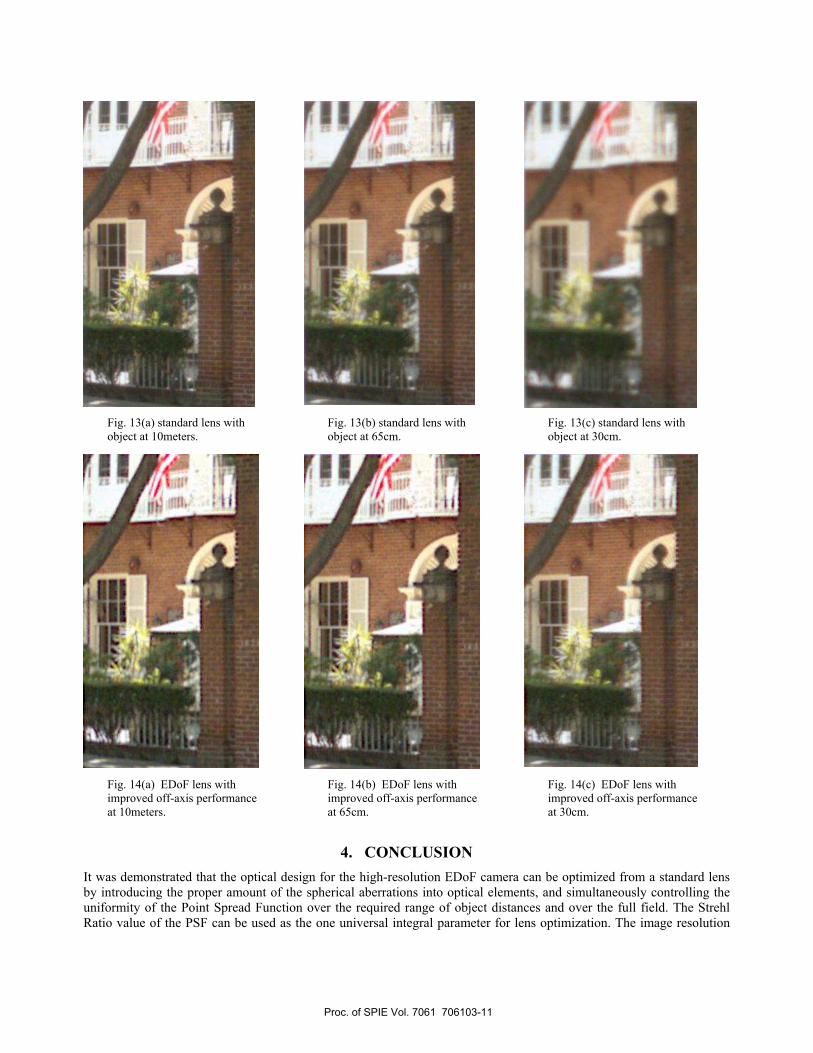
Fig. 13(a) standard lens with
object at 10meters.
Fig. 13(b) standard lens with
object at 65cm.
Fig. 13(c) standard lens with
object at 30cm.
4. CONCLUSION
It was demonstrated that the optical design for the high-resolution EDoF camera can be optimized from a standard lens
by introducing the proper amount of the spherical aberrations into optical elements, and simultaneously controlling the
uniformity of the Point Spread Function over the required range of object distances and over the full field. The Strehl
Ratio value of the PSF can be used as the one universal integral parameter for lens optimization. The image resolution
Fig. 14(a) EDoF lens with
improved off-axis performance
at 10meters.
Fig. 14(b) EDoF lens with
improved off-axis performance
at 65cm.
Fig. 14(c) EDoF lens with
improved off-axis performance
at 30cm.
Proc. of SPIE Vol. 7061 706103-11
and the overall quality are strongly affected by size and shape of a point spread function and Strehl Ratio. From the
analysis of the performance of the EDoF imaging module with 1.75µm 3 mega-pixel CMOS sensor, we concluded that
during optimization the lens PSF Strehl ratio should be kept above the 0.3 threshold value. We’ve designed two EDoF
lenses – one based on logarithmic asphere algorithm, and the other based on off-axis performance optimization. The
performances of both EDoF imaging modules were compared against that of a standard imaging module. The optimized
EDoF imaging modules allowed extending the depth-of-field to 30cm. As shown in Figs. 13 and 14, the images at object
distances 10meters, 65cm and 30cm taken with the EDoF imaging module look as good as the best-focused image taken
with the standard lens imaging module. An EDoF extension factor in the range of 2 to 3 was achieved.
5. ACKNOWLEDGEMENT
We are very thankful to our colleagues Dr. Brian Keelan, Dr. Dan Delescue and Dr. Junqing Chen for their suggestions
and supports. We are also very thankful to Dr. Wanli Chi at the Institute of Optics, University of Rochester for his great
ideas and suggestions.
REFERENCES
[1] Jorge Ojeda-Castaneda and Berriel-Valdos, L. R., “Zone plate for arbitrarily high focal depth,” Appl. Opt. 29, 994-
997 (1990). [2]
Ko, J., Kim, M. and Kim, C., “2d-to-3d stereoscopic conversion: Depth-map estimation in a 2d single-view image,”
in Proc. SPIE Applications of Digital Image Processing XXIX, (2007). [3]
Bae, S. and Durand, F., “Defocus magnification,” Computer Graphics Forum 26, 571-579 (2007). [4]
Marr, D. and Poggio, T., “A computational theory of human stereo vision,” Proc. Royal Soc. London Ser. B 204,
301-328 (1979). [5]
Grossmann, P., “Depth from focus,” Pattern Recogn. Lett. 5, 63-69 (1987). [6]
Ng, R., Levoy, M., Bredif, M., Duval, G., Horowitz, M., Hanrahan, P., “Light field photography with a hand-held
plenoptic camera,” Stanford Tech Report CTSR 2005-02, 1-11. [7]
Dowski, E. R. and Cathey, W. T., “Extended depth of field through wave-front coding,” Appl. Opt. 34, 1859-1866
(1995). [8]
Chi, W. and George, N., “Electronic imaging using a logarithmic asphere,” Opt. Lett. 26, 875-877 (2001). [9]
Ben-Eliezer, E., Marom, E., Konforti, N., and Zalevsky Z., “Radial mask for imaging systems that exhibit high
resolution and extended depths of field,” Appl. Opt. 45, 2001-2013 (2001). [10]
Chi, W. and George, N., “Computational imaging with the logarithmic asphere: theory,” J. Opt. Soc. Am. A 20,
2260-2273 (2003). [11]
George, N. and Chi, W., “extended depth of field using a multi-focal length lens with a controlled range of spherical
aberration and a centrally obscured aperture,” US Patent 7,336,430, B2.
Proc. of SPIE Vol. 7061 706103-12
Copyright © 2022 FDOKUMEN