
Optics Communications2004
10
Theoretical study of an absorbing sample in infrared near-field spectromicroscopy A. Dazzi a, * , S. Goumri-Said b , L. Salomon b a Laboratoire pour l’Utilisation du Rayonnement Electromagnetique, Centre Universitaire Paris-sud, B^ atiment 209D BP 34, 91898 ORSAY Cedex, France b Laboratoire de Physique (LPUB), CNRS UMR 5027, Universit e de BOURGOGNE, Facult e des Sciences Mirande, 9 Avenue Alain Savary, BP 47 870, 21078 Dijon Cedex, France Received 19 September 2003; received in revised form 24 February 2004; accepted 27 February 2004 Abstract This paper is devoted to study the near-field spectrometry in the infrared spectral range. To understand the behavior of the infrared light diffracted by an object, numerical calculations have been carried out with Fourier Modale (FM) method within R-matrix algorithm. We consider the case of three-dimensional system including a translational sym- metry in one direction, where is included an homogenous layer in which is buried an absorbing object. Using an optical near-field analysis and by calculating the electric field intensity distribution, both of the thickness effect and the lateral size of the absorbing sample are investigated. It is found that the distribution of the intensity related to the electric field is depending on geometry of the absorbing object. Also, we show how the diffraction due to the sample edges has an effect on the field intensity distribution. After that we pay more attention to the spectroscopy mapping description, in particular to the influence of the sample characteristics on detection of an absorbent object in near-field. This technique is also able to detect the doublet of an absorbent object with over-wavelength size but in near-field zone. When the lateral size of the object is a sub-wavelength, the absorption bands are detected with slight distortion but the diffraction effects are present. To diminish the diffraction effects, we reduce the sample thickness which may induce a more im- portant absorption bands distortion. Ó 2004 Elsevier B.V. All rights reserved. PACS: 42.25.Bs; 42.25.Gy; 68.37.Uv; 68.49.Uv; 61.14.Dc; 42.25.Fx Keywords: Optical near-field; Spectromicroscopy; Diffraction effects 1. Introduction Infrared spectroscopy is a powerful technique for identifying molecules and mid-infrared do- main is often used as a molecular fingerprint re- gion. Chemical mapping or spectromicroscopy is * Corresponding author. Tel.: +33-1-64-46-81-23; fax: +33-1- 64-46-41-48. E-mail address: [email protected] (A. Dazzi). 0030-4018/$ - see front matter Ó 2004 Elsevier B.V. All rights reserved. doi:10.1016/j.optcom.2004.02.084 Optics Communications 235 (2004) 351–360 www.elsevier.com/locate/optcom
Transcript of Optics Communications2004

Optics Communications 235 (2004) 351–360
www.elsevier.com/locate/optcom
Theoretical study of an absorbing sample in infrarednear-field spectromicroscopy
A. Dazzi a,*, S. Goumri-Said b, L. Salomon b
a Laboratoire pour l’Utilisation du Rayonnement Electromagnetique, Centre Universitaire Paris-sud, Batiment 209D BP 34,
91898 ORSAY Cedex, Franceb Laboratoire de Physique (LPUB), CNRS UMR 5027, Universit�e de BOURGOGNE, Facult�e des Sciences Mirande,
9 Avenue Alain Savary, BP 47 870, 21078 Dijon Cedex, France
Received 19 September 2003; received in revised form 24 February 2004; accepted 27 February 2004
Abstract
This paper is devoted to study the near-field spectrometry in the infrared spectral range. To understand the behavior
of the infrared light diffracted by an object, numerical calculations have been carried out with Fourier Modale (FM)
method within R-matrix algorithm. We consider the case of three-dimensional system including a translational sym-
metry in one direction, where is included an homogenous layer in which is buried an absorbing object. Using an optical
near-field analysis and by calculating the electric field intensity distribution, both of the thickness effect and the lateral
size of the absorbing sample are investigated. It is found that the distribution of the intensity related to the electric field
is depending on geometry of the absorbing object. Also, we show how the diffraction due to the sample edges has an
effect on the field intensity distribution. After that we pay more attention to the spectroscopy mapping description, in
particular to the influence of the sample characteristics on detection of an absorbent object in near-field. This technique
is also able to detect the doublet of an absorbent object with over-wavelength size but in near-field zone. When the
lateral size of the object is a sub-wavelength, the absorption bands are detected with slight distortion but the diffraction
effects are present. To diminish the diffraction effects, we reduce the sample thickness which may induce a more im-
portant absorption bands distortion.
� 2004 Elsevier B.V. All rights reserved.
PACS: 42.25.Bs; 42.25.Gy; 68.37.Uv; 68.49.Uv; 61.14.Dc; 42.25.Fx
Keywords: Optical near-field; Spectromicroscopy; Diffraction effects
* Corresponding author. Tel.: +33-1-64-46-81-23; fax: +33-1-
64-46-41-48.
E-mail address: [email protected] (A. Dazzi).
0030-4018/$ - see front matter � 2004 Elsevier B.V. All rights reserv
doi:10.1016/j.optcom.2004.02.084
1. Introduction
Infrared spectroscopy is a powerful technique
for identifying molecules and mid-infrared do-
main is often used as a molecular fingerprint re-
gion. Chemical mapping or spectromicroscopy is
ed.

352 A. Dazzi et al. / Optics Communications 235 (2004) 351–360
currently performed at synchrotron radiation
centers where the brilliance of the beam allows to
reach a spatial resolution close to the diffraction
limit (ffik) [1–3]. However, in the infrared domain
the diffraction limit exceeds largely the size of
many interesting species such as a typical livingcell (5–30 lm). Furthermore, much interest has
been devoted to enhance this resolution in mag-
nitude by using near-field microscopy. In fact,
during the last decade these new techniques have
been developed and refined, principally in the
visible region and few works were devoted to mid-
infrared domain [4–8]. This is mainly due to the
limitation of the number of tunable sources. Ac-tually, free electron lasers and optical parametric
oscillators can cover this interesting spectral range.
This is why we have developed an infrared mi-
croscope working in the photon scanning tunnel-
ing microscope (PSTM) configuration. Using this
optical near-field technique, our first experimental
results show that it is possible to visualize easily a
doublet of an absorbent substance centered at 3lm [9]. To go further, we have undertaken to
model numerically this device to understand the-
oretically the behavior of the diffracted field by an
absorbing sample when sweeping the wavelength
across absorption bands.
This paper is organized as follows. In Section 2,
we describe the physical system, illumination
conditions as well as the sample. Also we give brief
d
s
e n1an1b
n1
n2
θ
y
z
Hinc
E inc
k inc
Fig. 1. Schematic description of the set-up: n1 ¼ 4 is the refractive ind
n1b is the refractive index of the absorbing object, n2 ¼ 1 the refractive
absorbing region, e the thickness and h is the angle of incidence.
details of the numerical technique used in the
computation of diffracted electromagnetic field. In
Section 3, both of effects of the sample thickness
and its lateral size in the diffracted electromagnetic
field are studied. This step is important because it
allows us to determine the main system parametersrelated to the sample spectroscopy. In Section 4,
we detail the theoretical spectroscopy maps ob-
tained for an absorbent sample buried in homog-
enous layer. The effect of different geometrical
parameters of the sample are studied in detail to
point out their influence on the spectral detection
and spatial localization of the absorbent sample. A
general conclusion is given in Section 5, whichallows us to make an evaluation of our results and
to draw up future perspectives with the optical
near-field technique.
2. Description of the physical system and model
In this paper, we consider a PSTM configura-tion as an optical near-field technique. The physi-
cal system consists to illuminate in total reflection
with plane wave, a sample deposited on prism. The
electromagnetic field diffracted by the prism–sam-
ple system is collected close to the sample by a
tappered probe. In Fig. 1, we consider a sample
which incorporates: an homogenous film of re-
fractive index n1a ¼ 1:7 including an absorbent
prism
sample
air
x
ex of the prism, n1a ¼ 1:7 is the refractive index of the thin film,
index of air. d is the period of the structure, s is the size of the

A. Dazzi et al. / Optics Communications 235 (2004) 351–360 353
object, infinite in the z direction and possesses a
rectangular section of lateral size taken equal to sand e as the thickness. The refractive index of the
object is equal to n1b, for which the real and
imaginary parts are presented in Fig. 2. This latter
is similar to the refractive index of the photosen-sitive polymer diazonaphthoquinone usually used
in photolithography. Moreover, for the considered
object, we see in Fig. 2 that the refractive index
shows one characteristic doublet around 5 lmwhich allows us to identify its presence without
encountering any problem. Incidence angle and
different refractive indices of prism–sample–air are
taken in such manner that a total reflection canappear in sample–air interface. The detection of
electric field is performed in the constant height
scanning mode, at y0 height less than k0. The
prism, in Germanium, is modeled by semi-infinite
medium of refractive index n1 ¼ 4 (for k0 ¼ 5 lm)
in the considered wavelength domain. One must
notice here that different effects of opto-geometri-
cal parameters (e.g., size of the absorbent sample,refractive index, illumination conditions, etc.) can
be studied in detail easily with this model.
The numerical work is performed by the FM
method improved by R-matrix algorithm. This
method is well known by the authors working in
the diffraction gratings field [10]. It consists to
write the magnetic field (for TM polarization) with
Rayleigh expansion in two homogenous zones(prism and air). The zone of the sample is inho-
mogeneous (i.e., its refractive index varies along xdirection) and is called also modulated zone (see
Fig. 2. Distribution of the real (r) and imaginary (d) part of
the refractive index n1b versus the wavelength.
Fig. 1). We suppose that a finite number of modes
in Rayleigh expansion is sufficient to describe the
electromagnetic field outside the inhomogeneous
structure. To determine the transmission and re-
flection matrices of the system composed by three
zones defined previously, we choose N indepen-dent vectors. After that, we calculate their images
through the inhomogeneous structure with a nu-
merical method (Runge–Kutta). By writing the
boundary conditions of the electromagnetic field
for different interfaces, we obtain the cited above
matrices. Once these matrices are determined and
using the incident wave, it is possible to calculate
the electromagnetic field in three zones. One of themost important advantage of this method is the
possibility to evaluate the contribution of both
radiative and evanescent components emitted by
the diffracted zone. The details of FM method
have been reported elsewhere [11]. This method is
more adapted for periodical structure. But it is
possible to adapt the period to the used wave-
length to guarantee that there is no (or at leastminimized) electromagnetic coupling between the
absorbent objects. For the range of absorbent
object geometries considered in this work, the pe-
riod is taken equal to 200 lm.
Unfortunately, when the modulated zone be-
comes higher in height (i.e., in the order of the
wavelength) or/and the truncation number N in-
creases, the method becomes unstable. This insta-bility is related to the numerical problem
encountered when the evanescent orders are
propagated during the Runge–Kutta integration.
Moreover, for any precision obtained by the
computer, the rapid decreasing of evanescent or-
ders of low range strongly induces numerical in-
stabilities. To find a remedy for this problem,
different roughly equivalent algorithms may beused. In this work, we employ the R-matrix algo-
rithm to circumvent all numerical instabilities
[12,13].
However, at this level the problem is not com-
pletely resolved mainly in TM polarization. In
fact, other numerical instabilities may arise when
treating metals with a high reflectivity power. It
has been reported by Li [14] that when using thestandard theorems of Fourier factorization of
the truncated Fourier series of products of

Fig. 3. Near-field intensity distribution at k ¼ 5 lm, h ¼ 20�and y0 ¼ 10 nm versus the lateral position for different thick-
nesses sample: (a) (d) e ¼ 0:5 lm, (b) (r) e ¼ 1:3 lm, (c) (j)
354 A. Dazzi et al. / Optics Communications 235 (2004) 351–360
discontinuous functions employed in the differen-
tial theory are not converging everywhere in TM
polarization. So a new formulation based on a
correct representation of truncated Fourier series
of products of discontinuous functions was pro-
posed [15]. The convergence rate with respect tothe number of diffraction orders is much faster
and may approach the convergence rate in TE
polarization.
We must notice that when modeling this system,
we have not taken into account the presence of the
probe. We suppose that the tip probe collect the
intensity linked to the different electric field com-
ponents without modifying the electromagneticfield diffracted by the object [16,17].
e ¼ 2 lm.
3. Optical near-field analysis
3.1. Sample thickness influence
To understand the influence of the absorbingedge effect (absorbing object is bounded by two
edges), we start our study by analyzing the sample
for which the absorbent object has a large lateral
extension (s ¼ 50 lm) compared to the used
wavelength (k0 ¼ 5 lm). While when the absor-
bent zone is very small compared to k0, the two
edges may interact and the distribution intensity
related to the object may be extended to a largedistance more greater than the object lateral sur-
face. It may also be shifted with regard to the
geometrical position of the object. Below, we ex-
amine this sight more carefully. These effects are
well known for the near-field community for the
sample including non-absorbent surface defects
and sub-surface particle [18,19]. It seems very im-
portant to describe these sights for the absorbentobjects in aims to achieve the spectroscopic study
in part IV.
We represent in Fig. 3, the electric field intensity
distribution versus the lateral position of the probe
for three different sample thicknesses. All the in-
tensities are calculated in constant height scanning
mode, at y0 ¼ 10 nm above the sample surface. It
is shown in Fig. 3 that the intensity decreasesabove the absorbent zone of the object, but the
distribution intensity does not take the exact shape
of the object. The asymmetrical distribution above
the sample is due to illumination direction [20].
Consequently, the different oscillation patterns
obtained on the intensity distribution are due tothe interference between waves created by the
presence of the object and the transmitted incident
wave. Also, we may observe that the amplitude of
these oscillations is weak compared with the de-
tected signal. This phenomenon is associated to
the fact that both of real parts of refractive index
of the absorbent object and thin film are equal.
Furthermore, the imaginary part of refractive in-dex of the absorbent object contributes to the
damping down of the oscillations.
We must point out that when the sample
thickness increases, the intensity outside the ab-
sorbent zone varies in non monotonous manner.
This behavior may be explained by the interference
which takes place inside the sample layer. In fact,
if we consider the homogenous sample with a re-fractive index n1a ¼ 1:7 (without the absorbent
object), and one represents the intensity (associ-
ated to the evanescent components) emitted in air
zone (for example at 10 nm), we obtain an oscil-
lating curve versus the sample thickness (see curve
(a) in Fig. 4). This behavior is identical to a Fabry–
Perot interferometer, except that the transmitted
wave in the air medium is an infinite sum of eva-nescent waves. This last point is related to the fact
that the total reflection takes place on the last

Fig. 5. Near-field intensity distribution at k ¼ 5 lm, h ¼ 20�and y0 ¼ 10 nm for different size of absorbing region: (a) (r)
s ¼ 50 lm, (b) (d) s ¼ 10 lm, (c) (j) s ¼ 5 lm, (d) (�)
s ¼ 1 lm.
Fig. 4. Representation of: (a) (d) Near-field intensity versus the
sample thickness (the scale is not represented here and the
amplitude of the curve has been adapted to appear in full scale).
(b) (j) Value of absorption contrast versus the sample thick-
ness. (c) (r) Lateral spreading versus the sample thickness.
A. Dazzi et al. / Optics Communications 235 (2004) 351–360 355
sample–air interface. In the sample layer, we have
an infinite sum of radiative waves which are in-
terfering between them: when these interferences
are destructive, the intensity corresponds to a
maximum of the curve (a) and when they areconstructive, there is a confinement of the elec-
tromagnetic field inside the sample and we observe
a minimum in curve (a). This behavior may ex-
plain all values of the intensities (outside the ab-
sorbent zone) found in Fig. 3.
Now, we define two important quantities which
allow us to explain the next results: the absorption
contrast which will enable us to define the spec-troscopic threshold of detection for any object of a
given nature. The lateral spreading will allow us to
discuss the side positioning and the perception of
the absorbent object size on a spectroscopic image.
Firstly, the absorption contrast is defined by
(Imax–Imin)/(Imax), where Imax defines the average
value of the near-field intensity outside the ab-
sorbent zone. Imin can be obtained by taking theaverage value of the near-field intensity about this
zone (as is shown in curve (a) of Fig. 3). Secondly,
the lateral spreading (Ls) represents the lateral
distance between two points A and B. Where A is
the intersection of the vertical line in right-hand
side passing by the left end of the absorbing object
and the horizontal line defined by Imin, and B is the
intersection of the curve of intensity with the Imin
line. We present in Fig. 4 the absorption contrast
(curve (b)) and the lateral spreading (curve (c))
versus the sample thickness (by including the ob-
ject). These different curves are displayed for the
used wavelength (k0 ¼ 5 lm). We observe the
same behavior for the other wavelengths (not
represented here). We may observe from Fig. 4that these two quantities increase when the sample
thickness increases. They exhibit also oscillations
pattern with maximum and minimum in phase
with the diffracted intensity (curve (a) in Fig. 4).
This will have a direct consequence on the spec-
troscopy. One can verify here that the absorption
contrast diminishes to tend to zero when the
thickness vanishes. However, if we consider thatwe can detect an absorption contrast at least lower
than 5%, the sample thickness must be great than
or equal to 0.35 lm (ffik0=15). This value corre-
sponds to a lateral spreading of 5 lm (i.e., k0). All
these considerations will have important conse-
quences on spectroscopy mapping which will be
shown in the following section.
3.2. Effect of the lateral size of the sample
We present in Fig. 5 the intensity distribution as
function of the lateral position above the sample
and for different lateral size of object. The thick-
ness is fixed at 1 lm and the wavelength is con-
served equal to 5 lm with the refractive index of
absorbent object taken equal as previously ton ¼ 1:7þ j 0:04. For a lateral size of the absorbent

Fig. 6. Linear mapping of an absorbing region calculated at
y0 ¼ 10 nm, k ¼ 5 lm and h ¼ 20� from the surface of the thin
film. Absorbing object parameters are s ¼ 20 lm, e ¼ 1 lm.
The colour bar describes the variation of the electric field
intensity.
356 A. Dazzi et al. / Optics Communications 235 (2004) 351–360
object greater than or equal to the lateral spread-
ing (see Fig. 5(a)), the contrast absorption is con-
stant and it is found equal to 23%. Moreover,
when the size of the absorbent object is less than
the lateral spreading (see Fig. 5(b)–(d)) the inten-
sity above the absorbent object decreases slightlyand consequently the absorption is more weak. If
we suppose that we can detect an absorption
contrast equal at least to 5%, an absorbent object
for which the lateral size is greater than or equal to
1 lm can be detected to the detriment of the lateral
spreading. Then, for a sample thickness equal to
0.1 lm (not represented here), we obtain the same
behavior as for a thicker object. But in this case theabsorption contrast is weak (about 1%) when the
object lateral size is greater than or equal to 1 lm(with a lateral spreading equal to 2 lm). Under
this object lateral size the contrast becomes weaker
and the lateral spreading is conserved.
However, the quantities discussed here (ab-
sorption contrast and the lateral spreading) are
related to the opto-geometrical parameters of thesample, the substrate and superstate, as well as in
illumination conditions of the system. So, the ab-
sorption contrast and the lateral spreading found
are specific for the considered opto-geometrical
parameters. Moreover, these quantities allow us to
better apprehend the limitations which may occur
when the spectroscopy images are recorded in both
cases, theoretical and experimental. From all theseresults, we see that the absorption contrast plays
an important role in the detected intensity. Con-
sequently, in experimental studies, the quality of
tunables sources as well as the system noise (me-
chanical and electronic) will have a great impor-
tance to define the threshold of minimal detection
for the absorbent object.
4. Spectroscopy
4.1. Spectroscopy mapping description
In this study, we choose to draw the spectros-
copy map at two dimensional with the aim to ex-
tract the absorption bands when possible. On thedifferent figures (from Fig. 6 to Fig. 9), the hori-
zontal coordinate corresponds to a lateral position
of the detector from the object. The vertical co-
ordinate corresponds to the wavelengths scanned
around the position of the doublet. In the inter-
section point, the color corresponds to the value of
the intensity detected by the probe (positioned
here at 10 nm above the sample).
In Fig. 6, we describe the spectroscopy mapof absorbent zone of 20 lm in width and 1 lmin thickness. Also, we identify two zones corre-
sponding to the doublet for which the profile
(parallel to x axis) is comparable to that reported
in Fig. 3 and Fig. 5. The minima of absorption
(vertically to x-direction) are centred on the
maxima of the imaginary part of refractive index
of the absorbent object (see Fig. 2). We find thatthe stronger the imaginary part of refractive in-
dex of the object is, the more absorption is, and
the weaker detected intensity is. The position of
the absorbent zone (related to the doublet) in
Fig. 6 reproduces the lateral size of the absor-
bent object with a lateral spreading (as observed
in Fig. 3, Fig. 5 and remarks given in Section
3.2). This figure shows that it is possible to de-tect the absorbing object by its spectroscopic

Fig. 7. Behaviour of the linear mapping versus the tip-sample distance.
A. Dazzi et al. / Optics Communications 235 (2004) 351–360 357
signature. We have presented (with green lines in
Fig. 6) the position of the minima of the dou-
blet. We may see that there is no distortion on
the absorption bands for the considered lateral
size of sample.
4.2. Sample–probe distance influence
In optical near-field, it is well known that the
distance between the probe and sample is an im-
portant parameter, and this may have a strong
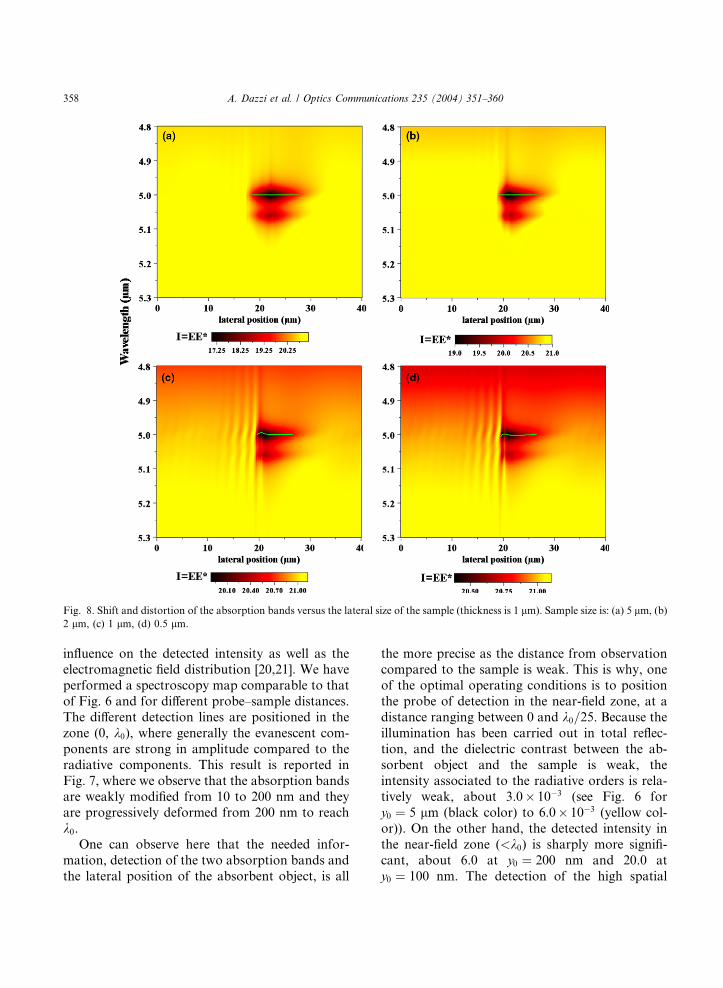
Fig. 8. Shift and distortion of the absorption bands versus the lateral size of the sample (thickness is 1 lm). Sample size is: (a) 5 lm, (b)
2 lm, (c) 1 lm, (d) 0.5 lm.
358 A. Dazzi et al. / Optics Communications 235 (2004) 351–360
influence on the detected intensity as well as theelectromagnetic field distribution [20,21]. We have
performed a spectroscopy map comparable to that
of Fig. 6 and for different probe–sample distances.
The different detection lines are positioned in the
zone (0, k0), where generally the evanescent com-
ponents are strong in amplitude compared to the
radiative components. This result is reported in
Fig. 7, where we observe that the absorption bandsare weakly modified from 10 to 200 nm and they
are progressively deformed from 200 nm to reach
k0.One can observe here that the needed infor-
mation, detection of the two absorption bands and
the lateral position of the absorbent object, is all
the more precise as the distance from observationcompared to the sample is weak. This is why, one
of the optimal operating conditions is to position
the probe of detection in the near-field zone, at a
distance ranging between 0 and k0=25. Because theillumination has been carried out in total reflec-
tion, and the dielectric contrast between the ab-
sorbent object and the sample is weak, the
intensity associated to the radiative orders is rela-tively weak, about 3.0� 10�3 (see Fig. 6 for
y0 ¼ 5 lm (black color) to 6.0� 10�3 (yellow col-
or)). On the other hand, the detected intensity in
the near-field zone (<k0) is sharply more signifi-
cant, about 6.0 at y0 ¼ 200 nm and 20.0 at
y0 ¼ 100 nm. The detection of the high spatial

Fig. 9. Distortion of the linear mapping versus the thickness of
the sample (size is 1 lm). Thickness is: (a) 1 lm, (b) 0.5 lm, (c)
0.1 lm.
A. Dazzi et al. / Optics Communications 235 (2004) 351–360 359
frequency allows to highlight very clearly the two
absorption bands and to position with precision
the absorbing object.
4.3. Effect of the lateral size and the sample
thickness in the spectroscopy maps
In Fig. 8, we show the spectroscopy maps for an
analogous object as previously defined one, but we
have reduced its lateral size in such manner to
obtain a size less than or equal to the wavelength.
Also, we have considered four different lateral size
of the sample: 5, 2, 1 and 0.5 lm, and the thickness
is kept equal to 1 lm. On different images, weobserve that in wavelength the doublet position is
reproduced although the absorption zone for
k0 ¼ 5:06 lm is less marked for the different ob-
jects. Concerning the spatial localization of this
absorbent object, the diffraction effects are more
significant compared to the case of an object
greater than the wavelength. The oscillations are
also more pronounced compared to those ofFig. 6, and we find that the asymmetrical illumi-
nation effect has a tendency to shift laterally the
presence of the absorbent object. This is also in
agreement with the lateral spreading effect which
has been investigated in Fig. 3. As shown in Fig. 6,
the absorption bands are underlined by a green
sketch in map spectroscopy of Fig. 8. The ab-
sorption bands position (with an absorption con-trast greater than or equal to 5%) is more
spreading laterally, essentially in Fig. 8(c) and
Fig. 8(d). In Fig. 8(a) and (b), the distortion bands
are weak (less than Dr ¼ 1 cm�1), whereas in
Fig. 8(c) and (d) the bands distortion can achieve
Dr ¼ 3 cm �1 (Dk0 ¼ 8 nm). These results show
that the diffraction effects have a direct conse-
quence on the bands distortion.In Fig. 9, we study the effect of the absorbent
zone thickness. For this aim, we choose an ab-
sorbent object with a lateral size equal to 1 lm and
different thicknesses: 1, 0.5 and 0.1 lm. As previ-
ously, the doublet is detected on each figure. In
this case, we observe that the lateral spreading is
weaker as the sample thickness is (see Fig. 4). For
an absorbent object of 0.1 lm thickness, the lateralspreading (2 lm) is in order of the absorbent ob-
ject size (1 lm). Concerning the absorption bands,

360 A. Dazzi et al. / Optics Communications 235 (2004) 351–360
the thicker the absorbent object is, the weaker
are the distortion bands. But for a thickness of 0.1
lm, the distortion is relatively large and is equal to
Dr ¼ 5 cm�1 (Dk0 ¼ 13 nm), with absorption
contrast relatively weak (about 1%). We may es-
tablish that an absorbent sample with a weakthickness contributes in reducing the lateral
spreading of the object but enhances the distortion
of the absorption bands. We have also observed
that when carrying out an incoherent symmetrical
PSTM illumination of the sample [22], it is possible
to position spatially with more precision, the ab-
sorbing object but by increasing the distortion of
the absorption bands. In the case of the sample ofFig. 9(c), Dr is found equal to 7.6 cm�1, whereas it
was estimated to be 5 cm�1 with an asymmetrical
illumination.
5. Conclusion
We have shown through this study, using an
optical near-field technique, that it is possible to
detect the presence of an absorbent object having
an optical signature characterized by a doublet in
infrared domain. For an absorbent object with anover-wavelength lateral size, both of localization
and lateral size of objects as well as the absorption
bands position are reproduced. Moreover, in this
case, the detection must be performed in near-field
and very close to the sample. For an absorbent
object with a sub-wavelength lateral size, the lo-
calization is also obtained but to the detriment of
the lateral spreading (diffraction of edges). In thiscase, the absorption bands are detected without
distortion. The lateral spreading may be strongly
diminished when the absorbent object thickness is
reduced. In this case, we observe a distortion of
bands (about few cm�1) but they are always de-
tected. This distortion is only due to the diffraction
effect and not the chemical one. Moreover, in ex-
perimental study a minimum of absorption con-trast requires a tunable source stable in frequency
and a detection system with less noise to detect
correctly.
This theoretical study constitutes a preliminary
step and calls for more theoretical and experi-
mental investigations, such as the study of power
of resolution and a sample including different ab-
sorbent objects with different size and natures.
Another interesting idea will be to include the
probe and to study its influence on the spectros-
copy maps (localization of objects and absorption
bands detection) as well as the localized absorbentobjects in three dimension.
References
[1] P. Dumas, G.L. Carr, G.P. Williams, Analysis 1 (2000) 68.
[2] G.L. Carr, G.P. Williams, SPIE Conf. Proc. 3153 (1997)
51.
[3] G.L. Carr, D. DiMarzio, M.B. Lee, D.J. Larson, AIP
Conf. Proc. (Woodbury, NY) (1996) 418.
[4] A. Piednoir, F. Creuset, C. Licoppe, J.M. Ortega, Second
International Conference on Near-field Optics, Raleigh,
USA, 1994.
[5] A. Piednoir, F. Creuset, C. Licoppe, F. de Fornel,
Workshop on Optical Near-field, Arc et Senans, France,
1992.
[6] A. Laherech, R. Bachelot, P. Gleyzes, A.C. Boccara, Opt.
Lett. 21 (1996) 1315.
[7] B. Knoll, F. Keilmann, Nature 399 (1999) 134.
[8] R. Hillenbrand, T. Taubner, F. Keilmann, Nature 418
(2002) 159.
[9] N. Gross, A. Dazzi, J.M. Ortega, R. Andouart, R.
Prazeres, C. Chicanne, J.-P. Goudonnet, Y. Lacroute, C.
Boussard, G. Fonteneau, S. Hocd�e, EPJ-AP 16 (2001) 91.
[10] M. Nevi�ere, P. Viencent, R. Petit, Nouv. Rev. Opt. 5 (1974)
65.
[11] R. Petit (Ed.), Electromagnetic Theory of Gratings, Topics
in Current Physics, vol. 22, Springer-Verlag, Berlin, 1980
(see Chapter IV, pp. 101–121 by P. Vincent).
[12] F. Montiel, M. Nevi�ere, J. Opt. Soc. Am. A 11 (1994) 3241.
[13] L. Salomon, G. Bassou, J.-P. Dufour, F. de Fornel, A.V.
Zayats, Phys. Rev. B 65 (2002) 125409.
[14] L. Li, J. Opt. Soc. Am. A 13 (1996) 1870.
[15] E. Popov, M. Nevi�ere, J. Opt. Soc. Am. A 10 (2000) 1773.
[16] D. van Labeke, D. Barchiesi, J. Opt. Soc. Am. A 10 (1993)
2193.
[17] J.-J. Greffet, R. Carminati, Prog. Surf. Sci. 56 (1997) 133.
[18] R. Carminati, J.-J. Greffet, J. Opt. Soc. Am. A 12 (1995)
2716.
[19] R. Carminati, J.-J. Greffet, N. Garcia, M. Nieto-Vesperi-
nas, J. Opt. Lett. 21 (1996) 501.
[20] F. de Fornel, L. Salomon, E. Bourillot, J.P. Goudonnet,
Ultramicroscopy 42 (1992) 422.
[21] F. de Fornel, P.M. Adam, L. Salomon, J.P. Goudonnet, A.
Santenac, R. Carminatti, J.-J. Greffet, J. Opt. Soc. Am. A
13 (1996) 35.
[22] G. Chabrier, F. de Fornel, E. Bourillot, L. Salomon, J.P.
Goudonnet, Opt. Commun. 107 (1994) 347.