
Eigenstate expansion method for simulations of non-perturbative multiphoton processes
Upload
independentCategory
view
1download
0
Journal of Neuroscience Methods 173 (2008) 259–270
Contents lists available at ScienceDirect
Journal of Neuroscience Methods
journa l homepage: www.e lsev ier .com/ locate / jneumeth
Optical monitoring of neuronal activity at high frame rate with a digitalrandom-access multiphoton (RAMP) microscope
Yo Otsua,1, Volker Bormutha,1, Jerome Wonga, Benjamin Mathieub,
Guillaume P. Duguéa, Anne Feltza, Stéphane Dieudonnéa,∗a Laboratoire de Neurobiologie, CNRS UMR 8544, Ecole Normale Supérieure, 46 rue d’Ulm 75005, Paris, Franceb 5005
ffersmplinactivof actiallyrateshich
we demonsal pyrand sscennam
Imaging platform, département de Biologie, Ecole Normale Supérieure, 46 rue d’Ulm 7
a r t i c l e i n f o
Article history:Received 8 April 2008Received in revised form 10 June 2008Accepted 16 June 2008
Keywords:ImagingMultiphoton microscopyCalciumCerebellumCerebral cortex
a b s t r a c t
Two-photon microscopy otissue. However, serial sacharacteristic of neuronalamplitude. The recent usemicroscopy (RAMP) potenpoints-of-interest at highand phototoxicity issues, wnot been assessed. Here,RAMP microscope. We dein Purkinje cells and corticimposed by phototoxicitythese recordings the fluoreonly by the calcium dye dy
1. Introduction
Monitoring cell type specific activity in space and time is centralto our understanding of brain microcircuits function. Imaging tech-niques are well suited to yield large-scale non-invasive recordingsof local microcircuit activity with cellular precision. In particular,specific cell types can be selectively targeted on the basis of theirmorphology or according to the expression of genetically encodedfluorescent markers and probes (Diez-Garcia et al., 2005; Hasan etal., 2004; Heim et al., 2007; Yaksi and Friedrich, 2006). Followingthe recent development of bulk loading protocols (Nagayama etal., 2007; Nevian and Helmchen, 2007; Nimmerjahn et al., 2004;Peterlin et al., 2000; Stosiek et al., 2003), optical recordings ofneuronal activity have brought new insights into the functionalorganization of microcircuits in vitro (Brecht et al., 2004; Cossartet al., 2003; Ikegaya et al., 2004) and in vivo (Kerr et al., 2005;
∗ Corresponding author at: Laboratoire de Neurobiologie, CNRS UMR 8544, EcoleNormale Supérieure, 46 rue d’Ulm 75005, Paris, France. Tel.: +33 1 4432 3750;fax: +33 1 4432 3887.
E-mail address: [email protected] (S. Dieudonné).1 Both authors contributed equally to the work.
0165-0270/$ – see front matter © 2008 Elsevier B.V. All rights reserved.doi:10.1016/j.jneumeth.2008.06.015
Paris, France
the promise of monitoring brain activity at multiple locations within intactg of voxels has been difficult to reconcile with millisecond timescales
ity. This is due to the conflicting constraints of scanning speed and signalousto-optic deflector scanning to implement random-access multiphotonallows to preserve long illumination dwell times while sampling multiple
. However, the real-life abilities of RAMP microscopy regarding sensitivityhave so far impeded prolonged optical recordings at high frame rates, havescribe the design, implementation and characterisation of an optimisedtrate the application of the microscope by monitoring calcium transientsamidal cell dendrites and spines. We quantify the illumination constraintshow that stable continuous high-rate recordings can be obtained. During
ce signal is large enough to detect spikes with a temporal resolution limitedics, improving upon previous techniques by at least an order of magnitude.
© 2008 Elsevier B.V. All rights reserved.
Nagayama et al., 2007; Ohki et al., 2005; Sullivan et al., 2005; Yaksiand Friedrich, 2006).
Monitoring single spikes at high temporal resolution in a pop-ulation of neurons can be achieved with photodiode arrays or fastCCD cameras (Mao et al., 2001; Smetters et al., 1999), but thesefield illumination techniques suffer from serious drawbacks. Theirspatial resolution, penetration capability in diffusive brain tissueand signal-to-noise ratio are poor. Moreover, high photon fluxinduces photodamage and photobleaching, limiting the durationof the recordings (Mao et al., 2001). Laser-scanning techniques,which have optical slicing capabilities and can resolve neuritesin situ, could overcome these limitations. Non-linear excitationmicroscopy (Denk et al., 1990), in particular, has greatly con-tributed to improve the depth of penetration and the sensitivityof in situ imaging (Denk et al., 1994; Helmchen and Denk, 2005)at reduced photodamage levels. However, laser-scanning micro-scopes are serial-acquisition devices and their temporal resolutionis limited both by the inertia of mechanical scanners and by thevanishingly small signal collected from each voxel at high scanningspeed. Despite efforts to implement parallel scanning with multi-ple beams (Hell and Andresen, 2001; Straub et al., 2000) the useof laser-scanning imaging has been so far confined to the study ofslow population activity (Garaschuk et al., 2006) like calcium waves
cience
260 Y. Otsu et al. / Journal of Neuros(Crepel et al., 2007; Stosiek et al., 2003), cortical up-states (Kerret al., 2005; Yaksi and Friedrich, 2006) or responses to prolongedstimuli (Ohki et al., 2005; Yaksi and Friedrich, 2006).
In laser-scanning microscopy, images constitute a bidimen-sional sampling of tridimensional biological objects. A simplestrategy to improve the temporal resolution is to further reducethe dimensionality of the scanned area. Line scanning has beenextensively used to follow biological signals with kHz resolution(Yasuda et al., 2004). The spatial sampling capacity of this techniquehas been recently adapted to the study of neuronal populationsby implementing curved trajectories in 2D and in 3D (Gobel et al.,2007). However, one-dimensional scanning is not optimal to sam-ple the sparse structure of neurons and networks. Ideally, points ofinterest should be placed on each singular object. This ultimatereduction in the dimension of the scanned area, aimed at opti-mizing useful dwell times, was named random-access microscopy(Bullen et al., 1997). Such discontinuous scanning cannot be imple-mented with galvanometric mirrors but is the essence of AODs,which are digital pointing devices with microsecond switch times(Bullen et al., 1997). Adaptation of AODs to two-photon microscopyhas raised important technical difficulties that have been solved inthe past years (Iyer et al., 2006, 2003; Kremer et al., 2008; Lechleiteret al., 2002; Reddy and Saggau, 2005; Salomé et al., 2006; Zeng etal., 2006, 2007) leading to the design of functional random-accessmultiphoton (RAMP) microscopes (Iyer et al., 2006; Salomé et al.,2006; Vucinic and Sejnowski, 2007).
RAMP microscopy has been employed in episodic acquisitionprotocols to monitor calcium influx at high speed for short-durationtrials (Diana et al., 2007; Iyer et al., 2006). However, the com-patibility of RAMP microscopy with continuous network imagingremains to be established, as repetitive two-photon excitation athigh rates is known to cause photodamage (Hopt and Neher, 2001;Koester et al., 1999; Yasuda et al., 2004). In the present work weaimed at optimizing the sensitivity and reducing the phototoxi-city of RAMP microscopy. We describe the design choices madeto build a fully interfaced RAMP microscope in which the illumi-nation and collection of light have been optimised for high-speedscanning. As preliminary to real-life experiments, we establish thelaser power threshold for the phototoxicity of continuous highframe rate RAMP imaging. The sensitivity of our instrument allowsus to obtain stable high-speed recordings without phototoxicity.We then demonstrate the microscope’s application in two biolog-ical preparations: in cerebellar Purkinje cells, we detect complexspike calcium influx at single spines with millisecond precision; in
neocortex, we show that the calcium transient evoked by simplespikes in apical dendrites can be detected. The temporal precisionof single-event detection (3 ms) is limited only by the dynamics ofthe fluorescent dyes used, and is significantly improved comparedto previous methods.2. Materials and methods
2.1. Microscope design
Our instrument (Fig. 1A) is based on an Olympus BX51WI mod-ular microscope equipped with a 40× objective (LUMPlanFL/IR, 0.8NA). Two-photon excitation is produced by a femtosecond Ti–Sapulsed laser (Tsunami pumped by a 6 W Millenia VI, 400 mW out-put at 700 fs, Spectra-Physics) in which the back cavity mirroris replaced by a Gire-Tournois interferometer. The laser is cou-pled into the transmitted light pathway of the microscope bya dichroic filter (740dcsx, Chroma Technology Corporation). Thelaser beam is expanded 2.5-fold to match the AOD input win-dow. The beam-steering pathway is composed of the acousto-opticdeflectors (AODs) and of a 1:2 relay telescope made of achro-
Methods 173 (2008) 259–270
matic doublet lenses (L1 and L2 in Fig. 1). The AODs can be tiltedin pitch and yaw to match the angle of incidence of the laserbeam to the Bragg angle, which maximizes the diffraction effi-ciency.
To operate the AODs and coordinate the scanning protocols andsignal acquisition, we developed a custom-made user interfacebased on National Instrument cards programmed under Labview.A high-speed (20 MHz) 32 bits digital I/O card (PCI-6534) and two16 bits DDS circuit are used to control the AODs. Sequences of coor-dinates are stored on the 64 MB internal memory of the PCI-6534card before starting the acquisition. The scan coordinates, i.e. theacoustic frequencies, are coded on 12 bits, yielding a resolution of770 × 770 points at 825 nm. Central frequencies are calculated tomatch the Bragg conditions at each wavelength. The AODs are alsoused as fast power modulators, effectively replacing electro-opticcells and attenuation filters. The acoustic power, i.e. the laser powerdiffracted to the sample, is coded on 8 bits. In Z stacks the laserpower is automatically adjusted for the exponential loss of ballisticphotons with depth.
A multi-counter/timer card (NI PCI-6602) constitutes the coreof our system, providing for all the timing and synchronizationclocks. Photon counting is also operated on this card and is gatedby one of the synchronization clocks. Images can be displayedonline or offline. Points of interest are selected by a simple mouseclick from any previously acquired image. In the point-scanningmode, de-multiplexed fluorescence traces are displayed online. Inan externally triggered episodic mode, cumulative fluorescence and�F/F signals can be displayed online. In a continuous acquisitionmode, time-stamps (400 spurious photons at 20 MHz) can be super-imposed on the signal to indicate the time of occurence of externaltriggers. Finally a multifunction card (NI-PCI-MIO 16 E-4) is usedto pass all the triggers necessary to synchronize the imaging andthe electrophysiology and to control the piezo-electric device thatmoves the objective in Z.
2.2. Point-spread function (PSF) measurements
Sub-resolution fluorescent beads (200 nm; Molecular Probes)were embedded in agarose gel (1%, w/v). Drops of gel placed on aslide were imaged with a 40× water immersion objective (Olym-pus). For each experiment the laser pulse bandwidth, expressed asFull Width at Half Maximum (FWHM), was determined by Gaussianfit of the spectrum (USB2000; Ocean Optics) and the laser powerwas measured at the sample and adjusted to be close to 10 mW. A
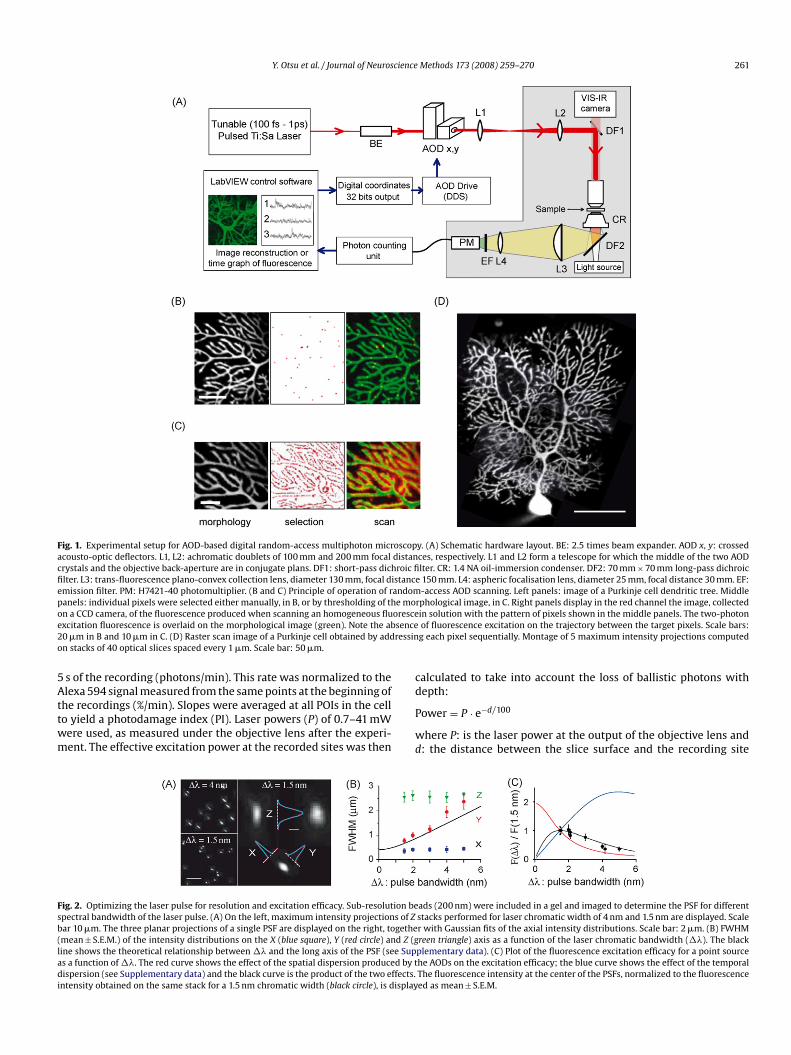
number of beads (20–80) were imaged within 40 �m Z stacks, withan X–Y resolution of 0.125 �m and a Z sampling of 0.3 �m. Isolatedbeads were selected for analysis. Each stack was acquired for dif-ferent laser spectral widths. Axial fluorescence profiles, averagedover a width of 4 pixels on a single section at the center of the PSF(ImageJ), were fitted by Gaussian functions. The distribution of thepeak fluorescence of the beads in each stack was best described bya log-logistic distribution and fits were performed to determine themedian peak fluorescence of the data set (fitting tools of the statis-tical toolbox of Matlab). Results are plotted in Fig. 2B. These valueswere then normalized to the square of the laser power and to themedian peak fluorescence obtained on the same bead sample fora spectral width of 1.5 nm to yield the data of Fig. 2C. SEMs of thetest and control data sets were added.2.3. Photodamage quantification
For photodamage quantification the rate of change of the Fluo-4signal during a continuous optical recording (7–13 min) was calcu-lated at imaged points of interest in the Purkinje cell dendrites asthe slope between the averaged photon count in the first and last
Y. Otsu et al. / Journal of Neuroscience Methods 173 (2008) 259–270 261
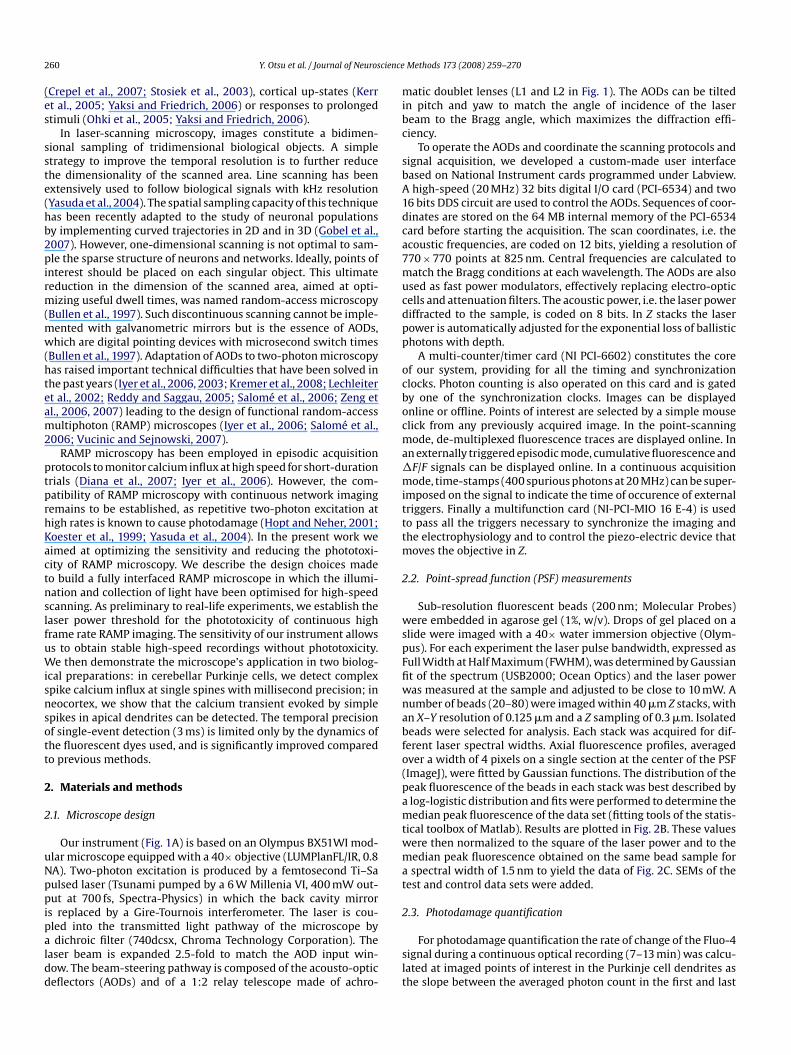
Fig. 1. Experimental setup for AOD-based digital random-access multiphoton microscopacousto-optic deflectors. L1, L2: achromatic doublets of 100 mm and 200 mm focal distancrystals and the objective back-aperture are in conjugate plans. DF1: short-pass dichroic fifilter. L3: trans-fluorescence plano-convex collection lens, diameter 130 mm, focal distancemission filter. PM: H7421-40 photomultiplier. (B and C) Principle of operation of randompanels: individual pixels were selected either manually, in B, or by thresholding of the moon a CCD camera, of the fluorescence produced when scanning an homogeneous fluoresceexcitation fluorescence is overlaid on the morphological image (green). Note the absence20 �m in B and 10 �m in C. (D) Raster scan image of a Purkinje cell obtained by addressinon stacks of 40 optical slices spaced every 1 �m. Scale bar: 50 �m.
5 s of the recording (photons/min). This rate was normalized to theAlexa 594 signal measured from the same points at the beginning ofthe recordings (%/min). Slopes were averaged at all POIs in the cellto yield a photodamage index (PI). Laser powers (P) of 0.7–41 mWwere used, as measured under the objective lens after the experi-ment. The effective excitation power at the recorded sites was then
Fig. 2. Optimizing the laser pulse for resolution and excitation efficacy. Sub-resolution bespectral bandwidth of the laser pulse. (A) On the left, maximum intensity projections of Zbar 10 �m. The three planar projections of a single PSF are displayed on the right, togethe(mean ± S.E.M.) of the intensity distributions on the X (blue square), Y (red circle) and Z (gline shows the theoretical relationship between �� and the long axis of the PSF (see Supas a function of ��. The red curve shows the effect of the spatial dispersion produced by tdispersion (see Supplementary data) and the black curve is the product of the two effects.intensity obtained on the same stack for a 1.5 nm chromatic width (black circle), is display
y. (A) Schematic hardware layout. BE: 2.5 times beam expander. AOD x, y: crossedces, respectively. L1 and L2 form a telescope for which the middle of the two AODlter. CR: 1.4 NA oil-immersion condenser. DF2: 70 mm × 70 mm long-pass dichroic
e 150 mm. L4: aspheric focalisation lens, diameter 25 mm, focal distance 30 mm. EF:-access AOD scanning. Left panels: image of a Purkinje cell dendritic tree. Middle
rphological image, in C. Right panels display in the red channel the image, collectedin solution with the pattern of pixels shown in the middle panels. The two-photonof fluorescence excitation on the trajectory between the target pixels. Scale bars:g each pixel sequentially. Montage of 5 maximum intensity projections computed
calculated to take into account the loss of ballistic photons withdepth:
Power = P · e−d/100
where P: is the laser power at the output of the objective lens andd: the distance between the slice surface and the recording site
ads (200 nm) were included in a gel and imaged to determine the PSF for differentstacks performed for laser chromatic width of 4 nm and 1.5 nm are displayed. Scaler with Gaussian fits of the axial intensity distributions. Scale bar: 2 �m. (B) FWHMreen triangle) axis as a function of the laser chromatic bandwidth (��). The blackplementary data). (C) Plot of the fluorescence excitation efficacy for a point sourcehe AODs on the excitation efficacy; the blue curve shows the effect of the temporalThe fluorescence intensity at the center of the PSFs, normalized to the fluorescenceed as mean ± S.E.M.

cience
262 Y. Otsu et al. / Journal of Neuros(19–41 �m). The space constant of 100 �m was taken from (Oheimet al., 2001) for young animals after correction for the wavelengthof 825 nm.
2.4. Slice preparation for electrophysiological and opticalrecording
Slices (250–350 �m) were prepared from the cerebellumand primary sensory-motor cortex of Wistar rats (17–21 daysold), according to CNRS animal protocols. A block including thesomatosensory cortex or the vermal part of the cerebellum wasremoved and slices were cut using a vibrating blade microtome(Leica VT 1000 S) in an ice-cold solution containing (mM) 130K-gluconate, 15 KCl, 0.05 EGTA, 20 Hepes, 25 glucose and 50 �M D-APV, pH 7.4. Slices were transferred to artificial cerebrospinal fluid(ACSF, 32–34 ◦C) containing (mM) 125 NaCl, 2.5 KCl, 1.25 NaH2PO4,26 NaHCO3, 25 glucose, 2 CaCl2, 1 MgCl2 and bubbled with 95% O2,5% CO2.
For long-lasting multisite optical recording experiments,mechanical stability is a crucial issue, as image registration is notpossible in this mode. We found that the slices swelled whendirectly placed onto the glass bottom of the chamber (up to1 �m min−1). Henceforth, all the slices were maintained in suspen-sion between two nylon nets and perfused on both sides.
Neurons were visualized for patch-clamp recordings usinga combination of gradient contrast and online video contrastenhancement (CoolSnapCf and Metamorph, Roper Scientific) atwavelengths of 670–740 nm, as defined by the dichroic filter pairDF1 and DF2. Whole-cell recordings were performed with anAxoclamp amplifier (Axon Instruments). Pipette were filled withan intracellular solution containing (mM) 145 KMeSO4, 6 NaCl,1 MgCl2 10 Hepes, 4 ATP-Mg, 0.4 GTP-Mg, pH 7.35, and supple-mented with a morphological dye (Alexa 594, 10–20 �M, MolecularProbes) and a calcium-sensitive dye (30–200 �M) as stated in thetext (∼300 mOsm). The pipettes resistances ranged from 3 to 5 M�.Cells were held at membrane potentials of −60 to −65 mV. Purkinjecell imaging was started after at least 30 min of whole-cell dialy-sis. The climbing fiber inputs to Purkinje cells, identified on thebasis of their large all-or-none electrophysiological response, werestimulated every 3 s while recording the cell in current-clamp. Theelectrophysiological responses were low-pass filtered at 3 kHz andrecorded at a sampling frequency of 5–20 kHz.
2.5. Bulk loading of neuronal populations in brain slices with AM
dyesCortical slices were put directly in the recording chamber. Fluo-4AM or Fluo-5 AM (10 mM) were dissolved in Pluronic F-127 solution(20% solution in DMSO) and calcein orange (633 �M) was dissolvedin DMSO. These stock solutions were diluted in the Hepes-bufferedsolution and mixed to yield concentrations of 0.9 mM and 12 �M,respectively. The dye solution was sonicated for 10 min and filteredin 0.25 �m centrifuge filters. A small patch pipette (5 M�) was filledwith the dye solution, inserted slowly with a positive pressure of∼0.2–0.3 bar and placed a hundred microns below the surface. Thedyes were continuously pressure-ejected in the slice until a sphereof about 200 �m diameter was loaded. The slice was then let torecover for 1 h before starting the recording session.
2.6. Data analysis
The analysis was performed with Igor Pro 5.0 (Wave-metrics) and pClamp 9 software (Axon Instruments). Relativefluorescence was expressed as �F/F, that is as the background-corrected increase in fluorescence (�F) divided by the prestimulus
Methods 173 (2008) 259–270
background-corrected fluorescence (F). To detect spontaneouscalcium transients, optical recordings were smoothed and differen-tiated. Threshold detection was performed on the resulting tracesto identify the occurrence of significant deviations (4 S.D.) fromthe baseline (Dugue et al., 2005). Once individual transients weredetected, a custom fitting procedure was implemented to deter-mine with greater temporal accuracy the onset time of the calciumtransients. An ad hoc function was composed of a linear segment(baseline) connected to an exponentially rising function mimickingthe onset of the calcium transient (see Fig. 8E). Two free parame-ters were then optimized: the time of origin of the exponentialrise, considered to be the onset time, and the time constant of theexponential.
Data are presented as mean ± S.E.M. and statistical signifi-cance was calculated using the non-parametric Mann–Whitney testunless otherwise stated.
3. Results
3.1. Implementation of AOD digital scanning strategies
We have built a multiphoton microscope (see Section 2) inwhich both X and Y deflection is operated by acousto-optic deflec-tors (AODs) (Fig. 1A). Crossed X–Y shear mode AODs made ofTeO2 were custom-designed by A–A Opto-Electronics (based on theAA.DTS.XY-250 model). These AODs have an acoustic bandwidth ofone octave and they accept, by design, laser wavelengths rangingfrom 800 nm to 1 �m. This wide optical bandwidth covers 70% ofthe tuning range of current Ti–Sa pulsed lasers and is compatiblewith a large variety of dyes used in multiphoton microscopy. Thesize of the input window of the AODs (4.2 mm) was chosen to opti-mize a tradeoff between the resolution, the size of the field of viewand the scan speed (Supplementary data). With our optical design,we measured a field of view of 96 �m at 830 nm, in agreement withthe calculated value of 95 �m (Supplementary data).
In this non-mechanical scanning microscope, deflection of thelaser beam to a specific position is obtained by setting the appropri-ate acoustic wavelength in the AOD crystal. While a new acousticwave travels through the optic window of the AODs, the laser poweris rapidly decreased at the voxel of origin and increased at the des-tination voxel, eliminating undesired illumination of the voxels onthe trajectory (Fig. 1B and C). Switching the illumination betweenany two points takes nominally 6.5 �s. However, it takes only 4 �sto redirect more than 90% of the beam power (<1% of the excitation
remaining at the point of origin). By setting the right lag betweenthe AOD command output and the onset of signal integration, anoperational scan rate of 250,000 Hz (Supplementary data) can beobtained.National Instrument boards programmed under Labview wereused to implement digital scanning strategies and to synchro-nize AOD scanning and photon detection (see Section 2). Twotypes of user interfaces were implemented. In the imaging mode,large numbers of voxels are excited sequentially and an image isreconstructed. In its simplest form, full images can be acquired byperforming a regular raster scan (Fig. 1D) with a minimal increment(pixel size) of 0.125 �m. However, in contrast with mirror-scanningmicroscopes (Tan et al., 1999), complex shapes can be selected. Anextreme example is displayed in Fig. 1C, POIs were selected ona morphological image by thresholding, excluding high and low-intensity points. This strategy can be used to map large regionsof the imaged neurons with single-spine resolution and optimizedframe rates while preserving good signal levels. In the random-access mode (Bullen et al., 1997), a sequence composed of a smallnumber of manually selected points of interest (POI) is sampledrepetitively (Fig. 1B) and the signal for each location is displayed

cience
Y. Otsu et al. / Journal of Neurosonline as a continuous or episodic recording. Frame rates of 1 kHzare commonly obtained (for a dwell time of 16 �s and a pattern of50 points).
3.2. Optimisation of the spatial resolution and sensitivity ofRAMP microscopy
To increase the sensitivity of our microscope we optimized thefluorescence detection configuration. To this end, we used collec-tion optics of large effective angular acceptance (Oheim et al., 2001)in a trans-fluorescence arrangement (Mainen et al., 1999), i.e. an oil-immersion condenser (U-AAC, 1.4 NA; Olympus) and a relay lens L3(Fig. 1A; diameter 100 mm, focal length 135 mm) covering a field ofview of 3 mm. A second lens (Fig. 1A; diameter 25 mm, focal length25.4 mm) focalises the fluorescence photons on the photocathodeof a cooled AsGaP photomultiplier (H7421-40, Hamamatsu) thatcombines 30% quantum efficiency and 100 Hz dark count. Mostimportantly, fast photon counting (maximum counter frequency80 MHz, paired-pulse delay 20 ns) allowed us to work at the shotnoise limit with good linearity up to 10 MHz. As shown below, opti-mal sensitivity is a key step to implement long-duration opticalrecordings at high frame rate with limited photodamage.
Fast physiological optical signals with large dynamics, that canbe used for high-speed optical recordings, occur in micrometriccompartments within the neurites. Unfortunately, acousto-opticdeflection of femtosecond laser pulses produces a chromatic angu-lar dispersion of the laser beam (Iyer et al., 2003; Salomé et al.,2006), leading to a dramatic loss of spatial resolution. Variousprecompensation configurations have been proposed to reduceAOD’s chromatic dispersion and temporal chirp with 100 fs laserpulses (Iyer et al., 2003; Lechleiter et al., 2002; Reddy and Saggau,2005; Salomé et al., 2006; Zeng et al., 2006, 2007). Alterna-tively longer laser pulses, which will be less distorted because oftheir narrower spectral bandwidth (Supplementary data), couldbe used to mitigate AOD-induced distortions (Iyer et al., 2006).This second solution appears best for our purpose, as photodamageduring repetitive high-frequency illumination may follow a supra-quadratic rule (Hopt and Neher, 2001) and will thus decrease withlonger pulses and larger focal volumes.
A picosecond laser has been used successfully to implementAOD-based RAMP microscopy (Iyer et al., 2006), but in this workthe pulse duration that optimizes the excitation efficiency and thespatial resolution has not been characterized. We utilized a tun-able laser (Tsunami equipped with an intracavity Gire-Tournois
interferometer; Spectraphysics) to characterize the point-spreadfunction (PSF) of the microscope at laser bandwidth (��) rang-ing from 1.5 nm (∼700 fs) to 5 nm (∼220 fs) (Fig. 2A). Due to thechromatic dispersion (Supplementary data) the cross-section of thePSF at the plane of highest intensity is an ellipse elongated alongthe diagonal between the scan axes. Indeed the short, long andZ axes of the PSF were measured by fitting Gaussian functions tothe intensity profiles (Fig. 2A). The long axis FWHM varied withthe laser pulse width in agreement with the theoretical predic-tions (Supplementary data), decreasing to 0.84 ± 0.05 �m (n = 7) for1.5 nm pulses (Fig. 2B). The short axis and Z axis FWHM remainedconstant at 0.44 ± 0.03 �m (n = 7) and 2.6 ± 0.05 �m (n = 7), respec-tively (Fig. 2B). Smaller PSFs will produce a brighter two-photonfluorescence signal, because the peak laser intensity at the centerincreases. However, this beneficial effect will be counteracted bythe detrimental consequence of pulse lengthening on the averagesquared laser power. Theoretical calculations predict an opti-mal chromatic bandwidth (Fig. 2C and Supplementary data). Asexpected, the excitation efficiency increased with pulses of lowerchromaticity and reached a plateau for a chromatic width close to1.5 nm, corresponding to 700 fs pulses (Fig. 2C). At this setting, theMethods 173 (2008) 259–270 263
excitation efficiency is about 10 times lower than that of standardmicroscope using diffraction-limited galvanometric scanning and130 fs laser pulses. All subsequent experiments were performedwith this setting.
3.3. Mapping dendritic calcium transients with single-spineresolution
The dimensions of the focal spot obtained with subpicosecondpulses may impede recordings from small subcellular compart-ments like spine heads. In order to test the ability of our microscopeto resolve signals coming from adjacent subcellular compart-ments, we followed calcium transients (Fig. 3A–D) in spines andshafts throughout the dendritic tree of cerebellar Purkinje cells,which have very densely packed spines. Purkinje cells were loadedwith the calcium dye Fluo-4 (200 �M) and the morphological dyeAlexa594 (10–20 �M), which was used to acquire a full-resolutionimage. Random-access recordings were performed from pointsof interest placed on spines heads and attached dendritic shafts(Fig. 3B). Optical transients were subsequently monitored quasi-simultaneously in 30–80 spines and dendrites at frame rates of0.5–1.5 kHz (dwell time 20–50 �s). Upon electrical stimulation ofthe climbing fiber afferent, complex spike-associated fluorescencetransients (Fig. 3B) were recorded in all individual spines and den-drites. As shown in Fig. 3C and D, the rising phase of the fluorescencetransients (time to peak 9 ± 0.4 ms as measured from the firstsodium spike of the complex spike; 6 cells, 89 spines) was resolvedat all sites of recording.
The amplitude and decay of the calcium transients were com-pared in spines and dendrites (Fig. 3C and D). Climbing fiberstimulation evoked a much larger �F/F calcium transient sig-nal in spines (350 ± 15%; n = 70, 5 cells) than in spiny branchlets(106 ± 5%; n = 42, 5 cells; p < 0.001) or aspiny dendritic trunks(101 ± 7%; n = 29, 5 cells, p < 0.001). Calcium transients in spinesand dendrites exhibited biphasic decays. Fast decay time constantswere not significantly different in spines (14.2 ± 0.5 ms) in spinybranchlets (13.8 ± 0.6 ms, p = 0.67) and in large aspiny dendrites(14.8 ± 1.0 ms, p = 0.84), as previously reported for the equilibra-tion of calcium binding to endogenous buffer molecules (Schmidtet al., 2003). However, the fast component �F/F was slightly butsignificantly (p < 0.001) larger in spines (65.7 ± 0.9%) than in spinybranchlets (56.6 ± 1.4%) or in the main dendrites (59.1 ± 1.4%).For the slow decay, the time course of the signal recorded fromspines (186 ± 6 ms) was faster than the decay in the dendrites
(285 ± 13 ms, n = 71; p < 0.001), in agreement with a higher calciumextrusion capacity of spines (Yuste et al., 2000). The differentialproperty of calcium transients in spines and dendrites confirms thatwe can resolve spatially one compartment from the other. Whilesimilar results can be obtained at small sets of spines with linescans, RAMP microscopy permits high throughput mapping of den-dritic heterogeneity at high spatial and temporal resolution (Dianaet al., 2007; Iyer et al., 2006).3.4. Assessing photodamage during high frame rate opticalmultiunit recordings
The technical capacity to perform multiunit optical recordingsat high frame rate is a prerequisite to follow neural networksdynamics, but does not guarantee that the biological sample canwithstand prolonged illumination. High repetition rates (1 kHz typ-ically) used in line-scan protocols have been shown to producecumulative photodamage (Hopt and Neher, 2001; Koester et al.,1999; Yasuda et al., 2004) associated with an increase in basalfluorescence and a decrease in physiological calcium transients.To quantify the maximum illumination regime compatible with

264 Y. Otsu et al. / Journal of Neuroscience Methods 173 (2008) 259–270
rkinjetitivelings oer tra
tratincanneanel:
Fig. 3. Simultaneous high frame rate optical recordings of calcium transients in Pucells were recorded in current-clamp while their climbing fiber was stimulated repedisplayed in B and D, respectively. (B) Upper traces display averaged optical recordstimulation of the climbing fiber. A representative complex spike is shown in the lowbars: 40 mV, 100% �F/F and 100 ms. (C) Same recordings at a faster timescale, illusrecordings at six pairs of spines and dendrites out of a total of 33 POIs that were stransients are larger and faster in spines than in dendrites. Scale bar in the central p
prolonged recordings, we performed 10 min continuous multisiteimaging sessions on Purkinje cell dendrites. At high laser power,the Fluo-4 signal increased rapidly and supra-linearly over min-utes, leading to noisy spontaneous fluorescence transients (Fig. 4A).This supra-linear behavior was associated with the emergence ofbright fluorescent spots around the imaged point (Fig. 4A) when afull-frame image was taken after the continuous imaging session.These bright spots were not observed for the morphological dye
(Fig. 4A, red) at the end of the recordings, suggesting that Fluo-4fluorescence increase might correspond to membrane breakdownleading to sustained local calcium entry. A photodamage index (PI)was calculated for each recording session of 10 min (see Section2). Photodamage has been shown to depend quadratically (Koesteret al., 1999) or even supra-quadratically (Hopt and Neher, 2001)on laser power. With 700 fs laser pulses and degraded focal pointquadratic damage should predominate (Koester et al., 1999) and wetherefore expressed laser power as its averaged squared value perpoint. However, at high laser power the PI correlated supra-linearlyto the mean squared laser power per point (Fig. 4B). This indicatesthat cumulative photodamage during prolonged illumination maydisplay a higher order dependance over laser power.At laser power below 12 mW2 per point, supra-linear fluores-cence increase was no longer observed but the fluorescence signaleventually displayed a slow linear increase over time. In many casesthe PI of the population of points in individual recording sessionswas not significantly different from zero (Fig. 4C). At these low illu-mination regimes, the mean fluorescence increase was correlatedwith the squared laser power per point (slope 0.09% min−1 mW−2;p = 0.02, weighted linear regression) (Fig. 4C). This was true inde-
cell spines and dendrites. (A) Diagram of the experimental configuration. Purkinjey. Field of view: 100 �m. The red square and the white rectangle indicate the regionsf the fluorescence transients evoked in a spine head and its attached dendrite by
ce. Optical traces represent the average of 35 stimulations. Inset 5 �m × 5 �m. Scaleg the high frame rate of RAMP microscopy. Horizontal scale bar: 10 ms. (D) Opticald simultaneously at a frame rate of 0.96 kHz in the same cell as in A. Fluorescence10 �m. Insets 5 �m × 5 �m. Scale bars in the boxes: same as in B and C.
pendantly of the total number of points of interest and of therepetition rate (Fig. 4C). This indicates that repetition rate by itself,and thus sample heating for example, is not a relevant factor forphotodamage in this regime. Rather, the value of 12 mW2 per pointappears as an upper limit for two-photon illumination. Becauseof the supra-quadratic nature of cumulative photodamage at highframe rate, shorter laser pulse or better focal points (as used inmirror-scanning two-photon microscopy) would probably make
things worse and therefore reduce the maximum fluorescence yieldat permissive laser power.To exclude functional photodamage, that could remain unde-tectable in the basal fluorescence signal, we verified thatcontinuous imaging was not associated with a time-dependantalteration of calcium transients. Climbing fiber evoked calciumtransients were recorded in Purkinje cells during continuous mul-tisite imaging sessions at a frame rate of 0.5–2 kHz and at a laserpower close to 10 mW2 per point (Fig. 5). The signal averaged fromall the POIs is shown in Fig. 5B and C. Neither the amplitude northe decay time course of the transients did change during thecourse of the recording. In a series of similar experiments (n = 7cells; 180 recording sites) transients were compared at the begin-ning of the recording and after 294 ± 23 s (Fig. 5D). The amplitudeof the transients and the basal fluorescence did not change sig-nificantly (87 ± 9%, p = 0.06; 92 ± 7%, p = 0.24; n = 7; Wilcoxon test),demonstrating the mechanical stability of the preparation. In addi-tion, the �F/F ratio remained stable over time at 96 ± 5% of itsinitial value (p = 0.6; Wilcoxon test). Given the 400 mW output ofour laser, recordings could be performed down to about 200 �m indepth.

Y. Otsu et al. / Journal of Neuroscience Methods 173 (2008) 259–270 265
Fig. 4. Photodamage quantification during long-duration recordings. (A) Illustration of tPurkinje cell dendrites with excessive laser power. The Purkinje cell was filled with 15recording sites. Note the supra-linear increase in Fluo-4 fluorescence with time at locaDependence of the increase in the Fluo-4 signal, measured at the end of 10 min recordingexperiment defines the repetition rate and is color-coded. The arrow points to the experimincrease is linearly related to the squared laser power per point in the region of low laser
3.5. Continuous optical monitoring of climbing fiber transients
The inocuous power threshold of 12 mW2 per point defines themaximal signal-to-noise achievable during continuous recordings.At this excitation power a calcium-saturated solution of 100 �MFluo-4 yields a photon count of 92 photons per pixel for a framerate of 1 kHz. This value corresponds to a signal-to-shot-noise ratioof 9.6 that would constitute a maximum for kHz continuous mul-
Fig. 5. Stability of the physiological calcium transients during high frame rate continuousand dendrites of a Purkinje cell were repetitively scanned at 0.62 kHz while the climbing fibtransients averaged from all 30 POIs during 3 min of continuous optical monitoring. (C) Fluof the optical transients parameters at the beginning and at the end of long optical record
he photodamage produced by 10 min continuous optical recordings of secondary�M Alexa 594 (red signal) and 200 �M Fluo-4 (green signal). Arrows indicate thetions 2 and 3. Dashed lines represent the zero photon level. Scale bar: 3 �m. (B)sessions on the average squared laser power per point. The number of POIs in eachent illustrated in A. (C) Enlargement of the graph in B showing that the fluorescencepower (slope 0.09% min−1 mW−2; p = 0.02).
tiphoton recordings with this dye. We thus assessed if climbingfiber evoked fluorescence transients obtained from single pointsof interest (Fig. 6A) were large enough to permit the detection ofclimbing fiber activity and, if so, with which temporal precision. Asshown in Fig. 6C climbing fiber evoked transients could be identi-fied visually in the unfiltered recordings. However, the maximumphoton count at the peak did not permit a reliable discriminationfrom the basal shot noise. Optical signals were thus box-filtered
recordings. (A) Recording configuration. 30 points of interest placed on the spineser was stimulated every 3 s. (B) Plot of the normalized amplitude of the fluorescenceorescence transients at the beginning and at the end of the recording. (D) Summaryings in 7 Purkinje cells.

266 Y. Otsu et al. / Journal of Neuroscience Methods 173 (2008) 259–270
stratiulateddurin
e phophotonifica
lored c
Fig. 6. Detection of climbing fiber events in continuous optical recordings. (A) Illuthe same Purkinje cell dendritic branchlet. The climbing fiber was electrically stimsignal-to-noise ratio. (B) Distribution of the photon count level of the filtered tracerepresent the expected Poisson distribution of pure shot noise for the same averagthe photon count level for a statistical significance of 1 event every 10 s (3.8 and 3.2shown in A. (D) Same as in C after 5 points box filtering. Dashed lines are set at the sigfiber stimulation and the time at which the optical signal crossed the threshold (coand 6.2 ms (lower graph) and exponential rates of 1.3 ms and 1.8 ms.
over approximately 8 ms, to match the rise time of fluorescencetransients and optimize the signal-to-noise ratio (5 points filter inFig. 6A and D). To assess the significance of fluorescence transients,the amplitude distribution of the basal fluorescence collected dur-ing 25 s was computed (Fig. 6B). As expected for photon-countingdetection, the noise was described by a Poisson distribution (Fig. 6B)allowing to define statistical significance levels for threshold detec-tion of fluorescence transients (Fig. 6B and D). Using a statisticalthreshold of 1 spurious event every 10 s (6170 frames), 41% of thePOIs (n = 29) displayed large enough transients to detect climbingfiber activity with a reliability superior to 90% (54 out of 60 climb-ing fiber stimulations detected). The average efficiency for these
points was 94 ± 3% (n = 12 points and 60 climbing fiber stimulationsper point). The mean lag from the time of electrical stimulationto threshold-crossing was 6.4 ± 1.6 ms (n = 12), similar to the lagfor the peak of the averaged calcium transient over trials at eachPOI (7.2 ± 0.4 ms). Most importantly the jitter for the detection was3.8 ± 1.4 ms (n = 12), about one order of magnitude lower than whatcan be deduced from video rate imaging.3.6. Optical monitoring of millisecond synchrony in AM-loadedneocortical networks
In the previous experiments, cells were filled with calcium dyeconcentrations higher than the ones generally achieved with bulkloading. Because Purkinje cells do not load efficiently, we imple-mented bulk-loading protocols in cortical slices. In a first step,pyramidal cells of the primary sensory-motor cortex were loadedin the whole-cell configuration with a morphological dye and lowconcentrations (30 �M) of a calcium dye, either Fluo-4 or Fluo-5F,to assess the nature and amplitude of the dendritic fluorescencetransients (Fig. 7). Pyramidal cells did not fire at rest but depolar-izing current steps triggered an early spike followed by tonic firing
on of the continuous optical signal recorded from two spines (out of 31 POIs) onevery 3 s (arrowheads). Traces have been box-filtered on 5 points to increase the
g 25 s of baseline recording without climbing fiber stimulation (dots). Plain curveston count (1.38 for the red spine and 1.08 for the blue spine). Dotted lines indicatens). (C) Example of the raw unfiltered signal for the first climbing fiber stimulationnce level defined in B. (E) Cumulative histograms of the delay between the climbingurves). Data are fitted by sigmoids (black lines) with means of 5.2 ms (upper graph)
of several spikes on top of a depolarized plateau. The first spike didnot always evoke calcium transients in the oblique dendrites (Fig. 7)suggesting that it does not always back-propagates in this part ofthe dendritic tree. The following spikes invaded the proximal api-cal and oblique dendrites, where they evoked large and fast-risingcalcium transients, in agreement with previous in vitro and in vivodata. As shown in Fig. 7B these transients were large enough to bedetected at individual recording sites. Thus, single spikes can bedetected in the proximal apical and oblique dendrites of pyramidalcell during continuous RAMP recordings.
We then performed RAMP recordings in populations of AM-loaded pyramidal neurons in situ. To be able to record from
dendrites, where optical signals are faster and bigger, we developeda mixed bulk loading protocol including a calcium dye (Fluo-4 orFluo-5F-AM) and a morphological dye (calcein orange-AM) (Sec-tion 2 and Fig. 8A). Following bulk loading in cortical layer V,individual pyramidal cell dendrites that displayed calcein fluores-cence could be followed into layer II/III (Fig. 8B). Bath applicationof gabazine (0.5–5 �M) to neocortical slices, alone or in combi-nation with kainate (0.5–1 �M), triggered the gradual onset ofepileptiform activity that was composed of short interictal bursts ofaction potentials and of ictal discharges. Pharmacologically inducedepileptiform activity evoked fluorescence transients in 50% of theimaged cells (Badea et al., 2001). The transients amplitude waslarger in the dendrites (41 ± 7%, �F/F, n = 11, 4 slices) than inthe soma (18 ± 3%, �F/F, n = 5, 1 slice). They rose in 19 ± 6 ms(20–80%; n = 11, 4 slices), and decayed with variable time constants(390 ± 110 ms; Fig. 8C).We found that 100% of the calcium transients recorded in pop-ulations of bulk-loaded cells (n = 280) occurred at the same time asinterictal and ictal bursts in nearby cells recorded electrophysiolog-ically (Fig. 8C; n = 5), suggesting that stable populations of neuronsparticipate to each epileptiform event in the slice. The time of onset

Y. Otsu et al. / Journal of Neuroscience Methods 173 (2008) 259–270 267
midalded wischahe PO
Fig. 7. Spike-associated calcium transients in the apical dendrites of layer V pyradendrite of a layer V pyramidal cell recorded in the whole-cell configuration and loaB. (B) Upper trace: a depolarizing current step triggered an early spike and a tonic dtransients recorded at the POIs for the single trial shown. (C) Average signal for all t
of the spike-triggered averages of the dendritic calcium transients
(Fig. 8D) was calculated by template fitting (Section 2 and Fig. 8E).The lag between the first spike of the electrophysiological recordingand the onset of the optical signal was 5.6 ± 1.5 ms (n = 6 dendrites).This lag may be due to the inability of the first spikes in the burst toback-propagate into the apical dendrites (see Fig. 7). These resultsfavor a synaptic origin of interictal bursts in this model (de la Pridaet al., 2006) over an astrocytic origin (Tian et al., 2005), which wouldinvolve lower level of synchrony and repeatability.To quantify optical recordings independently of the electrophys-iological signal, individual optical transients were detected on thefiltered signal, as for Purkinje cells, and their time of onset wasdetermined by template fitting of the raw signal (see Section 2).The lag of the single-event optical signal onset relative to the elec-trophysiology was 6 ± 12 ms (mean ± S.D.; 280 transients, 19 cells,5 experiments). Furthermore, the averaged lag of individual tran-sients in each cell was not significantly different from the lag of theaveraged signal for that cell (1 ± 1 ms, n = 19, p = 0.24; Wilcoxon test)(Fig. 6F). Thus, RAMP microscopy, while enabling long-durationoptical recordings at high frame rate in situ, is well suited to resolvespike patterns in neuronal networks with single-cell and millisec-ond precision.
neurons. (A) Single plane image of the apical dendrite and of a proximal obliqueith Fluo4 (30 �M). Red dots indicate the POIs for the optical recordings displayed inrge of additional spikes on top of a depolarized plateau. Lower traces: fluorescenceIs in B. Note that the first spike does not propagate in this part of the dendrites.
4. Discussion
We have combined two-axis acousto-optic deflection of asubpicosecond pulsed laser and high-sensitivity photon-countingdetection to produce a digital RAMP laser-scanning microscope.This device can address up to 250 000 voxels per second in anyspatial and temporal pattern. We demonstrate that continuousmultiunit optical recordings can be performed during tens of min-utes at kHz frame rate with this instrument. As a result, RAMPmicroscopy can reveal the dynamics of neural network activity withmillisecond precision.
The illumination pattern optimization obtained with RAMPmicroscopy distinguishes this technique from previous develop-ments aimed at increasing the temporal resolution of multiphotonmicroscopy, like the use of fast resonant galvanometers (Fan et al.,1999), of single axis AODs (Lechleiter et al., 2002), or the simulta-neous illumination of multiple focal points (Straub et al., 2000).Random-access with two-axis AOD scanning was first proposedfor single photon laser-scanning microscopy (Bullen et al., 1997)and was implemented recently for fast multipoint UV uncaging(Shoham et al., 2005). The technical complications encounteredwhen combining AODs and femtosecond lasers have slowed the

268 Y. Otsu et al. / Journal of Neuroscience Methods 173 (2008) 259–270
Fig. 8. Optical monitoring of pyramidal cell synchrony during epileptiform activity. (A) Dsomato-sensory cortex were loaded by pressure ejection of the AM forms of the calcium dperformed on one of the loaded cells. (B) The apical dendrites of 7 pyramidal cells were folsites. Field of view: 100 �m. (C) Upper trace: pharmacologically induced epileptiform activtraces: color-coded fluorescence signals recorded in the dendrites displayed in B. Opticalelectrophysiological recording. Scale bars: 100% �F/F and 5 s. (D) The optical transients rSuccessive transients were aligned on the first action potential of the bursts and averagered was fitted to the data to detect the time of onset of the optical transients. Scale barstransients recorded in the different dendrites, relative to the first action potential in the bof onset of the averaged transients displayed in D.
application of AOD scanning to multiphoton microscopy (Iyer etal., 2006, 2003; Lechleiter et al., 2002; Roorda et al., 2004; Saloméet al., 2006; Zeng et al., 2007). We show here that the use of 700 fspulses optimizes the excitation efficacy of RAMP microscopy whilepreserving a submicrometric resolution. This strategy allowed usto use a much simpler optical design than the ones proposed forprecompensation schemes. Furthermore we confirm that photo-damage can follow a supra-quadratic law at high excitation powerand argue that subpicosecond pulses are better suited than 100 fs
iagram of the experimental configuration. Pyramidal cells in layer V of the primaryye Fluo-5F and of the morphological dye Calcein orange. A whole-cell recording waslowed in layer II–III and selected for optical recording. Points indicate the recordingity recorded in the dendrite indicated by a white arrow in B. Scale bar 20 mV. Lower
transients are synchronous with the occurrence of bursts of action potentials in theecorded in the different pyramidal cells are synchronous at the millisecond scale.d. Scale bars: 20 mV, 20% �F/F and 100 ms. (E) The template function displayed in20 mV, 20% �F/F and 40 ms (F) Distribution of the onset values for the individualursts. Dotted lines indicate the mean of the distribution and arrowheads the time
pulses to yield stable optical recordings at high frame rates. Theresulting power at the focal point was not limiting in our slices(for an output laser power of 400 mW), given the excitation inten-sity compatible with continuous recordings at high repetition rates.However, the use of subpicosecond pulses would be limiting forsome applications, like uncaging or photobleaching, that require ahigh excitation power and small focal volumes. In this case prec-ompensation methods should be used to correct for the dispersionof the laser pulse by AODs (Iyer et al., 2006, 2003; Kremer et al.,

cience
Y. Otsu et al. / Journal of Neuros2008; Lechleiter et al., 2002; Reddy and Saggau, 2005; Salomé etal., 2006; Zeng et al., 2006, 2007).
Imaging experiments have been central to the demonstrationthat the elaborate dendritic tree of neurons is endowed with sub-stantial computational power and presents many levels of spatialspecialization (London and Hausser, 2005). In particular morpho-logical and functional differences between spines of the sameneuron were linked to their position in the dendritic arbor, to thespecific afferences they receive or to the potentiation state of thesynapse (Segal, 2005; Yuste et al., 2000). With conventional line-scanning devices data must be collected sequentially from singlespines over many recording sessions. We show here that RAMPmicroscopy provides a way to perform high throughput samplingof spines and dendrites and to obtain maps of dendritic calciumtransients with single-spine resolution within a single experiment(Iyer et al., 2006).
Optical recordings of network activity are much more demand-ing than functional mapping in terms of signal-to-noise ratio (SNR)because protocols cannot be repeated to generate averaged signals.Spatial averaging has been used to increase the SNR of opti-cal recordings. When performed with laser-scanning microscopes,spatial averaging has several drawbacks. Firstly, it requires theacquisition of complete images thus constraining frame rates to thevideo range (Kerr et al., 2005; Ohki et al., 2005; Sullivan et al., 2005).In contrast random-access microscopy optimizes the illuminationpattern, preserving kHz frame rates while keeping photobleach-ing at undetectable levels. Secondly, spatial averaging reduces thedynamic range of the signals. Indeed, because of the small dwelltime per pixel in large images, signal has to be averaged over largeareas. These correspond generally to the cross-sections of the cellbodies and large dendrites with the focal plane. Because of the lowsurface to volume ratio in these regions of the cells, calcium signalsare generally much slower and smaller than in distal dendrites.In this study we confirm, by recording from Purkinje cell den-drites, that the quality of optical transients detection varies highlybetween loci. Recent in vivo recordings of bulk-loaded neocortexhave revealed that most of the fluorescence signal comes from theneuropile (Kerr et al., 2005), probably from the axons. As shown inFig. 8, RAMP microscopy is perfectly adapted to record from sparsedye-loaded neurites in the neuropile, like individual axons and den-drites at a distance from their cell bodies, offering a new way toimprove the SNR in optical recordings of neuronal activity.
Infusion with AM dyes results in the massive loading of allthe neuropile and the signal from individual neurites cannot be
resolved. Bulk-loaded neurites cannot be followed far from the siteof injection when using calcium dyes with low resting fluores-cence, that offer the best dynamics. To overcome this difficulty wehave developed a double staining procedure that combines mor-phological and calcium dye loading (see Section 2). Alternatively,novel methods of electroporation could be used (Nagayama et al.,2007; Nevian and Helmchen, 2007) to implement sparse loading.We show here that short high-frequency bursts of spike can bedetected in pyramidal cells of the neocortex and in Purkinje cellswith a precision of 3 ms. Overall the temporal precision of digitalRAMP recordings is no longer limited by the imaging technology butdepends crucially on the amplitude and speed of the fluorescencetransients. These parameters should improve with better loadingprocedures and fluorescent reporters. The development of digitalRAMP microscopy constitutes a promising step towards the opticalmonitoring of neural networks at high temporal resolution.Acknowledgements
This project was funded by HFSP (RGP60/2003) and supportedby the CNRS, INSERM, Ecole Normale Supérieure, FRM (to Y.O.) and
Methods 173 (2008) 259–270 269
Région Ile de France (Convention E. 1762). We thank J. Eilers, L. Bour-dieu and R. Yuste for help and discussions throughout the projectand C. Léna, P. Isope, E. Schwartz and B. Barbour for discussion andcomments on the manuscript.
Appendix A. Supplementary data
Supplementary data associated with this article can be found,in the online version, at doi:10.1016/j.jneumeth.2008.06.015.
References
Badea T, Goldberg J, Mao B, Yuste R. Calcium imaging of epileptiform events withsingle-cell resolution. J Neurobiol 2001;48:215–27.
Brecht M, Fee MS, Garaschuk O, Helmchen F, Margrie TW, Svoboda K, et al. Novelapproaches to monitor and manipulate single neurons in vivo. J Neurosci2004;24:9223–7.
Bullen A, Patel SS, Saggau P. High-speed, random-access fluorescence microscopy: I.High-resolution optical recording with voltage-sensitive dyes and ion indicators.Biophys J 1997;73:477–91.
Cossart R, Aronov D, Yuste R. Attractor dynamics of network UP states in the neo-cortex. Nature 2003;423:283–8.
Crepel V, Aronov D, Jorquera I, Represa A, Ben-Ari Y, Cossart R. A parturition-associated nonsynaptic coherent activity pattern in the developing hippocam-pus. Neuron 2007;54:105–20.
de la Prida LM, Huberfeld G, Cohen I, Miles R. Threshold behavior in the initiation ofhippocampal population bursts. Neuron 2006;49:131–42.
Denk W, Delaney KR, Gelperin A, Kleinfeld D, Strowbridge BW, Tank DW, et al.Anatomical and functional imaging of neurons using 2-photon laser scanningmicroscopy. J Neurosci Methods 1994;54:151–62.
Denk W, Strickler JH, Webb WW. Two-photon laser scanning fluorescencemicroscopy. Science 1990;248:73–6.
Diana MA, Otsu Y, Maton G, Collin T, Chat M, Dieudonne S. T-type and L-type Ca2+ con-ductances define and encode the bimodal firing pattern of vestibulocerebellarunipolar brush cells. J Neurosci 2007;27:3823–38.
Diez-Garcia J, Matsushita S, Mutoh H, Nakai J, Ohkura M, Yokoyama J, et al. Acti-vation of cerebellar parallel fibers monitored in transgenic mice expressing afluorescent Ca2+ indicator protein. Eur J Neurosci 2005;22:627–35.
Dugue GP, Dumoulin A, Triller A, Dieudonne S. Target-dependent use of co-releasedinhibitory transmitters at central synapses. J Neurosci 2005;25:6490–8.
Fan GY, Fujisaki H, Miyawaki A, Tsay RK, Tsien RY, Ellisman MH. Video-rate scan-ning two-photon excitation fluorescence microscopy and ratio imaging withcameleons. Biophys J 1999;76:2412–20.
Garaschuk O, Milos RI, Grienberger C, Marandi N, Adelsberger H, Konnerth A. Opticalmonitoring of brain function in vivo: from neurons to networks. Pflugers Arch2006;453:385–96.
Gobel W, Kampa BM, Helmchen F. Imaging cellular network dynamics in threedimensions using fast 3D laser scanning. Nat Methods 2007;4:73–9.
Hasan MT, Friedrich RW, Euler T, Larkum ME, Giese G, Both M, et al. Functionalfluorescent Ca2+ indicator proteins in transgenic mice under TET control. PLoSBiol 2004;2:e163.
Heim N, Garaschuk O, Friedrich MW, Mank M, Milos RI, Kovalchuk Y, et al. Improvedcalcium imaging in transgenic mice expressing a troponin C-based biosensor.
Nat Methods 2007;4:127–9.Hell SW, Andresen V. Space-multiplexed multifocal nonlinear microscopy. J Microsc2001;202:457–63.
Helmchen F, Denk W. Deep tissue two-photon microscopy. Nat Methods2005;2:932–40.
Hopt A, Neher E. Highly nonlinear photodamage in two-photon fluorescencemicroscopy. Biophys J 2001;80:2029–36.
Ikegaya Y, Aaron G, Cossart R, Aronov D, Lampl I, Ferster D, et al. Synfire chains andcortical songs: temporal modules of cortical activity. Science 2004;304:559–64.
Iyer V, Hoogland TM, Saggau P. Fast functional imaging of single neu-rons using random-access multiphoton (RAMP) microscopy. J Neurophysiol2006;95:535–45.
Iyer V, Losavio BE, Saggau P. Compensation of spatial and temporal disper-sion for acousto-optic multiphoton laser-scanning microscopy. J Biomed Opt2003;8:460–71.
Kerr JN, Greenberg D, Helmchen F. Imaging input and output of neocortical networksin vivo. Proc Natl Acad Sci USA 2005;102:14063–8.
Koester HJ, Baur D, Uhl R, Hell SW. Ca2+ fluorescence imaging with pico-and femtosecond two-photon excitation: signal and photodamage. Biophys J1999;77:2226–36.
Kremer Y, Léger JF, Lapole R, Honnorat N, Candela Y, Dieudonné S, BourdieuL. A spatio-temporally compensated acousto-optic scanner for two-photonmicroscopy providing large field of view. Opt Express 2008;16(14):10066–76.
Lechleiter JD, Lin DT, Sieneart I. Multi-photon laser scanning microscopy using anacoustic optical deflector. Biophys J 2002;83:2292–9.
London M, Hausser M. Dendritic computation. Annu Rev Neurosci 2005;28:503–32.Mainen ZF, Maletic-Savatic M, Shi SH, Hayashi Y, Malinow R, Svoboda K. Two-photon
imaging in living brain slices. Methods 1999;18(231-9):181.

cience
of neuronal networks. Proc Natl Acad Sci USA 2003;100:7319–24.
270 Y. Otsu et al. / Journal of Neuros
Mao BQ, Hamzei-Sichani F, Aronov D, Froemke RC, Yuste R. Dynamics of spontaneousactivity in neocortical slices. Neuron 2001;32:883–98.
Nagayama S, Zeng S, Xiong W, Fletcher ML, Masurkar AV, Davis DJ, et al. In vivosimultaneous tracing and Ca(2+) imaging of local neuronal circuits. Neuron
2007;53:789–803.Nevian T, Helmchen F. Calcium indicator loading of neurons using single-cell elec-troporation. Pflugers Arch 2007;454:675–88.
Nimmerjahn A, Kirchhoff F, Kerr JN. Helmchen F. Sulforhodamine 101 as a specificmarker of astroglia in the neocortex in vivo. Nat Methods 2004;1:31–7.
Oheim M, Beaurepaire E, Chaigneau E, Mertz J, Charpak S. Two-photon microscopyin brain tissue: parameters influencing the imaging depth. J Neurosci Methods2001;111:29–37.
Ohki K, Chung S, Ch’ng YH, Kara P, Reid RC. Functional imaging with cel-lular resolution reveals precise micro-architecture in visual cortex. Nature2005;433:597–603.
Peterlin ZA, Kozloski J, Mao BQ, Tsiola A, Yuste R. Optical probing of neuronal circuitswith calcium indicators. Proc Natl Acad Sci USA 2000;97:3619–24.
Reddy GD, Saggau P. Fast three-dimensional laser scanning scheme using acousto-optic deflectors. J Biomed Opt 2005;10:64038.
Roorda RD, Hohl TM, Toledo-Crow R, Miesenbock G. Video-rate nonlinearmicroscopy of neuronal membrane dynamics with genetically encoded probes.J Neurophysiol 2004;92:609–21.
Salomé R, Kremer Y, Dieudonné S, Léger JF, Krichevsky O, Wyart C, et al. Ultrafastrandom-access scanning in two-photon microscopy using acousto-optic deflec-tors. J Neurosci Methods 2006;154:161–74.
Schmidt H, Stiefel KM, Racay P, Schwaller B, Eilers J. Mutational analysis of dendriticCa2+ kinetics in rodent Purkinje cells: role of parvalbumin and calbindin D28k.J Physiol 2003;551:13–32.
Segal M. Dendritic spines and long-term plasticity. Nat Rev Neurosci 2005;6:277–84.Shoham S, O’Connor DH, Sarkisov DV, Wang SS. Rapid neurotransmitter uncaging in
spatially defined patterns. Nat Methods 2005;2:837–43.
Methods 173 (2008) 259–270
Smetters D, Majewska A, Yuste R. Detecting action potentials in neuronal populationswith calcium imaging. Methods 1999;18:215–21.
Stosiek C, Garaschuk O, Holthoff K, Konnerth A. In vivo two-photon calcium imaging
Straub M, Lodemann P, Holroyd P, Jahn R, Hell SW. Live cell imaging by multifocalmultiphoton microscopy. Eur J Cell Biol 2000;79:726–34.
Sullivan MR, Nimmerjahn A, Sarkisov DV, Helmchen F, Wang SS. In vivo cal-cium imaging of circuit activity in cerebellar cortex. J Neurophysiol 2005;94:1636–44.
Tan YP, Llano I, Hopt A, Wurriehausen F, Neher E. Fast scanning and effi-cient photodetection in a simple two-photon microscope. J Neurosci Methods1999;92:123–35.
Tian GF, Azmi H, Takano T, Xu Q, Peng W, Lin J, et al. An astrocytic basis of epilepsy.Nat Med 2005;11:973–81.
Vucinic D, Sejnowski TJ. A compact multiphoton 3D imaging system for recordingfast neuronal activity. PLoS ONE 2007;2:e699.
Yaksi E, Friedrich RW. Reconstruction of firing rate changes across neuronal pop-ulations by temporally deconvolved Ca(2+) imaging. Nat Methods 2006;3:377–83.
Yasuda R, Nimchinsky EA, Scheuss V, Pologruto TA, Oertner TG, Sabatini BL, et al.Imaging calcium concentration dynamics in small neuronal compartments. SciSTKE 2004:15.
Yuste R, Majewska A, Holthoff K. From form to function: calcium compartmental-ization in dendritic spines. Nat Neurosci 2000;3:653–9.
Zeng S, Lv X, Bi K, Zhan C, Li D, Chen WR, et al. Analysis of the dispersion compen-sation of acousto-optic deflectors used for multiphoton imaging. J Biomed Opt2007;12:024015.
Zeng S, Lv X, Zhan C, Chen WR, Xiong W, Jacques SL, et al. Simultaneouscompensation for spatial and temporal dispersion of acousto-optical deflec-tors for two-dimensional scanning with a single prism. Opt Lett 2006;31:1091–3.
Copyright © 2022 FDOKUMEN