ONTARIO - Progress Report Rapport de Production - Lactanet
77
ONTARIO Progress Report Rapport de Production DE L’ONTARIO 1
-
Upload
khangminh22 -
Category
Documents
-
view
1 -
download
0
Transcript of ONTARIO - Progress Report Rapport de Production - Lactanet

ONTARIO Progress Report Rapport de Production DE L’ONTARIO
1

Copyright © April 2017 CanWest DHI 660 Speedvale Avenue West, Suite 101, Guelph, ON N1K 1E5
Toll Free: 1-800-549-4373 Tel: (519) 824-2320 Fax: (519) 824-2434 canwestdhi.com
2016 ONTARIO PROGRESS REPORT
Rapport de production de l’Ontario
Industry/Industrie ....................................................................................................................................6Herd Profiles/Profils de troupeaux ..............................................................................................15Statistics/Statistiques ........................................................................................................................25Publishable Herd Listing/Liste de troupeaux publiables ..............................................45Looking Forward/Regarder en avant .........................................................................................74
SPECIAL THANKS TO OUR ADVERTISERS Un grand merci a nos commanditaires
BMO Bank of Montreal ................................................................................................................37Brodie Industries Ag & Industrial Inc. ..................................................................................47Diamond V Mills ............................................................................................ Inside Back CoverFarm Credit Canada ......................................................................................................................43FS Co-operatives/W-L Research ..........................................................................................35Grand Valley Fortifiers .............................................................................. Inside Front CoverMerial Canada Inc. ........................................................................................................................... 5Quality Seeds ......................................................................................................................................7Select Sires Genervations ....................................................................Outside Back CoverTru-Test Inc.. .......................................................................................................................................49
Special thanks to the Ontario Milk Transport Association for the distribution of this publication.
Nous voudrions remercier, tout particulièrement, l’Association des transporteurs de lait de l’Ontario pour la distribution de cette publication.
OMTA

3
DHI Privacy Policy SummaryThe information collected by CanWest DHI, voluntarily provided by producers through the use of services, is available to customers in paper and electronic forms. Access to information by advisors and/or any other parties via mail, email, website, or otherwise, requires explicit customer consent. Canwest DHI customers acknowledge that CanWest DHI may collect their personal information, including, but not limited to name, address, phone number and unique animal identification numbers when they use Canwest DHI services. By providing us with any personal information, customers consent to the sharing of information with the responsible administrator for dairy traceability for the purposes of regulatory and/or voluntary reporting. Further, herds enrolled on DHI services may have information published for awards and recognition purposes with Annual Summaries and year-end publications. Additionally, selected information from all customers will be provided to Canadian Dairy Network for the calculation of genetic indexes and sire proofs. Where applicable, information is provided to various breed associations for recognition and breed improvement programs. Participation in DHI testing programs implies consent for the release of data to these third party organizations, unless otherwise stated to DHI. From time to time, CanWest DHI provides marketing services to third party agricultural organizations. All methods of distribution of marketing materials maintain producer confidentiality. No producer information is sold, traded or otherwise shared. CanWest DHI operates under Canada‘s Personal Information Protection and Electronic Documents Act (PIPEDA). Please Note: This is a summary of the DHI Privacy Policy. For the complete statement, please visit www.canwestdhi.com.
Déclaration de confidentialité de CanWest DHILes informations recueillies par CanWest DHI, volontairement fournies par les producteurs avec l’utilisation des services, sont mises à la disposition des clients sous forme papier et sous forme électronique. L’accès aux informations par les conseillers et/ou tout autre parti par l’intermédiaire du courrier, courriel, site Web ou autrement, exige le consentement approprié du client. Les clients de CanWest DHI reconnaissent que CanWest DHI peut recueillir leurs informations personnelles, y compris, mais sans s’y limiter, leur nom, adresse, numéro de téléphone et les numéros d’identification unique des animaux lorsqu’ils utilisent les services de CanWest DHI. En nous fournissant des informations personnelles, les clients consentent au partage d’informations avec l’administrateur responsable de la traçabilité du bétail laitier à des fins de signalement réglementaire et/ou volontaire. En plus, les troupeaux inscrits aux services de DHI peuvent avoir leurs informations publiées aux fins de récompenses et de reconnaissance avec les sommaires annuels et les publications de fin d’année. De plus, des informations sélectionnées provenant de tous les clients seront fournies au Réseau laitier canadien pour le calcul des index génétiques et des épreuves de taureaux. Là où applicables, des informations sont fournies à diverses associations de race pour des programmes de reconnaissance et d’amélioration de la race. La participation aux programmes de contrôle de DHI implique le consentement autorisant la publication des données à ces organismes tiers, sauf indication contraire à DHI.
De temps en temps, CanWest DHI fournit des services de marketing à des organismes agricoles tiers. Toutes les méthodes de distribution de ce matériel maintiennent la confidentialité du producteur. Aucune information provenant du producteur n’est vendue, commercée ou autrement partagée.
CanWest DHI fonctionne sous la Loi sur la protection des renseignements personnels et les documents électroniques du Canada (LPRPDÉ).
Veuillez noter : ceci est un résumé de la Politique de confidentialité de CanWest DHI. Notre déclaration sur la confidentialité peut être visionnée en entier sur notre site Web au www.canwestdhi.com.
HERD MANAGEMENT SOFTWARE
B E N E F I T S I N C L U D E :
Easy Data EntryTime Saver
Flexible Management Lists & ReportsOn-site Installation & TrainingIndustry Leading SupportEasily Connects with AdvisorsHandheld Capabilities
Electronic Registration Ready CQM Approved
Secure Data Backup
FORTUNATELY, THERE’S A BETTER WAY
1-800-549-4373 canwestdhi.com

4
We are pleased to present our 2016 edition of the Ontario Progress Report to recognize the top county and provincial dairy herds. Last year we introduced the National Herd Management Score ranking in conjunction with our DHI colleagues at Valacta in Quebec. This year we have expanded our national listings to include the Top 10 robot herds in the country given the growing number of robot installations in Canada.
On page 36 you will find a list of the National Top 10 herds for 2016. We are proud to announce that Larenwood Farms Ltd. in Oxford County has won with a top score of 985 points out of a possible 1,000. This is Larenwood’s third time as the top herd in Ontario and the second time as the top herd in Canada. Congratulations to Larenwood Farms on their outstanding efforts.
As mentioned above, this year we are also proud to congratulate Yorellea Farms from Prescott County as the Top Canadian robot herd for the Herd Management Score, with a high score of 947 points.
In addition to the top Herd Management Score listings for Canada and Ontario, you will also find a list of the top herds for Milk Value in Ontario. This year’s top ranked herd is Albadon Farms Ltd. of Bruce County with a herd average milk value of $10,867. Also breaking the $10,000 barrier is Prinzhaven Farms from Prince Edward Country with an average milk value of $10,810 and Shiness Holsteins Ltd. of Oxford County with an average milk value of $10,108 per cow.
We also recognize other aspects of herd management excellence with our listing of the lowest SCC herds in the province reflecting their outstanding udder health management skills and practices. This year’s list of herds with an SCC average of 100,000 cells/ml or less includes 62 herds from across the province including 6 herds with milking robots. We would like to congratulate Sunrise Holsteins in Russell County who topped the list with a low score of 42,000 cells/ml. The Kaelin’s have now topped the list five out of the six years that we have included this listing. Congratulations to Sunrise Holsteins on their achievement.
Inside you will find profiles on some of the best dairy producers in the industry as well as the usual listings of the top BCA herds and industry statistics. You will also find of interest articles on DHI and robotic technology, Ketosis Milk Test, making progress on traits that matter to producers and what Fatty Acids in milk can tell us about our herd’s health.
In addition to thanking our advertisers, I would also like to recognize the 50th Anniversary of the Ontario Milk Transport Association and extend our appreciation to their members who have volunteered again this year to hand-deliver this publication to every dairy farm in the province.
Neil Petreny General Manager CanWest DHI
Foreword

Avant-propos
5
Nous sommes heureux de vous présenter notre édition du Rapport de production de l’Ontario pour l’année 2016 afin de reconnaitre les meilleurs troupeaux laitiers dans les comtés et dans la province. L’année dernière, nous avons introduit le classement national selon la Cote de gestion de troupeau conjointement avec nos collègues de Valacta au Québec. Cette année, nous avons élargi notre liste nationale pour inclure les 10 meilleurs troupeaux en système de traite robotisée dans le pays compte tenu du nombre croissant d’installations équipées d’un système de traite robotisée au Canada.
À la page 36, vous trouverez une liste des 10 meilleurs troupeaux au niveau national pour l’année 2016. Nous sommes fiers d’annoncer que l’entreprise Larenwood Farms Ltd du comté d’Oxford a gagné avec la meilleure cote de 985 points sur un maximum possible de 1000. C’est la troisième
fois que Larenwood se classe le meilleur troupeau en Ontario et la deuxième fois qu’il se classe le meilleur troupeau au Canada ― félicitations pour vos efforts exceptionnels.
Comme mentionné ci-dessus, cette année, nous sommes également fiers de féliciter l’entreprise Yorellea Farms du comté de Prescott, en tant que meilleur troupeau canadien en système de traite robotisée selon la Cote de gestion de troupeau, avec une cote élevée de 947 points.
En plus de la liste des meilleurs troupeaux selon la Cote de gestion de troupeau pour le Canada et l’Ontario, vous trouverez également une liste des meilleurs troupeaux pour la valeur du lait en Ontario. Le troupeau de l’entreprise Albadon Farms Ltd du comté de Bruce s’est classé en première position cette année avec une moyenne de troupeau de 10 867 $ pour la valeur du lait par vache. Les troupeaux suivants ont également dépassé la barre des 10 000 $, le troupeau de l’entreprise Prinzhaven Farms du comté de Prince Edward avec une moyenne de 10 810 $ pour la valeur du lait par vache et le troupeau de l’entreprise Shiness Holsteins Ltd du comté d’Oxford avec une moyenne de 10 108 $ pour la valeur du lait par vache.
Nous reconnaissons également d’autres aspects de l’excellence dans la gestion de troupeau avec notre liste des troupeaux ayant les plus bas comptages de cellules somatiques (CCS) dans la province ce qui reflète leurs remarquables compétences et pratiques dans la gestion de la santé du pis. Cette année, la liste des troupeaux avec une moyenne de 100 000 cellules/ml ou moins comprend 62 troupeaux à travers la province y compris 6 troupeaux avec des robots de traite. Nous aimerions féliciter l’entreprise Sunrise Holsteins dans le comté de Russell qui s’est classée en première position avec un comptage bas de 42 000 cellules/ml. Les Kaelin se sont maintenant classés en première position pour cinq des six années que nous avons inclus cette liste ― félicitations pour votre réussite.
À l’intérieur, vous trouverez les profils de quelques-uns de nos meilleurs producteurs laitiers dans l’industrie ainsi que la liste habituelle des troupeaux avec les meilleures MCR et les statistiques de l’industrie. Vous trouverez également des articles qui vous intéresseront sur DHI et la technologie robotique, le test sur le lait pour détecter l’acétonémie, les progrès faits sur les traits qui importent pour les producteurs et ce que les acides gras dans le lait peuvent nous dire à propos de la santé de notre troupeau.
En plus de remercier nos commanditaires, j’aimerais également souligner le 50e anniversaire de l’Association des transporteurs de lait de l’Ontario et souhaiterais remercier leurs membres qui ont offert à nouveau cette année de livrer en main propre cette publication à toutes les exploitations laitières dans la province.
Neil PetrenyDirecteur généralCanWest DHI

® The CATTLEHEAD LOGO and EPRINEX® are registered trademarks of Merial Limited. Merial is now part of Boehringer Ingelheim. ® are registered trademarks of Merial Limited. Merial is now part of Boehringer Ingelheim. ®
© 2017 Merial Canada Inc. All rights reserved. EPX-17-2651-AD(E) MER-2176
PO
UR
ING
ON
EP
RIN
EX® C
ON
TR
OLS
MO
RE
SPEC
IES
AN
D
STA
GES
OF
PAR
ASI
TES
TH
AN
AN
Y O
TH
ER P
RO
DU
CT.
1
• Fa
st a
ctin
g, lo
ng-la
stin
g co
ntro
l of m
ore
spec
ies a
nd st
ages
of p
aras
ites t
han
any
othe
r pro
duct
1
• A
prod
uct s
how
n to
incr
ease
milk
pro
duct
ion2
• T
he o
nly
par
asite
con
trol w
ith n
o m
ilk w
ithho
ldin
g an
d no
mea
t with
draw
al1
• Sa
fe fo
r the
use
r and
the
envir
onm
ent*1
,3
• C
ompl
iant w
ith th
e C
anad
ian Q
ualit
y M
ilk P
rogr
am (C
QM
)4
To
lear
n m
ore,
tal
k to
you
r vet
erin
aria
n.
* Whe
n us
ed a
s rec
omm
ende
d. 1 B
ased
on
Can
adian
EPR
INEX
and
oth
er p
our-
on e
ndec
tocid
e pr
oduc
t lab
els.
2 Nod
vedt
A, C
onbo
y G
, Doh
oo I,
San
chez
J, K
eefe
G,
Des
cote
aux
L. In
crea
se in
milk
yie
ld fo
llow
ing
eprin
omec
tin tr
eatm
ent a
t calv
ing
in p
astu
red
dairy
cat
tle. V
eter
inar
y Pa
rasi
tolo
gy 1
05 (2
002)
191
-206
. 3 Mat
erial
Saf
ety
Dat
a Sh
eet.
4C
anad
ian
Qua
lity
Milk
On-
Farm
Foo
d Sa
fety
Pro
gram
Ref
eren
ce M
anua
l, Jun
e 20
10.
mer
ial.c
a
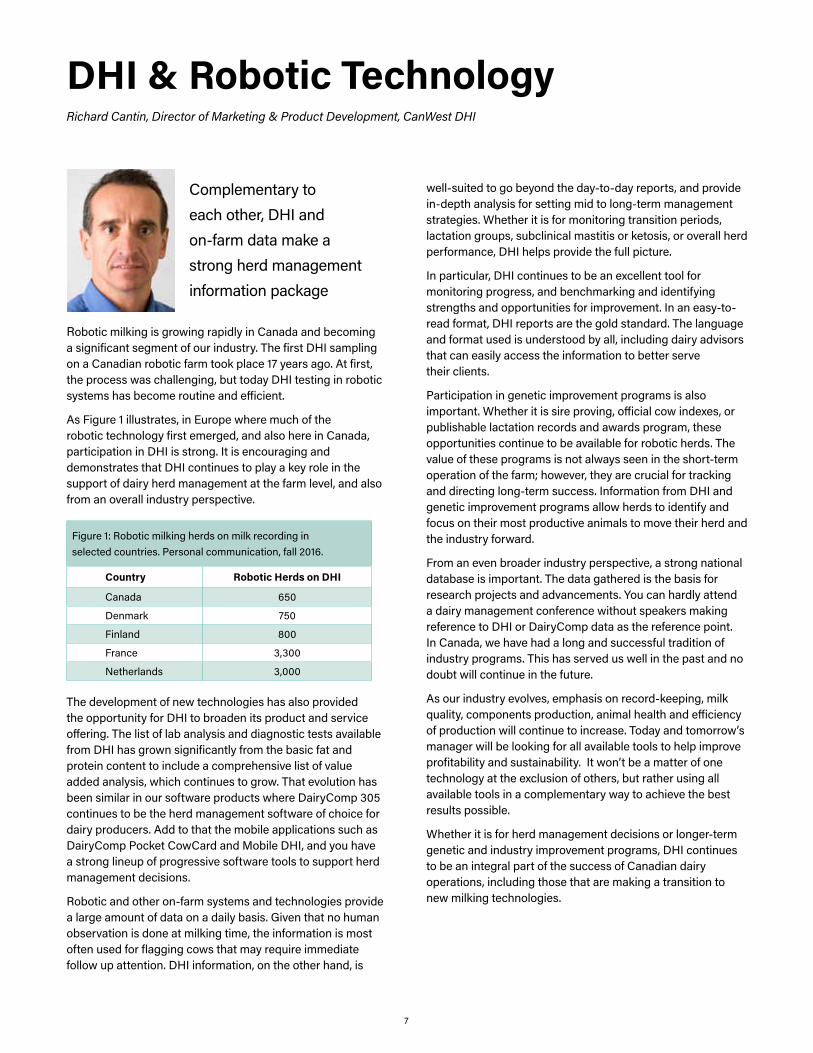
Complementary to each other, DHI and on-farm data make a strong herd management information package
Robotic milking is growing rapidly in Canada and becoming a significant segment of our industry. The first DHI sampling on a Canadian robotic farm took place 17 years ago. At first, the process was challenging, but today DHI testing in robotic systems has become routine and efficient.
As Figure 1 illustrates, in Europe where much of the robotic technology first emerged, and also here in Canada, participation in DHI is strong. It is encouraging and demonstrates that DHI continues to play a key role in the support of dairy herd management at the farm level, and also from an overall industry perspective.
Figure 1: Robotic milking herds on milk recording in selected countries. Personal communication, fall 2016.
Country Robotic Herds on DHI
Canada 650
Denmark 750
Finland 800
France 3,300
Netherlands 3,000
The development of new technologies has also provided the opportunity for DHI to broaden its product and service offering. The list of lab analysis and diagnostic tests available from DHI has grown significantly from the basic fat and protein content to include a comprehensive list of value added analysis, which continues to grow. That evolution has been similar in our software products where DairyComp 305 continues to be the herd management software of choice for dairy producers. Add to that the mobile applications such as DairyComp Pocket CowCard and Mobile DHI, and you have a strong lineup of progressive software tools to support herd management decisions.
Robotic and other on-farm systems and technologies provide a large amount of data on a daily basis. Given that no human observation is done at milking time, the information is most often used for flagging cows that may require immediate follow up attention. DHI information, on the other hand, is
well-suited to go beyond the day-to-day reports, and provide in-depth analysis for setting mid to long-term management strategies. Whether it is for monitoring transition periods, lactation groups, subclinical mastitis or ketosis, or overall herd performance, DHI helps provide the full picture.
In particular, DHI continues to be an excellent tool for monitoring progress, and benchmarking and identifying strengths and opportunities for improvement. In an easy-to-read format, DHI reports are the gold standard. The language and format used is understood by all, including dairy advisors that can easily access the information to better serve their clients.
Participation in genetic improvement programs is also important. Whether it is sire proving, official cow indexes, or publishable lactation records and awards program, these opportunities continue to be available for robotic herds. The value of these programs is not always seen in the short-term operation of the farm; however, they are crucial for tracking and directing long-term success. Information from DHI and genetic improvement programs allow herds to identify and focus on their most productive animals to move their herd and the industry forward.
From an even broader industry perspective, a strong national database is important. The data gathered is the basis for research projects and advancements. You can hardly attend a dairy management conference without speakers making reference to DHI or DairyComp data as the reference point. In Canada, we have had a long and successful tradition of industry programs. This has served us well in the past and no doubt will continue in the future.
As our industry evolves, emphasis on record-keeping, milk quality, components production, animal health and efficiency of production will continue to increase. Today and tomorrow’s manager will be looking for all available tools to help improve profitability and sustainability. It won’t be a matter of one technology at the exclusion of others, but rather using all available tools in a complementary way to achieve the best results possible.
Whether it is for herd management decisions or longer-term genetic and industry improvement programs, DHI continues to be an integral part of the success of Canadian dairy operations, including those that are making a transition to new milking technologies.
DHI & Robotic TechnologyRichard Cantin, Director of Marketing & Product Development, CanWest DHI
7

• Improved fiber digestibility and intake for more milk/meat
• High yielding genetics that are non-transgenic
• Greater harvest flexibility
The Alfalfa That Changes the Game
New alfalfa breeding to help BOOST your milk production
The Alfalfa That Changes the Game
• Improved fiber digestibility and intake for more milk/meat
• High yielding genetics that are non-transgenic
• Greater harvest flexibility
BOOST HG Alfalfa

Exploring Ketosis Risk with the Ketoscreen Milk TestElise Tatone, DVM, PhD
A successful lactation begins with a smooth transition from late pregnancy through to peak lactation. One of the challenges of the transition period is the abrupt increase in demand for energy and nutrients to support milk production. When coupled with a decreased feed intake pre-calving, the high requirement of lactation
leads to a period of negative energy balance in the cow that results in the mobilization of body fat. Mobilized fat can be used to produce ketones as an alternative energy source. Ketosis occurs when there is an overproduction of ketone bodies and is measured in the blood or milk as beta-hydroxybutyrate (BHB). Ketosis represents a significant cost to the herd, an average of $200 to $300 per case, due to decreased milk production and increased risk of diseases such as metritis and displaced abomasum.
Nothing can replace on-farm ketosis testing, but the Ketoscreen milk test can be a useful tool for monitoring herd-level trends and overall ketosis status.Until recently, the impact of ketosis on Ontario dairy farms wasn’t clear. Our previous estimates for disease prevalence came from field studies consisting of a small number of herds. With the introduction of CanWest DHI’s Ketoscreen test for milk BHB, we had the opportunity to look at the proportion of animals in Ontario with ketosis across a large sample of herds and to use routinely collected data to examine factors associated with herd-level and cow-level disease risk. The proportion of cows with ketosis, on 795 Ontario dairy herds, was determined based on first test-day milk samples collected within the first 30 days in milk. There was a large variation in the number of positive animals per herd, ranging from 0% to 59%. The average herd had 21% ketotic animals at first test.
Data was collected on over 150,000 cows and first-calf heifers to examine factors associated with ketosis risk. Longer calving intervals, extended dry periods and an older age at first calving were all associated with a higher
risk of ketosis. It is likely that these factors are related to the amount of time on feed and body condition score at calving. It highlights the importance of good reproductive management in reducing the risk of metabolic disease. Further research is needed to explore several other characteristics that were associated with a higher risk of ketosis such as breed, milking system and season.
There was a greater risk for ketosis in Jersey compared to Holstein cattle, as well as in herds milking with automated milking systems (AMS). A breed effect has been previously reported, but the clinical significance has not been explored. Having a first test in the summer months was associated with a lower ketosis risk. It is possible that the greater ketosis risk in AMS herds and seasonal effects are both related to feeding management. More work is needed to explore the impact of various feeding practices and seasonal feed quality on ketosis risk.
Ketosis is a disease of management. Nothing can replace on-farm ketosis testing for the timely diagnosis and treatment of animals, but the Ketoscreen milk test can be a useful tool for monitoring herd-level trends and overall ketosis status.
Elise completed this work as part of her PhD thesis at the University of Guelph with Drs Todd Duffield and Jessica Gordon.
Histogram of herd-level ketosis prevalence in percentiles
Num
ber o
f Her
ds
Herd prevalence of ketosis (%)
45
75%
90%
50%
25%
34
23
11
0
10%
9
10
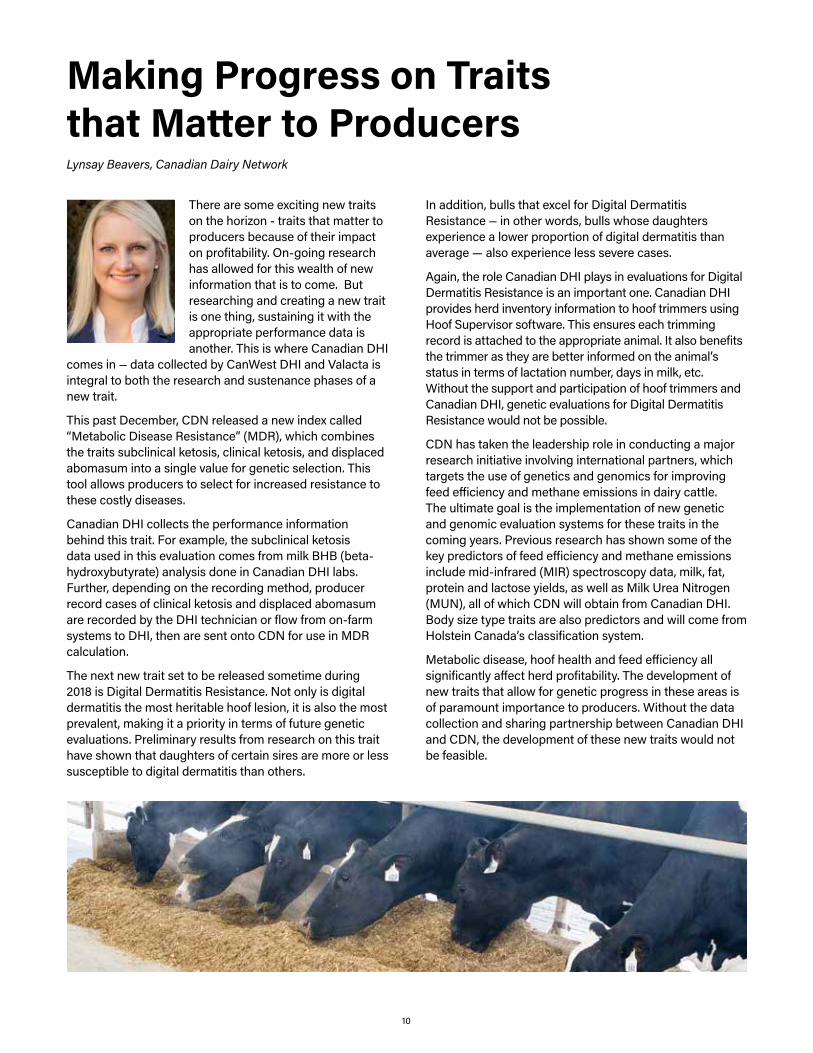
There are some exciting new traits on the horizon - traits that matter to producers because of their impact on profitability. On-going research has allowed for this wealth of new information that is to come. But researching and creating a new trait is one thing, sustaining it with the appropriate performance data is another. This is where Canadian DHI
comes in ― data collected by CanWest DHI and Valacta is integral to both the research and sustenance phases of a new trait.
This past December, CDN released a new index called “Metabolic Disease Resistance” (MDR), which combines the traits subclinical ketosis, clinical ketosis, and displaced abomasum into a single value for genetic selection. This tool allows producers to select for increased resistance to these costly diseases.
Canadian DHI collects the performance information behind this trait. For example, the subclinical ketosis data used in this evaluation comes from milk BHB (beta-hydroxybutyrate) analysis done in Canadian DHI labs. Further, depending on the recording method, producer record cases of clinical ketosis and displaced abomasum are recorded by the DHI technician or flow from on-farm systems to DHI, then are sent onto CDN for use in MDR calculation.
The next new trait set to be released sometime during 2018 is Digital Dermatitis Resistance. Not only is digital dermatitis the most heritable hoof lesion, it is also the most prevalent, making it a priority in terms of future genetic evaluations. Preliminary results from research on this trait have shown that daughters of certain sires are more or less susceptible to digital dermatitis than others.
Making Progress on Traits that Matter to ProducersLynsay Beavers, Canadian Dairy Network
In addition, bulls that excel for Digital Dermatitis Resistance ― in other words, bulls whose daughters experience a lower proportion of digital dermatitis than average ― also experience less severe cases.
Again, the role Canadian DHI plays in evaluations for Digital Dermatitis Resistance is an important one. Canadian DHI provides herd inventory information to hoof trimmers using Hoof Supervisor software. This ensures each trimming record is attached to the appropriate animal. It also benefits the trimmer as they are better informed on the animal’s status in terms of lactation number, days in milk, etc. Without the support and participation of hoof trimmers and Canadian DHI, genetic evaluations for Digital Dermatitis Resistance would not be possible.
CDN has taken the leadership role in conducting a major research initiative involving international partners, which targets the use of genetics and genomics for improving feed efficiency and methane emissions in dairy cattle. The ultimate goal is the implementation of new genetic and genomic evaluation systems for these traits in the coming years. Previous research has shown some of the key predictors of feed efficiency and methane emissions include mid-infrared (MIR) spectroscopy data, milk, fat, protein and lactose yields, as well as Milk Urea Nitrogen (MUN), all of which CDN will obtain from Canadian DHI. Body size type traits are also predictors and will come from Holstein Canada’s classification system.
Metabolic disease, hoof health and feed efficiency all significantly affect herd profitability. The development of new traits that allow for genetic progress in these areas is of paramount importance to producers. Without the data collection and sharing partnership between Canadian DHI and CDN, the development of these new traits would not be feasible.

11
Bovine milk fat is primarily made of triglycerides (TG) which are about 94.5% fatty acids (FA) and 5.5% glycerol by weight. There are 3 FA and one glycerol in each TG. The common fatty acids in milk range in number of carbons per fatty acid from 4 to 18. There are two origins of fatty acids on milk: the 4 to 16 carbon FA (i.e., de novo FA)
that are made in the mammary cells from low molecular weight substrates produced by fermentation of forage in the rumen and those FA that enter the mammary cells premade (i.e., preformed) that contain 16 carbons and longer. The preformed come directly from FA in the feed and from mobilization of adipose tissue in early lactation.
Because the 16 carbon fatty acid can be made by both the de novo process and can be supplied preformed, we call the 16 carbon fatty acids, mixed origin. By measuring the concentration (g/100 g milk) of each of these 3 groups of FA (i.e., de novo, mixed origin, and preformed FA) we can understand how well the rumen is functioning and how effectively by-pass fat fed in the diet is being transferred into milk.
In addition, milk FA can contain double bonds (i.e., unsaturation) in their structure. Milk TG on average in Holstein milk contain just a little less than one double bond (DB) per FA. This has been known but until recently we did not have a rapid and cost effective method for measuring these 4 characteristics of milk fat in addition to the milkfat test. This testing is now being done commercially by mid infrared milk analysis on bulk tank milk payment samples in the Northeast US. We have been doing FA testing on Holstein herds for about 5 years and have some bench marks and understanding of how to use the data to improve dairy herd performance. Generally, we find that the higher the concentration of de novo and mixed origin FA in milk, the higher the bulk tank fat and protein test. When DB per FA is too high, we find that the rumen unsaturated fatty acid load (RUFAL) is too high and/or release of fat in the rumen from corn and oil seed products is too fast in the rumen and causing milk fat depression due to C18:1 trans 10 fatty acid production in the rumen.
Fatty acids in milk – what does it tell us? Dave Barbano, Department of Food Science, Cornell University, Ithaca, NY;
Heather Dann and Rick Grant, W. H. Miner Institute, Chazy, NY.
By using routine herd and cow samples that are already collected and delivered to our labs, we can cost effectively use the FA information as another piece of the nutrition management puzzle. We have used these metrics to trouble shoot feeding problems on herds and improve bulk tank milk fat and protein test. We have found that milk protein test generally increases as de novo FA concentration increases. Higher milk de novo FA indicates excellent rumen fermentation and delivery of more rumen microbial biomass to the lower gastrointestinal track and supports milk protein synthesis. Opportunities also exist to use FA information at the individual cow level, to help assess and monitor rumen function.
By using routine herd and cow samples that are already collected and delivered to our labs, we can cost effectively use the FA information as another piece of the nutrition management puzzle. Some of these developments are relatively new, however our knowledge and understanding of how to interpret and use the information for improved feeding management is growing rapidly. Much opportunity lies ahead in this area.

12
La traite robotisée est en croissance rapide au Canada et devient un segment important de notre industrie. Le premier échantillon prélevé par DHI sur une ferme robotisée canadienne a eu lieu il y a 17 ans. Au début, le processus était difficile, mais aujourd’hui, le contrôle laitier dans les systèmes robotisés se fait de façon routinière et efficace.
Comme le tableau 1 le démontre, en Europe où une grande partie de la technologie robotique est d’abord apparue, et également ici au Canada, la participation dans DHI est forte. Cela est encourageant et démontre que DHI continue de jouer un rôle clé dans le soutien de la gestion du troupeau laitier au niveau de la ferme, et aussi du point de vue de l’ensemble de l’industrie.
Tableau 1: Nombre de troupeaux laitiers en système de traite robotisée inscrit au contrôle laitier dans des pays sélectionnés. Communications personnelles, automne 2016.
Pays# de troupeaux en système de traite robotisée inscrit sur DHI
Canada 650
Danemark 750
Finlande 800
France 3,300
Pays-Bas 3,000
Le développement de nouvelles technologies a également permis à DHI d’élargir son offre de produits et de services. La liste des analyses de laboratoire et des tests diagnostiques disponibles auprès de DHI a considérablement augmenté depuis les analyses de base de la teneur en matière grasse et en protéines pour inclure une liste complète d’analyses à valeur ajoutée, qui continue de croitre. Cette évolution a été semblable dans nos produits logiciels où DairyComp 305 continue d’être le logiciel de gestion de troupeau de choix pour les producteurs laitiers. Ajoutez à cela les applications mobiles telles que DairyComp Pocket CowCard et Mobile DHI, et vous avez une gamme solide d’outils logiciels progressifs pour appuyer la prise de décisions dans la gestion du troupeau.
Les systèmes robotisés et autres systèmes et technologies à la ferme fournissent une grande quantité de données sur une base quotidienne. Étant donné qu’aucune observation humaine ne se fait au moment de la traite, l’information est le plus souvent utilisée pour signaler les vaches qui peuvent nécessiter un suivi immédiat. D’autre part, les informations de DHI sont bien adaptées pour aller au-delà des rapports quotidiens, et fournissent une analyse approfondie pour établir des stratégies
de gestion à moyen et à long terme. Qu’il s’agisse de suivre de près les périodes de transition, les groupes de lactation, la mammite ou l’acétonémie subclinique, ou la performance globale du troupeau, DHI contribue à fournir un portrait d’ensemble.
Plus précisément, DHI continue d’être un excellent outil pour suivre de près les progrès, et l’analyse comparative et identifier les points forts et les possibilités d’amélioration. Dans un format facile à lire, les rapports de DHI sont la norme d’excellence. Le langage et le format utilisés sont compris par tous, y compris les conseillers de l’industrie laitière qui peuvent facilement accéder aux informations pour mieux servir leurs clients.
La participation à des programmes d’amélioration génétique est également importante. Qu’il s’agisse des programmes d’épreuve de progéniture, des indices officiels des vaches, ou des relevés de lactation publiable et les programmes de récompenses, ces opportunités continuent d’être disponibles pour les troupeaux en système de traite robotisée. La valeur de ces programmes n’est pas toujours vue dans le fonctionnement à court terme de la ferme ; cependant, ils sont essentiels pour suivre et diriger le succès à long terme. Les informations de DHI et les programmes d’amélioration génétique permettent aux troupeaux d’identifier et de se concentrer sur leurs animaux les plus productifs pour faire avancer leur troupeau et l’industrie.
D’un point de vue encore plus large de l’industrie, une solide base de données nationale est importante. Les données rassemblées sont la base pour les projets de recherche et les avancements. Vous pouvez difficilement assister à une conférence sur la gestion laitière sans que les intervenants aient recours aux données de DHI ou du logiciel de gestion DairyComp comme point de référence. Au Canada, nous possédons déjà une longue tradition, couronnée de succès, de programmes de l’industrie. Cela nous a bien servi dans le passé et continuera sans doute à bien nous servir dans les années à venir.
À mesure que notre industrie évolue, l’importance particulière accordée à la tenue de dossiers, la qualité du lait, la production des composants du lait, la santé animale et l’efficacité de la production continuera d’augmenter. Les gérants d’aujourd’hui et de demain rechercherons tous les outils disponibles pour aider à améliorer la rentabilité et la durabilité. Il ne sera pas question d’une technologie à l’exclusion des autres, mais bien d’utiliser tous les outils disponibles de façon complémentaire pour atteindre les meilleurs résultats possible.
Qu’il s’agisse de décisions concernant la gestion du troupeau ou à plus long terme de programmes d’amélioration de la génétique et de l’industrie, DHI continue de faire partie intégrante du succès des exploitations laitières canadiennes, y compris celles qui font une transition vers de nouvelles technologies de traite.
DHI et la technologie robotiqueRichard Cantin, Directeur du marketing et du développement des produits, CanWest DHI

Une lactation réussie commence par une transition en douceur de la fin de la gestation jusqu’au pic de lactation. Un des défis de la période de transition est la soudaine augmentation dans la demande d’énergie et de nutriments pour soutenir la production de lait. Lorsqu’elle est associée à une diminution de l’apport alimentaire
avant le vêlage, les exigences élevées de la lactation entrainent une période de balance énergétique négative dans la vache qui entraine la mobilisation des graisses corporelles. La graisse mobilisée peut être utilisée pour produire des cétones comme autre source d’énergie. L’acétonémie survient lorsqu’il y a une surproduction de corps cétoniques et elle est mesurée dans le sang ou le lait sous forme de bêta-hydroxybutyrate (BHB). L’acétonémie représente un coût important pour le troupeau, en moyenne de 200 à 300 $ par cas, en raison d’une baisse de la production de lait et du risque accru de maladies telles que la métrite et le déplacement de caillette.
Jusqu’à récemment, l’impact de l’acétonémie sur les fermes laitières de l’Ontario n’était pas clair. Nos estimations précédentes pour la prévalence de la maladie proviennent d’études sur le terrain qui ont été faites sur un petit nombre de troupeaux. Avec l’introduction du test Ketoscreen de CanWest DHI pour détecter le BHB dans le lait, nous avons eu l’occasion d’examiner la proportion des animaux en Ontario atteint d’acétonémie à travers un large échantillon de troupeaux et d’utiliser les données de routine recueillies pour examiner les facteurs associés avec le risque de maladie au niveau du troupeau et au niveau de la vache. La proportion de vaches atteintes d’acétonémie, sur 795 troupeaux laitiers en Ontario, a été déterminée en se basant sur les échantillons de lait recueillis lors du premier contrôle laitier dans les 30 premiers jours en lactation. On a constaté de fortes variations dans le nombre d’animaux positifs par troupeau, allant de 0 % à 59 %. Le troupeau moyen avait 21 % des animaux atteints d’acétonémie au premier contrôle.
Des données ont été recueillies sur plus de 150 000 vaches et génisses de premier veau pour examiner les facteurs associés au risque d’acétonémie. Des intervalles de vêlage plus longs, des périodes de tarissement prolongées et un âge plus avancé au premier vêlage étaient tous associés à un risque plus élevé d’acétonémie. Il est probable que ces facteurs sont liés à la quantité de temps consacré
Explorer le risque d’acétonémie avec le test KetoscreenElise Tatone, D.M.V., Ph. D.
à l’alimentation et à la cote de condition de chair au vêlage. Ceci souligne l’importance d’une bonne gestion de la reproduction pour réduire le risque de maladies métaboliques. Des recherches supplémentaires sont nécessaires pour explorer plusieurs autres caractéristiques qui étaient associées avec un risque plus élevé d’acétonémie telles que la race, le système de traite et la saison.
Il y avait un plus grand risque d’acétonémie chez les vaches de race Jersey comparée aux vaches de race Holstein, ainsi que dans les troupeaux qui sont traits par des systèmes de traite automatisée. Un effet de la race a été rapporté auparavant, mais la signification clinique n’a pas été explorée. Avoir un premier test au cours des mois d’été était associé à un risque moins élevé d’acétonémie. Il est possible que le plus grand risque d’acétonémie dans les troupeaux traits par des systèmes de traite automatisée et les effets saisonniers soient tous les deux liés à la gestion de l’alimentation. On doit effectuer davantage de travail pour explorer l’impact de diverses pratiques en alimentation et la qualité des aliments saisonniers sur le risque d’acétonémie.
L’acétonémie est une maladie de la gestion. Rien ne peut remplacer les tests à la ferme pour détecter l’acétonémie pour le diagnostic et le traitement rapide des animaux, mais le test Ketoscreen sur le lait peut être un outil utile pour suivre de près les tendances au niveau du troupeau et le statut global de l’acétonémie.
Elise a accompli ce travail dans le cadre de sa thèse de doctorat à l’Université de Guelph avec Dr Todd Duffield et Dre Jessica Gordon.
Histogramme de la prévalence de l’acétonémie au niveau du troupeau par rang centile
Nom
bre
de tr
oupe
aux
Prévalence de l’acétonémie dans le troupeau (%)
45
75%
90%
50%
25%
34
23
11
0
10%
13
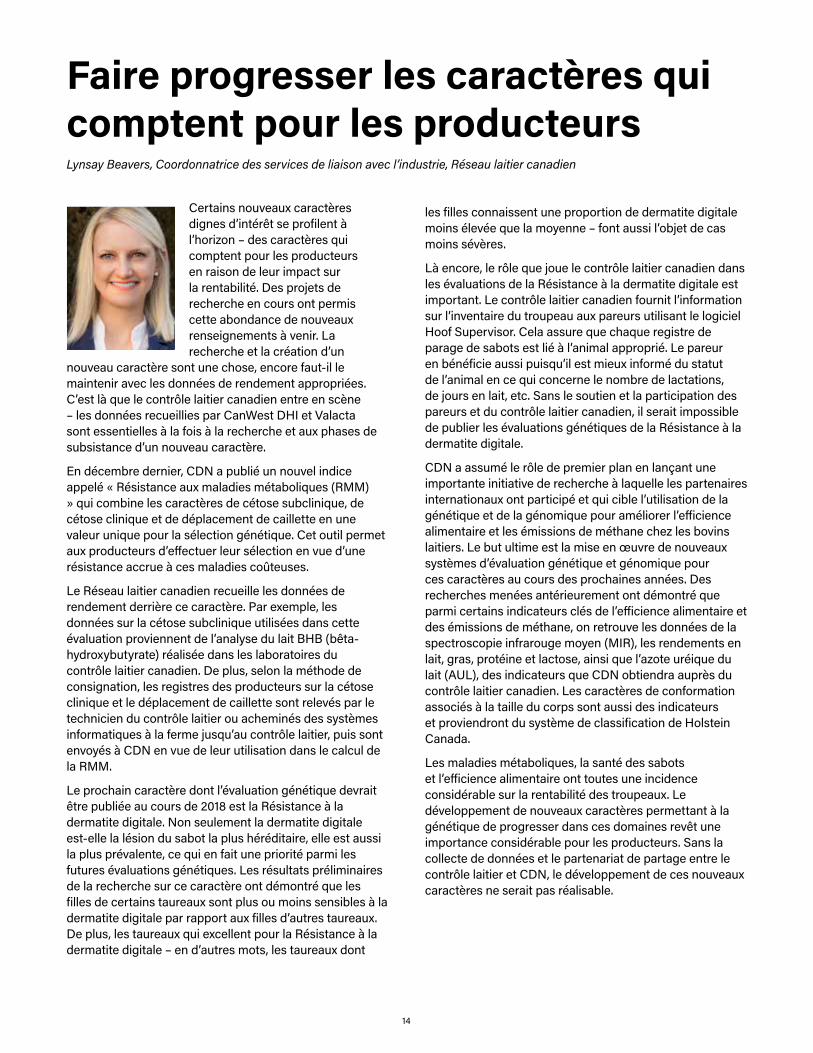
Certains nouveaux caractères dignes d’intérêt se profilent à l’horizon – des caractères qui comptent pour les producteurs en raison de leur impact sur la rentabilité. Des projets de recherche en cours ont permis cette abondance de nouveaux renseignements à venir. La recherche et la création d’un
nouveau caractère sont une chose, encore faut-il le maintenir avec les données de rendement appropriées. C’est là que le contrôle laitier canadien entre en scène – les données recueillies par CanWest DHI et Valacta sont essentielles à la fois à la recherche et aux phases de subsistance d’un nouveau caractère.
En décembre dernier, CDN a publié un nouvel indice appelé « Résistance aux maladies métaboliques (RMM) » qui combine les caractères de cétose subclinique, de cétose clinique et de déplacement de caillette en une valeur unique pour la sélection génétique. Cet outil permet aux producteurs d’effectuer leur sélection en vue d’une résistance accrue à ces maladies coûteuses.
Le Réseau laitier canadien recueille les données de rendement derrière ce caractère. Par exemple, les données sur la cétose subclinique utilisées dans cette évaluation proviennent de l’analyse du lait BHB (bêta-hydroxybutyrate) réalisée dans les laboratoires du contrôle laitier canadien. De plus, selon la méthode de consignation, les registres des producteurs sur la cétose clinique et le déplacement de caillette sont relevés par le technicien du contrôle laitier ou acheminés des systèmes informatiques à la ferme jusqu’au contrôle laitier, puis sont envoyés à CDN en vue de leur utilisation dans le calcul de la RMM.
Le prochain caractère dont l’évaluation génétique devrait être publiée au cours de 2018 est la Résistance à la dermatite digitale. Non seulement la dermatite digitale est-elle la lésion du sabot la plus héréditaire, elle est aussi la plus prévalente, ce qui en fait une priorité parmi les futures évaluations génétiques. Les résultats préliminaires de la recherche sur ce caractère ont démontré que les filles de certains taureaux sont plus ou moins sensibles à la dermatite digitale par rapport aux filles d’autres taureaux. De plus, les taureaux qui excellent pour la Résistance à la dermatite digitale – en d’autres mots, les taureaux dont
Faire progresser les caractères qui comptent pour les producteursLynsay Beavers, Coordonnatrice des services de liaison avec l’industrie, Réseau laitier canadien
les filles connaissent une proportion de dermatite digitale moins élevée que la moyenne – font aussi l’objet de cas moins sévères.
Là encore, le rôle que joue le contrôle laitier canadien dans les évaluations de la Résistance à la dermatite digitale est important. Le contrôle laitier canadien fournit l’information sur l’inventaire du troupeau aux pareurs utilisant le logiciel Hoof Supervisor. Cela assure que chaque registre de parage de sabots est lié à l’animal approprié. Le pareur en bénéficie aussi puisqu’il est mieux informé du statut de l’animal en ce qui concerne le nombre de lactations, de jours en lait, etc. Sans le soutien et la participation des pareurs et du contrôle laitier canadien, il serait impossible de publier les évaluations génétiques de la Résistance à la dermatite digitale.
CDN a assumé le rôle de premier plan en lançant une importante initiative de recherche à laquelle les partenaires internationaux ont participé et qui cible l’utilisation de la génétique et de la génomique pour améliorer l’efficience alimentaire et les émissions de méthane chez les bovins laitiers. Le but ultime est la mise en œuvre de nouveaux systèmes d’évaluation génétique et génomique pour ces caractères au cours des prochaines années. Des recherches menées antérieurement ont démontré que parmi certains indicateurs clés de l’efficience alimentaire et des émissions de méthane, on retrouve les données de la spectroscopie infrarouge moyen (MIR), les rendements en lait, gras, protéine et lactose, ainsi que l’azote uréique du lait (AUL), des indicateurs que CDN obtiendra auprès du contrôle laitier canadien. Les caractères de conformation associés à la taille du corps sont aussi des indicateurs et proviendront du système de classification de Holstein Canada.
Les maladies métaboliques, la santé des sabots et l’efficience alimentaire ont toutes une incidence considérable sur la rentabilité des troupeaux. Le développement de nouveaux caractères permettant à la génétique de progresser dans ces domaines revêt une importance considérable pour les producteurs. Sans la collecte de données et le partenariat de partage entre le contrôle laitier et CDN, le développement de ces nouveaux caractères ne serait pas réalisable.
14

15
La matière grasse du lait bovin est principalement constituée de triglycérides (TG) qui sont environ 94,5 % acides gras (AG) et 5,5 % glycérol en poids. Chaque TG est constitué de 3 molécules d’AG et d’une molécule de glycérol. Les acides gras courants dans le lait varient en nombre d’atomes de carbone par acides gras de 4 à
18. Les acides gras du lait ont deux origines : les AG qui comportent de 4 à 16 atomes de carbone (c.-à-d., AG de novo) qui sont fabriqués dans les cellules mammaires à partir de substrats de faible masse moléculaire produits par la fermentation du fourrage dans le rumen et ces AG qui pénètrent dans les cellules mammaires déjà fabriqués (c.-à-d., préformé) qui contiennent 16 atomes de carbone et plus. Les préformés viennent directement des AG dans les aliments et de la mobilisation de tissu adipeux en début de lactation.
Étant donné que les acides gras qui comportent 16 atomes de carbone peuvent être, à la fois, fabriqués par le processus de novo et fournis préformés, nous appelons les acides gras qui comportent 16 atomes de carbone, d’origine mixte. En mesurant la concentration (g/100 g de lait) de chacun de ces 3 groupes d’AG (c.-à-d., AG de novo, AG d’origine mixte et AG préformé), nous pouvons comprendre dans quelle mesure le rumen fonctionne et l’efficacité avec laquelle les graisses digestibles au niveau de l’intestin nourries dans le régime alimentaire sont transférées dans le lait.
En plus, les AG du lait peuvent contenir des doubles liaisons (c.-à-d., non saturé) dans leur structure. Les TG du lait dans le lait de vache Holstein contiennent en moyenne juste un peu moins de 1 double liaison (DL) par AG. Cela on le savait, mais jusqu’à récemment nous n’avions pas de méthode rapide et abordable pour mesurer ces 4 caractéristiques de la matière grasse du lait en plus de la teneur en matière grasse du lait. Ce test est maintenant fait commercialement par système analytique infrarouge moyen sur le lait pour les échantillons de lait prélevés dans le réservoir en vrac pour le paiement du lait dans le nord-est des États-Unis. Nous faisons des tests sur les AG dans les troupeaux Holstein depuis environ 5 ans et nous avons des repères et une compréhension de la façon d’utiliser les données pour améliorer la performance des
Les acides gras dans le lait ― qu’est-ce que cela nous dit ?Dave Barbano, Département de la science alimentaire, Université de Cornell, Ithaca, N.Y. ;
Heather Dann et Rick Grant, W. H. Miner Institute, Chazy, N.Y.
troupeaux laitiers. En général, nous constatons que plus la concentration d’AG de novo et d’origine mixte dans le lait est élevée, plus la teneur en matière grasse et en protéines est élevée dans le lait du réservoir en vrac. Lorsque le nombre de DL par AG est trop élevé, nous constatons que la charge ruminale en acides gras insaturés (CRAGI) est trop élevée et/ou la libération de matière grasse dans le rumen à partir de produits de maïs et graines oléagineuses est trop rapide dans le rumen et cause une dépression de la matière grasse dans le lait en raison de la production d’acides gras C18:1 trans-10 dans le rumen.
Nous avons utilisé ces mesures pour détecter et corriger les problèmes d’alimentation dans les troupeaux et pour améliorer la teneur en matière grasse et en protéines dans le lait du réservoir en vrac. Nous avons constaté que généralement la teneur en protéines dans le lait augmente à mesure que la concentration des AG de novo augmente. Un plus haut niveau d’AG de novo dans le lait indique une
excellente fermentation du rumen et la livraison de plus de biomasse microbienne du rumen au tractus gastro-intestinal inférieur et soutient la synthèse des protéines du lait. Il existe également des possibilités d’utiliser l’information sur les AG au niveau de la vache individuelle, pour aider à évaluer et suivre de près la fonction du rumen.
En utilisant des échantillons de troupeau et de vache prélevés de façon routinière lesquels sont déjà rassemblés et livrés à nos laboratoires, nous pouvons utiliser efficacement les informations sur les AG comme un autre élément dans le casse-tête de la gestion de l’alimentation. Certains de ces développements sont relativement récents, mais notre connaissance et notre compréhension sur la façon d’interpréter et d’utiliser l’information pour une meilleure gestion de l’alimentation augmentent rapidement. L’avenir nous réserve de nombreuses opportunités dans ce domaine.

16
Wim Muilwyk has operated the farm for nearly six years and has had the top Herd Management Score in Elgin County for the last three years.
He, his father and two brothers are all dairy farmers who emigrated from the Netherlands 17 years ago. They all work together closely with field work and also wherever needed.
A new free-stall barn was built four years ago featuring sand bedding. This is the key reason for attaining a high management score. Wim feels that “sand is the way to go.” The herd consists of 90 purebred Holsteins plus young stock. He milks in a double-eight Boumatic parallel parlour.
A neighbouring student, Kevin Damen, 18, is a “very reliable” part-time employee. Wim also appreciates support from his family, neighbours and friends. Dr. Dave Carson of Oxford Bovine Veterinary Service is an important part of the team as well as Dave Crossan from Shur-Gain who balances the rations.
He uses DHI reports for Somatic Cell Counts, for milk production and components, which helps him selectively cull the bottom end of the herd. He uses genomic tested bulls and aims for high production and longevity. He says he likes to provide the DHI records to the artificial insemination unit as confirmation that the genomic advice is working.
He is a fan of DairyComp 305. “It’s fantastic. It’s very simple and has lots of applications” such as scheduling vaccinations and making sure that cows are bred in a timely fashion. He doesn’t use any additional aids such as activity, but simply watches his cows closely to detect heats.
“We try to keep it simple,” says Wim. “We’re just simple farmers who try to do a good job.”
Muilwyk FarmsBROWNSVILLE, ON
Producer Profile
17
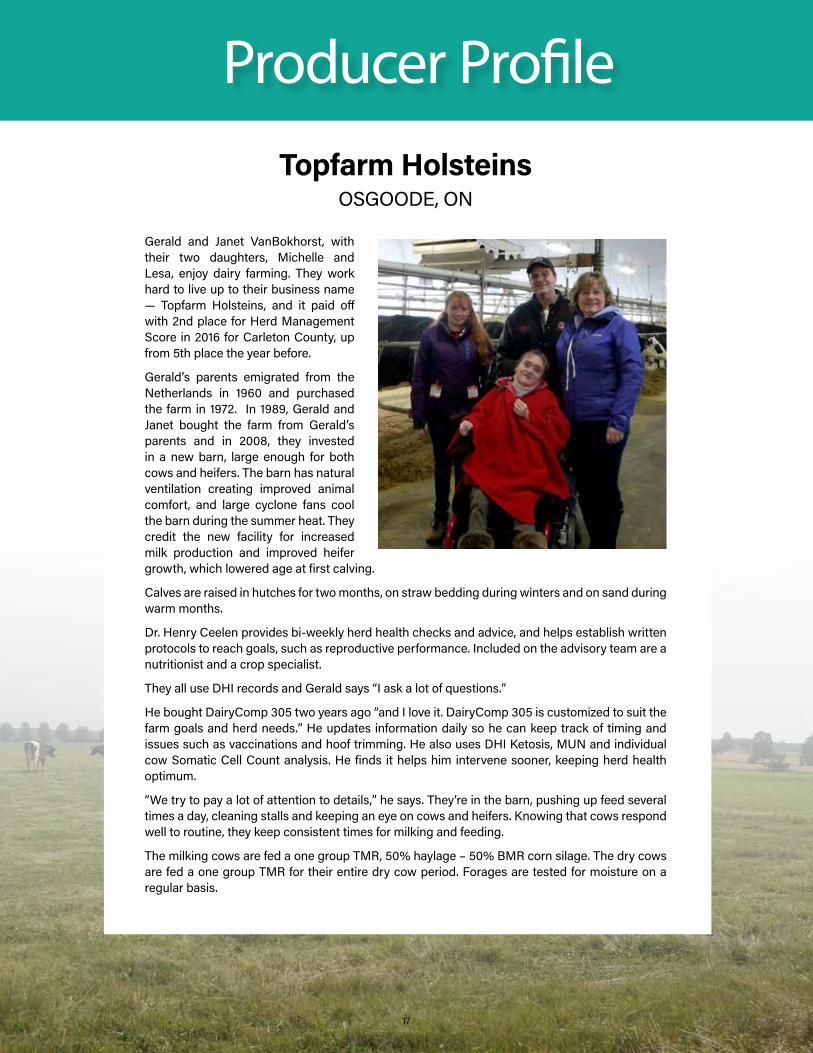
Gerald and Janet VanBokhorst, with their two daughters, Michelle and Lesa, enjoy dairy farming. They work hard to live up to their business name ― Topfarm Holsteins, and it paid off with 2nd place for Herd Management Score in 2016 for Carleton County, up from 5th place the year before.
Gerald’s parents emigrated from the Netherlands in 1960 and purchased the farm in 1972. In 1989, Gerald and Janet bought the farm from Gerald’s parents and in 2008, they invested in a new barn, large enough for both cows and heifers. The barn has natural ventilation creating improved animal comfort, and large cyclone fans cool the barn during the summer heat. They credit the new facility for increased milk production and improved heifer growth, which lowered age at first calving.
Calves are raised in hutches for two months, on straw bedding during winters and on sand during warm months.
Dr. Henry Ceelen provides bi-weekly herd health checks and advice, and helps establish written protocols to reach goals, such as reproductive performance. Included on the advisory team are a nutritionist and a crop specialist.
They all use DHI records and Gerald says “I ask a lot of questions.”
He bought DairyComp 305 two years ago “and I love it. DairyComp 305 is customized to suit the farm goals and herd needs.” He updates information daily so he can keep track of timing and issues such as vaccinations and hoof trimming. He also uses DHI Ketosis, MUN and individual cow Somatic Cell Count analysis. He finds it helps him intervene sooner, keeping herd health optimum.
“We try to pay a lot of attention to details,” he says. They’re in the barn, pushing up feed several times a day, cleaning stalls and keeping an eye on cows and heifers. Knowing that cows respond well to routine, they keep consistent times for milking and feeding.
The milking cows are fed a one group TMR, 50% haylage – 50% BMR corn silage. The dry cows are fed a one group TMR for their entire dry cow period. Forages are tested for moisture on a regular basis.
Topfarm HolsteinsOSGOODE, ON
Producer Profile

18
Everyone in the Stewardson family has a role in the dairy that features 600 Holsteins, about 275 of them being milked three times daily.
Jeff and his wife, Brenda, took over the farm in 1985 from his parents who founded it in 1958, and they are both fully engaged in management, finances, strategic planning and fieldwork. Their son, Dylan, is now the point man on day-to-day management; his wife, Carley, will graduate this spring from the Ontario Veterinary College. They have a one-year old daughter, Renley. Dylan’s brother, Dan, is a full-time farm equipment mechanic and also helps with cropping and relief milking and sister, Nicole, takes care of the family’s broiler chicken operation as well as managing calves and milking.
They have a number of committed and dependable employees, most of them part-timers for nighttime milking.
“People management is an important part of what we do”, says Dylan.
Fifty days after calving, the team starts breeding based on heat detection, and if none is observed by 70 days in milk, a synchronization program is implemented. About 65 per cent of matings are from natural heats.
Veterinarian, Robyn Elgie, visits every second week and is an integral part of the management team.
They feed a milking cow TMR of home-grown haylage, corn silage, cob meal, as well as soybean meal, roasted soybeans, wet brewer’s grain, corn distiller’s grain, minerals and chopped straw.
Another priority is transition cow management. The focus is placed on barn design and day-to-day protocols to help ensure feed intakes are maintained and cows are comfortable.
It has all added up to first place for Herd Management Score in 2016 for Lambton County and 13th in the province. The team is determined to keep improving in all aspects of the farm.
They use DHI for data analysis and benchmarking to identify areas for improvement. They have used services to screen for Johne’s, Mastitis4, Ketosis and for MUN analysis.
Dylan concludes, “taking care of the cows is a priority at Stewardson Dairy. Yet, as important as the cows are, it’s really all about family.”
Stewardson DairyTHEDFORD, ON
Producer Profile

19
John and Brenda Branderhorst operate a 52 cow tie-stall operation that ranked an impressive 1st in Huron County and 8th in the province for Herd Management Score in 2016.
They have five sons, all of them involved in dairy farming. Their oldest two, Bryan and Josh, along with Josh’s wife Samantha, have a 120-cow herd in Prince Edward County. The three younger boys are Thomas, who is now involved full time, Joel, who helps when he’s home from Fleming College, and Isaac, a grade 10 student who does evening milkings with his cousin, Maria Robinson. The herd is milked three times daily.
John says he has noticed a big improvement since Thomas joined full time. “He’s been a big addition and we now have time to do all the little things. It makes the job more enjoyable.”
They use DHI to track production as well as butterfat, protein and Somatic Cell Counts. Chronic high SCC cows are eventually culled. They do not use a computer for herd management, so John finds reports left by DHI staff on test day very helpful.
Kirkton Veterinary Clinic and Grand Valley Fortifiers provide herd health and nutrition services and advice. They buy a complete mix to go with their TMR of 30 per cent haylage and 70 per cent corn silage.
Heifers have heats detected by an activity monitoring system while the milking herd is on an Ovsynch program, which John says is working “almost perfectly.”
They manage the herd in a relatively old barn, but the cows are comfortable and performing well.
His grandfather, who emigrated from the Netherlands, gave the farm its name ― Ora Et Labora Inc., which means ‘Pray and Work’. John’s father was involved with feeding right up until the month before he passed away in December, 2016.
“God has blessed us immensely,” says John.
Ora Et Labora Inc.HENSALL, ON
Producer Profile
Producer Profile
20
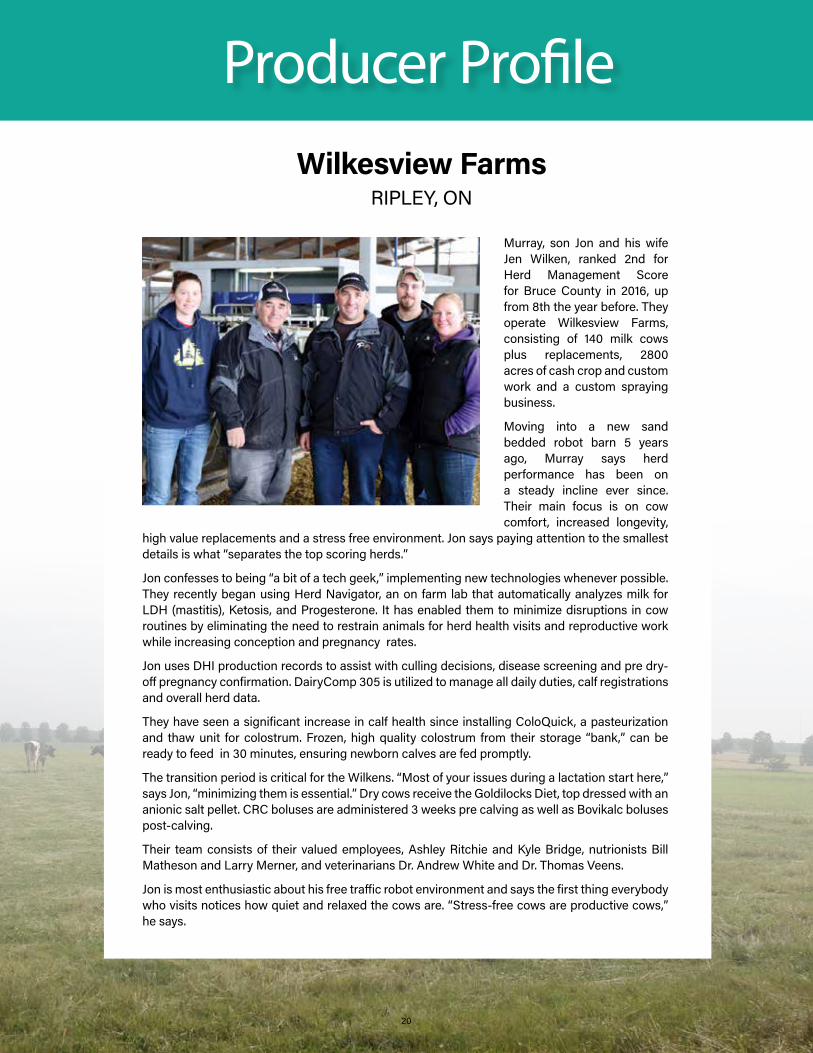
Murray, son Jon and his wife Jen Wilken, ranked 2nd for Herd Management Score for Bruce County in 2016, up from 8th the year before. They operate Wilkesview Farms, consisting of 140 milk cows plus replacements, 2800 acres of cash crop and custom work and a custom spraying business.
Moving into a new sand bedded robot barn 5 years ago, Murray says herd performance has been on a steady incline ever since. Their main focus is on cow comfort, increased longevity,
high value replacements and a stress free environment. Jon says paying attention to the smallest details is what “separates the top scoring herds.”
Jon confesses to being “a bit of a tech geek,” implementing new technologies whenever possible. They recently began using Herd Navigator, an on farm lab that automatically analyzes milk for LDH (mastitis), Ketosis, and Progesterone. It has enabled them to minimize disruptions in cow routines by eliminating the need to restrain animals for herd health visits and reproductive work while increasing conception and pregnancy rates.
Jon uses DHI production records to assist with culling decisions, disease screening and pre dry-off pregnancy confirmation. DairyComp 305 is utilized to manage all daily duties, calf registrations and overall herd data.
They have seen a significant increase in calf health since installing ColoQuick, a pasteurization and thaw unit for colostrum. Frozen, high quality colostrum from their storage “bank,” can be ready to feed in 30 minutes, ensuring newborn calves are fed promptly.
The transition period is critical for the Wilkens. “Most of your issues during a lactation start here,” says Jon, “minimizing them is essential.” Dry cows receive the Goldilocks Diet, top dressed with an anionic salt pellet. CRC boluses are administered 3 weeks pre calving as well as Bovikalc boluses post-calving.
Their team consists of their valued employees, Ashley Ritchie and Kyle Bridge, nutrionists Bill Matheson and Larry Merner, and veterinarians Dr. Andrew White and Dr. Thomas Veens.
Jon is most enthusiastic about his free traffic robot environment and says the first thing everybody who visits notices how quiet and relaxed the cows are. “Stress-free cows are productive cows,” he says.
Wilkesview FarmsRIPLEY, ON

21
Wim Muilwyk gère son entreprise depuis près de six ans et il s’est classé en première position selon la Cote de gestion de troupeau pour le comté d’Elgin pour les trois dernières années.
Lui, son père et deux frères sont tous des producteurs laitiers qui ont émigré des Pays-Bas il y a 17 ans. Ils travaillent tous en étroite collaboration pour les travaux dans les champs et aussi partout où c’est nécessaire.
Il y a quatre ans ils ont bâti une nouvelle étable à stabulation libre équipée d’une litière de sable. C’est la raison principale pour laquelle nous avons obtenu une note élevée pour la gestion. Wim trouve que « le sable est préférable à tout ». Le troupeau comprend 90 vaches Holstein de race pure, plus les jeunes animaux. Il trait les vaches dans une salle de traite parallèle double 8 de Boumatic.
Un étudiant qui demeure dans le voisinage, Kevin Damen, âgé de 18 ans, est un employé à temps partiel « très fiable ». Wim apprécie également l’appui de sa famille, de ses voisins et de
ses amis. Dr Dave Carson de la clinique vétérinaire Oxford Bovine Veterinary Service est un membre important de l’équipe ainsi que Dave Crossan de la meunerie Shur Gain qui équilibre les rations.
Il utilise les rapports de DHI pour le comptage des cellules somatiques, pour la production de lait et les composants du lait, ce qui l’aide à éliminer sélectivement les vaches les moins performantes du troupeau. Il utilise des taureaux testés par la génomique et il a pour objectif une production élevée et la longévité. Il dit qu’il aime fournir les rapports de DHI à son centre d’insémination artificielle pour confirmer que les conseils en génomique donnent les résultats attendus.
Il est un admirateur du logiciel de gestion Dairy Comp 305. « Il est fantastique. Il est très simple et il contient de nombreuses applications » telles que la planification des vaccinations et pour s’assurer que les vaches sont inséminées en temps opportun. Il n’utilise pas d’aide additionnelle telle qu’un système de surveillance des activités motrices, mais surveille simplement ses vaches de près pour détecter les chaleurs.
« Nous essayons de garder les choses simples », dit Wim. « Nous ne sommes que de simples agriculteurs qui essaient de faire du bon travail. »
Muilwyk FarmsBROWNSVILLE, ON
Profil de producteur

22
Gerald et Janet VanBokhorst, avec leurs deux filles, Michelle et Lesa, aiment l’industrie laitière. Ils travaillent fort pour être à la hauteur du nom que porte leur entreprise – Topfarm Holsteins, et cela a porté fruit, ils se sont classés en deuxième position selon la Cote de gestion de troupeau en 2016 pour le comté de Carleton, ils étaient en cinquième position l’année précédente.
Les parents de Gerald ont émigré des Pays-Bas en 1960 et ils ont acheté la ferme en 1972.
En 1989, Gerald et Janet ont acheté la ferme des parents de Gerald et en 2008, ils ont investi dans une nouvelle étable assez grande pour les vaches et les génisses. L’étable a une ventilation
naturelle apportant une amélioration dans le confort des animaux, et de gros ventilateurs cyclones refroidissent l’étable pendant les chaleurs de l’été. Ils attribuent à la nouvelle installation une augmentation de la production laitière et une amélioration dans la croissance des génisses, ce qui a réduit l’âge au premier vêlage.
Les veaux sont élevés dans des huttes pour deux mois, sur une litière de paille pendant les mois d’hiver et sur une litière de sable pendant les mois chauds.
Le docteur Henry Ceelen fournit des vérifications sur la santé du troupeau et des conseils toutes les deux semaines et il aide à établir des protocoles écrits pour atteindre des objectifs, tels que la performance de reproduction. Un nutritionniste et un spécialiste en cultures font partie de l’équipe consultative.
Tous utilisent les rapports de DHI et Gerald dit « Je pose beaucoup de questions ».
Il a acheté le logiciel de gestion Dairy Comp 305 il y a deux ans et il dit « Je l’aime beaucoup. Le logiciel de gestion Dairy Comp 305 est personnalisé en fonction des objectifs de la ferme et des besoins du troupeau. » Il met à jour les informations quotidiennement ainsi il peut surveiller le calendrier et les questions tels que les vaccinations et le parage des onglons. Il utilise également le test de DHI pour détecter l’acétonémie, l’analyse de l’urée du lait et le comptage des cellules somatiques pour chaque vache. Il trouve que cela lui permet d’intervenir plus tôt, gardant la santé du troupeau optimale.
« Nous essayons de porter beaucoup d’attention aux détails », dit-il. Ils sont dans l’étable, ils poussent les aliments en avant des animaux plusieurs fois par jour, ils nettoient les stalles et ils surveillent les vaches et les génisses. Sachant que les vaches répondent bien à la routine, l’heure de la traite et la distribution des aliments se font à des heures régulières.
Les vaches en lactation sont nourries une ration totale mélangée pour groupe unique, 50 % ensilage de foin et 50 % ensilage de maïs à nervure brune. Les vaches taries sont nourries une ration totale mélangée pour groupe unique durant toute leur période de tarissement. Les fourrages sont testés régulièrement pour l’humidité.
Topfarm HolsteinsOSGOODE, ON
Profil de producteur

23
Chaque membre de la famille Stewardson a un rôle dans l’entreprise laitière qui compte 600 vaches Holstein, dont environ 275 de celles-ci sont traites trois fois par jour.
Jeff et son épouse, Brenda, ont pris la relève de la ferme en 1985 de ses parents qui l’ont fondée en 1958, et ils sont tous les deux pleinement engagés dans la gestion, les finances, la planification stratégique et le travail dans les champs. Leur fils, Dylan, est maintenant celui qui est responsable de la gestion quotidienne ; son épouse, Carley, obtiendra son diplôme ce printemps du Collège vétérinaire de l’Ontario. Ils ont une fille âgée d’un an, Renley. Le frère de Dylan, Dan, est mécanicien d’équipement agricole à temps plein et il aide aussi avec les cultures et comme trayeur occasionnel et sa sœur, Nicole, s’occupe de l’exploitation de poulets à rôtir de la famille en plus de la gestion des veaux et de la traite.
Ils ont plusieurs employés engagés et fiables, la plupart d’entre eux sont des travailleurs à temps partiel pour la traite du soir. « La gestion du personnel est une part importante de ce que nous faisons », dit Dylan.
Cinquante jours après le vêlage, l’équipe commence les inséminations en se basant sur la détection des chaleurs, et si aucune chaleur n’est observée rendu à 70 jours en lactation un programme de synchronisation des chaleurs est mis en œuvre. Environ 65 pour cent des inséminations sont des inséminations sur chaleur naturelle.
Leur vétérinaire, Dr Robyn Elgie, visite le troupeau toutes les deux semaines et fait partie intégrante de l’équipe de gestion.
Le troupeau est nourri une ration totale mélangée pour vaches en lactation qui comprend de l’ensilage de foin, de l’ensilage de maïs et de la farine d’épis de maïs cultivés à la ferme, en plus du tourteau de soya, des fèves de soya rôties, de la drêche de brasserie humide, de la drêche de maïs de distillerie, des minéraux et de la paille hachée.
Une autre priorité est la gestion des vaches en période de transition. L’accent est mis sur la conception de l’étable et les protocoles quotidiens pour s’assurer que les apports alimentaires sont maintenus et que les vaches sont confortables.
Tout cela fait en sorte qu’ils se sont classés en première position selon la Cote de gestion de troupeau en 2016 pour le comté de Lambton et en 13e position dans la province. L’équipe est déterminée à continuer à s’améliorer dans tous les aspects de la ferme.
Ils utilisent DHI pour l’analyse des données et l’analyse comparative pour identifier les domaines à améliorer. Ils ont utilisé les services pour dépister la maladie de Johne, le test Mastitis 4, le test pour détecter l’acétonémie, et pour l’analyse de l’urée du lait.
Dylan conclut, « prendre soin des vaches est une priorité de l’entreprise Stewardson Dairy. Cependant, aussi importantes que les vaches soient, il n’y a rien de plus important que la famille. »
Stewardson DairyTHEDFORD, ON
Profil de producteur

24
John et Brenda Branderhorst gèrent une entreprise comprenant 52 vaches dans une installation avec stabulation entravée qui s’est classée en, une impressionnante, première position dans le comté de Huron et huitième dans la province selon la Cote de gestion de troupeau en 2016.
Ils ont cinq fils, tous impliqués dans l’industrie laitière. Leurs deux fils aînés, Bryan et Josh, ainsi que l’épouse de Josh, Samantha, ont un troupeau de 120 vaches dans le comté de Prince Edward. Les trois garçons plus jeunes sont Thomas, qui est maintenant impliqué à plein temps, Joel, qui aide quand il rentre
du Collège Fleming, et Isaac, un étudiant de 10e année qui fait la traite du soir avec sa cousine, Maria Robinson. Le troupeau est trait trois fois par jour.
John dit qu’il a remarqué une grande amélioration depuis que Thomas s’est joint à eux à temps plein. « Son arrivée nous a beaucoup aidés et nous avons maintenant le temps de faire toutes les petites choses. Cela rend le travail plus agréable. »
Ils utilisent DHI pour suivre la production ainsi que le gras, la protéine et le comptage des cellules somatiques. Les vaches qui ont régulièrement un comptage de cellules somatiques élevé sont éventuellement envoyées à la réforme. Ils n’utilisent pas d’ordinateur pour la gestion du troupeau, donc John trouve très utiles les rapports que le personnel de DHI laisse la journée du contrôle laitier.
La clinique vétérinaire Kirkton et la meunerie Grand Valley Fortifiers fournissent des services et des conseils sur la santé et l’alimentation du troupeau. Ils achètent un mélange complet pour aller avec leur ration totale mélangée qui est composée de 30 pour cent ensilage de foin et de 70 pour cent ensilage de maïs.
Les chaleurs des génisses sont détectées par un système de surveillance des activités motrices tandis que le troupeau en lactation est sur un programme de synchronisation Ovsynch, lequel, dit John, fonctionne « de façon presque parfaite ».
Ils gèrent le troupeau dans une étable relativement vieille, mais les vaches sont confortables et elles performent bien.
Son grand-père, qui a émigré des Pays-Bas, a donné à la ferme son nom – Ora Et Labora Inc., qui signifie « prie et travaille ». Le père de John était impliqué dans l’alimentation des animaux jusqu’à un mois avant son décès en décembre 2016.
« Dieu nous a bénis immensément », dit John.
Ora Et Labora Inc.HENSALL, ON
Profil de producteur

25
Murray, son fils Jon et son épouse Jen Wilken se sont classés en deuxième position selon la Cote de gestion de troupeau pour le comté de Bruce en 2016, ils étaient en huitième position l’année précédente. Ils gèrent l’entreprise Wilkesview Farms, composée de 140 vaches laitières, plus les sujets de remplacement, 2800 acres de cultures commerciales, du travail à forfait et une entreprise de pulvérisation à forfait.
Murray dit que les performances du troupeau sont en progression constante depuis qu’ils ont déménagé dans une nouvelle étable, équipée d’un robot de traite et d’une litière de sable, il y a cinq ans. Leur principal objectif est le confort des vaches, une longévité accrue, des sujets de remplacement de valeur et un environnement sans stress. Jon dit que l’attention portée au moindre détail est ce qui « sépare les troupeaux avec les meilleures notes ».
Jon avoue être « un peu accro de technologie », il emploie de nouvelles technologies chaque fois que c’est possible. Ils ont récemment commencé à utiliser Herd Navigator, un laboratoire à la ferme qui analyse automatiquement le lait pour le LDH (mammite), l’acétonémie et la progestérone. Cela leur a permis de minimiser les perturbations dans la routine des vaches en éliminant la nécessité de restreindre les animaux pour les visites de santé du troupeau et les fonctions liées à la reproduction tout en augmentant les taux de conception et de gestation.
Jon utilise les rapports de production de DHI pour aider dans la prise de décision pour les animaux à envoyer à la réforme, le dépistage des maladies et les vérifications pour confirmer la gestation avant le tarissement. Le logiciel de gestion DairyComp 305 est utilisé pour gérer toutes les tâches quotidiennes, l’enregistrement des veaux et l’ensemble des données du troupeau.
Ils ont vu une amélioration significative dans la santé des veaux depuis l’installation de ColoQuick, une unité de pasteurisation et de décongélation pour le colostrum. Un colostrum congelé, de haute qualité provenant de leur « banque » de stockage, peut être prêt à nourrir en 30 minutes, assurant que les veaux nouveau-nés sont nourris rapidement.
La période de transition est critique pour les Wilken. « La plupart de vos problèmes pendant une lactation commencent ici », dit Jon, les minimiser est essentiel. Les vaches taries sont alimentées en utilisant la stratégie Goldilocks (c.-à-d. une alimentation faible en énergie, haute en fibre, qui fournit juste la bonne quantité de nutrition), ils rajoutent des comprimés de sel anionique. Des bolus Rumensin CRC sont administrés trois semaines avant le vêlage ainsi que des bolus Bovikalc après le vêlage.
Leur équipe est composée de leurs précieux employés, Ashley Ritchie et Kyle Bridge, les nutritionnistes Bill Matheson et Larry Merner, et les vétérinaires Dr Andrew White et Dr Thomas Veens.
Jon est très enthousiaste à propos de l’environnement sans congestion du robot de traite et il dit que la première chose que tous les gens qui visitent remarquent, c’est à quel point les vaches sont calmes et détendues. « Des vaches sans stress sont des vaches productives », dit-il.
Wilkesview FarmsRIPLEY, ON
Profil de producteur

26
STATISTICS BY PROVINCE / Statistiques par province
Recorded Herds Troupeaux contrôlés
Recorded Cows Vaches contrôlées
Avg Herd Size Moy de grosseur de troupeau
% Herds > 50 Cows % de troupeaux > 50 vaches
2015 2016 2015 2016 2015 2016 2015 2016
British Columbia 308 294 52,257 48,743 170 166 91 91
Alberta 399 384 57,303 56,374 144 147 95 95
Saskatchewan 93 89 17,031 15,210 183 171 96 94
Manitoba 176 169 27,227 27,021 155 160 90 92
Ontario 2,866 2,742 232,625 233,080 81 85 67 69
Quebec 4,470 4,244 277,971 272,486 62 64 56 60
New Brunswick 136 128 11,586 11,705 85 91 68 72
Nova Scotia 141 134 11,400 12,222 81 91 67 70
Prince Edward Island 96 97 8,170 8,514 85 88 72 70
Canada 8,648 8,281 695,570 685,355 80 83 64 67
STATISTICS BY PROVINCE / Statistiques par province
Calving Interval (Months) Intervalle de vêlage (Mois)
Dry Period (Days) Jours taris (Jours)
Age at First Calving (Months) Âge au 1er vêlage (Mois) Avg SCC/Moy CCS
2015 2016 2015 2016 2015 2016 2015 2016
British Columbia 14.0 14.0 68 68 26.2 26.0 198 184
Alberta 13.7 13.6 75 74 26.2 25.8 221 217
Saskatchewan 14.1 14.0 81 81 26.1 25.8 240 235
Manitoba 14.4 14.3 84 86 27.2 26.9 258 268
Ontario 13.9 13.9 68 69 26.3 26.2 232 241
Quebec 13.8 13.7 63 64 26.3 26.1 223 216
New Brunswick 13.9 13.9 66 68 27.3 27.5 206 221
Nova Scotia 14.0 14.0 67 70 27.3 27.2 240 240
Prince Edward Island 14.2 14.1 75 76 27.4 27.3 215 221
Newfoundland 13.6 13.7 68 71 27.0 26.6 239 276

27
AVERAGE PRODUCTION PER COW / Moyenne de production par vache
Service Level Niveau de service
305 Days Lactation/Lactation 305 jours BCA/MCR Complete Lactation/Lactation compléte
Milk Kg Lait kg
Fat Kg Gras kg
Protein Kg Protéin kg
Milk Lait
Fat Gras
Protein Protéin
Milk Kg Lait kg
Fat Kg Gras kg
Protein Kg Protéin kg
Avg Days in Milk Moy jours en lait
2016All 9,578 373 308 217 223 217 9,924 391 322 313Publishable 9,917 387 319 225 231 226 10,259 405 333 313Management 8,883 347 284 199 207 199 9,298 366 302 313
2015All 9,310 365 297 210 218 209 9,622 381 311 313Publishable 9,659 378 309 219 226 218 9,958 394 322 313Management 8,600 338 274 193 201 192 9,018 357 291 313
2014
All 9,156 358 291 207 214 205 9,440 372 304 312Publishable 9,494 371 302 215 221 213 9,754 385 314 311Management 8,479 332 268 190 198 188 8,904 351 286 313
2013
All 9,230 356 294 208 212 207 9,376 365 302 307Publishable 9,572 369 305 217 220 215 9,689 377 312 307Management 8,575 331 272 192 198 190 8,878 345 286 307
HERD STATISTICS / Tendances
DFO DHI Publishable Service/Troupeaux publiables Management Service/Troupeaux de service de gestion
Year Année
Herds Troupeaux
Herds Troupeaux
Cows Vache
Avg Size Moy grosseur
Herds Troupeaux
Cows Vache
Avg Size Moy grosseur
Herds Troupeaux
Cows Vache
Avg Size Moy grosseur
2016 3,658 2,742 233,052 85 1,856 160,576 87 886 72,476 82
2015 3,764 2,866 232,604 81 1,941 160,260 83 925 72,344 78
2014 3,878 2,961 232,233 78 1,993 158,098 79 968 74,135 77
2013 3,969 3,046 233,946 77 2,026 156,953 77 1,020 76,993 75
HERD SIZE DISTRIBUTION / Taille du troupeau distribution
Cows/Vache Herds/Troupeaux Cows/Vache Herds/Troupeaux Cows/Vache Herds/Troupeaux Cows/Vache Herds/Troupeaux
0-19 12 60-69 343 110-119 90 160-169 30
20-29 101 70-79 258 120-129 68 170-179 24
30-39 307 80-89 184 130-139 59 180-189 21
40-49 475 90-99 150 140-149 51 190-199 15
50-59 454 100-109 107 150-159 30 > 200 122

28
LOW SCC HERDS / Troupeaux avec un CSS bas
DHI congratulates the following producers for outstanding udder health management resulting in low SCC.
DHI félicite les producteurs suivants pour une gestion de la santé du pis exceptionnelle qui se traduit en un CCS bas.
Farm/Ferme Producer/Producteur County/Comté Avg Cows Moy vaches
Average SCC × 1000 Moynenne des CCS × 1000
Sunrise Holsteins Inc Edgar & Ramona Kaelin Russell 56 42
Warby Farm Henny & Hendriks Van Warby Oxford 111 59
Opsterlawn Marten Bylsma Wellington 319 68
Tansymoss Paul & Shawna Chaddock Glengarry 126 * 70
Chris Martin ― Wellington 88 71
Clearview Farm Chris & Abbie Mueller Russell 85 72
Royal Acres Jim & Heather Robinson Perth 63 72
Sunnyfield Holsteins Brent, Susanne, Cal & Ash Snoddon Durham 101 R 74
Hodglynn Holsteins Adam Hodgins Bruce 55 74
Heidi Farms Inc Paul Oeggerli Glengarry 346 77
Hillisle Bruce & Cheryl Hill Carleton 65 77
Eldonna Farm Murray & Sandra Sherk Waterloo 124 * 78
Wiebe Huizinga ― Wellington 63 79
Claynook Farms Ltd W, D & M Wagler Waterloo 205 80
Kenilyn Farms Limited Ken Jackson Perth 109 80
Larenwood Farms Ltd Chris McLaren Oxford 103 80
Groenway Farms Inc M & D Groenewegen Frontenac 74 81
Oakstone Farm Todd & Carolyn Styles Carleton 77 R 82
Ontowa ― Waterloo 109 84
Brakke Farm Inc Jacob, Nelleke & Henk Brakke Dufferin 97 84
Doublejay Farms Peter Dowling Frontenac 30 84
Wallaceview Holsteins John & Garry Koobs Perth 135 86
Hibridge John Ferguson Leeds 76 86
Brightridge Farms Inc Derek Schipper Oxford 136 87
Orchardview Holsteins Glen & Lucille Martin Wellington 70 87
Blackrapids Farms Peter & Rosemary Ruiter Carleton 47 88
Albrecht Ringgenberg ― Huron 43 88
Toprock Farms Ltd T & D Hodgins & B & J Brydges Lanark 67 89
Waycrest Holsteins ― Perth 41 90
Rockaberry Farm David, Lisa & Brian Berry Leeds 26 90
Lecon Holsteins Rob & Amanda Montag Bruce 43 91
Rolling Acres Ltd Jane, Herman & Joshua Kapteyn Northumberland 122 92
Ardross Holsteins Dale & Dave Lang Haldimand 120 92
Evenstar Scott & Joyce Jackson Leeds 74 92
Travis & Jaclyn Riddell ― Perth 71 92
Fairmile Farms Tim Bernard Grenville 54 92
Midlee Holsteins Jim & Connie McDiarmid & Sons Carleton 105 93
*3× per day or greater milking (all or part)/traite 3× par jour R: Robotic/Robotique
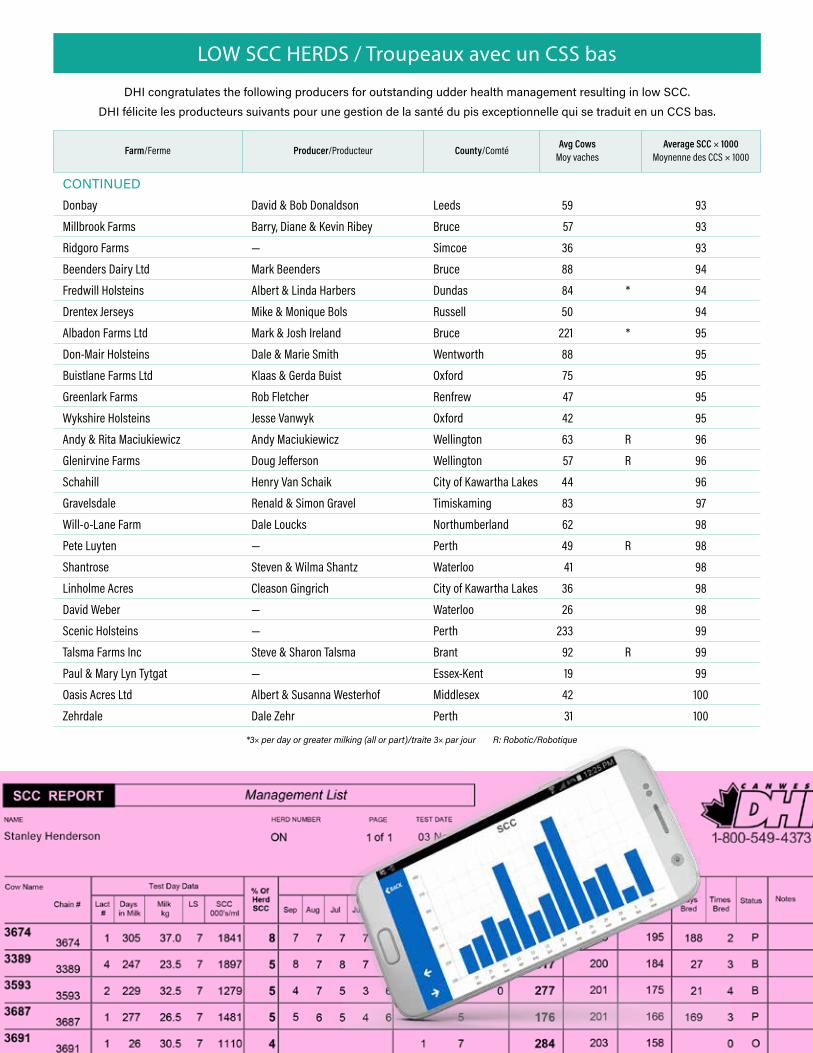
29
LOW SCC HERDS / Troupeaux avec un CSS bas
DHI congratulates the following producers for outstanding udder health management resulting in low SCC.
DHI félicite les producteurs suivants pour une gestion de la santé du pis exceptionnelle qui se traduit en un CCS bas.
Farm/Ferme Producer/Producteur County/Comté Avg Cows Moy vaches
Average SCC × 1000 Moynenne des CCS × 1000
CONTINUEDDonbay David & Bob Donaldson Leeds 59 93
Millbrook Farms Barry, Diane & Kevin Ribey Bruce 57 93
Ridgoro Farms ― Simcoe 36 93
Beenders Dairy Ltd Mark Beenders Bruce 88 94
Fredwill Holsteins Albert & Linda Harbers Dundas 84 * 94
Drentex Jerseys Mike & Monique Bols Russell 50 94
Albadon Farms Ltd Mark & Josh Ireland Bruce 221 * 95
Don-Mair Holsteins Dale & Marie Smith Wentworth 88 95
Buistlane Farms Ltd Klaas & Gerda Buist Oxford 75 95
Greenlark Farms Rob Fletcher Renfrew 47 95
Wykshire Holsteins Jesse Vanwyk Oxford 42 95
Andy & Rita Maciukiewicz Andy Maciukiewicz Wellington 63 R 96
Glenirvine Farms Doug Jefferson Wellington 57 R 96
Schahill Henry Van Schaik City of Kawartha Lakes 44 96
Gravelsdale Renald & Simon Gravel Timiskaming 83 97
Will-o-Lane Farm Dale Loucks Northumberland 62 98
Pete Luyten ― Perth 49 R 98
Shantrose Steven & Wilma Shantz Waterloo 41 98
Linholme Acres Cleason Gingrich City of Kawartha Lakes 36 98
David Weber ― Waterloo 26 98
Scenic Holsteins ― Perth 233 99
Talsma Farms Inc Steve & Sharon Talsma Brant 92 R 99
Paul & Mary Lyn Tytgat ― Essex-Kent 19 99
Oasis Acres Ltd Albert & Susanna Westerhof Middlesex 42 100
Zehrdale Dale Zehr Perth 31 100
*3× per day or greater milking (all or part)/traite 3× par jour R: Robotic/Robotique

30
COUNTY AVERAGES / Les moyennes du comté
County/Comté
Herd Management All Herds/Moyennes de gestion de troupeau Publishable Herds/Moyennes publiables des troupeaux
Herds Troupeaux
Avg Cows Moy vaches
Avg Milk Value Moy vache du lait
Avg Management Score Moy cote de gestion
Herds Troupeaux
Avg Milk Production Moy production laitière
Avg BCA/Moy MCR
2014 2015 2016
Algoma 5 62 5,412 282 ― ― 180 200 ―Brant 40 95 6,438 442 29 9,121 210 215 220Bruce 107 80 7,133 567 69 10,363 222 226 235Carleton 57 91 6,863 519 47 9,916 223 226 231City of Kawartha Lakes 35 70 6,094 346 21 9,344 215 216 216Cochrane 4 50 6,207 412 2 9,017 237 247 227Dufferin 18 60 7,076 559 17 9,660 221 231 230Dundas 72 83 6,914 504 55 10,142 210 221 227Durham 70 73 6,350 379 64 9,419 201 207 211Elgin 36 100 7,180 542 32 10,247 222 224 232Essex-Kent 15 65 6,771 469 12 9,695 214 214 223Frontenac 24 53 6,200 341 12 9,262 200 209 204Glengarry 65 85 6,803 491 50 9,697 212 214 221Grenville 27 103 6,725 479 21 9,554 209 211 216Grey 113 56 6,683 483 61 10,022 210 218 228Haldimand 38 90 7,012 515 29 10,123 213 218 230Halton 4 62 6,816 427 4 9,823 194 207 214Hastings 33 82 6,736 469 24 9,626 220 223 225Huron 118 105 6,878 542 77 9,655 217 224 228Lambton 25 114 6,583 488 20 9,534 202 210 215Lanark 27 55 6,328 408 19 9,798 203 209 216Leeds 58 79 6,622 441 39 9,566 210 212 220Lennox-Addington 22 75 6,770 442 18 10,117 212 213 223Manitoulin-Sudbury West 3 59 7,170 627 2 10,705 223 230 246Middlesex 79 117 6,657 495 50 9,873 214 216 224Niagara 33 68 6,812 494 28 9,833 209 215 222Nipissing-Parry Sound 12 64 6,720 487 7 9,230 213 212 214Norfolk 10 63 6,266 421 7 9,584 221 224 226Northumberland 51 76 6,582 458 43 9,667 212 215 219Oxford 232 111 7,177 582 167 10,161 224 228 236Peel 19 96 6,583 459 18 9,572 209 214 216Perth 246 91 7,074 550 155 10,129 223 226 232Peterborough 31 62 6,334 390 33 9,423 203 208 211Prescott 79 98 6,971 517 52 10,252 224 225 232Prince Edward 26 65 7,592 593 18 10,751 232 237 250Rainy River 5 51 6,495 446 3 10,462 220 225 234Renfrew 38 80 6,599 448 25 9,618 208 207 217Russell 76 97 7,160 557 54 10,477 235 238 241Simcoe 71 65 6,383 402 56 9,675 221 223 224Stormont 53 74 6,696 467 33 9,514 211 217 220Thunder Bay 19 86 6,501 423 17 9,550 200 199 213Timiskaming 28 80 6,094 388 14 9,132 199 203 210Waterloo 211 58 7,236 576 148 10,329 224 231 239Wellington 297 71 7,228 574 205 10,262 224 227 234Wentworth 19 115 6,877 477 13 9,543 207 216 219York 20 66 6,333 399 14 9,565 211 216 218

31
TOP HERDS FOR AVERAGE BCA BY BREED / Meilleurs troupeaux selon la moyenne des MCR par race
Name/Nom Owner/Propriétaire County/Comté Records Relevés
BCA/MCR 305 (Kg)
Avg Moy
Milk Lait
Fat Gras
Protein Protéine
Milk Lait
Fat Gras
Protein Protéine
HolsteinPrinzhaven Farms Philip & Selena Prinzen Prince Edward 61 327.7 321 341 321 14,442 * 570 460Albadon Farms Ltd Mark & Josh Ireland Bruce 186 326.0 322 343 313 14,294 * 567 442Ontario Inc 1024248 Andy Senn Prescott 438 322.7 319 330 319 13,976 * 539 446Lillies Dale Holsteins Leo Baumann Leeds 78 314.3 300 341 302 13,434 R 564 429Larenwood Farms Ltd Chris McLaren Oxford 90 312.0 310 320 306 14,193 544 445Paradigm Holsteins Steve Vandendool Oxford 77 309.7 313 320 296 13,584 * 515 409Bertom Farm F & T Vanmunsteren Russell 86 307.7 307 306 310 13,463 * 497 434Bellwin Bellwin Farms Inc Wellington 59 307.7 302 315 306 13,305 515 429Brabantdale Farms Ltd Chris & John Nooyen Russell 82 305.3 306 307 303 13,651 * 504 429Jubilee Farm Cecil & Nathan Siebenga Perth 73 305.3 306 314 296 13,458 * 514 416Ferme Serheal Claude & Celine Seguin Prescott 72 303.3 302 309 299 13,230 504 417Ferme Prospere Inc Luc & Sylvie Dutrisac Russell 37 299.7 288 312 299 12,650 509 419Summitholm Holsteins Joe Loewith & Sons Wentworth 398 299.3 297 308 293 13,630 * 525 427Armstrong Manor – Peel 300 298.0 291 309 294 12,775 * 503 410Margrove Dale Martin Waterloo 68 298.0 294 305 295 13,556 521 432Alexerin Dairy Inc Ron & Todd Nixon Carleton 160 297.0 302 291 298 13,286 * 475 418Hyden Holsteins Bryan Zehr Perth 48 295.3 294 299 293 13,061 * 497 416Shiness Holsteins Ltd Glen & Dan Matheson Oxford 85 295.0 292 315 278 13,058 * 526 397Sunol Farms J & A O'Connell Lanark 97 294.0 296 291 295 12,596 R 461 401Wilmarlea Farms John & Willard Mackay Oxford 154 293.0 289 309 281 12,726 * 507 394Silverridge Farms Charlie Dykxhoorn Elgin 98 292.7 288 296 294 13,374 * 511 434Ferme Lavigne Inc A & JP Lavigne Prescott 131 292.0 293 297 286 13,006 * 489 404Topfarm Holsteins G & J Vanbokhorst Carleton 69 292.0 286 305 285 12,573 497 399Sunnybrooke Ronald Watson Northumberland 49 291.0 294 294 285 13,128 R 486 405Ferme Mirella Inc Guy & Carol Levac Prescott 108 290.3 289 300 282 13,124 504 409
JerseyHollylane Jerseys R & D Jarrell Ray Hastings 33 309.0 324 296 307 9,462 467 341Weberlea Jesse & Ellen Weber Waterloo 34 286.3 299 269 291 8,511 417 314Branderlea Tyler Brander Wellington 11 274.3 269 278 276 8,585 479 333
AyrshireBydand Scott Gordon Wellington 8 267.7 264 274 265 9,116 391 301Doanlea Donald Doan Oxford 8 252.3 257 243 257 8,560 * 334 281Shadylane M & T Schoeni Russell 125 250.3 247 249 255 8,824 365 299
Brown SwissGubelmann Brown Swiss Ltd Ernst Gubelmann Huron 64 304.0 298 306 308 11,356 470 410Swiss Lane A & T Rechsteiner Huron 52 276.0 284 271 273 10,628 410 359Clearcrest Farms – Simcoe 44 266.3 259 274 266 9,767 416 350
Milking ShorthornPrinsville Dairy Farms Inc B & D Prinzen Prince Edward 27 273.3 280 264 276 7,667 291 246Lynmark Tim Shearer Peterborough 29 265.0 262 261 272 7,446 297 251Prosperous Acres Jim & Judy Snyder Huron 45 246.7 246 237 257 6,471 254 221
GuernseyEby Manor Farm Ltd Jim Eby Waterloo 61 240.3 243 246 232 7,914 401 269Maplehurst Farms Ken & Chris Forster Wentworth 51 191.7 199 188 188 6,592 312 221Broadview Robert Beynon York 22 190.7 207 178 187 6,891 297 222
*3× per day or greater milking (all or part)/traite 3× par jour R: Robotic/Robotique

32
PROVINCIAL HERD AVERAGE BY BREED* / Moyenne provinciale des troupeaux selon la race
Breed/Race Herds Troupeaux
BCA/MCR 305 (Kg)
Avg/Moy Milk/Lait Fat/Gras Protein/Protéine Milk/Lait Fat/Gras Protein/Protéine
Holstein 1,745 228.4 226 234 226 10,233 393 326
Jersey 156 221.5 228 208 228 6,822 336 258
Ayrshire 23 221.2 223 215 226 7,783 309 259
Brown Swiss 23 234.4 234 236 233 9,002 366 314
Milking Shorthorn 6 242.7 246 234 249 6,761 258 223
Guernsey 5 192.7 203 187 188 6,691 309 221
Ontario 1,879 228.1 226 232 226 9,958 388 320
* Publishable/Publiables
TOP COWS FOR AVERAGE BCA BY BREED / Meilleures vaches selon la moyenne des MCR par race
Breed/Race Name/Nom Age Âge
BCA/MCR 305 (Kg)
Owner/PropriétaireAvg Moy
Milk Lait
Fat Gras
Protein Protéine
Milk Lait
Fat Gras
Protein Protéine
Holstein
Yearlings Brabantdale Let It Repeat 1-9 519.7 442 636 481 16,285 872 567 Brabantdale Farms Ltd, Russell
Brabantdale Let It Reign 1-11 517.0 443 620 488 16,527 862 581 Brabantdale Farms Ltd, Russell
2 Year Olds Blondin McCutchen Angelica 2-1 509.0 463 614 450 17,890 891 562 Brabantdale Farms Ltd, Russell
Markridge Iota Sparkles 2-10 428.3 371 506 408 16,525 830 575 Markhill Holsteins, Oxford
3 Year Olds Two Bridge Shottle Katty 3-0 433.7 418 489 394 18,035 788 551 Ontario Inc 1024248, Prescott
Two Bridge Sleeman Izie 3-4 425.3 381 516 379 17,196 862 553 Ontario Inc 1024248, Prescott
4 Year Olds S-S Holstein Reece 2059 4-0 441.7 403 551 371 20,277 1041 597 Ontario Inc 1024248, Prescott
Lilliesdale Burns Lucky Cake 4-4 439.3 391 511 416 18,922 914 641 Lillies Dale Holsteins, Leeds
5 Year Olds Lilliesdale Shotle Lucky Cream 5-9 423.7 423 457 391 20,990 845 618 Lillies Dale Holsteins, Leeds
Erdine Bronco Buckaroo 5-1 414.7 463 322 459 24,597 628 757 Erdine Farms, Peterborough
Mature Albadon Reggie Ellsa 6-9 401.3 382 463 359 20,345 902 593 Albadon Farms Ltd, Bruce
Lockmar Gibson Allison 11-8 392.0 357 438 381 18,045 811 606 Lockmar Holsteins, York
Jersey Hollylane Reward Twix 2-3 481.0 511 440 492 12,827 598 467 Hollylane Jerseys, Hastings
Hollylane Reagan Mischief 2-6 452.0 504 424 428 14,427 653 462 Hollylane Jerseys, Hastings
Ayrshire Allensite Burdette Cinnamon 2-4 644.7 706 564 664 21,680 716 671 Hollylane Jerseys, Hastings
Murisa Vande M1592 3-2 364.0 359 353 380 12,415 501 433 Wilkesview, Bruce
Brown Swiss Gubelman Brookings Katie 3-3 380.3 367 378 396 14,414 601 546 Gubelmann Brown Swiss Ltd, Huron
Nor Bella Supreme Dabble 8-5 379.7 388 376 375 17,633 680 596 Nor Bella Acres Inc, Bruce
Milking Shorthorn Koopycrest Mocha Ali Apple Et 5-5 420.3 415 445 401 12,329 530 389 Shawn Koopmans, Prince Edward
Showcase Ace Canola 1-10 394.3 362 432 389 8,368 410 292 Cnd Agriculture Museum, Carleton
Guernsey Eby Manor Vance Fran 5-1 306.0 329 304 285 12,441 571 385 Eby Manor Farm Ltd, Waterloo
Eby Manor Gary Sparkle 1-10 300.7 323 293 286 8,973 407 283 Eby Manor Farm Ltd, Waterloo

33
DEMOGRAPHICS / Démographiques
Demographic/Démographiques
Herd Size Taille du troupeau
Housing Hébergement
Frequency Fréquence
0-49 50 -99 100-199 200+ Tie Stall Entravé
Free Stall Stab. libre 2× 3× Robotic
Robotique
Herds/Troupeaux 895 1389 495 122 1,869 1,026 2,539 138 224
% of Herds/% de troupeaux 30.9 47.9 17.1 4.2 64.4 35.4 87.5 4.8 7.7
Percentage of Cows/Pourcentage de vaches 14.6 40.2 27.7 17.6 45.6 54.3 79.3 11.2 9.5
Avg Herd Size/Taille moy du troupeau 38.7 68.7 132.7 341.6 57.9 125.5 74.2 192.5 100.3
Avg 305 Milk Prod/Production de lait moy à 305 jours 9,118 9,642 10,011 10,468 9,461 9,799 9,430 11,138 10,298
Avg 305 Fat Prod/Production de gras moy à 305 jours 355 377 390 405 368 383 368 430 398
Avg 305 Protein Prod/Production de protéine moy à 305 jours 292 310 322 335 303 315 303 351 332
BCA Milk/MCR lait 206 219 226 237 214 223 213 252 234
BCA Fat/MCR gras 211 225 235 246 219 231 220 260 239
BCA Protein/MCR protéine 205 219 227 238 213 224 214 249 235
Average SCC/Moyenne du CCS 252 245 224 220 253 224 244 225 243
DISPOSAL / ÉliminationMonth/Mois 2014 2015 2016 Reason/ Raisons
January/Janvier 6,347 5,617 5,314 1 Reproductive/Reproduction 15,713 30%February/Février 5,059 4,316 4,963 2 Mastitis/High SCC/Haut comptage cellulaire 8,001 15%
March/Mars 4,836 3,449 5,709 3 Low Milk Production/Faible production de lait 7,888 15%
April/Avril 4,093 3,269 4,512 4 Sickness/Maladie 5,546 11%
May/Mai 3,555 2,998 4,188 5 Feet/Leg Problems/Problèmes de pieds et membres 5,094 10%
June/Juin 3,377 3,806 3,656 6 Udder Breakdown/Pis descendu 4,143 8%
July/Juillet 3,911 4,714 3,080 7 Injury/Accident/Blessure/Accident 2,537 5%
August/Août 3,821 4,532 3,714 8 Old Age/Vieillesse 1,868 4%
September/Septembre 4,443 4,611 3,790 9 Exported/Exportation 852 2%
October/Octobre 4,880 5,011 4,247 10 Bad Temperament/Mauvais tempérament 593 1%
November/Novembre 5,299 5,132 4,947
December/Décembre 6,099 5,077 4,435
PROVINCIAL COW AVERAGE BY BREED* / Moyenne provinciale des vaches selon la race
Breed/Race Records Relevés
Percent Pourcent
BCA/MCR 305 (Kg)
Milk/Lait Fat/Gras Protein/Protéine Milk/Lait Fat/Gras Protein/Protéine
Holstein 115,745 92.9% 232 241 232 10,461 403 333
Jersey 6,366 5.1% 231 211 231 6,883 340 261
Brown Swiss 1,194 1.0% 224 217 228 7,819 312 262
Ayrshire 829 0.7% 237 242 236 9,118 374 318
Milking Shorthorn 238 0.2% 249 237 251 6,804 261 224
Guernsey 214 0.2% 214 201 201 7,033 332 236
Ontario 124,588 232 239 232 10,231 398 328
*Publishable/Publiables
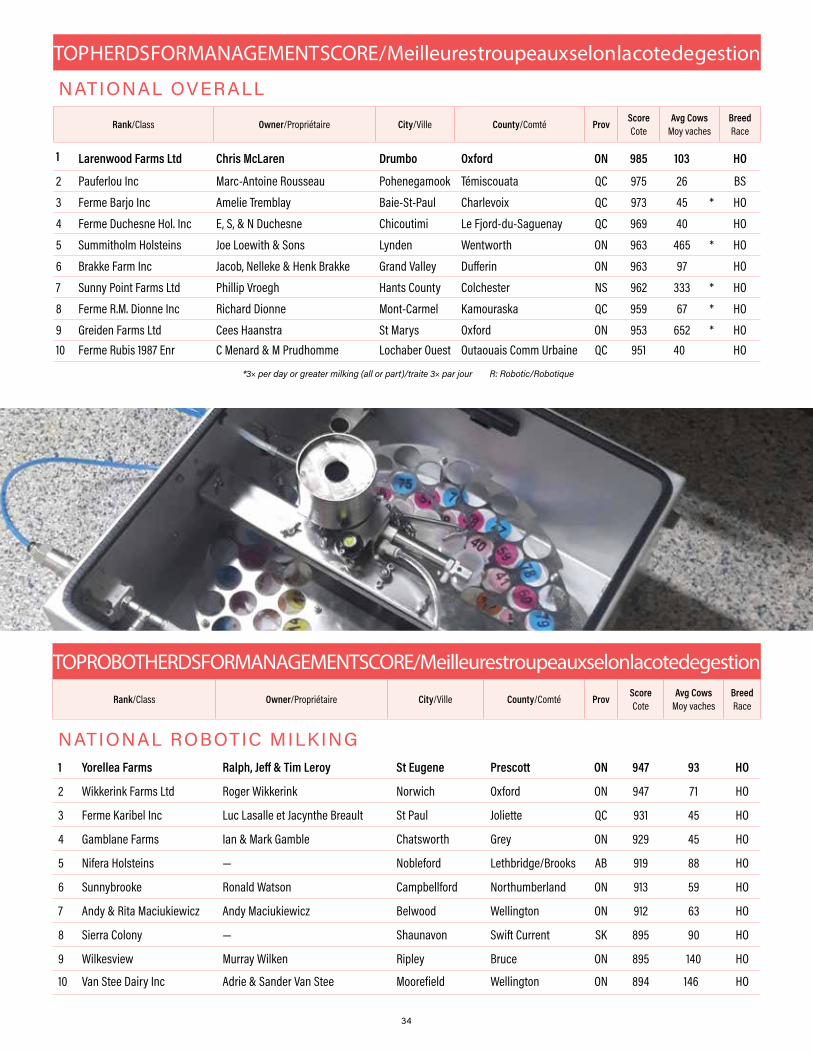
34
TOP ROBOT HERDS FOR MANAGEMENT SCORE / Meilleures troupeaux selon la cote de gestion
Rank/Class Owner/Propriétaire City/Ville County/Comté Prov Score Cote
Avg Cows Moy vaches
Breed Race
NATIONAL ROBOTIC MILKING1 Yorellea Farms Ralph, Jeff & Tim Leroy St Eugene Prescott ON 947 93 HO
2 Wikkerink Farms Ltd Roger Wikkerink Norwich Oxford ON 947 71 HO
3 Ferme Karibel Inc Luc Lasalle et Jacynthe Breault St Paul Joliette QC 931 45 HO
4 Gamblane Farms Ian & Mark Gamble Chatsworth Grey ON 929 45 HO
5 Nifera Holsteins ― Nobleford Lethbridge/Brooks AB 919 88 HO
6 Sunnybrooke Ronald Watson Campbellford Northumberland ON 913 59 HO
7 Andy & Rita Maciukiewicz Andy Maciukiewicz Belwood Wellington ON 912 63 HO
8 Sierra Colony ― Shaunavon Swift Current SK 895 90 HO
9 Wilkesview Murray Wilken Ripley Bruce ON 895 140 HO
10 Van Stee Dairy Inc Adrie & Sander Van Stee Moorefield Wellington ON 894 146 HO
TOP HERDS FOR MANAGEMENT SCORE / Meilleures troupeaux selon la cote de gestion
NATIONAL OVERALL
Rank/Class Owner/Propriétaire City/Ville County/Comté Prov Score Cote
Avg Cows Moy vaches
Breed Race
1 Larenwood Farms Ltd Chris McLaren Drumbo Oxford ON 985 103 HO
2 Pauferlou Inc Marc-Antoine Rousseau Pohenegamook Témiscouata QC 975 26 BS
3 Ferme Barjo Inc Amelie Tremblay Baie-St-Paul Charlevoix QC 973 45 * HO
4 Ferme Duchesne Hol. Inc E, S, & N Duchesne Chicoutimi Le Fjord-du-Saguenay QC 969 40 HO
5 Summitholm Holsteins Joe Loewith & Sons Lynden Wentworth ON 963 465 * HO
6 Brakke Farm Inc Jacob, Nelleke & Henk Brakke Grand Valley Dufferin ON 963 97 HO
7 Sunny Point Farms Ltd Phillip Vroegh Hants County Colchester NS 962 333 * HO
8 Ferme R.M. Dionne Inc Richard Dionne Mont-Carmel Kamouraska QC 959 67 * HO
9 Greiden Farms Ltd Cees Haanstra St Marys Oxford ON 953 652 * HO10 Ferme Rubis 1987 Enr C Menard & M Prudhomme Lochaber Ouest Outaouais Comm Urbaine QC 951 40 HO
*3× per day or greater milking (all or part)/traite 3× par jour R: Robotic/Robotique

35
TOP HERDS FOR MANAGEMENT SCORE / Meilleures troupeaux selon la cote de gestion
PROVINCIAL OVERALL
Rank/Class Owner/Propriétaire City/Ville County/Comté Score Cote
Avg Cows Moy vaches
Breed Race
1 Larenwood Farms Ltd Chris McLaren Drumbo Oxford 985 103 HO
2 Summitholm Holsteins Joe Loewith & Sons Lynden Wentworth 963 465 * HO3 Brakke Farm Inc Jacob, Nelleke & Henk Brakke Grand Valley Dufferin 963 97 HO4 Greiden Farms Ltd Cees Haanstra St Marys Oxford 953 652 * HO5 Yorellea Farms Ralph, Jeff & Tim Leroy St Eugene Prescott 947 93 R HO6 Wikkerink Farms Ltd Roger Wikkerink Norwich Oxford 947 71 R HO7 Albadon Farms Ltd Mark & Josh Ireland Teeswater Bruce 945 221 * HO8 Ora Et Labora Inc John Branderhorst Hensall Huron 941 61 * HO9 Wilmarlea Farms John & Willard Mackay Embro Oxford 939 164 * HO10 Pfister Dairy Farm Hans Pfister Mitchell Perth 935 87 HO11 Gamblane Farms Ian & Mark Gamble Chatsworth Grey 929 45 R HO12 JPC Farms Inc Jamie Beaumont Mitchell Perth 927 168 * HO13 Stewardson Dairy Inc ― Thedford Lambton 923 298 * HO14 A, M & M Zandbelt ― Metcalfe Carleton 915 59 HO15 Sunnybrooke Ronald Watson Campbellford Northumberland 913 59 R HO16 Marelvue Farms Eli & Elizabeth Martin Gowanstown Perth 913 83 HO17 A & R Maciukiewicz Andy Maciukiewicz Belwood Wellington 912 63 R HO18 Muilwyk Farms Ltd ― Brownsville Elgin 911 90 HO19 Reijnen Dairy Farms Jeffery & Monique Reijnen St Marys Perth 911 196 HO20 Jaygars Mooing Meadows Gary Martin Arthur Wellington 908 56 HO21 Eldonna Farm Murray & Sandra Sherk Plattsville Waterloo 906 124 * HO22 Markwood Farms Inc Peter & Pauline Markus Beachville Oxford 906 153 HO23 Deboer Holst Ben & Anieta Deboer Selkirk Haldimand 905 100 * HO24 Ritchdale Farms Doug & Glen Ritchie Elmvale Simcoe 905 82 HO25 Paradigm Holsteins Steve Vandendool Woodstock Oxford 898 81 * HO26 Dairydale John Garner Embro Oxford 897 115 * HO27 Shiness Holsteins Ltd Glen & Dan Matheson Embro Oxford 896 104 * HO28 Wilkesview Murray Wilken Ripley Bruce 895 140 R HO29 Leutenegger Farms Roman Leutenegger Gowanstown Perth 895 115 HO30 Van Stee Dairy Adrie Van Stee Moorefield Wellington 894 146 R HO31 Ferme Mirella Inc Guy & Carol Levac St Bernardin Prescott 893 131 HO32 Zethill Farms Ltd Russell & Joyce Zettler Hanover Bruce 893 39 HO33 Krul Holsteins Ltd Jeff & John Krul Arthur Wellington 893 101 HO34 Weppler Farms Ltd Carman Weppler Clifford Grey 893 31 HO35 Ferme LCM Quesnel Inc Marc Quesnel Moose Creek Stormont 893 185 * HO36 Pleasant Hill Holsteins Inc Roger Spriel St Marys Perth 889 119 HO37 Topfarm Holsteins Gerald & Janet Vanbokhorst Osgoode Carleton 889 77 HO38 Rosenhill Farm Inc Andre Hildbrand St Albert Russell 889 104 HO39 Kooi Pleats Dairy Inc Willem & Martine Van Der Kooi Moorefield Wellington 889 122 HO40 Alexerin Dairy Inc Ron & Todd Nixon Manotick Carleton 887 191 * HO
*3× per day or greater milking (all or part)/traite 3× par jour R: Robotic/Robotique

TM
Plant the BestFROM THE ALFALFA AUTHORITYMore tonnes per acreMore cuttings per yearMore profitability for you!
We can prove it! ASK your local FS Crop Specialist how you can takethe HQ Challenge!
When you partner with your local FS Co-operative Crop Specialist, you’re getting expert agronomic recommendations from someone who knows your operation and will be there with you throughout the season.
WL 354HQExceptional quality and productivity in your toughest soils, with high resistance to all root rots that attack alfalfa.
Choose from four OUTSTANDING alfalfas:
WL 366HQExtremely winter-hardy with fast recovery.
WL 319HQHigh tonnage and superior forage quality!
WL 358LHA powerful new weapon in the battle against potato leafhopper.
Lucknow District Co-operative ........................... 519-529-7953
North Wellington Co-operative Services .......... 519-338-2331
Sunderland Co-operative ..................................... 705-357-3491
Thunder Bay Co-operative Farm Supplies ........ 807-475-5190
Vineland Growers Co-operative ......................... 905-562-4642
Wanstead Farmers Co-operative ........................ 519-845-3301
For more information, contact your local FS Co-operative
AGRIS Co-operative .................................................. 519-287-3434
Co-operative Regional de Nipissing Sudbury ..... 800-361-9255
Durham Farmers’ County Co-op .............................. 905-983-9134
FS PARTNERS ............................................................ 519-638-3026
Huron Bay Co-operative .......................................... 519-392-6862
La Co-operative Agricole d’Embrun ...................... 613-443-2833
NEW
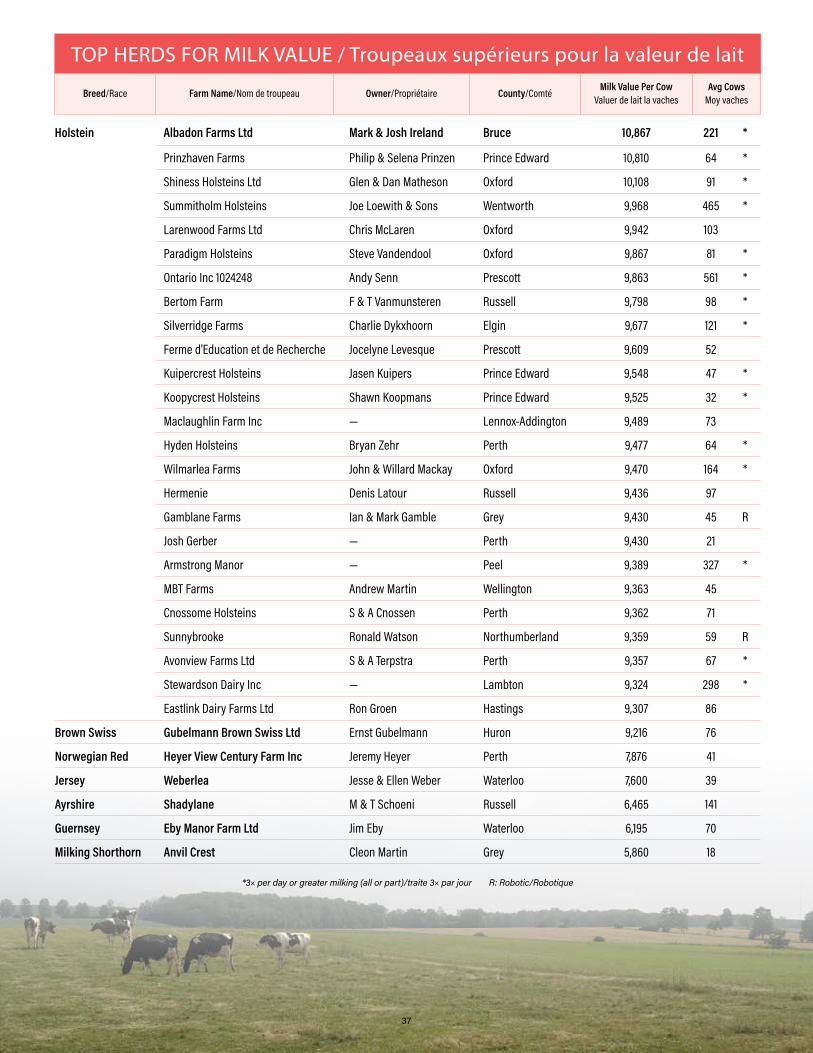
37
TOP HERDS FOR MILK VALUE / Troupeaux supérieurs pour la valeur de lait
Breed/Race Farm Name/Nom de troupeau Owner/Propriétaire County/Comté Milk Value Per Cow Valuer de lait la vaches
Avg Cows Moy vaches
Holstein Albadon Farms Ltd Mark & Josh Ireland Bruce 10,867 221 *
Prinzhaven Farms Philip & Selena Prinzen Prince Edward 10,810 64 *
Shiness Holsteins Ltd Glen & Dan Matheson Oxford 10,108 91 *
Summitholm Holsteins Joe Loewith & Sons Wentworth 9,968 465 *
Larenwood Farms Ltd Chris McLaren Oxford 9,942 103
Paradigm Holsteins Steve Vandendool Oxford 9,867 81 *
Ontario Inc 1024248 Andy Senn Prescott 9,863 561 *
Bertom Farm F & T Vanmunsteren Russell 9,798 98 *
Silverridge Farms Charlie Dykxhoorn Elgin 9,677 121 *
Ferme d'Education et de Recherche Jocelyne Levesque Prescott 9,609 52
Kuipercrest Holsteins Jasen Kuipers Prince Edward 9,548 47 *
Koopycrest Holsteins Shawn Koopmans Prince Edward 9,525 32 *
Maclaughlin Farm Inc ― Lennox-Addington 9,489 73
Hyden Holsteins Bryan Zehr Perth 9,477 64 *
Wilmarlea Farms John & Willard Mackay Oxford 9,470 164 *
Hermenie Denis Latour Russell 9,436 97
Gamblane Farms Ian & Mark Gamble Grey 9,430 45 R
Josh Gerber ― Perth 9,430 21
Armstrong Manor ― Peel 9,389 327 *
MBT Farms Andrew Martin Wellington 9,363 45
Cnossome Holsteins S & A Cnossen Perth 9,362 71
Sunnybrooke Ronald Watson Northumberland 9,359 59 R
Avonview Farms Ltd S & A Terpstra Perth 9,357 67 *
Stewardson Dairy Inc ― Lambton 9,324 298 *
Eastlink Dairy Farms Ltd Ron Groen Hastings 9,307 86
Brown Swiss Gubelmann Brown Swiss Ltd Ernst Gubelmann Huron 9,216 76
Norwegian Red Heyer View Century Farm Inc Jeremy Heyer Perth 7,876 41
Jersey Weberlea Jesse & Ellen Weber Waterloo 7,600 39
Ayrshire Shadylane M & T Schoeni Russell 6,465 141
Guernsey Eby Manor Farm Ltd Jim Eby Waterloo 6,195 70
Milking Shorthorn Anvil Crest Cleon Martin Grey 5,860 18
*3× per day or greater milking (all or part)/traite 3× par jour R: Robotic/Robotique

38
HERD MANAGEMENT SCORE / Cote de gestion de troupeaux Top Ten Percent in the Province / Le meilleur dix pour cent des troupeaux dans la province
County/Comté Farm/Ferme Owner/Propriétaire City/Ville Score/Cote Avg Cows/Moy vaches Breed/Race
Brant Talsma Farms Inc Steve & Sharon Talsma Harley 846 92 R HOButtermine Farms Inc Chris Vandenberg Harley 821 96 R HOWill-Cher Farm Bill & Cheryl Donkers Branchton 807 74 HOKnillstead Farm Ltd Keith & John Knill Princeton 793 95 HO
Bruce Albadon Farms Ltd Mark & Josh Ireland Teeswater 945 221 * HOWilkesview Murray Wilken Ripley 895 140 R HOZethill Farms Ltd Russell & Joyce Zettler Hanover 893 39 HOBelmoral Farms Ltd David & Mitch Kieffer Teeswater 887 71 HOSteve & Amanda Hammell ― Dobbinton 884 38 R HOIkendale Farms Ltd ― Walkerton 873 370 * HOLowlace Farms J & B Wallace Port Elgin 857 87 HORG & G Farms Ltd Geoff Farrell Kincardine 830 64 R HODoral Farms Inc ― Teeswater 829 73 HOBryceholme Brian Weber Allenford 814 83 HOHolmdale Farms ― Elmwood 813 152 R HOPrehnbrook Farms Ltd ― Ripley 795 295 * HO
Carleton Mary-Ann & M Zandbelt ― Metcalfe 915 59 HOTopfarm Holsteins Gerald & Janet Vanbokhorst Osgoode 889 77 HOAlexerin Dairy Inc Ron & Todd Nixon Manotick 887 191 * HO
*3× per day or greater milking (all or part)/traite 3× par jour R: Robotic/Robotique
Visit bmo.com/agricultureor call 1-877-629-6262
Financing the future of agriculture.

39
HERD MANAGEMENT SCORE / Cote de gestion de troupeaux Top Ten Percent in the Province / Le meilleur dix pour cent des troupeaux dans la province
County/Comté Farm/Ferme Owner/Propriétaire City/Ville Score/Cote Avg Cows/Moy vaches Breed/Race
Carleton (con’t) Blackrapids Farms Peter & Rosemary Ruiter Nepean 876 47 HOGruen Valley Farm Ltd Thom & Wilma Mueller Osgoode 875 100 HOMidlee Holsteins J & B McDiarmid & Sons Osgoode 871 105 HORangedale Farms Mike & Rita Heuving Osgoode 835 78 HODonevelyn Farms Ltd ― Metcalfe 833 173 * HOWeeberlac Tim & Diane Groniger Carlsbad Spring 830 39 * HOCornerview Farm Chris Schouten Richmond 811 724 * HO
Dufferin Brakke Farm Inc Jacob, Nelleke & Henk Brakke Grand Valley 963 97 HOMarsville Holsteins Melis Brouwer East Garafraxa 853 94 HOSwissbell Walter & Marlie Kaehli Grand Valley 806 85 R JESimonhof Farms Ltd Eiko Oosterhof Grand Valley 802 72 HODeaksview Ron & Lisa Deaken Grand Valley 793 78 HO
Dundas Fredwill Holsteins Albert & Linda Harbers Brinston 855 84 * HORicrodreg Holsteins Dwight Gilmer & Sons Ltd South Mountain 835 194 R HOTibben Farms ― Brinston 830 194 R HOBreteler Farms Inc Paul Breteler Winchester 826 124 HOVriesdale Henry & Robert Velthuis Mountain 822 144 R HOSandycreek Farms Dave Verburg Iroquois 803 68 R HOMorning Sun R & T Cornelissen & Sons Chesterville 789 83 R HO
Elgin Muilwyk Farms Ltd ― Brownsville 911 90 HOSilverridge Farms Charlie Dykxhoorn Springfield 870 121 * HOMaplekeys Farms Paul Vis Aylmer 840 284 HOVerhoef Dairy Farm Inc Reinoud & Klaartje Verhoef Belmont 825 183 * HO
Glengarry Lochdale David MacMillan Alexandria 879 64 HOTansymoss Paul & Shawna Chaddock Lancaster 876 126 * HOHeidi Farms Inc Paul Oeggerli Bainsville 876 346 HO
Grenville Gerann Holsteins John & Dawn Wynands Cardinal 829 234 * HORideauside Farms Inc ― Kemptville 799 274 * HO
Grey Gamblane Farms Ian & Mark Gamble Chatsworth 929 45 R HOWeppler Farms Ltd Carman Weppler Clifford 893 31 HOValleykirk R & M Kirkconnell Owen Sound 869 55 HOSandyland Holsteins Merle Frey Mount Forest 862 46 HOWayne Martin ― Mount Forest 814 41 HOGlenwin Holsteins Patti Alsop Singhampton 785 150 HO
Haldimand Deboer Holst Ben & Anieta Deboer Selkirk 905 100 * HOSpring Knoll Dairy Inc Stan Heeg Hagersville 809 34 R HOZants Holsteins Chris Zantingh Dunnville 798 103 HO
Hastings Eggleton Farms Inc R, A & S Eggleton Belleville 837 57 HOEastlink Dairy Farms Ltd Ron Groen Stirling 788 86 HO
Huron Ora Et Labora Inc John Branderhorst Hensall 941 61 * HOBeeline Holsteins Rob Moffat Wingham 873 66 HOGubelmann Brown Swiss Ltd Ernst Gubelmann Walton 869 76 BSVan Dieten Farms Inc Hank & Derek Van Dieten Seaforth 869 90 * HOAlmelo Holsteins Ben & Sandy Terpstra Brussels 846 221 HOEckerlea Acres Christa Eckert Seaforth 842 242 * HOGuntensperger Dairy Inc Karl Guntensperger Seaforth 837 154 HOEvergreen Holsteins Robert Van Nes Ethel 832 557 HO
*3× per day or greater milking (all or part)/traite 3× par jour R: Robotic/Robotique
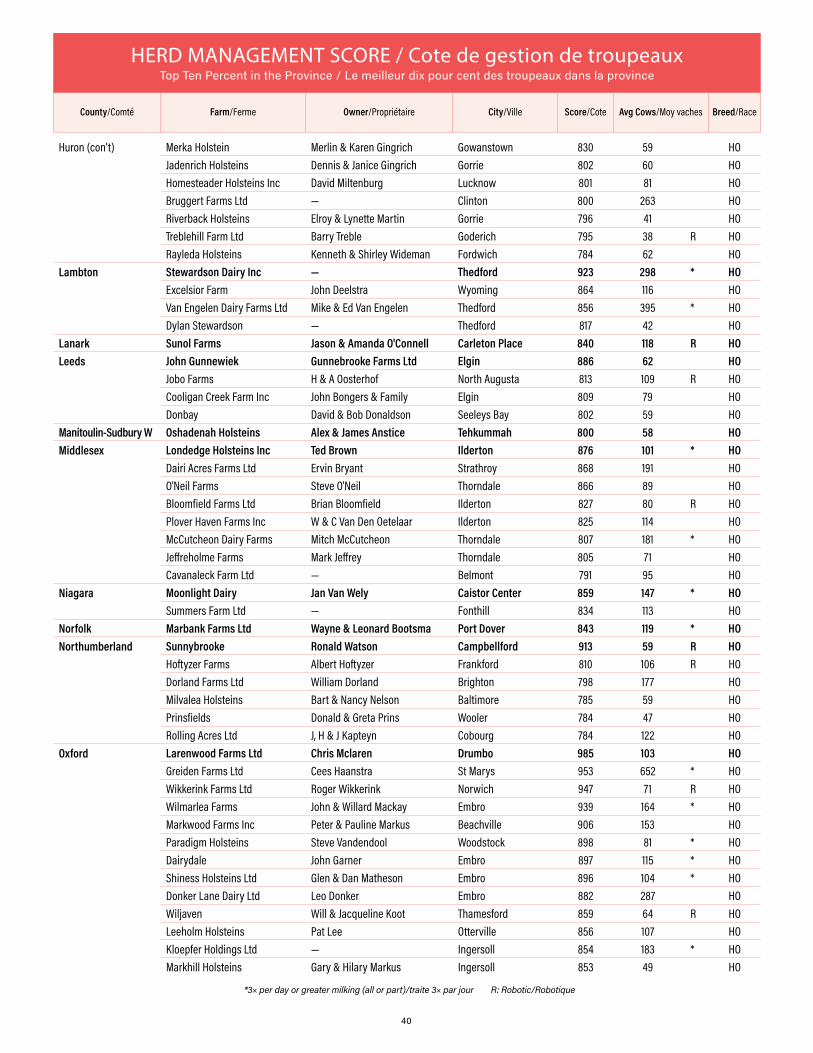
40
HERD MANAGEMENT SCORE / Cote de gestion de troupeaux Top Ten Percent in the Province / Le meilleur dix pour cent des troupeaux dans la province
County/Comté Farm/Ferme Owner/Propriétaire City/Ville Score/Cote Avg Cows/Moy vaches Breed/Race
Huron (con’t) Merka Holstein Merlin & Karen Gingrich Gowanstown 830 59 HOJadenrich Holsteins Dennis & Janice Gingrich Gorrie 802 60 HOHomesteader Holsteins Inc David Miltenburg Lucknow 801 81 HOBruggert Farms Ltd ― Clinton 800 263 HORiverback Holsteins Elroy & Lynette Martin Gorrie 796 41 HOTreblehill Farm Ltd Barry Treble Goderich 795 38 R HORayleda Holsteins Kenneth & Shirley Wideman Fordwich 784 62 HO
Lambton Stewardson Dairy Inc ― Thedford 923 298 * HOExcelsior Farm John Deelstra Wyoming 864 116 HOVan Engelen Dairy Farms Ltd Mike & Ed Van Engelen Thedford 856 395 * HODylan Stewardson ― Thedford 817 42 HO
Lanark Sunol Farms Jason & Amanda O'Connell Carleton Place 840 118 R HOLeeds John Gunnewiek Gunnebrooke Farms Ltd Elgin 886 62 HO
Jobo Farms H & A Oosterhof North Augusta 813 109 R HOCooligan Creek Farm Inc John Bongers & Family Elgin 809 79 HODonbay David & Bob Donaldson Seeleys Bay 802 59 HO
Manitoulin-Sudbury W Oshadenah Holsteins Alex & James Anstice Tehkummah 800 58 HOMiddlesex Londedge Holsteins Inc Ted Brown Ilderton 876 101 * HO
Dairi Acres Farms Ltd Ervin Bryant Strathroy 868 191 HOO'Neil Farms Steve O'Neil Thorndale 866 89 HOBloomfield Farms Ltd Brian Bloomfield Ilderton 827 80 R HOPlover Haven Farms Inc W & C Van Den Oetelaar Ilderton 825 114 HOMcCutcheon Dairy Farms Mitch McCutcheon Thorndale 807 181 * HOJeffreholme Farms Mark Jeffrey Thorndale 805 71 HOCavanaleck Farm Ltd ― Belmont 791 95 HO
Niagara Moonlight Dairy Jan Van Wely Caistor Center 859 147 * HOSummers Farm Ltd ― Fonthill 834 113 HO
Norfolk Marbank Farms Ltd Wayne & Leonard Bootsma Port Dover 843 119 * HONorthumberland Sunnybrooke Ronald Watson Campbellford 913 59 R HO
Hoftyzer Farms Albert Hoftyzer Frankford 810 106 R HODorland Farms Ltd William Dorland Brighton 798 177 HOMilvalea Holsteins Bart & Nancy Nelson Baltimore 785 59 HOPrinsfields Donald & Greta Prins Wooler 784 47 HORolling Acres Ltd J, H & J Kapteyn Cobourg 784 122 HO
Oxford Larenwood Farms Ltd Chris Mclaren Drumbo 985 103 HOGreiden Farms Ltd Cees Haanstra St Marys 953 652 * HOWikkerink Farms Ltd Roger Wikkerink Norwich 947 71 R HOWilmarlea Farms John & Willard Mackay Embro 939 164 * HOMarkwood Farms Inc Peter & Pauline Markus Beachville 906 153 HOParadigm Holsteins Steve Vandendool Woodstock 898 81 * HODairydale John Garner Embro 897 115 * HOShiness Holsteins Ltd Glen & Dan Matheson Embro 896 104 * HODonker Lane Dairy Ltd Leo Donker Embro 882 287 HOWiljaven Will & Jacqueline Koot Thamesford 859 64 R HOLeeholm Holsteins Pat Lee Otterville 856 107 HOKloepfer Holdings Ltd ― Ingersoll 854 183 * HOMarkhill Holsteins Gary & Hilary Markus Ingersoll 853 49 HO
*3× per day or greater milking (all or part)/traite 3× par jour R: Robotic/Robotique
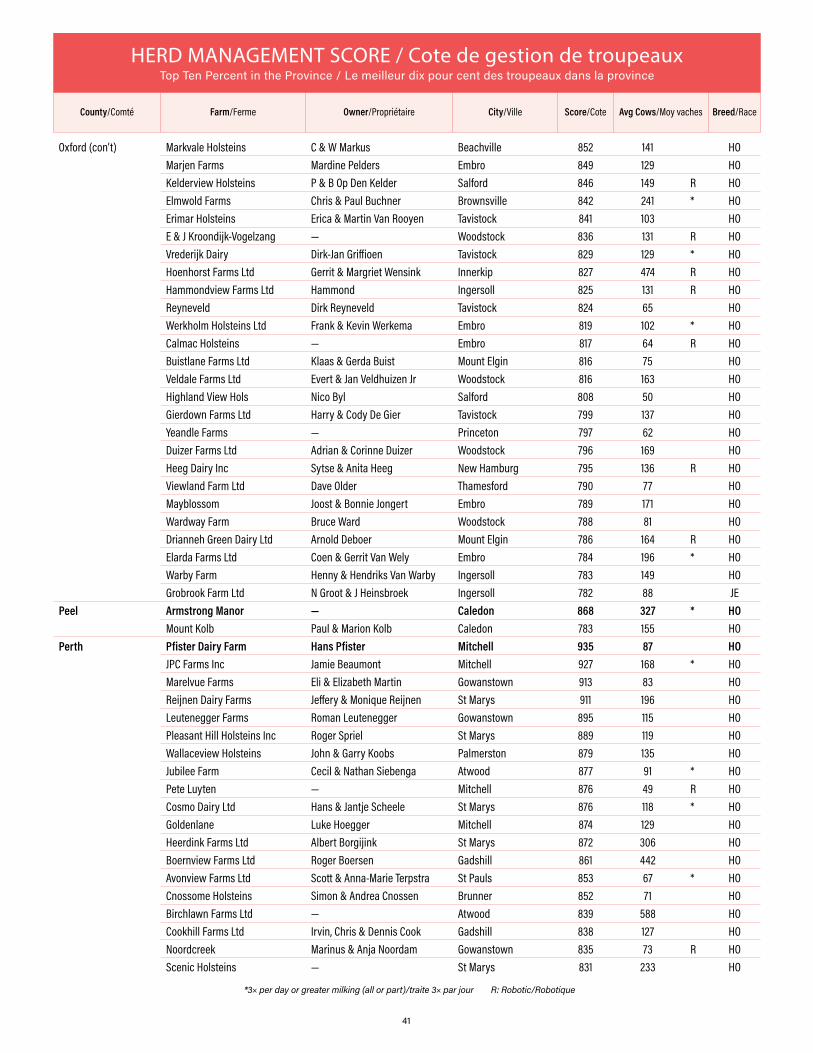
41
HERD MANAGEMENT SCORE / Cote de gestion de troupeaux Top Ten Percent in the Province / Le meilleur dix pour cent des troupeaux dans la province
County/Comté Farm/Ferme Owner/Propriétaire City/Ville Score/Cote Avg Cows/Moy vaches Breed/Race
Oxford (con’t) Markvale Holsteins C & W Markus Beachville 852 141 HOMarjen Farms Mardine Pelders Embro 849 129 HOKelderview Holsteins P & B Op Den Kelder Salford 846 149 R HOElmwold Farms Chris & Paul Buchner Brownsville 842 241 * HOErimar Holsteins Erica & Martin Van Rooyen Tavistock 841 103 HOE & J Kroondijk-Vogelzang ― Woodstock 836 131 R HOVrederijk Dairy Dirk-Jan Griffioen Tavistock 829 129 * HOHoenhorst Farms Ltd Gerrit & Margriet Wensink Innerkip 827 474 R HOHammondview Farms Ltd Hammond Ingersoll 825 131 R HOReyneveld Dirk Reyneveld Tavistock 824 65 HOWerkholm Holsteins Ltd Frank & Kevin Werkema Embro 819 102 * HOCalmac Holsteins ― Embro 817 64 R HOBuistlane Farms Ltd Klaas & Gerda Buist Mount Elgin 816 75 HOVeldale Farms Ltd Evert & Jan Veldhuizen Jr Woodstock 816 163 HOHighland View Hols Nico Byl Salford 808 50 HOGierdown Farms Ltd Harry & Cody De Gier Tavistock 799 137 HOYeandle Farms ― Princeton 797 62 HODuizer Farms Ltd Adrian & Corinne Duizer Woodstock 796 169 HOHeeg Dairy Inc Sytse & Anita Heeg New Hamburg 795 136 R HOViewland Farm Ltd Dave Older Thamesford 790 77 HOMayblossom Joost & Bonnie Jongert Embro 789 171 HOWardway Farm Bruce Ward Woodstock 788 81 HODrianneh Green Dairy Ltd Arnold Deboer Mount Elgin 786 164 R HOElarda Farms Ltd Coen & Gerrit Van Wely Embro 784 196 * HOWarby Farm Henny & Hendriks Van Warby Ingersoll 783 149 HOGrobrook Farm Ltd N Groot & J Heinsbroek Ingersoll 782 88 JE
Peel Armstrong Manor ― Caledon 868 327 * HOMount Kolb Paul & Marion Kolb Caledon 783 155 HO
Perth Pfister Dairy Farm Hans Pfister Mitchell 935 87 HOJPC Farms Inc Jamie Beaumont Mitchell 927 168 * HOMarelvue Farms Eli & Elizabeth Martin Gowanstown 913 83 HOReijnen Dairy Farms Jeffery & Monique Reijnen St Marys 911 196 HOLeutenegger Farms Roman Leutenegger Gowanstown 895 115 HOPleasant Hill Holsteins Inc Roger Spriel St Marys 889 119 HOWallaceview Holsteins John & Garry Koobs Palmerston 879 135 HOJubilee Farm Cecil & Nathan Siebenga Atwood 877 91 * HOPete Luyten ― Mitchell 876 49 R HOCosmo Dairy Ltd Hans & Jantje Scheele St Marys 876 118 * HOGoldenlane Luke Hoegger Mitchell 874 129 HOHeerdink Farms Ltd Albert Borgijink St Marys 872 306 HOBoernview Farms Ltd Roger Boersen Gadshill 861 442 HOAvonview Farms Ltd Scott & Anna-Marie Terpstra St Pauls 853 67 * HOCnossome Holsteins Simon & Andrea Cnossen Brunner 852 71 HOBirchlawn Farms Ltd ― Atwood 839 588 HOCookhill Farms Ltd Irvin, Chris & Dennis Cook Gadshill 838 127 HONoordcreek Marinus & Anja Noordam Gowanstown 835 73 R HOScenic Holsteins ― St Marys 831 233 HO
*3× per day or greater milking (all or part)/traite 3× par jour R: Robotic/Robotique

42
HERD MANAGEMENT SCORE / Cote de gestion de troupeaux Top Ten Percent in the Province / Le meilleur dix pour cent des troupeaux dans la province
County/Comté Farm/Ferme Owner/Propriétaire City/Ville Score/Cote Avg Cows/Moy vaches Breed/Race
Perth (con’t) Kevcrest Holsteins Kevin Beuermann Mitchell 830 57 R HOSlits Dairy Farm Pedro & Jolanda Slits Brunner 829 193 HOMerdell Dairy Farm Inc Kevin & Sandy Riddell Newton 810 130 R HOZehrdale Dale Zehr Milverton 809 31 HOMDF Hans & Daniela Meier Gowanstown 804 65 * HOAthlone Farms Brian Anderson Tavistock 803 159 HOAvonbank Holsteins Henry & Kevin Wydeven St Marys 799 114 * HODanzel Holsteins Ed & Julie Danen Shakespeare 799 127 * HOPendora Dairy Rick & Ingrid Portena Monkton 798 374 * HODelton Weber ― Listowel 798 33 HOGreydanus Farms Jason & Kara Greydanus Gowanstown 792 78 HOHyden Holsteins Bryan Zehr Milverton 790 64 * HOHeulcrest Farms Ltd Gys & Ria Dewit St Pauls 789 128 HO
Peterborough Embrdale Farm ― Asphodel-Norwood 830 76 * HOPrescott Yorellea Farms Ralph, Jeff & Tim Leroy St Eugene 947 93 R HO
Ferme Mirella Inc Guy & Carol Levac St Bernardin 893 131 HORedstone Farm Stefan & Linda Kunz St Eugene 874 107 HODuffeynial Jean-Marie & Felix Duffey L'Orignal 873 101 HOHaspengouw Farm Inc Marc & Josee Valkenborg Casselman 872 75 HOFerme Lavigne Inc Alain & Jean-Pierre Lavigne Ste Anne De Prescott 867 144 * HOOntario Inc 1024248 Andy Senn St Bernardin 852 561 * HOOverdale Farm Gerry Overvest L'Orignal 814 98 HOFerme Cavalait Alain & Claudine Poirier Lefaivre 809 55 JEWilkridge Farm Ken & Peggy Wilkes Fournier 795 72 HOFerme Serheal Claude & Celine Seguin St Isidore 783 86 HO
Prince Edward Prinzhaven Farms Philip & Selena Prinzen Bloomfield 828 87 * HOMaypulayn Farms Martin & Angela Miller Milford 813 71 HO
Renfrew Enright Dairy Farms Mike & Jerry Enright Renfrew 788 256 * HORussell Rosenhill Farm Inc Andre Hildbrand St Albert 889 104 HO
Ferme A & L Desnoyers ― St Albert 878 101 HOFerme St Malo Inc Etienne Seguin St Pascal 877 80 HOHeiwa Farm Walter Von Ah St Albert 868 122 HOSunrise Holsteins Inc Edgar & Ramona Kaelin Clarence Creek 861 56 HOClearview Farm Chris & Abbie Mueller Clarence Creek 854 85 HOHermenie Denis Latour St Albert 825 97 HOFerme Philos Inc Philippe Etter Sarsfield 814 142 HOFerme DD Gascon et Fils Inc Denis Gascon Navan 810 63 HOMelistar Marc Bergeron Vars 808 89 HOLa Ferme Ben-Rey-Mo Ltd Reynald Benoit St Albert 796 99 HOBerwen Holsteins Bert & Wendy Molenaar Cumberland 793 47 HODlasept Jacques Lafleche St Albert 787 99 HO
Simcoe Ritchdale Farms Doug & Glen Ritchie Elmvale 905 82 HOClearcrest Farms ― New Lowell 838 62 BS
Stormont Ferme LCM Quesnel Inc Marc Quesnel Moose Creek 893 185 * HOThunder Bay Candyview Farm ― Slate River 819 72 * HO
*3× per day or greater milking (all or part)/traite 3× par jour R: Robotic/Robotique

43
HERD MANAGEMENT SCORE / Cote de gestion de troupeaux Top Ten Percent in the Province / Le meilleur dix pour cent des troupeaux dans la province
County/Comté Farm/Ferme Owner/Propriétaire City/Ville Score/Cote Avg Cows/Moy vaches Breed/Race
Waterloo Eldonna Farm Murray & Sandra Sherk Plattsville 906 124 * HOWebine Holsteins Lewis & Pauline Weber Elmira 878 54 HOCedarbrook Clare Martin Elmira 869 71 HONith Crest Farms Limited Larry Jantzi Wellesley 869 136 HOMintvalley Farms Inc ― Breslau 868 128 HOQuiet Oak Holsteins John & Angela Van Bergeijk New Hamburg 864 168 HOLebold Farms Inc Terry & Susan Lebold Wellesley 856 96 HOWoolview Lester & Shirley Gingrich Elmira 848 43 HOOntowa ― Elmira 846 109 HOGreen Acre Farms Ltd T, G, D & A Wagler New Hamburg 845 173 HOEzra & Jackie Martin ― Waterloo 834 35 HOCitilimits N, B & J Dietrich St Agatha 834 114 HOCleon Gingrich ― Drayton 822 50 HOClaynook Farms Ltd W, D & M Wagler New Hamburg 817 205 HORoute Two Holstein Harvey Martin Elmira 809 46 HOCherrydale Jerseys George Martin Waterloo 807 63 JEWebnook Holsteins Gary Weber Elmira 804 47 HOHidden Lane Dairy Inc Kyle & Jolene Horst Elmira 804 48 HOLaverne & Marlene Martin ― Waterloo 802 41 HOMurray & Charlene Brubacher ― Elmira 802 60 HOCleossy Cleason Wideman St Jacobs 798 43 HOValleymar Melvin Martin Waterloo 796 37 HOAvelee Holsteins Maynard & Vera Shantz Waterloo 788 45 HOWeberlea Jesse & Ellen Weber St Clements 788 39 JELen-Ed Holsteins Leonard Martin Linwood 783 45 HO
Wellington Andy & Rita Maciukiewicz Andy Maciukiewicz Belwood 912 63 R HOJaygar's Mooing Meadows Gary Martin Arthur 908 56 HOVan Stee Dairy Adrie Van Stee Moorefield 894 146 R HOKrul Holsteins Ltd Jeff & John Krul Arthur 893 101 HOKooi Pleats Dairy Inc W & M Van Der Kooi Moorefield 889 122 HOBradco Holsteins Inc Brad & Connie Lichty Wallenstein 886 50 HODannroving Holsteins Matt & Jill Dann Palmerston 876 79 HOMBT Farms Andrew Martin Alma 872 52 HOMelmar Holsteins Melvin Martin Mount Forest 872 58 HOCnossen Holsteins ― Elora 858 134 HOHartland Holsteins Corey & Henrietta Heimpel Moorefield 850 47 HOEdward Weber ― Mount Forest 849 42 HOStirtoga Farm Ltd Tom & Jake Devries Drayton 848 125 HOMayhaven Paul & Tim May Rockwood 847 45 HOOpsterlawn Marten Bylsma Alma 842 319 HOHillmeadows Farms Inc Doug & Sandy Sikkema Moorefield 838 89 HONelson Weber ― Wallenstein 832 57 HOBouwman Holsteins Inc Klaas Bouwman Guelph 829 321 * HOSigview Farms Simon & Kristina Signer Moorefield 819 55 BSWeblea Duane & Rhonda Weber Alma 818 52 HOLeonard Frey ― Elora 815 42 HOKosterview Farms John Koster Harriston 815 52 R HO
*3× per day or greater milking (all or part)/traite 3× par jour R: Robotic/Robotique

44
HERD MANAGEMENT SCORE / Cote de gestion de troupeaux Top Ten Percent in the Province / Le meilleur dix pour cent des troupeaux dans la province
County/Comté Farm/Ferme Owner/Propriétaire City/Ville Score/Cote Avg Cows/Moy vaches Breed/Race
Wellington (con’t) Amon Bearinger ― Harriston 814 54 HORosymill Holsteins Elo & Barbara Bowman Listowel 813 22 HOTunecroft Jim & Teresa Teune Clifford 810 58 HODouanne Holsteins R & S Diefenbacher Gowanstown 808 68 HOWiebe Huizinga ― Belwood 807 63 HOMilky Lane Eric & Bettina Schuurmans Drayton 806 51 HOBellwin Bellwin Farms Inc Elora 804 74 HOCreekside Holsteins Joel Frey Elora 803 55 HOMarbruck Holsteins Gary & Carolyn Martin Drayton 802 67 HOFloyd & Loreen Martin ― Clifford 800 46 HOMapledrive Holsteins Kent Martin Drayton 796 51 HOSharmaple Ernie Martin Alma 794 110 HOMaynard Bauman ― Wallenstein 792 33 HOMervin & Mildred Martin ― Elmira 790 46 HOBrookside Luke & Vera Martin Mount Forest 789 57 HOVernon & Edna Martin ― Mount Forest 789 42 HOWebton Farms Ray & Sara Weber Alma 784 76 HO
Wentworth Summitholm Holsteins Joe Loewith & Sons Lynden 963 465 * HO
*3× per day or greater milking (all or part)/traite 3× par jour R: Robotic/Robotique
Save dollars and make sensewith accounting software built for agriculture
Keep your business on track and
on budget with AgExpert Analyst –
do everything from basic bookkeeping
to GST returns, inventory management,
payroll, forecasts, automated or
customized reports, and more.
fccsoftware.ca | 1-800-667-7893
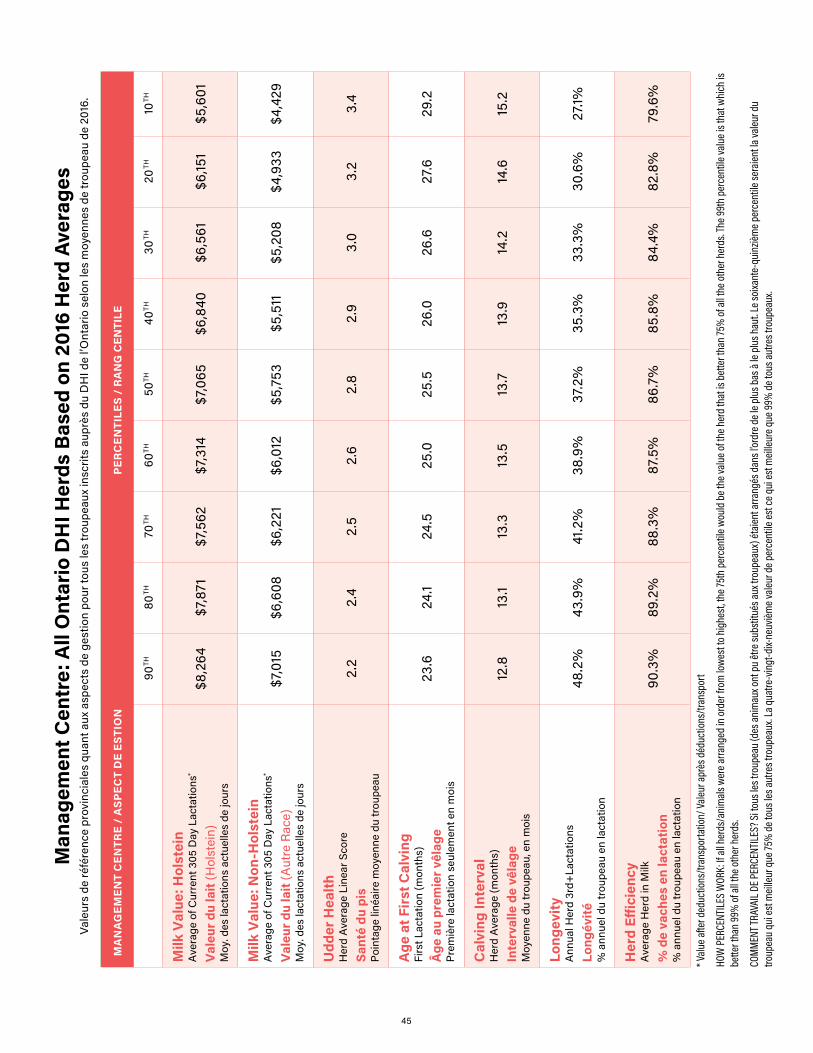
45
Man
agem
ent C
entr
e: A
ll O
ntar
io D
HI H
erds
Bas
ed o
n 20
16 H
erd
Aver
ages
Vale
urs
de ré
fére
nce
prov
inci
ales
qua
nt a
ux a
spec
ts d
e ge
stio
n po
ur to
us le
s tr
oupe
aux
insc
rits
aupr
ès d
u D
HI d
e l’O
ntar
io s
elon
les
moy
enne
s de
trou
peau
de
2016
.
MA
NA
GEM
ENT
CEN
TRE
/ A
SP
ECT
DE
ESTI
ON
PER
CEN
TILE
S /
RA
NG
CEN
TILE
90 TH
80 TH
70 TH
60 TH
50
TH
40
TH
30
TH
20
TH
10
TH
Milk
Val
ue: H
olst
ein
A
vera
ge o
f Cur
rent
305
Day
Lac
tatio
ns*
Val
eur d
u la
it (H
olst
ein)
M
oy. d
es la
ctat
ions
act
uelle
s de
jour
s
$8,2
64
$7,8
71
$7,5
62
$7,3
14
$7,0
65
$6,8
40
$6,5
61
$6,15
1 $5
,601
Milk
Val
ue: N
on-H
olst
ein
Ave
rage
of C
urre
nt 3
05 D
ay L
acta
tions
*
Val
eur d
u la
it (A
utre
Rac
e)
Moy
. des
lact
atio
ns a
ctue
lles
de jo
urs
$7,0
15
$6,6
08
$6,2
21
$6,0
12
$5,7
53
$5,5
11
$5,2
08
$4,9
33
$4,4
29
Udd
er H
ealth
H
erd
Ave
rage
Lin
ear S
core
Sant
é du
pis
Po
inta
ge li
néai
re m
oyen
ne d
u tr
oupe
au
2.2
2.4
2.5
2.6
2.8
2.9
3.0
3.2
3.4
Age
at F
irst
Cal
ving
Fi
rst L
acta
tion
(mon
ths)
Âge
au
prem
ier v
êlag
e Pr
emiè
re la
ctat
ion
seul
emen
t en
moi
s
23.6
24.1
24
.5
25
.0
25
.5
26
.0
26
.6
27
.6
29
.2
Cal
ving
Inte
rval
H
erd
Ave
rage
(mon
ths)
Inte
rval
le d
e vê
lage
M
oyen
ne d
u tr
oupe
au, e
n m
ois
12.8
13.1
13
.3
13
.5
13
.7
13
.9
14
.2
14
.6
15
.2
Long
evity
A
nnua
l Her
d 3r
d+La
ctat
ions
Long
évité
%
ann
uel d
u tr
oupe
au e
n la
ctat
ion
48.2
%
43.9
%
41.2
%
38.9
%
37.2
%
35.3
%
33.3
%
30.6
%
27.1%
Her
d Eff
icie
ncy
Ave
rage
Her
d in
Milk
% d
e va
ches
en
lact
atio
n%
ann
uel d
u tr
oupe
au e
n la
ctat
ion
90.3
%
89.2
%
88.3
%
87.5
%
86.7
%
85.8
%
84.4
%
82.8
%
79.6
%
* Valu
e afte
r ded
uctio
ns/tr
ansp
orta
tion/
Valeu
r apr
ès d
éduc
tions
/tran
spor
t
HOW
PER
CENT
ILES W
ORK:
If all
her
ds/a
nim
als w
ere a
rrang
ed in
orde
r fro
m lo
west
to h
ighe
st, th
e 75t
h pe
rcen
tile w
ould
be t
he va
lue o
f the
her
d th
at is
bet
ter t
han
75%
of al
l the o
ther
her
ds. T
he 99
th p
erce
ntile
valu
e is t
hat w
hich
is
bette
r tha
n 99
% of
all th
e oth
er h
erds
.
COMM
ENT T
RAVA
IL DE
PER
CENT
ILES?
Si to
us le
s tro
upea
u (d
es an
imau
x ont
pu
être
subs
titué
s aux
trou
peau
x) ét
aient
arra
ngés
dans
l’ord
re d
e le p
lus b
as à
le pl
us ha
ut. L
e soi
xant
e-qu
inziè
me p
erce
ntile
sera
ient la
valeu
r du
troup
eau
qui e
st m
eilleu
r que
75%
de t
ous l
es au
tres t
roup
eaux
. La q
uatre
-vin
gt-d
ix-ne
uvièm
e vale
ur d
e per
cent
ile es
t ce q
ui es
t meil
leure
que
99%
de t
ous a
utre
s tro
upea
ux.

46
The rank listings of our highest production herds on Publishable milk recording programs (Supervised 24 hrs or AP) are based on the Annual Summary reports generated for each herd enrolled with CanWest DHI.
This report is a detailed summary of production and BCA for milk, butterfat, and protein for eligible records that reached 305 days in milk, or terminated at or before 305 days in milk, between January 1 and December 31. The following were used in the development of our listings:
ENROLMENT: Records must be competed under a Publishable Service Plan.
NUMBER OF RECORDS: Herds with at least 8 records are included.
EQUAL TO OR GREATER THAN COUNTY OR PROVINCIAL AVERAGE: All Publishable herds with composite BCAs equal to or greater than the average composite BCA for the province or their respective county/district have been printed.
PERCENTAGE OF PUBLISHABLE RECORDS: In order for a herd to be included in the listing, 50% or more of the total records contributing to the herd’s average must be Publishable.
TIES: In the event of a tie in average composite BCA, the tie is broken in the following sequence: most records, highest herd protein BCA.
BREED CODES: Single letters have been used to denote breed: (A) Ayrshire; (H) Holstein; (B) Brown Swiss; (J) Jersey; (G) Guernsey; (M) Milking Shorthorn
MULTI-BREED: Herds with averages based on more than one breed are indicated by multiple breed codes at the end of the record. These codes are listed in order of breed predominance within the herd (highest to lowest).
COUNTY BORDERS: When a farm borders two counties, the Progress Report listing will be the same as the location indicated on the DFO license.
Ontario production is summarized on an annual basis, not only as a service to herd owners, but also to plot progress of production levels on a provincial, breed and service basis. Many counties/districts use the ranked information to calculate production awards in recognition of dairy producer achievements in their local area.
Thank you to the Ontario Joint Dairy Breeds for supplying certificates for the Ontario Top County Average awards.
Le classement suivant des troupeaux les plus productifs inscrits à des programmes officiels de contrôle laitier (service de 24 heures supervisé ou service alternatif publiables), est basé sur le sommaire annuel de produit pour chaque troupeau inscrit auprès de CanWest DHI.
Ce rapport constitue le sommaire détaillé de la production et des MCR de lait, de matière grasse du lait et de protéine pour les animaux admissibles en lactation pendant 305 jours ou dont la lactation s’est terminée à 305 jours ou avant, entre le 1er janvier et le 31 décembre. Ce qui suit a été employé dans le développement de nos listes :
INSCRIPTION : Les relevés doivent être inscrits à un plan de service publiable.
NOMBRE D’ANIMAUX INSCRITS : Les troupeaux ayant plus de 8 relevés sont compris dans le rapport de production.
ÉGALITÉ OU SUPÉRIORITÉ À LA MOYENNE DU COMTÉ OU DE LA PROVINCE : Les relevés publiables de tous les troupeaux munis de composants de MCR égaux à ou supérieurs à la moyenne des composants MCR de la province ou de leur compté/district ont été publiés.
POURCENTAGE DES RELEVÉS PUBLIABLES : Afin qu’un troupeau soit inclus sur la liste, 50% ou plus, de tous les relevés contribuant à la moyenne du troupeau, doivent être publiables.
EX-AEQUO : Dans le cas où il y aurait au moins deux troupeaux avec le total des moyennes de MCR égal, l’ordre serait choisi selon les critères suivants: le nombre de relevés le plus élevé, la moyenne de MCR en protéine la plus élevée.
CODES DES RACES : Une seule lettre a été utilisée pour identifier la race: (A) Ayrshire; (H) Holstein; (B) Suisse Brune; (J) Jersey; (G) Guernsey; (M) Shorthorn Laitier
MOYENNE MULTI-RACE : On identifie les troupeaux dont la moyenne est basée sur celle de plus d’une race par le code de plusieurs races à la fin du dossier. Ces codes sont classés par ordre d’importance des races dans le troupeau (de la plus importante à la moins importante).
LIMITES DU COMTÉ : Lorsqu’une exploitation est à la limite de deux comtés, l’emplacement indiqué dans le classement du Rapport de production serra le même que celui qui est inscrit sur le permis de le DFO.
La production de l’Ontario est résumée chaque année, non seulement pour rendre service aux propriétaires de troupeaux, mais également pour suivre la progression des niveaux de production provinciale, par troupeau et par service. De nombreux comtés et districts se servent des renseignements du classement pour préparer la remise des prix de production soulignant les réussites des producteurs de lait dans leur région.
Merci à Ontario Joint Dairy Breeds (une alliance de toutes les associations de races laitières en Ontario) d’avoir fourni les certificats pour les récompenses pour les meilleures moyennes du comté en Ontario.
Publishable Herd Listing Criteria Criteres publiables de liste de troupeau

47
PUBLISHABLE HERD LISTING / Liste de troupeaux publiables Herds equal to or greater than county or provincial average composite BCA / Troupeaux supérieurs à la moyenne de composite MCR du comté ou province
Farm
/Own
er
Ferm
e /Pr
oprié
taire
Owne
r/Pro
priét
aire
City
/Ville
BCA
Aver
age/
MCR
moy
enne
BCA
Milk
/MCR
lait
BCA
Fat/M
CR g
ras
BCA
Prot
ein/
MCR
prot
éine
Reco
rds/
Relev
és
305 M
ilk K
g/30
5 lait
Kg
305 F
at K
g/30
5 gra
s kg
Fat %
/Gra
s %
305 P
rote
in/3
05 p
roté
ine
Prot
ein
%/P
roté
ine %
Bree
d/Ra
ce
Brant (Average 219.7)Emcrest Farm William & Jean Emmott Brantford 284.7 280 293 281 49 12,600 R 493 3.9 405 3.2 HButtermine Farms Inc Chris Vandenberg Harley 279.7 269 288 282 66 12,323 R 492 4 412 3.3 HBrenbe Farms ― Ayr 264.7 262 259 273 73 7,859 410 5.2 306 3.9 J,HTalsma Farms Inc Steve & Sharon Talsma Harley 264.3 259 270 264 40 11,990 R 463 3.9 388 3.2 HBridon Farms Inc Brian Sayles Paris 250.3 264 236 251 87 8,316 R 391 4.7 296 3.6 J,HNutreco Canada Agresearch Trouwnutrition Burford 249.3 255 245 248 89 11,506 410 3.6 356 3.1 HSpruce Avenue Farms ― Paris 248.7 256 240 250 84 8,321 386 4.6 294 3.5 J,H,BRovelon Holsteins Gary Cain Paris 244.3 246 247 240 28 11,197 * 422 3.8 348 3.1 H,AWill-Cher Farm Bill & Cheryl Donkers Branchton 236.3 230 248 231 56 10,586 423 4.0 338 3.2 HStage Road Dairy Farm Arie & Liesbeth Duizer Burford 234.3 229 241 233 108 10,224 R 399 3.9 332 3.2 HFaircrest Corwin Schaap Brantford 225.0 222 232 221 52 9,828 381 3.9 311 3.2 HCharbend Farm Murray Charlton Brantford 225.0 222 231 222 39 10,508 R 404 3.8 333 3.2 HBrowndale Robert Brown Paris 223.3 219 231 220 76 10,273 401 3.9 327 3.2 HBridgeview Brian Coleman Brantford 221.3 224 222 218 85 9,604 380 4.0 307 3.2 H,JDrew & Amy Honderich ― Norwich 220.7 223 211 228 45 6,349 327 5.2 246 3.9 J
Bruce (Average 235.3)Albadon Farms Ltd Mark & Josh Ireland Teeswater 326.0 322 343 313 186 14,294 * 567 4.0 442 3.1 HWilkesview Murray Wilken Ripley 278.7 276 284 276 118 12,324 R 474 3.8 394 3.2 H,AZethill Farms Ltd Russell & Joyce Zettler Hanover 277.7 279 283 271 35 12,528 468 3.7 387 3.1 HIkendale Farms Ltd ― Walkerton 274.0 275 277 270 323 11,663 * 437 3.7 365 3.1 HBelmoral Farms Ltd David & Mitch Kieffer Teeswater 271.7 258 295 262 62 11,709 496 4.2 378 3.2 HZettlerdale Farms Howard & Glen Zettler Chepstow 264.3 259 281 253 74 11,970 481 4.0 372 3.1 HDoral Farms Inc ― Teeswater 264.0 255 282 255 61 11,458 473 4.1 365 3.2 HMisch Farms Merv & Tyler Misch Dobbinton 263.0 262 269 258 60 11,989 453 3.8 374 3.1 HLowlace Farms J & B Wallace Port Elgin 261.3 262 261 261 77 11,663 430 3.7 369 3.2 HBryceholme Brian Weber Allenford 260.3 254 271 256 66 10,988 436 4.0 353 3.2 HHarmony Holsteins Matt & Larissa Hamel Elmwood 258.7 258 262 256 118 11,768 442 3.8 371 3.2 HPrehnbrook Farms Ltd ― Ripley 256.7 254 269 247 242 11,337 * 447 3.9 351 3.1 HFlorbil Farms Ltd Jeff & Dan Bross Mildmay 256.7 247 270 253 46 11,288 457 4.0 368 3.3 HCharacter Holsteins Jayne & Ralph Dietrich Mildmay 256.3 255 260 254 39 11,345 428 3.8 359 3.2 HRandy & Rod Weber ― Allenford 255.0 246 273 246 89 10,842 446 4.1 346 3.2 HSteve & Amanda Hammell ― Dobbinton 254.3 244 262 257 26 11,134 R 443 4.0 371 3.3 HMillbrook Farms Barry, Diane & Kevin Ribey Paisley 253.0 251 256 252 46 11,396 429 3.8 363 3.2 HHolmdale Farms ― Elmwood 251.0 257 245 251 137 11,372 R 402 3.5 354 3.1 HCedarpatch Glen Burgess Mildmay 249.7 256 241 252 56 9,694 403 4.2 327 3.4 J,HMoorwyk Dairy Farms Ltd Marco & Connie Vergeer Teeswater 249.3 247 255 246 108 10,751 412 3.8 341 3.2 HChristhill Farms James Christie Tara 249.3 250 246 252 66 11,865 R 431 3.6 378 3.2 HHyholme Holsteins Jonas Martin Chesley 248.3 249 251 245 38 11,103 414 3.7 348 3.1 HTrinal Farm Murray & Emma Horst Teeswater 247.7 245 253 245 77 10,781 413 3.8 344 3.2 HR & G Farms Ltd Geoff Farrell Kincardine 247.3 258 233 251 53 10,499 R 390 3.7 341 3.2 H,JBryt Farms Ltd David & Jennifer Bryson Dobbington 246.7 242 257 241 50 10,902 430 3.9 347 3.2 H
*3× per day or greater milking (all or part)/traite 3× par jour R: Robotic/Robotique
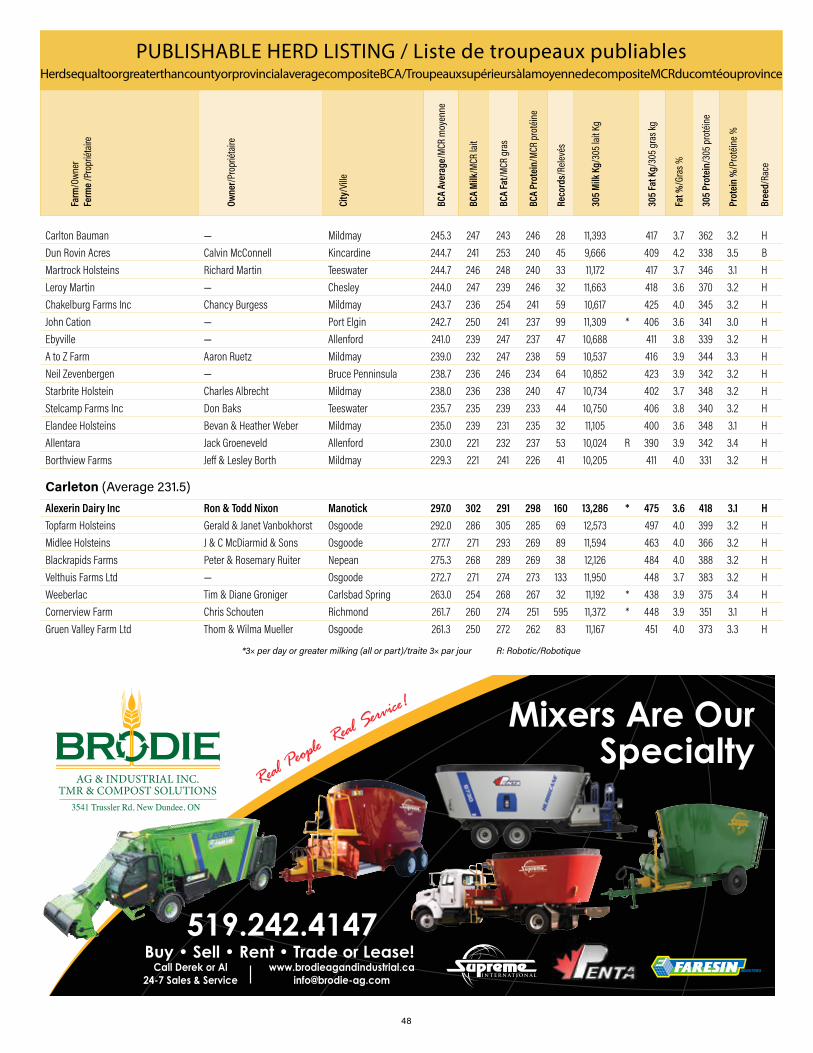
48
PUBLISHABLE HERD LISTING / Liste de troupeaux publiables Herds equal to or greater than county or provincial average composite BCA / Troupeaux supérieurs à la moyenne de composite MCR du comté ou province
Farm
/Own
er
Ferm
e /Pr
oprié
taire
Owne
r/Pro
priét
aire
City
/Ville
BCA
Aver
age/
MCR
moy
enne
BCA
Milk
/MCR
lait
BCA
Fat/M
CR g
ras
BCA
Prot
ein/
MCR
prot
éine
Reco
rds/
Relev
és
305 M
ilk K
g/30
5 lait
Kg
305 F
at K
g/30
5 gra
s kg
Fat %
/Gra
s %
305 P
rote
in/3
05 p
roté
ine
Prot
ein
%/P
roté
ine %
Bree
d/Ra
ce
Carlton Bauman ― Mildmay 245.3 247 243 246 28 11,393 417 3.7 362 3.2 HDun Rovin Acres Calvin McConnell Kincardine 244.7 241 253 240 45 9,666 409 4.2 338 3.5 BMartrock Holsteins Richard Martin Teeswater 244.7 246 248 240 33 11,172 417 3.7 346 3.1 HLeroy Martin ― Chesley 244.0 247 239 246 32 11,663 418 3.6 370 3.2 HChakelburg Farms Inc Chancy Burgess Mildmay 243.7 236 254 241 59 10,617 425 4.0 345 3.2 HJohn Cation ― Port Elgin 242.7 250 241 237 99 11,309 * 406 3.6 341 3.0 HEbyville ― Allenford 241.0 239 247 237 47 10,688 411 3.8 339 3.2 HA to Z Farm Aaron Ruetz Mildmay 239.0 232 247 238 59 10,537 416 3.9 344 3.3 HNeil Zevenbergen ― Bruce Penninsula 238.7 236 246 234 64 10,852 423 3.9 342 3.2 HStarbrite Holstein Charles Albrecht Mildmay 238.0 236 238 240 47 10,734 402 3.7 348 3.2 HStelcamp Farms Inc Don Baks Teeswater 235.7 235 239 233 44 10,750 406 3.8 340 3.2 HElandee Holsteins Bevan & Heather Weber Mildmay 235.0 239 231 235 32 11,105 400 3.6 348 3.1 HAllentara Jack Groeneveld Allenford 230.0 221 232 237 53 10,024 R 390 3.9 342 3.4 HBorthview Farms Jeff & Lesley Borth Mildmay 229.3 221 241 226 41 10,205 411 4.0 331 3.2 H
Carleton (Average 231.5)Alexerin Dairy Inc Ron & Todd Nixon Manotick 297.0 302 291 298 160 13,286 * 475 3.6 418 3.1 HTopfarm Holsteins Gerald & Janet Vanbokhorst Osgoode 292.0 286 305 285 69 12,573 497 4.0 399 3.2 HMidlee Holsteins J & C McDiarmid & Sons Osgoode 277.7 271 293 269 89 11,594 463 4.0 366 3.2 HBlackrapids Farms Peter & Rosemary Ruiter Nepean 275.3 268 289 269 38 12,126 484 4.0 388 3.2 HVelthuis Farms Ltd ― Osgoode 272.7 271 274 273 133 11,950 448 3.7 383 3.2 HWeeberlac Tim & Diane Groniger Carlsbad Spring 263.0 254 268 267 32 11,192 * 438 3.9 375 3.4 HCornerview Farm Chris Schouten Richmond 261.7 260 274 251 595 11,372 * 448 3.9 351 3.1 HGruen Valley Farm Ltd Thom & Wilma Mueller Osgoode 261.3 250 272 262 83 11,167 451 4.0 373 3.3 H
*3× per day or greater milking (all or part)/traite 3× par jour R: Robotic/Robotique
Mixers Are Our Specialty
Real Peopl
e Real S
ervice!
3541 Trussler Rd, New Dundee, ON
519.242.4147www.brodieagandindustrial.ca
[email protected] Derek or Al
24-7 Sales & Service
Buy • Sell • Rent • Trade or Lease!

49
PUBLISHABLE HERD LISTING / Liste de troupeaux publiables Herds equal to or greater than county or provincial average composite BCA / Troupeaux supérieurs à la moyenne de composite MCR du comté ou province
Farm
/Own
er
Ferm
e /Pr
oprié
taire
Owne
r/Pro
priét
aire
City
/Ville
BCA
Aver
age/
MCR
moy
enne
BCA
Milk
/MCR
lait
BCA
Fat/M
CR g
ras
BCA
Prot
ein/
MCR
prot
éine
Reco
rds/
Relev
és
305 M
ilk K
g/30
5 lait
Kg
305 F
at K
g/30
5 gra
s kg
Fat %
/Gra
s %
305 P
rote
in/3
05 p
roté
ine
Prot
ein
%/P
roté
ine %
Bree
d/Ra
ce
Riverdown Holsteins ― Metcalfe 259.0 246 276 255 81 11,368 472 4.2 372 3.3 HOakstone Farm Todd & Carolyn Styles Kinburn 253.3 251 253 256 59 11,304 R 423 3.7 367 3.2 HMaple Shade Farm Matthew Craven North Gower 247.3 261 231 250 37 7,883 376 4.8 286 3.6 JGlennholme Holst Brian & Jill Rivington Carp 243.3 235 255 240 59 10,815 437 4.0 351 3.2 H,JFerme Rubi Jakob Buehler Embrun 243.0 237 244 248 67 11,060 422 3.8 366 3.3 HRangedale Farms Mike & Rita Heuving Osgoode 241.7 241 243 241 72 10,907 407 3.7 346 3.2 HMcewen Farm William McEwen Nepean 241.7 233 248 244 49 10,796 426 3.9 358 3.3 HCavanhill Mel & Andy Cavanagh Kinburn 241.0 226 266 231 74 10,739 468 4.4 348 3.2 HTile Croft Farms Eleanor & Jeff Robinson Osgoode 240.0 241 234 245 77 8,175 * 327 4.0 273 3.3 ACanada Agriculture Museum Natl Museum of Sci Tech Ottawa 237.0 233 243 235 55 9,911 400 4.0 323 3.3 H,M,JMarvellane Theo & Maria Nyentap Russell 236.7 235 245 230 153 10,482 407 3.9 327 3.1 HAcredale Farm Janet Acres Smiley Kars 234.0 234 237 231 73 10,575 398 3.8 333 3.1 HBakkercrest Steve & Shelley Bakker Metcalfe 233.7 231 240 230 48 10,238 393 3.8 324 3.2 HHilltone Farms Bruce & Harvey Hill Kinburn 233.7 235 231 235 40 10,716 392 3.7 340 3.2 H,AIvandale Farm Barry & Shelley Waddell Edwards 232.0 229 242 225 56 10,021 393 3.9 313 3.1 HJockbrae Farms Ltd 2 Melinda & Mark Foster Carleton Place 231.7 225 240 230 111 10,099 R 399 4.0 327 3.2 HCarlmar Holsteins Ltd ― Richmond 231.0 223 240 230 147 10,016 R 400 4.0 329 3.3 H
City of Kawartha Lakes (Average 215.5)Thursthill Farms Inc ― Lindsay 250.7 253 249 250 84 11,397 R 416 3.7 359 3.1 HKawartha Holsteins D & M McMorrow Lindsay 244.7 245 254 235 44 11,092 428 3.9 339 3.1 H,JMisty Springs & Piepers Holsteins Merminod & Kroekenstoel Little Britain 243.3 240 243 247 61 10,564 398 3.8 346 3.3 HMillen Farms Ronald Millen Omemee 242.0 239 248 239 108 10,924 419 3.8 347 3.2 HSchaicrest Bob Van Schaik Woodville 239.7 229 253 237 64 11,084 452 4.1 363 3.3 HOakmill Holsteins Mark & Loretta Gingrich Lindsay 239.3 231 250 237 40 10,580 426 4.0 344 3.3 HSchahill Henry Van Schaik Oakwood 222.3 218 234 215 41 9,839 391 4.0 310 3.2 HHyspruce Holsteins Inc Dale Hamilton Woodville 220.3 217 226 218 98 9,665 372 3.8 309 3.2 HTomalynn Farms Tom & Brad Hawman Omemee 219.0 216 225 216 40 10,190 395 3.9 324 3.2 HSchailyn Charles Van-Schaik Woodville 218.7 216 225 215 43 9,860 382 3.9 312 3.2 H
Cochrane (Average 226.7)Shadylane Farms ― Matheson 242.7 241 249 238 57 11,091 425 3.8 349 3.1 H
Dufferin (Average 229.8)Swissbell Walter & Marlie Kaehli Grand Valley 268.3 281 257 267 73 8,120 R 401 4.9 293 3.6 JColmont Joe Oosterhof Grand Valley 266.0 257 290 251 47 11,431 476 4.2 355 3.1 HDeaksview Ron & Lisa Deaken Grand Valley 263.3 257 276 257 66 11,651 464 4.0 371 3.2 HEl Dorado Dairy Steve Illick Amaranth 261.3 266 248 270 23 8,251 R 389 4.7 308 3.7 J,HWaterdale Farms Ltd Jan Scheurwater Grand Valley 255.0 254 267 244 38 11,804 460 3.9 361 3.1 HSimonhof Farms Ltd Eiko Oosterhof Grand Valley 250.7 242 258 252 68 11,346 449 4.0 376 3.3 HMarsville Holsteins Melis Brouwer East Garafraxa 245.0 236 262 237 75 10,374 429 4.1 332 3.2 HA & E Dairy Ltd Eric Vander Zaag Amaranth 233.3 234 226 240 51 10,775 387 3.6 352 3.3 HGeordawn George & Dawn Van Kampen Amaranth 230.0 233 226 231 47 6,864 362 5.3 259 3.8 J
*3× per day or greater milking (all or part)/traite 3× par jour R: Robotic/Robotique

50
PUBLISHABLE HERD LISTING / Liste de troupeaux publiables Herds equal to or greater than county or provincial average composite BCA / Troupeaux supérieurs à la moyenne de composite MCR du comté ou province
Farm
/Own
er
Ferm
e /Pr
oprié
taire
Owne
r/Pro
priét
aire
City
/Ville
BCA
Aver
age/
MCR
moy
enne
BCA
Milk
/MCR
lait
BCA
Fat/M
CR g
ras
BCA
Prot
ein/
MCR
prot
éine
Reco
rds/
Relev
és
305 M
ilk K
g/30
5 lait
Kg
305 F
at K
g/30
5 gra
s kg
Fat %
/Gra
s %
305 P
rote
in/3
05 p
roté
ine
Prot
ein
%/P
roté
ine %
Bree
d/Ra
ce
Dundas (Average 226.8)Ricrodreg Holsteins Dwight Gilmer & Sons Ltd South Mountain 273.3 270 269 281 168 12,172 R 452 3.7 403 3.3 HGlen Haven Farms Tom Macgregor Crysler 270.3 268 272 271 50 12,033 R 456 3.8 388 3.2 H,GVerspeek Farms Ltd P & C Verspeek Winchester 269.7 276 268 265 85 12,435 447 3.6 380 3.1 HMaple Dale Farms Gordon Empey Iroquois 268.0 263 278 263 41 12,402 R 487 3.9 394 3.2 HBreteler Farms Inc Paul Breteler Winchester 265.0 259 273 263 82 11,330 443 3.9 366 3.2 HVriesdale Henry & Robert Velthuis Mountain 263.3 260 268 262 126 11,892 R 452 3.8 381 3.2 HSandycreek Farms Dave Verburg Iroquois 258.0 255 266 253 62 11,439 R 443 3.9 362 3.2 HJames-Dean Holsteins Dean, Parker & Terry Boyd South Mountain 258.0 257 265 252 60 11,566 * 443 3.8 361 3.1 HAija Holsteins Gerald & Alana Jaquemet Winchester 252.7 250 255 253 71 11,528 434 3.8 370 3.2 HMorning Sun R & T Cornelissen & Sons Chesterville 250.7 252 254 246 67 11,476 R 430 3.7 357 3.1 HWestergreen Farm J, M & P Westervelt Brinston 250.3 240 261 250 82 10,590 R 428 4.0 352 3.3 HTibben Farms ― Brinston 248.3 252 245 248 161 11,642 R 419 3.6 364 3.1 HWintergreen Farms Carl Sears & Sons South Mountain 248.0 243 254 247 77 10,861 R 421 3.9 352 3.2 HNick & Oliver Thurler ― South Mountain 247.3 247 252 243 346 10,926 * 413 3.8 342 3.1 HBelsmith Farms Robin & Ann Marie Smith Iroquois 246.7 251 233 256 52 8,138 R 369 4.5 300 3.7 J,HBrabantia Farms Inc Robert Byvelds Williamsburg 245.3 247 248 241 102 10,837 R 405 3.7 337 3.1 HPerry Hart & Matt Bilmer Harthaven Farms Inc Morrisburg 244.7 249 245 240 50 11,153 405 3.6 341 3.1 HFredwill Holsteins Albert & Linda Harbers Brinston 243.3 233 260 237 80 10,319 * 427 4.1 335 3.2 HSignature Holsteins Michael Farlinger Morrisburg 243.0 246 239 244 55 11,150 404 3.6 352 3.2 H,JNation Vale Farms Inc Jim & Carol Ann Byvelds Chesterville 241.0 242 247 234 86 10,823 407 3.8 333 3.1 HMoreview Farms Barbara Merkley & Sons Morewood 241.0 245 236 242 53 11,760 420 3.6 369 3.1 HAlgerdale Farms Gerald Crowder & Son Winchester 239.7 245 241 233 36 10,573 * 387 3.7 321 3.0 HStraderhill Farms Doug De Vries Williamsburg 238.0 235 237 242 42 10,819 405 3.7 354 3.3 HAnnalea Hans & Daniel Schuler Chesterville 236.7 236 241 233 75 10,712 404 3.8 335 3.1 HWinright Brian & Audrey Enright Winchester 234.0 235 233 234 84 10,758 394 3.7 341 3.2 HWild Country Farms Inc Brandon Dejong Chesterville 229.3 225 240 223 20 9,849 389 3.9 311 3.2 HBergridge Farms Brian & Liz Vandenberg Winchester 227.7 225 232 226 46 9,922 380 3.8 318 3.2 H
*3× per day or greater milking (all or part)/traite 3× par jour R: Robotic/Robotique
2564TTSM01 CANWEST DHIA 7.75x2.75in NAM FEB16 V2.indd 1 24/02/16 10:37 am

51
PUBLISHABLE HERD LISTING / Liste de troupeaux publiables Herds equal to or greater than county or provincial average composite BCA / Troupeaux supérieurs à la moyenne de composite MCR du comté ou province
Farm
/Own
er
Ferm
e /Pr
oprié
taire
Owne
r/Pro
priét
aire
City
/Ville
BCA
Aver
age/
MCR
moy
enne
BCA
Milk
/MCR
lait
BCA
Fat/M
CR g
ras
BCA
Prot
ein/
MCR
prot
éine
Reco
rds/
Relev
és
305 M
ilk K
g/30
5 lait
Kg
305 F
at K
g/30
5 gra
s kg
Fat %
/Gra
s %
305 P
rote
in/3
05 p
roté
ine
Prot
ein
%/P
roté
ine %
Bree
d/Ra
ce
Durham (Average 211.3)Ruti Farms Werner & Nicolas Renggli Seagrave 284.3 271 303 279 39 11,758 485 4.1 385 3.3 HO'Connor Land & Cattle Co Sean & Kelly O'Connor Ajax 279.3 277 275 286 104 12,175 R 446 3.7 399 3.3 HMaplebrough Farm M & J Risebrough Uxbridge 273.7 273 270 278 43 10,962 446 4.1 371 3.4 H,JKefay Farms Robert Ashton Port Perry 273.0 266 289 264 57 11,915 * 486 4.1 378 3.2 H,M,JRaivue Farms Ltd Wm & Robert Raines Sunderland 258.0 260 258 256 67 11,777 434 3.7 370 3.1 HValcroft Murray & Alec Stone Sunderland 254.7 245 267 252 48 11,000 445 4.0 361 3.3 HEmlane Farms Ltd Scott Wilson Port Perry 254.0 247 261 254 48 11,176 435 3.9 365 3.3 HElmden Farms Ltd Elmden Farms Sunderland 251.3 245 267 242 46 11,003 447 4.1 348 3.2 HSunnyfield Holsteins B, S, C & A Snoddon Sunderland 246.3 244 251 244 85 10,763 R 411 3.8 343 3.2 HPhillhavn Holsteins Mary, Rob & Dale Phillips Sunderland 242.7 243 239 246 48 10,653 395 3.7 350 3.3 H,BMusthaven Farms Ltd G Mustard Uxbridge 241.3 238 247 239 67 10,516 R 403 3.8 336 3.2 HAltona Lea Farms G Barkey & F Puterbough Blackstock 241.3 235 246 243 50 10,629 415 3.9 350 3.3 H,JVintage Land & Cattle Ltd D, I & R Larmer Blackstock 234.3 229 240 234 65 10,342 400 3.9 336 3.2 HBeaverbrock Merlyn Doble Cannington 232.3 227 228 242 43 10,900 409 3.8 368 3.4 H,JMaifield Holsteins ― Bowmanville 231.0 230 235 228 146 10,494 398 3.8 331 3.2 HEnniskillen Jerseys Tim Sargent Hampton 230.3 240 205 246 41 7,445 343 4.6 289 3.9 JValview Farm Bastiaan Benschop Port Perry 230.0 236 226 228 16 10,816 385 3.6 333 3.1 HWilada Dave & Bernice Andrews Cannington 228.7 226 232 228 41 10,534 405 3.8 339 3.2 H,JVerdurelea Jerseys Ltd ― Sunderland 228.3 237 212 236 60 7,117 344 4.8 268 3.8 JParbro Farms Ltd Ron & Karen Parrish Uxbridge 226.7 227 229 224 114 10,293 R 386 3.8 323 3.1 HGlen Robert Farm Robert Powell Port Perry 225.7 223 223 231 83 7,978 326 4.1 271 3.4 A,HHerralea Farms Inc ― Uxbridge 225.3 223 232 221 68 10,350 398 3.8 326 3.1 HKeemuse Holsteins Jim Kiezebrink Cannington 221.0 225 223 215 49 8,322 359 4.3 271 3.3 H,J,MWerrcroft Farms Ltd Kevin & Diane Werry Enniskillen 220.3 215 221 225 72 9,944 R 380 3.8 331 3.3 HLoa-De-Mede Farms Ltd ― Oshawa 218.0 214 226 214 76 9,859 R 386 3.9 313 3.2 HHigh Point Farms Robert Smith Port Perry 217.7 208 232 213 34 10,091 417 4.1 327 3.2 HLandomills James Millson Enniskillen 217.0 217 225 209 74 9,931 383 3.9 304 3.1 HCoxlyn Farms Ltd Murray Cox Uxbridge 216.7 214 222 214 93 9,891 380 3.8 314 3.2 HElmcroft Holsteins Gary Jebson Sunderland 216.3 216 226 207 37 10,127 396 3.9 307 3.0 H,JRiversite Farms Ltd Dave Beatty Cannington 214.7 214 214 216 38 10,053 374 3.7 321 3.2 HSun Up Keith Kennedy Uxbridge 213.7 212 217 212 28 9,643 367 3.8 308 3.2 H
Elgin (Average 231.8)Silverridge Farms Charlie Dykxhoorn Springfield 292.7 288 296 294 98 13,374 * 511 3.8 434 3.2 HMisty Glen Murray Pettit Belmont 278.3 274 289 272 37 12,132 R 476 3.9 384 3.2 HMuilwyk Farms Ltd ― Brownsville 271.3 266 288 260 85 11,986 478 4.0 371 3.1 HSwance Farms Brad & Scott Swance Tillsonburg 271.0 271 276 266 37 11,896 R 452 3.8 374 3.1 HVerhoef Dairy Farm Inc Reinoud & Klaartje Verhoef Belmont 267.0 272 265 264 136 12,191 * 445 3.7 378 3.1 H,JLiddlerock Holsteins Wray & Carole Bowen Aylmer 263.0 254 264 271 58 11,593 446 3.8 395 3.4 HCentral Dairy Ltd Pete Van Hemert Belmont 258.3 256 265 254 85 11,475 * 441 3.8 362 3.2 HMaplekeys Farms Paul Vis Aylmer 250.0 247 257 246 252 11,010 424 3.9 349 3.2 HHartveld Farms Ltd Ryan Hartemink Aylmer 241.7 237 247 241 63 10,375 402 3.9 338 3.3 H
*3× per day or greater milking (all or part)/traite 3× par jour R: Robotic/Robotique

52
PUBLISHABLE HERD LISTING / Liste de troupeaux publiables Herds equal to or greater than county or provincial average composite BCA / Troupeaux supérieurs à la moyenne de composite MCR du comté ou province
Farm
/Own
er
Ferm
e /Pr
oprié
taire
Owne
r/Pro
priét
aire
City
/Ville
BCA
Aver
age/
MCR
moy
enne
BCA
Milk
/MCR
lait
BCA
Fat/M
CR g
ras
BCA
Prot
ein/
MCR
prot
éine
Reco
rds/
Relev
és
305 M
ilk K
g/30
5 lait
Kg
305 F
at K
g/30
5 gra
s kg
Fat %
/Gra
s %
305 P
rote
in/3
05 p
roté
ine
Prot
ein
%/P
roté
ine %
Bree
d/Ra
ce
Gentle Acres John Gent Springfield 241.0 240 247 236 44 11,099 424 3.8 345 3.1 HBuis Farms Larry Buis Aylmer 240.7 237 250 235 59 10,036 R 393 3.9 318 3.2 HDonkelman Farms Ltd ― Tillsonburg 240.3 236 246 239 209 10,410 403 3.9 336 3.2 HNiholm Hosteins ― Springfield 238.7 232 252 232 42 10,639 R 427 4.0 336 3.2 HNarwood Dairy Farm Don & Diane Catt St Thomas 237.3 231 249 232 38 10,454 418 4.0 332 3.2 HAnkor Dairy Farm Anko Guikema Belmont 235.7 233 243 231 118 10,096 390 3.9 320 3.2 HDohner Farm Peter Dohner Port Burwell 233.0 231 234 234 80 9,966 R 377 3.8 323 3.2 H1610379 Ontario Ltd ― St Thomas 230.3 226 240 225 24 9,867 391 4.0 313 3.2 HSchipper Farms Ltd Rudolph Schipper Aylmer 229.0 227 232 228 268 10,315 391 3.8 330 3.2 HWoolley Farms Inc Russell Woolley Springfield 228.7 227 229 230 58 10,120 386 3.8 329 3.3 H,J
Essex-Kent (Average 222.6)William & Vicky Morrison ― Woodslee 252.7 244 267 247 137 11,300 462 4.1 365 3.2 HRcat Dairy Ridgetown College Ridgetown 252.7 253 256 249 38 11,209 418 3.7 351 3.1 HGreenridge Dairy Ltd Herbert & Michaela Wanger Ridgetown 244.3 242 247 244 80 10,435 395 3.8 336 3.2 H,AJansen Farms 'Merlin' Ltd Martin Jansen Merlin 239.7 245 235 239 48 10,914 389 3.6 339 3.1 HLilac Row Farms Bernard Nelson Kingsville 236.7 235 235 240 106 10,820 400 3.7 352 3.3 HWridair Farms Roger & Sheryl Wright Harrow 223.3 226 222 222 36 9,514 360 3.8 302 3.2 H,J
Frontenac (Average 204.1)Groenway Farms Inc M & D Groenewegen Harrowsmith 240.3 237 244 240 63 10,764 410 3.8 345 3.2 HShanlake Farm Dudley Shannon Inverary 238.3 235 241 239 43 10,620 406 3.8 345 3.2 HOrserdale Farms Lloyd Orser Sydenham 237.7 240 240 233 34 10,634 * 405 3.8 332 3.1 H,JSunny Plains Farms Gary, Susan & Kent Curtis Joyceville 221.0 213 236 214 51 9,482 390 4.1 303 3.2 HMorningsight Farms Henry & Janine Posthumus Wolfe Island 220.7 220 224 218 37 10,694 403 3.8 334 3.1 HG & D Farms Inc Jamie & Maida Edwards Westport 205.0 202 207 206 37 8,869 337 3.8 288 3.2 H
Glengarry (Average 221.8)Glenhaven Farms Tom Pasco Williamstown 279.3 271 290 277 136 12,365 * 493 4.0 404 3.3 HKerrydale Farms Ltd Tom Mcdonald Williamstown 275.3 272 273 281 57 11,955 445 3.7 392 3.3 HLochdale David Macmillan Alexandria 274.3 262 301 260 52 12,249 522 4.3 385 3.1 HDunmatt Farm Josef & Karen Odermatt Dunvegan 270.7 277 258 277 164 12,281 * 424 3.5 391 3.2 HChanmar C & A Glaude Bainsville 261.7 256 268 261 36 11,315 440 3.9 368 3.3 HHeidi Farms Inc Paul Oeggerli Bainsville 259.3 256 264 258 300 11,340 435 3.8 365 3.2 HTansymoss Paul & Shawna Chaddock Lancaster 253.3 251 255 254 110 10,904 * 412 3.8 352 3.2 HMisty Meadows Robert Lancaster North Lancaster 250.3 253 244 254 47 8,517 338 4.0 281 3.3 ADenlorn Farms Ltd Paul St Denis Bainsville 248.3 240 255 250 40 10,669 424 4.0 355 3.3 HMarvans Inc Corey Vansleeuwen Williamstown 247.7 251 250 242 97 10,812 400 3.7 331 3.1 HDenvan Farms Adrian St Denis Alexandria 247.3 249 240 253 55 10,785 385 3.6 350 3.2 HGlengarry Stock Farms Inc Robert Macintosh Apple Hill 246.0 245 241 252 56 11,164 407 3.6 366 3.3 HGlensprings Farms Ltd Donald Thomson Martintown 245.3 238 255 243 62 11,358 450 4.0 367 3.2 HKirklea Farms Robert Macdonald Dalkeith 244.7 250 242 242 41 11,410 411 3.6 352 3.1 HCherry Crest Holsteins D Johnston & N Beerwort Martintown 243.3 232 251 247 69 9,939 397 4.0 336 3.4 HFraserloch Jack Fraser Maxville 241.3 245 235 244 30 10,662 378 3.5 339 3.2 H
*3× per day or greater milking (all or part)/traite 3× par jour R: Robotic/Robotique
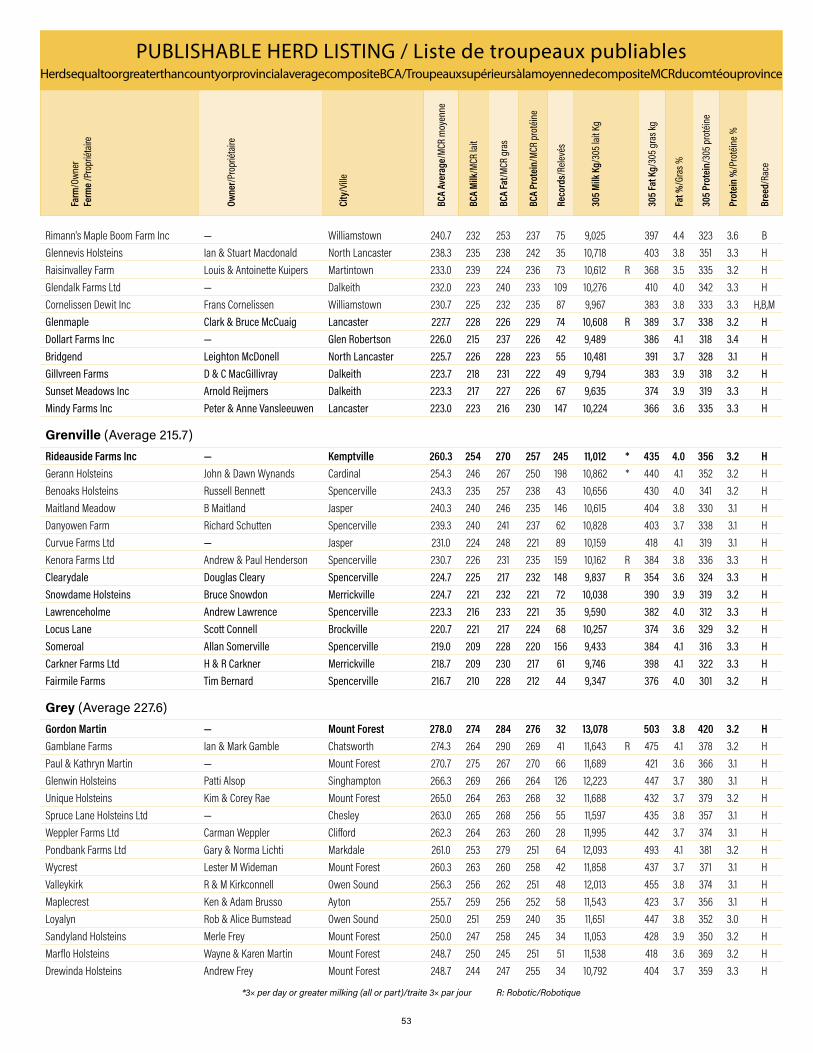
53
PUBLISHABLE HERD LISTING / Liste de troupeaux publiables Herds equal to or greater than county or provincial average composite BCA / Troupeaux supérieurs à la moyenne de composite MCR du comté ou province
Farm
/Own
er
Ferm
e /Pr
oprié
taire
Owne
r/Pro
priét
aire
City
/Ville
BCA
Aver
age/
MCR
moy
enne
BCA
Milk
/MCR
lait
BCA
Fat/M
CR g
ras
BCA
Prot
ein/
MCR
prot
éine
Reco
rds/
Relev
és
305 M
ilk K
g/30
5 lait
Kg
305 F
at K
g/30
5 gra
s kg
Fat %
/Gra
s %
305 P
rote
in/3
05 p
roté
ine
Prot
ein
%/P
roté
ine %
Bree
d/Ra
ce
Rimann's Maple Boom Farm Inc ― Williamstown 240.7 232 253 237 75 9,025 397 4.4 323 3.6 BGlennevis Holsteins Ian & Stuart Macdonald North Lancaster 238.3 235 238 242 35 10,718 403 3.8 351 3.3 HRaisinvalley Farm Louis & Antoinette Kuipers Martintown 233.0 239 224 236 73 10,612 R 368 3.5 335 3.2 HGlendalk Farms Ltd ― Dalkeith 232.0 223 240 233 109 10,276 410 4.0 342 3.3 HCornelissen Dewit Inc Frans Cornelissen Williamstown 230.7 225 232 235 87 9,967 383 3.8 333 3.3 H,B,MGlenmaple Clark & Bruce McCuaig Lancaster 227.7 228 226 229 74 10,608 R 389 3.7 338 3.2 HDollart Farms Inc ― Glen Robertson 226.0 215 237 226 42 9,489 386 4.1 318 3.4 HBridgend Leighton McDonell North Lancaster 225.7 226 228 223 55 10,481 391 3.7 328 3.1 HGillvreen Farms D & C MacGillivray Dalkeith 223.7 218 231 222 49 9,794 383 3.9 318 3.2 HSunset Meadows Inc Arnold Reijmers Dalkeith 223.3 217 227 226 67 9,635 374 3.9 319 3.3 HMindy Farms Inc Peter & Anne Vansleeuwen Lancaster 223.0 223 216 230 147 10,224 366 3.6 335 3.3 H
Grenville (Average 215.7)Rideauside Farms Inc ― Kemptville 260.3 254 270 257 245 11,012 * 435 4.0 356 3.2 HGerann Holsteins John & Dawn Wynands Cardinal 254.3 246 267 250 198 10,862 * 440 4.1 352 3.2 HBenoaks Holsteins Russell Bennett Spencerville 243.3 235 257 238 43 10,656 430 4.0 341 3.2 HMaitland Meadow B Maitland Jasper 240.3 240 246 235 146 10,615 404 3.8 330 3.1 HDanyowen Farm Richard Schutten Spencerville 239.3 240 241 237 62 10,828 403 3.7 338 3.1 HCurvue Farms Ltd ― Jasper 231.0 224 248 221 89 10,159 418 4.1 319 3.1 HKenora Farms Ltd Andrew & Paul Henderson Spencerville 230.7 226 231 235 159 10,162 R 384 3.8 336 3.3 HClearydale Douglas Cleary Spencerville 224.7 225 217 232 148 9,837 R 354 3.6 324 3.3 HSnowdame Holsteins Bruce Snowdon Merrickville 224.7 221 232 221 72 10,038 390 3.9 319 3.2 HLawrenceholme Andrew Lawrence Spencerville 223.3 216 233 221 35 9,590 382 4.0 312 3.3 HLocus Lane Scott Connell Brockville 220.7 221 217 224 68 10,257 374 3.6 329 3.2 HSomeroal Allan Somerville Spencerville 219.0 209 228 220 156 9,433 384 4.1 316 3.3 HCarkner Farms Ltd H & R Carkner Merrickville 218.7 209 230 217 61 9,746 398 4.1 322 3.3 HFairmile Farms Tim Bernard Spencerville 216.7 210 228 212 44 9,347 376 4.0 301 3.2 H
Grey (Average 227.6)Gordon Martin ― Mount Forest 278.0 274 284 276 32 13,078 503 3.8 420 3.2 HGamblane Farms Ian & Mark Gamble Chatsworth 274.3 264 290 269 41 11,643 R 475 4.1 378 3.2 HPaul & Kathryn Martin ― Mount Forest 270.7 275 267 270 66 11,689 421 3.6 366 3.1 HGlenwin Holsteins Patti Alsop Singhampton 266.3 269 266 264 126 12,223 447 3.7 380 3.1 HUnique Holsteins Kim & Corey Rae Mount Forest 265.0 264 263 268 32 11,688 432 3.7 379 3.2 HSpruce Lane Holsteins Ltd ― Chesley 263.0 265 268 256 55 11,597 435 3.8 357 3.1 HWeppler Farms Ltd Carman Weppler Clifford 262.3 264 263 260 28 11,995 442 3.7 374 3.1 HPondbank Farms Ltd Gary & Norma Lichti Markdale 261.0 253 279 251 64 12,093 493 4.1 381 3.2 HWycrest Lester M Wideman Mount Forest 260.3 263 260 258 42 11,858 437 3.7 371 3.1 HValleykirk R & M Kirkconnell Owen Sound 256.3 256 262 251 48 12,013 455 3.8 374 3.1 HMaplecrest Ken & Adam Brusso Ayton 255.7 259 256 252 58 11,543 423 3.7 356 3.1 HLoyalyn Rob & Alice Bumstead Owen Sound 250.0 251 259 240 35 11,651 447 3.8 352 3.0 HSandyland Holsteins Merle Frey Mount Forest 250.0 247 258 245 34 11,053 428 3.9 350 3.2 HMarflo Holsteins Wayne & Karen Martin Mount Forest 248.7 250 245 251 51 11,538 418 3.6 369 3.2 HDrewinda Holsteins Andrew Frey Mount Forest 248.7 244 247 255 34 10,792 404 3.7 359 3.3 H
*3× per day or greater milking (all or part)/traite 3× par jour R: Robotic/Robotique
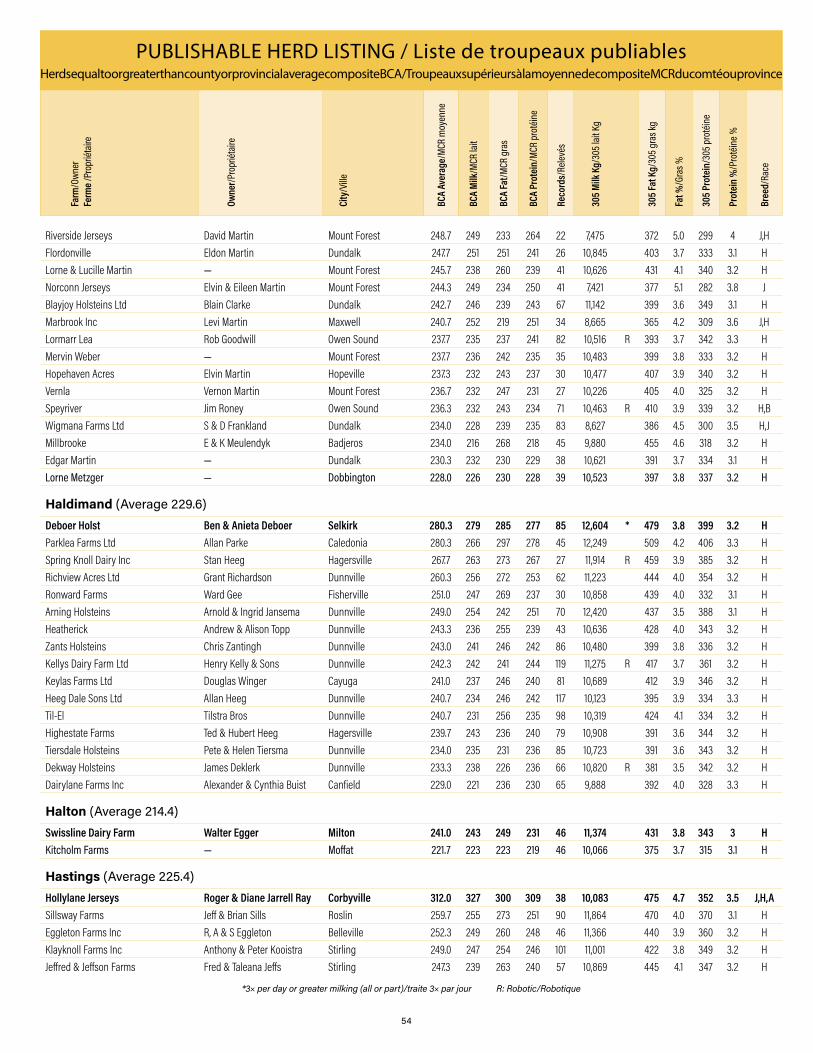
54
PUBLISHABLE HERD LISTING / Liste de troupeaux publiables Herds equal to or greater than county or provincial average composite BCA / Troupeaux supérieurs à la moyenne de composite MCR du comté ou province
Farm
/Own
er
Ferm
e /Pr
oprié
taire
Owne
r/Pro
priét
aire
City
/Ville
BCA
Aver
age/
MCR
moy
enne
BCA
Milk
/MCR
lait
BCA
Fat/M
CR g
ras
BCA
Prot
ein/
MCR
prot
éine
Reco
rds/
Relev
és
305 M
ilk K
g/30
5 lait
Kg
305 F
at K
g/30
5 gra
s kg
Fat %
/Gra
s %
305 P
rote
in/3
05 p
roté
ine
Prot
ein
%/P
roté
ine %
Bree
d/Ra
ce
Riverside Jerseys David Martin Mount Forest 248.7 249 233 264 22 7,475 372 5.0 299 4 J,HFlordonville Eldon Martin Dundalk 247.7 251 251 241 26 10,845 403 3.7 333 3.1 HLorne & Lucille Martin ― Mount Forest 245.7 238 260 239 41 10,626 431 4.1 340 3.2 HNorconn Jerseys Elvin & Eileen Martin Mount Forest 244.3 249 234 250 41 7,421 377 5.1 282 3.8 JBlayjoy Holsteins Ltd Blain Clarke Dundalk 242.7 246 239 243 67 11,142 399 3.6 349 3.1 HMarbrook Inc Levi Martin Maxwell 240.7 252 219 251 34 8,665 365 4.2 309 3.6 J,HLormarr Lea Rob Goodwill Owen Sound 237.7 235 237 241 82 10,516 R 393 3.7 342 3.3 HMervin Weber ― Mount Forest 237.7 236 242 235 35 10,483 399 3.8 333 3.2 HHopehaven Acres Elvin Martin Hopeville 237.3 232 243 237 30 10,477 407 3.9 340 3.2 HVernla Vernon Martin Mount Forest 236.7 232 247 231 27 10,226 405 4.0 325 3.2 HSpeyriver Jim Roney Owen Sound 236.3 232 243 234 71 10,463 R 410 3.9 339 3.2 H,BWigmana Farms Ltd S & D Frankland Dundalk 234.0 228 239 235 83 8,627 386 4.5 300 3.5 H,JMillbrooke E & K Meulendyk Badjeros 234.0 216 268 218 45 9,880 455 4.6 318 3.2 HEdgar Martin ― Dundalk 230.3 232 230 229 38 10,621 391 3.7 334 3.1 HLorne Metzger ― Dobbington 228.0 226 230 228 39 10,523 397 3.8 337 3.2 H
Haldimand (Average 229.6)Deboer Holst Ben & Anieta Deboer Selkirk 280.3 279 285 277 85 12,604 * 479 3.8 399 3.2 HParklea Farms Ltd Allan Parke Caledonia 280.3 266 297 278 45 12,249 509 4.2 406 3.3 HSpring Knoll Dairy Inc Stan Heeg Hagersville 267.7 263 273 267 27 11,914 R 459 3.9 385 3.2 HRichview Acres Ltd Grant Richardson Dunnville 260.3 256 272 253 62 11,223 444 4.0 354 3.2 HRonward Farms Ward Gee Fisherville 251.0 247 269 237 30 10,858 439 4.0 332 3.1 HArning Holsteins Arnold & Ingrid Jansema Dunnville 249.0 254 242 251 70 12,420 437 3.5 388 3.1 HHeatherick Andrew & Alison Topp Dunnville 243.3 236 255 239 43 10,636 428 4.0 343 3.2 HZants Holsteins Chris Zantingh Dunnville 243.0 241 246 242 86 10,480 399 3.8 336 3.2 HKellys Dairy Farm Ltd Henry Kelly & Sons Dunnville 242.3 242 241 244 119 11,275 R 417 3.7 361 3.2 HKeylas Farms Ltd Douglas Winger Cayuga 241.0 237 246 240 81 10,689 412 3.9 346 3.2 HHeeg Dale Sons Ltd Allan Heeg Dunnville 240.7 234 246 242 117 10,123 395 3.9 334 3.3 HTil-El Tilstra Bros Dunnville 240.7 231 256 235 98 10,319 424 4.1 334 3.2 HHighestate Farms Ted & Hubert Heeg Hagersville 239.7 243 236 240 79 10,908 391 3.6 344 3.2 HTiersdale Holsteins Pete & Helen Tiersma Dunnville 234.0 235 231 236 85 10,723 391 3.6 343 3.2 HDekway Holsteins James Deklerk Dunnville 233.3 238 226 236 66 10,820 R 381 3.5 342 3.2 HDairylane Farms Inc Alexander & Cynthia Buist Canfield 229.0 221 236 230 65 9,888 392 4.0 328 3.3 H
Halton (Average 214.4)Swissline Dairy Farm Walter Egger Milton 241.0 243 249 231 46 11,374 431 3.8 343 3 HKitcholm Farms ― Moffat 221.7 223 223 219 46 10,066 375 3.7 315 3.1 H
Hastings (Average 225.4)Hollylane Jerseys Roger & Diane Jarrell Ray Corbyville 312.0 327 300 309 38 10,083 475 4.7 352 3.5 J,H,ASillsway Farms Jeff & Brian Sills Roslin 259.7 255 273 251 90 11,864 470 4.0 370 3.1 HEggleton Farms Inc R, A & S Eggleton Belleville 252.3 249 260 248 46 11,366 440 3.9 360 3.2 HKlayknoll Farms Inc Anthony & Peter Kooistra Stirling 249.0 247 254 246 101 11,001 422 3.8 349 3.2 HJeffred & Jeffson Farms Fred & Taleana Jeffs Stirling 247.3 239 263 240 57 10,869 445 4.1 347 3.2 H
*3× per day or greater milking (all or part)/traite 3× par jour R: Robotic/Robotique

55
PUBLISHABLE HERD LISTING / Liste de troupeaux publiables Herds equal to or greater than county or provincial average composite BCA / Troupeaux supérieurs à la moyenne de composite MCR du comté ou province
Farm
/Own
er
Ferm
e /Pr
oprié
taire
Owne
r/Pro
priét
aire
City
/Ville
BCA
Aver
age/
MCR
moy
enne
BCA
Milk
/MCR
lait
BCA
Fat/M
CR g
ras
BCA
Prot
ein/
MCR
prot
éine
Reco
rds/
Relev
és
305 M
ilk K
g/30
5 lait
Kg
305 F
at K
g/30
5 gra
s kg
Fat %
/Gra
s %
305 P
rote
in/3
05 p
roté
ine
Prot
ein
%/P
roté
ine %
Bree
d/Ra
ce
Floridaview Farms Duane Redden Stirling 245.7 240 257 240 46 10,937 434 4.0 348 3.2 HBrownsonlea Jim Brownson Marmora 245.7 238 255 244 35 10,715 428 4.0 352 3.3 HCharcon Holsteins Charles Doornbos Foxboro 245.7 241 257 239 33 10,584 418 3.9 336 3.2 HChadwick Farms Inc W, B & R Chadwick Deseronto 242.7 235 253 240 62 10,516 421 4.0 342 3.3 HDonnandale ― Stirling 241.3 233 261 230 301 10,384 433 4.2 327 3.1 HRichlandview Farms Ltd Gary & Jeff Richardson Stirling 240.3 233 251 237 59 11,158 446 4.0 361 3.2 HAppenrose Farms Glen & Ryan Spencer Stirling 226.3 228 223 228 54 10,679 386 3.6 339 3.2 HRJ Farms Robert Jarrell Corbyville 226.0 234 206 238 90 7,976 351 4.4 295 3.7 J,H
Huron (Average 227.5)Gubelmann Brown Swiss Ltd Ernst Gubelmann Walton 304.0 298 306 308 64 11,356 470 4.1 410 3.6 BHeather Holme Farms Inc Glen McNeil Goderich 275.0 262 292 271 42 11,691 482 4.1 385 3.3 HOra Et Labora Inc John Branderhorst Hensall 274.3 278 276 269 51 12,856 * 472 3.7 396 3.1 HVan Dieten Farms Inc Hank & Derek Van Dieten Seaforth 274.0 272 294 256 76 12,451 * 499 4.0 374 3.0 HSwiss Lane A & T Rechsteiner Listowel 274.0 282 268 272 60 10,756 407 3.8 359 3.3 B,HShady Maple Farm Larry Martin Clifford 269.3 270 274 264 38 12,236 459 3.8 380 3.1 HRiverback Holsteins Elroy & Lynette Martin Gorrie 266.7 263 278 259 36 11,514 453 3.9 361 3.1 HGuntensperger Dairy Inc Karl Guntensperger Seaforth 264.7 263 267 264 143 11,349 426 3.8 361 3.2 HEvergreen Holsteins Robert Van Nes Ethel 263.3 263 262 265 465 11,914 440 3.7 381 3.2 HKlaview Holsteins John Klaver Kippen 259.7 260 265 254 54 11,020 * 418 3.8 344 3.1 HVan Nes Drying & Storage Andrea Van Nes Ethel 258.7 257 255 264 32 11,082 R 408 3.7 363 3.3 HHaag Farms Inc ― Brussels 258.0 254 270 250 142 11,133 R 440 4 348 3.1 HEckerlea Acres Christa Eckert Seaforth 256.0 256 268 244 194 11,301 * 440 3.9 344 3.0 HJadenrich Holsteins Dennis & Janice Gingrich Gorrie 253.7 257 256 248 48 11,399 421 3.7 351 3.1 HVinselaar Holsteins Inc Robert Van Den Hengel Seaforth 252.3 253 251 253 42 11,353 R 417 3.7 361 3.2 HRolling Lands Farms Tony & Anita Vanhittersum Blyth 250.3 249 255 247 115 10,718 408 3.8 340 3.2 HLiberty Farm Klaas & Annie De Boer Brussels 247.3 251 252 239 48 11,043 * 417 3.8 340 3.1 H,BProsperous Acres Jim & Judy Snyder Dashwood 246.7 246 237 257 45 6,471 254 3.9 221 3.4 MLaurlee Farm Leroy & Laurie Martin Fordwich 243.7 237 255 239 50 10,533 422 4.0 339 3.2 HDutchdale Perry Van Osch Lucknow 243.0 244 241 244 56 10,984 403 3.7 350 3.2 HMarhope Holsteins Clarence & Charlene Martin Gorrie 242.0 243 241 242 49 10,931 402 3.7 347 3.2 HRowill Jerseys ― Seaforth 241.3 245 223 256 87 7,072 R 347 4.9 280 4.0 JVinkelaar Farms Jan & Stevelien Bokkers Dublin 241.3 242 239 243 84 10,483 385 3.7 336 3.2 HBylsma Farms Ltd Jeff & Laurie Bylsma Blyth 240.3 241 249 231 96 11,083 425 3.8 338 3 HBruggert Farms Ltd ― Clinton 240.0 236 245 239 212 10,292 396 3.8 333 3.2 HHyland Holsteins John Calderwood Kippen 238.0 235 238 241 241 10,407 391 3.8 340 3.3 HHendriks Dairies Ltd Tyler Hendriks Egmondville 236.3 238 224 247 13 6,520 329 5.0 256 3.9 JKlasina & Renze Vander Ploeg ― Walton 235.7 233 242 232 79 10,332 398 3.9 328 3.2 HJohn Verburg ― Londesborough 234.3 236 237 230 44 10,833 401 3.7 334 3.1 HPedenia Holsteins Peter & Denise Angst Lucknow 234.0 235 235 232 58 10,225 R 380 3.7 322 3.1 HSilver Spring Farm Cleason & Rhoda Martin Fordwich 233.3 236 236 228 55 10,657 396 3.7 329 3.1 HErvin Bowman ― Clifford 233.3 245 210 245 37 6,936 322 4.6 263 3.8 JMaitland Hill Marley & Merilynn Shantz Gorrie 233.0 236 234 229 46 10,629 388 3.7 327 3.1 HJoyrod Holsteins Rodney & Joyce Shantz Gorrie 232.3 236 232 229 45 10,492 382 3.6 325 3.1 H
*3× per day or greater milking (all or part)/traite 3× par jour R: Robotic/Robotique
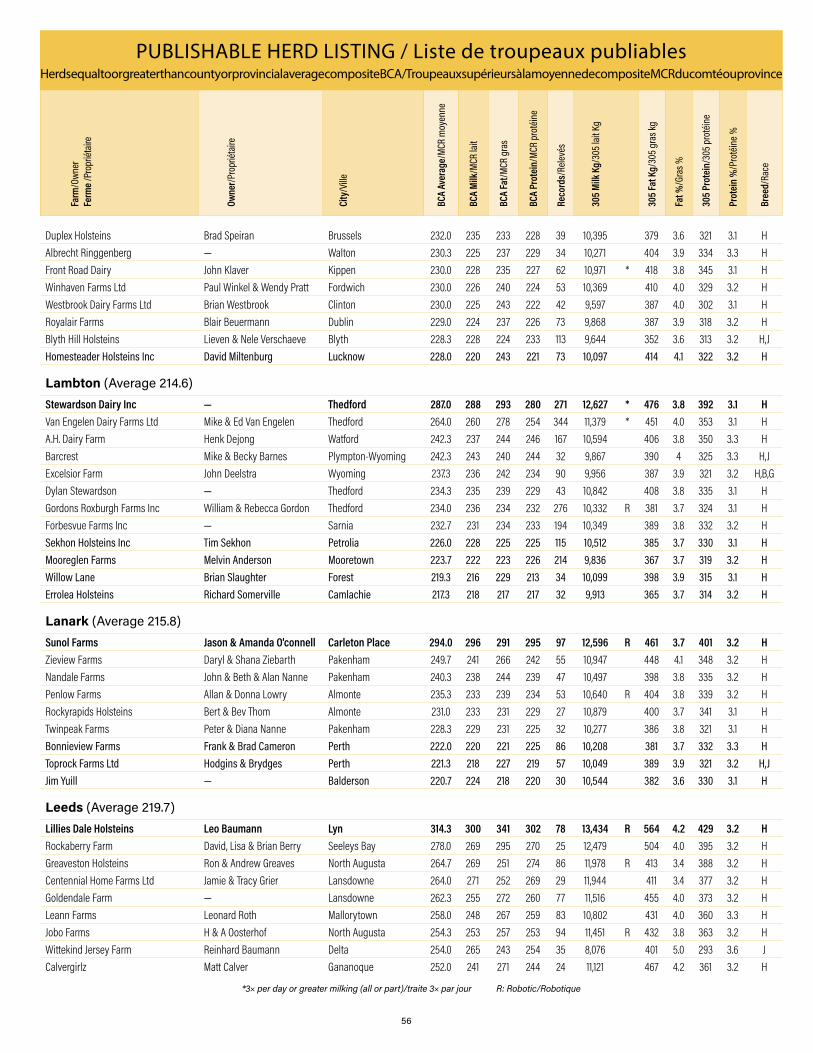
56
PUBLISHABLE HERD LISTING / Liste de troupeaux publiables Herds equal to or greater than county or provincial average composite BCA / Troupeaux supérieurs à la moyenne de composite MCR du comté ou province
Farm
/Own
er
Ferm
e /Pr
oprié
taire
Owne
r/Pro
priét
aire
City
/Ville
BCA
Aver
age/
MCR
moy
enne
BCA
Milk
/MCR
lait
BCA
Fat/M
CR g
ras
BCA
Prot
ein/
MCR
prot
éine
Reco
rds/
Relev
és
305 M
ilk K
g/30
5 lait
Kg
305 F
at K
g/30
5 gra
s kg
Fat %
/Gra
s %
305 P
rote
in/3
05 p
roté
ine
Prot
ein
%/P
roté
ine %
Bree
d/Ra
ce
Duplex Holsteins Brad Speiran Brussels 232.0 235 233 228 39 10,395 379 3.6 321 3.1 HAlbrecht Ringgenberg ― Walton 230.3 225 237 229 34 10,271 404 3.9 334 3.3 HFront Road Dairy John Klaver Kippen 230.0 228 235 227 62 10,971 * 418 3.8 345 3.1 HWinhaven Farms Ltd Paul Winkel & Wendy Pratt Fordwich 230.0 226 240 224 53 10,369 410 4.0 329 3.2 HWestbrook Dairy Farms Ltd Brian Westbrook Clinton 230.0 225 243 222 42 9,597 387 4.0 302 3.1 HRoyalair Farms Blair Beuermann Dublin 229.0 224 237 226 73 9,868 387 3.9 318 3.2 HBlyth Hill Holsteins Lieven & Nele Verschaeve Blyth 228.3 228 224 233 113 9,644 352 3.6 313 3.2 H,JHomesteader Holsteins Inc David Miltenburg Lucknow 228.0 220 243 221 73 10,097 414 4.1 322 3.2 H
Lambton (Average 214.6)Stewardson Dairy Inc ― Thedford 287.0 288 293 280 271 12,627 * 476 3.8 392 3.1 HVan Engelen Dairy Farms Ltd Mike & Ed Van Engelen Thedford 264.0 260 278 254 344 11,379 * 451 4.0 353 3.1 HA.H. Dairy Farm Henk Dejong Watford 242.3 237 244 246 167 10,594 406 3.8 350 3.3 HBarcrest Mike & Becky Barnes Plympton-Wyoming 242.3 243 240 244 32 9,867 390 4 325 3.3 H,JExcelsior Farm John Deelstra Wyoming 237.3 236 242 234 90 9,956 387 3.9 321 3.2 H,B,GDylan Stewardson ― Thedford 234.3 235 239 229 43 10,842 408 3.8 335 3.1 HGordons Roxburgh Farms Inc William & Rebecca Gordon Thedford 234.0 236 234 232 276 10,332 R 381 3.7 324 3.1 HForbesvue Farms Inc ― Sarnia 232.7 231 234 233 194 10,349 389 3.8 332 3.2 HSekhon Holsteins Inc Tim Sekhon Petrolia 226.0 228 225 225 115 10,512 385 3.7 330 3.1 HMooreglen Farms Melvin Anderson Mooretown 223.7 222 223 226 214 9,836 367 3.7 319 3.2 HWillow Lane Brian Slaughter Forest 219.3 216 229 213 34 10,099 398 3.9 315 3.1 HErrolea Holsteins Richard Somerville Camlachie 217.3 218 217 217 32 9,913 365 3.7 314 3.2 H
Lanark (Average 215.8)Sunol Farms Jason & Amanda O'connell Carleton Place 294.0 296 291 295 97 12,596 R 461 3.7 401 3.2 HZieview Farms Daryl & Shana Ziebarth Pakenham 249.7 241 266 242 55 10,947 448 4.1 348 3.2 HNandale Farms John & Beth & Alan Nanne Pakenham 240.3 238 244 239 47 10,497 398 3.8 335 3.2 HPenlow Farms Allan & Donna Lowry Almonte 235.3 233 239 234 53 10,640 R 404 3.8 339 3.2 HRockyrapids Holsteins Bert & Bev Thom Almonte 231.0 233 231 229 27 10,879 400 3.7 341 3.1 HTwinpeak Farms Peter & Diana Nanne Pakenham 228.3 229 231 225 32 10,277 386 3.8 321 3.1 HBonnieview Farms Frank & Brad Cameron Perth 222.0 220 221 225 86 10,208 381 3.7 332 3.3 HToprock Farms Ltd Hodgins & Brydges Perth 221.3 218 227 219 57 10,049 389 3.9 321 3.2 H,JJim Yuill ― Balderson 220.7 224 218 220 30 10,544 382 3.6 330 3.1 H
Leeds (Average 219.7)Lillies Dale Holsteins Leo Baumann Lyn 314.3 300 341 302 78 13,434 R 564 4.2 429 3.2 HRockaberry Farm David, Lisa & Brian Berry Seeleys Bay 278.0 269 295 270 25 12,479 504 4.0 395 3.2 HGreaveston Holsteins Ron & Andrew Greaves North Augusta 264.7 269 251 274 86 11,978 R 413 3.4 388 3.2 HCentennial Home Farms Ltd Jamie & Tracy Grier Lansdowne 264.0 271 252 269 29 11,944 411 3.4 377 3.2 HGoldendale Farm ― Lansdowne 262.3 255 272 260 77 11,516 455 4.0 373 3.2 HLeann Farms Leonard Roth Mallorytown 258.0 248 267 259 83 10,802 431 4.0 360 3.3 HJobo Farms H & A Oosterhof North Augusta 254.3 253 257 253 94 11,451 R 432 3.8 363 3.2 HWittekind Jersey Farm Reinhard Baumann Delta 254.0 265 243 254 35 8,076 401 5.0 293 3.6 JCalvergirlz Matt Calver Gananoque 252.0 241 271 244 24 11,121 467 4.2 361 3.2 H
*3× per day or greater milking (all or part)/traite 3× par jour R: Robotic/Robotique

57
PUBLISHABLE HERD LISTING / Liste de troupeaux publiables Herds equal to or greater than county or provincial average composite BCA / Troupeaux supérieurs à la moyenne de composite MCR du comté ou province
Farm
/Own
er
Ferm
e /Pr
oprié
taire
Owne
r/Pro
priét
aire
City
/Ville
BCA
Aver
age/
MCR
moy
enne
BCA
Milk
/MCR
lait
BCA
Fat/M
CR g
ras
BCA
Prot
ein/
MCR
prot
éine
Reco
rds/
Relev
és
305 M
ilk K
g/30
5 lait
Kg
305 F
at K
g/30
5 gra
s kg
Fat %
/Gra
s %
305 P
rote
in/3
05 p
roté
ine
Prot
ein
%/P
roté
ine %
Bree
d/Ra
ce
Maplelyn Holsteins Ed & Janet Wynands Lyn 245.3 233 266 237 61 10,257 434 4.2 333 3.2 HDonnaville Holsteins Richard & Susanna Shane Lyn 245.3 241 251 244 58 11,225 436 3.9 361 3.2 H,JSeelby Holsteins Ltd Dan Simpson Seeleys Bay 243.7 235 251 245 92 10,729 425 4.0 356 3.3 HCooligan Creek Farm Inc John Bongers & Family Elgin 242.7 236 256 236 81 10,888 438 4.0 347 3.2 HPurity Holsteins Kelvin Kerr Addison 239.7 237 242 240 9 11,217 426 3.8 362 3.2 HMaple-Ain Farms Ltd Hugh Hunter Smiths Falls 238.3 235 246 234 87 10,740 * 418 3.9 340 3.2 HLombard Dale R & L Macmillan Lombardy 235.3 230 241 235 59 9,490 378 4.0 311 3.3 H,AEvenstar Scott & Joyce Jackson Gananoque 233.3 228 238 234 56 10,417 403 3.9 339 3.3 HRail Crest Farms Les Bryan Purvis Larrin Lyn 228.3 223 236 226 57 9,979 391 3.9 322 3.2 HAlmarlea Allan Ferguson Brockville 228.0 225 237 222 45 10,667 * 416 3.9 334 3.1 HFresyl Farm Scott Berseth Brockville 224.7 220 235 219 68 9,555 380 4.0 304 3.2 HTanglin Farm Stephen Coote Frankville 224.0 218 229 225 61 9,461 368 3.9 310 3.3 H
Lennox-Addington (Average 223.0)MacLaughlin Farm Inc ― Tamworth 284.0 275 292 285 70 12,286 483 3.9 406 3.3 HRipplebrook Kevin Maclean Napanee 263.3 269 264 257 112 12,218 * 445 3.6 372 3.0 HHykabode Allan Huyck Bath 251.7 249 258 248 53 11,509 443 3.8 364 3.2 HLocust Dell Robert Grooms Napanee 250.0 252 259 239 39 11,220 428 3.8 339 3.0 HMartingale Matt & Sandra Jarmin Selby 232.3 226 236 235 89 10,192 394 3.9 336 3.3 HMillspring Wayne Milligan Napanee 232.0 230 239 227 81 10,622 408 3.8 332 3.1 HPoplardell Holsteins B Caughey & M Walhout Stella 231.7 226 238 231 53 10,880 * 425 3.9 352 3.2 HBrownlands Alan Brown & Son Enterprise 230.7 228 235 229 62 10,911 416 3.8 347 3.2 HPynacker Holsteins Gary Sonneveld Bath 226.0 225 226 227 56 10,446 388 3.7 336 3.2 HBeslea Farm Ltd Yarker 223.0 224 217 228 80 9,419 371 3.9 317 3.4 H,J
Manitoulin-Sudbury West (Average 245.8)Oshadenah Holsteins Alex & James Anstice Tehkummah 251.3 243 264 247 46 10,983 441 4.0 355 3.2 HJonella Farms John & Suzanne Mooney Massey 240.3 231 246 244 68 10,426 R 412 4.0 351 3.4 H
Middlesex (Average 223.9)Stanton Bros Ltd Jim, Jeff & Greg Stanton Ilderton 285.7 279 298 280 742 11,880 * 470 4.0 380 3.2 HLondedge Holsteins Inc Ted & Brian Brown Ilderton 262.0 262 274 250 87 11,706 * 453 3.9 356 3.0 HMcCutcheon Dairy Farms Mitch McCutcheon Thorndale 258.3 258 267 250 145 11,588 * 445 3.8 358 3.1 HGolden Meadow Holsteins Kenneth Hutcheson Mossley 257.0 250 256 265 77 10,309 417 4.0 357 3.5 H,JCavanaleck Farm Ltd ― Belmont 254.3 244 268 251 84 11,454 467 4.1 374 3.3 HBloomfield Farms Ltd Brian Bloomfield Ilderton 254.3 249 270 244 66 10,984 R 441 4.0 344 3.1 HDairi Acres Farms Ltd ― Strathroy 252.3 245 258 254 172 11,038 432 3.9 364 3.3 HGreenway Farms Ltd Ed Groenewegen Lucan 252.3 250 255 252 56 11,752 R 442 3.8 374 3.2 HAlfinch Holsteins Mary & Dave Finch Belmont 252.0 253 249 254 39 10,709 407 3.8 349 3.3 H,JCastle Hill Holsteins Andy Beattie London 251.3 249 262 243 77 10,625 416 3.9 332 3.1 HO'Neil Farms Steve O'Neil Thorndale 251.0 244 256 253 73 10,759 418 3.9 355 3.3 HMarvale Farms Ltd Isaak & Helena Klassen Mossley 250.3 247 260 244 23 11,393 444 3.9 358 3.1 HTalsdale Holsteins Ken & Shirley Talsma Kerwood 249.3 244 255 249 41 10,651 412 3.9 346 3.2 HHighbridge Farm A & J Hoogerbrugge Parkhill 246.7 242 252 246 110 10,574 409 3.9 344 3.3 H
*3× per day or greater milking (all or part)/traite 3× par jour R: Robotic/Robotique
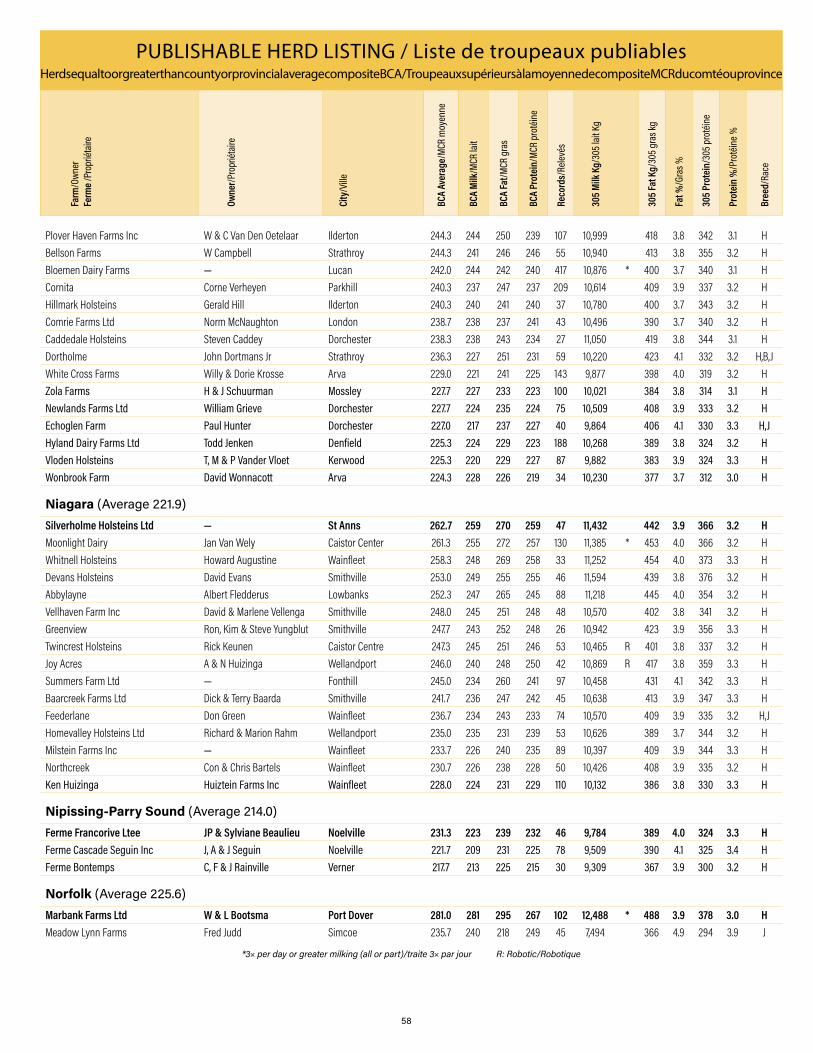
58
PUBLISHABLE HERD LISTING / Liste de troupeaux publiables Herds equal to or greater than county or provincial average composite BCA / Troupeaux supérieurs à la moyenne de composite MCR du comté ou province
Farm
/Own
er
Ferm
e /Pr
oprié
taire
Owne
r/Pro
priét
aire
City
/Ville
BCA
Aver
age/
MCR
moy
enne
BCA
Milk
/MCR
lait
BCA
Fat/M
CR g
ras
BCA
Prot
ein/
MCR
prot
éine
Reco
rds/
Relev
és
305 M
ilk K
g/30
5 lait
Kg
305 F
at K
g/30
5 gra
s kg
Fat %
/Gra
s %
305 P
rote
in/3
05 p
roté
ine
Prot
ein
%/P
roté
ine %
Bree
d/Ra
ce
Plover Haven Farms Inc W & C Van Den Oetelaar Ilderton 244.3 244 250 239 107 10,999 418 3.8 342 3.1 HBellson Farms W Campbell Strathroy 244.3 241 246 246 55 10,940 413 3.8 355 3.2 HBloemen Dairy Farms ― Lucan 242.0 244 242 240 417 10,876 * 400 3.7 340 3.1 HCornita Corne Verheyen Parkhill 240.3 237 247 237 209 10,614 409 3.9 337 3.2 HHillmark Holsteins Gerald Hill Ilderton 240.3 240 241 240 37 10,780 400 3.7 343 3.2 HComrie Farms Ltd Norm McNaughton London 238.7 238 237 241 43 10,496 390 3.7 340 3.2 HCaddedale Holsteins Steven Caddey Dorchester 238.3 238 243 234 27 11,050 419 3.8 344 3.1 HDortholme John Dortmans Jr Strathroy 236.3 227 251 231 59 10,220 423 4.1 332 3.2 H,B,JWhite Cross Farms Willy & Dorie Krosse Arva 229.0 221 241 225 143 9,877 398 4.0 319 3.2 HZola Farms H & J Schuurman Mossley 227.7 227 233 223 100 10,021 384 3.8 314 3.1 HNewlands Farms Ltd William Grieve Dorchester 227.7 224 235 224 75 10,509 408 3.9 333 3.2 HEchoglen Farm Paul Hunter Dorchester 227.0 217 237 227 40 9,864 406 4.1 330 3.3 H,JHyland Dairy Farms Ltd Todd Jenken Denfield 225.3 224 229 223 188 10,268 389 3.8 324 3.2 HVloden Holsteins T, M & P Vander Vloet Kerwood 225.3 220 229 227 87 9,882 383 3.9 324 3.3 HWonbrook Farm David Wonnacott Arva 224.3 228 226 219 34 10,230 377 3.7 312 3.0 H
Niagara (Average 221.9)Silverholme Holsteins Ltd ― St Anns 262.7 259 270 259 47 11,432 442 3.9 366 3.2 HMoonlight Dairy Jan Van Wely Caistor Center 261.3 255 272 257 130 11,385 * 453 4.0 366 3.2 HWhitnell Holsteins Howard Augustine Wainfleet 258.3 248 269 258 33 11,252 454 4.0 373 3.3 HDevans Holsteins David Evans Smithville 253.0 249 255 255 46 11,594 439 3.8 376 3.2 HAbbylayne Albert Fledderus Lowbanks 252.3 247 265 245 88 11,218 445 4.0 354 3.2 HVellhaven Farm Inc David & Marlene Vellenga Smithville 248.0 245 251 248 48 10,570 402 3.8 341 3.2 HGreenview Ron, Kim & Steve Yungblut Smithville 247.7 243 252 248 26 10,942 423 3.9 356 3.3 HTwincrest Holsteins Rick Keunen Caistor Centre 247.3 245 251 246 53 10,465 R 401 3.8 337 3.2 HJoy Acres A & N Huizinga Wellandport 246.0 240 248 250 42 10,869 R 417 3.8 359 3.3 HSummers Farm Ltd ― Fonthill 245.0 234 260 241 97 10,458 431 4.1 342 3.3 HBaarcreek Farms Ltd Dick & Terry Baarda Smithville 241.7 236 247 242 45 10,638 413 3.9 347 3.3 HFeederlane Don Green Wainfleet 236.7 234 243 233 74 10,570 409 3.9 335 3.2 H,JHomevalley Holsteins Ltd Richard & Marion Rahm Wellandport 235.0 235 231 239 53 10,626 389 3.7 344 3.2 HMilstein Farms Inc ― Wainfleet 233.7 226 240 235 89 10,397 409 3.9 344 3.3 HNorthcreek Con & Chris Bartels Wainfleet 230.7 226 238 228 50 10,426 408 3.9 335 3.2 HKen Huizinga Huiztein Farms Inc Wainfleet 228.0 224 231 229 110 10,132 386 3.8 330 3.3 H
Nipissing-Parry Sound (Average 214.0)Ferme Francorive Ltee JP & Sylviane Beaulieu Noelville 231.3 223 239 232 46 9,784 389 4.0 324 3.3 HFerme Cascade Seguin Inc J, A & J Seguin Noelville 221.7 209 231 225 78 9,509 390 4.1 325 3.4 HFerme Bontemps C, F & J Rainville Verner 217.7 213 225 215 30 9,309 367 3.9 300 3.2 H
Norfolk (Average 225.6)Marbank Farms Ltd W & L Bootsma Port Dover 281.0 281 295 267 102 12,488 * 488 3.9 378 3.0 HMeadow Lynn Farms Fred Judd Simcoe 235.7 240 218 249 45 7,494 366 4.9 294 3.9 J
*3× per day or greater milking (all or part)/traite 3× par jour R: Robotic/Robotique
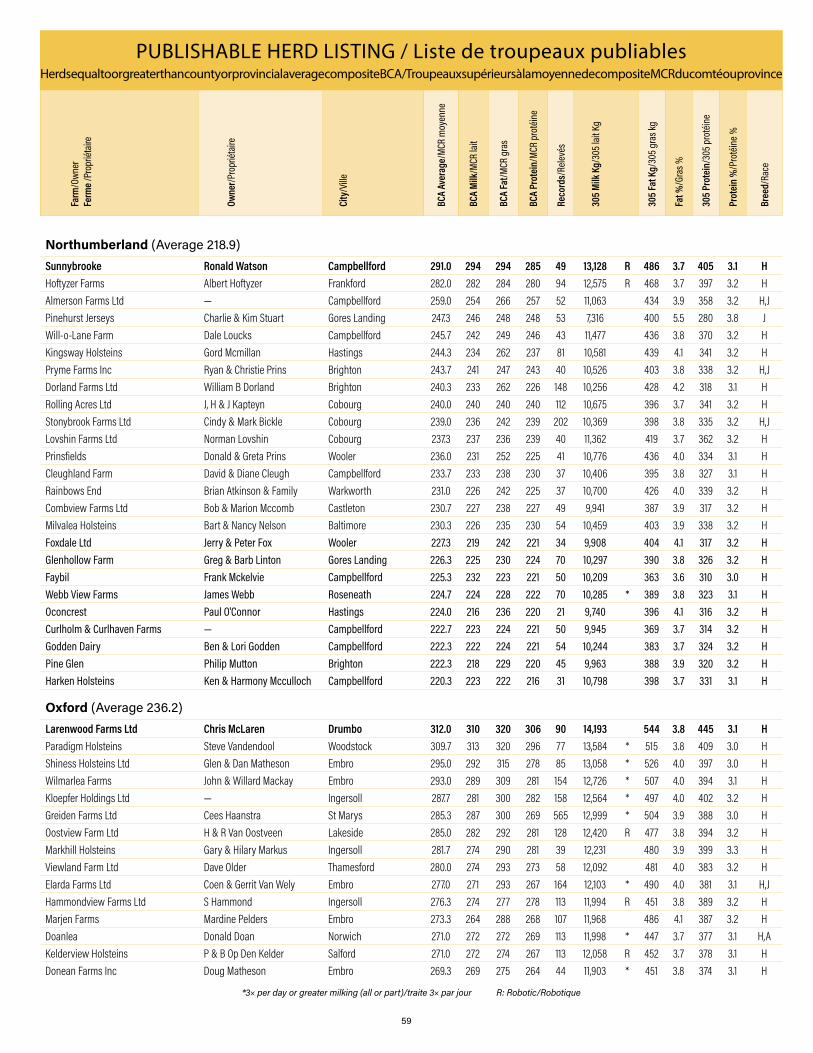
59
PUBLISHABLE HERD LISTING / Liste de troupeaux publiables Herds equal to or greater than county or provincial average composite BCA / Troupeaux supérieurs à la moyenne de composite MCR du comté ou province
Farm
/Own
er
Ferm
e /Pr
oprié
taire
Owne
r/Pro
priét
aire
City
/Ville
BCA
Aver
age/
MCR
moy
enne
BCA
Milk
/MCR
lait
BCA
Fat/M
CR g
ras
BCA
Prot
ein/
MCR
prot
éine
Reco
rds/
Relev
és
305 M
ilk K
g/30
5 lait
Kg
305 F
at K
g/30
5 gra
s kg
Fat %
/Gra
s %
305 P
rote
in/3
05 p
roté
ine
Prot
ein
%/P
roté
ine %
Bree
d/Ra
ce
Northumberland (Average 218.9)Sunnybrooke Ronald Watson Campbellford 291.0 294 294 285 49 13,128 R 486 3.7 405 3.1 HHoftyzer Farms Albert Hoftyzer Frankford 282.0 282 284 280 94 12,575 R 468 3.7 397 3.2 HAlmerson Farms Ltd ― Campbellford 259.0 254 266 257 52 11,063 434 3.9 358 3.2 H,JPinehurst Jerseys Charlie & Kim Stuart Gores Landing 247.3 246 248 248 53 7,316 400 5.5 280 3.8 JWill-o-Lane Farm Dale Loucks Campbellford 245.7 242 249 246 43 11,477 436 3.8 370 3.2 HKingsway Holsteins Gord Mcmillan Hastings 244.3 234 262 237 81 10,581 439 4.1 341 3.2 HPryme Farms Inc Ryan & Christie Prins Brighton 243.7 241 247 243 40 10,526 403 3.8 338 3.2 H,JDorland Farms Ltd William B Dorland Brighton 240.3 233 262 226 148 10,256 428 4.2 318 3.1 HRolling Acres Ltd J, H & J Kapteyn Cobourg 240.0 240 240 240 112 10,675 396 3.7 341 3.2 HStonybrook Farms Ltd Cindy & Mark Bickle Cobourg 239.0 236 242 239 202 10,369 398 3.8 335 3.2 H,JLovshin Farms Ltd Norman Lovshin Cobourg 237.3 237 236 239 40 11,362 419 3.7 362 3.2 HPrinsfields Donald & Greta Prins Wooler 236.0 231 252 225 41 10,776 436 4.0 334 3.1 HCleughland Farm David & Diane Cleugh Campbellford 233.7 233 238 230 37 10,406 395 3.8 327 3.1 HRainbows End Brian Atkinson & Family Warkworth 231.0 226 242 225 37 10,700 426 4.0 339 3.2 HCombview Farms Ltd Bob & Marion Mccomb Castleton 230.7 227 238 227 49 9,941 387 3.9 317 3.2 HMilvalea Holsteins Bart & Nancy Nelson Baltimore 230.3 226 235 230 54 10,459 403 3.9 338 3.2 HFoxdale Ltd Jerry & Peter Fox Wooler 227.3 219 242 221 34 9,908 404 4.1 317 3.2 HGlenhollow Farm Greg & Barb Linton Gores Landing 226.3 225 230 224 70 10,297 390 3.8 326 3.2 HFaybil Frank Mckelvie Campbellford 225.3 232 223 221 50 10,209 363 3.6 310 3.0 HWebb View Farms James Webb Roseneath 224.7 224 228 222 70 10,285 * 389 3.8 323 3.1 HOconcrest Paul O'Connor Hastings 224.0 216 236 220 21 9,740 396 4.1 316 3.2 HCurlholm & Curlhaven Farms ― Campbellford 222.7 223 224 221 50 9,945 369 3.7 314 3.2 HGodden Dairy Ben & Lori Godden Campbellford 222.3 222 224 221 54 10,244 383 3.7 324 3.2 HPine Glen Philip Mutton Brighton 222.3 218 229 220 45 9,963 388 3.9 320 3.2 HHarken Holsteins Ken & Harmony Mcculloch Campbellford 220.3 223 222 216 31 10,798 398 3.7 331 3.1 H
Oxford (Average 236.2)Larenwood Farms Ltd Chris McLaren Drumbo 312.0 310 320 306 90 14,193 544 3.8 445 3.1 HParadigm Holsteins Steve Vandendool Woodstock 309.7 313 320 296 77 13,584 * 515 3.8 409 3.0 HShiness Holsteins Ltd Glen & Dan Matheson Embro 295.0 292 315 278 85 13,058 * 526 4.0 397 3.0 HWilmarlea Farms John & Willard Mackay Embro 293.0 289 309 281 154 12,726 * 507 4.0 394 3.1 HKloepfer Holdings Ltd ― Ingersoll 287.7 281 300 282 158 12,564 * 497 4.0 402 3.2 HGreiden Farms Ltd Cees Haanstra St Marys 285.3 287 300 269 565 12,999 * 504 3.9 388 3.0 HOostview Farm Ltd H & R Van Oostveen Lakeside 285.0 282 292 281 128 12,420 R 477 3.8 394 3.2 HMarkhill Holsteins Gary & Hilary Markus Ingersoll 281.7 274 290 281 39 12,231 480 3.9 399 3.3 HViewland Farm Ltd Dave Older Thamesford 280.0 274 293 273 58 12,092 481 4.0 383 3.2 HElarda Farms Ltd Coen & Gerrit Van Wely Embro 277.0 271 293 267 164 12,103 * 490 4.0 381 3.1 H,JHammondview Farms Ltd S Hammond Ingersoll 276.3 274 277 278 113 11,994 R 451 3.8 389 3.2 HMarjen Farms Mardine Pelders Embro 273.3 264 288 268 107 11,968 486 4.1 387 3.2 HDoanlea Donald Doan Norwich 271.0 272 272 269 113 11,998 * 447 3.7 377 3.1 H,AKelderview Holsteins P & B Op Den Kelder Salford 271.0 272 274 267 113 12,058 R 452 3.7 378 3.1 HDonean Farms Inc Doug Matheson Embro 269.3 269 275 264 44 11,903 * 451 3.8 374 3.1 H
*3× per day or greater milking (all or part)/traite 3× par jour R: Robotic/Robotique

60
PUBLISHABLE HERD LISTING / Liste de troupeaux publiables Herds equal to or greater than county or provincial average composite BCA / Troupeaux supérieurs à la moyenne de composite MCR du comté ou province
Farm
/Own
er
Ferm
e /Pr
oprié
taire
Owne
r/Pro
priét
aire
City
/Ville
BCA
Aver
age/
MCR
moy
enne
BCA
Milk
/MCR
lait
BCA
Fat/M
CR g
ras
BCA
Prot
ein/
MCR
prot
éine
Reco
rds/
Relev
és
305 M
ilk K
g/30
5 lait
Kg
305 F
at K
g/30
5 gra
s kg
Fat %
/Gra
s %
305 P
rote
in/3
05 p
roté
ine
Prot
ein
%/P
roté
ine %
Bree
d/Ra
ce
Dairy Doc Holsteins Matt Walker Woodstock 268.3 267 273 265 37 11,823 R 446 3.8 373 3.2 HVeldale Farms Ltd Evert & Jan Veldhuizen Jr Woodstock 267.7 264 273 266 113 11,578 442 3.8 370 3.2 HDairydale John Garner Embro 267.7 263 284 256 99 11,712 * 470 4.0 362 3.1 HGreenmoor Farms Paul Shulman Embro 266.3 277 250 272 114 7,688 R 375 4.9 287 3.7 JWiljaven Will & Jacqueline Koot Thamesford 263.7 261 272 258 68 11,645 R 450 3.9 366 3.1 HMarkwood Farms Inc Peter & Pauline Markus Beachville 262.7 256 266 266 128 11,180 430 3.8 371 3.3 HBushy View Farm Mike Unholzer Lakeside 262.7 257 278 253 70 11,863 480 4.0 372 3.1 HWerkholm Holsteins Ltd Frank & Kevin Werkema Embro 261.3 259 265 260 86 11,953 * 453 3.8 381 3.2 HCalmac Holsteins ― Embro 260.7 253 273 256 47 11,312 R 452 4.0 364 3.2 HBlair Kelner ― Woodstock 260.7 263 262 257 42 11,577 R 429 3.7 361 3.1 HBrightside Dairy Inc Henk Van Roekel Innerkip 260.3 256 270 255 105 11,243 * 441 3.9 359 3.2 HWikkerink Farms Ltd Roger Wikkerink Norwich 260.0 255 267 258 59 11,908 R 460 3.9 382 3.2 HElmwold Farms Chris & Paul Buchner Brownsville 258.7 254 275 247 191 11,048 * 446 4 343 3.1 HMarkvale Holsteins C & W Markus Beachville 258.0 252 266 256 113 11,190 439 3.9 364 3.3 HWykholme Farm John & Melanie Vanwyk Woodstock 257.7 256 263 254 87 11,728 R 447 3.8 371 3.2 HVrederijk Dairy Dirk-Jan Griffioen Tavistock 257.7 256 269 248 83 11,600 * 455 3.9 359 3.1 HView Hill Holsteins Rene & Bianca Strik Woodstock 257.3 257 256 259 91 11,699 431 3.7 374 3.2 HWalnutlawn Burnell & Darlene Zehr Tavistock 257.3 245 274 253 59 10,979 455 4.1 361 3.3 HRoesbett Farms Ltd Gerry & Debbie Roefs Lakeside 257.0 254 266 251 46 10,902 440 4.0 349 3.2 H,JRingia Farms Ltd Mulder Family Lakeside 256.0 251 264 253 370 11,311 * 442 3.9 364 3.2 HVanview Farms Inc ― Burgessville 255.7 250 262 255 73 10,935 427 3.9 356 3.3 HHazeldom & Hanalee Holsteins Hank Hazeleger Embro 255.3 249 264 253 118 11,298 444 3.9 364 3.2 HKarnvilla Dean & Doug Karn Woodstock 254.7 249 260 255 92 11,212 433 3.9 366 3.3 HWilliam Mcintosh ― Embro 254.3 250 262 251 93 11,272 439 3.9 361 3.2 H,JTriplekay Holsteins Cindy & Brent Hartman Embro 254.0 242 272 248 47 10,461 439 4.2 342 3.3 HHammondowns Farms David Hammond Ingersoll 253.3 243 272 245 217 10,355 R 431 4.2 333 3.2 HClaessic Fields John & Jo-Ann Claessens Ingersoll 252.7 266 232 260 68 8,032 381 4.7 299 3.7 JWardway Farm Bruce Ward Woodstock 252.7 246 271 241 68 10,712 443 4.1 335 3.1 H,JSmithden Holsteins James Smith Woodstock 252.0 246 253 257 101 11,016 422 3.8 366 3.3 H,J
Warby Farm Henny & Hendriks Van Warby Ingersoll 252.0 252 256 248 85 11,236 423 3.8 353 3.1 H
Highhaven Holsteins Inc Dirk Heeg Tavistock 251.7 249 255 251 118 11,202 424 3.8 359 3.2 HNew Galma Dairy N & W Zeldenrijk Mount Elgin 251.3 247 254 253 131 11,253 R 432 3.8 367 3.3 HBuistlane Farms Ltd Klaas & Gerda Buist Mount Elgin 251.0 238 269 246 59 10,450 438 4.2 344 3.3 HHeeg Dairy Inc Sytse & Anita Heeg New Hamburg 249.3 244 256 248 111 11,158 R 435 3.9 361 3.2 HSpero Holsteins Ltd David & Joyce Vanderspek Embro 247.7 252 249 242 133 11,292 * 416 3.7 346 3.1 H,JGierdown Farms Ltd Harry & Cody De Gier Tavistock 247.0 242 255 244 115 10,791 421 3.9 347 3.2 HVonburg Farms Carl & Lisa Vondervoort Woodstock 247.0 245 258 238 46 11,300 440 3.9 350 3.1 HVelrob Steven & Carol Veldman Embro 246.7 244 249 247 93 10,793 407 3.8 347 3.2 HUp-Ridge Charles & Joanne Lupton Embro 246.3 243 252 244 106 10,821 416 3.8 346 3.2 H,JMayblossom Joost & Bonnie Jongert Embro 245.7 248 240 249 144 11,060 397 3.6 354 3.2 HA & K Van Lith Cassel Dairy Farms Bright 245.3 237 252 247 164 10,806 428 4.0 360 3.3 HDarcroft Farm Ltd Paul & Ellen Macleod Embro 245.3 234 269 233 103 10,534 452 4.3 334 3.2 HGreen Alda Farm Inc Cecil Hofstetter Plattsville 245.3 233 278 225 38 10,772 479 4.4 330 3.1 H
*3× per day or greater milking (all or part)/traite 3× par jour R: Robotic/Robotique

61
PUBLISHABLE HERD LISTING / Liste de troupeaux publiables Herds equal to or greater than county or provincial average composite BCA / Troupeaux supérieurs à la moyenne de composite MCR du comté ou province
Farm
/Own
er
Ferm
e /Pr
oprié
taire
Owne
r/Pro
priét
aire
City
/Ville
BCA
Aver
age/
MCR
moy
enne
BCA
Milk
/MCR
lait
BCA
Fat/M
CR g
ras
BCA
Prot
ein/
MCR
prot
éine
Reco
rds/
Relev
és
305 M
ilk K
g/30
5 lait
Kg
305 F
at K
g/30
5 gra
s kg
Fat %
/Gra
s %
305 P
rote
in/3
05 p
roté
ine
Prot
ein
%/P
roté
ine %
Bree
d/Ra
ce
Altofarm Inc Tony Zondag Glencoe 245.0 246 250 239 87 10,685 403 3.8 331 3.1 HSteenholl Dairy Farms Ltd Remco Steen Norwich 245.0 240 247 248 57 11,323 433 3.8 371 3.3 HKouwenberg Dairy Inc Arjan Kouwenberg Salford 243.7 238 253 240 115 10,850 428 3.9 347 3.2 HHoenhorst Farms Ltd Gerrit & Margriet Wensink Innerkip 243.3 240 244 246 410 10,829 R 408 3.8 353 3.3 HFraholme Farms Inc Mark & Wayne Fraser Embro 243.0 244 243 242 71 10,779 R 398 3.7 340 3.2 HDanensview Farms Inc Jack & Jane Danen Tavistock 242.7 247 242 239 98 10,649 R 386 3.6 328 3.1 HStonehenge Holsteins Ron Lightfoot Hickson 242.7 242 253 233 84 10,996 426 3.9 337 3.1 HWoodstonian Holsteins Inc Kees & Wilma Overzet Ingersoll 242.3 242 250 235 131 11,014 * 422 3.8 340 3.1 HWitview Farm Hugh Dewit Embro 242.3 237 247 243 44 10,533 408 3.9 345 3.3 HBrentridge Holstein Ltd Brent Pike Ingersoll 242.3 241 243 243 41 10,602 398 3.8 342 3.2 HMaplekay Farms Ltd Donald McKay Woodstock 242.0 233 257 236 40 10,498 430 4.1 338 3.2 HScherpenzeel Farms Wim Scherpenzeel Ingersoll 241.7 240 240 245 279 10,717 397 3.7 348 3.2 HLeeholm Holsteins Pat Lee Otterville 241.7 241 245 239 101 10,880 411 3.8 344 3.2 HE & J Kroondijk-Vogelzang ― Woodstock 241.3 236 243 245 112 10,390 R 396 3.8 344 3.3 HEvert & Lys Veldhuizen ― Woodstock 241.0 238 241 244 66 10,403 R 391 3.8 339 3.3 HKlynhill Holsteins Hein & Thea Van Der Klyn Burgessville 240.3 233 262 226 107 10,414 434 4.2 321 3.1 HDykholm Farms Ltd Harry Dykxhoorn Brownsville 239.0 236 242 239 119 10,366 394 3.8 335 3.2 HFloral Dairy Inc Aalt Pelleboer Tillsonburg 238.7 231 254 231 166 10,148 R 415 4.1 324 3.2 HDon Richardson ― St Marys 238.3 247 225 243 48 7,031 257 3.7 225 3.2 M,HOrnum Farms Ltd Fred Munro Embro 238.0 230 250 234 113 10,105 406 4.0 327 3.2 HBrucevale Bruce Schmidt Tavistock 236.7 229 244 237 128 10,401 409 3.9 342 3.3 HGrobrook Farm Ltd Nick Groot & Jos Heinsbroek Ingersoll 236.3 239 226 244 72 6,912 353 5.1 268 3.9 JHazelcrest John & Nancy Hazeleger Embro 236.3 228 251 230 63 10,707 434 4.1 343 3.2 HLochalsh Holsteins Inc ― Embro 236.0 235 242 231 182 10,722 409 3.8 334 3.1 HDrianneh Green Dairy Ltd Arnold Deboer Mount Elgin 235.3 226 244 236 146 9,924 R 398 4.0 330 3.3 HSkeeview Farms Bob & Cathy & Will Luyben Thamesford 235.3 241 222 243 75 7,082 R 353 5.0 271 3.8 JBoon Crocket Mac & Rose Jakeman Thamesford 235.3 238 232 236 36 8,241 330 4.0 268 3.3 A,HFraman Brad Fraser Embro 234.3 232 238 233 81 10,595 R 402 3.8 338 3.2 HHarcolm Farms Ltd Mckinlay & Hargreaves Beachville 234.0 233 237 232 49 9,674 R 397 4.1 319 3.3 H,JCelmar Dairy Ltd Marcel & Annika Steen Norwich 233.7 225 240 236 148 10,055 R 398 4.0 336 3.3 HFriesiana Holsteins Ltd Peter Deboer Tillsonburg 233.7 226 242 233 139 10,105 400 4.0 331 3.3 HMapleburg Holsteins Robert & Dorthy Garfat Woodstock 233.7 226 248 227 44 9,936 R 403 4.1 317 3.2 HGlenbert Glen Sim Embro 233.3 220 258 222 66 9,987 436 4.4 320 3.2 HFaralary Hill Farms Ltd Steve & Teresa Mackay Embro 233.0 230 239 230 184 10,296 395 3.8 327 3.2 HDestination Dairy Ltd Allardus Nauta Woodstock 233.0 231 234 234 156 10,340 388 3.8 333 3.2 HSteveleigh Holsteins Steve Witmer Woodstock 233.0 230 236 233 52 10,689 407 3.8 343 3.2 HHighland View Holsteins Nico Byl Salford 233.0 229 235 235 45 10,070 385 3.8 330 3.3 HBribrad Farm Brad & Tara Mcintosh Embro 233.0 230 242 227 44 10,561 412 3.9 331 3.1 HStephensonlane Matt Stephenson Ingersoll 233.0 226 244 229 41 10,315 R 412 4.0 331 3.2 HInnlawn Fred Innes Embro 231.3 233 235 226 50 10,525 393 3.7 325 3.1 HArnhome Farms Ltd Bruce Arnott Bright 231.0 225 244 224 50 10,511 R 422 4.0 332 3.2 HRoss Loch Jim & Karen Ross Embro 230.0 226 234 230 41 9,987 382 3.8 323 3.2 HRenhope Farm Ltd Craig & Cara Renkema Woodstock 229.7 222 247 220 74 10,003 412 4.1 316 3.2 HGrenook Farms Inc Bob & Karen Green Embro 229.3 225 242 221 78 10,241 408 4.0 319 3.1 H
*3× per day or greater milking (all or part)/traite 3× par jour R: Robotic/Robotique
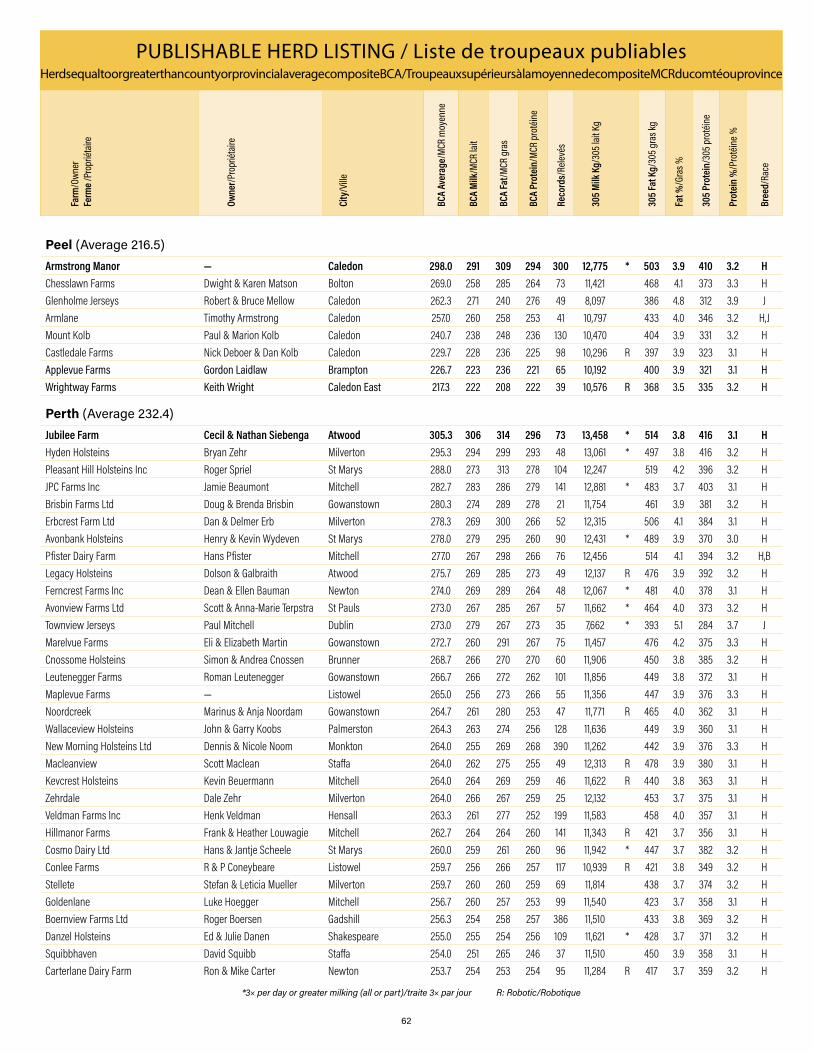
62
PUBLISHABLE HERD LISTING / Liste de troupeaux publiables Herds equal to or greater than county or provincial average composite BCA / Troupeaux supérieurs à la moyenne de composite MCR du comté ou province
Farm
/Own
er
Ferm
e /Pr
oprié
taire
Owne
r/Pro
priét
aire
City
/Ville
BCA
Aver
age/
MCR
moy
enne
BCA
Milk
/MCR
lait
BCA
Fat/M
CR g
ras
BCA
Prot
ein/
MCR
prot
éine
Reco
rds/
Relev
és
305 M
ilk K
g/30
5 lait
Kg
305 F
at K
g/30
5 gra
s kg
Fat %
/Gra
s %
305 P
rote
in/3
05 p
roté
ine
Prot
ein
%/P
roté
ine %
Bree
d/Ra
ce
Peel (Average 216.5)Armstrong Manor ― Caledon 298.0 291 309 294 300 12,775 * 503 3.9 410 3.2 HChesslawn Farms Dwight & Karen Matson Bolton 269.0 258 285 264 73 11,421 468 4.1 373 3.3 HGlenholme Jerseys Robert & Bruce Mellow Caledon 262.3 271 240 276 49 8,097 386 4.8 312 3.9 JArmlane Timothy Armstrong Caledon 257.0 260 258 253 41 10,797 433 4.0 346 3.2 H,JMount Kolb Paul & Marion Kolb Caledon 240.7 238 248 236 130 10,470 404 3.9 331 3.2 HCastledale Farms Nick Deboer & Dan Kolb Caledon 229.7 228 236 225 98 10,296 R 397 3.9 323 3.1 HApplevue Farms Gordon Laidlaw Brampton 226.7 223 236 221 65 10,192 400 3.9 321 3.1 HWrightway Farms Keith Wright Caledon East 217.3 222 208 222 39 10,576 R 368 3.5 335 3.2 H
Perth (Average 232.4)Jubilee Farm Cecil & Nathan Siebenga Atwood 305.3 306 314 296 73 13,458 * 514 3.8 416 3.1 HHyden Holsteins Bryan Zehr Milverton 295.3 294 299 293 48 13,061 * 497 3.8 416 3.2 HPleasant Hill Holsteins Inc Roger Spriel St Marys 288.0 273 313 278 104 12,247 519 4.2 396 3.2 HJPC Farms Inc Jamie Beaumont Mitchell 282.7 283 286 279 141 12,881 * 483 3.7 403 3.1 HBrisbin Farms Ltd Doug & Brenda Brisbin Gowanstown 280.3 274 289 278 21 11,754 461 3.9 381 3.2 HErbcrest Farm Ltd Dan & Delmer Erb Milverton 278.3 269 300 266 52 12,315 506 4.1 384 3.1 HAvonbank Holsteins Henry & Kevin Wydeven St Marys 278.0 279 295 260 90 12,431 * 489 3.9 370 3.0 HPfister Dairy Farm Hans Pfister Mitchell 277.0 267 298 266 76 12,456 514 4.1 394 3.2 H,BLegacy Holsteins Dolson & Galbraith Atwood 275.7 269 285 273 49 12,137 R 476 3.9 392 3.2 HFerncrest Farms Inc Dean & Ellen Bauman Newton 274.0 269 289 264 48 12,067 * 481 4.0 378 3.1 HAvonview Farms Ltd Scott & Anna-Marie Terpstra St Pauls 273.0 267 285 267 57 11,662 * 464 4.0 373 3.2 HTownview Jerseys Paul Mitchell Dublin 273.0 279 267 273 35 7,662 * 393 5.1 284 3.7 JMarelvue Farms Eli & Elizabeth Martin Gowanstown 272.7 260 291 267 75 11,457 476 4.2 375 3.3 HCnossome Holsteins Simon & Andrea Cnossen Brunner 268.7 266 270 270 60 11,906 450 3.8 385 3.2 HLeutenegger Farms Roman Leutenegger Gowanstown 266.7 266 272 262 101 11,856 449 3.8 372 3.1 HMaplevue Farms ― Listowel 265.0 256 273 266 55 11,356 447 3.9 376 3.3 HNoordcreek Marinus & Anja Noordam Gowanstown 264.7 261 280 253 47 11,771 R 465 4.0 362 3.1 HWallaceview Holsteins John & Garry Koobs Palmerston 264.3 263 274 256 128 11,636 449 3.9 360 3.1 HNew Morning Holsteins Ltd Dennis & Nicole Noom Monkton 264.0 255 269 268 390 11,262 442 3.9 376 3.3 HMacleanview Scott Maclean Staffa 264.0 262 275 255 49 12,313 R 478 3.9 380 3.1 HKevcrest Holsteins Kevin Beuermann Mitchell 264.0 264 269 259 46 11,622 R 440 3.8 363 3.1 HZehrdale Dale Zehr Milverton 264.0 266 267 259 25 12,132 453 3.7 375 3.1 HVeldman Farms Inc Henk Veldman Hensall 263.3 261 277 252 199 11,583 458 4.0 357 3.1 HHillmanor Farms Frank & Heather Louwagie Mitchell 262.7 264 264 260 141 11,343 R 421 3.7 356 3.1 HCosmo Dairy Ltd Hans & Jantje Scheele St Marys 260.0 259 261 260 96 11,942 * 447 3.7 382 3.2 HConlee Farms R & P Coneybeare Listowel 259.7 256 266 257 117 10,939 R 421 3.8 349 3.2 HStellete Stefan & Leticia Mueller Milverton 259.7 260 260 259 69 11,814 438 3.7 374 3.2 HGoldenlane Luke Hoegger Mitchell 256.7 260 257 253 99 11,540 423 3.7 358 3.1 HBoernview Farms Ltd Roger Boersen Gadshill 256.3 254 258 257 386 11,510 433 3.8 369 3.2 HDanzel Holsteins Ed & Julie Danen Shakespeare 255.0 255 254 256 109 11,621 * 428 3.7 371 3.2 HSquibbhaven David Squibb Staffa 254.0 251 265 246 37 11,510 450 3.9 358 3.1 HCarterlane Dairy Farm Ron & Mike Carter Newton 253.7 254 253 254 95 11,284 R 417 3.7 359 3.2 H
*3× per day or greater milking (all or part)/traite 3× par jour R: Robotic/Robotique
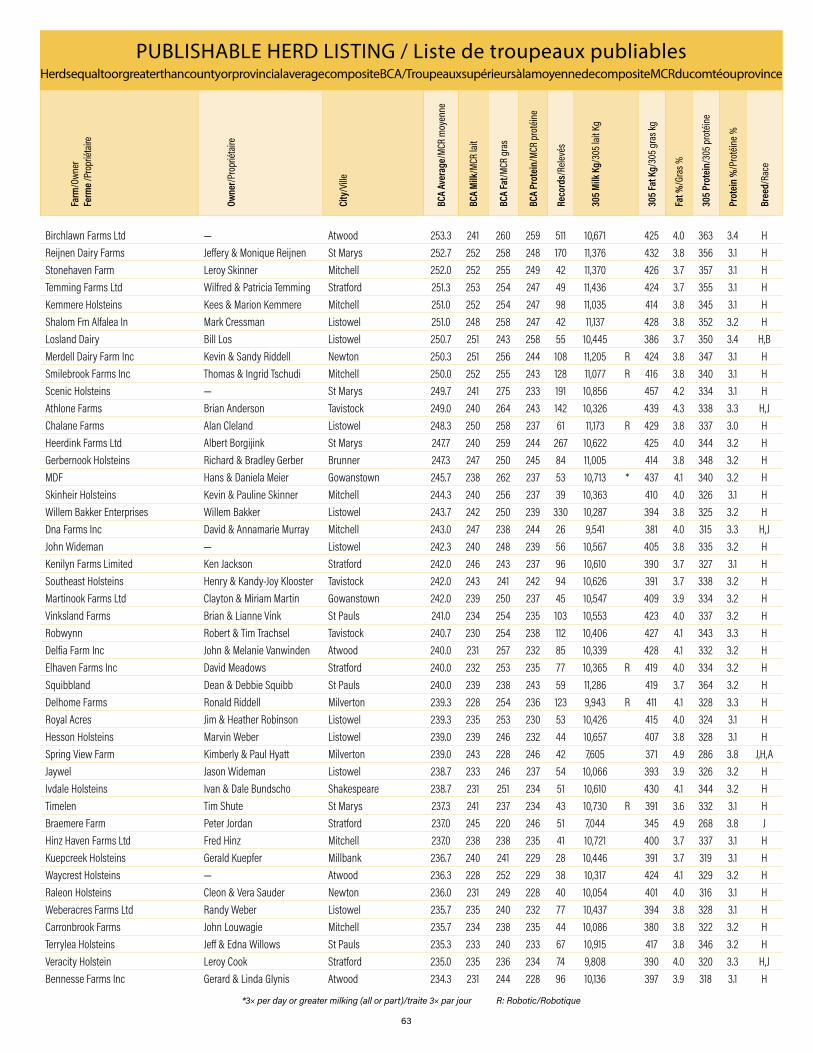
63
PUBLISHABLE HERD LISTING / Liste de troupeaux publiables Herds equal to or greater than county or provincial average composite BCA / Troupeaux supérieurs à la moyenne de composite MCR du comté ou province
Farm
/Own
er
Ferm
e /Pr
oprié
taire
Owne
r/Pro
priét
aire
City
/Ville
BCA
Aver
age/
MCR
moy
enne
BCA
Milk
/MCR
lait
BCA
Fat/M
CR g
ras
BCA
Prot
ein/
MCR
prot
éine
Reco
rds/
Relev
és
305 M
ilk K
g/30
5 lait
Kg
305 F
at K
g/30
5 gra
s kg
Fat %
/Gra
s %
305 P
rote
in/3
05 p
roté
ine
Prot
ein
%/P
roté
ine %
Bree
d/Ra
ce
Birchlawn Farms Ltd ― Atwood 253.3 241 260 259 511 10,671 425 4.0 363 3.4 HReijnen Dairy Farms Jeffery & Monique Reijnen St Marys 252.7 252 258 248 170 11,376 432 3.8 356 3.1 HStonehaven Farm Leroy Skinner Mitchell 252.0 252 255 249 42 11,370 426 3.7 357 3.1 HTemming Farms Ltd Wilfred & Patricia Temming Stratford 251.3 253 254 247 49 11,436 424 3.7 355 3.1 HKemmere Holsteins Kees & Marion Kemmere Mitchell 251.0 252 254 247 98 11,035 414 3.8 345 3.1 HShalom Fm Alfalea In Mark Cressman Listowel 251.0 248 258 247 42 11,137 428 3.8 352 3.2 HLosland Dairy Bill Los Listowel 250.7 251 243 258 55 10,445 386 3.7 350 3.4 H,BMerdell Dairy Farm Inc Kevin & Sandy Riddell Newton 250.3 251 256 244 108 11,205 R 424 3.8 347 3.1 HSmilebrook Farms Inc Thomas & Ingrid Tschudi Mitchell 250.0 252 255 243 128 11,077 R 416 3.8 340 3.1 HScenic Holsteins ― St Marys 249.7 241 275 233 191 10,856 457 4.2 334 3.1 HAthlone Farms Brian Anderson Tavistock 249.0 240 264 243 142 10,326 439 4.3 338 3.3 H,JChalane Farms Alan Cleland Listowel 248.3 250 258 237 61 11,173 R 429 3.8 337 3.0 HHeerdink Farms Ltd Albert Borgijink St Marys 247.7 240 259 244 267 10,622 425 4.0 344 3.2 HGerbernook Holsteins Richard & Bradley Gerber Brunner 247.3 247 250 245 84 11,005 414 3.8 348 3.2 HMDF Hans & Daniela Meier Gowanstown 245.7 238 262 237 53 10,713 * 437 4.1 340 3.2 HSkinheir Holsteins Kevin & Pauline Skinner Mitchell 244.3 240 256 237 39 10,363 410 4.0 326 3.1 HWillem Bakker Enterprises Willem Bakker Listowel 243.7 242 250 239 330 10,287 394 3.8 325 3.2 HDna Farms Inc David & Annamarie Murray Mitchell 243.0 247 238 244 26 9,541 381 4.0 315 3.3 H,JJohn Wideman ― Listowel 242.3 240 248 239 56 10,567 405 3.8 335 3.2 HKenilyn Farms Limited Ken Jackson Stratford 242.0 246 243 237 96 10,610 390 3.7 327 3.1 HSoutheast Holsteins Henry & Kandy-Joy Klooster Tavistock 242.0 243 241 242 94 10,626 391 3.7 338 3.2 HMartinook Farms Ltd Clayton & Miriam Martin Gowanstown 242.0 239 250 237 45 10,547 409 3.9 334 3.2 HVinksland Farms Brian & Lianne Vink St Pauls 241.0 234 254 235 103 10,553 423 4.0 337 3.2 HRobwynn Robert & Tim Trachsel Tavistock 240.7 230 254 238 112 10,406 427 4.1 343 3.3 HDelfia Farm Inc John & Melanie Vanwinden Atwood 240.0 231 257 232 85 10,339 428 4.1 332 3.2 HElhaven Farms Inc David Meadows Stratford 240.0 232 253 235 77 10,365 R 419 4.0 334 3.2 HSquibbland Dean & Debbie Squibb St Pauls 240.0 239 238 243 59 11,286 419 3.7 364 3.2 HDelhome Farms Ronald Riddell Milverton 239.3 228 254 236 123 9,943 R 411 4.1 328 3.3 HRoyal Acres Jim & Heather Robinson Listowel 239.3 235 253 230 53 10,426 415 4.0 324 3.1 HHesson Holsteins Marvin Weber Listowel 239.0 239 246 232 44 10,657 407 3.8 328 3.1 HSpring View Farm Kimberly & Paul Hyatt Milverton 239.0 243 228 246 42 7,605 371 4.9 286 3.8 J,H,AJaywel Jason Wideman Listowel 238.7 233 246 237 54 10,066 393 3.9 326 3.2 HIvdale Holsteins Ivan & Dale Bundscho Shakespeare 238.7 231 251 234 51 10,610 430 4.1 344 3.2 HTimelen Tim Shute St Marys 237.3 241 237 234 43 10,730 R 391 3.6 332 3.1 HBraemere Farm Peter Jordan Stratford 237.0 245 220 246 51 7,044 345 4.9 268 3.8 JHinz Haven Farms Ltd Fred Hinz Mitchell 237.0 238 238 235 41 10,721 400 3.7 337 3.1 HKuepcreek Holsteins Gerald Kuepfer Millbank 236.7 240 241 229 28 10,446 391 3.7 319 3.1 HWaycrest Holsteins ― Atwood 236.3 228 252 229 38 10,317 424 4.1 329 3.2 HRaleon Holsteins Cleon & Vera Sauder Newton 236.0 231 249 228 40 10,054 401 4.0 316 3.1 HWeberacres Farms Ltd Randy Weber Listowel 235.7 235 240 232 77 10,437 394 3.8 328 3.1 HCarronbrook Farms John Louwagie Mitchell 235.7 234 238 235 44 10,086 380 3.8 322 3.2 HTerrylea Holsteins Jeff & Edna Willows St Pauls 235.3 233 240 233 67 10,915 417 3.8 346 3.2 HVeracity Holstein Leroy Cook Stratford 235.0 235 236 234 74 9,808 390 4.0 320 3.3 H,JBennesse Farms Inc Gerard & Linda Glynis Atwood 234.3 231 244 228 96 10,136 397 3.9 318 3.1 H
*3× per day or greater milking (all or part)/traite 3× par jour R: Robotic/Robotique

64
PUBLISHABLE HERD LISTING / Liste de troupeaux publiables Herds equal to or greater than county or provincial average composite BCA / Troupeaux supérieurs à la moyenne de composite MCR du comté ou province
Farm
/Own
er
Ferm
e /Pr
oprié
taire
Owne
r/Pro
priét
aire
City
/Ville
BCA
Aver
age/
MCR
moy
enne
BCA
Milk
/MCR
lait
BCA
Fat/M
CR g
ras
BCA
Prot
ein/
MCR
prot
éine
Reco
rds/
Relev
és
305 M
ilk K
g/30
5 lait
Kg
305 F
at K
g/30
5 gra
s kg
Fat %
/Gra
s %
305 P
rote
in/3
05 p
roté
ine
Prot
ein
%/P
roté
ine %
Bree
d/Ra
ce
Tedliz Ted & Liz Van Den Tempel Poole 234.3 233 239 231 67 10,658 R 404 3.8 335 3.1 HGreydanus Farms Jason & Kara Greydanus Gowanstown 234.0 235 233 234 69 10,354 380 3.7 327 3.2 HVronernes Dairy John Duif Listowel 233.7 227 248 226 123 9,989 405 4.1 316 3.2 HTenhove Farms ― Gowanstown 233.7 239 224 238 67 7,942 360 4.5 284 3.6 J,HArwynd Farms Inc ― Atwood 233.7 235 232 234 66 10,653 391 3.7 337 3.2 HCookhill Farms Ltd Irvin, Chris & Dennis Cook Gadshill 233.3 232 239 229 111 10,351 399 3.9 326 3.1 H,JPop-a-Top Holsteins Kevin Squibb St Pauls 232.3 236 228 233 41 10,606 379 3.6 333 3.1 HEdgar Horst ― Listowel 232.3 238 222 237 30 7,536 380 5.0 285 3.8 JMornholme Holsteins Paul Frey Listowel 231.0 226 235 232 65 10,225 395 3.9 333 3.3 HDe Witt Haven Inc Ralph & Heather Dewitt Stratford 231.0 230 240 223 34 10,127 391 3.9 313 3.1 HWeberdream Holsteins Mike Weber Brunner 230.7 234 230 228 35 10,321 382 3.7 322 3.1 H,JLewood Holsteins Inc Levi Jantzi Newton 230.0 226 238 226 79 10,334 403 3.9 328 3.2 HWalmsdale Harry Walmsley Milverton 230.0 228 237 225 31 10,049 386 3.8 316 3.1 HLenslake Farms Henno & Henriet Lensvelt Gowanstown 229.3 227 227 234 53 10,131 374 3.7 332 3.3 HCarldot Farms Ltd Larry Krantz Stratford 229.0 222 245 220 48 10,046 R 409 4.1 316 3.1 HJoosse Dairy Inc ― Mitchell 228.7 225 236 225 130 10,078 391 3.9 321 3.2 HTimean Holsteins Timothy Frey Listowel 228.7 223 234 229 36 10,138 395 3.9 332 3.3 H
Peterborough (Average 210.9)Embrdale Farm ― Norwood 265.7 263 278 256 63 12,176 * 477 3.9 377 3.1 HSedgrose Farms Robert Sedgwick & Sons Norwood 263.7 265 267 259 65 11,832 442 3.7 369 3.1 HExtramile Farm Kirk & Sherry Stockdale Keene 260.3 251 281 249 77 11,503 482 4.2 364 3.2 H,JLifloc Holsteins Thom Murray Otonabee 257.0 257 260 254 23 12,135 455 3.7 381 3.1 HVelan Farms Randy & Kevin Morton Cavan 247.3 238 260 244 35 10,957 443 4.0 356 3.2 HCrovalley Holsteins John Crowley Hastings 247.0 241 256 244 82 10,975 433 3.9 354 3.2 HLynmark Tim Shearer Norwood 244.3 241 243 249 43 7,893 317 4.0 264 3.3 M,H,JErdine Farms Rick Pulfer Hastings 228.3 225 227 233 62 10,496 391 3.7 345 3.3 HArmdale Farm Glen Armstrong Millbrook 228.0 224 232 228 33 10,425 397 3.8 336 3.2 HHurstelm Andy & Rob Elmhurst Hastings 224.3 223 231 219 32 10,706 410 3.8 333 3.1 HNewcorner Bill & Rick Van Engen Millbrook 224.0 220 222 230 35 9,755 365 3.7 325 3.3 HRonbeth Holsteins Camron, Warner & Murphy Hastings 221.0 215 230 218 53 9,863 390 4.0 318 3.2 HTrent Valley Holsteins Gerald Coughlin Jr. Peterborough 220.7 218 227 217 28 10,069 388 3.9 318 3.2 HBargeolane Farms Blayne & Geoff Barr Warsaw 219.7 215 227 217 53 9,640 380 3.9 311 3.2 HCarlow Farms Murray Carlow Douro Dummer 217.0 211 218 222 89 9,409 362 3.8 315 3.3 HWellsfarm John Van Beek Norwood 215.3 211 224 211 46 9,213 366 4.0 295 3.2 H,BMelvin Davis ― Ennismore 211.7 215 211 209 44 9,879 359 3.6 305 3.1 HKedeb Acres N ,F & K Kidd Selwyn 211.3 208 214 212 39 9,829 377 3.8 319 3.2 H
Prescott (Average 232.1)Ontario Inc 1024248 Andy Senn St Bernardin 322.7 319 330 319 438 13,976 * 539 3.9 446 3.2 HFerme Serheal Claude & Celine Seguin St Isidore 303.3 302 309 299 72 13,230 504 3.8 417 3.2 HFerme Lavigne Inc Alain & Jean-Pierre Lavigne Ste Anne De Prescott 292.0 293 297 286 131 13,006 * 489 3.8 404 3.1 HFerme Mirella Inc Guy & Carol Levac St Bernardin 290.3 289 300 282 108 13,124 504 3.8 409 3.1 HFerme Frederic Ltd Luc Fredette Plantagenet 290.0 281 304 285 90 12,822 R 513 4.0 412 3.2 H
*3× per day or greater milking (all or part)/traite 3× par jour R: Robotic/Robotique
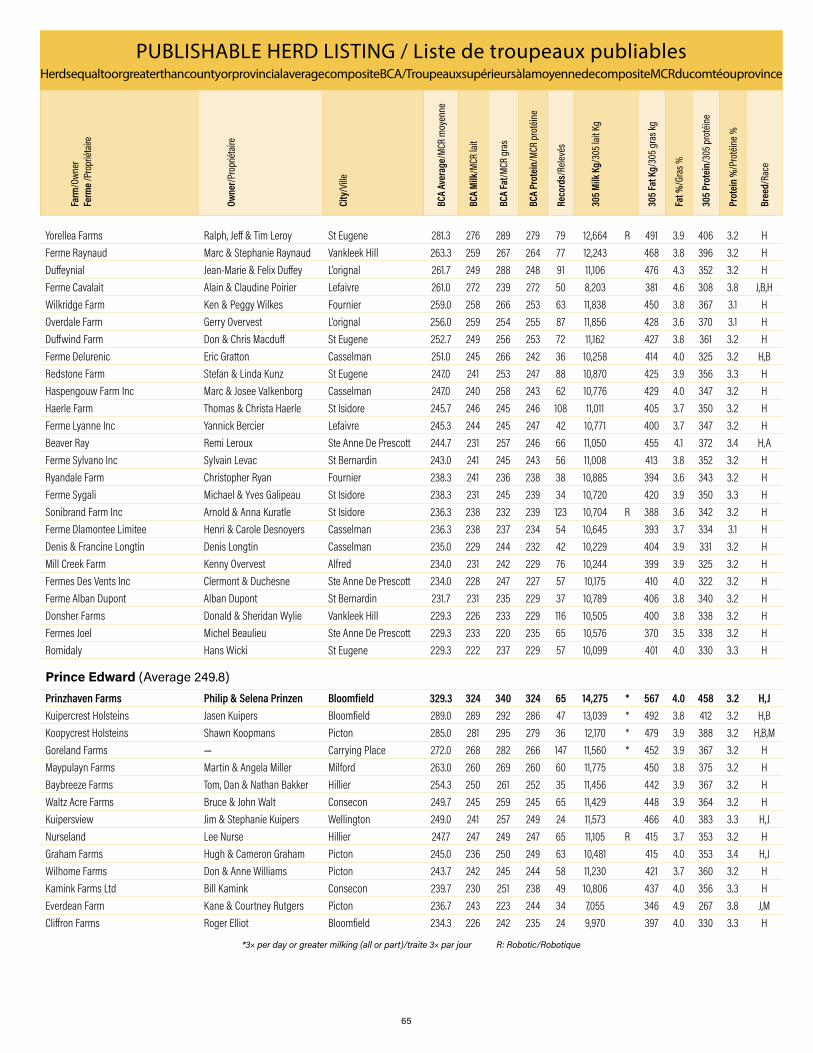
65
PUBLISHABLE HERD LISTING / Liste de troupeaux publiables Herds equal to or greater than county or provincial average composite BCA / Troupeaux supérieurs à la moyenne de composite MCR du comté ou province
Farm
/Own
er
Ferm
e /Pr
oprié
taire
Owne
r/Pro
priét
aire
City
/Ville
BCA
Aver
age/
MCR
moy
enne
BCA
Milk
/MCR
lait
BCA
Fat/M
CR g
ras
BCA
Prot
ein/
MCR
prot
éine
Reco
rds/
Relev
és
305 M
ilk K
g/30
5 lait
Kg
305 F
at K
g/30
5 gra
s kg
Fat %
/Gra
s %
305 P
rote
in/3
05 p
roté
ine
Prot
ein
%/P
roté
ine %
Bree
d/Ra
ce
Yorellea Farms Ralph, Jeff & Tim Leroy St Eugene 281.3 276 289 279 79 12,664 R 491 3.9 406 3.2 HFerme Raynaud Marc & Stephanie Raynaud Vankleek Hill 263.3 259 267 264 77 12,243 468 3.8 396 3.2 HDuffeynial Jean-Marie & Felix Duffey L'orignal 261.7 249 288 248 91 11,106 476 4.3 352 3.2 HFerme Cavalait Alain & Claudine Poirier Lefaivre 261.0 272 239 272 50 8,203 381 4.6 308 3.8 J,B,HWilkridge Farm Ken & Peggy Wilkes Fournier 259.0 258 266 253 63 11,838 450 3.8 367 3.1 HOverdale Farm Gerry Overvest L'orignal 256.0 259 254 255 87 11,856 428 3.6 370 3.1 HDuffwind Farm Don & Chris Macduff St Eugene 252.7 249 256 253 72 11,162 427 3.8 361 3.2 HFerme Delurenic Eric Gratton Casselman 251.0 245 266 242 36 10,258 414 4.0 325 3.2 H,BRedstone Farm Stefan & Linda Kunz St Eugene 247.0 241 253 247 88 10,870 425 3.9 356 3.3 HHaspengouw Farm Inc Marc & Josee Valkenborg Casselman 247.0 240 258 243 62 10,776 429 4.0 347 3.2 HHaerle Farm Thomas & Christa Haerle St Isidore 245.7 246 245 246 108 11,011 405 3.7 350 3.2 HFerme Lyanne Inc Yannick Bercier Lefaivre 245.3 244 245 247 42 10,771 400 3.7 347 3.2 HBeaver Ray Remi Leroux Ste Anne De Prescott 244.7 231 257 246 66 11,050 455 4.1 372 3.4 H,AFerme Sylvano Inc Sylvain Levac St Bernardin 243.0 241 245 243 56 11,008 413 3.8 352 3.2 HRyandale Farm Christopher Ryan Fournier 238.3 241 236 238 38 10,885 394 3.6 343 3.2 HFerme Sygali Michael & Yves Galipeau St Isidore 238.3 231 245 239 34 10,720 420 3.9 350 3.3 HSonibrand Farm Inc Arnold & Anna Kuratle St Isidore 236.3 238 232 239 123 10,704 R 388 3.6 342 3.2 HFerme Dlamontee Limitee Henri & Carole Desnoyers Casselman 236.3 238 237 234 54 10,645 393 3.7 334 3.1 HDenis & Francine Longtin Denis Longtin Casselman 235.0 229 244 232 42 10,229 404 3.9 331 3.2 HMill Creek Farm Kenny Overvest Alfred 234.0 231 242 229 76 10,244 399 3.9 325 3.2 HFermes Des Vents Inc Clermont & Duchesne Ste Anne De Prescott 234.0 228 247 227 57 10,175 410 4.0 322 3.2 HFerme Alban Dupont Alban Dupont St Bernardin 231.7 231 235 229 37 10,789 406 3.8 340 3.2 HDonsher Farms Donald & Sheridan Wylie Vankleek Hill 229.3 226 233 229 116 10,505 400 3.8 338 3.2 HFermes Joel Michel Beaulieu Ste Anne De Prescott 229.3 233 220 235 65 10,576 370 3.5 338 3.2 HRomidaly Hans Wicki St Eugene 229.3 222 237 229 57 10,099 401 4.0 330 3.3 H
Prince Edward (Average 249.8)Prinzhaven Farms Philip & Selena Prinzen Bloomfield 329.3 324 340 324 65 14,275 * 567 4.0 458 3.2 H,JKuipercrest Holsteins Jasen Kuipers Bloomfield 289.0 289 292 286 47 13,039 * 492 3.8 412 3.2 H,BKoopycrest Holsteins Shawn Koopmans Picton 285.0 281 295 279 36 12,170 * 479 3.9 388 3.2 H,B,MGoreland Farms ― Carrying Place 272.0 268 282 266 147 11,560 * 452 3.9 367 3.2 HMaypulayn Farms Martin & Angela Miller Milford 263.0 260 269 260 60 11,775 450 3.8 375 3.2 HBaybreeze Farms Tom, Dan & Nathan Bakker Hillier 254.3 250 261 252 35 11,456 442 3.9 367 3.2 HWaltz Acre Farms Bruce & John Walt Consecon 249.7 245 259 245 65 11,429 448 3.9 364 3.2 HKuipersview Jim & Stephanie Kuipers Wellington 249.0 241 257 249 24 11,573 466 4.0 383 3.3 H,JNurseland Lee Nurse Hillier 247.7 247 249 247 65 11,105 R 415 3.7 353 3.2 HGraham Farms Hugh & Cameron Graham Picton 245.0 236 250 249 63 10,481 415 4.0 353 3.4 H,JWilhome Farms Don & Anne Williams Picton 243.7 242 245 244 58 11,230 421 3.7 360 3.2 HKamink Farms Ltd Bill Kamink Consecon 239.7 230 251 238 49 10,806 437 4.0 356 3.3 HEverdean Farm Kane & Courtney Rutgers Picton 236.7 243 223 244 34 7,055 346 4.9 267 3.8 J,MCliffron Farms Roger Elliot Bloomfield 234.3 226 242 235 24 9,970 397 4.0 330 3.3 H
*3× per day or greater milking (all or part)/traite 3× par jour R: Robotic/Robotique

66
PUBLISHABLE HERD LISTING / Liste de troupeaux publiables Herds equal to or greater than county or provincial average composite BCA / Troupeaux supérieurs à la moyenne de composite MCR du comté ou province
Farm
/Own
er
Ferm
e /Pr
oprié
taire
Owne
r/Pro
priét
aire
City
/Ville
BCA
Aver
age/
MCR
moy
enne
BCA
Milk
/MCR
lait
BCA
Fat/M
CR g
ras
BCA
Prot
ein/
MCR
prot
éine
Reco
rds/
Relev
és
305 M
ilk K
g/30
5 lait
Kg
305 F
at K
g/30
5 gra
s kg
Fat %
/Gra
s %
305 P
rote
in/3
05 p
roté
ine
Prot
ein
%/P
roté
ine %
Bree
d/Ra
ce
Rainy River (Average 233.7)Gerber Dairy Farm Jacob Gerber Fort Frances 246.7 247 251 242 32 11,102 420 3.8 348 3.1 HRainy Acre Farm Herman Krahn Rainy River 236.7 235 243 232 32 10,587 407 3.8 334 3.2 H
Renfrew (Average 217.2)Gouldhaven Farms Barry R Gould Foresters Falls 285.7 271 304 282 45 12,541 520 4.1 414 3.3 HPetermann Holsteins Nick & Steph Petermann Pembroke 253.0 245 263 251 54 10,861 432 4.0 354 3.3 HDiro Holsteins Gerry & Linda Rook Cobden 251.3 242 263 249 31 11,157 451 4.0 365 3.3 HDonden Farms Inc ― Renfrew 248.7 245 261 240 50 11,458 451 3.9 356 3.1 HPinehaven Holsteins Kevin Agnew Cobden 238.3 229 247 239 40 10,398 416 4.0 344 3.3 HBriscoelea Alex & Betty Briscoe Renfrew 234.7 229 251 224 53 9,956 403 4.0 310 3.1 HLindmilk Farms ― Renfrew 233.7 230 241 230 117 10,290 399 3.9 328 3.2 HStraathof Farms John Straathof Arnprior 232.3 230 231 236 122 10,219 R 381 3.7 333 3.3 HFepro Farms Fritz & Paul Klaesi Cobden 229.3 224 233 231 148 10,072 R 389 3.9 330 3.3 H,GMcBride Farms Paul McBride Cobden 225.7 218 237 222 58 10,081 406 4.0 326 3.2 HGreenlark Farms Rob Fletcher Pembroke 220.0 223 214 223 39 10,350 369 3.6 329 3.2 HSpruce Briar Jerseys Andrew Bromley Westmeath 219.7 229 205 225 51 6,886 317 4.6 250 3.6 J,MFlolyn Holsteins Floyd & Lynette Bauman Cobden 219.3 224 215 219 42 9,906 353 3.6 307 3.1 H
Russell (Average 240.6)Bertom Farm F & T Vanmunsteren Sarsfield 307.7 307 306 310 86 13,463 * 497 3.7 434 3.2 HBrabantdale Farms Ltd Chris & John Nooyen Navan 305.3 306 307 303 82 13,651 * 504 3.7 429 3.1 HFerme Prospere Inc Luc & Sylvie Dutrisac Orleans 299.7 288 312 299 37 12,650 509 4.0 419 3.3 HFerme DD Gascon Et Fils Inc Denis Gascon Navan 283.7 274 302 275 42 12,472 507 4.1 397 3.2 HBerwen Holsteins Bert & Wendy Molenaar Cumberland 277.7 275 279 279 39 12,215 458 3.7 394 3.2 HMorrisbel Holsteins Denis Morris Sarsfield 274.3 274 275 274 78 12,132 451 3.7 387 3.2 HSunrise Holsteins Inc Edgar & Ramona Kaelin Clarence Creek 274.0 270 286 266 49 11,610 457 3.9 365 3.1 HClearview Farm Chris & Abbie Mueller Clarence Creek 272.3 268 281 268 71 12,208 474 3.9 387 3.2 HMelistar Marc Bergeron Vars 268.0 260 284 260 72 11,993 486 4.1 382 3.2 HFerme St Malo Inc Etienne Seguin St Pascal 268.0 258 275 271 69 11,675 460 3.9 388 3.3 HHeiwa Farm Walter Von Ah St Albert 264.7 255 276 263 108 11,036 449 4.1 368 3.3 H,BFerme A & L Desnoyers ― St Albert 263.7 258 278 255 86 11,460 460 4.0 362 3.2 HTinyville Farm Eric Ruiter Russell 258.3 258 262 255 19 11,351 427 3.8 359 3.2 HFerme Descayer Et Fils Francois Cayer St Albert 258.0 248 270 256 60 10,666 431 4.0 351 3.3 HRusland Farm Inc ― Cumberland 257.3 249 282 241 111 11,065 465 4.2 342 3.1 HReylene R & H Blanchard Embrun 257.3 249 274 249 98 11,034 450 4.1 352 3.2 HLa Ferme Ben-Rey-Mo Ltd Reynald Benoit St Albert 256.7 252 265 253 89 10,993 427 3.9 351 3.2 HLa Ferme Gillette Gilles Patenaude Embrun 254.7 246 270 248 554 10,757 * 440 4.1 346 3.2 HRosenhill Farm Inc Andre Hildbrand St Albert 253.3 251 265 244 93 11,255 439 3.9 347 3.1 HDlasept Jacques Lafleche St Albert 252.3 250 263 244 88 11,055 431 3.9 345 3.1 HFerme Ricky Inc Patrick Seguin St Albert 252.0 250 255 251 75 11,404 431 3.8 364 3.2 HShadylane M & T Schoeni Russell 250.3 247 249 255 125 8,824 365 4.1 299 3.4 AFerme Philos Inc Philippe Etter Sarsfield 243.0 233 249 247 122 10,389 410 3.9 349 3.4 H
*3× per day or greater milking (all or part)/traite 3× par jour R: Robotic/Robotique

67
PUBLISHABLE HERD LISTING / Liste de troupeaux publiables Herds equal to or greater than county or provincial average composite BCA / Troupeaux supérieurs à la moyenne de composite MCR du comté ou province
Farm
/Own
er
Ferm
e /Pr
oprié
taire
Owne
r/Pro
priét
aire
City
/Ville
BCA
Aver
age/
MCR
moy
enne
BCA
Milk
/MCR
lait
BCA
Fat/M
CR g
ras
BCA
Prot
ein/
MCR
prot
éine
Reco
rds/
Relev
és
305 M
ilk K
g/30
5 lait
Kg
305 F
at K
g/30
5 gra
s kg
Fat %
/Gra
s %
305 P
rote
in/3
05 p
roté
ine
Prot
ein
%/P
roté
ine %
Bree
d/Ra
ce
Smygwatys Holsteins Ray & Terry Smygwaty Russell 243.0 234 253 242 51 10,883 436 4.0 357 3.3 HFerme Dessaint Inc Nicholas Dessaint Sarsfield 241.3 230 263 231 62 10,315 434 4.2 330 3.2 HHanenberg Farms Inc Dan & Willy Hanenberg Navan 240.7 231 250 241 68 10,808 435 4.0 359 3.3 HFerme Hupdale Fernand & Sylvie Menard Clarence Creek 240.7 233 249 240 58 10,891 432 4.0 357 3.3 HGeranik Gerald Benoit St Albert 240.3 233 261 227 118 10,757 446 4.1 333 3.1 HDe Groot Horizons Dairy Inc Marcel De Groot Hammond 240.3 233 261 227 38 10,172 426 4.2 318 3.1 HFerme Kricelana Robert & Laure Jaquemet Bourget 236.3 224 250 235 60 10,364 430 4.1 346 3.3 HHasliland Thomas & Paula Meyerhans Casselman 235.7 233 248 226 116 10,552 416 3.9 325 3.1 HBoldi J & L Oeschger Vars 235.3 226 241 239 54 9,869 393 4.0 334 3.4 HBraedale Holstein Terry & Mark Beaton Cumberland 233.7 234 233 234 64 10,719 396 3.7 341 3.2 HLarchway Scott Rathwell Navan 229.7 226 233 230 31 10,243 393 3.8 331 3.2 HFerme Des 4 Guindon Inc Jenrene Guindon Hammond 228.3 218 244 223 53 10,098 419 4.1 328 3.2 H
Simcoe (Average 224.5)Robins Holsteins Andy & Jason Robinson Midland 278.3 277 284 274 53 12,137 462 3.8 383 3.2 HRay & Donna Klein-Gebbinck ― Elmvale 274.3 269 277 277 39 11,865 452 3.8 389 3.3 HClearcrest Farms ― New Lowell 265.7 256 276 265 54 9,994 426 4.3 354 3.5 B,HShady Glen Farms Kevin & Steve Jones Midland 263.0 270 248 271 95 8,019 398 5.0 305 3.8 JSpence Farms Roger & Janice Spence Elmvale 259.7 254 266 259 67 11,583 R 449 3.9 376 3.2 HSpence Farms Roy & Doug Spence Elmvale 256.3 251 263 255 38 11,488 445 3.9 370 3.2 HWalkhavern Farms Limited Collin & Tanya Walker Stayner 253.0 257 244 258 80 11,832 421 3.6 377 3.2 H,JJohn & Marie Miller ― Creemore 251.3 256 241 257 114 7,776 397 5.1 296 3.8 JSunny Maple Holsteins Doug Livingston Beeton 249.3 244 261 243 66 11,315 448 4.0 359 3.2 HWaynan Farms Wayne & Scott Somerville Stayner 249.3 248 260 240 60 11,089 432 3.9 344 3.1 HBrent McLean & Sons ― Minesing 244.3 237 254 242 34 10,113 402 4.0 330 3.3 HMaivan Nook Holsteins Andy Clark Oro-Medonte 244.0 241 242 249 46 11,025 408 3.7 360 3.3 HAptohaven Farm Peter Kapteyn Phelpston 239.7 238 244 237 66 10,481 400 3.8 334 3.2 HKellwood Holsteins Keith Kell & Barb Kell-Rose Gilford 239.7 235 243 241 32 10,647 412 3.9 348 3.3 H,JNellridge Jerseys Mark & Julie Parnell Wyebridge 238.7 245 222 249 37 7,167 353 4.9 277 3.9 JCadillac Holsteins Gary & Geoff Mclean Barrie 238.3 236 239 240 39 9,852 388 3.9 325 3.3 H,JHarvdale Holsteins Kevin Harvey Stayner 237.7 226 259 228 38 10,925 465 4.3 349 3.2 HLangnic Farms ― Elmvale 237.0 235 240 236 56 10,618 R 403 3.8 340 3.2 HHummelink Holsteins ― Tiny 236.3 233 241 235 42 10,652 408 3.8 341 3.2 HWilcrest Holsteins John & Susan Williams Bradford 235.0 234 233 238 39 10,690 399 3.7 348 3.3 H,JHaanview Holsteins John & Bonnie Den Haan Loretto 233.0 230 245 224 56 10,629 420 4.0 330 3.1 HBatesdale Daniel & David Bates Stayner 232.7 232 234 232 33 9,272 385 4.2 321 3.5 B,H,JTembro Farms Bryan & Michael Temolder Elmvale 232.3 222 243 232 53 9,993 405 4.1 332 3.3 HJanbrian Holsteins Brian & Janice Stephenson Alliston 232.0 230 235 231 51 10,826 413 3.8 346 3.2 H,JAutumn View Farm's John Holm Waubaushene 229.3 233 222 233 40 8,432 328 3.9 277 3.3 ADean Nelson ― Phelpston 229.3 231 232 225 34 10,329 383 3.7 319 3.1 HFarisview DJ Faris Newmarket 228.0 225 228 231 63 10,757 402 3.7 349 3.2 HTom & Karen Klein-Gebbinck ― Elmvale 227.3 227 228 227 23 10,250 R 383 3.7 327 3.2 HFishervale Acres Limited Robert, June & Scott Fisher Thornton 226.0 225 226 227 33 10,368 385 3.7 333 3.2 HFieldholme Holsteins Bryan Fieldhouse Bradford 225.7 225 228 224 29 10,357 391 3.8 328 3.2 H
*3× per day or greater milking (all or part)/traite 3× par jour R: Robotic/Robotique

68
PUBLISHABLE HERD LISTING / Liste de troupeaux publiables Herds equal to or greater than county or provincial average composite BCA / Troupeaux supérieurs à la moyenne de composite MCR du comté ou province
Farm
/Own
er
Ferm
e /Pr
oprié
taire
Owne
r/Pro
priét
aire
City
/Ville
BCA
Aver
age/
MCR
moy
enne
BCA
Milk
/MCR
lait
BCA
Fat/M
CR g
ras
BCA
Prot
ein/
MCR
prot
éine
Reco
rds/
Relev
és
305 M
ilk K
g/30
5 lait
Kg
305 F
at K
g/30
5 gra
s kg
Fat %
/Gra
s %
305 P
rote
in/3
05 p
roté
ine
Prot
ein
%/P
roté
ine %
Bree
d/Ra
ce
Stormont (Average 219.5)Murrayholm Farms Campbell Murray Martintown 262.3 255 268 264 71 11,653 R 455 3.9 384 3.3 HWenallt Holsteins ― Crysler 256.3 251 264 254 56 11,714 457 3.9 377 3.2 HFerme Sabourin Inc Gilles & Johanne Sabourin Crysler 248.0 242 254 248 67 10,759 419 3.9 351 3.3 HArc Acres Randy Moke Newington 245.3 242 252 242 39 11,215 433 3.9 356 3.2 HKemmatten Farm Josef Speck Moose Creek 238.0 230 245 239 85 9,844 389 4.0 327 3.3 HRoclane Holsteins Roger & Margaret Courville Crysler 237.0 234 243 234 38 10,518 405 3.9 334 3.2 HKnonaudale Farm Chris & Bobbi-Jo Uhr Crysler 236.7 226 246 238 86 9,936 402 4.0 333 3.4 H,ACritesdale Farms Calvin Crites Ingleside 235.7 235 242 230 89 10,539 401 3.8 328 3.1 HWielendale A & J Vanderwielen Maxville 235.7 230 246 231 49 10,103 400 4.0 324 3.2 HBonvale Farms Inc Peter Beaudette St Andrews West 234.7 232 240 232 59 10,695 410 3.8 340 3.2 HRedlodge Farm Inc Armin & Monica Kagi Finch 234.3 232 240 231 49 10,675 410 3.8 339 3.2 HSaziemaz Farm Philippe Gutknecht Newington 228.0 230 221 233 70 10,576 376 3.6 340 3.2 HGreenstor Farm Inc Luc & Nadine Quesnel Moose Creek 227.7 224 232 227 60 10,041 385 3.8 324 3.2 HMarchbank Doug Paul Crysler 226.3 230 213 236 63 8,145 310 3.8 275 3.4 ATrenant Acres Ltd Bernard & Cynthia Daoust Finch 226.0 232 215 231 48 8,156 311 3.8 267 3.3 APaynebranch Farms Ltd Henry Teplate Finch 224.3 215 248 210 28 9,309 399 4.3 290 3.1 HHartene Farm David Hart Newington 223.7 222 227 222 50 10,085 382 3.8 322 3.2 H
Thunder Bay (Average 212.9)Candyview Farm ― Slate River 258.3 262 260 253 56 11,675 * 431 3.7 361 3.1 HOlivercrest Holsteins Ed Breukelman Neebing 249.7 247 253 249 79 11,059 R 420 3.8 355 3.2 HChrishar Farms Arie Grootenboer Murillo 241.7 242 245 238 55 11,334 425 3.7 353 3.1 HJoalfarms Lorne & Cynthia Vis Murillo 236.7 232 246 232 51 10,828 426 3.9 343 3.2 HTrustmore Farm Henry & Deb Streutker Slate River 234.0 226 241 235 59 10,242 404 3.9 339 3.3 H,JMountain Valley Farms Jonathon Bakker Neebing 225.0 223 229 223 120 9,669 368 3.8 309 3.2 HCrossways Farms Richard Tempelman Rosslyn 216.0 212 223 213 85 9,667 R 378 3.9 309 3.2 HVeumount Farm Ltd John & Joel Veurink Slate River 216.0 216 220 212 78 9,706 367 3.8 304 3.1 HJaspers Dairy Farms Fritz Jaspers Slate River 215.7 210 220 217 65 9,916 385 3.9 326 3.3 H
Timiskaming (Average 209.9)Shadybrook Meadow Leon & Donna Kraemer Thornloe 243.7 234 252 245 34 11,195 446 4 371 3.3 HGravelsdale Renald & Simon Gravel Earlton 242.3 244 237 246 63 11,139 402 3.6 358 3.2 HDouble Ridge Farm Darren Jibb New Liskeard 236.0 227 250 231 82 10,201 418 4.1 332 3.3 HRailside Farm Joe & Nicole Holeksa Englehart 232.7 231 237 230 44 10,338 392 3.8 328 3.2 HMcLeans Dairy Marc McLean Kenabeek 229.3 226 237 225 66 10,599 411 3.9 335 3.2 HSha-Rob Jerseys R & S Flewwelling Earlton 226.3 238 210 231 36 7,232 345 4.8 266 3.7 JAlfadair Mario Gauthier Earlton 221.0 217 228 218 157 9,762 381 3.9 313 3.2 HFreedom Farms Inc Chris & Carole Loach New Liskeard 216.7 217 215 218 64 9,101 360 4.0 300 3.3 H,J,ACloutier Dale Farms Ltd A & C Bergeron Earlton 212.3 211 212 214 113 9,751 363 3.7 314 3.2 HClaybrook Farm Inc Steve Runnalls Thornloe 210.0 210 207 213 40 9,162 344 3.8 298 3.3 H,J
*3× per day or greater milking (all or part)/traite 3× par jour R: Robotic/Robotique

69
PUBLISHABLE HERD LISTING / Liste de troupeaux publiables Herds equal to or greater than county or provincial average composite BCA / Troupeaux supérieurs à la moyenne de composite MCR du comté ou province
Farm
/Own
er
Ferm
e /Pr
oprié
taire
Owne
r/Pro
priét
aire
City
/Ville
BCA
Aver
age/
MCR
moy
enne
BCA
Milk
/MCR
lait
BCA
Fat/M
CR g
ras
BCA
Prot
ein/
MCR
prot
éine
Reco
rds/
Relev
és
305 M
ilk K
g/30
5 lait
Kg
305 F
at K
g/30
5 gra
s kg
Fat %
/Gra
s %
305 P
rote
in/3
05 p
roté
ine
Prot
ein
%/P
roté
ine %
Bree
d/Ra
ce
Waterloo (Average 238.5)Margrove Dale Martin Elmira 298.0 294 305 295 68 13,556 521 3.8 432 3.2 HGreen Acre Farms Ltd T, G, D & A Wagler New Hamburg 289.7 286 302 281 149 12,462 488 3.9 390 3.1 HWeberlea Jesse & Ellen Weber St Clements 286.3 299 269 291 34 8,511 417 4.9 314 3.7 JMurray & Leona Brubacher ― Elmira 279.3 276 289 273 64 12,252 476 3.9 386 3.2 HMintvalley Farms Inc ― Breslau 279.0 275 291 271 106 12,450 487 3.9 390 3.1 HMilky Wave Schuurmans Family Elmira 278.0 276 288 270 212 11,777 * 455 3.9 368 3.1 HQuiet Oak Holsteins John & Angela Van Bergeijk New Hamburg 277.0 283 271 277 149 12,691 450 3.5 396 3.1 HClaynook Farms Ltd W, D & M Wagler New Hamburg 275.0 266 290 269 153 11,715 473 4.0 377 3.2 HLebold Farms Inc Terry & Susan Lebold Wellesley 274.3 260 292 271 87 11,701 488 4.2 388 3.3 HCherrydale Jerseys George Martin Waterloo 274.0 281 266 275 56 7,955 407 5.1 295 3.7 JAvelee Holsteins Maynard & Vera Shantz Waterloo 274.0 273 282 267 35 12,285 470 3.8 382 3.1 HCitilimits N, B & J Dietrich St Agatha 272.0 266 282 268 98 11,284 444 3.9 362 3.2 HOscar Gingrich ― Elmira 271.3 266 283 265 35 11,772 462 3.9 372 3.2 HCleon Gingrich ― Drayton 270.3 263 281 267 44 11,398 454 4.0 369 3.2 HNith Crest Farms Limited Larry Jantzi Wellesley 270.0 265 281 264 115 11,889 468 3.9 377 3.2 HMaplemar Edgar Martin St Clements 270.0 271 272 267 35 11,936 443 3.7 375 3.1 HRiver Dale Holsteins Lloyd Martin St Jacobs 270.0 266 279 265 35 12,344 480 3.9 389 3.2 HSandihills Holsteins Lloyd & Naomi Horst Elmira 268.0 257 285 262 54 11,353 467 4.1 369 3.3 HWebine Holsteins Lewis & Pauline Weber Elmira 266.7 265 275 260 47 12,175 470 3.9 379 3.1 HPoplarvale Daniel Gerber Millbank 266.7 261 274 265 34 11,880 463 3.9 384 3.2 HEldonna Farm Murray & Sandra Sherk Plattsville 265.7 267 279 251 105 11,829 * 459 3.9 354 3.0 HFloralake Holsteins Daniel & Edna Martin Elmira 264.0 265 273 254 34 12,126 462 3.8 370 3.1 HMarlawn Holsteins Howard & Lucille Martin St Jacobs 263.7 256 271 264 34 11,763 464 3.9 387 3.3 HMarcrest Holsteins Maynard & Lorna Martin St Clements 263.3 262 267 261 36 11,929 451 3.8 379 3.2 HBosdale Farm John & Ed Bos Galt-Cambridge 262.3 259 275 253 167 12,161 478 3.9 376 3.1 HHorstville Holsteins Maynard Horst Elmira 262.3 254 278 255 43 11,138 452 4.1 357 3.2 HDenholme Dennis Martin St Jacobs 261.3 259 266 259 46 11,444 437 3.8 365 3.2 HPleasant Nook Farms Rob & Julie Eby Ayr 260.7 256 263 263 41 8,658 433 5.0 318 3.7 J,HEventide Holsteins Leroy & Vera Metzger Elmira 260.3 264 267 250 26 11,282 422 3.7 340 3.0 HOntowa ― Elmira 260.0 256 272 252 94 11,289 444 3.9 353 3.1 HMurray & Charlene Brubacher ― Elmira 259.7 249 275 255 46 11,193 458 4.1 364 3.3 HPaul & Shirley Martin ― Elmira 258.7 255 271 250 58 11,221 445 4.0 351 3.1 HBraefoot Farm Grant Henderson Cambridge 258.3 265 255 255 40 7,797 R 404 5.2 284 3.6 JJaline Holsteins Vernon & Emaline Jantzi Linwood 258.3 255 266 254 29 11,268 434 3.9 356 3.2 HGrandisle Cleason & Martha Martin West Montrose 257.7 252 261 260 41 11,292 434 3.8 372 3.3 HEzra & Jackie Martin ― Waterloo 256.3 257 261 251 28 11,655 437 3.7 363 3.1 HJaylin Holme Jason Martin Elmira 255.7 249 274 244 35 11,942 R 486 4.1 371 3.1 HGoldenview Holsteins ― Elmira 254.7 250 261 253 72 11,395 442 3.9 368 3.2 HValleymar Melvin Martin Waterloo 254.7 248 261 255 32 10,984 428 3.9 359 3.3 HCleossy Cleason Wideman St Jacobs 253.7 250 255 256 34 11,280 427 3.8 368 3.3 HLaverne & Marlene Martin ― Waterloo 252.3 248 261 248 32 10,871 424 3.9 346 3.2 HLewis Weber ― Elmira 252.0 249 259 248 42 11,328 436 3.8 359 3.2 H
*3× per day or greater milking (all or part)/traite 3× par jour R: Robotic/Robotique

70
PUBLISHABLE HERD LISTING / Liste de troupeaux publiables Herds equal to or greater than county or provincial average composite BCA / Troupeaux supérieurs à la moyenne de composite MCR du comté ou province
Farm
/Own
er
Ferm
e /Pr
oprié
taire
Owne
r/Pro
priét
aire
City
/Ville
BCA
Aver
age/
MCR
moy
enne
BCA
Milk
/MCR
lait
BCA
Fat/M
CR g
ras
BCA
Prot
ein/
MCR
prot
éine
Reco
rds/
Relev
és
305 M
ilk K
g/30
5 lait
Kg
305 F
at K
g/30
5 gra
s kg
Fat %
/Gra
s %
305 P
rote
in/3
05 p
roté
ine
Prot
ein
%/P
roté
ine %
Bree
d/Ra
ce
Charwill Farms William Martin Wallenstein 251.7 248 259 248 44 11,314 438 3.9 360 3.2 HHidden Lane Dairy Inc Kyle & Jolene Horst Elmira 251.7 252 254 249 41 11,013 410 3.7 346 3.1 HRiver Mar Murray Martin St Jacobs 251.3 247 260 247 24 11,253 438 3.9 358 3.2 HMountainoak Farm Adam Van Bergeijk New Hamburg 250.7 249 255 248 181 11,373 431 3.8 359 3.2 HCrosswell Jerseys Tillman & Betsy Bauman Millbank 249.3 253 230 265 40 7,156 351 4.9 284 4.0 JWillowood Holsteins Melvin & Ellen Gingrich Elmira 249.3 248 248 252 37 10,845 402 3.7 352 3.2 HHawlin Philip & Mary Wideman Wallenstein 249.3 258 235 255 30 7,674 380 5.0 286 3.7 JRose Vega Luke Donkers Branchton 248.3 240 264 241 75 11,009 448 4.1 351 3.2 HWoolrich Holsteins Larry Gingrich Elmira 248.3 244 260 241 32 11,170 439 3.9 351 3.1 HWalnut Meadow Vernon & Loraine Martin Elmira 247.3 249 250 243 37 11,200 420 3.8 349 3.1 HSandhills Arnold Good Baden 247.3 248 247 247 34 11,110 409 3.7 351 3.2 HRicklee Richard & Arlene Martin St Jacobs 247.0 249 248 244 43 11,291 418 3.7 354 3.1 HRodney & Sarah Lebold ― Millbank 246.7 243 246 251 33 10,971 411 3.7 359 3.3 HCallumlea Farm Ken & Marie McNabb New Hamburg 246.3 246 251 242 59 11,133 R 425 3.8 350 3.1 H,GShady Poplar Holsteins Eli Martin Elmira 246.3 245 258 236 35 10,924 427 3.9 336 3.1 HBrenland Brad & Jenny Brenneman Millbank 246.0 251 244 243 46 11,619 * 419 3.6 358 3.1 HLen-Ed Holsteins Leonard Martin Linwood 245.7 235 259 243 40 10,540 429 4.1 346 3.3 HShantrose Steven & Wilma Shantz West Montrose 245.3 245 252 239 33 10,645 407 3.8 332 3.1 HMorningsky Holsteins Ltd Edwin & Folkertje Noom Millbank 245.0 239 252 244 93 10,807 424 3.9 352 3.3 HCookridge Robert Cook Wellesley 244.3 241 250 242 72 10,520 405 3.8 337 3.2 HRedmaple Andrew Zehr Millbank 244.0 240 255 237 54 10,773 422 3.9 337 3.1 HWoolview Lester & Shirley Gingrich Elmira 244.0 238 258 236 35 10,954 440 4.0 345 3.1 HElmer Martin ― Elmira 244.0 251 239 242 11 7,027 360 5.1 257 3.7 JBrodmaple Donald Brodhaecker Cambridge 243.3 241 253 236 50 10,788 415 3.8 335 3.1 HMatthew & Doree Martin ― Waterloo 243.3 250 237 243 25 11,355 402 3.5 351 3.1 HHanfre Holsteins Hans & Frederika Bokdam New Hamburg 242.3 239 244 244 89 10,894 411 3.8 353 3.2 HCanaan Slopes Dairy Inc Roland Good New Hamburg 242.3 235 249 243 67 10,338 408 3.9 341 3.3 HTopwood Holsteins Vernon & Pauline Jantzi Milverton 241.7 245 241 239 39 11,247 408 3.6 348 3.1 HBoghaven Jerseys David & Erma Horst Elmira 241.3 250 231 243 55 7,126 356 5.0 263 3.7 JFloraview Farms Inc Darcy & Lorna Weber Elmira 240.7 239 249 234 40 10,727 416 3.9 335 3.1 HEby Manor Farm Ltd Jim Eby Waterloo 240.3 243 246 232 61 7,914 401 5.1 269 3.4 GLaurelwood James & Eileen Martin Waterloo 240.3 238 242 241 33 10,689 407 3.8 346 3.2 HStewmar Holsteins Stewart Martin Wallenstein 240.0 234 244 242 28 10,693 413 3.9 351 3.3 HGerberland D, M, M & S Gerber Millbank 239.3 237 240 241 41 10,716 405 3.8 347 3.2 HDenlee Farms ― New Hamburg 239.0 230 258 229 54 10,484 434 4.1 331 3.2 HOrchard Grove Holsteins David Shantz St Clements 239.0 235 243 239 32 10,443 403 3.9 338 3.2 HCherry Hollow Daniel & Mary Martin Elmira 238.7 242 235 239 21 10,889 394 3.6 343 3.1 HTrailview Holsteins Merle Martin Wallenstein 238.3 233 246 236 34 10,505 413 3.9 339 3.2 HCleon & Laurene Martin ― Elmira 237.7 234 247 232 36 10,740 422 3.9 338 3.1 HPondhaven Holsteins Wilmer Weber Elmira 237.3 235 247 230 51 10,849 423 3.9 337 3.1 HHartlene Murray & Arlene Burkhart Wallenstein 237.3 244 235 233 42 11,034 396 3.6 336 3.0 HJohn Weber ― West Montrose 237.3 233 243 236 37 10,701 415 3.9 344 3.2 HErbholme Allan Erb Wellesley 236.7 231 250 229 31 10,474 R 420 4.0 330 3.2 HCleon Bauman ― Elmira 236.3 239 238 232 33 10,821 398 3.7 334 3.1 H
*3× per day or greater milking (all or part)/traite 3× par jour R: Robotic/Robotique

71
PUBLISHABLE HERD LISTING / Liste de troupeaux publiables Herds equal to or greater than county or provincial average composite BCA / Troupeaux supérieurs à la moyenne de composite MCR du comté ou province
Farm
/Own
er
Ferm
e /Pr
oprié
taire
Owne
r/Pro
priét
aire
City
/Ville
BCA
Aver
age/
MCR
moy
enne
BCA
Milk
/MCR
lait
BCA
Fat/M
CR g
ras
BCA
Prot
ein/
MCR
prot
éine
Reco
rds/
Relev
és
305 M
ilk K
g/30
5 lait
Kg
305 F
at K
g/30
5 gra
s kg
Fat %
/Gra
s %
305 P
rote
in/3
05 p
roté
ine
Prot
ein
%/P
roté
ine %
Bree
d/Ra
ce
Heritage Hill Farms Johnston & Dore New Dundee 236.0 236 239 233 82 10,381 389 3.7 325 3.1 HOrnan Martin ― Elmira 235.7 229 255 223 29 10,087 418 4.1 314 3.1 HErvin Weber ― St Clements 235.0 233 240 232 31 10,768 411 3.8 339 3.1 HWayne & Elmeda Martin ― Elmira 234.7 231 242 231 48 10,527 409 3.9 335 3.2 HDoug Horst ― Elmira 234.3 236 240 227 51 10,962 424 3.9 337 3.1 H,JPerrinridge Farms Ltd Ted Perrin Ayr 233.0 230 243 226 51 10,347 407 3.9 324 3.1 HGoldenrod Acres Elo Weber Linwood 232.7 237 228 233 21 8,930 369 4.1 298 3.3 H,JSimeon Sherk ― St Clements 232.0 241 215 240 35 7,313 353 4.8 276 3.8 JJ Holsteins & D Farms Inc Eric & Janelle Martin Listowel 231.7 232 234 229 88 10,610 396 3.7 333 3.1 HRipplechic Edward Martin Elmira 231.3 231 232 231 26 10,255 383 3.7 327 3.2 HHawdale Holsteins Martha Wideman Wallenstein 231.0 235 226 232 29 10,640 378 3.6 333 3.1 HWillow Springs Holsteins Timothy Martin Wallenstein 230.7 238 226 228 49 10,481 369 3.5 320 3.1 HPineside Holsteins Willard & Lorraine Martin Elmira 229.3 230 230 228 37 10,358 384 3.7 326 3.1 HGerber Acres Joe Gerber Millbank 229.0 238 219 230 40 11,045 378 3.4 340 3.1 HDonel Farms Ltd Jeff & Ken Hunsberger Baden 228.3 221 243 221 50 10,029 409 4.1 319 3.2 HJandale Holsteins Kenneth Jantzi Wellesley 228.3 224 235 226 34 10,177 397 3.9 327 3.2 H
Wellington (Average 234.3)Bellwin Bellwin Farms Inc Elora 307.7 302 315 306 59 13,305 515 3.9 429 3.2 HKrul Holsteins Ltd Jeff & John Krul Arthur 285.7 288 291 278 79 13,029 487 3.7 400 3.1 HMayhaven Paul & Tim May Rockwood 282.3 278 292 277 40 12,768 497 3.9 404 3.2 HMBT Farms Andrew Martin Alma 281.7 277 295 273 41 12,890 508 3.9 402 3.1 HShadyrail Holsteins Randy & Lynette Martin Harriston 274.3 271 284 268 53 12,123 472 3.9 382 3.2 HWindy Pine Holsteins Douglas & Car Weber Drayton 273.3 271 270 279 54 12,266 452 3.7 402 3.3 HJoyvin & Ralbea Kevin & Ralph Martin Drayton 271.3 269 273 272 51 11,886 448 3.8 383 3.2 HBranderlea Tyler Brander Rockwood 270.7 268 271 273 35 10,942 459 4.2 372 3.4 H,JRollingview Farms Nelson & Leon Weber Wallenstein 268.3 262 280 263 47 12,021 475 4.0 383 3.2 HFieldhouse Farms Rick Fieldhouse Ariss 265.3 258 275 263 66 11,738 463 3.9 380 3.2 HMarbruck Holsteins Gary & Carolyn Martin Drayton 265.0 262 267 266 52 11,796 444 3.8 380 3.2 HCnossen Holsteins ― Elora 264.7 262 272 260 106 11,603 446 3.8 367 3.2 HRosymill Holsteins Elo & Barbara Bowman Listowel 264.3 265 268 260 18 11,417 441 3.9 361 3.2 H,JEarlen Farms Limited Derrick & Dwayne Martin Alma 263.0 257 271 261 78 11,595 R 453 3.9 374 3.2 HMar-Crest Holsteins Gavin & Delphine Martin Alma 263.0 263 264 262 51 11,507 430 3.7 365 3.2 HRickhaven Holsteins Susan Martin Drayton 262.3 256 273 258 34 11,340 448 4.0 364 3.2 HSpruce Hedge Jerseys Colin & Laura Martin Elora 262.0 269 239 278 33 7,954 383 4.8 313 3.9 JB & J Kottelenberg ― Hillsburgh 262.0 261 270 255 30 11,804 452 3.8 365 3.1 HVernon & Edna Martin ― Mount Forest 261.7 255 264 266 32 11,158 426 3.8 368 3.3 HWeblea Duane & Rhonda Weber Alma 261.0 256 261 266 41 11,139 420 3.8 367 3.3 HAveline Holsteins Tony & Charlene Martin Drayton 260.3 253 274 254 67 11,747 472 4.0 374 3.2 HMilky Lane Eric & Romy Schuurmans Drayton 259.7 257 270 252 53 12,295 477 3.9 383 3.1 HBydand Scott Gordon Rockwood 259.7 257 267 255 35 10,226 424 4.1 331 3.2 H,A,GDannroving Holsteins Matt & Jill Dann Palmerston 259.3 256 272 250 66 11,672 461 3.9 363 3.1 H,JStirtoga Farm Ltd Tom & Jake Devries Drayton 259.0 250 270 257 105 11,252 452 4.0 368 3.3 HRon & Linda Weber ― Arthur 258.7 254 265 257 49 11,383 441 3.9 367 3.2 H
*3× per day or greater milking (all or part)/traite 3× par jour R: Robotic/Robotique
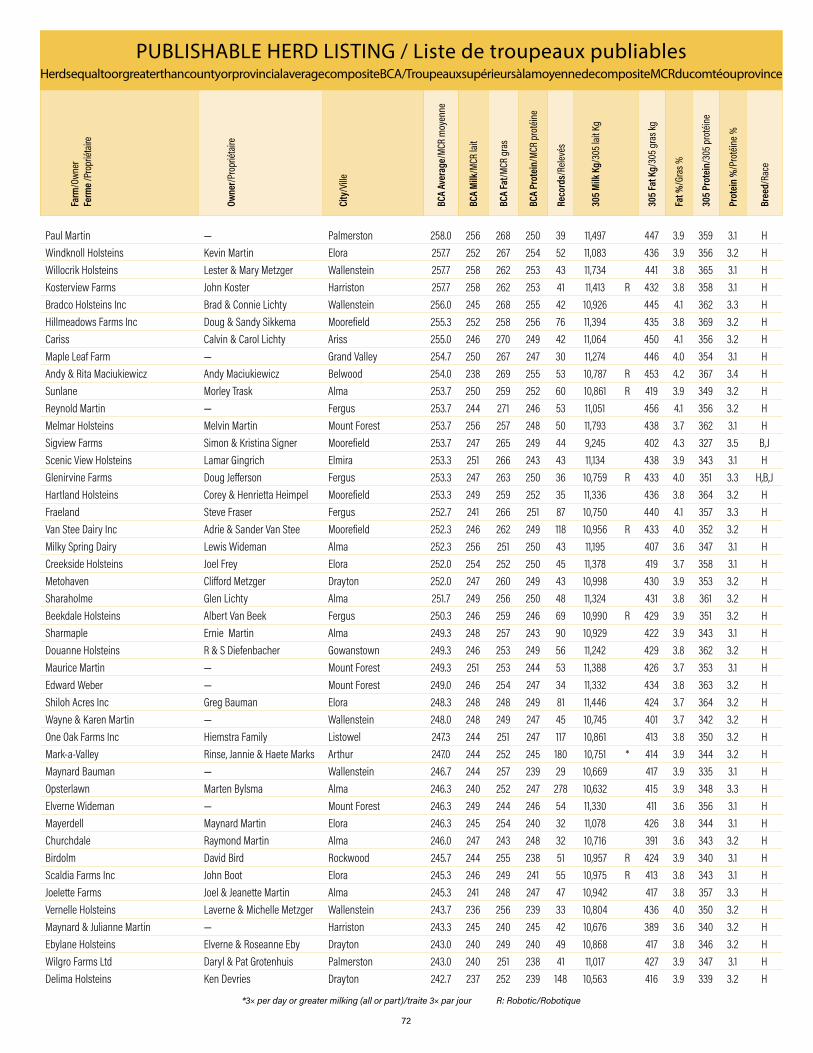
72
PUBLISHABLE HERD LISTING / Liste de troupeaux publiables Herds equal to or greater than county or provincial average composite BCA / Troupeaux supérieurs à la moyenne de composite MCR du comté ou province
Farm
/Own
er
Ferm
e /Pr
oprié
taire
Owne
r/Pro
priét
aire
City
/Ville
BCA
Aver
age/
MCR
moy
enne
BCA
Milk
/MCR
lait
BCA
Fat/M
CR g
ras
BCA
Prot
ein/
MCR
prot
éine
Reco
rds/
Relev
és
305 M
ilk K
g/30
5 lait
Kg
305 F
at K
g/30
5 gra
s kg
Fat %
/Gra
s %
305 P
rote
in/3
05 p
roté
ine
Prot
ein
%/P
roté
ine %
Bree
d/Ra
ce
Paul Martin ― Palmerston 258.0 256 268 250 39 11,497 447 3.9 359 3.1 HWindknoll Holsteins Kevin Martin Elora 257.7 252 267 254 52 11,083 436 3.9 356 3.2 HWillocrik Holsteins Lester & Mary Metzger Wallenstein 257.7 258 262 253 43 11,734 441 3.8 365 3.1 HKosterview Farms John Koster Harriston 257.7 258 262 253 41 11,413 R 432 3.8 358 3.1 HBradco Holsteins Inc Brad & Connie Lichty Wallenstein 256.0 245 268 255 42 10,926 445 4.1 362 3.3 HHillmeadows Farms Inc Doug & Sandy Sikkema Moorefield 255.3 252 258 256 76 11,394 435 3.8 369 3.2 HCariss Calvin & Carol Lichty Ariss 255.0 246 270 249 42 11,064 450 4.1 356 3.2 HMaple Leaf Farm ― Grand Valley 254.7 250 267 247 30 11,274 446 4.0 354 3.1 HAndy & Rita Maciukiewicz Andy Maciukiewicz Belwood 254.0 238 269 255 53 10,787 R 453 4.2 367 3.4 HSunlane Morley Trask Alma 253.7 250 259 252 60 10,861 R 419 3.9 349 3.2 HReynold Martin ― Fergus 253.7 244 271 246 53 11,051 456 4.1 356 3.2 HMelmar Holsteins Melvin Martin Mount Forest 253.7 256 257 248 50 11,793 438 3.7 362 3.1 HSigview Farms Simon & Kristina Signer Moorefield 253.7 247 265 249 44 9,245 402 4.3 327 3.5 B,JScenic View Holsteins Lamar Gingrich Elmira 253.3 251 266 243 43 11,134 438 3.9 343 3.1 HGlenirvine Farms Doug Jefferson Fergus 253.3 247 263 250 36 10,759 R 433 4.0 351 3.3 H,B,JHartland Holsteins Corey & Henrietta Heimpel Moorefield 253.3 249 259 252 35 11,336 436 3.8 364 3.2 HFraeland Steve Fraser Fergus 252.7 241 266 251 87 10,750 440 4.1 357 3.3 HVan Stee Dairy Inc Adrie & Sander Van Stee Moorefield 252.3 246 262 249 118 10,956 R 433 4.0 352 3.2 HMilky Spring Dairy Lewis Wideman Alma 252.3 256 251 250 43 11,195 407 3.6 347 3.1 HCreekside Holsteins Joel Frey Elora 252.0 254 252 250 45 11,378 419 3.7 358 3.1 HMetohaven Clifford Metzger Drayton 252.0 247 260 249 43 10,998 430 3.9 353 3.2 HSharaholme Glen Lichty Alma 251.7 249 256 250 48 11,324 431 3.8 361 3.2 HBeekdale Holsteins Albert Van Beek Fergus 250.3 246 259 246 69 10,990 R 429 3.9 351 3.2 HSharmaple Ernie Martin Alma 249.3 248 257 243 90 10,929 422 3.9 343 3.1 HDouanne Holsteins R & S Diefenbacher Gowanstown 249.3 246 253 249 56 11,242 429 3.8 362 3.2 HMaurice Martin ― Mount Forest 249.3 251 253 244 53 11,388 426 3.7 353 3.1 HEdward Weber ― Mount Forest 249.0 246 254 247 34 11,332 434 3.8 363 3.2 HShiloh Acres Inc Greg Bauman Elora 248.3 248 248 249 81 11,446 424 3.7 364 3.2 HWayne & Karen Martin ― Wallenstein 248.0 248 249 247 45 10,745 401 3.7 342 3.2 HOne Oak Farms Inc Hiemstra Family Listowel 247.3 244 251 247 117 10,861 413 3.8 350 3.2 HMark-a-Valley Rinse, Jannie & Haete Marks Arthur 247.0 244 252 245 180 10,751 * 414 3.9 344 3.2 HMaynard Bauman ― Wallenstein 246.7 244 257 239 29 10,669 417 3.9 335 3.1 HOpsterlawn Marten Bylsma Alma 246.3 240 252 247 278 10,632 415 3.9 348 3.3 HElverne Wideman ― Mount Forest 246.3 249 244 246 54 11,330 411 3.6 356 3.1 HMayerdell Maynard Martin Elora 246.3 245 254 240 32 11,078 426 3.8 344 3.1 HChurchdale Raymond Martin Alma 246.0 247 243 248 32 10,716 391 3.6 343 3.2 HBirdolm David Bird Rockwood 245.7 244 255 238 51 10,957 R 424 3.9 340 3.1 HScaldia Farms Inc John Boot Elora 245.3 246 249 241 55 10,975 R 413 3.8 343 3.1 HJoelette Farms Joel & Jeanette Martin Alma 245.3 241 248 247 47 10,942 417 3.8 357 3.3 HVernelle Holsteins Laverne & Michelle Metzger Wallenstein 243.7 236 256 239 33 10,804 436 4.0 350 3.2 HMaynard & Julianne Martin ― Harriston 243.3 245 240 245 42 10,676 389 3.6 340 3.2 HEbylane Holsteins Elverne & Roseanne Eby Drayton 243.0 240 249 240 49 10,868 417 3.8 346 3.2 HWilgro Farms Ltd Daryl & Pat Grotenhuis Palmerston 243.0 240 251 238 41 11,017 427 3.9 347 3.1 HDelima Holsteins Ken Devries Drayton 242.7 237 252 239 148 10,563 416 3.9 339 3.2 H
*3× per day or greater milking (all or part)/traite 3× par jour R: Robotic/Robotique

73
PUBLISHABLE HERD LISTING / Liste de troupeaux publiables Herds equal to or greater than county or provincial average composite BCA / Troupeaux supérieurs à la moyenne de composite MCR du comté ou province
Farm
/Own
er
Ferm
e /Pr
oprié
taire
Owne
r/Pro
priét
aire
City
/Ville
BCA
Aver
age/
MCR
moy
enne
BCA
Milk
/MCR
lait
BCA
Fat/M
CR g
ras
BCA
Prot
ein/
MCR
prot
éine
Reco
rds/
Relev
és
305 M
ilk K
g/30
5 lait
Kg
305 F
at K
g/30
5 gra
s kg
Fat %
/Gra
s %
305 P
rote
in/3
05 p
roté
ine
Prot
ein
%/P
roté
ine %
Bree
d/Ra
ce
Merlane Farms Brent & Philip Bauman Drayton 242.3 248 241 238 46 10,980 395 3.6 336 3.1 HEdgar Martin ― Mount Forest 242.3 243 241 243 29 11,331 416 3.7 361 3.2 HRoyhaven Holsteins Leroy Martin Elora 241.7 238 246 241 35 10,751 412 3.8 347 3.2 HShady Mar Holsteins Fred & Murrel Martin Drayton 241.0 237 244 242 62 10,653 407 3.8 347 3.3 HStarglow Holsteins Brad & Edith Martin Alma 241.0 237 247 239 42 10,854 419 3.9 348 3.2 HNeil Bauman ― Kenilworth 241.0 238 242 243 41 10,758 408 3.8 350 3.3 HSpringflo Holsteins Inc Sherman & Shellie Martin Fergus 240.7 243 245 234 52 10,719 R 402 3.8 330 3.1 HMarlin Weber ― Arthur 240.3 236 244 241 37 10,669 407 3.8 346 3.2 HGorweir Holsteins Chris & Jessie Weir Guelph 240.0 233 246 241 50 10,637 R 417 3.9 351 3.3 HMerlin Metzger ― Mount Forest 239.3 239 240 239 50 10,731 400 3.7 341 3.2 HSprucehollow Acres Murrel Martin Alma 239.0 240 254 223 36 10,574 416 3.9 314 3.0 HAbner Martin ― Wallenstein 239.0 237 243 237 33 10,437 397 3.8 334 3.2 HGingdale Holsteins Elmer & Florence Gingrich Alma 238.7 243 245 228 53 11,080 415 3.7 331 3.0 HElmar Holsteins Marvin & Elsie Eby Drayton 238.3 236 246 233 44 10,399 402 3.9 327 3.1 HAndrose Holsteins Andrew & Rosanne Eby Drayton 238.3 239 234 242 40 10,227 373 3.6 331 3.2 HJamie & Denise Martin ― Elora 238.3 238 239 238 37 10,839 401 3.7 344 3.2 HU of G Dairy Research & Innovation ― Ariss 237.7 234 244 235 194 10,149 392 3.9 325 3.2 HPaulroe Paul & Rose Martin Arthur 237.7 237 236 240 35 10,959 405 3.7 353 3.2 HHarbodale Farm Jake Bouwman Fergus 237.3 234 233 245 44 10,322 R 382 3.7 343 3.3 HLaros Farms Kees & Gerard Laros Arthur 236.0 236 228 244 49 10,323 372 3.6 340 3.3 HHiddencrest Lloyd Martin Kenilworth 236.0 235 238 235 36 10,770 404 3.8 343 3.2 HShadycorner Farms ― Drayton 235.3 239 232 235 76 10,359 374 3.6 325 3.1 HMarvin Bauman ― Mount Forest 235.3 234 242 230 36 10,401 398 3.8 325 3.1 HHavenvalley Farms Inc James & Erla Brubacher Wallenstein 235.0 226 245 234 58 10,456 420 4.0 343 3.3 HJeff Koster ― Moorefield 235.0 231 241 233 44 10,194 R 392 3.8 327 3.2 HNew Obelink Farms Ltd Rosegaar Brothers Arthur 234.7 233 242 229 378 10,063 * 388 3.9 315 3.1 HRoger Martin ― Kenilworth 234.7 232 240 232 59 10,339 396 3.8 328 3.2 HWindymar Holsteins Glen Martin Drayton 234.7 234 235 235 35 10,173 379 3.7 326 3.2 HSprucecho Farms Inc Gary & Debbie Oxby Moorefield 234.7 225 246 233 32 10,551 425 4.0 347 3.3 HOrvancy Holsteins Orvie & Nancy Brubacher Alma 234.3 236 236 231 56 10,611 392 3.7 331 3.1 HJohn & Carol Gingrich ― Moorefield 234.3 230 241 232 48 10,664 416 3.9 342 3.2 HCedar Park Holsteins Dennis & Brenda Lichty Alma 234.3 231 239 233 37 10,406 399 3.8 334 3.2 HMapleton Brian Gingrich Drayton 234.0 228 243 231 38 10,675 420 3.9 343 3.2 HHarrcroft Acres Ltd ― Fergus 233.0 230 238 231 96 10,043 385 3.8 321 3.2 HBrenford Farms Shawn & Lynn Martin Drayton 233.0 231 236 232 49 10,468 396 3.8 335 3.2 HAllan & Elsie Gingrich ― Mount Forest 233.0 233 240 226 47 10,736 408 3.8 331 3.1 HKarlinrock Marlin Martin Palmerston 232.3 229 243 225 113 10,547 415 3.9 330 3.1 HRosalea Jerseys Bruce & John Nixon Rockwood 232.3 231 229 237 95 7,344 393 5.4 285 3.9 JStrathallan Harvey Allan Rockwood 232.3 239 213 245 22 8,147 338 4.1 293 3.6 J,HClay Haven Holsteins Melvin Martin Wallenstein 232.0 229 234 233 59 10,547 399 3.8 341 3.2 HRobin Nest Acres Inc Elroy & Carol Horst Wallenstein 232.0 231 234 231 56 10,265 393 3.8 333 3.2 H,BModview Farm Donald Moddison Orton 232.0 229 238 229 52 10,074 R 389 3.9 322 3.2 HLloyd & Terry Diefenbacher ― Moorefield 232.0 229 243 224 39 9,961 394 4.0 310 3.1 H,JWillowlawn Farm Angus Martin Wallenstein 231.7 231 234 230 38 10,227 384 3.8 325 3.2 H
*3× per day or greater milking (all or part)/traite 3× par jour R: Robotic/Robotique

74
PUBLISHABLE HERD LISTING / Liste de troupeaux publiables Herds equal to or greater than county or provincial average composite BCA / Troupeaux supérieurs à la moyenne de composite MCR du comté ou province
Farm
/Own
er
Ferm
e /Pr
oprié
taire
Owne
r/Pro
priét
aire
City
/Ville
BCA
Aver
age/
MCR
moy
enne
BCA
Milk
/MCR
lait
BCA
Fat/M
CR g
ras
BCA
Prot
ein/
MCR
prot
éine
Reco
rds/
Relev
és
305 M
ilk K
g/30
5 lait
Kg
305 F
at K
g/30
5 gra
s kg
Fat %
/Gra
s %
305 P
rote
in/3
05 p
roté
ine
Prot
ein
%/P
roté
ine %
Bree
d/Ra
ce
Silverdream Holsteins Onias & Karen Martin Wallenstein 231.7 228 239 228 35 10,124 394 3.9 323 3.2 HWedgeview Laverne Gingrich Drayton 231.3 230 235 229 42 10,081 382 3.8 320 3.2 HSam Martin ― Alma 231.3 233 232 229 40 10,697 396 3.7 336 3.1 HAbner Martin ― Wallenstein 231.3 229 235 230 37 10,058 382 3.8 322 3.2 HKurt & Brianna Dykstra ― Clifford 230.3 229 240 222 53 10,248 398 3.9 317 3.1 HTunecroft Jim & Teresa Teune Clifford 230.3 215 249 227 46 9,705 417 4.3 327 3.4 HDarcy Gingrich ― Arthur 230.3 233 228 230 40 10,406 376 3.6 327 3.1 HBarcliff Farm Ltd Phil Vandenberg Moorefield 230.0 230 230 230 80 10,327 384 3.7 329 3.2 HMartindel Dennis Martin Palmerston 229.7 228 228 233 252 9,967 370 3.7 324 3.3 HWrighthaven Farms Ltd Lloyd Wright Kenilworth 229.7 227 229 233 57 9,959 373 3.7 326 3.3 HMilky Hills Farm Inc Henry Vervoort Elora 228.7 230 231 225 41 8,700 373 4.3 289 3.3 H,J,BAcherholme Holsteins Eli & Verna Brubacher Wallenstein 228.3 221 237 227 54 10,031 401 4.0 328 3.3 H,JKentonvale T, J, R & S Kent Elora 228.3 229 221 235 53 6,666 349 5.2 260 3.9 JGlenvue Farm Jim Dunton Rockwood 228.3 228 229 228 41 10,912 405 3.7 345 3.2 H
Wentworth (Average 219.2)Summitholm Holsteins Joe Loewith & Sons Lynden 299.3 297 308 293 398 13,630 * 525 3.9 427 3.1 HMapelwood Holsteins Len Vis Jerseyville 244.3 237 252 244 71 10,734 423 3.9 350 3.3 HDon-Mair Holsteins Dale & Marie Smith Mount Hope 243.3 242 242 246 70 11,140 412 3.7 359 3.2 HMagnetic Farms John & Rick Van Den Berg Dundas 240.7 230 254 238 87 10,309 423 4.1 341 3.3 HProvidence Holsteins Ltd Phil Elgersma Branchton 232.0 224 243 229 54 10,160 411 4.0 330 3.2 H,ACarpediem Holsteins Robert Alblas Branchton 222.3 227 221 219 54 10,062 363 3.6 309 3.1 H,J
York (Average 218.1)Lockmar Holsteins James Lockie Sutton West 273.7 259 295 267 87 11,971 505 4.2 392 3.3 HRexlea Jerseys Inc John Sheardown Schomberg 266.3 274 243 282 50 8,248 396 4.8 321 3.9 JQuality Holsteins Paul Ekstein Woodbridge 249.7 249 252 248 70 11,677 437 3.7 367 3.1 HEverdale Farm John Phillips Schomberg 236.0 227 242 239 52 10,674 422 4.0 357 3.3 HDandyland Holsteins ― Schomberg 233.7 230 235 236 84 10,426 395 3.8 340 3.3 HBeckridge Holsteins Glen Beckett Keswick 233.3 223 254 223 46 10,457 440 4.2 330 3.2 HHulsdale Paul & Brad Hulshof Stouffville 221.7 217 225 223 53 9,931 380 3.8 323 3.3 H
*3× per day or greater milking (all or part)/traite 3× par jour R: Robotic/Robotique
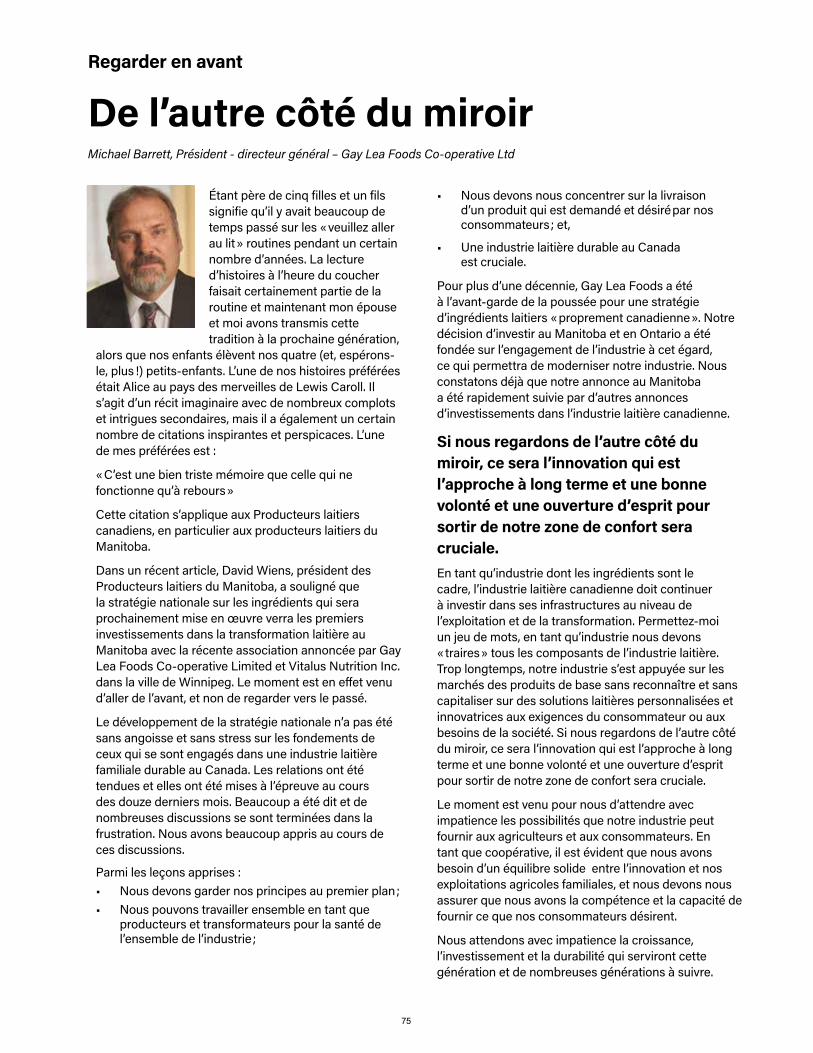
75
Étant père de cinq filles et un fils signifie qu’il y avait beaucoup de temps passé sur les « veuillez aller au lit » routines pendant un certain nombre d’années. La lecture d’histoires à l’heure du coucher faisait certainement partie de la routine et maintenant mon épouse et moi avons transmis cette tradition à la prochaine génération,
alors que nos enfants élèvent nos quatre (et, espérons-le, plus !) petits-enfants. L’une de nos histoires préférées était Alice au pays des merveilles de Lewis Caroll. Il s’agit d’un récit imaginaire avec de nombreux complots et intrigues secondaires, mais il a également un certain nombre de citations inspirantes et perspicaces. L’une de mes préférées est :
« C’est une bien triste mémoire que celle qui ne fonctionne qu’à rebours »
Cette citation s’applique aux Producteurs laitiers canadiens, en particulier aux producteurs laitiers du Manitoba.
Dans un récent article, David Wiens, président des Producteurs laitiers du Manitoba, a souligné que la stratégie nationale sur les ingrédients qui sera prochainement mise en œuvre verra les premiers investissements dans la transformation laitière au Manitoba avec la récente association annoncée par Gay Lea Foods Co-operative Limited et Vitalus Nutrition Inc. dans la ville de Winnipeg. Le moment est en effet venu d’aller de l’avant, et non de regarder vers le passé.
Le développement de la stratégie nationale n’a pas été sans angoisse et sans stress sur les fondements de ceux qui se sont engagés dans une industrie laitière familiale durable au Canada. Les relations ont été tendues et elles ont été mises à l’épreuve au cours des douze derniers mois. Beaucoup a été dit et de nombreuses discussions se sont terminées dans la frustration. Nous avons beaucoup appris au cours de ces discussions.
Parmi les leçons apprises :• Nous devons garder nos principes au premier plan ;• Nous pouvons travailler ensemble en tant que
producteurs et transformateurs pour la santé de l’ensemble de l’industrie ;
Regarder en avant
De l’autre côté du miroirMichael Barrett, Président - directeur général – Gay Lea Foods Co-operative Ltd
• Nous devons nous concentrer sur la livraison d’un produit qui est demandé et désiré par nos consommateurs ; et,
• Une industrie laitière durable au Canada est cruciale.
Pour plus d’une décennie, Gay Lea Foods a été à l’avant-garde de la poussée pour une stratégie d’ingrédients laitiers « proprement canadienne ». Notre décision d’investir au Manitoba et en Ontario a été fondée sur l’engagement de l’industrie à cet égard, ce qui permettra de moderniser notre industrie. Nous constatons déjà que notre annonce au Manitoba a été rapidement suivie par d’autres annonces d’investissements dans l’industrie laitière canadienne.
Si nous regardons de l’autre côté du miroir, ce sera l’innovation qui est l’approche à long terme et une bonne volonté et une ouverture d’esprit pour sortir de notre zone de confort sera cruciale. En tant qu’industrie dont les ingrédients sont le cadre, l’industrie laitière canadienne doit continuer à investir dans ses infrastructures au niveau de l’exploitation et de la transformation. Permettez-moi un jeu de mots, en tant qu’industrie nous devons « traires » tous les composants de l’industrie laitière. Trop longtemps, notre industrie s’est appuyée sur les marchés des produits de base sans reconnaître et sans capitaliser sur des solutions laitières personnalisées et innovatrices aux exigences du consommateur ou aux besoins de la société. Si nous regardons de l’autre côté du miroir, ce sera l’innovation qui est l’approche à long terme et une bonne volonté et une ouverture d’esprit pour sortir de notre zone de confort sera cruciale.
Le moment est venu pour nous d’attendre avec impatience les possibilités que notre industrie peut fournir aux agriculteurs et aux consommateurs. En tant que coopérative, il est évident que nous avons besoin d’un équilibre solide entre l’innovation et nos exploitations agricoles familiales, et nous devons nous assurer que nous avons la compétence et la capacité de fournir ce que nos consommateurs désirent.
Nous attendons avec impatience la croissance, l’investissement et la durabilité qui serviront cette génération et de nombreuses générations à suivre.

PROFITABLE DAIRY HERD MANAGEMENT1 800 549 4373 canwestdhi.com
COWSHEIFERS
More Options More Information More Flexibility
Easy Data Entry RFID Tag Scanning Option
MILK kg
34.7> STD MILK kg
38.2>
DIM
169 days
>MILK VALUE
$7,856>
FAT / PROT %
4.05 3.28
>FAT / PROT kg
1.411.14
305 MILK kg
11108SCC
207
>
> >11 cows
12% >200k
SCC - STAGE
305>
Early
SCC - PARITY
241>
Lact 1
02 SEP2016
06 OCT2016
04 NOV2016
03 DEC2016
06 JAN2017
81% 8:32 PM
DHI Herd
Mobile DHIDairyComp
PocketCowCard
NEWUPDATES!
Access your data from the
DHI Cloud
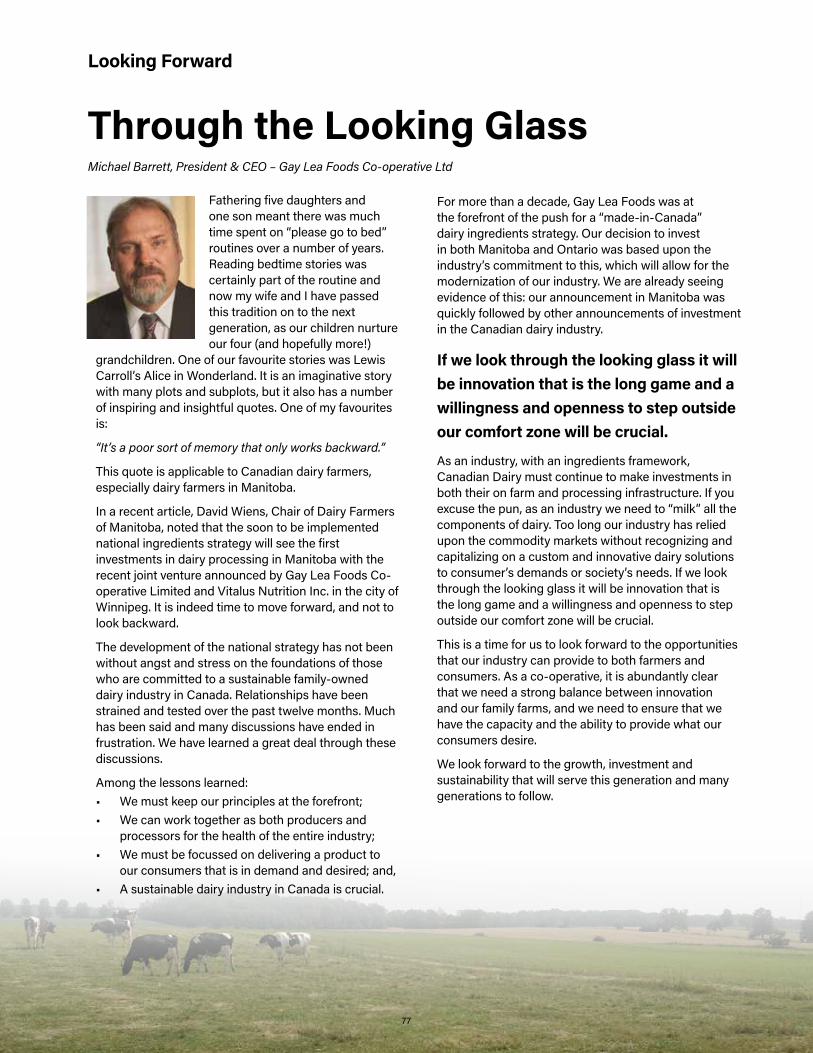
Fathering five daughters and one son meant there was much time spent on “please go to bed” routines over a number of years. Reading bedtime stories was certainly part of the routine and now my wife and I have passed this tradition on to the next generation, as our children nurture our four (and hopefully more!)
grandchildren. One of our favourite stories was Lewis Carroll’s Alice in Wonderland. It is an imaginative story with many plots and subplots, but it also has a number of inspiring and insightful quotes. One of my favourites is:
“It’s a poor sort of memory that only works backward.”
This quote is applicable to Canadian dairy farmers, especially dairy farmers in Manitoba.
In a recent article, David Wiens, Chair of Dairy Farmers of Manitoba, noted that the soon to be implemented national ingredients strategy will see the first investments in dairy processing in Manitoba with the recent joint venture announced by Gay Lea Foods Co-operative Limited and Vitalus Nutrition Inc. in the city of Winnipeg. It is indeed time to move forward, and not to look backward.
The development of the national strategy has not been without angst and stress on the foundations of those who are committed to a sustainable family-owned dairy industry in Canada. Relationships have been strained and tested over the past twelve months. Much has been said and many discussions have ended in frustration. We have learned a great deal through these discussions.
Among the lessons learned: • We must keep our principles at the forefront;• We can work together as both producers and
processors for the health of the entire industry;• We must be focussed on delivering a product to
our consumers that is in demand and desired; and,• A sustainable dairy industry in Canada is crucial.
Looking Forward
Through the Looking GlassMichael Barrett, President & CEO – Gay Lea Foods Co-operative Ltd
For more than a decade, Gay Lea Foods was at the forefront of the push for a “made-in-Canada” dairy ingredients strategy. Our decision to invest in both Manitoba and Ontario was based upon the industry’s commitment to this, which will allow for the modernization of our industry. We are already seeing evidence of this: our announcement in Manitoba was quickly followed by other announcements of investment in the Canadian dairy industry.
If we look through the looking glass it will be innovation that is the long game and a willingness and openness to step outside our comfort zone will be crucial.
As an industry, with an ingredients framework, Canadian Dairy must continue to make investments in both their on farm and processing infrastructure. If you excuse the pun, as an industry we need to “milk” all the components of dairy. Too long our industry has relied upon the commodity markets without recognizing and capitalizing on a custom and innovative dairy solutions to consumer’s demands or society’s needs. If we look through the looking glass it will be innovation that is the long game and a willingness and openness to step outside our comfort zone will be crucial.
This is a time for us to look forward to the opportunities that our industry can provide to both farmers and consumers. As a co-operative, it is abundantly clear that we need a strong balance between innovation and our family farms, and we need to ensure that we have the capacity and the ability to provide what our consumers desire.
We look forward to the growth, investment and sustainability that will serve this generation and many generations to follow.
77