ONLINE SUPPLEMENT DOES BLOOD PRESSURE INEVITABLY RISE WITH AGE? LONGITUDINAL EVIDENCE AMONG...
20
ONLINE SUPPLEMENT DOES BLOOD PRESSURE INEVITABLY RISE WITH AGE? LONGITUDINAL EVIDENCE AMONG FORAGER-HORTICULTURALISTS Michael Gurven*, Professor Integrative Anthropological Sciences Program University of California-Santa Barbara Santa Barbara, CA 93106 Telephone: 805-893-2202; Fax: 805-893-8707 [email protected] Aaron D. Blackwell Integrative Anthropological Sciences Program University of California-Santa Barbara Santa Barbara, CA 93106 [email protected] Daniel Eid Rodriguez Universidad Mayor de San Simón Departamento de Medicina Cochabamba, Bolivia [email protected] Jonathan Stieglitz Department of Anthropology University of New Mexico Albuquerque, NM 87131 [email protected] Hillard Kaplan Department of Anthropology University of New Mexico Albuquerque, NM 87131 [email protected] Short title: Blood pressure change with age and modernization *To whom all correspondence should be sent
-
Upload
independent -
Category
Documents
-
view
3 -
download
0
Transcript of ONLINE SUPPLEMENT DOES BLOOD PRESSURE INEVITABLY RISE WITH AGE? LONGITUDINAL EVIDENCE AMONG...
ONLINE SUPPLEMENT
DOES BLOOD PRESSURE INEVITABLY RISE WITH AGE? LONGITUDINAL EVIDENCE AMONG FORAGER-HORTICULTURALISTS
Michael Gurven*, Professor
Integrative Anthropological Sciences Program University of California-Santa Barbara
Santa Barbara, CA 93106 Telephone: 805-893-2202; Fax: 805-893-8707
Aaron D. Blackwell Integrative Anthropological Sciences Program
University of California-Santa Barbara Santa Barbara, CA 93106
Daniel Eid Rodriguez Universidad Mayor de San Simón
Departamento de Medicina Cochabamba, Bolivia [email protected]
Jonathan Stieglitz
Department of Anthropology University of New Mexico Albuquerque, NM 87131
Hillard Kaplan Department of Anthropology University of New Mexico Albuquerque, NM 87131
Short title: Blood pressure change with age and modernization
*To whom all correspondence should be sent

METHODS Village sample. Villages can be grouped based on decreasing access to market: Near Town (n=752 adults, 17 villages, average 18 km from San Borja), Lower Maniqui River (n=330, 6 villages, 23 km), Central River (n=261, 16 villages, 40 km), road to Rurrenabaque (n=70, 8 villages, 48 km), Forest (n=318, 11 villages, 56 km), Upper Maniqui River (n=276, 9 villages, 64 km), Mission (n=203, 1 village, 66 km), and Quiquibey River (n=59, 8 villages, 74 km). The following villages were added in 2010 and only sampled once: all villages along the road to Rurrenbaque, all villages along the Quiquibey River, 12 of the Near Town villages, one Forest village, 15 Near River villages, and one Lower Maniqui River village. Medical rounds. Data were collected during annual medical exams of the Tsimane Health and Life History Project. From 2002 to 2004, a mobile medical team made annual visits to 18 villages, obtaining blood pressure measurements during routine medical exams. Efforts were made to sample all present individuals. An additional 7 villages were sampled from 2005 to 2009. From 2010 to 2011, medical exams on all adults age 40+ were conducted in a clinic in San Borja. An additional 45 villages were added to the sample in 2010. Adults from these 45 villages were only sampled once. Clinical exams are given by Bolivian physicians with the assistance of bilingual Spanish-Tsimane translators. Additional details are given here1. Age estimation. Ages were assessed by cross-checked demographic interviews, as has been described elsewhere2. These include using known ages from written records, relative age lists, dated events, photo comparisons of people with known ages and cross-checking of information from independent interviews of kin. In constructing relative age lists, multiple informants were used for each five year age grouping of individuals, and inconsistencies were investigated and resolved. The photo comparison method used a sample of 70 photos of individuals with known ages. For older individuals, 50 photos of men and women from ages 50-75 were used. Each of these methods provides a roughly independent age estimate. When all estimates yield a date of birth within a 3-year range, the average was used unless one or two estimates were judged to be superior. DATA ANALYSIS Estimation of individual rates of blood pressure change. To estimate individual longitudinal rates of change, BP values and time points were first centered on the mean blood pressure value and median time-point for a given individual, such that blood pressures were recoded as positive or negative changes from the subject’s mean, and times were recorded as days before or after the subject’s median reading date. Linear models were fit to blood pressure change including subject PID, a subject-by-time interaction, season of exam, and pregnancy status as control variables. Fitting all slopes in one model, instead of separate models for each subject, facilitated estimation of population values for control variables. Parameter values for rates of blood pressure changes were then obtained from the subject-by-time interaction parameters. Slopes based on only two data points had large variances and showed evidence of regression to the mean. In order to analyze these slopes we therefore had to determine how many data points were required for an accurate slope estimate. To examine the effect of number of measures on slope estimates we performed a simple simulation. Beginning with individuals with six or more observations we randomly sampled different numbers of consecutive observations from each individual. We then examined the standard deviation of the slopes obtained. The results show that the standard
deviation around the mean slope declines with increasing number of observations (Figure S7). For our data, however, requiring six or more observations would drastically decrease sample size. We therefore estimated the standard error of the mean that would be obtained from our sample, given different inclusion criteria to identify the “optimal” trade-off between accuracy and sample size. We found that the standard error was minimized by including only individuals with five or more observations. For longitudinal analyses we therefore use this inclusion criterion.
REFERENCES
1 Gurven, M., Kaplan, H., Winking, J., Rodriguez, D., Vasunilashorn, F., Kim, J., Finch, C., and Crimmins, E. Inflammation and infection do not promote arterial aging and cardiovascular disease among lean Tsimane forager-horticulturalists. PLoS One. 2009; 4:e6590.
2 Gurven, M., Kaplan, H. & Zelada Supa, A. Mortality experience of Tsimane Amerindians: regional variation and temporal trends. American Journal of Human Biology. 2007; 19:376-398.

Table S1. Number of repeat samples and hypertension diagnoses across repeat sampling
# of Times Sampled
Age Group 1 2 3 4 5 6 7 8 9 Total 20-29 193 164 122 105 54 33 11 7 0 68930-39 61 51 67 96 52 36 28 5 3 39940-49 236 24 43 47 74 32 22 11 2 49150-59 120 16 18 28 28 17 16 5 0 24860-69 108 12 24 11 22 9 8 2 0 19670+ 153 12 10 21 20 3 3 3 0 225Total 871 279 284 308 250 130 88 33 5 2248Total Obs. 871 558 852 1232 1250 780 616 264 45 6468 Never Hyper 92.2% 93.5% 88.4% 91.9% 86.4% 80.0% 84.1% 72.7% 40.0% 89.8%Hyper Only Once 7.8% 6.5% 7.7% 6.2% 10.0% 16.9% 9.1% 18.2% 40.0% 8.5%Hyper More Than - 0.0% 3.9% 1.9% 3.6% 3.1% 6.8% 9.1% 20.0% 2.9%Hyper Always 7.8% 0.0% 0.4% 0.0% 0.0% 0.0% 0.0% 0.0% 0.0% 3.1%

Table S2. Sample size for all variables by medical round
Medical round and date (month/year)
Variable
(1) 8/03-12/03
(2) 1/04-6/04
(3) 7/04-12/04
(4) 1/05-8/05
(5) 10/05-7/06
(6) 8/06-8/07
(7) 9/07-8/08
(8) 10/08-10/09
(9) 12/09-12/10
SBP 276 279 268 321 865 1117 1107 1186 1098DBP 276 279 268 321 865 1117 1106 1186 1098Pregnant 276 279 268 321 865 1117 1107 1186 1098Height 184 143 250 115 840 1116 1104 1184 1057Weight 184 142 247 115 852 1116 1103 1184 1057BMI 183 141 246 115 839 1115 1102 1183 1056Spanish fluency 193 201 210 247 658 863 945 1084 490Years of schooling 192 197 209 241 648 851 934 1064 489Smoking 179 182 172 199 586 759 700 712 508Distance to San Borja 269 275 261 319 851 1100 1088 1168 1018

Table S3. Two-stage mixed models. Stage 1 models have a random slope and intercept for each individual in the study, with blood pressure (SBP, DBP, PP) as the dependent variable. Stage 2 models are generalized additive models that use the individual random-effect slopes plus population main effects from Stage 1 as the dependent variable to model associations with individual level slope, with the overall age-pattern in the slopes modeled with thin-plate splines. Parameter values are in units of change per decade. Only individuals with data for all variables and at least two observations were included (n=695 individuals, n=2,876 observations).
Stage 1 Main effects (mm Hg) SBP DBP PP
B SE p B SE p B SE p Constant 94.5 2.4 <0.01 57.6 1.6 <0.01 36.3 1.7 <0.01 Sex (Male) 2.7 1.0 <0.01 1.4 0.6 0.02 1.1 0.7 0.11 BMI 0.6 0.1 <0.01 0.4 0.06 <0.01 0.3 0.07 <0.01 Pregnant -2.8 1.0 <0.01 -3.3 0.7 <0.01 0.4 0.8 0.63 Smoking tercile 1st -1.2 0.9 0.21 -1.4 0.6 0.02 0.21 0.7 0.75 2nd 1.1 1.2 0.34 0.5 0.8 0.55 1.1 0.8 0.21 3rd 0.5 1.3 0.68 -0.4 0.9 0.62 1.2 0.9 0.19 Spanish fluency None 0 0 0 Moderate 1.1 0.8 0.14 0.5 0.5 0.32 0.5 0.6 0.38 Fluent -1.1 1.0 0.27 0.4 0.7 0.51 -1.8 0.7 0.01 Years of Schooling 0.1 0.1 0.58 0.1 0.08 0.23 0.01 0.09 0.91 Distance to San Borja (per 10 km) -0.3 0.1 0.04 -0.1 0.1 0.29 -0.2 0.1 0.13 Season Wet 0 0 0 Dry 3.9 0.6 <0.01 2.8 0.4 <0.01 1.0 0.5 0.04 Intermediate -0.6 0.59 0.33 0.02 0.4 0.97 -0.6 0.5 0.26 edf Ref.df p edf Ref.df p edf Ref.df p Age Splines Female 3.1 3.1 <0.01 1 1 <0.01 3.4 3.4 <0.01 Male 3.4 3.4 0.03 2.6 2.6 <0.01 4.2 4.2 <0.01
Table S3 continued on next page

Table S3 continued
Stage 2 BP slopes (mm Hg/decade) SBP DBP PP
B SE p B SE p B SE p Constant 2.0 0.4 <0.01 0.9 0.2 <0.01 0.6 0.4 0.12 Sex (Male) -2.7 0.1 <0.01 0.03 0.07 0.65 -3.0 0.1 <0.01 BMI 0.02 0.01 0.27 0.00 0.01 0.91 0.03 0.02 0.07 Smoking tercile 1st -0.1 0.1 0.37 -0.03 0.07 0.63 -0.2 0.1 0.16 2nd -0.01 0.2 0.97 0.1 0.08 0.25 -0.1 0.2 0.41 3rd -0.02 0.2 0.90 0.05 0.09 0.59 -0.08 0.2 0.65 Spanish fluency None Moderate 0.05 0.1 0.65 0.07 0.06 0.26 0.01 0.1 0.93 Fluent 0.08 0.1 0.55 0.06 0.07 0.41 0.2 0.2 0.28 Years of schooling 0.01 0.02 0.63 0.01 0.01 0.63 0.01 0.02 0.60 Distance to San Borja (per 10 km) 0.03 0.02 0.15 0.01 0.01 0.70 0.08 0.02 <0.01 edf Ref.df p edf Ref.df p edf Ref.df p Age Splines Female 7.2 8.2 <0.01 6.1 7.3 0.184 7.5 8.4 <0.01 Male 6.2 7.4 <0.01 2.7 3.4 <0.01 7.6 8.5 <0.01

Table S4. Variance in blood pressure and change in blood pressure by age and sex for Tsimane and NHANES 2005-2006. Cross-sectional (CS) Tsimane values are based only on the largest medical round; slopes were estimated from longitudinal (L) data on individuals with at least five years between first and last observations. P-values represent F-test comparison of variance with a Bonferroni correction for multiple comparisons. p<0.01 comparing Tsimane vs. NHANES BP variance, except for females aged 60+ (p=0.92).
Variance P-value Tsimane NHANES Males vs. Females
Pressures (CS) Slopes (L) Pressures (CS) Pressure Slopes Pressure Measure Age Females Males Females Males Females Male Tsimane Tsimane NHANES SBP 22 - 39 68.9 60.9 3.76 3.73 102.9 140.8 1.00 1.00 <0.01
40-59 188.0 87.6 7.55 3.49 320.6 252.7 <0.01 <0.01 <0.01 60+ 454.7 115.7 11.52 8.55 600.4 426.9 <0.01 1.00 <0.01
DBP 22 - 39 46.3 70.1 2.12 3.31 119.4 167.8 <0.01 0.11 <0.01 40-59 71.1 62.2 3.22 2.99 125.9 153.4 1.00 1.00 0.05 60+ 157.1 83.8 3.55 2.25 301.4 203.8 0.05 1.00 <0.01
PP 22 - 39 47.6 80.3 2.65 2.62 127.9 205.2 <0.01 1.00 <0.01 40-59 95.1 69.0 4.55 2.30 241.2 189.3 0.17 <0.01 <0.01 60+ 190.5 89.7 6.27 5.46 685.1 444.5 0.01 1.00 <0.01

Table S5. Pairwise comparison of variance in blood pressure and change in blood pressure between age groups within each sex in the last medical round for Tsimane and NHANES 2005-2006. P-values represent F-test comparison of variance with a Bonferroni correction for multiple comparisons. CS refers to cross-sectional analysis and L refers to longitudinal analysis.
p-value Tsimane NHANES
Pressures (CS) Slopes (L) Pressures (CS) Measure Comparison Females Males Females Males Female Males SBP 22 - 39 vs. 40 - 59 <0.01 0.03 <0.01 1.00 <0.01 <0.01
22 - 29 vs. 60+ <0.01 <0.01 <0.01 0.02 <0.01 <0.01 40 - 59 vs. 60+ <0.01 0.66 0.75 <0.01 <0.01 <0.01
DBP 22 - 39 vs. 40 - 59 <0.01 1.00 0.12 1.00 1.00 0.93
22 - 29 vs. 60+ <0.01 1.00 0.36 0.87 <0.01 0.03 40 - 59 vs. 60+ <0.01 0.54 1.00 1.00 <0.01 <0.01
PP 22 - 39 vs. 40 - 59 <0.01 1.00 0.04 1.00 <0.01 1.00
22 - 29 vs. 60+ <0.01 1.00 0.02 0.04 <0.01 <0.01 40 - 59 vs. 60+ <0.01 0.75 1.00 <0.01 <0.01 <0.01

TABLE S6. Probability of overweight or obesity (BMI>=25 kg/m2) and obesity (BMI>=30 kg/m2) in mixed-effects regression models with random intercept and age parameters, controlling for physician, medical round, season, and pregnancy status (n=3,411 observations for 1,136 individuals)
Probability of overweight or obese Probability of obese
Predictor Odds Ratio
95% Wald Odds Ratio
95% Wald Confidence Limits P
Confidence Limits p
Age 1.2 <0.01 1.2 <0.01 Age2 0.99 <0.01 0.99 <0.01 Sex (Female) 1.8 1.4 2.5 <0.01 6.3 3.0 13.1 <0.01 Pregnant 1.7 1.2 2.5 <0.01 1.4 0.7 2.9 0.32 Region Downriver 1.7 1.3 2.4 <0.01 1.5 0.8 2.9 0.04 Mission 0.8 0.6 1.2 0.04 0.5 0.2 1.1 0.03 Forest 1.2 0.8 1.7 0.46 1.2 0.6 2.6 0.32 Upriver (vs. Near Town) 0.9 0.6 1.2 0.08 0.9 0.4 1.9 0.93 Spanish fluency None 0.5 0.4 0.7 <0.01 0.5 0.3 1.1 <0.01 Moderate (vs. Fluent) 1.1 0.8 1.4 <0.01 1.4 0.7 2.5 <0.01 Years of schooling 1.1 1.04 1.1 <0.01 1.1 1.01 1.2 0.03 Smoking Low 1.2 0.9 1.6 0.81 0.99 0.5 1.9 0.43 Moderate 1.1 0.8 1.6 0.77 0.5 0.2 1.5 0.03 High 1.1 0.8 1.6 0.66 1.3 0.5 3.3 0.8 Unknown (vs. None) 1.6 0.96 2.6 0.15 4.03 2.0 8.3 <0.01

TABLE S7. Regional differences in hypertension risk factors by sex. Yellow refers to region(s) with highest potential risk. Blue refers to region(s) with lowest expected risk.
Females Males
Variable
Forest
(57 km)
Upriver
(62 km)
Downriver
(22 km)
Fatima
(66 km)
Near Town
(18 km) p
Forest
(57 km)
Upriver
(62 km)
Downriver
(22 km)
Fatima
(66 km)
Near Town
(18 km) p Age (years) 38.6 37.2 38.5 37.0 38.3 ns 38.9 38.5 40.7 38.4 40.4 * Height (cm) 151.0 150.4 150.9 150.9 150.9 ns 162.2 161.7 162.2 163.7 163.2 ‡ Weight (kg) 54.3 52.2 55.6 53.7 54.8 ‡ 61.0 61.0 61.8 63.7 63.5 ‡ Body fat (%) 25.7 24.1 26.3 24.8 24.9 ‡ 16.6 16.4 17.3 18.1 16.4 ‡ BMI (kg/m2) 23.8 23.1 24.4 23.5 24.0 ‡ 23.2 23.3 23.5 23.8 23.8 ‡ Schooling (years) 0.2 0.8 0.8 2.3 2.1 ‡ 0.9 1.9 1.9 3.0 4.5 ‡ Spanish fluency (%)
None 88.5 71.3 65.4 49.9 30.2 ‡ 55.4 23.1 19.3 16.7 8.9 ‡ Moderate 10.8 25.1 29.0 33.3 36.1 35.8 46.0 43.0 58.3 31.4 Fluent 0.7 3.6 5.7 16.9 33.7 8.9 30.9 37.7 25.0 59.7
Smoking (%) None 66.4 71.2 70.4 80.5 83.3 ‡ 4.2 21.0 14.8 16.8 12.6 ‡ Low 22.9 13.5 13.2 7.1 8.3 17.8 21.6 19.6 12.4 25.0 Moderate 7.3 5.5 6.4 3.7 5.0 33.0 17.7 30.7 23.5 33.5 High 2.0 4.9 0.0 0.0 1.2 42.1 35.1 22.6 46.0 25.9
SBP (mm Hg) 110.0 103.2 108.1 108.0 106.9 ‡ 113.9 110.3 113.3 113.0 112.0 ‡ DBP (mm Hg) 68.5 64.2 66.4 68.1 66.1 ‡ 70.4 67.5 68.6 70.8 67.7 ‡ PP (mm Hg) 41.5 39.0 41.7 39.9 40.9 ‡ 43.5 42.8 44.6 42.2 44.2 † n (cases) 492 515 471 463 939 434 467 463 417 817
*p<0.05, †p<0.01, ‡p<0.001, ns=not significant


Table S8. Blood Pressure at average U.S. and Tsimane body mass index (BMI), estimated from models in Table 2 and Figure 2. Calculated With Tsimane Average BMI Average
BMI NHANES Tsimane
Sex/Age SBP DBP SBP DBP Female
Age 40 24.29 113.29 70.25 112.73 70.03 Age 70 23.07 135.98 65.99 117.02 70.99
Male Age 40 24.15 120.22 73.85 112.63 69.97 Age 70 23.20 131.02 67.76 117.11 71.05
Calculated With US Average BMI Average
BMI NHANES Tsimane
Sex/Age SBP DBP SBP DBP Female
Age 40 28.56 114.96 70.79 115.72 71.98 Age 70 29.66 138.56 66.82 121.64 74.01
Male Age 40 29.35 122.26 74.50 116.27 72.35 Age 70 28.55 133.11 68.43 120.86 73.50

Figure S1. SBP, DBP and PP for last Tsimane medical round (Oct. 2008-2009) and NHANES 2005-2006 for females and males. Boxes encompass the 25th- 75th percentiles, lines indicate the median, and whiskers indicate either the extreme data points or 1.5 times the interquartile range, whichever produces a shorter whisker. Outliers are not shown.

Figure S2. Prevalence of hypertension, pre-hypertension and normal tension among (a) females and (b) males during the last medical round (n=1,186 individuals). Sample sizes are in parentheses below age categories.

Figure S3. Effects of median adult body mass index (BMI) on median levels of (a) SBP and (b) DBP, and on age-related increases per 10 years of adult age in (c) SBP and (d) DBP, using INTERSALT study (ages 20-59). Tsimane estimates are represented as black dots.

FIGURE S4. Body fat percentages as a function of body mass index (BMI) for women and men in largest medical round (Oct. 2008-2009).
y = 1.22x - 11.88R2 = 0.33
y = 1.72x - 16.42R2 = 0.57
0
10
20
30
40
50
60
70
14 16 18 20 22 24 26 28 30 32 34 36 38 40
BMI
% B
ody
Fat
WomenMenLinear (Men)Linear (Women)

Figure S5. Spanish ability by sex and distance to San Borja

Figure S6. Smoking by sex and distance to San Borja
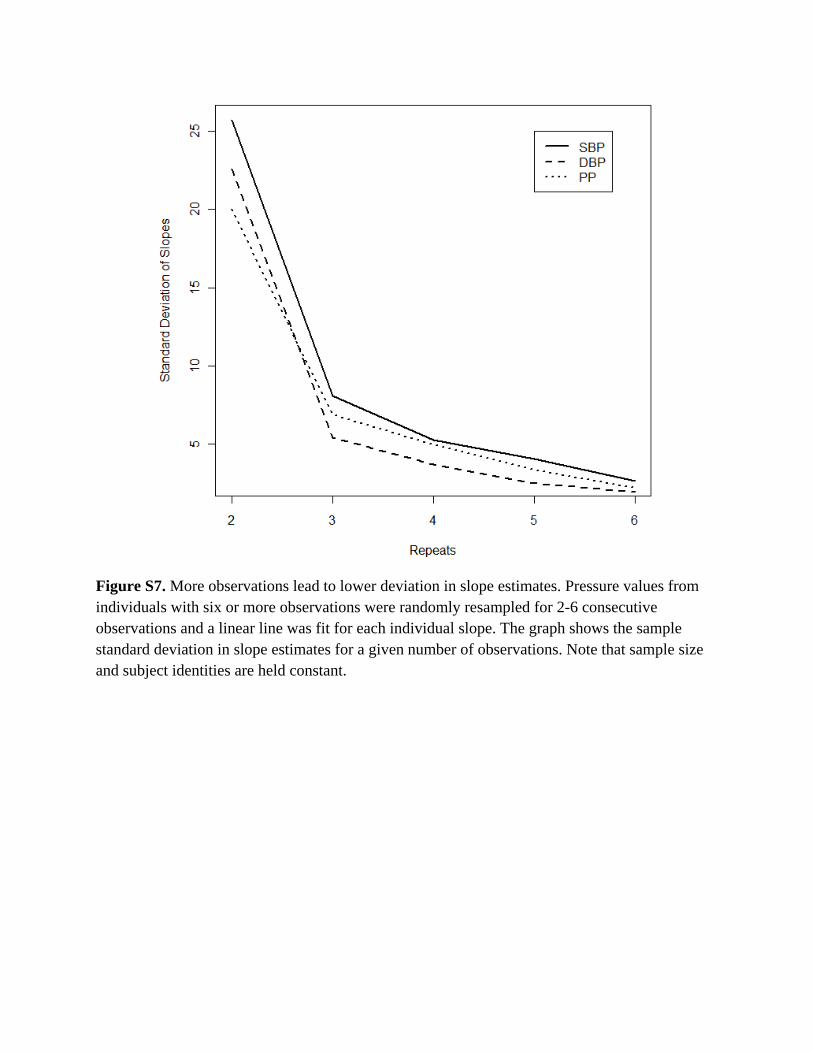
Figure S7. More observations lead to lower deviation in slope estimates. Pressure values from individuals with six or more observations were randomly resampled for 2-6 consecutive observations and a linear line was fit for each individual slope. The graph shows the sample standard deviation in slope estimates for a given number of observations. Note that sample size and subject identities are held constant.