Does Blood Pressure Inevitably Rise With Age? Longitudinal Evidence Among Forager-Horticulturalists
30
Kaplan Michael Gurven, Aaron D. Blackwell, Daniel Eid Rodríguez, Jonathan Stieglitz and Hillard Forager-Horticulturalists Does Blood Pressure Inevitably Rise With Age? : Longitudinal Evidence Among Print ISSN: 0194-911X. Online ISSN: 1524-4563 Copyright © 2012 American Heart Association, Inc. All rights reserved. is published by the American Heart Association, 7272 Greenville Avenue, Dallas, TX 75231 Hypertension published online May 21, 2012; Hypertension. http://hyper.ahajournals.org/content/early/2012/05/21/HYPERTENSIONAHA.111.189100 World Wide Web at: The online version of this article, along with updated information and services, is located on the http://hyper.ahajournals.org/content/suppl/2012/05/21/HYPERTENSIONAHA.111.189100.DC1.html Data Supplement (unedited) at: http://hyper.ahajournals.org//subscriptions/ is online at: Hypertension Information about subscribing to Subscriptions: http://www.lww.com/reprints Information about reprints can be found online at: Reprints: document. Permissions and Rights Question and Answer this process is available in the click Request Permissions in the middle column of the Web page under Services. Further information about Office. Once the online version of the published article for which permission is being requested is located, can be obtained via RightsLink, a service of the Copyright Clearance Center, not the Editorial Hypertension in Requests for permissions to reproduce figures, tables, or portions of articles originally published Permissions: at CONS CALIFORNIA DIG LIB on May 21, 2012 http://hyper.ahajournals.org/ Downloaded from
-
Upload
independent -
Category
Documents
-
view
4 -
download
0
Transcript of Does Blood Pressure Inevitably Rise With Age? Longitudinal Evidence Among Forager-Horticulturalists

KaplanMichael Gurven, Aaron D. Blackwell, Daniel Eid Rodríguez, Jonathan Stieglitz and Hillard
Forager-HorticulturalistsDoes Blood Pressure Inevitably Rise With Age? : Longitudinal Evidence Among
Print ISSN: 0194-911X. Online ISSN: 1524-4563 Copyright © 2012 American Heart Association, Inc. All rights reserved.
is published by the American Heart Association, 7272 Greenville Avenue, Dallas, TX 75231Hypertension published online May 21, 2012;Hypertension.
http://hyper.ahajournals.org/content/early/2012/05/21/HYPERTENSIONAHA.111.189100World Wide Web at:
The online version of this article, along with updated information and services, is located on the
http://hyper.ahajournals.org/content/suppl/2012/05/21/HYPERTENSIONAHA.111.189100.DC1.htmlData Supplement (unedited) at:
http://hyper.ahajournals.org//subscriptions/
is online at: Hypertension Information about subscribing to Subscriptions:
http://www.lww.com/reprints Information about reprints can be found online at: Reprints:
document. Permissions and Rights Question and Answer this process is available in the
click Request Permissions in the middle column of the Web page under Services. Further information aboutOffice. Once the online version of the published article for which permission is being requested is located,
can be obtained via RightsLink, a service of the Copyright Clearance Center, not the EditorialHypertensionin Requests for permissions to reproduce figures, tables, or portions of articles originally publishedPermissions:
at CONS CALIFORNIA DIG LIB on May 21, 2012http://hyper.ahajournals.org/Downloaded from

Does Blood Pressure Inevitably Rise With Age?Longitudinal Evidence Among Forager-Horticulturalists
Michael Gurven, Aaron D. Blackwell, Daniel Eid Rodríguez, Jonathan Stieglitz, Hillard Kaplan
Abstract—The rise in blood pressure with age is a major risk factor for cardiovascular and renal disease, stroke, and type2 diabetes mellitus. Age-related increases in blood pressure have been observed in almost every population, exceptamong hunter-gatherers, farmers, and pastoralists. Here we tested for age-related increases in blood pressure amongTsimane forager-farmers. We also test whether lifestyle changes associated with modernization lead to higher bloodpressure and a greater rate of age-related increase in blood pressure. We measured blood pressure longitudinally on 2248adults age �20 years (n�6468 observations over 8 years). Prevalence of hypertension was 3.9% for women and 5.2%for men, although diagnosis of persistent hypertension based on multiple observations reduced prevalence to 2.9%for both sexes. Mixed-effects models revealed systolic, diastolic, and pulse blood pressure increases of 2.86(P�0.001), 0.95 (P�0.001), and 1.95 mmHg (P�0.001) per decade for women and 0.91 (P�0.001), 0.93(P�0.001), and �0.02 mmHg (P�0.93) for men, substantially lower than rates found elsewhere. Lifestyle factors,such as smoking and Spanish fluency, had minimal effect on mean blood pressure and no effect on age-relatedincreases in blood pressure. Greater town proximity was associated with a lower age-related increase in pulsepressure. Effects of modernization were, therefore, deemed minimal among Tsimane, in light of their leanphysique, active lifestyle, and protective diet. (Hypertension. 2012;60:00.) ● Online Data Supplement
Key Words: hypertension � Tsimane � blood pressure � modernization
An age-related increase in blood pressure (BP) is viewedas a universal feature of human aging.1–3 Among West-
erners over age 40 years, systolic BP (SBP) increases by �7mmHg per decade.4 Epidemiological surveys show a pro-gressive increase in SBP with age, reaching an average of�140 mmHg by the eighth decade.5 Diastolic BP (DBP) alsoincreases with age but at a lower rate than SBP; DBP mayeven fall at late ages.6 Women show lower SBP and DBPthan men up until the age of menopause, when women’s SBPsurpasses that of men.7 By age 70 years, more than threequarters of US adults have hypertension.
Understanding the conditions affecting age-related BPincrease is of obvious clinical importance. Higher BP isassociated with cardiovascular and renal disease acrossdiverse populations, even controlling for other factors.5
Hypertension is the leading cause of cardiovascular mor-tality, and age-related BP increase is a high-priority targetfor intervention.8
The only reported cases of no age-related BP increasecome from studies of subsistence-level populations.9–11
These studies, however, are problematic: they are cross-sectional; use small, sometimes biased samples; and often do
not specify explicit measurement methods. Age estimates ofolder adults are also poor.12 Because of epidemiological andeconomic transitions, cohort effects may also have muted ageeffects; younger adults may have higher BP than older adultsdid when they were younger.
Nonetheless, results from many studies suggest that “mod-ernization” results in changes in diet, adiposity, activity, andpsychosocial stress, leading to higher BP and greater age-related increases in BP.13–15 Although available evidenceshows that hypertension is more common among those withmodern lifestyles, it is unclear whether these changes impactthe rate of increase in BP. It is also unclear whether thesechanges impact everyone equally or just high risk subpopu-lations. Heterogeneity in susceptibility and modernizationcould reveal further variability in longitudinal age trajectoriesof BP.
Here we assess the extent to which BP increases with ageusing longitudinal and cross-sectional data collected amongTsimane of the Bolivian Amazon. Tsimane are lowlandforager-horticulturalists (population, �11000) subsisting onplantains, rice, corn and manioc, fish, and hunted game.Tsimane are currently undergoing epidemiological and tech-
Received December 4, 2011; first decision December 29, 2011; revision accepted April 12, 2012.From the Integrative Anthropological Sciences Program (M.G., A.D.B.), University of California-Santa Barbara, Santa Barbara, CA; Departamento de
Medicina (D.E.R.), Universidad Mayor de San Simón, Cochabamba, Bolivia; Department of Anthropology (J.S., H.K.), University of New Mexico,Albuquerque, NM.
The online-only Data Supplement is available with this article at http://hyper.ahajournals.org/lookup/suppl/doi:10.1161/HYPERTENSIONAHA.111.189100/-/DC1.
Correspondence to Michael Gurven, Integrative Anthropological Sciences Program, University of California-Santa Barbara, Santa Barbara, CA 93106.E-mail [email protected]
© 2012 American Heart Association, Inc.
Hypertension is available at http://hyper.ahajournals.org DOI: 10.1161/HYPERTENSIONAHA.111.189100
1 at CONS CALIFORNIA DIG LIB on May 21, 2012http://hyper.ahajournals.org/Downloaded from

nological transitions,16 although there was no electricity,running water, or waste management at the time of study.Villages vary in their degree of healthcare access. Modern-ization takes several forms, including visits to the town of SanBorja (population, �24000), wage labor with loggers orcolonists, debt peonage with itinerant river merchants, andschooling. Schools now exist in �75% of villages, but manyolder adults have little or no schooling.
We first assessed hypertension prevalence and examinedage-related changes in SBP, DBP, and pulse pressure (PP)to test the general hypothesis that BP increase is a robustfeature of human aging. We then tested whether both BPand age-related increase in BP increased with moderniza-tion, operationalized by Spanish fluency, distance to town,smoking frequency, and body mass index (BMI). We alsoassessed whether an increase in BP with age occurreduniformly or was instead concentrated among a high-risksubpopulation.
MethodsStudy PopulationA total of 2248 adults aged 20 to 90 years (n�82 villages)participated in the Tsimane Health and Life History Project fromJuly 2002 to December 2010. Adults were sampled anywhere from1 to 9 times during medical rounds, yielding a sample of 6468person-observations; 61% of adults were sampled at least twice and36% �4 times (Table S1, available in the online-only Data Supple-ment). Sample size varied from 268 to 1186 individuals across 9medical rounds (Table S2).
BP and ControlsSBP and DBP were measured on the right arm by trained Bolivianphysicians with a Welch Allyn Tycos Aneroid 5090 sphygmoma-nometer and Littman stethoscope. Patients were seated or supine for�20 minutes before measurements. After 2008, all of the hyperten-sive readings were repeated after �30 minutes to confirm prelimi-nary diagnoses. No Tsimane has ever taken medication to controlhypertension. We use the Joint National Committee on Prevention,Detection, and Treatment of High Blood Pressure classificationscheme to define BP categories as hypertensive (SBP �140 mmHgor DBP �90 mmHg), prehypertensive (120–139 mmHg SBP or80–89 mmHg DBP), and normotensive (SBP �120 mmHg andDBP �80 mmHg).
Height (in centimeters) was measured by trained Tsimane researchassistants with a portable Seca stadiometer. Weight (in kilograms)and body fat percentage were measured using a Tanita BF-572 weighscale.
ModernizationVillage-level variance in distance to San Borja is substantial(mean�SD, 41�23 km; minimum, 6; maximum, 82). Highest levelof schooling and Spanish fluency were assessed during censusupdates and demographic interviews. Cumulative smoking wasmeasured in cigarette pack-years based on interviews of number ofcigarettes smoked per week and age at which the interviewee startedsmoking. One pack-year is equal to a pack of cigarettes smoked perday for 1 year. Given potential problems with recall bias, cumulativesmoking experience was categorized into tertiles, including first(0.003–0.070 pack-years), second (0.07–0.30 pack-years), or third(�0.30 pack-years).
Statistical Analysis
Cross-Sectional AnalysesWe used mixed- and fixed-effect models with linear and nonlinearage parameters. Linear models were fit with the lm and lme
procedures in R 2.13.1. Nonlinear models used generalized additivemodels.17,18 Generalized additive models use a thin-point spline tofit nonlinear age patterns while allowing for the simultaneousinclusion of parametric terms. Generalized additive models were fitwith gam in the mgcv package and gamm4 in the gamm4 package.Mixed models were used to control for both individual variation inage trajectories and correlated errors between repeated samples.19
Longitudinal Rates of BP ChangeLongitudinal analyses included only individuals with �5 yearsbetween first and last observation (please see the online-only DataSupplement). Repeat BP values were recoded as changes from themean of a subject’s BP measures (�BP); times were coded as daysbefore or after the subject’s median examination date. Linear modelswere fit to �BP including subject identification, a subject-by-timeinteraction term, season, and pregnancy status as controls. Parametervalues for �BP were obtained from the subject-by-time interactionterms.
Two-Stage Mixed ModelTo examine the effect of modernization on absolute BP levels andrates of BP change, we use a 2-stage mixed model (Tables 2 and S3).In the first stage, a standard mixed generalized additive model wasrun with a nonparametric age term, and individual variation in slopewas modeled as a random effect. Individual slopes were obtained byadding the overall population slope for an individual’s age plus thatindividual’s random slope, both from the stage 1 model. These slopeswere used as the dependent variable in model 2 to examine factorsaffecting rate of BP change.
Ethical ConcernsInformed consent was obtained for all of the protocols at 3 levels,Tsimane government, community, and individual. After explanationof protocols by bilingual Spanish-Tsimane research assistants, con-sent forms were either signed by literate participants or fingerprintedby nonliterate participants. All of the protocols have been approvedby the institutional review boards at University of New Mexico andUniversity of California-Santa Barbara.
ResultsSample CharacteristicsAverage age was 38.0 and 39.3 years for women and men,respectively (Table 1). Women represented 52.6% of obser-vations. In comparison with normotensives, hypertensivemen and women were older, shorter, had more body fat, wereless likely to be nonsmokers, were less educated, and weremore likely to speak Spanish.
Mean BP and Hypertension PrevalenceIn the largest medical round (October 2008–2009), anyobservation of hypertension was followed with a confirma-tory reading within a half hour. Mean BP for Tsimane menand women, respectively, was 113, 108 mmHg (SBP); 70, 66mmHg (DBP); and 43, 41 mmHg (PP). This cross-sectionalanalysis shows a notable increase in SBP and PP with age forwomen and a very modest increase in SBP for men (FigureS1). Prevalence of hypertension was 3.9% for women and5.2% for men (Figure S2). It was highest among women overage 70 years (30.4%). Isolated systolic hypertension ac-counted for 49.3% of hypertensive cases, and isolated dia-stolic accounted for 22.3%. Prehypertension prevalence was17.4% for women and 29.1% for men.
Prevalence of hypertension declined substantially if werequired additional observations of elevated BP in otherrounds. Among people sampled �3 times, only 38% were
2 Hypertension July 2012
at CONS CALIFORNIA DIG LIB on May 21, 2012http://hyper.ahajournals.org/Downloaded from

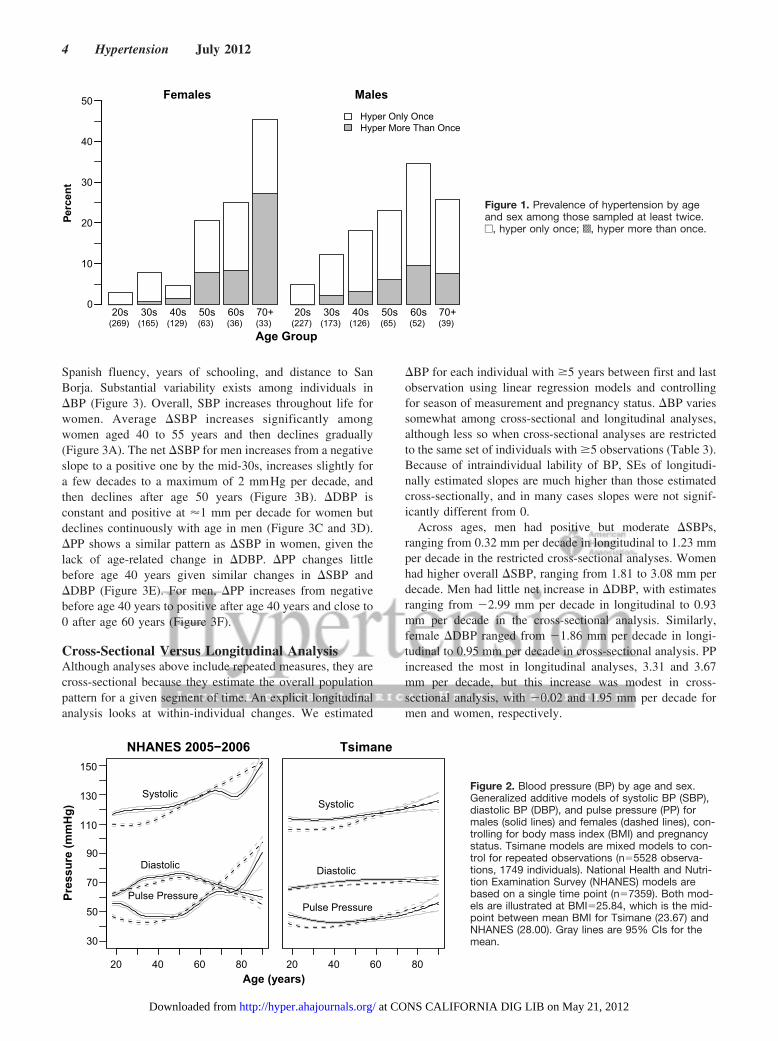
hypertensive more than once, and only 1% were hypertensivefor all of the readings (Table S1). Even among those sampled8 times, 50% of those with a hypertensive measurement werehypertensive only once. It is, therefore, likely that the trueprevalence of hypertension may be as low as one third therates based on single measurements reported in Table S1 andpreliminarily described in Reference 20. Among those sam-pled multiple times, frequency of �2 instances of hyperten-sion was low (Figure 1). Only 7.7% and 27.3% of men andwomen, respectively, in the highest risk age category (aged�70 years) were hypertensive more than once, whereas anadditional 18% of each sex were hypertensive only once.Overall, prevalence of repeat hypertension was 2.9% for bothsexes.
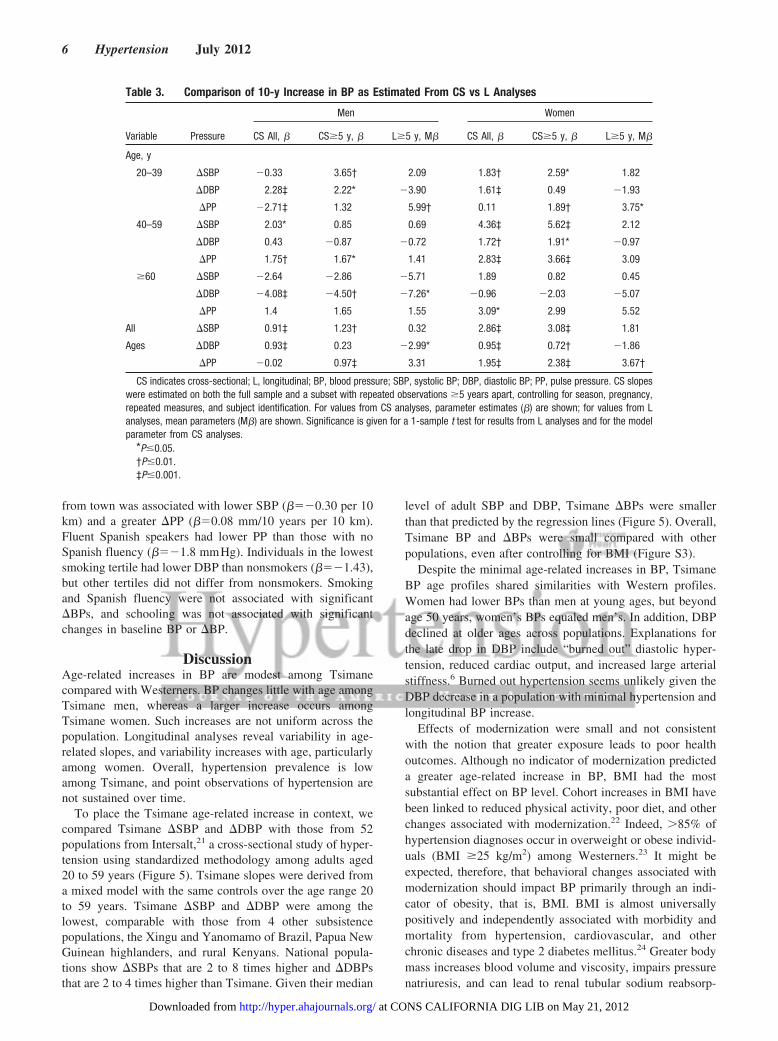
Rise in BP With AgeWe estimated age trajectories of SBP, DBP, and PP forTsimane and a US comparison (National Health and NutritionExamination Survey 2005–2006; Figure 2). Men’s SBP ismuch flatter across adulthood than women’s, whose SBPrises substantially around menopause. DBP increase with age
is modest for women, whereas DBP decreases for men afterage 60 years. This decrease in DBP is observed for both menand women in the U.S. PP increases for women after age 40and less steeply for men after age 45. Despite these sexdifferences, Tsimane age profiles indicate substantially lesschange in BP with age than US age profiles, even aftercontrolling for BMI (Figure 2). However, both populationsshow similarities, including lower SBP for women than menat younger ages and increasing BP in women after meno-pause. Although blunted, Tsimane males also show an in-crease in DBP early in life and a decrease later in life. PPincreases at later ages in both populations.
The 2-stage mixed-modeling strategy tests for effects onboth the intercept and rate of increase in BP for individuals(Tables 2 and S3). Stage 1 models main effects of predictorson BP, using random effects to control for repeated observa-tions. Stage 2 assigns a slope to each individual consisting ofthe population slope for that age from stage 1 plus theindividual’s difference from the population mean obtainedfrom the stage 1 random-effects model. These analysesinclude controls for sex, pregnancy status, season, BMI,
Table 1. Sample Means by BP Status for Tsimane Adults Aged >20 y
Variable
Women Men
Sex byBP Group�
Blood Pressure Group P Value§ Blood Pressure Group P Value§
Normal Prehypertensive Hypertensive NvP NvH PvH Normal Prehypertensive Hypertensive NvP NvH PvH
Age, y 38.0 56.0 66.5 ‡ ‡ ‡ 39.3 46.8 65.8 ‡ ‡ ‡ ‡
Height, cm 150.8 150.8 148.3 NS † † 162.7 162.2 159.5 NS ‡ † NS
Weight, kg 53.6 56.3 52.5 † NS * 62.8 63.7 63.3 † NS NS NS
Body fat, % 25.9 28.5 28.2 ‡ † NS 17.5 18.9 21.1 ‡ ‡ * NS
BMI, kg/m2 23.6 24.7 23.8 ‡ NS NS 23.6 24.2 24.8 ‡ * NS NS
Years of schooling 1.4 0.5 0.5 ‡ NS NS 2.8 2.5 1.0 NS NS NS NS
Distance to SanBorja, km
37.7 35.0 35.9 NS NS NS 38.5 41.1 36.2 NS NS NS NS
SBP, mm Hg 103.8 122.2 146.5 ‡ ‡ ‡ 107.9 122.5 144.3 ‡ ‡ ‡ ‡
DBP, mm Hg 64.4 73.9 80.0 ‡ ‡ ‡ 66.6 74.0 95.0 ‡ ‡ ‡ ‡
PP, mm Hg 39.2 47.0 65.2 ‡ ‡ ‡ 41.6 47.3 54.7 ‡ ‡ NS ‡
Smoking tertile, %
None 78.9 69.3 58.8 * * NS 15.8 21.4 18.8 NS NS NS NS
First 14.9 13.3 23.5 27.5 21.4 18.8
Second 3.9 16.0 11.8 27.5 23.3 31.3
Third 2.3 1.3 5.9 29.3 34.0 31.3
Spanish fluency, %
None 55.8 72.1 38.5 * NS * 24.6 31.4 16.7 NS NS NS NS
Moderate 27.3 18.0 38.5 36.6 36.4 66.7
Fluent 16.9 9.8 23.1 38.8 32.2 16.7
n (cases) 942 158 44 838 288 51
For each individual the median value of repeated measures on a given variable was used to calculate group means and determine hypertensive category. NvPindicates normal vs prehypertensive; NvH, normal vs hypertensive; PvH prehypertensive vs hypertensive; NS, not significant; SBP, systolic blood pressure; DBP,diastolic blood pressure; PP, pulse pressure; BMI, body mass index; BP, blood pressure.
*P�0.05.†P�0.01.‡P�0.001.§P values for comparisons are from a Mann-Whitney U or �2 test.�P values indicate the significance of a sex�blood pressure group interaction in a linear model with Gaussian link or a geneneralized linear model with ordinal
response and logit link function. Models also included main effect terms for sex and hypertension group (not shown).
Gurven et al Blood Pressure Change With Age and Modernization 3
at CONS CALIFORNIA DIG LIB on May 21, 2012http://hyper.ahajournals.org/Downloaded from
Spanish fluency, years of schooling, and distance to SanBorja. Substantial variability exists among individuals in�BP (Figure 3). Overall, SBP increases throughout life forwomen. Average �SBP increases significantly amongwomen aged 40 to 55 years and then declines gradually(Figure 3A). The net �SBP for men increases from a negativeslope to a positive one by the mid-30s, increases slightly fora few decades to a maximum of 2 mmHg per decade, andthen declines after age 50 years (Figure 3B). �DBP isconstant and positive at �1 mm per decade for women butdeclines continuously with age in men (Figure 3C and 3D).�PP shows a similar pattern as �SBP in women, given thelack of age-related change in �DBP. �PP changes littlebefore age 40 years given similar changes in �SBP and�DBP (Figure 3E). For men, �PP increases from negativebefore age 40 years to positive after age 40 years and close to0 after age 60 years (Figure 3F).
Cross-Sectional Versus Longitudinal AnalysisAlthough analyses above include repeated measures, they arecross-sectional because they estimate the overall populationpattern for a given segment of time. An explicit longitudinalanalysis looks at within-individual changes. We estimated
�BP for each individual with �5 years between first and lastobservation using linear regression models and controllingfor season of measurement and pregnancy status. �BP variessomewhat among cross-sectional and longitudinal analyses,although less so when cross-sectional analyses are restrictedto the same set of individuals with �5 observations (Table 3).Because of intraindividual lability of BP, SEs of longitudi-nally estimated slopes are much higher than those estimatedcross-sectionally, and in many cases slopes were not signif-icantly different from 0.
Across ages, men had positive but moderate �SBPs,ranging from 0.32 mm per decade in longitudinal to 1.23 mmper decade in the restricted cross-sectional analyses. Womenhad higher overall �SBP, ranging from 1.81 to 3.08 mm perdecade. Men had little net increase in �DBP, with estimatesranging from �2.99 mm per decade in longitudinal to 0.93mm per decade in the cross-sectional analysis. Similarly,female �DBP ranged from �1.86 mm per decade in longi-tudinal to 0.95 mm per decade in cross-sectional analysis. PPincreased the most in longitudinal analyses, 3.31 and 3.67mm per decade, but this increase was modest in cross-sectional analysis, with �0.02 and 1.95 mm per decade formen and women, respectively.
Females
0
10
20
30
40
50
20s 30s 40s 50s 60s 70+(269) (165) (129) (63) (36) (33)
Hyper Only OnceHyper More Than Once
Males
20s 30s 40s 50s 60s 70+(227) (173) (126) (65) (52) (39)
Perc
ent
Age Group
Figure 1. Prevalence of hypertension by ageand sex among those sampled at least twice.e, hyper only once; s, hyper more than once.
Pres
sure
(mm
Hg)
30
50
70
90
110
130
150
20 40 60 80
Systolic
Diastolic
Pulse Pressure
20 40 60 80
Systolic
Diastolic
Pulse Pressure
NHANES 2005−2006 Tsimane
Age (years)
Figure 2. Blood pressure (BP) by age and sex.Generalized additive models of systolic BP (SBP),diastolic BP (DBP), and pulse pressure (PP) formales (solid lines) and females (dashed lines), con-trolling for body mass index (BMI) and pregnancystatus. Tsimane models are mixed models to con-trol for repeated observations (n�5528 observa-tions, 1749 individuals). National Health and Nutri-tion Examination Survey (NHANES) models arebased on a single time point (n�7359). Both mod-els are illustrated at BMI�25.84, which is the mid-point between mean BMI for Tsimane (23.67) andNHANES (28.00). Gray lines are 95% CIs for themean.
4 Hypertension July 2012
at CONS CALIFORNIA DIG LIB on May 21, 2012http://hyper.ahajournals.org/Downloaded from

After segregating the sample by age, cross-sectional andlongitudinal analyses showed similarities but with notableexceptions. Men aged 20 to 39 years had significantlydecreasing �PP in the cross-sectional model, including allTsimane, but increasing �PP in the restricted sample. In all 3of the models, male �PP increased between ages 40 and 59years, but only �SBP in the full cross-sectional modelincreased significantly above 0. Male �DBP declined signif-icantly in individuals aged �60 years in all of the analyses.Like men, women aged 20 to 39 years had increasing �PP inthe restricted sample and no change in the full cross-sectionalsample. �SBP increased in all 3 of the models, although notsignificantly in the longitudinal analysis. For women aged 40to 59 years, �SBP, �DBP, and �PP increased in bothcross-sectional analyses. Increases in �SBP and �PP in thelongitudinal analysis were not statistically significant.Women aged �60 years showed increasing �SBP, declining�DBP, and increasing �PP, but only �PP changed signifi-cantly and only in the full cross-sectional sample.
Variance in BPTo test whether BP patterns were consistent for all of theindividuals or affected subpopulations differentially, we ex-
amined differences in variance in BP and longitudinal slopesby sex, age, and population. Overall, variance in SBP, DBP,and PP was higher in women than in men and higher inAmericans than in Tsimane, particularly after age 40 years(Figure 4 and Table S4). Variance in both sexes and popula-tions increased with age; both Tsimane and American womenshowed higher variance in BP with age. Examining longitu-dinal slopes, Tsimane women had higher variance over age40 years, but variance did not increase significantly at age�60 years compared with ages 40 to 59 years (Table S4).Tsimane men’s SBP variance increased after age 40 years,and men’s variance in slope also increased after age 60 years.Tsimane men’s variance in DBP did not change signifi-cantly with age, whereas Tsimane and American women’sDBP and PP variance increased with age (Figures 4 andS4). Overall variance was greatest for SBP, and the greatervariance with age among women is evident. By age 60years, although mean and median slopes for women werepositive for SBP and PP, a significant portion of womenshowed slopes �0.
Effects of ModernizationWe examined effects of modernization on SBP, DBP, and PPcontrolling for age, sex, season, and pregnancy status (Table2, Stage 1). BMI was associated with higher SBP (��0.61),DBP (��0.39), and PP (��0.25). BMI was not associatedwith significant differences in �BPs with age. Living farther
Table 2. Two-Stage Mixed Models
Parameter
Stage 1 MainEffects, mm Hg
Stage 2, �BP, mm Hgper Decade
SBP DBP PP SBP DBP PP
Constant 94.5‡ 57.6‡ 36.3‡ 2.0‡ 0.9‡ 0.6
Sex (male) 2.7‡ 1.4* 1.1 �2.7‡ 0.03 �3.0‡
BMI 0.6‡ 0.4‡ 0.3‡ 0.02 0.01 0.03
Years of schooling 0.1 0.1 0.01 0.01 0.01 0.01
Distance to SanBorja (per 10 km)
�0.3* �0.1 �0.2 0.03 0.01 0.08‡
Pregnant �2.8† �3.3‡ 0.4
Smoking (tertile§)
First �1.2 �1.4* 0.2 �0.1 �0.03 �0.20
Second 1.1 0.5 1.1 �0.01 0.10 �0.10
Third 0.5 �0.4 1.2 �0.02 0.05 �0.08
Spanish fluency�
Moderate 1.1 0.5 0.5 0.05 0.07 0.01
Fluent �1.1 0.4 �1.8* 0.08 0.06 0.2
Season¶
Dry 3.9‡ 2.8‡ 1.0*
Intermediate �0.6 0.02 �0.6
Stage 1 models have a random slope and intercept for each individual in thestudy, with blood pressure (BP) as the dependent variable. Stage 2 models usethe individual random-effect slopes plus population main effect of age fromstage 1 as the dependent variable. Age was included as a nonlinear thin-platespline in both models. Only individuals with data for all of the variables and �2observations were included (n�695 individuals; n�2876 observations). Formore details please see the online-only Data Supplement. BMI indicates bodymass index; SBP, systolic BP; DBP, diastolic BP; PP, pulse pressure.
*P�0.05.†P�0.01.‡P�0.001.§Data are relative to no smoking.�Data are relative to speaks no Spanish.¶Data are relative to wet season.
●●
●
●
●
●
●●
●
●
●
●
●
●
●
●
●
●
●
●
●
●
● ●
●
●●
●
●●
●
●
●
●
●
●●
●
●
●●
●
●
●
●
●
●
●
●
●
●
●
●
●
●
●
●
●
●
●
● ●●
●
●
●
●
●
●
●
●
●
●
●
●
●●
●
●
●
●
●
●
●
●●
●
●
●
●
●
●
●●
●
●●
●
●
●
●
●●
●
●
●
●
●
●
● ●
●
●
●
●
●
●
●
●
●
●
●
●
●
●
●
●
●
●
●
●
●
●
● ●●
●
●
●
●
●
●
●
●
●
●
●
●
●
●
●
●
●
●
●
●
●
●
●●
●
●
●
●
●
●
●
●
●
●
●●
●
●
●
●
●
●
●
●●
●
●
●
●
●
●
●
●
●
●●
●
●
●
●
●
●
●
●
●
● ●
●
●
●
●
●
●
●
●
●
●●
●
●
●
●●●
●
●
●
●
●●
●
●
●
●
●
●
●
●
●
●
●
●
●
●●●
●
●
●
● ●
●
●
●
●
●
●
●
●
●
●
●
●
●
●
●
●
●●
●
●
●
●
●
●
●
●
●
●
●
●
●
●
●
●
●
●
●
●
●
●
●
●
●
●
●
●
●
●
●
●
●●
●
●
●
●
●
●
●
●
●
●
●
●
●
●
●
●
●
●
● ●
●
●●
●●
●
●
●
●
●
●
●
●
● ●
●
●
●
●
●
●
●
●
●●
●
●
●
●
●
●
●
●●
●
●●●
●●●
●
●
●
●
●
●
A
−8
−4
0
4
8
● ●
●
●
●
●
●
●
●
●
●
●
●●
●●
●
●
●
●●
●
●
●
●
●●
●
●
●
●
●
●
●
●
●
●
●
●
●
●
●
●
●
●
●
●
●
●
●
●
●
●
●
●
●
●
●
●
●
●
●●
●
●
●●
●
●●
●
●
●
●
●
●
●●
●
●
●●
●
●
●
●
●
●
●
●
●
●
●
●
●
●
●
●●
●
●
●
●
●
●
●
●
●
●
●
●
●
●
●
●●
●
●●
●
●
●
●
●
●
●
●
●
●
●
●
●
●
●
●
●
●●
●
●
●●
●
●●
●
●
●●
●
●
●
●
●
●
●
●
●
●
●●
●●
●
●
●
●
●
●
●
●
●
●
●
● ●
●●
●
●
●
●
●
●
●
●
●
●
●
●
●
●
●
●●●
●
●
●
●
●
●
●
●
●
●
●
●
●
●
●
●
●
●
●
●
●
●
●
●
●
●
●
●
●●
●●
●
●
●
●
●
●
●
●
●
●
●
●
●
●
●
●
●
●
●
●
●
●
●
●
●
●
●
●
●
●
●
●
●
●
●
●
●
● ●
●●
●
●
●
●
●●
●
●
●
●
●
●
●
●
●
●
●
●
●
●
●
●
●
●
●
●
●
●
●
●
●
●
●
●
●
●
●●
●
●
●
●
●●
●
●
●
●
●
●
●
●
●
●
●
●
●
●
●
●
●
B
●●●
●●
●
● ●
●
●
●
●
●
● ●
●
●●
●●
●
●
●
●●
●● ●●
●●●
●●● ●
●
●
●
●
●
●●
●
●
●
●
●
●
●
●
●
●●
●● ●
●
●
●● ●●
●●●
●
●●
●
● ●
●● ● ●● ● ●●
●
● ●●
●
●
●
●
●
●
●●
●
●
●
●
●
●
●
●●●
● ●
●
●●
●
●
●●
●● ●
●
●●
●●
●
● ●● ●●●
●●● ●●
●●
●
●●
●
●
●
●
●
●
● ●●
●●●
●
●
●●●●
●●
●
●
●●● ●
●
●●
●
●
●
●●
●
●●
●●
●●
●
●
●
●●
●
●
●
●
●
●
●
●●
●
●
●
●●
● ● ●
●●
●●
●
●
●
●●
●
● ● ●●
●●● ● ●● ●● ●●
●●●● ●●
● ●
●●
●
●●
●
●●●
●
●●
●
●
● ●●
● ●●●●●●
●
●●●
●
●●
●
●
●
●
●
●●
●●
●
●
●
●
●
●
●
●
●
●
●● ●●
●●
●
●
● ●●
●
●
●
●●
●
●●●
●
● ●
●
●
●●●
●●●●
● ●●●
●
●
●●
●●
●
●
●
●
●
● ●●
●
●●
●
●●● ●
●●●
●
●
●
●
●●
●
●
● ●●● ●
●●●
●
●●
●
●
●
●●
●
C
−8
−4
0
4
8
●
●
●
●
●
●
●●
●
●
●
●●
●
●
●
●
●
●
●
●
●
●
●
●
●
●
●●
●
●
●●
●
●
●
●●
●
●
●
●
●
●
●
●●
●
● ●
●●
●
●
●●
●●
●
●
●
●
●● ●
●
●
●
●
●
●
●
●
●●
●
●
●●
●●●
●
●
●
●●
●
●
●
●
●
●
●
●
●
●
●
●
●
●
●
●
●
●
●
●
●
●●●
●
●
●
●
●
●
●●
●
●
●
● ●
●
●
●
●
● ●
●
●
●
●
●
●● ●
●●
●
●
●
●
●
●
●
●
●
●
●
●
●
●
●
●
●
●
●
●
●
●
●●
●
●
●
●
●
●
●
●●
●●
●
●
●
●●
●
●
●
●
●
●
●
●
●
●●
●
●
●
●●
●●
●
●
●
●●
●
●
●
●
●
●
●
●
●
●
●
●
●
●
●
●
●
● ●
●
●●●
●
●●
●
●
●
●●
●
●
●●
●
●
●
●
●
●
●
●●
●
●
●●
●
● ● ●
●
●
●
●
●
●
●
●
●
●
● ●
●
●●
●
●
●●
●
●
●
●
●
●
●●
●●
●
●●
●
●
●
●
●
●
●●
●
●
●
●
●
●
●
●●
●
●
●
●
●
●
●
●
●●
●
●
●
●
●●●
●
●
●
● ●
●
●
●
●
D
●
20 40 60 80
●
●
●
●
●
●
●
●
●
●
●
●
●
●
●
●
●
●
●
●
●
●
●
●
●●
●
●
●
●
●
●
●●
● ●
●
●
●
●
●
●
●
●
●
●●
●
●
●
●
●
●
●●
●
●
●
●
●
●●
●
●
● ●
●
●
●
●
●
●●
●
●
●
●
●
●
●
●
●
●
●
●
●●
●●
●
●
●●
●
●●
●
●
●
●
●●
●
●
●●●
●
●
●
●
●
●
●
●
●●
●
● ●
●
●
●
●
●
●
●
● ●
●
●
●
●
●●
●●
●
●
●
●
●
●
●
●
●●
●
●
●
●
●
●
●
●
●
●
●
●
●
●
●
●●
●
●
●
●
●
●●
●
●
●
●
●
●
●
●
●
●
●
●
●
●
●
●
●
●
●
●
●
●
●
●
●●
●●
●
●
●
●
●●
●●
●
●
●
●
●●●●
●
●
●●
●● ●
● ●
●
●
●●
●
●●
●
●
●
●
●
●
●
●
●
●
●
●
●
●
●
●
●
●
●
●
●●
●
●
●
●
●
●●
●
●
●
●
●
●
●
●
●
●
●
●
●
●
●
●
●
●
●
●
●
●
●
●●
●
●
●
●
●
●
●
●
●
●
●
●
●
●
●
●
● ●●
●
●
●
●
●
● ●●
●
●
●
●
●
●
●
●
●
●●
●
●
●
●
●
●
●
●
●●
●
●
●
● ●
●
●
●
●
●
●
●
●
●
●
●
●
●
● ●
●
●
●
●
●
●●
●
●
●
●
●
●E
−8
−4
0
4
8
●
20 40 60 80
●
●
●
●
●
●
●
●
●
●
●
●
●
●●
●
●
●
●
●
●
●
●
●
●
●
●
●
●
●
●
●
●
●●
●
●
●
●
●
●
●
●
●
●
●
●
●
●●
●
●
●
●
●
●
●
●
●
●
●
●
●
●●
●
●
● ●
●
●●
●
●
●
●
●●
●
●●
●
●
●●
●
●
●
●
●●
●
●
●
●
●
●
●●
●
●
●
●
●
●
●
●
●
●●
●
●
●
●
●
●
●
●
●
●
●
●●
●
●●
●
●
●●
●
●
●
●
●
●
●
●
●●
●
●
●
●
●
●
●
●
●
●
●
●
●
●
●
●
●
●
●
●●
●●●
●
●
●●●
●
●● ●
●
●
●
●
●
●
●
●
●
●
●
●
●
●
●
●
●
●
●
●
●
●
●
●
●
●
●
●
●
●
●
●
●
●
●
●
●
●
●
●
●
●
●
●
●
●●
●●
●
●
●
●
●
●
●
●
●
●
●
●
●
●
●
●
●
●
●
●
●
●
●
●
●
●
●●
●
●
●
●
●
●
●
●
●
●
●
●
●
●
●●
●
●
●
●
●
●
●
●
●
●
●
●●
●
●
●
●
●
●
●
●
●●
●
●
●
●
●
●
●
●
●
●
●
●
●
●
●
●
●
●
●
●
●
●
●
●
●
●
●
●
●
●
●
●
●
●
●
●
●
●
●
●
F
Females Males
Age (years)
∆ P
P / D
ecad
e∆
DB
P / D
ecad
e∆
SB
P / D
ecad
e
Figure 3. Change in systolic blood pressure (BP; SBP; A andB), diastolic BP (DBP; C and D), and pulse pressure (PP; E andF) per decade by sex and age. Points are �BP vs mean obser-vation age (Table 2, step 1). Lines are spline fits and 95% CIsfor the slopes as a function of mean observation age, estimatedwith a generalized additive model (Table 2, step 2).
Gurven et al Blood Pressure Change With Age and Modernization 5
at CONS CALIFORNIA DIG LIB on May 21, 2012http://hyper.ahajournals.org/Downloaded from
from town was associated with lower SBP (���0.30 per 10km) and a greater �PP (��0.08 mm/10 years per 10 km).Fluent Spanish speakers had lower PP than those with noSpanish fluency (���1.8 mmHg). Individuals in the lowestsmoking tertile had lower DBP than nonsmokers (���1.43),but other tertiles did not differ from nonsmokers. Smokingand Spanish fluency were not associated with significant�BPs, and schooling was not associated with significantchanges in baseline BP or �BP.
DiscussionAge-related increases in BP are modest among Tsimanecompared with Westerners. BP changes little with age amongTsimane men, whereas a larger increase occurs amongTsimane women. Such increases are not uniform across thepopulation. Longitudinal analyses reveal variability in age-related slopes, and variability increases with age, particularlyamong women. Overall, hypertension prevalence is lowamong Tsimane, and point observations of hypertension arenot sustained over time.
To place the Tsimane age-related increase in context, wecompared Tsimane �SBP and �DBP with those from 52populations from Intersalt,21 a cross-sectional study of hyper-tension using standardized methodology among adults aged20 to 59 years (Figure 5). Tsimane slopes were derived froma mixed model with the same controls over the age range 20to 59 years. Tsimane �SBP and �DBP were among thelowest, comparable with those from 4 other subsistencepopulations, the Xingu and Yanomamo of Brazil, Papua NewGuinean highlanders, and rural Kenyans. National popula-tions show �SBPs that are 2 to 8 times higher and �DBPsthat are 2 to 4 times higher than Tsimane. Given their median
level of adult SBP and DBP, Tsimane �BPs were smallerthan that predicted by the regression lines (Figure 5). Overall,Tsimane BP and �BPs were small compared with otherpopulations, even after controlling for BMI (Figure S3).
Despite the minimal age-related increases in BP, TsimaneBP age profiles shared similarities with Western profiles.Women had lower BPs than men at young ages, but beyondage 50 years, women’s BPs equaled men’s. In addition, DBPdeclined at older ages across populations. Explanations forthe late drop in DBP include “burned out” diastolic hyper-tension, reduced cardiac output, and increased large arterialstiffness.6 Burned out hypertension seems unlikely given theDBP decrease in a population with minimal hypertension andlongitudinal BP increase.
Effects of modernization were small and not consistentwith the notion that greater exposure leads to poor healthoutcomes. Although no indicator of modernization predicteda greater age-related increase in BP, BMI had the mostsubstantial effect on BP level. Cohort increases in BMI havebeen linked to reduced physical activity, poor diet, and otherchanges associated with modernization.22 Indeed, �85% ofhypertension diagnoses occur in overweight or obese individ-uals (BMI �25 kg/m2) among Westerners.23 It might beexpected, therefore, that behavioral changes associated withmodernization should impact BP primarily through an indi-cator of obesity, that is, BMI. BMI is almost universallypositively and independently associated with morbidity andmortality from hypertension, cardiovascular, and otherchronic diseases and type 2 diabetes mellitus.24 Greater bodymass increases blood volume and viscosity, impairs pressurenatriuresis, and can lead to renal tubular sodium reabsorp-
Table 3. Comparison of 10-y Increase in BP as Estimated From CS vs L Analyses
Variable Pressure
Men Women
CS All, � CS�5 y, � L�5 y, M� CS All, � CS�5 y, � L�5 y, M�
Age, y
20–39 �SBP �0.33 3.65† 2.09 1.83† 2.59* 1.82
�DBP 2.28‡ 2.22* �3.90 1.61‡ 0.49 �1.93
�PP �2.71‡ 1.32 5.99† 0.11 1.89† 3.75*
40–59 �SBP 2.03* 0.85 0.69 4.36‡ 5.62‡ 2.12
�DBP 0.43 �0.87 �0.72 1.72† 1.91* �0.97
�PP 1.75† 1.67* 1.41 2.83‡ 3.66‡ 3.09
�60 �SBP �2.64 �2.86 �5.71 1.89 0.82 0.45
�DBP �4.08‡ �4.50† �7.26* �0.96 �2.03 �5.07
�PP 1.4 1.65 1.55 3.09* 2.99 5.52
All �SBP 0.91‡ 1.23† 0.32 2.86‡ 3.08‡ 1.81
Ages �DBP 0.93‡ 0.23 �2.99* 0.95‡ 0.72† �1.86
�PP �0.02 0.97‡ 3.31 1.95‡ 2.38‡ 3.67†
CS indicates cross-sectional; L, longitudinal; BP, blood pressure; SBP, systolic BP; DBP, diastolic BP; PP, pulse pressure. CS slopeswere estimated on both the full sample and a subset with repeated observations �5 years apart, controlling for season, pregnancy,repeated measures, and subject identification. For values from CS analyses, parameter estimates (�) are shown; for values from Lanalyses, mean parameters (M�) are shown. Significance is given for a 1-sample t test for results from L analyses and for the modelparameter from CS analyses.
*P�0.05.†P�0.01.‡P�0.001.
6 Hypertension July 2012
at CONS CALIFORNIA DIG LIB on May 21, 2012http://hyper.ahajournals.org/Downloaded from

tion.25 Adipocytes also release angiotensinogen, a precursorof angiotensin.
The effect of a unit change in BMI on BP is similar amongTsimane and Americans (��0.39, 0.13, and 0.26 for SBP,DBP, and PP from the National Health and Nutrition Exam-ination Survey; ��0.61, 0.39, and 0.25 for Tsimane), butTsimane BMI did not increase substantially throughout adult-hood. Although obesity was rare among Tsimane (5.6% ofwomen and 1.6% men age �20 years), overweight was notuncommon, including 27.8% of women and 21.9% of men.Heavy smokers and moderate Spanish speakers with greaterschooling were more likely to be overweight or obese (TableS6). However, BMI was not greater in villages closer to town(Table S7), nor was overweight and obesity more prevalent(Table S6). Even if the average Tsimane was obese, TsimaneBP would not resemble US patterns. Based on the model fromTable 2, a Tsimane woman with US average BMI at ages 40and 70 years would have SBPs of 113 and 117 mmHg,respectively, whereas an American woman with Tsimaneaverage BMI at the same ages would have SBPs of 116 and122 mmHg, respectively (Table S8).
Despite the significant relationship between BMI and BPamong Tsimane, Tsimane display lower median SBP andDBP and lower �SBP and �DBP than expected based oncomparative BMIs of 52 Intersalt populations (Figure S3).
Based on regressions using all of the Intersalt populations,Tsimane �SBP and �DBP from ages 20 to 59 years should be339% and 134% greater, respectively, given their medianBMI of 23.5. One possibility for the low BP given TsimaneBMI is that higher BMI among lean, active forager-horticulturalists reflects greater muscle rather than fat mass.However, this is not the case; BMI is highly correlated withbody fat percentage in men and women across the BMI range(men, r�0.76, P�0.0001; women, r�0.55, P�0.0001; Fig-ure S4). Body fat percentage per unit increase in BMI alsoappears similar among Tsimane and US adults (1.5% fromBMI of 20–35; Figure S4 for Tsimane women; Reference 26for US women).
Unlike patterns documented in the developed world,23
Tsimane BMI reached its peak by age 45 years and thendeclined by 1.0 kg/m2 by age 70 years (Table S6), althoughbody fat percentage increased with age (men r�0.27,P�0.0001; women, r�0.13, P�0.0001). So, although wefind evidence that modernization may lead to higher BMIamong Tsimane, only cumulative smoking increased withage, whereas schooling and Spanish fluency were greateramong younger adults. The net effect is a decline in BMI atlate ages and only a minimal age-related increase in BP.
−10
−5
0
5
10 x= 0.18x~= 0.20
var= 3.65
x= 0.21x~= 0.48
var= 7.52
x= 0.05x~= 0.53
var= 11.48
x= 0.21x~= 0.43
var= 3.76
x= 0.07x~= 0.18
var= 3.53
x=−0.57x~=−0.04
var= 8.57
∆ SB
P / D
ecad
e
A
−10
−5
0
5
10 x=−0.19x~=−0.19
var= 2.11
x=−0.10x~= 0.18
var= 3.24
x=−0.51x~=−0.83
var= 3.55
x=−0.39x~=−0.28
var= 3.44
x=−0.07x~= 0.03
var= 3.06
x=−0.73x~=−0.40
var= 2.25
∆ D
BP
/ Dec
ade
B
−10
−5
0
5
10
22 − 39 40 − 59 60 +
x= 0.38x~= 0.48
var= 2.70
x= 0.31x~= 0.43
var= 4.54
x= 0.55x~= 0.83
var= 6.21
x= 0.60x~= 0.64
var= 2.56
x= 0.14x~= 0.34
var= 2.31
x= 0.15x~= 0.27
var= 5.47
∆ PP
/ D
ecad
e
C
F (n=120) M (n=78) F (n=85) M (n=84) F (n=21) M (n=28)
Age Group
Figure 4. Distribution of individual systolic blood pressure (BP;�SBP; A), diastolic BP (�DBP; B), and pulse pressure (�PP; C)per decade by sex and age. Females are shown on the left(gray) and males on the right (white). Only individuals with �2measures and �5 years between their earliest and latest BPmeasures were included. Box plots show the first to third quar-tile range. Distributions are smoothed density plots. White cir-cles indicate medians.
y = 0.15x - 13.54R2 = 0.24
0
2
4
6
8
10
12
14
80 85 90 95 100 105 110 115 120 125 130 135 140median SBP
SBP
slop
e w
ith a
ge (p
er 1
0 yr
s)
y = 0.08x - 2.19R2 = 0.09
0
1
2
3
4
5
6
7
8
50 55 60 65 70 75 80 85 90median DBP
DB
P sl
ope
with
age
(per
10
yrs)
A
B
Figure 5. Increase in (A) systolic blood pressure (SBP) and (B)diastolic blood pressure (DBP) per decade. Cross-cultural sam-ple includes 52 populations from the Intersalt study (ages 20–59years).21 Tsimane slope estimates are represented by blackdots. Other populations inside ovals include the Brazilian Yano-mamo and Xingu Amerindians, Papua New Guinea highlanders,and Kenyans.
Gurven et al Blood Pressure Change With Age and Modernization 7
at CONS CALIFORNIA DIG LIB on May 21, 2012http://hyper.ahajournals.org/Downloaded from
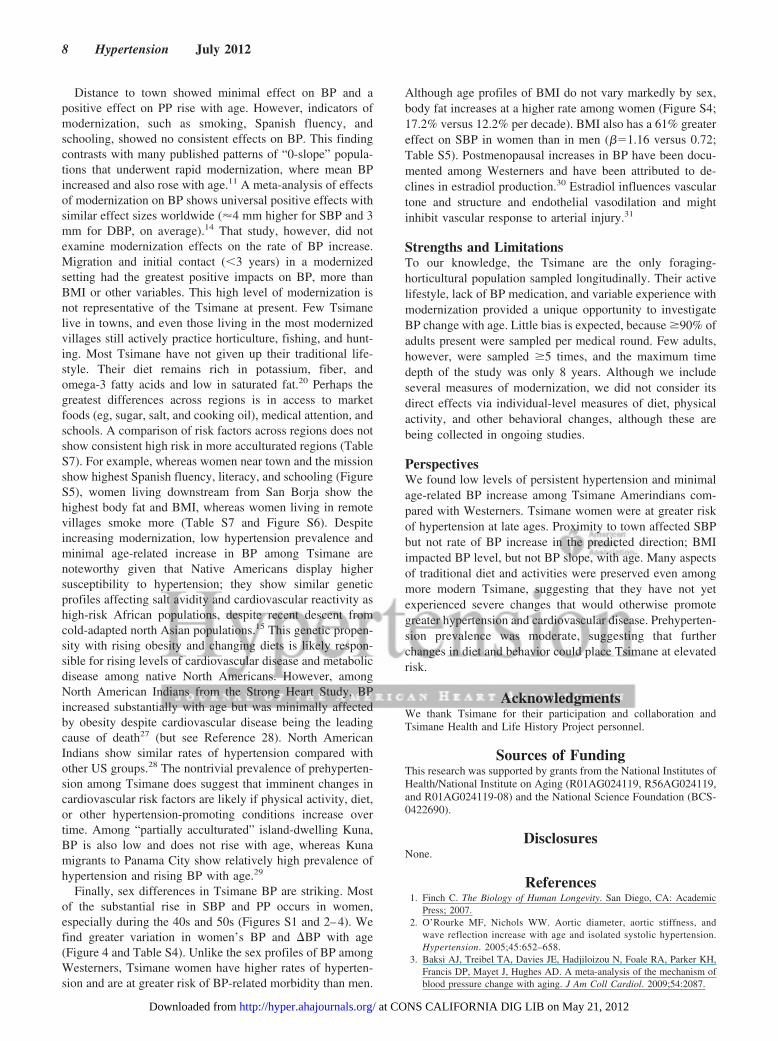
Distance to town showed minimal effect on BP and apositive effect on PP rise with age. However, indicators ofmodernization, such as smoking, Spanish fluency, andschooling, showed no consistent effects on BP. This findingcontrasts with many published patterns of “0-slope” popula-tions that underwent rapid modernization, where mean BPincreased and also rose with age.11 A meta-analysis of effectsof modernization on BP shows universal positive effects withsimilar effect sizes worldwide (�4 mm higher for SBP and 3mm for DBP, on average).14 That study, however, did notexamine modernization effects on the rate of BP increase.Migration and initial contact (�3 years) in a modernizedsetting had the greatest positive impacts on BP, more thanBMI or other variables. This high level of modernization isnot representative of the Tsimane at present. Few Tsimanelive in towns, and even those living in the most modernizedvillages still actively practice horticulture, fishing, and hunt-ing. Most Tsimane have not given up their traditional life-style. Their diet remains rich in potassium, fiber, andomega-3 fatty acids and low in saturated fat.20 Perhaps thegreatest differences across regions is in access to marketfoods (eg, sugar, salt, and cooking oil), medical attention, andschools. A comparison of risk factors across regions does notshow consistent high risk in more acculturated regions (TableS7). For example, whereas women near town and the missionshow highest Spanish fluency, literacy, and schooling (FigureS5), women living downstream from San Borja show thehighest body fat and BMI, whereas women living in remotevillages smoke more (Table S7 and Figure S6). Despiteincreasing modernization, low hypertension prevalence andminimal age-related increase in BP among Tsimane arenoteworthy given that Native Americans display highersusceptibility to hypertension; they show similar geneticprofiles affecting salt avidity and cardiovascular reactivity ashigh-risk African populations, despite recent descent fromcold-adapted north Asian populations.15 This genetic propen-sity with rising obesity and changing diets is likely respon-sible for rising levels of cardiovascular disease and metabolicdisease among native North Americans. However, amongNorth American Indians from the Strong Heart Study, BPincreased substantially with age but was minimally affectedby obesity despite cardiovascular disease being the leadingcause of death27 (but see Reference 28). North AmericanIndians show similar rates of hypertension compared withother US groups.28 The nontrivial prevalence of prehyperten-sion among Tsimane does suggest that imminent changes incardiovascular risk factors are likely if physical activity, diet,or other hypertension-promoting conditions increase overtime. Among “partially acculturated” island-dwelling Kuna,BP is also low and does not rise with age, whereas Kunamigrants to Panama City show relatively high prevalence ofhypertension and rising BP with age.29
Finally, sex differences in Tsimane BP are striking. Mostof the substantial rise in SBP and PP occurs in women,especially during the 40s and 50s (Figures S1 and 2–4). Wefind greater variation in women’s BP and �BP with age(Figure 4 and Table S4). Unlike the sex profiles of BP amongWesterners, Tsimane women have higher rates of hyperten-sion and are at greater risk of BP-related morbidity than men.
Although age profiles of BMI do not vary markedly by sex,body fat increases at a higher rate among women (Figure S4;17.2% versus 12.2% per decade). BMI also has a 61% greatereffect on SBP in women than in men (��1.16 versus 0.72;Table S5). Postmenopausal increases in BP have been docu-mented among Westerners and have been attributed to de-clines in estradiol production.30 Estradiol influences vasculartone and structure and endothelial vasodilation and mightinhibit vascular response to arterial injury.31
Strengths and LimitationsTo our knowledge, the Tsimane are the only foraging-horticultural population sampled longitudinally. Their activelifestyle, lack of BP medication, and variable experience withmodernization provided a unique opportunity to investigateBP change with age. Little bias is expected, because �90% ofadults present were sampled per medical round. Few adults,however, were sampled �5 times, and the maximum timedepth of the study was only 8 years. Although we includeseveral measures of modernization, we did not consider itsdirect effects via individual-level measures of diet, physicalactivity, and other behavioral changes, although these arebeing collected in ongoing studies.
PerspectivesWe found low levels of persistent hypertension and minimalage-related BP increase among Tsimane Amerindians com-pared with Westerners. Tsimane women were at greater riskof hypertension at late ages. Proximity to town affected SBPbut not rate of BP increase in the predicted direction; BMIimpacted BP level, but not BP slope, with age. Many aspectsof traditional diet and activities were preserved even amongmore modern Tsimane, suggesting that they have not yetexperienced severe changes that would otherwise promotegreater hypertension and cardiovascular disease. Prehyperten-sion prevalence was moderate, suggesting that furtherchanges in diet and behavior could place Tsimane at elevatedrisk.
AcknowledgmentsWe thank Tsimane for their participation and collaboration andTsimane Health and Life History Project personnel.
Sources of FundingThis research was supported by grants from the National Institutes ofHealth/National Institute on Aging (R01AG024119, R56AG024119,and R01AG024119-08) and the National Science Foundation (BCS-0422690).
DisclosuresNone.
References1. Finch C. The Biology of Human Longevity. San Diego, CA: Academic
Press; 2007.2. O’Rourke MF, Nichols WW. Aortic diameter, aortic stiffness, and
wave reflection increase with age and isolated systolic hypertension.Hypertension. 2005;45:652–658.
3. Baksi AJ, Treibel TA, Davies JE, Hadjiloizou N, Foale RA, Parker KH,Francis DP, Mayet J, Hughes AD. A meta-analysis of the mechanism ofblood pressure change with aging. J Am Coll Cardiol. 2009;54:2087.
8 Hypertension July 2012
at CONS CALIFORNIA DIG LIB on May 21, 2012http://hyper.ahajournals.org/Downloaded from

4. Wolf-Maier K, Cooper RS, Banegas JR, Giampaoli S, Hense H-W,Joffres M, Kastarinen M, Poulter N, Primatesta P, Rodriguez-Artalejo F,Stegmayr B, Thamm M, Tuomilehto J, Vanuzzo D, Vescio F. Hyper-tension prevalence and blood pressure levels in 6 European Countries,Canada, and the United States. JAMA. 2003;289:2363–2369.
5. Whelton PK. Epidemiology of hypertension. Lancet. 1994;344:101.6. Franklin SS, Gustin W, Wong ND, Larson MG, Weber MA, Kannel WB,
Levy D. Hemodynamic patterns of age-related changes in blood pressure:the Framingham Heart Study. Circulation. 1997;96:308.
7. Coylewright M, Reckelhoff JF, Ouyang P. Menopause and hypertension:an age-old debate. Hypertension. 2008;51:952–959.
8. Chobanian AV, Bakris GL, Black HR, Cushman WC, Green LA, Izzo JL,Jones DW, Materson BJ, Oparil S, Wright JT. Seventh report of the JointNational Committee on Prevention, Detection, Evaluation, and Treatmentof High Blood Pressure. Hypertension. 2003;42:1206–1252.
9. James GD, Baker PT. Human population biology and blood pressure:evolutional and ecological considerations and interpretations of popu-lation studies. In: Laragh JH, Brenner BM, eds. Hypertension, Patho-physiology, Diagnosis and Management, 2nd ed. New York, NY: RavenPress; 1995:115–125.
10. Carvalho JJ, Baruzzi RG, Howard PF, Poulter N, Alpers MP, Franco LJ,Marcopito LF, Spooner VJ, Dyer AR, Elliot P. Blood pressure in fourremote populations in the INTERSALT Study. Hypertension. 1989;14:238–246.
11. Stevenson DR. Blood pressure and age in cross-cultural perspective.Human Biology. 1999;71:529.
12. Fleming-Moran M, Coimbra CEA Jr. Blood pressure studies amongAmazonian native populations: a review from an epidemiological per-spective. Soc Sci Med. 1990;31:593–601.
13. Waldron I, Nowotarski M, Freimer M, Henry JP, Post N, Witten C.Cross-cultural variation in blood pressure: a quantitative analysis of therelationships of blood pressure to cultural characteristics, salt con-sumption and body weight. Soc Sci Med. 1982;16:419–430.
14. Steffen PR, Smith TB, Larson M, Butler L. Acculturation to Westernsociety as a risk factor for high blood pressure: a meta-analytic review.Psychosom Med. 2006;68:386–397.
15. Young JH, Chang Y-PC, Kim JD, Chretien J-P, Klag MJ, Levine MA,Ruff CB, Wang N-Y, Chakravarti A. Differential susceptibility to hyper-tension is due to selection during the Out-of-Africa expansion. PLoSGenetics. 2005;1:e82.
16. Gurven M, Kaplan H, Zelada Supa A. Mortality experience of TsimaneAmerindians: regional variation and temporal trends. Am J Hum Biol.2007;19:376–398.
17. Wood SN. Generalized Additive Models: An Introduction With R. BocaRaton, FL: CRC Press; 2006.
18. Hastie T, Tibshirani R. Generalized additive models. Stat Sci. 1986;1:297–310.
19. Verbeke G, Molenberghs G. Linear Mixed Models for Longitudinal Data.New York, NY: Springer Verlag; 2009.
20. Gurven M, Kaplan H, Winking J, Eid D, Vasunilashorn S, Kim J, FinchC, Crimmins E. Inflammation and infection do not promote arterial agingand cardiovascular disease among lean Tsimane forager-horticulturalists.PLoS One. 2009;4:e6590.
21. Intersalt CRG. Intersalt: An International Study of Electrolyte Excretionand Blood Pressure–results for 24 hour urinary sodium and potassiumexcretion. BMJ. 1988;297:319–328.
22. Asia Pacific Cohort Studies C. Body mass index and cardiovasculardisease in the Asia-Pacific Region: an overview of 33 cohorts involving310,000 participants. Int J Epidemiol. 2004;33:751–758.
23. Haslam DW, James WPT. Obesity. Lancet. 2005;366:1197–1209.24. Pi-Sunyer FX. Medical hazards of obesity. Ann Intern Med. 1993;119:
655–660.25. Hall JE. The kidney, hypertension and obesity. Hypertension. 2003;41:
625–633.26. Gallagher D, Heymsfield SB, Heo M, Jebb SA, Murgatroyd PR,
Sakamoto Y. Healthy percentage body fat ranges: an approach fordeveloping guidelines based on body mass index. Am J Clin Nutr. 2000;72:694–701.
27. Howard BV, Lee ET, Yeh JL, Go O, Fabsitz RR, Devereux RB, WeltyTK. hypertension in adult American Indians. Hypertension. 1996;28:256–264.
28. Wang W, Lee ET, Fabsitz RR, Devereux R, Best L, Welty TK, HowardBV. A longitudinal study of hypertension risk factors and their relation tocardiovascular disease: the Strong Heart Study. Hypertension. 2006;47:403–409.
29. Hollenberg NK, Martinez G, McCullough M, Meinking T, Passan D,Preston M, Rivera A, Taplin D, Vicaria-Clement M. Aging, acculturation,salt intake, and hypertension in the Kuna of Panama. Hypertension.1997;29:171.
30. Dubey RK, Oparil S, Imthurn B, Jackson EK. Sex hormones and hyper-tension. Cardiovasc Res. 2002;53:688–708.
31. Reckelhoff JF. Gender differences in the regulation of blood pressure.Hypertension. 2001;37:1199–1208.
Novelty and Significance
What Is New?● We provide the first systematic test of whether blood pressure increases
with age in a subsistence population using longitudinal and cross-sectional data.
● We test whether modernization affects blood pressure and its rise with age.
What Is Relevant?● Persistent hypertension is minimal (�3%) among adults aged �40
years, despite high levels of inflammation and variable experience withmodernization.
● Hypertension and age-related increase in blood pressure are moreprevalent among Tsimane women, unlike sex differences observed inWestern countries.
Summary
An increase in blood pressure with age is not a fundamentalfeature of human aging. Effects of age and modernization areminimal on blood pressure and its rise. The lean physique, activelifestyle, and traditional diet may protect against hypertension inspite of increasing socioeconomic change.
Gurven et al Blood Pressure Change With Age and Modernization 9
at CONS CALIFORNIA DIG LIB on May 21, 2012http://hyper.ahajournals.org/Downloaded from

ONLINE SUPPLEMENT
DOES BLOOD PRESSURE INEVITABLY RISE WITH AGE? LONGITUDINAL EVIDENCE AMONG FORAGER-HORTICULTURALISTS
Michael Gurven*, Professor
Integrative Anthropological Sciences Program University of California-Santa Barbara
Santa Barbara, CA 93106 Telephone: 805-893-2202; Fax: 805-893-8707
Aaron D. Blackwell Integrative Anthropological Sciences Program
University of California-Santa Barbara Santa Barbara, CA 93106
Daniel Eid Rodriguez Universidad Mayor de San Simón
Departamento de Medicina Cochabamba, Bolivia [email protected]
Jonathan Stieglitz
Department of Anthropology University of New Mexico Albuquerque, NM 87131
Hillard Kaplan Department of Anthropology University of New Mexico Albuquerque, NM 87131
Short title: Blood pressure change with age and modernization
*To whom all correspondence should be sent
at CONS CALIFORNIA DIG LIB on May 21, 2012http://hyper.ahajournals.org/Downloaded from

METHODS Village sample. Villages can be grouped based on decreasing access to market: Near Town (n=752 adults, 17 villages, average 18 km from San Borja), Lower Maniqui River (n=330, 6 villages, 23 km), Central River (n=261, 16 villages, 40 km), road to Rurrenabaque (n=70, 8 villages, 48 km), Forest (n=318, 11 villages, 56 km), Upper Maniqui River (n=276, 9 villages, 64 km), Mission (n=203, 1 village, 66 km), and Quiquibey River (n=59, 8 villages, 74 km). The following villages were added in 2010 and only sampled once: all villages along the road to Rurrenbaque, all villages along the Quiquibey River, 12 of the Near Town villages, one Forest village, 15 Near River villages, and one Lower Maniqui River village. Medical rounds. Data were collected during annual medical exams of the Tsimane Health and Life History Project. From 2002 to 2004, a mobile medical team made annual visits to 18 villages, obtaining blood pressure measurements during routine medical exams. Efforts were made to sample all present individuals. An additional 7 villages were sampled from 2005 to 2009. From 2010 to 2011, medical exams on all adults age 40+ were conducted in a clinic in San Borja. An additional 45 villages were added to the sample in 2010. Adults from these 45 villages were only sampled once. Clinical exams are given by Bolivian physicians with the assistance of bilingual Spanish-Tsimane translators. Additional details are given here1. Age estimation. Ages were assessed by cross-checked demographic interviews, as has been described elsewhere2. These include using known ages from written records, relative age lists, dated events, photo comparisons of people with known ages and cross-checking of information from independent interviews of kin. In constructing relative age lists, multiple informants were used for each five year age grouping of individuals, and inconsistencies were investigated and resolved. The photo comparison method used a sample of 70 photos of individuals with known ages. For older individuals, 50 photos of men and women from ages 50-75 were used. Each of these methods provides a roughly independent age estimate. When all estimates yield a date of birth within a 3-year range, the average was used unless one or two estimates were judged to be superior. DATA ANALYSIS Estimation of individual rates of blood pressure change. To estimate individual longitudinal rates of change, BP values and time points were first centered on the mean blood pressure value and median time-point for a given individual, such that blood pressures were recoded as positive or negative changes from the subject’s mean, and times were recorded as days before or after the subject’s median reading date. Linear models were fit to blood pressure change including subject PID, a subject-by-time interaction, season of exam, and pregnancy status as control variables. Fitting all slopes in one model, instead of separate models for each subject, facilitated estimation of population values for control variables. Parameter values for rates of blood pressure changes were then obtained from the subject-by-time interaction parameters. Slopes based on only two data points had large variances and showed evidence of regression to the mean. In order to analyze these slopes we therefore had to determine how many data points were required for an accurate slope estimate. To examine the effect of number of measures on slope estimates we performed a simple simulation. Beginning with individuals with six or more observations we randomly sampled different numbers of consecutive observations from each individual. We then examined the standard deviation of the slopes obtained. The results show that the standard
at CONS CALIFORNIA DIG LIB on May 21, 2012http://hyper.ahajournals.org/Downloaded from
deviation around the mean slope declines with increasing number of observations (Figure S7). For our data, however, requiring six or more observations would drastically decrease sample size. We therefore estimated the standard error of the mean that would be obtained from our sample, given different inclusion criteria to identify the “optimal” trade-off between accuracy and sample size. We found that the standard error was minimized by including only individuals with five or more observations. For longitudinal analyses we therefore use this inclusion criterion.
REFERENCES
1 Gurven, M., Kaplan, H., Winking, J., Rodriguez, D., Vasunilashorn, F., Kim, J., Finch, C., and Crimmins, E. Inflammation and infection do not promote arterial aging and cardiovascular disease among lean Tsimane forager-horticulturalists. PLoS One. 2009; 4:e6590.
2 Gurven, M., Kaplan, H. & Zelada Supa, A. Mortality experience of Tsimane Amerindians: regional variation and temporal trends. American Journal of Human Biology. 2007; 19:376-398.
at CONS CALIFORNIA DIG LIB on May 21, 2012http://hyper.ahajournals.org/Downloaded from

Table S1. Number of repeat samples and hypertension diagnoses across repeat sampling
# of Times Sampled
Age Group 1 2 3 4 5 6 7 8 9 Total 20-29 193 164 122 105 54 33 11 7 0 68930-39 61 51 67 96 52 36 28 5 3 39940-49 236 24 43 47 74 32 22 11 2 49150-59 120 16 18 28 28 17 16 5 0 24860-69 108 12 24 11 22 9 8 2 0 19670+ 153 12 10 21 20 3 3 3 0 225Total 871 279 284 308 250 130 88 33 5 2248Total Obs. 871 558 852 1232 1250 780 616 264 45 6468 Never Hyper 92.2% 93.5% 88.4% 91.9% 86.4% 80.0% 84.1% 72.7% 40.0% 89.8%Hyper Only Once 7.8% 6.5% 7.7% 6.2% 10.0% 16.9% 9.1% 18.2% 40.0% 8.5%Hyper More Than - 0.0% 3.9% 1.9% 3.6% 3.1% 6.8% 9.1% 20.0% 2.9%Hyper Always 7.8% 0.0% 0.4% 0.0% 0.0% 0.0% 0.0% 0.0% 0.0% 3.1%
at CONS CALIFORNIA DIG LIB on May 21, 2012http://hyper.ahajournals.org/Downloaded from
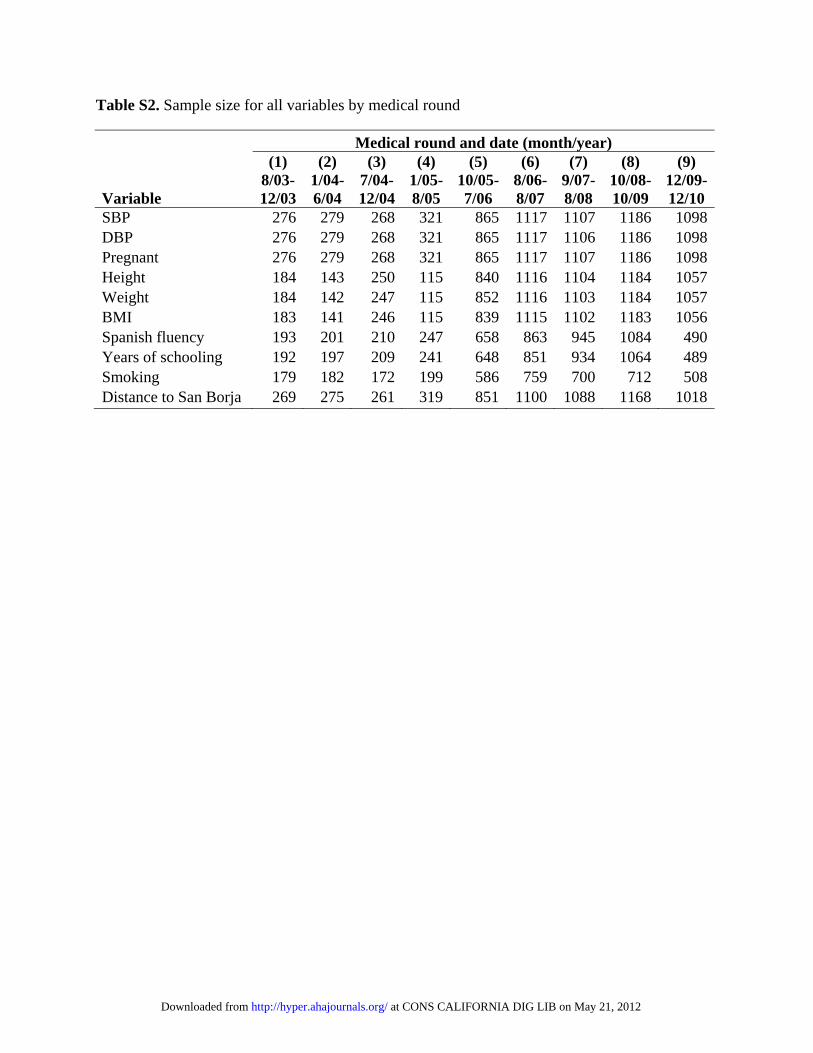
Table S2. Sample size for all variables by medical round
Medical round and date (month/year)
Variable
(1) 8/03-12/03
(2) 1/04-6/04
(3) 7/04-12/04
(4) 1/05-8/05
(5) 10/05-7/06
(6) 8/06-8/07
(7) 9/07-8/08
(8) 10/08-10/09
(9) 12/09-12/10
SBP 276 279 268 321 865 1117 1107 1186 1098DBP 276 279 268 321 865 1117 1106 1186 1098Pregnant 276 279 268 321 865 1117 1107 1186 1098Height 184 143 250 115 840 1116 1104 1184 1057Weight 184 142 247 115 852 1116 1103 1184 1057BMI 183 141 246 115 839 1115 1102 1183 1056Spanish fluency 193 201 210 247 658 863 945 1084 490Years of schooling 192 197 209 241 648 851 934 1064 489Smoking 179 182 172 199 586 759 700 712 508Distance to San Borja 269 275 261 319 851 1100 1088 1168 1018
at CONS CALIFORNIA DIG LIB on May 21, 2012http://hyper.ahajournals.org/Downloaded from

Table S3. Two-stage mixed models. Stage 1 models have a random slope and intercept for each individual in the study, with blood pressure (SBP, DBP, PP) as the dependent variable. Stage 2 models are generalized additive models that use the individual random-effect slopes plus population main effects from Stage 1 as the dependent variable to model associations with individual level slope, with the overall age-pattern in the slopes modeled with thin-plate splines. Parameter values are in units of change per decade. Only individuals with data for all variables and at least two observations were included (n=695 individuals, n=2,876 observations).
Stage 1 Main effects (mm Hg) SBP DBP PP
B SE p B SE p B SE p Constant 94.5 2.4 <0.01 57.6 1.6 <0.01 36.3 1.7 <0.01 Sex (Male) 2.7 1.0 <0.01 1.4 0.6 0.02 1.1 0.7 0.11 BMI 0.6 0.1 <0.01 0.4 0.06 <0.01 0.3 0.07 <0.01 Pregnant -2.8 1.0 <0.01 -3.3 0.7 <0.01 0.4 0.8 0.63 Smoking tercile 1st -1.2 0.9 0.21 -1.4 0.6 0.02 0.21 0.7 0.75 2nd 1.1 1.2 0.34 0.5 0.8 0.55 1.1 0.8 0.21 3rd 0.5 1.3 0.68 -0.4 0.9 0.62 1.2 0.9 0.19 Spanish fluency None 0 0 0 Moderate 1.1 0.8 0.14 0.5 0.5 0.32 0.5 0.6 0.38 Fluent -1.1 1.0 0.27 0.4 0.7 0.51 -1.8 0.7 0.01 Years of Schooling 0.1 0.1 0.58 0.1 0.08 0.23 0.01 0.09 0.91 Distance to San Borja (per 10 km) -0.3 0.1 0.04 -0.1 0.1 0.29 -0.2 0.1 0.13 Season Wet 0 0 0 Dry 3.9 0.6 <0.01 2.8 0.4 <0.01 1.0 0.5 0.04 Intermediate -0.6 0.59 0.33 0.02 0.4 0.97 -0.6 0.5 0.26 edf Ref.df p edf Ref.df p edf Ref.df p Age Splines Female 3.1 3.1 <0.01 1 1 <0.01 3.4 3.4 <0.01 Male 3.4 3.4 0.03 2.6 2.6 <0.01 4.2 4.2 <0.01
Table S3 continued on next page
at CO
NS C
AL
IFOR
NIA
DIG
LIB
on May 21, 2012
http://hyper.ahajournals.org/D
ownloaded from

Table S3 continued
Stage 2 BP slopes (mm Hg/decade) SBP DBP PP
B SE p B SE p B SE p Constant 2.0 0.4 <0.01 0.9 0.2 <0.01 0.6 0.4 0.12 Sex (Male) -2.7 0.1 <0.01 0.03 0.07 0.65 -3.0 0.1 <0.01 BMI 0.02 0.01 0.27 0.00 0.01 0.91 0.03 0.02 0.07 Smoking tercile 1st -0.1 0.1 0.37 -0.03 0.07 0.63 -0.2 0.1 0.16 2nd -0.01 0.2 0.97 0.1 0.08 0.25 -0.1 0.2 0.41 3rd -0.02 0.2 0.90 0.05 0.09 0.59 -0.08 0.2 0.65 Spanish fluency None Moderate 0.05 0.1 0.65 0.07 0.06 0.26 0.01 0.1 0.93 Fluent 0.08 0.1 0.55 0.06 0.07 0.41 0.2 0.2 0.28 Years of schooling 0.01 0.02 0.63 0.01 0.01 0.63 0.01 0.02 0.60 Distance to San Borja (per 10 km) 0.03 0.02 0.15 0.01 0.01 0.70 0.08 0.02 <0.01 edf Ref.df p edf Ref.df p edf Ref.df p Age Splines Female 7.2 8.2 <0.01 6.1 7.3 0.184 7.5 8.4 <0.01 Male 6.2 7.4 <0.01 2.7 3.4 <0.01 7.6 8.5 <0.01
at CO
NS C
AL
IFOR
NIA
DIG
LIB
on May 21, 2012
http://hyper.ahajournals.org/D
ownloaded from

Table S4. Variance in blood pressure and change in blood pressure by age and sex for Tsimane and NHANES 2005-2006. Cross-sectional (CS) Tsimane values are based only on the largest medical round; slopes were estimated from longitudinal (L) data on individuals with at least five years between first and last observations. P-values represent F-test comparison of variance with a Bonferroni correction for multiple comparisons. p<0.01 comparing Tsimane vs. NHANES BP variance, except for females aged 60+ (p=0.92).
Variance P-value Tsimane NHANES Males vs. Females
Pressures (CS) Slopes (L) Pressures (CS) Pressure Slopes Pressure Measure Age Females Males Females Males Females Male Tsimane Tsimane NHANES SBP 22 - 39 68.9 60.9 3.76 3.73 102.9 140.8 1.00 1.00 <0.01
40-59 188.0 87.6 7.55 3.49 320.6 252.7 <0.01 <0.01 <0.01 60+ 454.7 115.7 11.52 8.55 600.4 426.9 <0.01 1.00 <0.01
DBP 22 - 39 46.3 70.1 2.12 3.31 119.4 167.8 <0.01 0.11 <0.01 40-59 71.1 62.2 3.22 2.99 125.9 153.4 1.00 1.00 0.05 60+ 157.1 83.8 3.55 2.25 301.4 203.8 0.05 1.00 <0.01
PP 22 - 39 47.6 80.3 2.65 2.62 127.9 205.2 <0.01 1.00 <0.01 40-59 95.1 69.0 4.55 2.30 241.2 189.3 0.17 <0.01 <0.01 60+ 190.5 89.7 6.27 5.46 685.1 444.5 0.01 1.00 <0.01
at CO
NS C
AL
IFOR
NIA
DIG
LIB
on May 21, 2012
http://hyper.ahajournals.org/D
ownloaded from
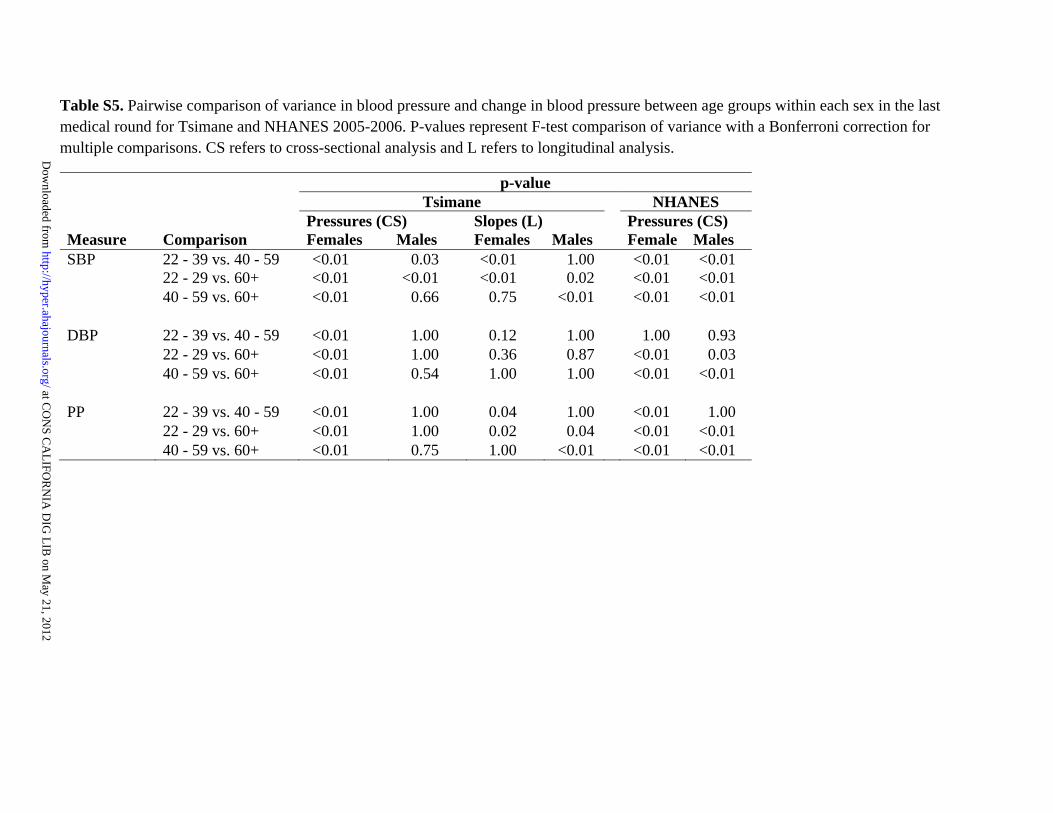
Table S5. Pairwise comparison of variance in blood pressure and change in blood pressure between age groups within each sex in the last medical round for Tsimane and NHANES 2005-2006. P-values represent F-test comparison of variance with a Bonferroni correction for multiple comparisons. CS refers to cross-sectional analysis and L refers to longitudinal analysis.
p-value Tsimane NHANES
Pressures (CS) Slopes (L) Pressures (CS) Measure Comparison Females Males Females Males Female Males SBP 22 - 39 vs. 40 - 59 <0.01 0.03 <0.01 1.00 <0.01 <0.01
22 - 29 vs. 60+ <0.01 <0.01 <0.01 0.02 <0.01 <0.01 40 - 59 vs. 60+ <0.01 0.66 0.75 <0.01 <0.01 <0.01
DBP 22 - 39 vs. 40 - 59 <0.01 1.00 0.12 1.00 1.00 0.93
22 - 29 vs. 60+ <0.01 1.00 0.36 0.87 <0.01 0.03 40 - 59 vs. 60+ <0.01 0.54 1.00 1.00 <0.01 <0.01
PP 22 - 39 vs. 40 - 59 <0.01 1.00 0.04 1.00 <0.01 1.00
22 - 29 vs. 60+ <0.01 1.00 0.02 0.04 <0.01 <0.01 40 - 59 vs. 60+ <0.01 0.75 1.00 <0.01 <0.01 <0.01
at CO
NS C
AL
IFOR
NIA
DIG
LIB
on May 21, 2012
http://hyper.ahajournals.org/D
ownloaded from

TABLE S6. Probability of overweight or obesity (BMI>=25 kg/m2) and obesity (BMI>=30 kg/m2) in mixed-effects regression models with random intercept and age parameters, controlling for physician, medical round, season, and pregnancy status (n=3,411 observations for 1,136 individuals)
Probability of overweight or obese Probability of obese
Predictor Odds Ratio
95% Wald Odds Ratio
95% Wald Confidence Limits P
Confidence Limits p
Age 1.2 <0.01 1.2 <0.01 Age2 0.99 <0.01 0.99 <0.01 Sex (Female) 1.8 1.4 2.5 <0.01 6.3 3.0 13.1 <0.01 Pregnant 1.7 1.2 2.5 <0.01 1.4 0.7 2.9 0.32 Region Downriver 1.7 1.3 2.4 <0.01 1.5 0.8 2.9 0.04 Mission 0.8 0.6 1.2 0.04 0.5 0.2 1.1 0.03 Forest 1.2 0.8 1.7 0.46 1.2 0.6 2.6 0.32 Upriver (vs. Near Town) 0.9 0.6 1.2 0.08 0.9 0.4 1.9 0.93 Spanish fluency None 0.5 0.4 0.7 <0.01 0.5 0.3 1.1 <0.01 Moderate (vs. Fluent) 1.1 0.8 1.4 <0.01 1.4 0.7 2.5 <0.01 Years of schooling 1.1 1.04 1.1 <0.01 1.1 1.01 1.2 0.03 Smoking Low 1.2 0.9 1.6 0.81 0.99 0.5 1.9 0.43 Moderate 1.1 0.8 1.6 0.77 0.5 0.2 1.5 0.03 High 1.1 0.8 1.6 0.66 1.3 0.5 3.3 0.8 Unknown (vs. None) 1.6 0.96 2.6 0.15 4.03 2.0 8.3 <0.01
at CO
NS C
AL
IFOR
NIA
DIG
LIB
on May 21, 2012
http://hyper.ahajournals.org/D
ownloaded from

TABLE S7. Regional differences in hypertension risk factors by sex. Yellow refers to region(s) with highest potential risk. Blue refers to region(s) with lowest expected risk.
Females Males
Variable
Forest
(57 km)
Upriver
(62 km)
Downriver
(22 km)
Fatima
(66 km)
Near Town
(18 km) p
Forest
(57 km)
Upriver
(62 km)
Downriver
(22 km)
Fatima
(66 km)
Near Town
(18 km) p Age (years) 38.6 37.2 38.5 37.0 38.3 ns 38.9 38.5 40.7 38.4 40.4 * Height (cm) 151.0 150.4 150.9 150.9 150.9 ns 162.2 161.7 162.2 163.7 163.2 ‡ Weight (kg) 54.3 52.2 55.6 53.7 54.8 ‡ 61.0 61.0 61.8 63.7 63.5 ‡ Body fat (%) 25.7 24.1 26.3 24.8 24.9 ‡ 16.6 16.4 17.3 18.1 16.4 ‡ BMI (kg/m2) 23.8 23.1 24.4 23.5 24.0 ‡ 23.2 23.3 23.5 23.8 23.8 ‡ Schooling (years) 0.2 0.8 0.8 2.3 2.1 ‡ 0.9 1.9 1.9 3.0 4.5 ‡ Spanish fluency (%)
None 88.5 71.3 65.4 49.9 30.2 ‡ 55.4 23.1 19.3 16.7 8.9 ‡ Moderate 10.8 25.1 29.0 33.3 36.1 35.8 46.0 43.0 58.3 31.4 Fluent 0.7 3.6 5.7 16.9 33.7 8.9 30.9 37.7 25.0 59.7
Smoking (%) None 66.4 71.2 70.4 80.5 83.3 ‡ 4.2 21.0 14.8 16.8 12.6 ‡ Low 22.9 13.5 13.2 7.1 8.3 17.8 21.6 19.6 12.4 25.0 Moderate 7.3 5.5 6.4 3.7 5.0 33.0 17.7 30.7 23.5 33.5 High 2.0 4.9 0.0 0.0 1.2 42.1 35.1 22.6 46.0 25.9
SBP (mm Hg) 110.0 103.2 108.1 108.0 106.9 ‡ 113.9 110.3 113.3 113.0 112.0 ‡ DBP (mm Hg) 68.5 64.2 66.4 68.1 66.1 ‡ 70.4 67.5 68.6 70.8 67.7 ‡ PP (mm Hg) 41.5 39.0 41.7 39.9 40.9 ‡ 43.5 42.8 44.6 42.2 44.2 † n (cases) 492 515 471 463 939 434 467 463 417 817
*p<0.05, †p<0.01, ‡p<0.001, ns=not significant
at CO
NS C
AL
IFOR
NIA
DIG
LIB
on May 21, 2012
http://hyper.ahajournals.org/D
ownloaded from

at CO
NS C
AL
IFOR
NIA
DIG
LIB
on May 21, 2012
http://hyper.ahajournals.org/D
ownloaded from

Table S8. Blood Pressure at average U.S. and Tsimane body mass index (BMI), estimated from models in Table 2 and Figure 2. Calculated With Tsimane Average BMI Average
BMI NHANES Tsimane
Sex/Age SBP DBP SBP DBP Female
Age 40 24.29 113.29 70.25 112.73 70.03 Age 70 23.07 135.98 65.99 117.02 70.99
Male Age 40 24.15 120.22 73.85 112.63 69.97 Age 70 23.20 131.02 67.76 117.11 71.05
Calculated With US Average BMI Average
BMI NHANES Tsimane
Sex/Age SBP DBP SBP DBP Female
Age 40 28.56 114.96 70.79 115.72 71.98 Age 70 29.66 138.56 66.82 121.64 74.01
Male Age 40 29.35 122.26 74.50 116.27 72.35 Age 70 28.55 133.11 68.43 120.86 73.50
at CONS CALIFORNIA DIG LIB on May 21, 2012http://hyper.ahajournals.org/Downloaded from

Figure S1. SBP, DBP and PP for last Tsimane medical round (Oct. 2008-2009) and NHANES 2005-2006 for females and males. Boxes encompass the 25th- 75th percentiles, lines indicate the median, and whiskers indicate either the extreme data points or 1.5 times the interquartile range, whichever produces a shorter whisker. Outliers are not shown.
at CONS CALIFORNIA DIG LIB on May 21, 2012http://hyper.ahajournals.org/Downloaded from

Figure S2. Prevalence of hypertension, pre-hypertension and normal tension among (a) females and (b) males during the last medical round (n=1,186 individuals). Sample sizes are in parentheses below age categories.
at CONS CALIFORNIA DIG LIB on May 21, 2012http://hyper.ahajournals.org/Downloaded from

Figure S3. Effects of median adult body mass index (BMI) on median levels of (a) SBP and (b) DBP, and on age-related increases per 10 years of adult age in (c) SBP and (d) DBP, using INTERSALT study (ages 20-59). Tsimane estimates are represented as black dots.
at CONS CALIFORNIA DIG LIB on May 21, 2012http://hyper.ahajournals.org/Downloaded from

FIGURE S4. Body fat percentages as a function of body mass index (BMI) for women and men in largest medical round (Oct. 2008-2009).
y = 1.22x - 11.88R2 = 0.33
y = 1.72x - 16.42R2 = 0.57
0
10
20
30
40
50
60
70
14 16 18 20 22 24 26 28 30 32 34 36 38 40
BMI
% B
ody
Fat
WomenMenLinear (Men)Linear (Women)
at CONS CALIFORNIA DIG LIB on May 21, 2012http://hyper.ahajournals.org/Downloaded from

Figure S5. Spanish ability by sex and distance to San Borja
at CONS CALIFORNIA DIG LIB on May 21, 2012http://hyper.ahajournals.org/Downloaded from

Figure S6. Smoking by sex and distance to San Borja
at CONS CALIFORNIA DIG LIB on May 21, 2012http://hyper.ahajournals.org/Downloaded from

Figure S7. More observations lead to lower deviation in slope estimates. Pressure values from individuals with six or more observations were randomly resampled for 2-6 consecutive observations and a linear line was fit for each individual slope. The graph shows the sample standard deviation in slope estimates for a given number of observations. Note that sample size and subject identities are held constant.
at CONS CALIFORNIA DIG LIB on May 21, 2012http://hyper.ahajournals.org/Downloaded from