Think. Innovate. Rise. - Continental Institute for International ...
Upload
khangminh22Category
view
3download
0

Back to contents >
$2.2 billion Total assets
$182.6 millonAmount spent maintaining, renewing and developing
our networks
11,111 Network projects relating
to customer requests
11,441Maintenance, renewal and
development projects
Lost-time injuriesThree lost-time
injuries compared with seven in 2015
$58.7 million Dividends
94% Powerco customer satisfaction rating
HighlightsFor the 12 months to 31 March 2016
Highlights ................................................ 2
Values ...................................................... 4
Chairman and CEO Introduction ............. 5
Board of Directors ................................... 6
Executive Management Team ................. 7
Corporate Governance Statement .......... 8
Powerco at a glance ................................ 9
Delivering results ................................... 10
Delivering a reliable supply .................... 12
Engaging with customers ...................... 15
Staying safe ........................................... 16
New technology..................................... 18
Caring for the environment .................... 22
In the community ................................... 24
Financials
Statutory Information ............................. 29
Consolidated Statement of Comprehensive Income .................... 30
Consolidated Statement of Changes in Equity .............................31
Consolidated Statement of Financial Position .............................. 32
Consolidated Statement of Cash Flows ........................................ 33
Reconciliation of Profit to Net Cash Flows ..................................... 34
Notes to the Financial Statements ........ 35
Audit Report .......................................... 58
Directory ................................................ 59
28,500 Fault callouts responded to
ReliabilityOutperformed target
by 6% (SAIDI)
436,000Gas and electricity
customer connections

POWERCO LTD Annual Report 2016 5
Chairman and Chief Executive Introduction
On behalf of the Board of Directors and Executive Management Team we are pleased to present shareholders and security holders with this Annual Report for the 12 months to 31 March 2016.
Powerco continued its track record of consistent delivery of operational and financial results for its stakeholders.
Key highlights • Revenue increased 2.5% from $445.9
million to $457.2 million.
• EBITDAF rose 1.6% from $249.2 million to $253.3 million.
• We invested $182.6 million in maintaining, renewing and developing Powerco’s electricity and gas networks, an increase of 6.9% (2015: $170.9 million).
• A record number of 11,441 scheduled maintenance, renewal and development projects were completed (2015: 8,532).
• Powerco surveyed about 8,000 people, of whom 5,500 were Powerco gas and electricity consumers. Of those, 94% of electricity customers were happy with the level of service the company provided.
• We connected 1,324 new gas customers, 6.5% more than last year.
• Our electricity and gas networks met all price limits and quality standards set by the Commerce Commission.
Our customers’ energy needs are diverse and continually changing. We see strong energy growth in business sectors as well as increasing options for our residential customers to adopt technologies such as solar generation, battery storage and electric vehicles.
To support the uptake of electric vehicles, in collaboration with Charge Net NZ, we installed our first public electric vehicle fast charging stations early in 2016. The first was a fast charger at the Bayfair Shopping Centre in Mt Maunganui, followed by another in New Plymouth, which was the first on a state highway in New Zealand. As demand increases we will work with our partners to roll out more charging stations across our network.
There was growth across Powerco’s networks, especially in Tauranga on the
back of significant subdivision development coupled with an increase in commercial and industrial activity. New subdivisions also drove up gas connections, especially in Taranaki, Hutt Valley and Porirua.
Safety remains a major focus for Powerco and there has been a concerted effort to ensure we remain an industry leader in this area. These efforts resulted in a 63% reduction in our lost-time injury numbers on last year, and our public safety initiatives being recognised by industry leaders when Powerco won the Electricity Engineers Association (EEA) Public Safety Award for 2015.
At Powerco we understand the investment decisions we make today for our electricity and gas networks will determine the quality of infrastructure for future generations. We take this responsibility seriously and are working to ensure the decisions we make are the right ones.
Revenue Total revenue was $457.2 million, a 2.5% increase on 2015’s $445.9 million. This positive result was achieved despite a challenging regulatory reset for Powerco’s electricity business where the weighted average cost of capital (WACC) reduced by 18%. The positive revenue performance was mainly driven by strong customer growth and higher electricity volumes ($6.9m).
Earnings before Interest, Taxation, Depreciation, Amortisation and Financial Instruments (EBITDAF)EBITDAF for the 12 month period ended 31 March 2016 was $253.3 million, an increase of 1.6% (2015: $249.2 million).
The improvement was due to the revenue increases already detailed.
Underlying performance of the companyPowerco is of the opinion that both EBITDAF and Profit before Taxation, adjusted to remove the impact of unrealised gains and losses, are better measures of the performance of the company, showing a 2.3% and 1.6% year-on-year improvement respectively.
The following table shows Profit before Taxation with Other Gains and Losses for 2016 and 2015 removed. The variance of $1.9 million is attributable to the increase in EBITDAF ($4.0 million), offset by increases in both depreciation and amortisation ($0.4 million), disposal of fixed assets ($0.4 million) and finance costs ($1.3 million).
Net Profit After Tax (NPAT)The Company made a net profit after tax of $64.4 million in the 12 months to 31 March 2016 compared with $73.7 million for the 12 months ended 31 March 2015. This reduction in Net Profit after Tax is due to much smaller gains on unrealised valuations of financial instruments. The results reflect the company’s resilience, stability and ongoing focus on performance improvement.
2016 $ MILLION
2015 $ MILLION
VARIANCE $ MILLION
VARIANCE %
Profit Before Taxation 84.6 93.7 (9.1)
Remove other (gains)/losses (1.8) (12.8) 11.0
Underlying profitability 82.8 80.9 1.9 2.3%
John Loughlin Chairman
Nigel Barbour Chief Executive
Values are an important part of shaping how we act at Powerco. They define the types of behaviours and actions that contribute to the success of the company.
Values
SafeWe are committed to keeping people safe.
ConscientiousWe are proactive,
hardworking, diligent and thoughtful. We are
mindful of the needs of others and of the environment. We take ownership for
our actions.
TrustworthyWe act with integrity.
We are honest, consistent and ethical. We trust each
other and our external partners and work to be
trusted in return.
AccountableWe lead.
We take ownership of our decisions and responsibility for our
actions. We are proactive in identifying and
resolving problems.
SafeWe are committed to keeping people safe.
IntelligentWe make informed
decisions for the best outcome. We continually seek improvement and
innovative solutions from our suppliers
and ourselves.
SafeWe are committed to keeping people safe.
CollaborativeWe work together with our partners, contribute
our capabilities and provide timely support and
consideration to achieve our collective goals.
SafeWe are committed to keeping people safe.
Back to contents >

6 POWERCO LTD Annual Report 2016 POWERCO LTD Annual Report 2016 7 Back to contents >
Nigel BarbourB.Com/LLB
Chief Executive
Mr Barbour is the Chief Executive of Powerco. He is responsible for leading the business to deliver on all customer, financial and operation targets. He joined Powerco in October 2002 and has been in executive management roles for the past 13 years, including General Manager Electricity. He was appointed Chief Executive in October 2011. He is a board member of the New Zealand Electricity Networks Association and the Gas Industry Company, and is a member of the New Zealand Security and Reliability Council. Mr Barbour has an economics and legal background and has previously held roles with Transpower and Bank of New Zealand.
Jo Birnie BSc (Hons) Psy, CIPD
Group Human Resources Manager
Mrs Birnie joined Powerco in June 2010. Before her current role she was employed as an HR advisor specialising in learning and development.Since immigrating with her family to New Zealand from the United Kingdom in 2007, Mrs Birnie has held generalist HR roles as well as being Committee Secretary for the Human Resources Institute of New Zealand Taranaki branch. She has more than 10 years’ experience in human resources, holding management, specialist, generalist and business partner roles in the private and public sectors, including central Government, health, and the retail industry. Her HR specialist areas include leadership, organisational development, change management and coaching. In addition to HR roles, she has worked on European
funding and corporate business projects. Mrs Birnie is a graduate member of the Chartered Institute of Personnel and Development (UK) and a member of the Human Resources Institute of New Zealand (MHRINZ).
Stuart Dickson BEng (Mech)
General Manager (Gas)
Mr Dickson joined Powerco in 2011 as the General Manager of Powerco’s Gas Business. He is a professional engineer who has worked in the gas and energy industry for the past 20 years in New Zealand and the United Kingdom. His experience spans asset strategy and management, network and plant operations, project delivery, consulting and engineering. Before joining Powerco, Mr Dickson worked as a consultant within the gas industry and was previously part of Vector’s Gas Management Team.
Richard Fletcher BSc (Hons) PhD
Regulation and Government Relations General Manager
Dr Fletcher joined Powerco in 2011 as General Manager Regulation and Government Relations. He is responsible for managing policy interactions with the company’s economic and technical regulators, as well as corporate relations with official stakeholders. Before joining Powerco, Dr Fletcher was Regulatory Strategy and Pricing Manager at Transpower NZ Ltd. Dr Fletcher relocated with his family from the United Kingdom in 2005. He has worked in the UK, Middle East and South East Asia, initially as an environmental engineering consultant in various commercial management roles in the water and electricity regulated network sectors. From 2000 to 2005, Dr Fletcher was Head of Economic Regulation at Welsh Water PLC.
’
Paul Goodeve LLB, BCA, CA, Barrister and Solicitor of the High Court of New Zealand
General Manager Operations Support
Mr Goodeve is responsible for the management of Powerco’s Operations Support Team. The Operations Support Team includes Corporate Affairs, Legal Services, Network Information, Business Development, Facilities, the Programme Office and Information Systems. Mr Goodeve is a director of the Electricity and Gas Complaints Commission. He joined Powerco in 2004 and has had roles as Regulatory and Business Manager, and Pricing, Risk and Regulatory Manager. His professional training is in law and commerce.
Dennis Martin BCA, CA
Chief Financial Officer
Mr Martin is Powerco’s Chief Financial Officer, responsible for the company’s accounting and treasury activities. He has a Bachelor of Commerce and Administration and is a member of the New Zealand Institute of Chartered Accountants and the Institute of Directors. Before joining Powerco in May 2010, Mr Martin was CFO at the New Zealand Refining Company.
Julie McAvoy MSc, BEng (Hons)
Group Health, Safety, Environment and Quality Manager
Mrs McAvoy holds a Mechanical Engineering Degree and a Masters in Mechatronics. During her 25
years’ experience she has held a number of engineering, project management and leadership roles in the UK and New Zealand in heavy engineering and marine industry, including eight years with Rolls Royce Marine. Since immigrating to New Zealand in 2009, Mrs McAvoy’s experience has been in the oil and gas sector in Taranaki. She has worked for an integrated energy company and in engineering, procurement, construction contractors in operations, engineering leadership and quality, health, safety and environment roles. Her experience ranges from engineering and project management, design for safety, lean six sigma, and quality, health, safety and environment management through to strategic planning and execution.
Andrew McLeod BEng (Mech) PGDipFA
General Manager (Electricity)
Mr McLeod runs Powerco’s Electricity Team as General Manager Electricity. He joined Powerco in 2009 as the General Manager Gas.Mr McLeod is a mechanical engineer and general manager with 18 years’ experience in the heavy engineering, water utility, gas and electricity utility sectors. His experience spans engineering strategy, project delivery, network and plant operations, and commercial sales. Before working for Powerco he was part of Vector’s Gas Management Team in the role of Asset Strategy Manager. He also previously held senior engineering management roles in New Zealand and the United Kingdom. Mr McLeod is a Chartered member of the Institute of Mechanical Engineers (UK). He holds professional qualifications in the areas of engineering and applied finance.
Board of Directors
Executive Management Team
John Loughlin MBA, BCA, FCA, FCIS, FCSAP, FNZIM, ANZIIF (Fellow), AFInstD, INFINZ (Fellow)
Mr Loughlin is the Chair of the Powerco Board. He is a professional Company Director and Chairman of Tru-Test Corporation Ltd, EastPack Ltd and Havelock North Fruit Company Ltd. He is also a director of Augusta Capital Ltd, Port of Napier Ltd and Bay Leisure & Events Ltd, and a trustee of the Professionelle Foundation. In his executive career, Mr Loughlin was Finance Manager of Richmond Ltd before becoming the company’s Chief Executive Officer. Prior to holding those positions, he was an institutional fund manager. He and his wife Kathryn established and own Askerne Estate Winery. Mr Loughlin was appointed to the Powerco Board in 2013.
Murray Bain MCom, BSc
Mr Bain has wide experience working with boards as a senior executive and as a board member. He has held senior roles with Trust Bank, the Ministry of Business, Innovation and Employment, the Ministry of Science and Innovation, Accident Compensation Corporation and the Reserve Bank of New Zealand. In addition to his role with Powerco he is Chair of the Open Polytech of NZ, Deputy Chair of TSB Bank and a Director of the DHB Central Technical Advisory Services organisation (CTAS). He also provides consultancy services to a wide range of organisations in both the private and public sector. Mr Bain was appointed to the Powerco Board in 2012.
Michael Bessell BEc, LLB (Hons), GradDipAppFin, MAICD
Mr Bessell is AMP Capital’s Head of Origination and Separately Managed Accounts, Australia and New Zealand. He leads AMP Capital’s Australian and New Zealand origination team and also has responsibility for AMP Capital’s $4 billion customised accounts infrastructure business. Mr Bessell has more than 23 years of investment banking and investment experience, with a focus on mergers and acquisitions, equity raising and developing infrastructure projects as a sponsor or principal across all infrastructure subsectors. He has worked in Europe and North America and has led teams undertaking investments in Europe, Australasia and North America. During the past five years, his team has transacted and executed investments with an enterprise value of more than $5 billion. He is a member of the AMP Capital Private Equity and Alternative Assets Investment committees, is on the global infrastructure management committee and serves as a director of a number of investee companies. Before joining AMP Capital in 2006, Mr Bessell served as a director at NM Rothschild & Sons (Australia) Ltd and worked for Schroders in Australia and the United Kingdom. Mr Bessell was appointed to the Powerco Board in April 2015.
Michael CummingsBEng, MIPENZ, MInstD, GAICD
Mr Cummings is AMP Capital’s Head of Australian and NZ Funds, including having responsibility for leading its Energy and Utilities Sector team. He is also the Fund Manager for AMP Capital’s domestic flagship Infrastructure Equity Fund, with investments in transport, energy and social infrastructure assets. Before joining AMP Capital, Mr Cummings was the Chief
Operating Officer (Energy) at Brookfield Infrastructure. This involved international governance roles as the Chair or Director on a number of company boards around the world, including NGPL and Cross Sound Cable in the US, the International Energy Group in the UK, DBP and WA Gas Networks in Western Australia, and the Tasmanian Gas Pipeline. With more than 25 years of experience in the infrastructure sector, Mr Cummings is a Graduate Member of the Australian Institute of Company Directors and a member of the Institute of Directors NZ, as well as the Institution of Professional Engineers NZ. Mr Cummings was re-appointed to the Powerco Board in 2013, having previously been a Director from 2008-2012 when working for BBI/Brookfield. He is a Director of Australian Pacific Airports Corporation, and an Alternate Director of Interlink.
Marcus Dorreen BSc, GradDip CommAlternate Director to Michael Cummings
Mr Dorreen is an Associate Director with AMP Capital’s Infrastructure Equity business, with coverage of the energy and utilities sectors. For more than 11 years he has worked across the power supply value chain from upstream coal and gas production to downstream retail markets. Before joining AMP Capital he was a Corporate Development Manager at AGL Energy, working on major acquisitions and development of large-scale electricity generation projects, which followed several years at Origin Energy working in energy risk management. Mr Dorreen is a member of the Australian Institute of Company Directors. He was appointed to the Powerco Board in 2015.
Gordon Hay BEng (Hons), MBA
Mr Hay is a Principal in the QIC Global Infrastructure
team and co-heads the team’s investment and asset management activities in the energy and utilities sector. He has more than 10 years of corporate advisory and transaction experience. Before joining QIC, he was Executive Director of BurnVoir Corporate Finance, an Australian boutique investment bank where he was responsible for origination and execution of M&A transactions, debt financings and equity raisings across the infrastructure, energy and resources sectors. Mr Hay’s experience spans transactional, project and strategic assignments for organisations ranging from major corporations and Government entities to small-cap and single-asset companies. Mr Hay joined the Powerco Board in 2014 as Alternate Director to Angela Karl. On 26 March 2015 Mr Hay became a Principal Director.
Angela Karl BCom (Hons 1), LLB (Hons 1)Alternate Director to Gordon Hay
Ms Karl joined QIC in 2012 and is a Partner in the QIC Global Infrastructure (GI) team. She is focused on the power and utilities sector within QIC GI’s broader infrastructure portfolio. Before joining QIC, Ms Karl had 11 years of investment banking, corporate advisory and transaction experience at both JPMorgan and UBS Investment Bank, with her most recent role as Australasian Head of Power & Utilities Advisory at UBS. During her time in banking, Ms Karl advised on more than $24 billion of mergers and acquisitions and more than $7 billion of capital raisings for Australasian corporates, predominantly in the utility sector. She is also a Director of Epic Energy SA and a Director of Lochard Energy. Ms Karl was appointed to the Powerco Board in 2013 as Principal Director then became Alternate Director to Mr Hay on 26 March 2015.
Tom Parry AM, BEc, MEc, PhD
Dr Parry is a director of ASX-Compliance and Brisbane Airport Corporation.Previously he was Chairman of the Australian Energy Market Operator, Chairman of Sydney Water Corporation, and Chairman of First Super Trustee Corporation. He also has held several important positions in regulation and public policy, including 12 years as Foundation Executive Chair of the Independent Pricing and Regulatory Tribunal of New South Wales, Foundation New South Wales Natural Resources Commissioner and Director of the New South Wales Clinical Excellence Commission. He has more than 35 years’ experience as an academic, business and public policy consultant in the financial sector and as a regulator. Dr Parry was appointed to the Powerco Board in 2010.
David Rees MAAlternate Director to Michael Bessell
Mr Rees is Partner and Head of Asset Management, Infrastructure Europe, AMP Capital Investors. He has responsibility for the long-term performance of AMP Capital’s European infrastructure assets. He joined AMP Capital in 2012 and has more than 28 years’ experience of infrastructure businesses. Before joining AMP Capital he worked for 10 years at National Grid, the international network energy company, where he held a number of senior executive roles, including Director of Finance and Regulation of Transco, the UK gas transmission and distribution business. He serves on the Boards of Thames Water, Angel Trains, Esvagt A/S and Newcastle Airport. Mr Rees was appointed to the Powerco Board as Alternate Director to Chris Wade in November 2013 and further appointed to the Powerco Board as Alternate to Michael Bessell in April 2015.

Back to contents > POWERCO LTD Annual Report 2016 9 8 POWERCO LTD Annual Report 2016
340*
full-time equivalent employees across branches in New Plymouth, Palmerston North, Wellington and Tauranga.
104,000* customers connected to our gas networks.
332,000*
customers connected to our electricity networks.
8,830,000* GJ of gas conveyed for the year ended 31 March 2016.
4,800* GWh of electricity conveyed for the year ended 31 March 2016.
36,000+kilometres of combined network length spanning 28 territorial authorities, six regional councils and 11 electorates.
Our gas pipeline networks are in Taranaki, Hutt Valley, Porirua, Wellington, Horowhenua, Manawatu and Hawke’s Bay.
Powerco’s electricity networks are in Western Bay of Plenty, Thames, Coromandel, Eastern and Southern Waikato, Taranaki, Whanganui, Rangitikei, Manawatu and Wairarapa.
Powerco at a glancePowerco is a leading New Zealand electricity and gas infrastructure business providing distribution services to more than 436,000 customers throughout the North Island.
Corporate Governance Statement
As a listed issuer on the NZX Debt Market (NZDX), Powerco is required to include a statement on its corporate governance policies, practices and processes in its annual report. In determining its approach to corporate governance, the Board has particular regard to the NZX Corporate Governance Best Practice Code and the principles outlined in the Financial Markets Authority Corporate Governance Handbook.
The Board is responsible for the overall direction and management of Powerco and for protecting and enhancing the value of the company’s assets. To achieve these objectives, it has adopted the following overarching governance objectives:
• To lay solid foundations for management and oversight
• To structure itself to add value and encourage performance growth
• To promote ethical and responsible decision-making
• To safeguard the integrity of its financial reporting
• To respect the rights of its shareholders and recognise the legitimate interests of stakeholders
• To recognise and manage risk
• To remunerate fairly and responsibly
Board composition The Board comprises six non-executive directors who are nominated and appointed in accordance with an agreement among the shareholders of Powerco’s parent company, Powerco NZ Holdings Ltd. The Board has enacted a Board Charter, which emphasises the importance of director induction and of on-going education to ensure that directors are able to effectively perform their duties. Board and director performance is regularly assessed and evaluated.
Directors’ remuneration is reviewed at least annually, with input sought from independent, professional advisers. As Powerco’s shares are not publicly traded, directors’ remuneration does not include any equity security components.
Board committees The following committees have been established to assist the Board, each governed by a Committee Charter.
A Regulatory Committee ensures Powerco is meeting its regulatory requirements and assists the Board in relation to mitigating regulatory risks and exercising due diligence in relation to regulatory engagement. The committee members are Tom Parry (Chair),
Michael Cummings, Gordon Hay and John Loughlin.
A Treasury Committee assists the Board in relation to debt capital funding, treasury management, including on-going development and review of treasury policies, and minimising the total cost of capital. The committee members are Michael Bessell (Chair), Murray Bain, Gordon Hay and John Loughlin.
An Audit and Risk Committee oversees the integrity of financial reporting and manages the relationship with external auditors, including the monitoring of their independence. The committee is also responsible for the company’s internal control environment and risk management framework. The committee members are Murray Bain (Chair), Michael Bessell, Gordon Hay and John Loughlin.
An HR and Remuneration Committee provides advice to the Board on human resources and remuneration policies for employees, including for the Chief Executive and senior management, performance-based components of remuneration and the remuneration of directors. The committee members are John Loughlin (Chair), Michael Cummings and Gordon Hay.
The Board regularly assesses the performance of each committee against its Charter and reviews each Charter.
Code of Ethics The Board regularly reviews Powerco’s Code of Ethics (the Code) which applies to the personal and professional behaviour of all directors, senior management and other staff at Powerco. The Code requires Powerco’s directors and staff to be accountable for acting honestly and with integrity, care and diligence. These are also reflected in Powerco’s values on page 4.
The Code emphasises the importance of managing conflicts of interest and using Powerco’s assets and information properly. Provisions in the Code about securities trading and insider trading are expanded in separate policies and procedures. Powerco has whistle-blowing procedures in place and mechanisms to protect whistle-blowers.
*approximately
Tauranga
Napier
Hastings
Wellington
Palmerston North
Whanganui
New Plymouth

Back to contents >10 POWERCO LTD Annual Report 2016 POWERCO LTD Annual Report 2016 11
Financial snapshot 2016 $MILLION
2015 $MILLION
Income 457.2 445.9
EBITDAF 253.3 249.2
Net loss on disposals, depreciation and amortisation 90.4 89.5
EBIT 162.9 159.7
NPAT 64.4 73.7
Total equity 540.6 534.4
Total assets 2,173.3 2,053.4
Borrowings 1,297.8 1,183.6
Key financial measures
EBITDAF/revenue 55.4% 55.9%
EBIT/revenue 74.1% 75.4%
Equity/total assets 24.9% 26.0%
Gearing ratio 59.7% 59.8%
Net interest cover (EBIT/net finance costs) 2.0 times 2.0 times
Underlying profit* 82.7 80.9
Net profit after tax 64.4 73.7
Dividends 58.7 55.0
*Net profit before tax less gains or losses
* The 2014 figure was impacted by a one-off configuration of metering assets at Carter Holt Harvey (Kinleith).
332,247Electricity customer connections as at 31 March
2016328,9132015
325,8602014
323,5152013
320,8742012
104,4392016103,7882015
102,5382014
103,0092013
102,8502012
The ICP count includes the status of active, inactive and ready, as this aligns to the definition of the number of connections in the electricity industry information disclosure requirements and ensures figures are reported consistently.
Energy transported in gigawatt hours (GWh) across Powerco’s electricity networks in the 12 months ending 31 March
Energy transported in gigajoules (GJ) across Powerco’s gas networks in the 12 months ending 31 March
4,80920164,7152015
4,770*2014
4,8022013
4,6382012
8,829,19820168,938,6412015
8,798,9262014
8,975,3652013
9,077,4612012
Delivering results
Total Revenue for the period ($000)
9 m
ths
12 m
ths 445,902
281,040
401,427
415,407
457,2402016
2015
2014
2012
2013
Customer connections
Gas customer connections as at 31 March
Energy transported
Earnings before finance costs, loss on disposal, tax, depreciation, amortisation and financial instruments for the period ($000)
249,226
147,826
224,086
227,141
253,2732016
2015
2014
2013
2012
9 m
ths
12 m
ths
NPAT for the period ($000)
73,664
25,595
91,831
64,4402016
2015
2014
2013
2012
62,076
9 m
ths
12 m
ths
Total assets employed at end of period ($000)
2,053,404
1,894,223
1,912,742
1,940,375
2,173,3212016
2015
2014
2013
2012
9 m
ths
12 m
ths

12 POWERCO LTD Annual Report 2016 POWERCO LTD Annual Report 2016 13 Back to contents >
We invested more than $180 million in maintaining, renewing and developing Powerco’s electricity and gas networks and completed more than 11,000 individual projects. Below are just a few examples of projects undertaken across our network in the past 12 months.
New substation powering kiwifruit sectorThe Bay of Plenty has a new $2.2 million substation to meet the growing demand of the kiwifruit sector. The substation, just north of Paengaroa village, has a 17MVA
Largest transformer assists dairy industryIn Eastern Waikato, we have installed our largest-ever transformer to meet the growing demand from the dairy industry. Imported from Australia, the 110kV, 102 tonne, 6.2 metre high transformer was installed at the Roache Rd substation near Morrinsville. It is the first time Powerco has used 110kV transformers – the highest voltage previously handled was 66kV. The upgrade was designed to significantly improve security of supply for Morrinsville and the surrounding rural area, including the Tatua dairy processing plant, and farming operations in the region.
North Taranaki network upgradeA $3.5 million network upgrade in North Taranaki will cater for the significant commercial and industrial growth in Waiwhakaiho and Bell Block. The project involved installing a new twin 33kV circuit from the main grid exit point at Huirangi to the Bell Block substation. A helicopter was used to run
six conductors along the 6.5km route. A fibre optic cable was also included in the upgrade and will provide network communication and protection services for Powerco.
Wellington gas projects go liveTwo major projects on Powerco’s Wellington gas network were successfully commissioned early this year. The first saw a significant lift in pressure to a large section of the capital’s CBD. The pressure boost – from 10kPa to 25kPa – was three years in the planning and involved the inspection of 784 customer connections. Pressure to the rest of the CBD will be lifted during the next five years.
North-east of Wellington City, in Upper Hutt, the gas pipeline under the Hutt River was replaced after river bed erosion exposed the original pipeline. With the river having the most severe scouring profile of any in New Zealand, the decision was made to replace the pipe with a 266m long, directionally drilled gas main, 18m below the river bed. This work ensures the ongoing gas supply to a major quarry and asphalt operation.
Gas restored after bridge collapsesUpper Hutt residents who lost gas supply when a bridge partially collapsed were reconnected thanks to an innovative solution. The bridge buckled from heavy rain and a raging Akatarawa River, cutting off road access to 70 homes in late October. Eleven customers lost their gas supply.
The Gas Team quickly came up with a semi-permanent solution to reconnect supply by running the existing line across the top of the bridge. A safety device was installed to automatically shut off gas if the line ruptured, effectively removing the risk of a gas leak. We are now working with the Upper Hutt City Council to plan the permanent solution.
Weathering the stormsHeavy rain in June caused multiple faults on Powerco’s electricity network, cutting power to a peak of 6,000 customers in Whanganui, Taranaki and South Waikato. There was a large number of slips, flooding damage, blocked roads and fallen trees across overhead lines. In Whanganui, the
Delivering a reliable supply
Powerco is focused on serving its 436,000 customers. In the past 12 months there has been significant investment in infrastructure throughout Powerco’s footprint, supporting population growth and business venture.
river burst its banks, inundating parts of the town, with floodwaters entering the yards of Powerco’s Peat St substation. A large slip took out multiple poles on a 33kV line.
At the height of the restoration work, more than 70 people were involved in carrying out repairs. Wairarapa crews were brought in to help, and helicopters were used to transport in-field staff where road access was blocked by storm damage. Generators were provided to areas where we were unable to restore supply because of the damage sustained and there was no access for our fault crews.
There was another storm in March, also in Taranaki and Whanganui, with about 13,000 customers affected by power cuts. In July, 13,000 properties on the Thames coast lost supply when high winds caused a tree to fall through lines.
Despite this, Powerco’s recovery efforts meant we could restore power quickly and met our overall reliability standards.*
Left: A 17MVA transformer, capable of powering 8,500 households and supporting industrial growth, is lowered into place in Waharoa.
capacity and will also provide the local community with a more reliable supply.
We have also invested $1.4 million in the Te Puke substation to meet the kiwifruit sector’s increased electricity needs and give the local community a more reliable service. The original building and switchboard has been replaced with a new switch room and the latest microprocessor-based equipment.
Boost for WaharoaWhile many small towns in New Zealand are in decline, Waikato’s Waharoa is bucking the trend and Powerco has invested $1.8 million to meet the growing demand. We upgraded the Waharoa substation by adding a 17MVA transformer capable of powering 8,500 households and supporting industrial growth in the area.
Dairy companies such as Open Country Dairy Ltd, which had undergone expansion, cool stores and new businesses coming into the area are behind a growth in electricity consumption.
Top: Flood waters inundate Whanganui fields after torrential rain in June.
Above: The single gas feed into Wainuiomata is re-aligned due to hill erosion exposing the pipe. More than 5,000 customers rely on the supply.
Left: A helicopter is used to run conductors along the Bell Block-Waiwhakaiho network upgrade route.
* Powerco’s SAIDI threshold for 2016 was 178.44 minutes, within the 188.87 assessment limit. The company’s SAIFI was 2.07, meeting the target of 2.34.

14 POWERCO LTD Annual Report 2016 POWERCO LTD Annual Report 2016 15 Back to contents >
We continued seeking feedback at the annual Mystery Creek and Feilding field days where visitors to our stand were asked about aspects of their power supply and safety around our network. Across the two events, 4,500 surveys were completed at our stands. About 2,000 of those were Powerco customers and 94% rated the reliability of their electricity supply as acceptable or better.
Market research was also undertaken across Powerco’s gas customer base to determine the level of satisfaction with supply. Results were positive with 93% of residential householders happy with the reliability of gas supply. The satisfaction with supply among commercial (97%) and industrial (90%) was similar and importantly none expressed dissatisfaction with their service.
There was also consultation through meetings with customers, on-site interaction and focus groups.
Engaging with customers
Powerco values contact with its customers and is actively working on ways to enhance that connection. We also value our customers’ feedback and have a range of methods to capture their thoughts on various topics.
The Powerco website was revamped and is now mobile friendly with access available on devices such as smartphones and tablets. In response to customer feedback, the website now includes a new faults page, which provides improved information on power cuts. A location map pinpoints the problem area with data relating to when the power went off, when it is due back on and how many properties are affected.
Left: The Port of Tauranga is helping to drive economic growth in the region.
Below: New subdivision gas uptake remains strong.
Right: Surveying customers at the field days also gives people the opportunity to talk to our staff.
Industrial and residential growthThere was significant growth across the Powerco network, especially in Tauranga.
During 2015-16 we continued to see significant subdivision growth in Tauranga and Papamoa as the region continues to be a popular place to live. In addition, we saw significant growth in the commercial and industrial section, in particular the kiwifruit processing industry with a number of firms doubling their coolstore capacity. This high level of customer-led activity was seen in the record number of Customer Initiated Works applications processed by Powerco staff during the year. Applications totalled 11,111 which was 20.5% up on the previous year. The value of completed work was $28.9m, up $8.8m on FY15.
While the Bay of Plenty was a hive of activity, there was also significant upgrading of supply to dairy farms across our network. In a major dairy industry project, Powerco worked with Fonterra to help boost electricity supply to the milk company’s Pahiatua plant, which was undergoing a $235m expansion. Supporting the
Wairarapa, Tararua and Manawatu dairy industry, the upgrade enabled Fonterra to process an extra 2.4 million litres of milk a day.
Our network upgrade involved increasing the capacity at the Mangamutu substation, which supplies Pahiatua and the surrounding region, as well as upgrading two 33kV lines. Two new dedicated 11kV lines to the Fonterra site were also part of the work, as was an 11kV upgrade to accommodate Fonterra’s waste water treatment plant.
The Gas Hub/Powerco programme of initiatives resulted in net growth of 1,324 new natural gas connections – an increase of 6.5% against FY15. Powerco’s overall gas customer base increased to 104,439.
New subdivision uptake for gas connections remains strong, especially in Taranaki, Hutt Valley and Porirua, which experienced a 90% gas connection rate. This work was underpinned by a series of supporting sales and marketing initiatives.
There has been a trend towards multiple appliance or whole-of-home natural gas
use in new houses. Historically, the only gas appliance installed was for hot water, but now customers are opting for gas to cater for water, heating and cooking needs.
Beyond subdivision growth, connections for new and existing homes were 8% up on the previous year. New commercial and industrial connection revenue growth remained strong, exceeding the target by 10%.
There are a significant number of inquiries across the network, particularly in Hawke’s Bay and Wellington, which bodes well heading into next year.

16 POWERCO LTD Annual Report 2016 POWERCO LTD Annual Report 2016 17 Back to contents >
Our goal is zero serious harm incidents and regrettably we had three lost-time injuries during the year. The incidents have been thoroughly investigated and findings shared industry wide to reduce the risk of reoccurrence. The three lost-time injuries represent a 63% reduction in lost-time injuries on the previous year, when we had seven.
In addition, with safety being a key priority at Powerco, we were well positioned for the new Health and Safety at Work Act when it came into effect. Below are areas of particular focus and highlights for Powerco during the past year.
Success and recognitionPowerco’s commitment to public safety has been recognised by industry leaders, with the company winning the Electricity Engineers’ Association (EEA) Public Safety Award for 2015. The award recognised Powerco’s public safety education programme, designed to get people thinking about electrical safety to prevent
injuries or fatalities caused by contact with power lines and cables. The campaign involves hard-hitting images and safety messages on billboards and on the back of buses, and the company attending events such as the national and central districts’ field days. It also includes our in-school safety campaign featuring our real-life character called Sparky.
Public safetyPowerco’s public safety campaign has expanded to include the rural community. The farm power line safety campaign was launched at the Central Districts Field Days event in Manawatu in March 2016. It reminds farmers to know what is overhead because complacency around power lines can kill. Federated Farmers Dairy Industry
Staying safe
Safety is a priority at Powerco. We are committed to protecting the health and safety of all people living and working around our networks. It’s a key Powerco value: Safe – We are committed to keeping people safe.
“I decided to get behind this project because there is a lot of focus right now on farm health and safety. Safety around power lines should be a simple one – if you are doing work around them, you certainly don’t want to hit them. Contact with power lines can be extremely dangerous or fatal.”Andrew Hoggard, Federated Farmers
Left: Powerco works closely with its contracting partners to ensure workers are kept safe.
Below: Our farm safety campaign was fronted by Federated Farmers Dairy Industry Group Chairman Andrew Hoggard.
Above: Sparky, Powerco’s safety mascot, visits pupils at Selwyn Ridge School in Tauranga.
Group Chairman Andrew Hoggard, who has Powerco lines spanning his Kiwitea farm, is the face of our campaign. He features in an online safety video, rural-based advertising and media stories.
External review Following an external review by Telarc, New Zealand’s largest auditing body, our electricity and gas public safety management systems were re-certified against NZS 7901 Public Safety Management Systems. Telarc found that our public safety management systems were good and had improved during the past 18-24 months with no major gaps.
Our work place safety management practices were also externally reviewed during the year and we retained our tertiary level accreditation in the ACC Workplace Safety Management Practices programme.

18 POWERCO LTD Annual Report 2016 POWERCO LTD Annual Report 2016 19 Back to contents >
The Powerco network will continue to provide a vital platform for customers who want to incorporate new technology into their energy use. We are continuing to undertake trial programmes and pilot studies of technologies and services that will help our customers get maximum value and flexibility from these new technologies.
Electric vehiclesPowerco and the rest of the electricity networks industry will have an important role to play if the adoption of electric vehicles (EVs) become widespread. Uptake of EVs will heavily rely on our electricity network as people look to charge their vehicles at home and away, placing new demands on the connection points and the network overall.
We recognise that owners of EVs want the security of knowing there are places to charge their vehicles on long trips. In response to this “range anxiety”, Powerco has been involved with installing charging stations in Tauranga and New Plymouth,
and there will be more across the network in the future. We will be selecting locations for fast and slow charging infrastructure to meet communities’ transportation needs and boost local economies as uptake of EVs grows.
In February, Powerco and Charge Net NZ combined to set up a user-pays fast charger at Mt Maunganui’s Bayfair Shopping Centre. Customers can fully charge their vehicles in the time it takes to buy and drink a cup of coffee.
In March, Powerco created transport history with the opening of its EV charger on New Plymouth’s one-way system. Described as a significant step into the future, the charger was the first installed on a New Zealand state highway.
Increasing the number of electric vehicles on New Zealand roads is something we have supported in our own business. We have installed a plug-in station for our fleet electric car, which was bought after several years of using hybrid electric
New technology
Our customers’ energy needs are diverse and continually changing. We see strong energy growth in business sectors as well as increasing options for our residential customers to adopt technologies such as solar generation, battery storage and electric vehicles.
vehicles. We will be adding to the electric car fleet and plan to increase this over time as a range of suitable vehicles becomes available.
Powerco’s network is the country’s largest geographically, which puts us in a unique position in this exciting new phase in private transport. As demand increases we will work with our partners to roll out more charging stations across our network.
Base PowerPowerco continues to expand the number of off-grid Base Power units that are used by customers in remote rural areas. The electricity supply from a Base Power unit is equal to, and in some cases better than, what is provided by the network.
The system is ideal for homes, lodges, hill country farms, small shearing sheds, dairy farms and commercial businesses. A single unit has the capacity to support the average daily needs of a home and can be scaled up to support larger farming needs. The units
can be powered by the sun, water or wind, and have a diesel generator as a backup.
Base Power is a cost effective and reliable solution for remote customers whose overhead supply lines are vulnerable to storms, landslips and falling trees. It can be difficult and disproportionally costly to repair lines in rugged and remote locations.
The result is a new choice for replacing remote rural lines and reducing capital expenditure costs by more than 40%. With approximately 300 remote rural lines within Powerco’s network, significant performance gains can be made as they are replaced.
The Base Power units kept remote Powerco residents on full power during the June 2015 storms. While flooding caused massive damage in Whanganui and South Taranaki and left many people isolated for days, those with Base Power systems enjoyed uninterrupted electricity supply.
Left: Powerco Chair John Loughlin (left) and Chief Executive Nigel Barbour at the launch of Tauranga’s first EV charging station.
Middle: New Plymouth Mayor Andrew Judd (right) congratulates Powerco and its partners at the launch of the city’s first EV charger.
Below: Customers with Base Power units escaped the power cuts caused by torrential floods in Whanganui and South Taranaki.

POWERCO LTD Annual Report 2016 21 Back to contents >20 POWERCO LTD Annual Report 2016
Here now
Installed or coming soon
For the future
Electric vehicle charger locations Delivering New Zealand’s energy future
Battery smoothes electricity peaks
EV night time charging
Remote energy monitoring and control
PV generation
Smart home optimised energy efficiency
Powerco and its partners are rolling out electric vehicle charging stations across the company’s network area to support the growth of electric vehicles.
Powerco is an innovative company embracing new technology and the opportunities it creates to better meet customer needs.

22 POWERCO LTD Annual Report 2016 POWERCO LTD Annual Report 2016 23 Back to contents >
We understand that caring for our environment is everyone’s responsibility and we promote this message to staff. If everyone does their bit – at work and at home – the environment will be in better shape for future generations.
Enviro-Mark certificationPowerco’s work on environmental responsibility has seen it rise through the rankings of the independent Enviro-Mark programme. To date we have achieved Enviro-Mark Diamond certification for our corporate offices and depots and
Enviro-Mark Gold certification for our gas and electricity networks. We are working towards achieving Enviro-Mark Diamond certification for all our networks in 2016.
Environmental awareness on the jobPowerco’s Environmental Management System (EMS) proved itself last year during the Takapu Aerial Crossing Refurbishment project. The company and its contractors put the EMS into practice during the complex and potentially hazardous project to inspect and upgrade the main gas pipeline supplying the Wellington region. Despite the complexity, project audits found no harm was caused to the environment.
Installed in the early 1970s, the pipeline is suspended under the Takapu Road Bridge. It runs over the Porirua Stream and the electrified North Island main trunk railway line. The condition of the 45m-long steel pipe, which was covered by a steel casing and yellow jacket covering, was unknown. These factors brought an element of complexity to what would have been a routine inspection job.
It was essential to protect the stream, as well as the surrounding environment, from any contamination. To assess the pipe’s condition, the steel casing and yellow jacket covering underneath needed to be removed. Scaffolding was erected and an all-encompassing wrapping placed over the pipeline and scaffolding. This ensured workers who were checking, cleaning and painting the pipeline protected the stream and environment from contamination.
Success and recognitionPowerco’s commitment to the environment saw it win the Environmental Initiative of the Year section at the 2015 Deloitte Energy Excellence Awards. The award recognised the environmental efforts of the Gas Team, particularly in the completion of the complex Takapu Aerial Crossing Refurbishment project.
The award reflects our pledge to care for the environment and continuously improve our environmental performance.
Other successful environmentally friendly projects in the past year include placing some of our District Regulator Stations (DRSs) underground. Burying the DRSs has a dual purpose – improving the visual environment and reducing noise.
Powerco has also employed young Wellington artists to paint graffiti-prone above-ground DRSs, converting bare concrete stations into pleasing visual artwork for the community.
Caring for the environment
Powerco is committed to environmental management excellence. We focus on continual improvement, in line with the company’s vision of leading New Zealand in electricity and gas distribution.
Left: A worker is surrounded by protective sheeting as he spray paints the pipe as part of the Takapu gas pipeline refurbishment.
Middle: Prior to this DRS being painted with a mural it was the target of many graffiti attacks.
Below: Members of Powerco’s Gas Team and HSEQ Team at the 2015 Deloitte Energy Excellence Awards after winning the Environmental Initiative of the Year Award.

24 POWERCO LTD Annual Report 2016 POWERCO LTD Annual Report 2016 25 Back to contents >
In June, Ngamatapouri School, 43km up the Waitotara Valley, was cut off by severe flooding. Such was the devastation that only one of the students could reach the school and then only by quad bike.
Power to the remote area was lost and clearing the road to restore access was expected to take five weeks. Powerco realised the school’s plight and responded quickly. Despite the challenges, we restored power to the area, allowing the pupils to continue learning using online tools.
There were acts of compassion too, as the most was made of helicopters used in the restoration efforts. One Powerco contractor responded to a customer’s plea for milk and bread as supplies dwindled in the first week of the flood aftermath. He gathered together a box of food and had a helicopter drop it off to the stranded family.
Powerco employees have empathy with their community and beyond as well. When Cyclone Winston flattened parts of Fiji in February, a Help Fiji Day among employees across the network raised $1000, which was matched by the company and sent off to the Red Cross cyclone appeal.
In September, more than 50 employees spent an hour gathering litter on the streets and in the parks of Palmerston North, Tauranga, Wellington and New Plymouth. It was Powerco’s gesture in the Keep New Zealand Beautiful campaign and the fourth year staff had volunteered to be part of the clean-up.
There was also a fantastic pre-Christmas response from staff for a call for Foodbank donations and canned food for SPCA branches in the Western region.
Powerco is also conscious of the disruption that can occur to outside parties during maintenance and development work on
In the community
Powerco gives strong support to the communities in which it operates. Our sponsorship programme assists groups throughout our North Island network – and we go the extra mile in times of crisis too.
“Getting power back on kick-started the recovery process for the school and surrounding community. The students were equipped with laptops and tablets and we emailed them links to different online exercises.”Ngamatapouri School principal Michael Bieleski
Above: The gift of giving is alive and well among Powerco employees. Denise Hill (left) and Celeste Gardiner with goods collected for charities ahead of Christmas.
its gas and electricity networks. Last year a section of the gas network that supplies Newtown in Wellington went underground in a $750,000 project.
A former gas control station in a high-profile location – next to Newtown School and across the road from Wellington Hospital – was replaced with modern, underground equipment. The project not only improved the streetscape but boosted the supply to meet expected future gas demand.
To thank the community for their cooperation, we donated $1,500 to the Wellington Children’s Hospital and contributed to a new bike and scooter compound at Newtown School.
Powerco continued its strong sponsorship support of organisations across its North Island network. These included involvement in a wildlife recovery centre, tree planting, surf lifesaving clubs, school projects, sports groups, garden and arts festivals, a multi-ethnic event and many other activities.
Far left: Powerco Gas Team staff celebrate with Newtown School students. The school was given a donation for a new bike and scooter compound as part of a Newtown gas network upgrade.
Left: Powerco staff take seriously the company’s support of the community. Here are some staff members with the bags of rubbish they collected for Keep New Zealand Beautiful week.

Back to contents > Forward to financial contents >26 POWERCO LTD Annual Report 2016 POWERCO LTD Annual Report 2016 27
Financial StatementsFor the year ended 31 March 2016

Back to contents >28 POWERCO LTD Annual Report 2016 POWERCO LTD Annual Report 2016 29
The Company’s register of substantial security holders, prepared in accordance with section 25 of the Securities Markets Act 1988 recorded the following information as at the date of this Annual Report:
NAME TYPE OF VOTING SECURITIES NUMBER OF VOTING SECURITIES
Powerco NZ Holdings Limited Ordinary Shares 369,929,053
As at the date of this Annual Report, the total number of issued voting securities was 369,929,053 ordinary shares.
Equity Security Holder InformationAs at 24 May 2016:
NAME ORDINARY SHARES PERCENTAGE OF ISSUED ORDINARY SHARES
Powerco NZ Holdings Limited 369,929,053 100%
Directors’ Equity SecuritiesThe Directors of Powerco Limited held no relevant interests in Equity Securities in the Company as at 30 April 2016.
Quoted Security Holder SpreadAs at 30 April 2016:
SIZE OF HOLDING NUMBER OF HOLDERS HOLDING QUANTITY
Ordinary Shares
Over 100,000 1 369,929,053
Total 1 369,929,053
Guaranteed Bonds (issued 28 September 2005) 6.74%
5,000 up to 100,000 105 3,695,000
100,000 and over 46 3,695,000
Total 151 50,000,000
Credit RatingAs at the date of this Annual Report, the Company has the following credit ratings:
RATING AGENCY SHORT TERM LONG TERM
Standard & Poor’s A-2 BBB (stable)
NZX WaiversThe Company has relied on a waiver granted on 27 September 2005 from Listing Rule 5.2.3, in relation to the bonds issued in September 2005. The effect of this waiver is that the Company is not required to have at least 500 members of the public holding those bonds.
Enforcement Action by NZXNo enforcement action has been taken by NZX during the 12 months ended 31 March 2016 under Listing Rule 5.4.2.
Gender compositionThe gender composition of Powerco Limited’s directors and officers is reported in the table below. The officers category consists of the Executive Management Team.
AS AT 31 MARCH 2016 AS AT 31 MARCH 2015
MALE FEMALE MALE FEMALE
Directors 6 0 6 0
Alternate Directors 2 0 2 1
Officers 6 2 6 2
Companies Act 1993In accordance with section 211(3) of the Companies Act 1993 (the Act), Powerco NZ Holdings Limited, as the Company’s sole shareholder, has resolved that the Company’s annual report for the year ended 31 March 2016 need not comply with sections 211(1)(a), 211(1)(e) to (j) and 211(2) of the Act and accordingly this Annual Report does not state the particulars required by those sections.
This Annual Report is dated 24 May 2016 and is signed on behalf of the Board by:
John Loughlin Director Murray Bain Director
Statutory InformationSubstantial Security Holders
Key messages regarding these Financial Statements
Statutory Information ..............................................................29
Consolidated Statement of Comprehensive Income ...........30
Consolidated Statement of Changes in Equity .....................31
Consolidated Statement of Financial Position .....................32
Consolidated Statement of Cash Flows ................................33
Reconciliation of Profit to Net Cash Flows ...........................34
Notes to the Financial Statements
1. Basis of accounting .................................................................. 35
2. Segmental reporting .................................................................. 36
3. Revenue and other income ....................................................... 38
4. Finance costs ........................................................................... 38
5. Gains on financial instruments ................................................... 39
6. Taxation .................................................................................... 39
7. Property, plant and equipment .................................................. 41
8. Intangible assets ....................................................................... 43
9. Borrowings ............................................................................... 44
10. Other financial assets and liabilities ........................................... 47
11. Financial instruments ................................................................ 49
12. Trade and other receivables ...................................................... 53
13. Trade and other payables .......................................................... 53
14. Finance lease receivable ........................................................... 54
15. Operating leases ....................................................................... 54
16. Employee benefits..................................................................... 55
17. Auditor remuneration ................................................................ 55
18. Related parties .......................................................................... 56
19. Share capital ............................................................................. 56
20. Reserves ................................................................................... 56
21. Contingent liabilities and commitments ..................................... 57
22. New and revised standards and interpretations ......................... 57
23. Subsequent events ................................................................... 57
Audit Report .............................................................................58
How we manage our borrowings and interest rates
Powerco Ltd is a leading New Zealand electricity and gas infrastructure company providing distribution services to more than 430,000 customers across the central and lower North Island.
Our networks have long design lives and our operating environment, through being regulated, is relatively steady.
Our profitability is regulated so the management of risks is very important. Although we do not ‘hedge account’ for accounting purposes, in practice we very carefully manage currency and interest rate risk. All hedges entered are on ‘matched terms’.
Current accounting practice requires us to value financial assets and liabilities based on a fair value basis, which does not reflect the risk mitigation and true economic and financial value to the business on a going concern basis. While current accounting practice does have its merits, it fails to recognise that in most situations these borrowings and hedges will remain in place until maturity.
Reflecting our regulatory environment
The regulatory environment is a key driver for our business. We have made a number of changes in our financial statements to better reflect the environment we operate in.
Electricity and Gas Asset Management Plans are included on Powerco’s website. These plans provide an insight into our future operational and capital expenditure requirements.
Changes have been made to the segments reported in the segmental reporting note. The regulated gas and electricity business are shown as separate segments, with all unregulated activities included in the other segment. Expense categories in this note also mirror the regulatory categories.
Regulatory frameworks require various reporting of financial and non-financial performance separate to these statutory financial statements. In all cases the financial reporting is reconciled to these financial statements and to the extent necessary these accounting policies and financial results fully reflect the requirements and implications of the regulatory regime on the company.
Contents

30 POWERCO LTD Annual Report 2016 POWERCO LTD Annual Report 2016 31 Back to financial contents >
NOTES 2016$000
2015$000
Revenue and other income 3 457,240 445,902
Pass-through and recoverable costs 115,271 115,155
Network operational expenditure 35,421 34,514
System operations and network support 17,333 12,286
Business support 35,941 34,721
Operating expenses 203,967 196,676
Earnings before finance costs, loss on disposal, taxation, depreciation, amortisation and financial instruments (EBITDAF) 253,273 249,226
Net loss on disposal of fixed assets 13,481 13,018
Depreciation and amortisation 76,898 76,484
Earnings before finance costs and taxation (EBIT) 162,894 159,724
Finance costs 4 80,155 78,866
Gains on financial instruments 5 (1,844) (12,817)
Profit before taxation 84,583 93,675
Income tax expense 6 20,143 20,011
Profit for the period after tax 64,440 73,664
Other comprehensive income
Items that may be reclassified subsequently to profit/loss:
Cash flow hedges amortised 679 677
Income tax expense on cash flow hedges (190) (189)
Total other comprehensive income 489 488
Total comprehensive income for the period, net of tax 64,929 74,152
Consolidated Statement of Comprehensive IncomeFor the year ended 31 March 2016
ATTRIBUTABLE TO OWNERS
SHARE CAPITAL
$000
RETAINED EARNINGS
$000
HEDGERESERVE
$000TOTAL
$000
Balance as at 31 March 2014 698,165 (177,856) (5,093) 515,217
Profit for the period - 73,664 - 73,664
Cash flow hedges amortised - - 677 677
Income tax expense on amortisation of cash flow hedges - - (189) (189)
Total comprehensive income, net of tax - 73,664 488 74,152
Transactions with owners
Dividends (14.87 cents per share) - (54,971) - (54,971)
Balance as at 31 March 2015 698,165 (159,163) (4,605) 534,397
Profit for the period - 64,440 - 64,440
Cash flow hedges amortised - - 679 679
Income tax expense on amortisation of cash flow hedges - - (190) (190)
Total comprehensive income, net of tax - 64,440 489 64,929
Transactions with owners
Dividends (14.86 cents per share) - (58,708) - (58,708)
Balance as at 31 March 2016 698,165 (153,431) (4,116) 540,618
Consolidated Statement of Changes in EquityFor the year ended 31 March 2016
These financial statements should be read in conjunction with the notes to the financial statements on pages 35 to 57. These financial statements should be read in conjunction with the notes to the financial statements on pages 35 to 57.

32 POWERCO LTD Annual Report 2016 POWERCO LTD Annual Report 2016 33 Back to financial contents >
John Loughlin Director24 May 2016
Murray Bain Director 24 May 2016
NOTES 2016$000
2015$000
Current assets
Cash and cash equivalents 632 357
Trade and other receivables 12 36,690 37,261
Finance lease receivable 14 465 429
Other financial assets 10 - 319
Other current assets 321 89
38,108 38,455
Non-current assets
Property, plant and equipment 7 1,977,750 1,920,420
Finance lease receivable 14 9,008 9,473
Other financial assets 10 131,856 67,805
Intangible assets 8 16,599 17,251
2,135,213 2,014,949
TOTAL ASSETS 2,173,321 2,053,404
Current liabilities
Trade and other payables 13 40,965 37,868
Employee benefits 16 4,961 4,837
Other financial liabilities 10 17,081 19,784
Borrowings 9 149,354 131,939
212,361 194,429
Non-current liabilities
Employee benefits 16 1,818 1,585
Other financial liabilities 10 82,156 73,705
Borrowings 9 1,118,409 1,051,664
Deferred tax liability 6 217,959 197,626
1,420,342 1,324,579
Equity
Share capital 19 698,165 698,165
Retained earnings (153,431) (159,164)
Hedge reserve 20 (4,116) (4,605)
540,618 534,397
TOTAL EQUITY AND LIABILITIES 2,173,321 2,053,404
Consolidated Statement of Financial PositionAs at 31 March 2016
2016$000
2015$000
CASH FLOWS FROM OPERATING ACTIVITIES
Cash receipts from customers 506,870 491,922
Cash paid to suppliers and employees 223,654 221,837
283,216 270,085
GST paid 22,794 23,649
Interest paid 79,033 76,537
101,827 100,186
Net cash provided by operating activities 181,389 169,899
CASH FLOWS FROM INVESTING ACTIVITIES
Proceeds from sale of property, plant and equipment 164 133
Purchase of property, plant and equipment (150,574) (131,311)
Net cash used in investing activities (150,410) (131,178)
CASH FLOWS FROM FINANCING ACTIVITIES
Proceeds from borrowings 477,418 160,000
Proceeds from finance leases 429 396
Loan establishment costs (423) (832)
Repayment of borrowings (449,420) (142,665)
Dividend paid (58,708) (54,971)
Net cash used in financing activities (30,704) (38,072)
Net increase in cash and cash equivalents 275 649
Cash and cash equivalents at the beginning of the period 357 (292)
Cash and cash equivalents at the end of the period 632 357
Comprises the following:
Cash and cash equivalents 632 357
Cash and cash equivalents comprise cash on hand, cash in banks and investments in working capital facilities.
Transactions recorded net in the Financial StatementsThe GST component of operating activities reflects the net GST paid and received with Inland Revenue. The GST component has been presented on a net basis, as the gross amounts do not provide meaningful information for financial reporting purposes. The gross cash flows are presented inclusive of GST.
Consolidated Statement of Cash FlowsFor the year ended 31 March 2016
These financial statements should be read in conjunction with the notes to the financial statements on pages 35 to 57. These financial statements should be read in conjunction with the notes to the financial statements on pages 35 to 57.
34 POWERCO LTD Annual Report 2016 POWERCO LTD Annual Report 2016 35 Back to financial contents >
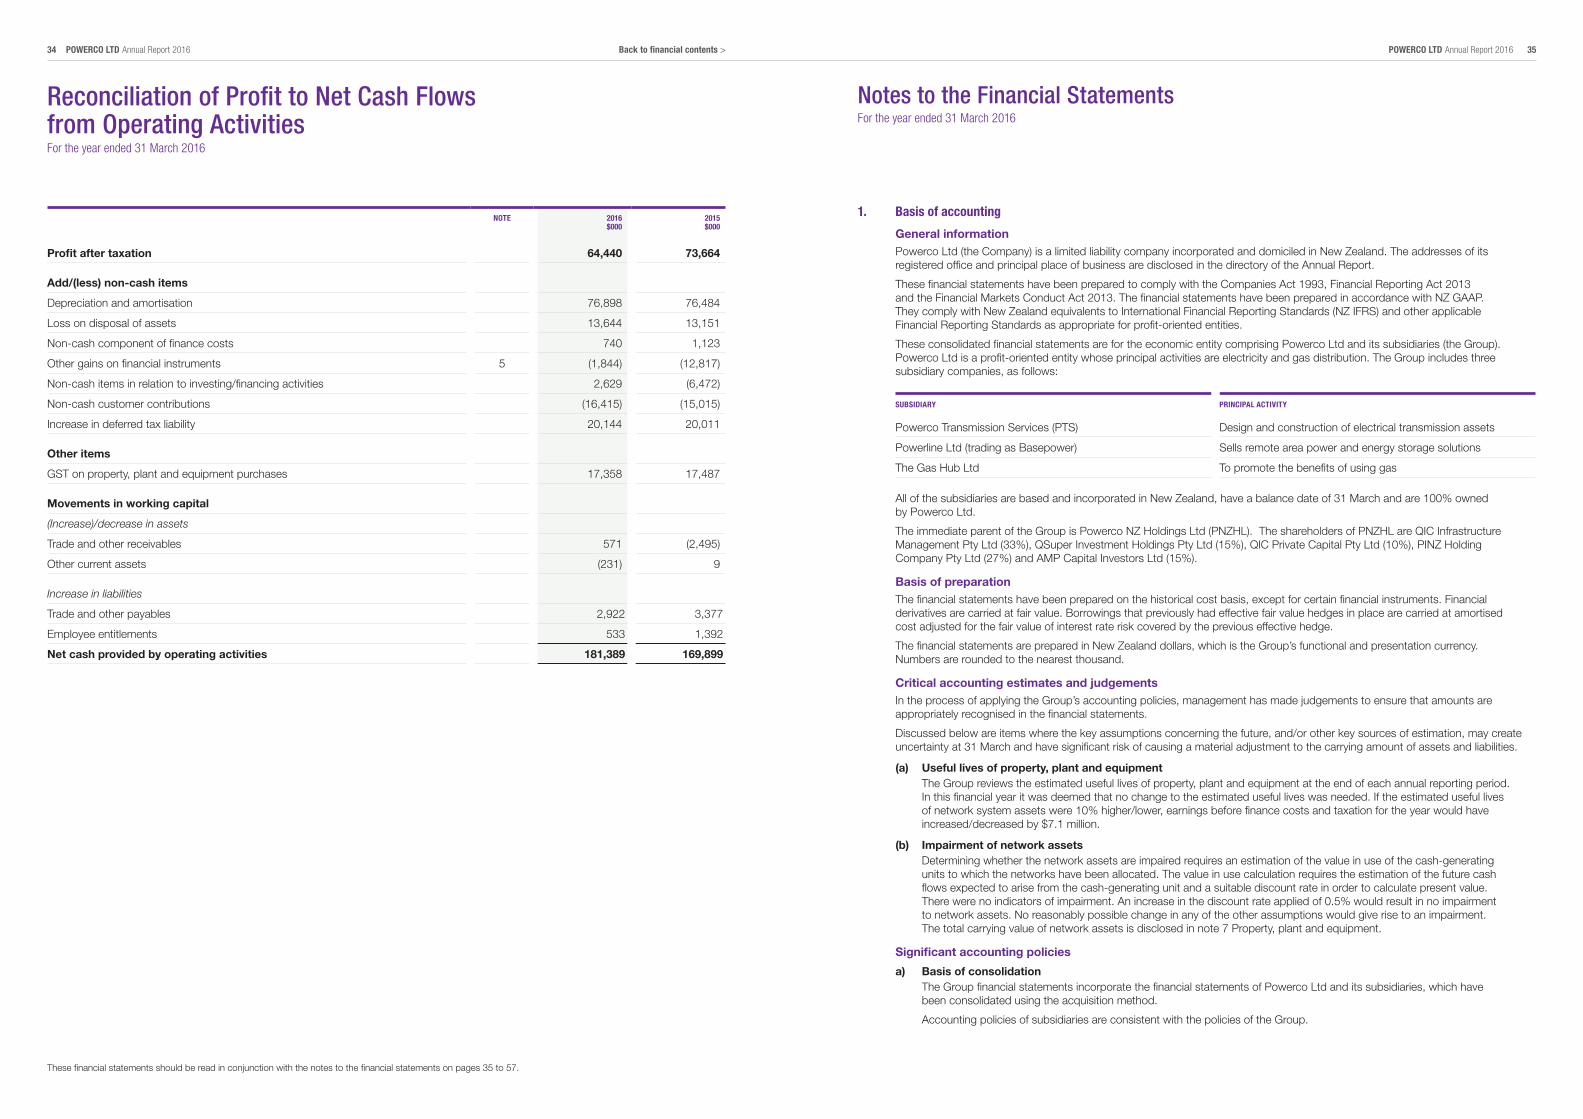
1. Basis of accounting
General informationPowerco Ltd (the Company) is a limited liability company incorporated and domiciled in New Zealand. The addresses of its registered office and principal place of business are disclosed in the directory of the Annual Report.
These financial statements have been prepared to comply with the Companies Act 1993, Financial Reporting Act 2013 and the Financial Markets Conduct Act 2013. The financial statements have been prepared in accordance with NZ GAAP. They comply with New Zealand equivalents to International Financial Reporting Standards (NZ IFRS) and other applicable Financial Reporting Standards as appropriate for profit-oriented entities.
These consolidated financial statements are for the economic entity comprising Powerco Ltd and its subsidiaries (the Group). Powerco Ltd is a profit-oriented entity whose principal activities are electricity and gas distribution. The Group includes three subsidiary companies, as follows:
SUBSIDIARY PRINCIPAL ACTIVITY
Powerco Transmission Services (PTS) Design and construction of electrical transmission assets
Powerline Ltd (trading as Basepower) Sells remote area power and energy storage solutions
The Gas Hub Ltd To promote the benefits of using gas
All of the subsidiaries are based and incorporated in New Zealand, have a balance date of 31 March and are 100% owned by Powerco Ltd.
The immediate parent of the Group is Powerco NZ Holdings Ltd (PNZHL). The shareholders of PNZHL are QIC Infrastructure Management Pty Ltd (33%), QSuper Investment Holdings Pty Ltd (15%), QIC Private Capital Pty Ltd (10%), PINZ Holding Company Pty Ltd (27%) and AMP Capital Investors Ltd (15%).
Basis of preparationThe financial statements have been prepared on the historical cost basis, except for certain financial instruments. Financial derivatives are carried at fair value. Borrowings that previously had effective fair value hedges in place are carried at amortised cost adjusted for the fair value of interest rate risk covered by the previous effective hedge.
The financial statements are prepared in New Zealand dollars, which is the Group’s functional and presentation currency. Numbers are rounded to the nearest thousand.
Critical accounting estimates and judgementsIn the process of applying the Group’s accounting policies, management has made judgements to ensure that amounts are appropriately recognised in the financial statements.
Discussed below are items where the key assumptions concerning the future, and/or other key sources of estimation, may create uncertainty at 31 March and have significant risk of causing a material adjustment to the carrying amount of assets and liabilities.
(a) Useful lives of property, plant and equipment The Group reviews the estimated useful lives of property, plant and equipment at the end of each annual reporting period.
In this financial year it was deemed that no change to the estimated useful lives was needed. If the estimated useful lives of network system assets were 10% higher/lower, earnings before finance costs and taxation for the year would have increased/decreased by $7.1 million.
(b) Impairment of network assets Determining whether the network assets are impaired requires an estimation of the value in use of the cash-generating
units to which the networks have been allocated. The value in use calculation requires the estimation of the future cash flows expected to arise from the cash-generating unit and a suitable discount rate in order to calculate present value. There were no indicators of impairment. An increase in the discount rate applied of 0.5% would result in no impairment to network assets. No reasonably possible change in any of the other assumptions would give rise to an impairment. The total carrying value of network assets is disclosed in note 7 Property, plant and equipment.
Significant accounting policies
a) Basis of consolidation The Group financial statements incorporate the financial statements of Powerco Ltd and its subsidiaries, which have
been consolidated using the acquisition method.
Accounting policies of subsidiaries are consistent with the policies of the Group.
NOTE 2016$000
2015$000
Profit after taxation 64,440 73,664
Add/(less) non-cash items
Depreciation and amortisation 76,898 76,484
Loss on disposal of assets 13,644 13,151
Non-cash component of finance costs 740 1,123
Other gains on financial instruments 5 (1,844) (12,817)
Non-cash items in relation to investing/financing activities 2,629 (6,472)
Non-cash customer contributions (16,415) (15,015)
Increase in deferred tax liability 20,144 20,011
Other items
GST on property, plant and equipment purchases 17,358 17,487
Movements in working capital
(Increase)/decrease in assets
Trade and other receivables 571 (2,495)
Other current assets (231) 9
Increase in liabilities
Trade and other payables 2,922 3,377
Employee entitlements 533 1,392
Net cash provided by operating activities 181,389 169,899
Reconciliation of Profit to Net Cash Flows from Operating ActivitiesFor the year ended 31 March 2016
Notes to the Financial StatementsFor the year ended 31 March 2016
These financial statements should be read in conjunction with the notes to the financial statements on pages 35 to 57.
36 POWERCO LTD Annual Report 2016 POWERCO LTD Annual Report 2016 37 Back to financial contents >
Subsidiaries are all those entities (including special-purpose entities) from which the Group has exposure or rights to variable returns from its involvement with the entity and has the ability to affect those returns through its power over the entity. The existence and effect of potential voting rights that are currently exercisable or convertible are considered when assessing whether the Company controls another entity. Subsidiaries that form part of the Group are consolidated from the date on which control is transferred to the Company. They cease to be consolidated from the date that control ceases.
The results of subsidiaries acquired or disposed of during the period are included in profit or loss from the effective date of acquisition or up to the effective date of disposal, as appropriate. All intra-group transactions, balances, income and expenses are eliminated in full on consolidation.
b) Business combinations Under a business combination where entities under common control are amalgamated, the carrying values of the assets
and liabilities of the entities are combined, with any net asset change on amalgamation recognised in equity.
c) Functional and presentation currency Items included in the financial statements of each of the subsidiaries’ operations are measured using the currency
of the primary economic environment in which they operate (the functional currency), which is New Zealand dollars.
Other accounting policiesAll other accounting policies are included with the applicable note.
Changes in accounting policiesAccounting policies have been consistently applied.
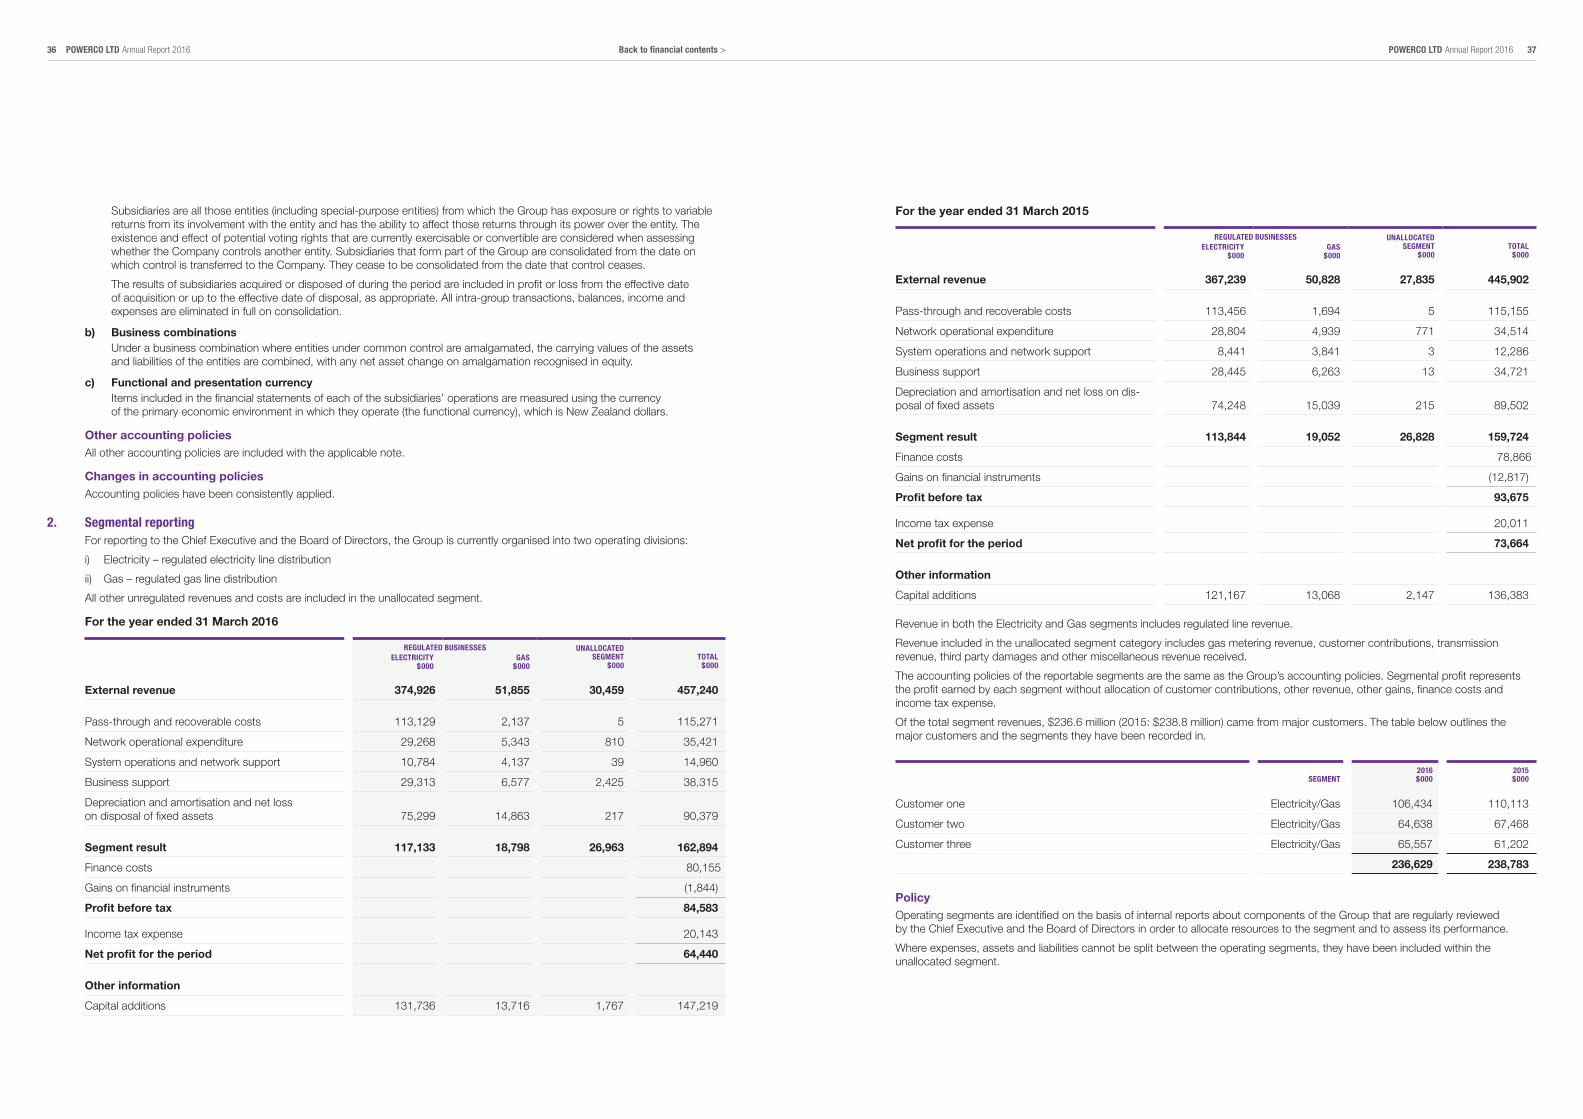
2. Segmental reportingFor reporting to the Chief Executive and the Board of Directors, the Group is currently organised into two operating divisions:
i) Electricity – regulated electricity line distribution
ii) Gas – regulated gas line distribution
All other unregulated revenues and costs are included in the unallocated segment.
For the year ended 31 March 2016
REGULATED BUSINESSES UNALLOCATED SEGMENT
$000TOTAL
$000ELECTRICITY
$000GAS
$000
External revenue 374,926 51,855 30,459 457,240
Pass-through and recoverable costs 113,129 2,137 5 115,271
Network operational expenditure 29,268 5,343 810 35,421
System operations and network support 10,784 4,137 39 14,960
Business support 29,313 6,577 2,425 38,315
Depreciation and amortisation and net loss on disposal of fixed assets 75,299 14,863 217 90,379
Segment result 117,133 18,798 26,963 162,894
Finance costs 80,155
Gains on financial instruments (1,844)
Profit before tax 84,583
Income tax expense 20,143
Net profit for the period 64,440
Other information
Capital additions 131,736 13,716 1,767 147,219
For the year ended 31 March 2015
REGULATED BUSINESSES UNALLOCATED SEGMENT
$000TOTAL
$000ELECTRICITY
$000GAS
$000
External revenue 367,239 50,828 27,835 445,902
Pass-through and recoverable costs 113,456 1,694 5 115,155
Network operational expenditure 28,804 4,939 771 34,514
System operations and network support 8,441 3,841 3 12,286
Business support 28,445 6,263 13 34,721
Depreciation and amortisation and net loss on dis-posal of fixed assets 74,248 15,039 215 89,502
Segment result 113,844 19,052 26,828 159,724
Finance costs 78,866
Gains on financial instruments (12,817)
Profit before tax 93,675
Income tax expense 20,011
Net profit for the period 73,664
Other information
Capital additions 121,167 13,068 2,147 136,383
Revenue in both the Electricity and Gas segments includes regulated line revenue.
Revenue included in the unallocated segment category includes gas metering revenue, customer contributions, transmission revenue, third party damages and other miscellaneous revenue received.
The accounting policies of the reportable segments are the same as the Group’s accounting policies. Segmental profit represents the profit earned by each segment without allocation of customer contributions, other revenue, other gains, finance costs and income tax expense.
Of the total segment revenues, $236.6 million (2015: $238.8 million) came from major customers. The table below outlines the major customers and the segments they have been recorded in.
SEGMENT2016$000
2015$000
Customer one Electricity/Gas 106,434 110,113
Customer two Electricity/Gas 64,638 67,468
Customer three Electricity/Gas 65,557 61,202
236,629 238,783
PolicyOperating segments are identified on the basis of internal reports about components of the Group that are regularly reviewed by the Chief Executive and the Board of Directors in order to allocate resources to the segment and to assess its performance.
Where expenses, assets and liabilities cannot be split between the operating segments, they have been included within the unallocated segment.

38 POWERCO LTD Annual Report 2016 POWERCO LTD Annual Report 2016 39 Back to financial contents >
3. Revenue and other income
2016$000
2015$000
Line revenue 310,238 301,803
Pass-through and recoverable cost revenue 115,271 115,155
Customer contributions 20,363 18,804
Gas metering revenue 4,798 4,369
Total Revenue 450,670 440,131
Other income 6,570 5,771
Total Revenue and Other Income 457,240 445,902
PolicyLine revenue, pass-through and recoverable cost revenue, customer contributions and gas metering revenue are recognised at the fair value of the sales of goods or services provided. Revenue is recorded net of Goods and Services Tax (GST), rebates and discounts. Pass-through and recoverable costs include transmission costs, statutory levies and utility rates.
Revenue from services is recognised in the accounting period in which the services are rendered, based upon usage or volume throughput during that period.
The Group received contributions from customers towards the costs of reticulating new subdivisions, constructing uneconomic lines and relocating existing lines. The timing of the recognition of revenue arising from the transfer of property, plant and equipment depends on the separately identifiable services included in the agreement. The fair value received is allocated between the services, and the recognition criteria of NZ IAS 18 Revenue is then applied to each service individually. Where the revenue relates to the transfer of the asset, the revenue is recognised when the risks and rewards are transferred to the Group. When the revenue relates to the underlying contract obtained in the transfer, the revenue is recognised on a systematic basis over the life of the contract.
4. Finance costs
2016$000
2015$000
Interest on working capital 938 1,176
Interest on senior debt and related derivatives 78,711 75,550
Deferred funding costs and financial instrument fees 2,575 3,738
Interest attributed to funding of capital projects (2,069) (1,598)
80,155 78,866
PolicyBorrowing costs directly attributable to the acquisition, construction or production of qualifying assets, which are assets that take a substantial period of time to get ready for their intended use or sale, are added to the cost of those assets until such time as the assets are substantially ready for their intended use or sale.
All other borrowing costs are recognised in the profit or loss component of the Statement of Comprehensive Income in the period in which they are incurred.
Interest is attributed to projects expected to have costs exceeding $0.5 million, in which the construction period is expected to be greater than six months. Interest is calculated at 6.57% per annum (2015: 6.73%) using the weighted average capitalisation rate on borrowings.
5. Gains on financial instruments
2016$000
2015$000
Movement of derivatives held at fair value through profit or loss 49,275 96,203
Foreign exchange movement on debt held at amortised cost (54,828) (94,406)
Amortisation of debt previously held at fair value (i) 8,076 11,697
Amortisation of fair value movement on derivatives previously taken to reserves (ii) (679) (677)
Other gains on financial instruments 1,844 12,817
The movement of derivatives held at fair value through profit or loss includes a loss of $6.9 million attributable to the change in the credit risk of the liabilities (2015: loss of $15.7 million).
De-designation of hedge accountingIn the financial year ended 31 March 2013, the Group made the decision to stop hedge accounting and de-designate its existing hedge relationships. This decision was made for the purpose of reducing complexity and aiding transparency. All movements of derivatives held at fair value and foreign exchange movements on debt are now recorded as other gains/losses on financial instruments in the Statement of Comprehensive Income.
Further information regarding the hedge reserve is provided in note 20.
There are two balances resulting from when the Group hedge accounted which are being amortised, as follows:
(i) Debt balance resulting from the increase in the fair value of debt which is being amortised to profit or loss over its remaining life. At the end of the period there was a balance of $22.0 million remaining to be amortised over the next 12 years using the effective interest method in line with the debt settlement periods as disclosed in note 9 (2015: $30.1 million remaining to be amortised over 13 years).
(ii) Hedge reserve which contained the fair value movement on derivatives taken to reserves. This is being amortised to profit or loss over the remaining lives of the underlying exposures. At the end of the period there was a balance of $4.1 million remaining to be amortised over the next 12 years (2015: $4.6 million to be amortised over 13 years).
6. Taxation
2016$000
2015$000
Tax expense comprises:
Deferred tax expense on temporary differences 20,102 17,938
Adjustments recognised in current period in relation to the deferred tax of prior years 41 2,073
Total tax expense/(benefit) 20,143 20,011
The total charge for the period can be reconciled to the accounting profit as follows:
2016$000
2015$000
Profit before taxation 84,583 93,675
Tax at the New Zealand income tax rate of 28 per cent 23,683 26,229
Tax effect of losses transferred from Powerco New Zealand Holdings Ltd (11,044) (6,818)
Tax effect of revenue items that are not deductible in determining taxable profit 7,463 (1,473)
20,102 17,938
Adjustments recognised in current period in relation to the deferred tax of prior years 41 2,073
Total tax expense 20,143 20,011

40 POWERCO LTD Annual Report 2016 POWERCO LTD Annual Report 2016 41 Back to financial contents >
For the year ended 31 March 2016
OPENING BALANCE
$000
CHARGED TO PROFIT OR LOSS
$000
CHARGED TO OTHER COMPREHENSIVE
INCOME$000
CLOSING BALANCE
$000
Deferred tax liabilities
Property, plant and equipment 215,868 10,883 - 226,751
Derivatives (7,102) 16,046 190 9,134
Borrowings (13,925) (7,797) - (21,722)
Other 2,785 1,011 - 3,796
197,626 20,143 190 217,959
For the year ended 31 March 2015
OPENING BALANCE
$000
CHARGED TO PROFIT OR LOSS
$000
CHARGED TO OTHER COMPREHENSIVE
INCOME$000
CLOSING BALANCE
$000
Deferred tax liabilities
Property, plant and equipment 209,683 6,185 - 215,868
Derivatives (42,318) 35,027 189 (7,102)
Borrowings 7,802 (21,727) - (13,925)
Other 2,259 526 - 2,785
177,426 20,011 189 197,626
PolicyThe amount recognised for current tax is based on the net profit for the period as adjusted for non-assessable and non-deductible items. It is calculated using tax rates that have been enacted or substantively enacted by the reporting date.
Deferred income tax is provided, using the balance sheet liability method, on all temporary differences at the reporting date between the tax base of the assets and liabilities and their carrying amounts in the Statement of Financial Position.
The following temporary differences are not provided for: goodwill; the initial recognition of assets or liabilities that affect neither accounting nor taxable profit; and the temporary differences relating to investments in subsidiaries where the Group is able to control the reversal of the temporary differences and it is probable that the temporary differences will not reverse in the foreseeable future.
Deferred income tax assets and liabilities are measured at tax rates that are expected to apply to the year when the asset is realised or the liability is settled, based on tax rates that have been enacted or substantively enacted at the reporting date.
The measurement of deferred tax liabilities and assets reflects the tax consequences that would follow the manner in which the Group expects, at the reporting date, to recover or settle the carrying amount of its assets and liabilities.
Deferred tax assets and liabilities are offset when they relate to income taxes levied by the same taxation authority and the Group intends to settle its current tax assets and liabilities on a net basis.
Current and deferred tax is recognised as an expense or benefit in the profit or loss component of the Statement of Comprehensive Income, except when it relates to items credited or debited in other comprehensive income or directly in equity. In this case, the deferred tax or current tax is also recognised in other comprehensive income or directly in equity. Where it arises from the initial accounting for a business combination, it is taken into account in the determination of goodwill.
7. Property, plant and equipment
NETWORK SYSTEMS
$000
WORK IN PROGRESS
$000
LAND AND BUILDINGS
$000
PLANT AND EQUIPMENT
$000TOTAL
$000
At 31 March 2014
Cost 2,516,216 49,147 15,213 33,105 2,613,681
Accumulated depreciation 702,969 - 4,297 29,973 737,239
Net book value 1,813,247 49,147 10,916 3,132 1,876,442
Movements in the year ended 31 March 2015
Opening net book value 1,813,247 49,147 10,916 3,132 1,876,442
Additions 58 129,021 23 1,217 130,319
Transfers 124,965 (125,069) - 104 -
Disposals (13,141) - - (10) (13,151)
Depreciation expense (70,971) - (517) (1,702) (73,190)
Closing net book value 1,854,158 53,099 10,422 2,741 1,920,420
At 31 March 2015
Cost 2,617,620 53,099 15,236 33,718 2,719,673
Accumulated depreciation 763,462 - 4,814 30,977 799,253
Net book value 1,854,158 53,099 10,422 2,741 1,920,420
Movements in the year ended 31 March 2016
Opening net book value 1,854,158 53,099 10,422 2,741 1,920,420
Additions 54 139,560 545 2,708 142,867
Transfers 144,762 (149,430) 310 4,358 -
Disposals (13,641) - - (2) (13,643)
Depreciation expense (69,690) - (542) (1,662) (71,894)
Closing net book value 1,915,643 43,229 10,735 8,143 1,977,750
At 31 March 2016
Cost 2,735,659 43,229 16,091 40,780 2,835,759
Accumulated depreciation 820,016 - 5,356 32,637 858,009
Net book value 1,915,643 43,229 10,735 8,143 1,977,750
Note 4 Finance costs provides details of borrowing costs capitalised during the period.

42 POWERCO LTD Annual Report 2016 POWERCO LTD Annual Report 2016 43 Back to financial contents >
Policy
Property, plant and equipmentAll items of property, plant and equipment are initially recognised at cost in the Statement of Financial Position. Cost includes the value of consideration exchanged and those costs directly attributable to bringing the item to working condition for its intended use.
Work in progress is carried at cost in the Statement of Financial Position and is not depreciated. A transfer out of work in progress to the relevant asset class takes place when an asset is commissioned or is ready for its intended use.
With the exception of a small number of non-network assets that are calculated using diminishing value, depreciation is calculated on a straight-line basis to write off the cost of the assets (other than land) over their useful lives. The estimated useful lives, residual values and depreciation methods are reviewed at the end of each reporting period, with the effect of any change in estimate accounted for from the start of the period.
Depreciation rates based on remaining useful life, for major classes of asset are:
Land Not depreciated
Buildings 4 to 50 years
Plant and equipment 3 to 28 years
Network systems 8 to 70 years
The gain or loss on the disposal or retirement of an item of property, plant and equipment is determined as the difference between the sales proceeds and the carrying amount of the asset and is recognised in the profit or loss component of the Statement of Comprehensive Income.
Classification of expenditure in relation to property, plant and equipment and software intangiblesOn initial recognition of items of property, plant and equipment and software intangibles, judgement must be made about whether costs incurred bring the item to working condition for their intended use and therefore should be capitalised as part of the cost of the item, or whether they should be expensed. Judgement is applied to assess the amount of overhead costs which can be reasonably directly attributed to the construction or acquisition of property, plant and equipment and software intangibles.
ImpairmentAt each reporting date, the group reviews the carrying amounts of its tangible and intangible assets to determine whether there is any indication that those assets have suffered an impairment loss. If any such indication exists, the recoverable amount of the asset is estimated to determine the extent of the impairment loss (if any). Where the asset does not generate cash flows that are independent from other assets, the Group estimates the recoverable amount of the cash-generating unit to which the asset belongs. A cash-generating unit is the smallest group of assets for which there are separately identified cash flows.
Recoverable amount is the higher of fair value less costs to sell and value in use. In assessing value in use, the estimated future cash flows are discounted to their present value using a pre-tax discount rate that reflects current market assessments of the time-value of money and the risks specific to the asset for which the estimates of future cash flows have not been adjusted.
If the recoverable amount of an asset (or cash-generating unit) is estimated to be less than its carrying amount, the carrying amount of the asset (or cash-generating unit) is reduced to its recoverable amount. An impairment loss is recognised immediately in the profit or loss component of the Statement of Comprehensive Income, unless the relevant asset is carried at fair value, in which case the impairment loss is treated as a revaluation decrease.
Where an impairment loss subsequently reverses, the carrying amount of the asset (or cash-generating unit) is increased to the revised estimate of its recoverable amount, but only to the extent that the increased carrying amount does not exceed the carrying amount that would have been determined had no impairment loss been recognised for the asset (or cash-generating unit) in prior years. A reversal of an impairment loss is recognised immediately in the profit or loss component of the Statement of Comprehensive Income, unless the relevant asset is carried at fair value, in which case the reversal of the impairment loss is treated as a revaluation increase.
8. Intangible assets
SOFTWARE $000
EASEMENTS$000
TOTAL$000
At 31 March 2014
Cost 30,796 4,085 34,881
Accumulated depreciation 20,400 - 20,400
Net book value 10,396 4,085 14,481
Movements in the year ended 31 March 2015
Opening net book value 10,396 4,085 14,481
Additions 5,700 364 6,064
Amortisation expense (3,294) - (3,294)
Closing net book value 12,802 4,449 17,251
At 31 March 2015
Cost 36,496 4,449 40,945
Accumulated depreciation 23,694 - 23,694
Net book value 12,802 4,449 17,251
Movements in the year ended 31 March 2016
Opening net book value 12,802 4,449 17,251
Additions 4,860 (508) 4,352
Amortisation expense (5,004) - (5,004)
Closing net book value 12,658 3,941 16,599
At 31 March 2016
Cost 41,356 3,941 45,297
Accumulated depreciation 28,698 - 28,698
Net book value 12,658 3,941 16,599
PolicyIntangible assets are comprised of computer software and easements. Computer software have finite lives while easements have an indefinite life. Easements are deemed to have an indefinite life as the right to access the land for the purpose of installation and maintenance of network assets does not have a maturity date and can not be traded.
Intangible assets acquired separately (purchased) are reported at cost less accumulated amortisation and accumulated impairment losses. Amortisation is charged on a diminishing value basis over their useful lives. The estimated useful lives, residual value and amortisation methods are reviewed at the end of each reporting period, with the effect of any changes in estimates being accounted for from the start of the period.
Intangible assets acquired in a business combination are identified and recognised separately from goodwill where they satisfy the definition of an intangible asset and their fair values can be measured reliably. The cost of such intangible assets is the fair value at the acquisition date.
Amortisation of intangibles is calculated on a diminishing value basis for computer software over their useful lives.
Amortisation rates based on remaining useful life for computer software is 4 to 55 years. Easements are not amortised.
The policy regarding impairment of intangible assets is included in note 7.

44 POWERCO LTD Annual Report 2016 POWERCO LTD Annual Report 2016 45 Back to financial contents >
The following information provides details of the borrowings listed in the previous tables.
AMOUNT $000
ISSUE DATE
INTEREST RATE MATURITY
RISK MITIGATED BY:
(a) Guaranteed bonds
12 year guaranteed bonds – secured 50,000 Sep 2005 6.74% fixed Sep 2017 Fixed rate
(b) Wholesale bonds
7 year fixed rate bonds 65,000 Dec 2011 6.31% fixed Dec 2018 Fixed rate
7 year floating rate bonds 35,000 Dec 2011 90 day bank bill rate plus a margin
Dec 2018 Interest rate swaps
7 year fixed rate bonds 150,000 Sep 2015 4.76% fixed Sep 2022 Fixed rate
(c) US Dollar private placement notes
13 year notes – 2003 issue 109,299 Nov 2003 5.67% fixed Nov 2016 US cross currency & interest rate swaps
9 year notes – 2011 issue 91,371 Jun 2011 4.36% fixed Jun 2020 US cross currency & interest rate swaps
12 year notes – 2011 issue 114,213 Jun 2011 4.56% fixed Jun 2023 US cross currency & interest rate swaps
15 year notes – 2011 issue 105,330 Jun 2011 4.86% fixed Jun 2026 US cross currency & interest rate swaps
12 year notes – 2013 issue 30,440 Jan 2013 3.40% fixed Jan 2025 US cross currency & interest rate swaps
15 year notes – 2013 issue 97,407 Jan 2013 3.60% fixed Jan 2028 US cross currency & interest rate swaps
(d) NZ Dollar private placement notes
12.5 year notes – 2014 issue 135,000 Oct 2014 6.62% fixed Apr 2027 Fixed rate
The comparative period included all of the borrowings listed in (a) to (d) above, with the addition of the following borrowings that matured during the period:
(a) 11 year bonds 50,000 Mar 2004 6.53% fixed Jun 2015 Fixed rate
(c) 12 year notes – 2003 issue 90,802 Nov 2003 5.57% fixed Nov 2015 US cross currency and interest rate swaps
9. Borrowings
As at 31 March 2016
FACE VALUE $000
FAIR VALUE ADJUSTMENT
$000
DEFERRED FUNDING COSTS
$000
ACCRUED INTEREST
$000TOTAL
$000
Current and non-current liabilities at amortised cost
Guaranteed bonds (a) 50,000 - (177) 37 49,860
Wholesale bonds (b) 250,000 - (529) 1,296 250,767
US dollar private placement notes (c) 548,059 74,614 (1,829) 3,911 624,754
NZ dollar private placement notes (d) 135,000 - (714) 1,789 136,075
Bank debt (e) 205,300 - (69) 1,078 206,308
1,188,359 74,614 (3,318) 8,109 1,267,763
Current portion 154,599 (13,304) (50) 8,109 149,354
Non-current portion 1,033,760 87,918 (3,268) - 1,118,409
1,188,359 74,614 (3,318) 8,109 1,267,763
As at 31 March 2015
FACE VALUE $000
FAIR VALUE ADJUSTMENT
$000
DEFERRED FUNDING COSTS
$000
ACCRUED INTEREST
$000TOTAL
$000
Current and non-current liabilities at amortised cost
Guaranteed bonds (a) 100,000 385 (333) 35 100,087
Wholesale bonds (b) 100,000 - (199) 1,188 100,989
US dollar private placement notes (c) 638,861 18,766 (2,185) 4,420 659,862
NZ dollar private placement notes (d) 135,000 - (778) 1,495 135,717
Bank debt (e) 186,500 - (141) 590 186,949
1,160,361 19,151 (3,636) 7,728 1,183,604
Current portion 140,802 (16,503) (88) 7,728 131,939
Non-current portion 1,019,559 35,654 (3,548) - 1,051,664
1,160,361 19,151 (3,636) 7,728 1,183,604
The fair value adjustment includes:
– Debt balance resulting from the increase in the fair value of debt which is being amortised to profit or loss over its remaining life. Refer to note 5(i) for further details.
– Valuation of debt as a result of movements in the NZD/USD exchange rate.

46 POWERCO LTD Annual Report 2016 POWERCO LTD Annual Report 2016 47 Back to financial contents >
Excluded from the comparative borrowings is the $150 million wholesale bond issued during this financial period.
2016 FLOATING INTEREST
RATE
FACILITY AMOUNT
$000
AMOUNT DRAWN
$000ISSUE DATE MATURITY
RISK MITIGATED
BY:
(e) Revolving Cash Facility 1 – Tranche A 2.58% 100,000 60,000 Apr 2012 Apr 2017 Interest rate swaps
(e) Revolving Cash Facility 2 2.65% 75,000 75,000 Mar 2015 Mar 2019 Interest rate swaps
(e) Revolving Cash Facility 3 2.63% 25,000 25,000 Mar 2015 Mar 2019 Interest rate swaps
(e) Working Capital Facility 2.25% 50,000 45,300 Mar 2014 Mar 2017 Interest rate swaps
In addition, Powerco has a revolving cash facility for $75 million that was issued in March 2015. As at 31 March, no funds were drawn down against this facility.
2015 FLOATING INTEREST
RATE
FACILITY AMOUNT
$000
AMOUNT DRAWN
$000ISSUE DATE MATURITY
RISK MITIGATED
BY:
(e) Revolving Cash Facility 1 – Tranche A 3.72% 100,000 55,000 Apr 2012 Apr 2017 Interest rate swaps
(e) Revolving Cash Facility 1 – Tranche B 3.63% 75,000 75,000 Mar 2015 Mar 2019 Interest rate swaps
(e) Revolving Cash Facility 2 3.63% 25,000 25,000 Mar 2015 Mar 2019 Interest rate swaps
(e) Working Capital Facility 3.50% 50,000 31,500 Mar 2014 Mar 2017 Interest rate swaps
The Group operates a $2 million overdraft facility. As at 31 March 2016, there were no drawings against this facility (2015: no drawings).
The guaranteed bonds, wholesale bonds, US dollar private placement notes, revolving cash facilities and working capital facility are all secured against the assets of the Company through the Security Trust Deed.
The scheduled payments of guaranteed bonds and related interest are guaranteed on an unsecured basis by US-based Syncora Guarantee Inc. (Syncora), a specialist financial guaranty organisation. Under a trust document relating to the guaranteed bonds, the Company has covenanted to ensure that, if Syncora defaults on its obligations under the financial guaranty, the Company will procure a sufficient number of its subsidiaries to guarantee its obligations under the guaranteed bonds by signing a subsidiary guarantee so that at all times the total tangible assets of the Company and all guaranteeing subsidiaries exceeds 85% of the total tangible assets of the Group. As at balance date, no default by Syncora had occurred.
CovenantsThe Company has covenanted with all counterparties to ensure certain financial criteria is met throughout the term of the debt agreements. These covenants include minimum interest coverage ratios, minimum net worth and maximum gearing or leverage ratios. Covenants also include various comparisons of the Guaranteeing Group earnings and assets under the Security Trust Deed to earnings and assets of the Group. There have been no breaches.
PolicyAll borrowings are initially recognised at the fair value of the consideration received, less issue costs associated with the borrowing. Subsequent to initial recognition, loans and borrowings are carried at amortised cost, using the effective interest rate method, which allocates the cost through the expected life of the borrowing. Borrowing costs are recognised as an expense when incurred, except to the extent that they are capitalised in accordance with the policy in note 4.
Payments of US dollar private placement note interest is made in US dollars and is exactly offset by the proceeds of cross-currency swaps. As a result, the accounting treatment is not affected by movements in exchange rates.
Borrowings are classified as current liabilities unless the Group has an unconditional right to defer settlement of the liability for at least 12 months after the reporting date.
10. Other financial assets and liabilities
The Company enters into various financial instruments to either eliminate or manage its exposures to foreign currencies and interest rate movements. Cross Currency Interest Rate Swap Agreements are used to economically convert exposures to US dollar borrowings and US interest rates to NZD borrowings and NZ interest rates. Interest rate swaps are used to economically convert our exposure to floating interest rates to fixed rates. Other financial instruments may be used from time to time to reduce risk.
Derivative instruments are initially recognised at fair value on the contract date and subsequently measured at their fair value on each reporting date. Derivative instruments are undertaken as economic hedges of exposures, but are not hedge accounted. Changes in the fair value of derivative instruments are recognised in the profit or loss component of the Statement of Comprehensive Income.
The fair value of financial derivatives and fixed rate debt is determined based on current market information from independent valuation sources. Refer to note 11(g) for further information.
The fair value of derivatives is disclosed in the financial statements as follows:
2016 $000
2015 $000
Other current financial assets
Interest rate swaps - 304
Foreign exchange contracts - 15
- 319
Other non-current financial assets
US cross currency interest rate swap 102,703 52,733
Interest rate swaps 29,153 15,072
131,856 67,805
Other current financial liabilities
US cross currency interest rate swap (12,879) (16,492)
Interest rate swaps (4,203) (3,247)
Foreign exchange contracts - (45)
(17,081) (19,784)
Other non-current financial liabilities
US cross currency interest rate swap - (16,379)
Interest rate swaps (82,156) (57,326)
(82,156) (73,705)
Fair value of assets and liabilities 32,619 (25,365)
Powerco enters into derivative transactions under International Swaps and Derivatives Association (ISDA) Master Agreements and Schedules. The various asset and liability valuation positions of these instruments are not offset against each other in the Statement of Financial Position. In the event of an early termination of the ISDA agreements, these assets and liabilities are able to be offset. Refer to the table above for the asset and liability of these instruments.
The Group holds the following instruments:

48 POWERCO LTD Annual Report 2016 POWERCO LTD Annual Report 2016 49 Back to financial contents >
NOTIONAL PRINCIPAL FAIR VALUEMOVEMENT OF DERIVATIVES HELD AT
FAIR VALUE THROUGH PROFIT OR LOSS
AS AT 2016 $000
AS AT 2015 $000
AS AT 2016 $000
AS AT 2015 $000
FOR THE PERIOD ENDED
MAR 2016 $000
FOR THE PERIOD ENDED
MAR 2015 $000
1 – US cross currency swaps 548,059 638,861 89,824 19,862 61,252 113,485
2 – Interest rate swaps (pay floating) 285,000 185,000 29,153 15,375 13,777 13,913
3 – Interest rate swaps (pay fixed) 1,375,000 1,333,000 (86,358) (60,572) (25,785) (31,221)
4 – Foreign exchange contracts - 801 - (30) 30 26
2,208,059 2,157,662 32,619 (25,365) 49,274 96,203
Policy
Financial assetsFinancial assets are recognised and derecognised on trade date where the purchase or sale of an investment is under a contract where the terms require delivery of the investment within the timeframe established by the market concerned. They are initially measured at fair value plus transaction costs, except for those financial assets classified as at fair value through profit or loss, which are initially measured at fair value.
Subsequent to initial recognition, investments in subsidiaries are measured at cost less impairment.
Other financial assets are classified into one of four categories: Financial assets at fair value through profit or loss; held to maturity investments; available for sale financial assets; or loans and receivables. At balance date, the Group had the following classes of financial assets:
Financial assets at fair value through profit or lossOther financial assets relate to derivatives held at period end. All derivative assets are measured at fair value through profit or loss and are classified as held for trading.
Loans and receivablesCash and cash equivalents, trade and other receivables (excluding prepayments) and bank accounts are initially measured at fair value, net of transaction costs. They are subsequently measured at amortised cost using the effective interest rate method, less impairment. Trade receivables that are assessed not to be impaired individually are subsequently assessed for impairment on a collective basis. Objective evidence of impairment for trade receivables includes the Group’s past experience of collecting payments, an increase in the number of delayed payments past the average credit period of 30 days, as well as observable changes in national, local or industry economic conditions that correlate with default on receivables.
ImpairmentFinancial assets, other than those at fair value through profit or loss, are assessed for indicators of impairment at the end of each reporting period. Financial assets are impaired where there is objective evidence that, as a result of one or more events that occurred after the initial recognition of the financial asset, the estimated future cash flows of the investment have been impacted. An impairment loss is recognised immediately in profit or loss. Where an impairment loss subsequently reverses, the carrying amount of the asset is increased to the revised estimate of its recoverable amount, but the increased carrying amount does not exceed the carrying amount that would have been determined had no impairment loss been recognised for the asset in prior periods. A reversal of an impairment loss is recognised immediately in profit or loss.
Financial liabilitiesFinancial liabilities are recognised when the entity becomes party to the contractual provisions of the instrument. The Group derecognises financial liabilities when the Group’s obligations are discharged, cancelled or expire. Financial liabilities are classified as either financial liabilities at fair value through profit or loss or other financial liabilities.
Financial liabilities at fair value through profit or loss All derivative liabilities are measured at fair value through profit or loss.
Other financial liabilitiesTrade and other payables, borrowings and inter-company accounts/loans are initially measured at fair value, net of transaction costs. They are subsequently measured at amortised cost using the effective interest method, with interest expense recognised on an effective interest basis.
11. Financial instruments a) Capital risk management
The Group manages its levels of debt and equity to ensure an efficient capital structure while maintaining certain internal financial ratios. The Group’s Treasury Policy specifies a long term target for total debt to equity. This is managed both by reviewing debt levels and altering distributions, which influence the balance of equity. The Group also complies with financial covenants agreed with lenders as part of financing arrangements as set out in note 9.
b) Risk management The Group manages risks in accordance with policies approved by the Board of Directors. Compliance with these policies
is monitored by the Board of Directors on a regular basis. The Treasury Policy is the fundamental policy that determines how risk management is governed.
The financial instruments that the Company holds exposes it to the following risks:
(1) Market risk
(2) Credit risk
(3) Liquidity risk
(1) Market risk
(i) Currency risk Currency risk is the risk that the fair value or future cash flows of a financial instrument or transaction will fluctuate
because of changes in foreign exchange rates. The Group operates in New Zealand and has foreign exchange exposures arising from US dollar denominated debt and the purchase of items of property, plant and equipment in foreign currencies.
This exposes the Group to potential gains and losses arising from currency movements. The policy relating to US dollar denominated debt is to eliminate the exchange rate exposure by use of matching cross currency and interest rate contracts taken out at the time the loans are drawn down and by entering forward exchange contracts when items of property, plant and equipment are ordered. Refer to notes 11(d) and 11(e) for further information.
(ii) Interest rate exposures Interest rate risk is the risk that the future cash flows of a financial instrument will fluctuate because of changes in market
interest rates, thereby changing the cost of borrowing or the return on cash and cash equivalents.
The Group’s short-term borrowings are on a floating interest rate basis. The Group has entered into interest rate swaps to reduce the impact on its borrowings of changes in interest rates. These derivatives are entered into in accordance with the Treasury Policy approved by the Board of Directors, which provides parameters on the level and duration of borrowings that must be hedged. Hedging activities are monitored and evaluated regularly to ensure that the most cost-effective economic hedging strategies are being applied.
Cash and cash equivalents are held at floating interest rates. The Group does not enter into derivatives in relation to these balances. Refer to notes 11(c) and 11(e) for further information.
(2) Credit risk Credit risk is the risk that the counterparty to a financial asset will default on its obligations and consequently cause
loss to the Group. The financial assets that expose the Group to credit risk are bank balances and accounts receivable. The maximum credit risk is the carrying value of each of these assets. There are concentrations of credit risk in regards to retailers. This risk is mitigated by the use of prudentials and ensuring retailers meet our credit rating standard.
Credit risk is managed in the following ways:
• Accountsreceivable–theGroupundertakescreditchecksforallthoseseekingcreditandwillonlyprovidecredittothose with an acceptable credit rating. Each credit customer has a credit limit and compliance with limits is monitored on a regular basis. In addition, compliance with payment terms is monitored on a regular basis and debtors in arrears are subject to collection action.
• Cashandcashequivalents–cashdepositsareonlymadewithregisteredbanks.
3) Liquidity risk Liquidity risk is the risk that the Group may be unable to meet its financial obligations as they fall due. This risk is
managed by maintaining sufficient cash and deposits, together with access to committed credit facilities, and forecasting and monitoring liquidity levels on a continuous basis. The Group adheres to a Treasury Policy, approved by the Board of Directors, which specifies the levels of liquidity that must be maintained to meet short term requirements and further stipulates timeframes for refinancing maturing debt. Note 9 provides details of additional undrawn facilities that the Group has at its disposal to reduce liquidity risk. Refer to note 11(f) for further information.

50 POWERCO LTD Annual Report 2016 POWERCO LTD Annual Report 2016 51 Back to financial contents >
c) Interest rate swap contracts Under interest rate swap contracts, the Company agrees to exchange the difference between fixed and floating rate interest amounts
calculated on agreed notional principal amounts. Such contracts enable the Company to mitigate the risk of changing interest rates on debt held. The fair value of interest rate swaps is determined by discounting the future cash flows using the yield curve at the reporting date. The average interest rate is based on the outstanding balances at the end of the financial year. The interest rate swaps settle on a quarterly basis, with the Company paying or receiving the difference between fixed and floating interest rate.
d) Foreign currency sensitivity analysis The Company’s foreign currency borrowings are 100% economically hedged against movements in the NZD/USD exchange
rate. Any movements in the value of borrowings, or the interest payable due to a movement in the exchange rate, is offset by an equal and opposite movement in the value and cash flows applicable to the hedge. The Company holds a small number of forward exchange contracts to hedge capital expenditure purchases in currencies other than New Zealand dollars.
e) Interest rate and foreign currency sensitivity analysis The following table details the Company’s sensitivity to a 100 basis point increase and decrease in the New Zealand interest
rates across the entire curve, with all other variables held constant as at the reporting date. The rate of 100 basis points is Powerco’s and the industry-accepted sensitivity rate used for analysing volatility through interest rate movements, and represents management’s assessment of the possible change in interest rates. This analysis includes cash flows on floating debt, and the cash flows on floating debt, and the cash flows and valuation movements on interest rate derivatives.
The table below details the sensitivity to changes in the exchange rate and interest rate:
FOREIGN CURRENCY SENSITIVITY ANALYSIS INTEREST RATE SENSITIVITY ANALYSIS
2016 $000
2015 $000
2016 $000
2015 $000
Net profit before tax +100 basis points (1,574) (1,334) 11,720 28,334
Net profit before tax -100 basis points 1,620 1,369 (11,076) (29,131)
Total equity +100 basis points (1,574) (1,334) 11,720 28,334
Total equity -100 basis points 1,620 1,369 (11,076) (29,131)
f) Liquidity profile of financial instruments These tables are based on the undiscounted contractual maturities of financial instruments, including interest payments and
the future contractual settlements for derivatives. For non-derivative floating rate liabilities and the floating rate portion of derviative instruments, the forecast cash flow is based on the floating rate applicable at the end of the reporting period.
2016LESS THAN
1 YEAR1 - 2
YEARS3 - 5
YEARSOVER 5 YEARS
TOTAL CONTRACTUAL
CASH FLOWS
Non-derivative financial liabilities
Trade and other payables 40,965 - - - 40,965
Current secured borrowings 146,164 - - - 146,164
Non-current secured borrowings 52,244 404,697 177,528 837,208 1,471,677
239,374 404,697 177,528 837,208 1,658,806
Derivative (assets)/liabilities
Net settled interest rate swaps 22,165 40,522 4,572 (27,097) 40,163
Gross settled cross currency interest rate swaps:
– (inflow) (121,128) (43,439) (145,375) (483,408) (793,350)
– outflow 131,161 38,096 126,530 418,559 714,346
Gross settled foreign exchange contracts:
– (inflow) - - - - -
– outflow - - - - -
Net value of derivative transactions 32,198 35,179 (14,273) (91,946) (38,841)
2015 LESS THAN 1 YEAR 1 - 2 YEARS 3 - 5 YEARS OVER 5 YEARS
TOTAL CONTRACTUALCASH FLOWS
Non-derivative financial liabilities
Trade and other payables 37,868 - - - 37,868
Current secured borrowings 127,138 - - - 127,138
Non-current secured borrowings 51,049 317,083 269,145 763,576 1,400,852
216,055 317,083 269,145 763,576 1,565,859
Derivative (assets)/liabilities
Net settled interest rate swaps 16,586 23,757 16,838 (15,839) 41,342
Gross settled cross currency interest rate swaps:
– (inflow) (101,347) (132,138) (40,183) (561,549) (835,217)
– outflow 121,958 162,412 49,416 629,369 963,155
Gross settled foreign exchange contracts:
– (inflow) (768) - - - (768)
– outflow 801 - - - 801
Net value of derivative transactions 37,230 54,031 26,071 51,981 169,313
g) Fair values Carrying value approximates fair value for the following assets and liabilities:
Cash and cash equivalents Trade and other receivables
Other current assets Other current liabilities
Trade and other payables Commercial bank debt and working capital advances
Finance lease receivable
Derivatives are the only items carried at fair value. Refer to note 10 for further information.
For the following liabilities, fair value does not equate to carrying value:
2016 CARRYING
AMOUNT $000
2016 FAIR
VALUE $000
2015 CARRYING
AMOUNT $000
2015 FAIR
VALUE $000
Financial liabilities
Guaranteed bonds 49,860 52,264 100,087 102,581
Wholesale bonds 250,767 260,136 100,989 104,588
US dollar private placement notes 624,754 602,715 659,862 630,063
NZD private placement notes 136,075 159,475 135,717 150,789
1,061,455 915,115 860,938 837,232
The fair value of financial assets and financial liabilities are determined as follows:
– For floating rate debt, carrying value approximates fair value due to continuing interest rate reset.
– The fair value of financial derivatives and fixed rate debt are determined by reference to the market quoted rates input into discounted cash flow valuation models.
The valuation method takes into account the interest rate curve and foreign exchange rates by calculating the discounted future cash flows on derivatives and debt at the reporting date. The risk of non-performance by each party is also taken into account.

52 POWERCO LTD Annual Report 2016 POWERCO LTD Annual Report 2016 53 Back to financial contents >
The following market interest rates and currency rates were used for valuation purposes:
NZ SWAP RATES 2016
NZ SWAP RATES 2015
US SWAP RATES 2016
US SWAP RATES 2015
Reporting date rates
1 year swap rate 2.19% 3.54% 0.74% 0.69%
2 year swap rate 2.20% 3.51% 0.84% 0.81%
3 year swap rate 2.27% 3.54% 0.95% 1.11%
4 year swap rate 2.38% 3.58% 1.06% 1.35%
5 year swap rate 2.50% 3.62% 1.17% 1.53%
7 year swap rate 2.72% 3.69% 1.39% 1.79%
10 year swap rate 2.98% 3.75% 1.64% 2.02%
15 year swap rate 3.31% 3.85% 1.90% 2.23%
2016 2015
NZD/USD rate 0.69094 0.74694
The above rates have been sourced from Bloomberg.
Fair value measurements recognised in the Statement of Financial Position All financial instruments that are measured subsequent to initial recognition at fair value on a recurring basis can be grouped
into Levels 1 to 3 based on the degree to which the fair value is observable:
1) Level 1 fair value measurements are those derived from quoted prices (unadjusted) in active markets for identical assets or liabilities
2) Level 2 fair value measurements are those derived from inputs other than quoted prices included in Level 1 that are observable for the asset or liability, either directly (ie prices) or indirectly (ie derived from prices)
3) Level 3 fair value measurements are those derived from valuation techniques that include inputs for the asset or liability that are not based on observable market data (unobservable inputs).
NZD interest rate swap contracts, foreign exchange contracts, USD cross currency interest rate swaps, guaranteed bonds, wholesale bonds, US dollar private placement notes and NZ dollar private placement notes are all categorised as Level 2.
Policy
Derivative financial instruments Financial derivatives are initially recognised in the Statement of Financial Position at fair value on the date a derivative contract
is entered into and are subsequently measured at their fair value on each reporting date. When derivative contracts are are entered into, the Group determines whether it wishes to hedge account or not. If it does not it designates them as either:
– Hedges of the fair value of recognised assets or liabilities (fair value hedge); or
– Hedges of forecast transactions or firm commitments (cash flow hedge) which hedge exposures to variability in cash flows; or
– Other derivative financial instruments not meeting hedge accounting criteria.
The fair values of financial derivatives are determined by using market-quoted rates as inputs into valuation models for interest and currency swaps, forwards and options. The risk of non-performance as an input is also required. Changes in fair value of derivatives are recognised:
– For fair value hedges, the movements are recorded in the profit or loss component of the Statement of Comprehensive Income alongside any changes in the fair value of the hedged items; and
– All other movements in the fair value of derivative financial instruments are recorded in the profit or loss component of the Statement of Comprehensive Income.
12. Trade and other receivables
2016 $000
2015 $000
Trade receivables 35,354 35,945
Impairment allowance (300) (300)
Prepayments 1,636 1,616
Trade and other receivables 36,690 37,261
Debtor ageing
2016 $000
2015 $000
Current 33,380 34,499
Past due 0 to 30 days 135 58
Past due 31 to 120 days 515 122
121+ days 1,324 1,266
35,354 35,945
The average credit or settlement terms are generally up to 30 days depending on the specific contract terms. These terms and other provisions, including recovery of overdue amounts, are stated in the retailer contract and are specified on tax invoices for non-retailer debtors. Retailer contracts provide for an interest rate in the event of payment default of 3% over the bank base rate.
At period end there were no overdue accounts being charged interest. Overdue accounts relate to third party damages and customer initiated contract work, for which no collateral is held.
The Group enters contractual arrangements with credit-worthy retailers, and conducts active credit evaluations on these retailers to minimise credit risk.
A review of the debtors’ aged trial balance, primarily third party damages, occurs monthly to ensure no debtor is impaired and that the impairment allowance is sufficient. There was no change to the impairment allowance during the period.
PolicyThe impairment allowance on receivables is assessed on a portfolio basis, based on historical delinquency rates and losses. Bad debts are written off when identified.
13. Trade and other payables
2016 $000
2015$000
Trade payables and accruals 40,849 37,294
GST payable 116 574
40,965 37,868
Trade payables and accruals principally comprise amounts outstanding for trade purchases and ongoing costs. On average, the creditors are paid on the 20th of the following month, unless a different term of credit is specified on the invoice.
PolicyTrade payables and other accounts payable are recognised when the Group becomes obliged to make future payments resulting from the purchase of goods and services. These are initially recognised at fair value. Subsequent to initial recognition, trade payables and other accounts payable are recorded at amortised cost. As trade and other payables are usually paid within 30 days, they are carried at face value.

54 POWERCO LTD Annual Report 2016 POWERCO LTD Annual Report 2016 55 Back to financial contents >
14. Finance lease receivable
MINIMUM FUTURE LEASE PAYMENTS
PRESENT VALUE OF MINIMUM FUTURE LEASE PAYMENTS
2016 $000
2015 $000
2016 $000
2015 $000
Amount receivable under finance lease
Not later than one year 1,413 1,390 465 429
Later than one year and not later than five years 5,839 5,767 2,279 2,104
Later than five years 11,400 12,885 6,729 7,369
Minimum future lease payments 18,652 20,042 9,473 9,902
Unguaranteed residual value - - - -
Gross finance lease receivable 18,652 20,042 9,473 9,902
Less unearned finance income (9,179) (10,140)
9,473 9,902 9,473 9,902
Classified as:
Current 465 429
Non-current 9,008 9,473
9,473 9,902
Powerco Transmission Services Ltd entered into a lease with NZ Windfarms Ltd. The term of the lease is 20 years, with an expiry in 2028. The interest rate inherent in the lease is fixed at the contract date for the entire lease term. The effective interest rate on the finance lease receivable is 10.15% per annum.
PolicyLeases are classified as finance leases whenever the terms of the lease transfer substantially all the risks and rewards of ownership to the lessee. Amounts due from lessees under finance leases are recorded as receivables at the amount of the Group’s net investment in the leases. Finance lease income is allocated to accounting periods so as to reflect a constant periodic rate of return on the Group’s net investment outstanding in respect of the leases.
15. Operating leases
2016 $000
2015 $000
Lease payments under operating leases recognised as an expense in the period 1,892 1,878
Operating lease obligations payable after balance date on non-cancellable leases are as follows:
Within one year 1,480 1,422
One to five years 2,334 2,586
More than five years 437 662
4,251 4,670
Operating lease payments represent amounts payable by the Group for certain office property leases, substation and radio communication licences and vehicle leases. Property leases are negotiated for terms of one to five years, with rights of renewal on most leases. Substation and radio communication licence terms range from one to 33 years, with rights of renewal on most licences. Vehicle leases are for a term of three years.
PolicyLeases that do not meet the criteria of a finance lease are classified as operating leases.
16. Employee benefits
2016 $000
2015 $000
Current portion 4,961 4,837
Non-current portion 1,818 1,585
6,779 6,422
The provision for employee benefits includes accrued wages, bonuses, redundancy, accrued holiday pay and long service leave. The provision is affected by a number of estimates, including the expected employment period of employees, the future earnings of the employees and the timing of employees utilising the benefits. The majority of the provision is expected to be realised within the next two years.
Employee benefit expenses of $35.8 million were incurred during the period (2015: $34.8 million). Employer contributions to defined contribution schemes of $1.1 million were incurred during the period (2015: $1.0 million).
PolicyProvision is made for benefits accruing to employees in respect of wages and salaries, annual leave and long-service leave when it is probable that settlement will be required and they are capable of being measured reliably.
Provisions made in respect of employee benefits expected to be settled within 12 months are measured at their nominal values using the remuneration rate expected to apply at the time of settlement.
Provisions made in respect of employee benefits that are not expected to be settled within 12 months are measured as the present value of the estimated future cash outflows to be made by the Group in respect of services provided by employees up to reporting date.
17. Auditor remuneration
2016 $000
2015$000
Amounts paid or payable to the auditor for:
Audit of financial statements
Audit of financial statements 195 215
Review of interim financial statements 35 35
Other assurance services
Regulatory audit services 112 121
Trustee reporting 5 5
347 376
Regulatory audit services consists of the audit of regulatory disclosure statements and the compliance statements.

56 POWERCO LTD Annual Report 2016 POWERCO LTD Annual Report 2016 57 Back to financial contents >
18. Related partiesRelated party transactions
2016 $000
2015 $000
Transactions between Powerco Ltd and PNZHL
– Dividends paid to PNZHL 58,708 54,971
– Tax losses made available to the Group from PNZHL 41,048 24,352
PNZHL transfers tax losses to the Powerco Group for nil consideration either via a loss offset or through the use of a consolidated tax group. Powerco Ltd performs the accounting function of PNZHL for nil consideration.
Compensation of key management personnel
2016 $000
2015$000
Short-term benefits 3,892 3,921
Long-term benefits 249 240
The remuneration of directors and key executives is determined by the Human Resources and Remuneration Committee, having regard to the performance of the Company, individuals and market trends.
19. Share capitalTotal number of ordinary shares authorised, issued and fully paid at 31 March 2016 is 369,929,053. There has been no movement in the number of shares in the period.
Each ordinary share in the Company confers on the holder:
(a) The right to one vote on a poll at a meeting of the Company on any resolution;
(b) The right to an equal share in the distributions approved by the Board of Directors; and
(c) The right to an equal share in distribution of the surplus assets of the Company.
The shares have no par value.
PolicyOrdinary shares are classified as equity. Costs directly attributable to the issue of new shares are shown in equity as a deduction from the proceeds.
20. ReservesThe hedge reserve represents hedging gains and losses recognised on the effective portion of cash flow hedges. The cumulative deferred gain or loss on the hedge is recognised in the profit or loss component of the Statement of Comprehensive Income when the hedged transaction impacts profit or loss, or is included as a basis adjustment to the non-financial hedged item, consistent with the applicable accounting policy. As at 31 March 2016, no swaps were effective cash flow hedges as the Group discontinued hedge accounting in 2013. The remaining hedge reserve balance is being amortised based on the maturity dates of the previously effective cash flow hedges, the last of which will mature in January 2028. For further information refer to note 5.
21. Contingent liabilities and commitmentsContingent assets and liabilitiesAs at 31 March 2016, the Group had no contingent assets or liabilities (31 March 2015: nil).
Commitments
2016 $000
2015$000
Commitments for future capital expenditure resulting from contracts entered into 4,842 2,325
Commitments for future operational expenditure resulting from contracts entered into 10,282 5,407
Commitments resulting from Electricity Field Service Agreement (EFSA) contract entered into 130,000 170,000
145,124 177,732
The Group and Downer Utilities Alliance New Zealand Ltd have entered into EFSA for capital and operational service for both the Eastern and Western regions. There is a separate EFSA for each region with a service commencement date of 30 June 2014 and an end date of 30 June 2019. The targeted annual expenditure is $20 million per year for each agreement ($40 million in total).
22. New and revised standards and interpretationsThe following are the new or revised Standards or Interpretations in issue that are not yet required to be adopted by entities preparing financial statements for periods ending on 31 March 2016. Management has not yet assessed the impact of these standards.
STANDARD/INTERPRETATION EFFECTIVE FOR ANNUAL REPORTING PERIODS BEGINNING
ON OR AFTER
EXPECTED TO BE INITIALLY APPLIED IN THE FINANCIAL YEAR
ENDING
Amendments to NZ IAS 16 and NZ IAS 38-Clarification of Acceptable Methods of Depreciation and Amortisation 1 January 2016 31 March 2017
Annual Improvements to NZ IFRS 2012-2014 Cycle 1 January 2016 31 March 2017
Disclosure Initiative (Amendments to NZ IAS 1) 1 January 2016 31 March 2017
NZ IFRS 9 Financial Instruments 1 January 2018 31 March 2019
NZ IFRS 15 Revenue from Contracts with Customers 1 January 2018 31 March 2019
NZ IFRS 16 Leases 1 January 2019 31 March 2020
Adoption of new and revised Standards and InterpretationsManagement has reviewed the Standards and Interpretations that became mandatory in the current year and has determined that there is no material effect on the results and position of the Group.
23. Subsequent eventsThere have been no significant subsequent events since 31 March 2016 requiring adjustment to these financial statements and disclosures.

Back to financial contents > Back to contents >58 POWERCO LTD Annual Report 2016 POWERCO LTD Annual Report 2016 59
INDEPENDENT AUDITOR’S REPORTTO THE SHAREHOLDER OF POWERCO LIMITED
Report on the Consolidated Financial StatementsWe have audited the accompanying consolidated financial statements of Powerco Limited and its subsidiaries (‘the Group’) on pages 30 to 57, which comprise the consolidated statement of financial position as at 31 March 2016, and the consolidated statement of comprehensive income, consolidated statement of changes in equity and consolidated statement of cash flows for the year then ended, and a summary of significant accounting policies and other explanatory information.
This report is made solely to the company’s shareholder. Our audit has been undertaken so that we might state to the company’s shareholder those matters we are required to state to them in an auditor’s report and for no other purpose. To the fullest extent permitted by law, we do not accept or assume responsibility to anyone other than the company’s shareholder, for our audit work, for this report, or for the opinions we have formed.
Board of Directors’ Responsibility for the Consolidated Financial StatementsThe Board of Directors are responsible on behalf of the company for the preparation and fair presentation of these consolidated financial statements, in accordance with New Zealand Equivalents to International Financial Reporting Standards and International Financial Reporting Standards, and for such internal control as the Board of Directors determine is necessary to enable the preparation of consolidated financial statements that are free from material misstatement, whether due to fraud or error.
Auditor’s ResponsibilitiesOur responsibility is to express an opinion on these consolidated financial statements based on our audit. We conducted our audit in accordance with International Standards on Auditing and International Standards on Auditing (New Zealand). Those standards require that we comply with ethical requirements and plan and perform the audit to obtain reasonable assurance about whether the consolidated financial statements are free from material misstatement.
DirectorsJ Loughlin (Chair)M Bain (also Alternate to T Parry)M BessellM CummingsM Dorreen (Alternate to M Cummings)G HayA Karl (Alternate to G Hay)T Parry (also Alternate to M Bain)D Rees (Alternate to M Bessell)
On 29 April 2015:
• MrLaw(asAlternatetoMrCummings)resigned from the Board
• MrBessellwasappointedtotheBoard
• MrReeswasappointedMrBessell’sAlternate
• MrVerrionwasappointedMrCummings’Alternate
On 24 August 2015:
MrVerrion(asAlternatetoMrCummings)resigned from the Board
On 25 August 2015:
Mr Dorreen was appointed Mr Cummings’ Alternate
Executive Management TeamN BarbourChief Executive
J BirnieGroup Manager Human Resources
S DicksonGeneral Manager Gas
R FletcherGeneral Manager Regulation and Government Relations
P GoodeveGeneral Manager Operations Support
D MartinChief Financial Officer
J McAvoyGroup Manager Health, Safety, Environment and Quality
A McLeodGeneral Manager Electricity
Registered officeLevel 2, NPDC Civic Centre 84 Liardet St New Plymouth 4310 New Zealand
AuditorsDeloitte
BankersWestpac Institutional BankANZ National Bank LtdBank of Tokyo-Mitsubishi UFJ LtdCommonwealth Bank of Australia
Bond RegistrarComputershare Investor Services Ltd Private Bag 92119 Auckland 1142 159 Hurstmere Rd Takapuna Auckland 0622
Bondholder inquiriesTo change your address or bank account and to view your registered details, including transactions, visit: www.computershare.co.nz/investorcentre
Private Bag 92119 Auckland 1142
Telephone +64 9 488 8777 Facsimile +64 9 488 8787
Please assist our registrar by quoting your CSN or shareholder number.
An audit involves performing procedures to obtain audit evidence about the amounts and disclosures in the consolidated financial statements. The procedures selected depend on the auditor’s judgement, including the assessment of the risks of material misstatement of the consolidated financial statements, whether due to fraud or error. In making those risk assessments, the auditor considers internal control relevant to the entity’s preparation and fair presentation of the consolidated financial statements in order to design audit procedures that are appropriate in the circumstances, but not for the purpose of expressing an opinion on the effectiveness of the entity’s internal control. An audit also includes evaluating the appropriateness of the accounting policies used and the reasonableness of accounting estimates, as well as the overall presentation of the consolidated financial statements.
We believe that the audit evidence we have obtained is sufficient and appropriate to provide a basis for our audit opinion.
Other than in our capacity as auditor and the provision of other assurance services including the audit of regulatory disclosure statements and trustee reporting, we have no relationship with or interests in Powerco Limited or any of its subsidiaries, except that partners and employees of our firm deal with Powerco Limited and its subsidiaries on normal terms within the ordinary course of trading activities of the business of Powerco Limited and its subsidiaries.
OpinionIn our opinion, the consolidated financial statements on pages 30 to 57 present fairly, in all material respects, the financial position of Powerco Limited and its subsidiaries as at 31 March 2016, and their financial performance and cash flows for the year then ended in accordance with New Zealand Equivalents to International Financial Reporting Standards and International Financial Reporting Standards.
Chartered Accountants 24 May 2016 | Wellington, New Zealand
Directory
This audit report relates to the consolidated financial statements of Powerco Limited for the year ended 31 March 2016 included on Powerco Limited’s website. The Board of Directors is responsible for the maintenance and integrity of Powerco Limited’s website. We have not been engaged to report on the integrity of Powerco Limited’s website. We accept no responsibility for any changes that may have occurred to the consolidated financial statements since they were initially presented on the website. The audit report refers only to the consolidated financial statements named above. It does not provide an opinion on any other information which may have been hyperlinked to/from these consolidated financial statements. If readers of this report are concerned with the inherent risks arising from electronic data communication they should refer to the published hard copy of the audited consolidated financial statements and related audit report dated 24 May 2016 to confirm the information included in the audited consolidated financial statements presented on this website. Legislation in New Zealand governing the preparation and dissemination of financial statements may differ from legislation in other jurisdictions.

Copyright © 2022 FDOKUMEN