On the Feasibility of Nanocrystal Imaging Using Intense and Ultrashort X-ray Pulses
6
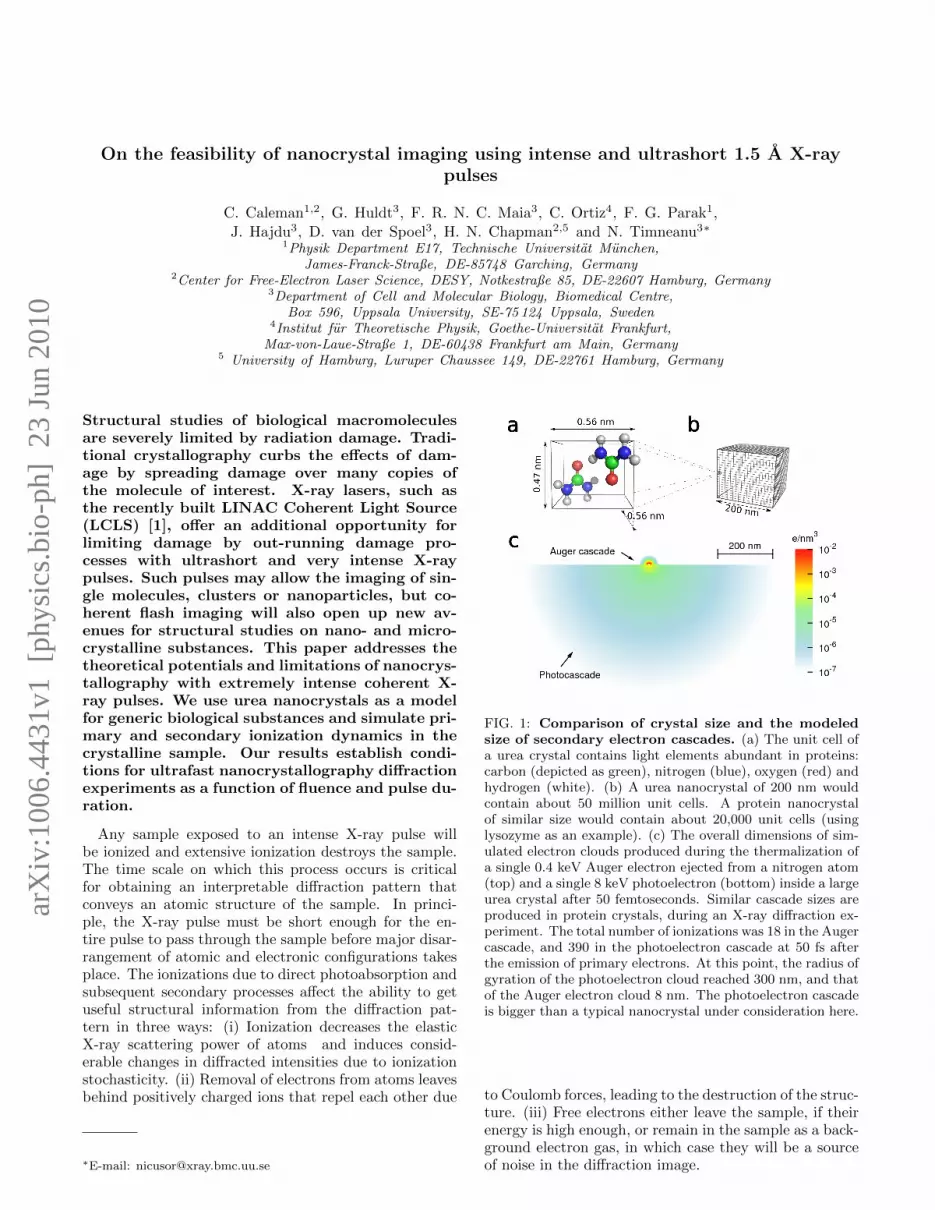
On the feasibility of nanocrystal imaging using intense and ultrashort 1.5 ˚ A X-ray pulses C. Caleman 1,2 , G. Huldt 3 , F. R. N. C. Maia 3 , C. Ortiz 4 , F. G. Parak 1 , J. Hajdu 3 , D. van der Spoel 3 , H. N. Chapman 2,5 and N. Timneanu 3* 1 Physik Department E17, Technische Universit¨ at M¨ unchen, James-Franck-Straße, DE-85748 Garching, Germany 2 Center for Free-Electron Laser Science, DESY, Notkestraße 85, DE-22607 Hamburg, Germany 3 Department of Cell and Molecular Biology, Biomedical Centre, Box 596, Uppsala University, SE-75 124 Uppsala, Sweden 4 Institut f¨ ur Theoretische Physik, Goethe-Universit¨ at Frankfurt, Max-von-Laue-Straße 1, DE-60438 Frankfurt am Main, Germany 5 University of Hamburg, Luruper Chaussee 149, DE-22761 Hamburg, Germany Structural studies of biological macromolecules are severely limited by radiation damage. Tradi- tional crystallography curbs the effects of dam- age by spreading damage over many copies of the molecule of interest. X-ray lasers, such as the recently built LINAC Coherent Light Source (LCLS) [1], offer an additional opportunity for limiting damage by out-running damage pro- cesses with ultrashort and very intense X-ray pulses. Such pulses may allow the imaging of sin- gle molecules, clusters or nanoparticles, but co- herent flash imaging will also open up new av- enues for structural studies on nano- and micro- crystalline substances. This paper addresses the theoretical potentials and limitations of nanocrys- tallography with extremely intense coherent X- ray pulses. We use urea nanocrystals as a model for generic biological substances and simulate pri- mary and secondary ionization dynamics in the crystalline sample. Our results establish condi- tions for ultrafast nanocrystallography diffraction experiments as a function of fluence and pulse du- ration. Any sample exposed to an intense X-ray pulse will be ionized and extensive ionization destroys the sample. The time scale on which this process occurs is critical for obtaining an interpretable diffraction pattern that conveys an atomic structure of the sample. In princi- ple, the X-ray pulse must be short enough for the en- tire pulse to pass through the sample before major disar- rangement of atomic and electronic configurations takes place. The ionizations due to direct photoabsorption and subsequent secondary processes affect the ability to get useful structural information from the diffraction pat- tern in three ways: (i) Ionization decreases the elastic X-ray scattering power of atoms and induces consid- erable changes in diffracted intensities due to ionization stochasticity. (ii) Removal of electrons from atoms leaves behind positively charged ions that repel each other due * E-mail: [email protected] FIG. 1: Comparison of crystal size and the modeled size of secondary electron cascades. (a) The unit cell of a urea crystal contains light elements abundant in proteins: carbon (depicted as green), nitrogen (blue), oxygen (red) and hydrogen (white). (b) A urea nanocrystal of 200 nm would contain about 50 million unit cells. A protein nanocrystal of similar size would contain about 20,000 unit cells (using lysozyme as an example). (c) The overall dimensions of sim- ulated electron clouds produced during the thermalization of a single 0.4 keV Auger electron ejected from a nitrogen atom (top) and a single 8 keV photoelectron (bottom) inside a large urea crystal after 50 femtoseconds. Similar cascade sizes are produced in protein crystals, during an X-ray diffraction ex- periment. The total number of ionizations was 18 in the Auger cascade, and 390 in the photoelectron cascade at 50 fs after the emission of primary electrons. At this point, the radius of gyration of the photoelectron cloud reached 300 nm, and that of the Auger electron cloud 8 nm. The photoelectron cascade is bigger than a typical nanocrystal under consideration here. to Coulomb forces, leading to the destruction of the struc- ture. (iii) Free electrons either leave the sample, if their energy is high enough, or remain in the sample as a back- ground electron gas, in which case they will be a source of noise in the diffraction image. arXiv:1006.4431v1 [physics.bio-ph] 23 Jun 2010
-
Upload
independent -
Category
Documents
-
view
0 -
download
0
Transcript of On the Feasibility of Nanocrystal Imaging Using Intense and Ultrashort X-ray Pulses
On the feasibility of nanocrystal imaging using intense and ultrashort 1.5 A X-raypulses
C. Caleman1,2, G. Huldt3, F. R. N. C. Maia3, C. Ortiz4, F. G. Parak1,
J. Hajdu3, D. van der Spoel3, H. N. Chapman2,5 and N. Timneanu3∗1Physik Department E17, Technische Universitat Munchen,
James-Franck-Straße, DE-85748 Garching, Germany2Center for Free-Electron Laser Science, DESY, Notkestraße 85, DE-22607 Hamburg, Germany
3Department of Cell and Molecular Biology, Biomedical Centre,Box 596, Uppsala University, SE-75 124 Uppsala, Sweden
4Institut fur Theoretische Physik, Goethe-Universitat Frankfurt,Max-von-Laue-Straße 1, DE-60438 Frankfurt am Main, Germany
5 University of Hamburg, Luruper Chaussee 149, DE-22761 Hamburg, Germany
Structural studies of biological macromoleculesare severely limited by radiation damage. Tradi-tional crystallography curbs the effects of dam-age by spreading damage over many copies ofthe molecule of interest. X-ray lasers, such asthe recently built LINAC Coherent Light Source(LCLS) [1], offer an additional opportunity forlimiting damage by out-running damage pro-cesses with ultrashort and very intense X-raypulses. Such pulses may allow the imaging of sin-gle molecules, clusters or nanoparticles, but co-herent flash imaging will also open up new av-enues for structural studies on nano- and micro-crystalline substances. This paper addresses thetheoretical potentials and limitations of nanocrys-tallography with extremely intense coherent X-ray pulses. We use urea nanocrystals as a modelfor generic biological substances and simulate pri-mary and secondary ionization dynamics in thecrystalline sample. Our results establish condi-tions for ultrafast nanocrystallography diffractionexperiments as a function of fluence and pulse du-ration.
Any sample exposed to an intense X-ray pulse willbe ionized and extensive ionization destroys the sample.The time scale on which this process occurs is criticalfor obtaining an interpretable diffraction pattern thatconveys an atomic structure of the sample. In princi-ple, the X-ray pulse must be short enough for the en-tire pulse to pass through the sample before major disar-rangement of atomic and electronic configurations takesplace. The ionizations due to direct photoabsorption andsubsequent secondary processes affect the ability to getuseful structural information from the diffraction pat-tern in three ways: (i) Ionization decreases the elasticX-ray scattering power of atoms and induces consid-erable changes in diffracted intensities due to ionizationstochasticity. (ii) Removal of electrons from atoms leavesbehind positively charged ions that repel each other due
∗E-mail: [email protected]
FIG. 1: Comparison of crystal size and the modeledsize of secondary electron cascades. (a) The unit cell ofa urea crystal contains light elements abundant in proteins:carbon (depicted as green), nitrogen (blue), oxygen (red) andhydrogen (white). (b) A urea nanocrystal of 200 nm wouldcontain about 50 million unit cells. A protein nanocrystalof similar size would contain about 20,000 unit cells (usinglysozyme as an example). (c) The overall dimensions of sim-ulated electron clouds produced during the thermalization ofa single 0.4 keV Auger electron ejected from a nitrogen atom(top) and a single 8 keV photoelectron (bottom) inside a largeurea crystal after 50 femtoseconds. Similar cascade sizes areproduced in protein crystals, during an X-ray diffraction ex-periment. The total number of ionizations was 18 in the Augercascade, and 390 in the photoelectron cascade at 50 fs afterthe emission of primary electrons. At this point, the radius ofgyration of the photoelectron cloud reached 300 nm, and thatof the Auger electron cloud 8 nm. The photoelectron cascadeis bigger than a typical nanocrystal under consideration here.
to Coulomb forces, leading to the destruction of the struc-ture. (iii) Free electrons either leave the sample, if theirenergy is high enough, or remain in the sample as a back-ground electron gas, in which case they will be a sourceof noise in the diffraction image.
arX
iv:1
006.
4431
v1 [
phys
ics.
bio-
ph]
23
Jun
2010
2
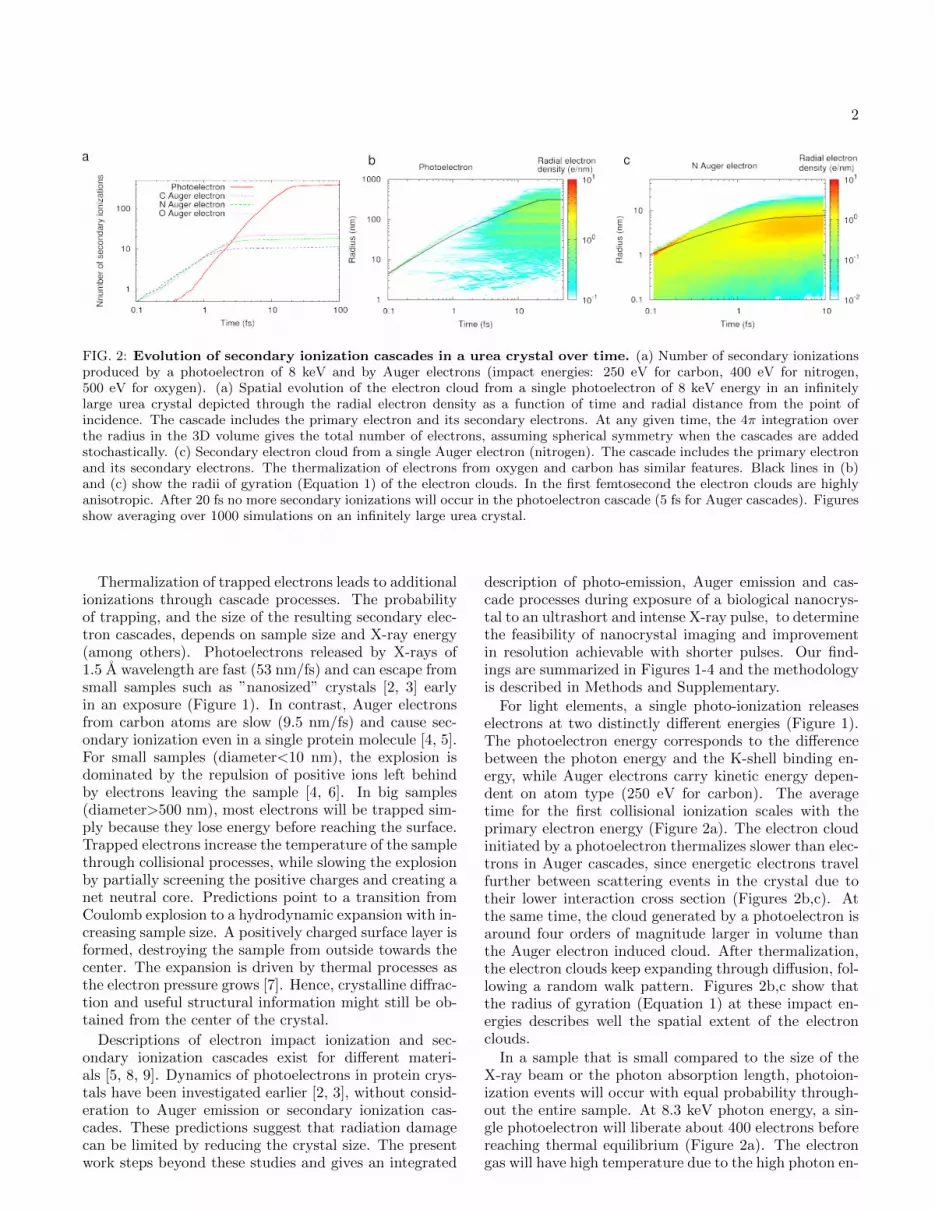
FIG. 2: Evolution of secondary ionization cascades in a urea crystal over time. (a) Number of secondary ionizationsproduced by a photoelectron of 8 keV and by Auger electrons (impact energies: 250 eV for carbon, 400 eV for nitrogen,500 eV for oxygen). (a) Spatial evolution of the electron cloud from a single photoelectron of 8 keV energy in an infinitelylarge urea crystal depicted through the radial electron density as a function of time and radial distance from the point ofincidence. The cascade includes the primary electron and its secondary electrons. At any given time, the 4π integration overthe radius in the 3D volume gives the total number of electrons, assuming spherical symmetry when the cascades are addedstochastically. (c) Secondary electron cloud from a single Auger electron (nitrogen). The cascade includes the primary electronand its secondary electrons. The thermalization of electrons from oxygen and carbon has similar features. Black lines in (b)and (c) show the radii of gyration (Equation 1) of the electron clouds. In the first femtosecond the electron clouds are highlyanisotropic. After 20 fs no more secondary ionizations will occur in the photoelectron cascade (5 fs for Auger cascades). Figuresshow averaging over 1000 simulations on an infinitely large urea crystal.
Thermalization of trapped electrons leads to additionalionizations through cascade processes. The probabilityof trapping, and the size of the resulting secondary elec-tron cascades, depends on sample size and X-ray energy(among others). Photoelectrons released by X-rays of1.5 A wavelength are fast (53 nm/fs) and can escape fromsmall samples such as ”nanosized” crystals [2, 3] earlyin an exposure (Figure 1). In contrast, Auger electronsfrom carbon atoms are slow (9.5 nm/fs) and cause sec-ondary ionization even in a single protein molecule [4, 5].For small samples (diameter<10 nm), the explosion isdominated by the repulsion of positive ions left behindby electrons leaving the sample [4, 6]. In big samples(diameter>500 nm), most electrons will be trapped sim-ply because they lose energy before reaching the surface.Trapped electrons increase the temperature of the samplethrough collisional processes, while slowing the explosionby partially screening the positive charges and creating anet neutral core. Predictions point to a transition fromCoulomb explosion to a hydrodynamic expansion with in-creasing sample size. A positively charged surface layer isformed, destroying the sample from outside towards thecenter. The expansion is driven by thermal processes asthe electron pressure grows [7]. Hence, crystalline diffrac-tion and useful structural information might still be ob-tained from the center of the crystal.
Descriptions of electron impact ionization and sec-ondary ionization cascades exist for different materi-als [5, 8, 9]. Dynamics of photoelectrons in protein crys-tals have been investigated earlier [2, 3], without consid-eration to Auger emission or secondary ionization cas-cades. These predictions suggest that radiation damagecan be limited by reducing the crystal size. The presentwork steps beyond these studies and gives an integrated
description of photo-emission, Auger emission and cas-cade processes during exposure of a biological nanocrys-tal to an ultrashort and intense X-ray pulse, to determinethe feasibility of nanocrystal imaging and improvementin resolution achievable with shorter pulses. Our find-ings are summarized in Figures 1-4 and the methodologyis described in Methods and Supplementary.
For light elements, a single photo-ionization releaseselectrons at two distinctly different energies (Figure 1).The photoelectron energy corresponds to the differencebetween the photon energy and the K-shell binding en-ergy, while Auger electrons carry kinetic energy depen-dent on atom type (250 eV for carbon). The averagetime for the first collisional ionization scales with theprimary electron energy (Figure 2a). The electron cloudinitiated by a photoelectron thermalizes slower than elec-trons in Auger cascades, since energetic electrons travelfurther between scattering events in the crystal due totheir lower interaction cross section (Figures 2b,c). Atthe same time, the cloud generated by a photoelectron isaround four orders of magnitude larger in volume thanthe Auger electron induced cloud. After thermalization,the electron clouds keep expanding through diffusion, fol-lowing a random walk pattern. Figures 2b,c show thatthe radius of gyration (Equation 1) at these impact en-ergies describes well the spatial extent of the electronclouds.
In a sample that is small compared to the size of theX-ray beam or the photon absorption length, photoion-ization events will occur with equal probability through-out the entire sample. At 8.3 keV photon energy, a sin-gle photoelectron will liberate about 400 electrons beforereaching thermal equilibrium (Figure 2a). The electrongas will have high temperature due to the high photon en-

3
0
0.2
0.4
0.6
0.8
1
-15 -10 -5 0 5 10 15 0
0.02
0.04
0.06
0.08
0.1
Rel
ativ
e in
tens
ity o
f Bra
gg p
eak
RM
SD
ato
mic
pos
ition
s (n
m)
Time (fs)
a
Pulse
RMSD urea
(110)(220)(330)
1010
1011
1012
0 10 20 30 40 50 60 70 80 90 100
Pul
se in
tens
ity (
phot
ons/
puls
e)
Pulse length (FWHM, fs)
R=0.05 0.15 0.25
z-=1
z-=2
z-=0.2
b crystal size < 200 nm
R value = 0.151 ionization/atom
109
1010
1011
0 10 20 30 40 50 60 70 80 90 100
Pul
se in
tens
ity (
phot
ons/
puls
e)
Pulse length (FWHM, fs)
R=0.05 0.15 0.25z-=1
z-=2
z-=0.2
z-=3
z-=0.5
c crystal size > 500 nm
R value = 0.151 ionization/atom
FIG. 3: Degradation of the detected signal as a result of radiation damage. (a) Decay of Bragg peaks during exposureto an X-ray pulse in a urea crystal. Pulse length: 10 fs (FWHM) centered at t=0, at 1.5 A wavelength. The pulse intensity(1.5×10¹¹ photons in a focal spot of 1 µm diameter FWHM) is such that atoms are ionized once in average when 99.5% ofthe intensity of the pulse passes through the sample. Peak intensities at different resolutions are represented by the (hkl)reflections and are normalized to one, based on intensities from undamaged crystals. The (330) reflection corresponds to 1.2 Aresolution and has a pulse-integrated degradation of 50% due to ionization and atomic displacement. The dashed black lineshows the average root mean square deviations (RMSD) in atomic positions during illumination. (b,c) Contour plots for theaverage ionization per atom (z) and the R-value as a function of the X-ray pulse length and intensity (photons/focal spot of 1µm diameter FWHM). The R-value (Equation 3) is calculated from all the Bragg peaks up to a resolution of 1.5 A. The redthick line corresponds to an R-value of 0.15, lower values are considered acceptable for a good reconstructable signal. The bluethick dashed line represents the damage of 1 ionization per atom. The plot in (b) shows behavior of nanocrystals smaller than200 nm, from which the photoelectrons escape early in an exposure, while (c) shows the behavior of crystals larger than 500nm, when photoelectrons are completely trapped during exposure.
ergy, and the electrons will be distributed approximatelyuniform throughout the sample. The free electrons willscatter predominantly in the forward direction and con-tribute incoherently to the background in the diffractionpattern.
At 1.5 A wavelength, the ratio between elastically scat-tered photons and photoionization is 1:32 for oxygen, 1:26for nitrogen and 1:20 for carbon. Incoming photons willprimarily ionize sample and only a few will contributeto coherent scattering. The loss of an electron will de-crease the scattering power by 17% for a carbon atom,14% for nitrogen and 12% for oxygen. One ionizationper atom also leads to atomic displacement and furtherdegradation of the scattered signal (Figure 3a).
Since a focused X-ray pulse will destroy the sample,three-dimensional (3D) structure determination relies onthe experiment being repeatable. Rather than build-ing up a complete X-ray diffraction data set by rotat-ing the crystal and collecting a sequence of diffractionimages it will be necessary to scale together individualdiffraction images from many different nanocrystals, inorder to assemble a complete 3D data set [10]. A crys-tal with 5×5×5 unit cells will produce a discrete diffrac-tion pattern [11], and conventional X-ray analysis tech-niques may be used for indexing, merging and recon-struction [10]. Furthermore, oversampling techniques fordirect phase retrieval may also be employed for a 3Dstructural determination [12].
We express damage-induced errors in terms of degra-dation of Bragg peaks, and for the entire diffractionpattern we calculate an R-value from simulated crys-
tals exposed to X-ray pulses (Figure 3). The R-valueis a measure of the overall agreement between the crys-tallographic model and the experimental X-ray diffrac-tion data (Equation 3). Small molecules (such as urea)form more ordered crystals and an R-value below 0.05is considered a good threshold (Cambridge StructuralDatabase). For macromolecules, values up to 0.20 areacceptable (Protein Data Bank) and we use the conven-tion R< 0.15 from [11] (Figure 3). Figure 3a shows howBragg peaks may degrade during exposure to an X-raypulse, and how this influences the dependence of the R-value with pulse parameters. The R-value is also de-pendent on crystal size, and Figures 3b,c compare tworegimes: crystals where Auger cascades dominate versuscrystals where damage is driven by photoelectron cas-cades. Trapping of photoelectrons in crystals larger than500 nm leads to a steeper degradation of the signal andconstrains what pulse lengths and intensities could beused for successful imaging.
When deciding which parameters of the X-ray laserpulse and sample characteristics one should use (Fig-ure 4), there is an interplay between two effects drivenmainly by photoelectrons; i) If photoelectrons escape thesample, the total number of ionizations will be signifi-cantly lowered. To reduce radiation damage early in theexposure, the sample has to be smaller than the size ofthe photoelectron cascade. The diffraction signal fromthe crystal scales with the size of the crystal as a powerlaw (Equation 5). Thus reducing sample size will con-versely require an increase in pulse intensity in order toretain the signal at the same level (Figure 4). ii) If the
4
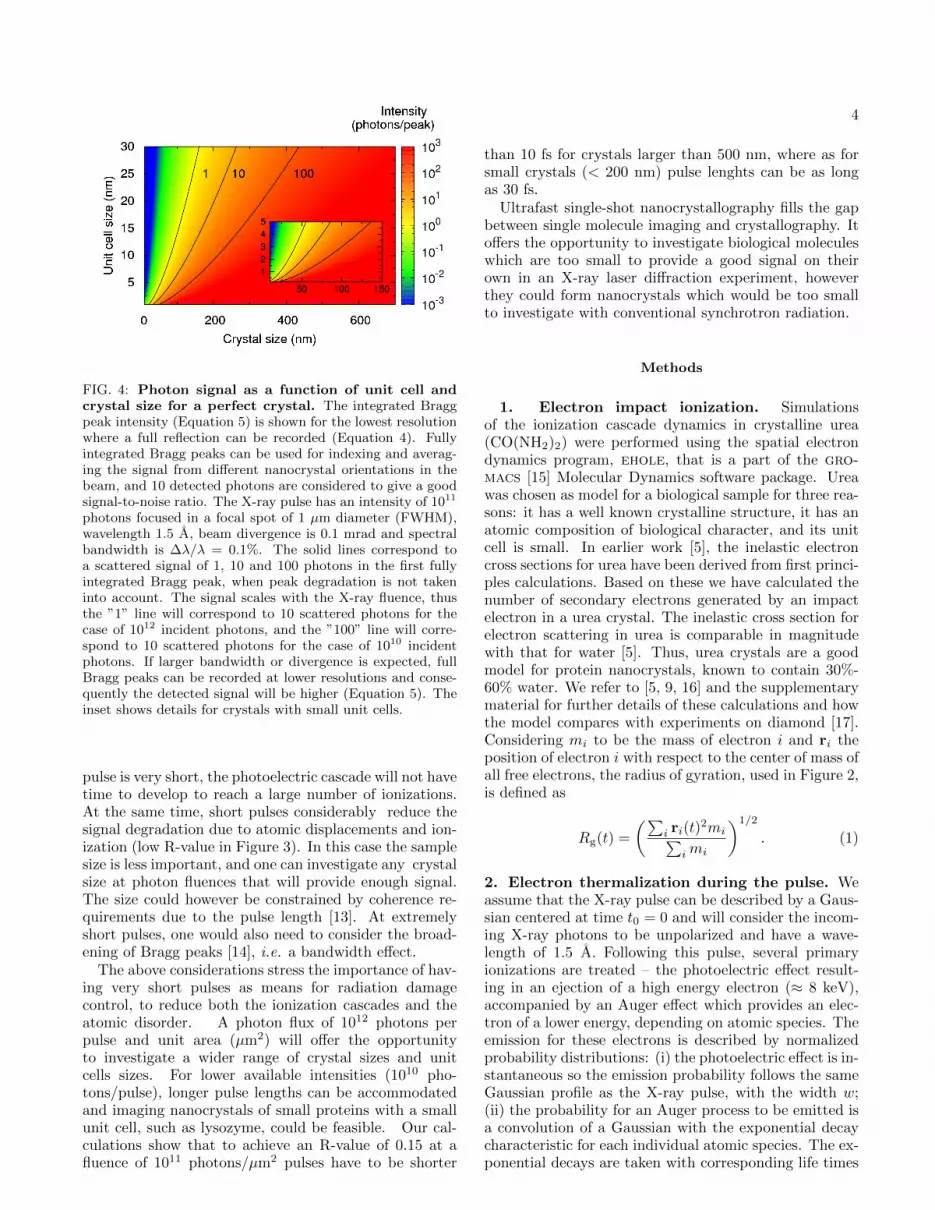
FIG. 4: Photon signal as a function of unit cell andcrystal size for a perfect crystal. The integrated Braggpeak intensity (Equation 5) is shown for the lowest resolutionwhere a full reflection can be recorded (Equation 4). Fullyintegrated Bragg peaks can be used for indexing and averag-ing the signal from different nanocrystal orientations in thebeam, and 10 detected photons are considered to give a goodsignal-to-noise ratio. The X-ray pulse has an intensity of 1011
photons focused in a focal spot of 1 µm diameter (FWHM),wavelength 1.5 A, beam divergence is 0.1 mrad and spectralbandwidth is ∆λ/λ = 0.1%. The solid lines correspond toa scattered signal of 1, 10 and 100 photons in the first fullyintegrated Bragg peak, when peak degradation is not takeninto account. The signal scales with the X-ray fluence, thusthe ”1” line will correspond to 10 scattered photons for thecase of 1012 incident photons, and the ”100” line will corre-spond to 10 scattered photons for the case of 1010 incidentphotons. If larger bandwidth or divergence is expected, fullBragg peaks can be recorded at lower resolutions and conse-quently the detected signal will be higher (Equation 5). Theinset shows details for crystals with small unit cells.
pulse is very short, the photoelectric cascade will not havetime to develop to reach a large number of ionizations.At the same time, short pulses considerably reduce thesignal degradation due to atomic displacements and ion-ization (low R-value in Figure 3). In this case the samplesize is less important, and one can investigate any crystalsize at photon fluences that will provide enough signal.The size could however be constrained by coherence re-quirements due to the pulse length [13]. At extremelyshort pulses, one would also need to consider the broad-ening of Bragg peaks [14], i.e. a bandwidth effect.
The above considerations stress the importance of hav-ing very short pulses as means for radiation damagecontrol, to reduce both the ionization cascades and theatomic disorder. A photon flux of 1012 photons perpulse and unit area (µm2) will offer the opportunityto investigate a wider range of crystal sizes and unitcells sizes. For lower available intensities (1010 pho-tons/pulse), longer pulse lengths can be accommodatedand imaging nanocrystals of small proteins with a smallunit cell, such as lysozyme, could be feasible. Our cal-culations show that to achieve an R-value of 0.15 at afluence of 1011 photons/µm2 pulses have to be shorter
than 10 fs for crystals larger than 500 nm, where as forsmall crystals (< 200 nm) pulse lenghts can be as longas 30 fs.
Ultrafast single-shot nanocrystallography fills the gapbetween single molecule imaging and crystallography. Itoffers the opportunity to investigate biological moleculeswhich are too small to provide a good signal on theirown in an X-ray laser diffraction experiment, howeverthey could form nanocrystals which would be too smallto investigate with conventional synchrotron radiation.
Methods
1. Electron impact ionization. Simulationsof the ionization cascade dynamics in crystalline urea(CO(NH2)2) were performed using the spatial electrondynamics program, ehole, that is a part of the gro-macs [15] Molecular Dynamics software package. Ureawas chosen as model for a biological sample for three rea-sons: it has a well known crystalline structure, it has anatomic composition of biological character, and its unitcell is small. In earlier work [5], the inelastic electroncross sections for urea have been derived from first princi-ples calculations. Based on these we have calculated thenumber of secondary electrons generated by an impactelectron in a urea crystal. The inelastic cross section forelectron scattering in urea is comparable in magnitudewith that for water [5]. Thus, urea crystals are a goodmodel for protein nanocrystals, known to contain 30%-60% water. We refer to [5, 9, 16] and the supplementarymaterial for further details of these calculations and howthe model compares with experiments on diamond [17].Considering mi to be the mass of electron i and ri theposition of electron i with respect to the center of mass ofall free electrons, the radius of gyration, used in Figure 2,is defined as
Rg(t) =
(∑i ri(t)
2mi∑imi
)1/2
. (1)
2. Electron thermalization during the pulse. Weassume that the X-ray pulse can be described by a Gaus-sian centered at time t0 = 0 and will consider the incom-ing X-ray photons to be unpolarized and have a wave-length of 1.5 A. Following this pulse, several primaryionizations are treated – the photoelectric effect result-ing in an ejection of a high energy electron (≈ 8 keV),accompanied by an Auger effect which provides an elec-tron of a lower energy, depending on atomic species. Theemission for these electrons is described by normalizedprobability distributions: (i) the photoelectric effect is in-stantaneous so the emission probability follows the sameGaussian profile as the X-ray pulse, with the width w;(ii) the probability for an Auger process to be emitted isa convolution of a Gaussian with the exponential decaycharacteristic for each individual atomic species. The ex-ponential decays are taken with corresponding life times

5
τ of 11.3 fs for carbon, 8.3 fs for nitrogen and 6.6 fs foroxygen. The probability for photoionization in urea isdetermined by the cross section of the atoms, which arewell known For the three atomic species that can un-dergo an Auger process, the contribution from the atomsC, N, and O, is weighted according to the photoioniza-tion cross section on the respective atoms, σC, σN, σO,and normalized to the total photoelectric cross sectionfor the urea molecule. The single electron ionization cas-cades develop mainly along the direction of the incidentphoton, however we consider spherical symmetry whenthese are stochastically produced. Thus, the entire ion-ization cascade following an X-ray pulse impinging on acrystal is given by
C(t) =∑
i=C,N,O
niσi
{∫Ne−
(t′−t0)2
2w2 Cphoto(t, t′)dt′+
+
∫Ne−
(t′−t0)2
2w21
τe−
(t−t′)τ CAuger(t, t
′)dt′},
(2)
where Cphoto(t, t′) and CAuger(t, t′) represent the cascade
development with time for a single electron starting fromtime t′. These are obtained from MD simulations and arerepresented by the ionization rate as a function of time(Figure 2a for t′ = 0), or radii of gyration, Figures 2b,c.3. X-ray interactions and damage quantification.The degradation of Bragg peaks in Figure 3 has been cal-culated from MD simulations on an urea crystal, usinggromacs with a stochastic interaction of X-ray photonswith atoms, assuming unpolarized X-rays and homoge-neous spatial distribution of the free electrons. The sim-ulation box was 10x10x10 unit cells of urea, with peri-odic boundary conditions, and includes thermal motionof atoms. The model is described in reference [11], andin the supplementary material. The intensity of Braggpeaks at each time step is defined by integrating aroundeach peak over a rectangular area centered on the Braggpeak and with sides of length equal to 1/10 of the sepa-ration between adjacent peaks [18]. The spectral width∆λ/λ, beam divergence or any broadening of the Ewaldsphere are not taken into account here. The degradationof the Bragg peak is expected to be smaller when inte-grating through an Ewald sphere of finite thickness. Toestimate the damage induced error we make use of theR-value (used in Figure 3), calculated up to a resolutionq from
R(q) =
∑hkl<q
∣∣∣√〈Ihkl〉t −√I0hkl∣∣∣∑hkl<q
√〈Ihkl〉t
, (3)
where the summation is performed over all Bragg peaks(hkl) corresponding to scattering vectors less than q. Theintensities of the Bragg peaks I0hkl for the undamagedcrystal are used as reference when compared with thetime averaged intensities 〈Ihkl〉t of the damaged crystalexposed to a Gaussian-shaped X-ray pulse. The latter
intensities take into account the ionization dynamics andatomic displacement as a function of time during the X-ray pulse.4. Minimum required signal. In ultra-fast single-shot experiments at X-ray lasers the crystals will be ex-posed in random orientations, X-rays beams are expectedto have small divergence (< 1 mrad) and are highlymonochromatic (spectral bandwidth ∆λ/λ < 0.1%).Thus, single shot diffraction patterns will contain manypartially reflected Bragg peaks. Full Bragg peaks maybe recorded on the detector at higher resolution, andcould be used for retrieving the original orientation ofthe nanocrystals and for averaging the signal from simi-lar orientation [10] (partial Bragg peaks could in princi-ple also be used for indexing). In our estimates for theminimum required signal for successful indexing, we con-sider only the signal from fully integrated Bragg peaksat the lowest resolution where these can be recorded.For given parameters that control the thickness of theEwald sphere (beam divergence ∆φ, spectral bandwidth∆λ/λ), the lowest resolution where a full Bragg peak canbe recorded (qmin) is found by comparing the thickness ofthe Ewald sphere to the size of the Bragg peak (modeledas inversely proportional to the crystal width A)
1
A∼ ∆λ
λ
λ
2q2min + ∆φ qmin
√1− λ2
4q2min . (4)
The average number of photons scattered elastically bya protein crystal within a Bragg peak for a given resolu-tion qmin can be approximated by the expression for theintegrated reflected intensity [19]
IBragg(qmin) ≈ I0(λ)λ2
2 sin2(θ0/2)
1 + cos2 θ02
×
×λ2A3
a6r2e∑atoms
f2atom(θ0) ,
(5)
where both small beam divergence and polychromatic-ity are accounted for. I0(λ) is the spectral intensity ofthe incoming X-ray beam (number of incoming photonsper unit wavelength and unit area), integrated over theangular density of the incident beam. The Lorentz fac-tor λ2/(2 sin2(θ0/2)) takes into account the integrationover the thickness of the Ewald sphere encompassing theBragg peak, in a similar way as [19] for the stationarycase (no rotation) with divergent polychromatic radia-tion. The polarization factor is given by (1 + cos2 θ0)/2.Furthermore, re is the classical electron radius, λ thewavelength, A the crystal side (cubic crystal), a the unitcell side (cubic unit cell), fatom the atomic scattering fac-tor, and θ0 the polar angle between the incident pulse andthe center of the Bragg peak.
It is assumed that the unit cell structure factor is con-stant within the Bragg peak, and that adjacent Braggpeaks do not overlap; both these approximations improvewith the ratio A/a. The squared structure factor of theunit cell is represented by its average value at high scat-tering angles [20]. For numerical evaluation, the unit
6
cell was assumed to have a density of 1/30 A−3 carbon-equivalent atoms (corresponding to a unit cell consist-ing of 50% non-structural water and protein with densityapproximately 1.35 g/cm3), and the scattering factor ofcarbon was calculated from the Cromer-Mann parame-ters [21]. The calculation of the number of photons perBragg peak (Equation 5) presented in Figure 4 with theassumption of perfect crystals with no mosaicity. It hasbeen shown that micron sized crystals could consist ofonly a few highly ordered domains [22], thus nanocrys-tals are unlikely to be organized with a mosaic spread.
The above approximations will break down when thecrystal size approaches the unit cell size, as the diffracted
image turns from a discrete into a continuous pattern.
Acknowledgments
The Swedish Research Council is acknowledged for fi-nancial support as well as the DFG Cluster of Excellence:Munich-Center for Advanced Photonics. The authorswould like to thank Magnus Bergh, Gerard Kleywegt, In-ger Andersson, Erik G. Marklund, Richard Neutze, Mar-tin Svenda, Rosmarie Friemann, Jochen Hub and KarinValegard for their valuable input.
[1] L. F. DiMauro, J. Arthur, N. Berrah, J. Bozek, J. N.Galayda, and J. Hastings. Progress report on the LCLSXFEL at SLAC. J. Phys.: Conf. Ser., 88:012058, 2007.
[2] Coline Nave and Mark A. Hill. Will reduced radiationdamage occur with very small crystals? J. Sync. Rad.,12:299–303, 2005.
[3] John A. Cowan and Colin Nave. The optimum conditionsto collect x-ray data from very small samples. J. Sync.Rad., 15:458–462, 2008.
[4] M. Bergh, N. Tımneanu, and D. van der Spoel. A modelfor the dynamics of a water cluster in a X-ray FEL beam.Phys. Rev. E, 70:051904, 2004.
[5] C. Caleman, C. Ortiz, E. Marklund, F. Bultmark,M. Gabrysch, F. G. Parak, J. Hajdu, M. Klintenberg,and N. Tımneanu. Radiation damage in biological mate-rial: electronic properties and electron impact ionizationin urea. Europhys. Lett., 85:18005, and erratum 88:29901,2009.
[6] Z. Jurek, G. Faigel, and M. Tegze. Dynamics in a clusterunder the influence of intense femtosecond hard X-raypulses. Eur. Phys. J. D, 29:217–229, 2004.
[7] Stefan P. Hau-Riege, Richard A. London, and AbrahamSzoke. Dynamics of biological molecules irradiated byshort x-ray pulses. Phys. Rev. E, 69:051906, 2004.
[8] Beata Ziaja, Richard A. London, and Janos Hajdu. Uni-fied model of secondary electron cascades in diamond. J.Appl. Phys., 97:064905, 2005.
[9] Carlos Ortiz and Carl Caleman. Secondary electroncascade dynamics in KI and CsI. J. Phys. Chem. C.,111:17442–17447, 2007.
[10] Richard A. Kirian, Xiaoyu Wang, Uwe Weierstall,Kevin E. Schmidt, John C. H. Spence, Mark Hunter,Petra Fromme, Thomas White, Henry N. Chapman, andJames Holton. Femtosecond protein nanocrystallogra-phydata analysis methods. Opt. Express, 18:5713–5723,2010.
[11] R. Neutze, R. Wouts, D. van der Spoel, E. Weckert, andJ. Hajdu. Potential for biomolecular imaging with fem-tosecond X-ray pulses. Nature, 406:752–757, 2000.
[12] J. Miao, K. O. Hodgson, and D. Sayre. An approachto three-dimensional structures of biomolecules by using
single-molecule diffraction images. Proc. Natl. Acad. Sci.U.S.A., 98:6641–6645, 2001.
[13] Stefan P. Hau-Riege. Effect of the coherence propertiesof self-amplified-spontaneous-emission x-ray free electronlasers on single-particle diffractive imaging. Opt. Express,16(4):2840–2844, 2008.
[14] IV Tomov, P Chen, and PM Rentzepis. Pulse broad-ening in femtosecond x-ray diffraction. J. Appl. Phys.,83(10):5546–5548, MAY 15 1998.
[15] David van der Spoel, Erik Lindahl, Berk Hess, GerritGroenhof, Alan E. Mark, and Herman J. C. Berendsen.GROMACS: Fast, Flexible and Free. J. Comp. Chem.,26:1701–1718, 2005.
[16] N. Tımneanu, C. Caleman, J. Hajdu, and D. van derSpoel. Auger electron cascades in water and ice. Chem.Phys., 299:277–283, 2004.
[17] M. Gabrysch, E. Marklund, J. Hajdu, D. J. Twitchen,J. Rudati, A. M. Lindenberg, C. Caleman, R. W. Fal-cone, T. Tschentscher, K. Moffat, P. H. Bucksbaum,J. Als-Nielsen, A. J. Nelson, D. P. Siddons, P. J. Emma,P. Krejcik, H. Schlarb, J. Arthur, S. Brennan, J. Hast-ings, and J. Isberg. Formation of secondary electroncascades in single-crystalline plasma-deposited diamondupon exposure to femtosecond x-ray pulses. J. Appl.Phys., 103:064909, 2008.
[18] David van der Spoel, Filipe R. N. C. Maia, and CarlCaleman. Structural studies of melting on the picosec-ond time scale. Phys. Chem. Chem. Phys., 10:6344–6349,2008.
[19] ZH Kalman. On the derivation of integrated reflectedenergy formulae. Acta Cryst. A, 35:634–641, JUL 1979.
[20] A. J. C. Wilson. The probability distribution of X-rayintensities. Act. Cryst., 2:318–321, 1949.
[21] Don T. Cromer and Joseph B. Mann. X-ray scatter-ing factors computed from numerical Hartree-Fock wavefunctions. Acta Cryst. A, 24:321–326, 1968.
[22] R Fourme, A Ducruix, M Rieskautt, and B Capelle. Theperfection of protein crystals probed by direct record-ing of bragg reflection profiles with a quasi-planar x-raywave. J. Sync. Rad., 2(Part 3):136–142, MAY 1 1995.