On the evaluation of global sea-salt aerosol models at coastal/orographic sites
8
On the evaluation of global sea-salt aerosol models at coastal/ orographic sites M. Spada a, * , O. Jorba a , C. P erez García-Pando b, c , Z. Janjic d , J.M. Baldasano a, e a Barcelona Supercomputing Center e Centro Nacional de Supercomputaci on, Barcelona, Spain b NASA Goddard Institute for Space Studies, New York, USA c Department of Applied Physics and Applied Math, Columbia University, New York, USA d National Centers for Environmental Prediction, College Park, MD, USA e Universitat Polit ecnica de Catalunya, Barcelona, Spain highlights Sea-salt global models are often compared to surface concentration climatologies. Models exhibit strong biases at several coastal stations. Mesoscale phenomena can significantly affect model behavior in coastal stations. High model resolution strongly improved annual concentration trends. Caution may be taken when comparing global models in coastal stations. article info Article history: Received 1 July 2014 Received in revised form 7 November 2014 Accepted 9 November 2014 Available online 11 November 2014 Keywords: Sea-salt aerosol Global model evaluation University of Miami Network Surface concentration measurements Coastal sites Orographic effects abstract Sea-salt aerosol global models are typically evaluated against concentration observations at coastal stations that are unaffected by local surf conditions and thus considered representative of open ocean conditions. Despite recent improvements in sea-salt source functions, studies still show significant model errors in specific regions. Using a multiscale model, we investigated the effect of high model resolution (0.1 0.1 vs. 1 1.4 ) upon sea-salt patterns in four stations from the University of Miami Network: Baring Head, Chatam Island, and Invercargill in New Zealand, and Marion Island in the sub- antarctic Indian Ocean. Normalized biases improved from þ63.7% to þ3.3% and correlation increased from 0.52 to 0.84. The representation of sea/land interfaces, mesoscale circulations, and precipitation with the higher resolution model played a major role in the simulation of annual concentration trends. Our results recommend caution when comparing or constraining global models using surface concen- tration observations from coastal stations. © 2014 The Authors. Published by Elsevier Ltd. This is an open access article under the CC BY-NC-ND license (http://creativecommons.org/licenses/by-nc-nd/3.0/). 1. Introduction Sea-salt is one of the largest contributors to the aerosol mass in the atmosphere, with uncertain annual emission estimates ranging from 0.3 Pg to 30 Pg (Lewis and Schwartz, 2004). Sea-salt affects the radiative fluxes directly by interacting with shortwave and long- wave radiation (Haywood et al., 1999; Ma et al., 2008), and indi- rectly by acting as cloud condensation nuclei (CCN) (Pierce and Adams, 2006, 2009). Therefore, future increases or decreases of sea-salt due to changes in surface wind speed, atmospheric sta- bility, precipitation, and sea-ice cover could result in positive or negative feedbacks on the climate system (Struthers et al., 2011). Modeling studies have attempted to constrain the sea-salt aerosol life-cycle, specially focusing on the sea-salt source func- tion, which represents the largest source of uncertainty (Gong, 2003; Mårtensson et al., 2003; Lewis and Schwartz, 2004; Clarke et al., 2006; Caffrey et al., 2006; Jaegl e et al., 2011; Fan and Toon, 2011; Gryhte et al., 2014; Partanen et al., 2014). Sea-salt source functions in global models are constrained and/or evaluated with aerosol optical depth (AOD) observations from satellites and Sun photometers, wind speed and surface concentration measurements * Corresponding author. Earth Sciences Department, Barcelona Supercomputing Center (BSC-CNS), Edificio Nexus II, c/ Jordi Girona 29, 08034 Barcelona, Spain. E-mail address: [email protected] (M. Spada). Contents lists available at ScienceDirect Atmospheric Environment journal homepage: www.elsevier.com/locate/atmosenv http://dx.doi.org/10.1016/j.atmosenv.2014.11.019 1352-2310/© 2014 The Authors. Published by Elsevier Ltd. This is an open access article under the CC BY-NC-ND license (http://creativecommons.org/licenses/by-nc-nd/3.0/). Atmospheric Environment 101 (2015) 41e48
-
Upload
independent -
Category
Documents
-
view
1 -
download
0
Transcript of On the evaluation of global sea-salt aerosol models at coastal/orographic sites
lable at ScienceDirect
Atmospheric Environment 101 (2015) 41e48
Contents lists avai
Atmospheric Environment
journal homepage: www.elsevier .com/locate/atmosenv
On the evaluation of global sea-salt aerosol models at coastal/orographic sites
M. Spada a, *, O. Jorba a, C. P�erez García-Pando b, c, Z. Janjic d, J.M. Baldasano a, e
a Barcelona Supercomputing Center e Centro Nacional de Supercomputaci�on, Barcelona, Spainb NASA Goddard Institute for Space Studies, New York, USAc Department of Applied Physics and Applied Math, Columbia University, New York, USAd National Centers for Environmental Prediction, College Park, MD, USAe Universitat Polit�ecnica de Catalunya, Barcelona, Spain
h i g h l i g h t s
� Sea-salt global models are often compared to surface concentration climatologies.� Models exhibit strong biases at several coastal stations.� Mesoscale phenomena can significantly affect model behavior in coastal stations.� High model resolution strongly improved annual concentration trends.� Caution may be taken when comparing global models in coastal stations.
a r t i c l e i n f o
Article history:Received 1 July 2014Received in revised form7 November 2014Accepted 9 November 2014Available online 11 November 2014
Keywords:Sea-salt aerosolGlobal model evaluationUniversity of Miami NetworkSurface concentration measurementsCoastal sitesOrographic effects
* Corresponding author. Earth Sciences DepartmenCenter (BSC-CNS), Edificio Nexus II, c/ Jordi Girona 29
E-mail address: [email protected] (M. Spada).
http://dx.doi.org/10.1016/j.atmosenv.2014.11.0191352-2310/© 2014 The Authors. Published by Elsevier
a b s t r a c t
Sea-salt aerosol global models are typically evaluated against concentration observations at coastalstations that are unaffected by local surf conditions and thus considered representative of open oceanconditions. Despite recent improvements in sea-salt source functions, studies still show significantmodel errors in specific regions. Using a multiscale model, we investigated the effect of high modelresolution (0.1� � 0.1� vs. 1� � 1.4�) upon sea-salt patterns in four stations from the University of MiamiNetwork: Baring Head, Chatam Island, and Invercargill in New Zealand, and Marion Island in the sub-antarctic Indian Ocean. Normalized biases improved from þ63.7% to þ3.3% and correlation increasedfrom 0.52 to 0.84. The representation of sea/land interfaces, mesoscale circulations, and precipitationwith the higher resolution model played a major role in the simulation of annual concentration trends.Our results recommend caution when comparing or constraining global models using surface concen-tration observations from coastal stations.© 2014 The Authors. Published by Elsevier Ltd. This is an open access article under the CC BY-NC-ND
license (http://creativecommons.org/licenses/by-nc-nd/3.0/).
1. Introduction
Sea-salt is one of the largest contributors to the aerosol mass inthe atmosphere, with uncertain annual emission estimates rangingfrom 0.3 Pg to 30 Pg (Lewis and Schwartz, 2004). Sea-salt affects theradiative fluxes directly by interacting with shortwave and long-wave radiation (Haywood et al., 1999; Ma et al., 2008), and indi-rectly by acting as cloud condensation nuclei (CCN) (Pierce and
t, Barcelona Supercomputing, 08034 Barcelona, Spain.
Ltd. This is an open access article u
Adams, 2006, 2009). Therefore, future increases or decreases ofsea-salt due to changes in surface wind speed, atmospheric sta-bility, precipitation, and sea-ice cover could result in positive ornegative feedbacks on the climate system (Struthers et al., 2011).
Modeling studies have attempted to constrain the sea-saltaerosol life-cycle, specially focusing on the sea-salt source func-tion, which represents the largest source of uncertainty (Gong,2003; Mårtensson et al., 2003; Lewis and Schwartz, 2004; Clarkeet al., 2006; Caffrey et al., 2006; Jaegl�e et al., 2011; Fan and Toon,2011; Gryhte et al., 2014; Partanen et al., 2014). Sea-salt sourcefunctions in global models are constrained and/or evaluated withaerosol optical depth (AOD) observations from satellites and Sunphotometers, wind speed and surface concentrationmeasurements
nder the CC BY-NC-ND license (http://creativecommons.org/licenses/by-nc-nd/3.0/).

Table 1Observation sites considered in this work. Labels UNI-MIAMI, NIWA, and SWASstand for University of Miami Network, National Institute of Water and AtmosphericResearch, and South African Weather Service, respectively.
Station Latitude Longitude Contributor Observation years
Sea-salt surface mass concentrationBaring Head 41.28� S 174.87� E UNI-MIAMI 1987e1996Chatam Island 43.92� S 176.50� W UNI-MIAMI 1983e1996Invercargill 46.43� S 168.35� E UNI-MIAMI 1983e1996Marion Island 46.92� S 37.75� E UNI-MIAMI 1992e1996Precipitation and windBaring Head 41.28� Sa 174.87� Ea NIWA 1980e2010Chatam Island 43.92� Sa 176.50� Wa NIWA 1980e2010Invercargill 46.43� Sa 168.35� Ea NIWA 1980e2010Marion Island 46.90� S 37.85� E SWAS 1980e2010
a Stands for average on multiple observation sites at the corresponding modelgridcell.
M. Spada et al. / Atmospheric Environment 101 (2015) 41e4842
from experimental campaigns (Quinn and Bates, 2005), and surfaceconcentration climatologies at coastal stations from the Universityof Miami Network (UNI-MIAMI) (Savoie and Prospero, 1977). TheUNI-MIAMI measurements represent the most comprehensive andused global climatological dataset of sea-salt surface concentration.Global model studies use a subset of the UNI-MIAMI coastal sta-tions that are barely affected by local surf conditions (i.e. localproduction by breaking waves) and thus considered representativeof open ocean conditions.
Fig. 1. Simulated sea-salt annual emission (upper panels) and annual mean surface concentresolutions over New Zealand using the Jaegl�e et al. (2011) (J11) source function. Simulatemission flux and surface concentration, respectively. Plots are displayed over zoomed regiolongitudes from 15.2� S to 67.2� S). a, b, and c indicate UNI-MIAMI stations (Baring Head, C
In a recent work, Jaegl�e et al. (2011) showed that the discrep-ancy with observations of a model including a widely used sourcefunction based on a power law dependence on wind speed (Gong,2003) was a strong function of SST. Using cruise observations toderive an empirical source function depending on both wind speedand SST, Jaegl�e et al. (2011) obtained model bias reductions ofnearly a factor of two for both cruise and station observations.Although the fitted parameters in the source function of Jaegl�e et al.(2011) are model dependent, Tsigaridis et al. (2013) and Spada et al.(2013) recently tested the source function and found improvedagreement with surface concentration observations in comparisonto a number of other schemes. However, simulations remainaffected with uncertainties up to a factor of 2 or more. For example,Spada et al. (2013) found positive systematic biases of a 100% ormore in Baring Head, Chatam Island, Invercargill andMarion Island,regardless of the source function applied in a global model at1� � 1.4� resolution. Simulations included a variety of combinedsource functions including the schemes of Gong (2003), Monahanet al. (1986), Smith et al. (1993), Mårtensson et al. (2003), andJaegl�e et al. (2011). Similarly, Tsigaridis et al. (2013) found strongoverestimations in these stations, with most of the simulatedmonthly mean concentrations greater than the measured clima-tological values plus one standard deviation. In Jaegl�e et al. (2011) apositive bias of about 100% was found in Marion Island, whilenegative biases in Baring Head and Invercargill were more pro-nounced when using the SST-dependent source function. Regard-less of the source function or global model used, the annual trend in
ration (bottom panels) at low (GLOB, left column) and high (REG, right column) modeled averages refer to a 5-year period (2002e2006). The labels emi and sconc refer tons with respect to simulated domains (covering latitudes from 148.8� E to 159.2� Wandhatam Island, and Invercargill, respectively).
M. Spada et al. / Atmospheric Environment 101 (2015) 41e48 43
Invercargill is not well captured (e.g. Liu et al. (2005); Jaegl�e et al.(2011); Tsigaridis et al. (2013); Spada et al. (2013)).
Sea-salt emissions in the open ocean are relatively independentof model resolution compared to mineral dust emitted from aridregions (Ridley et al., 2013). However, some UNI-MIAMI coastalstations are surrounded by pronounced orographic gradients and/or complex sea/land interfaces (complex coastal areas and smallislands). Therefore, even if free from surf-zone production, thesestationsmay not be representative of open-ocean conditions from ameteorological point of view, whichmay affect the interpretation ofglobal model evaluations. In this sense, we investigated the roleplayed by model resolution in capturing topography, mesoscalecirculations, and precipitation at these coastal/orographic regions,and how these aspects affected the sea-salt annual trends at themeasurement stations. We focused on two regions including fourUNI-MIAMI stations: the New Zealand region e including BaringHead (41.28� S, 174.87� E), Chatam Island (34.92� S, 176.50� W) andInvercargill (46.43� S, 168.35� E) e and Marion Island (46.92� S,37.75� E).
2. Methodology
We used the multiscale NMMB/BSC Chemical Transport Model(P�erez et al., 2011; Haustein et al., 2012; Jorba et al., 2012) whoseunified non-hydrostatic dynamical core allows for regional andglobal simulations (Janjic et al., 2011; Janjic and Gall, 2012). Sea-saltaerosol is represented by using a set of 8 size-bins ranging from0.1 mm to 15 mm in dry radius. Details on the sea-salt aerosolmodule can be found in Spada et al. (2013). We compared global
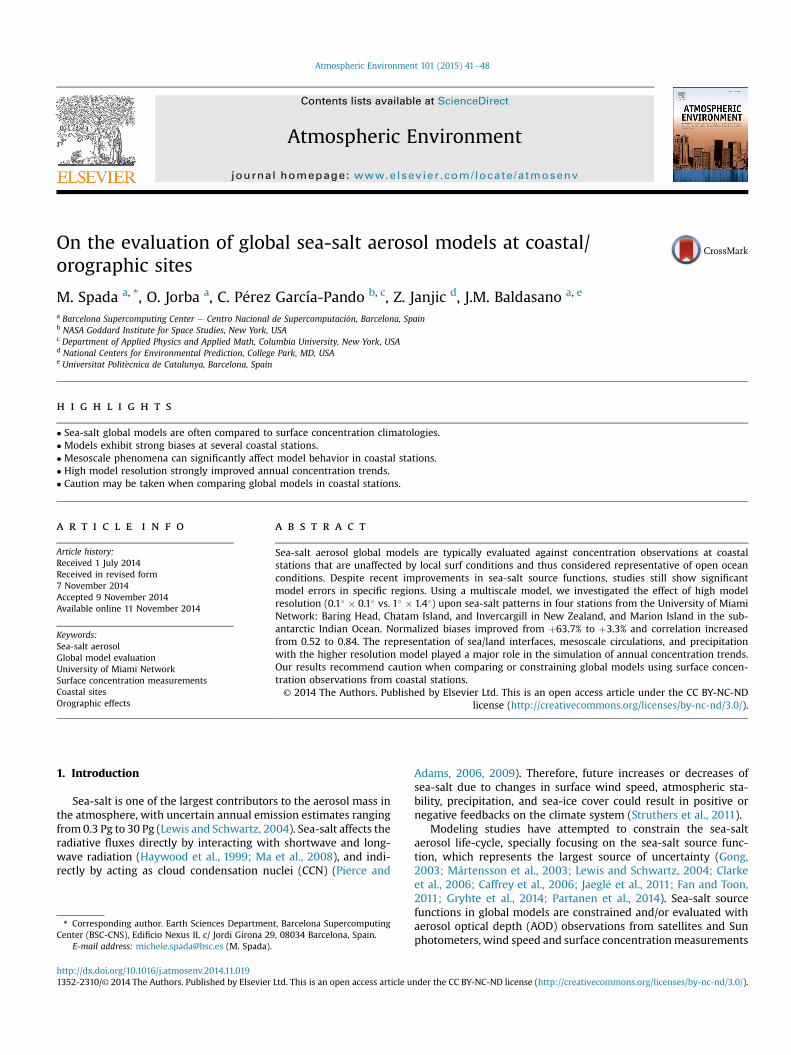
Fig. 2. Simulated annual mean wind speed at 10 m (upper panels) and annual accumulatedmodel resolutions over New Zealand. 30-year observational climatologies from the NatioSimulated values cover a 5-year period (2002e2006). The label acprec refers to accumuladomains (covering latitudes from 148.8� E to 159.2� Wand longitudes from 15.2� S to 67.2� Srespectively).
simulations at 1� �1.4� horizontal resolution and 24 vertical levels(GLOB) with high-resolution regional simulations at 0.1� � 0.1� and40 vertical levels. The global simulations and their evaluation werediscussed in Spada et al. (2013). In this contribution, we consideredtwo high-resolution regional domains (REG) centered in NewZealand (174.8� E, 41.2� S) and Marion Island (37.7� E, 46.1� S). Forthe global simulations we applied the source function of Gong(2003) (G03-GLOB) based on a power law dependence on windspeed and the source function of Jaegl�e et al. (2011) (J11-GLOB)based on Gong (2003) with an added dependency on SST. For theregional simulations we used the source function of Jaegl�e et al.(2011) (J11-REG). The dynamical core and all physical schemeswere identical in both REG and GLOB simulations. The two REGdomains were extended enough (i.e. more than 2000 km from thecenter of the domains, which represents five times the meantransport path of sea-salt aerosols at maximum wind speed con-ditions in the region) to avoid any noticeable sea-salt contributionfrom the boundaries of the domain to the study region. We per-formed 5-year simulations (2002e2006) in order to compare themodel results with climatological observations. Simulations wereinitialized every 24 h and constrained at boundaries every 6 h withNCEP Final Analysis (FNL).
For the model evaluation we considered four stations from theUNI-MIAMI Network: (a) Baring Head, (b) Chatam Island, (c)Invercargill, and (d) Marion Island (see Table 1). Measurements areavailable from the early 1980s to the 1996 and these sites are freefrom surf-zone produced sea-salt aerosol (J. Prospero, personalcommunication, 2012). Observed sea-salt concentration wascomputed as SS ¼ Cl� þ 1.47Naþ (Quinn and Bates, 2005).
precipitation (lower panels) at low (GLOB, left column) and high (REG, central column)nal Institute of Water and Atmospheric Research (NIWA) are shown (right column).ted precipitation. Plots are displayed over zoomed regions with respect to simulated). a, b, and c indicate UNI-MIAMI stations (Baring Head, Chatam Island, and Invercargill,
M. Spada et al. / Atmospheric Environment 101 (2015) 41e4844
Measurements are not constrained by an upper cutoff in radius. Wealso evaluated the simulatedwind speed and precipitationwith 30-year observational climatologies (1980e2010) provided by theNational Institute of Water and Atmospheric Research (NIWA)(Wratt et al., 2006) and the South African Weather Service (SWAS)(Rouault et al., 2005) (Table 1). Additionally, NIWA providedclimatological maps covering the New Zealand islands at0.5� � 0.5� resolution.
3. Results and discussion
The New Zealand region is characterized by open ocean west-erlies and extratropical cyclones colliding with steep orographicgradients, which represent a classic example of the barrier problem(e.g. Roe (2005)). The influence of the Southern Alps orographicgradients upon wind and precipitation patterns represents a wellstudied topic both experimentally (Sinclair et al., 1997; McCauleyand Sturman, 1999; Wratt et al., 2000) and through regionalmodeling (Katzfey, 1995a, b; Bormann and Marks, 1999; Revellet al., 2002). Westerlies have to circumvent the barrier and theflux is enhanced at the edges of the Island; rising humid air cools byadiabatic expansion releasing precipitation at the windward side ofthe mountain and becomes drier at the leeward side.
The Southern Alps are around 40 kmwide and over 1.5 km high,with maximum heights of 3 km. Therefore, at REG scales (lREG) themodel was able to capture the spatial length characterizing theorographic gradients lc ¼ 40 km (lc ~ 5lREG) in contrast to GLOB (lc/lGLOB < 1). Fig. 1 shows the simulated annual sea-salt emissionfluxes and annual mean surface concentration over the domain,both at low and high-resolution. At high-resolution (REG), theannual mean surface concentration decreased over New Zealandfrom 20% to 80% compared to the GLOB simulation. Markedchanges in concentration patterns also were found in the NewZealand straits that neighbor Baring Head (a) and Invercargill (c),respectively. Furthermore, Chatam Island (b) was treated as a landgrid cell with no direct emission in the REG simulation, while it wasrepresented as an ocean grid cell in the GLOB simulation, leading toa decrease of roughly 30%.
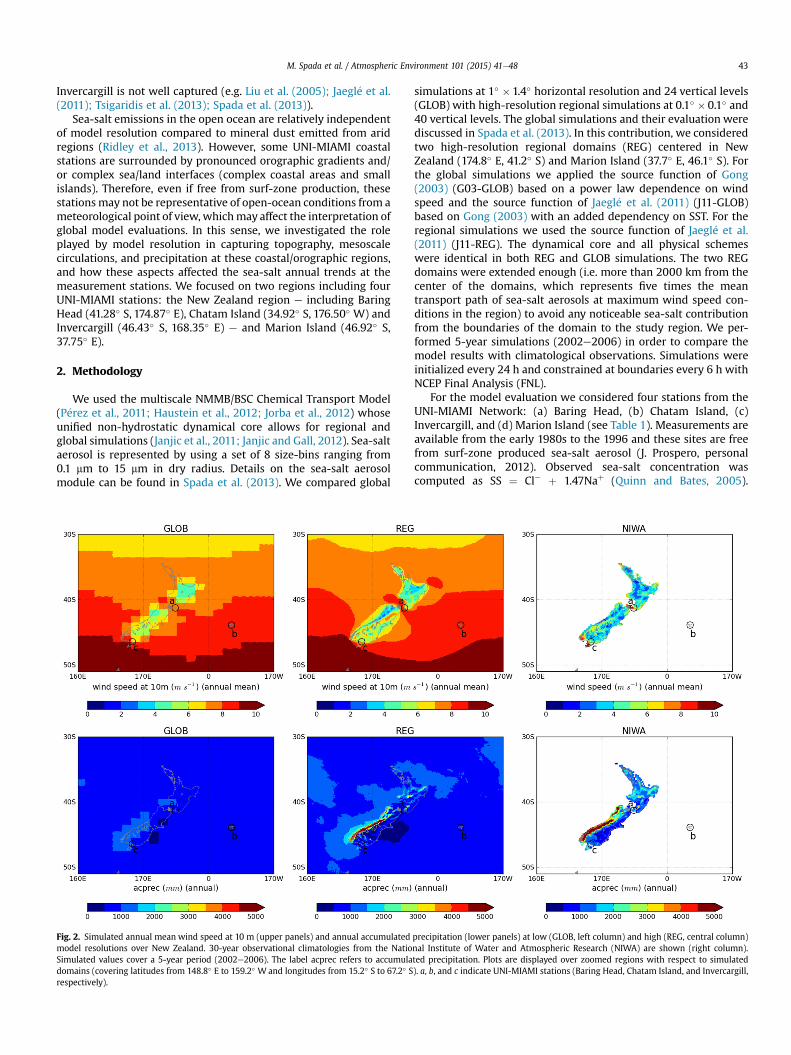
Fig. 2 shows the simulated annual meanwind speed at 10 m andannual precipitation over the New Zealand domain compared tothe NIWA climatological maps. Simulated and observed wind rosesat Invercargill are also displayed in Fig. 3. Meteorological patterns
Fig. 3. Simulated wind rose of Invercargill (c) at low (GLOB, left panel) and high (REG, centrathe National Institute of Water and Atmospheric Research (NIWA) are shown (right panel)
changed significantly. At REG scales wind speed increased up to20% compared to GLOB at the Cook Strait (between North and SouthIslands) and the edges of the Island. Over land, wind speedgenerally decreased, except for a narrow region leeward of theSouthern Alps where winds increased up to 6e8 m/s, in betteragreement with the observed NIWA climatology. Precipitation wasenhanced to the west of the Island, including the open ocean andspecially windward of the Southern Alps with a 800% increase. Themaximum values and fine structure of precipitation were in strongagreement with the NIWA climatological map. Simulated pre-cipitations upwind of the Southern Alps increased from 1200 mm/yr with GLOB to 10,300 mm/yr with REG, removingmost of the biaswith respect to the NIWAmaximumvalues (around 11,200 mm/yr).The fine structure of the North Island and its local maxima werealso well reproduced. The results outline the high-resolutionmodel's ability to capture characteristic scales of the New Zealandcirculation.
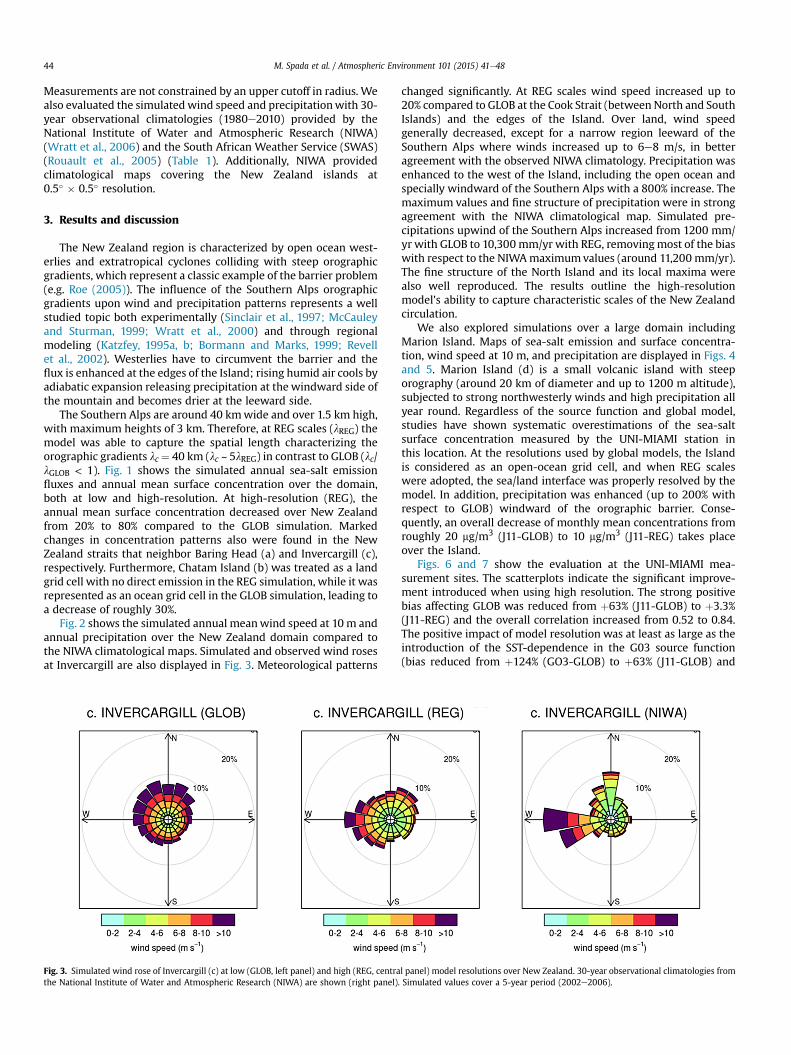
We also explored simulations over a large domain includingMarion Island. Maps of sea-salt emission and surface concentra-tion, wind speed at 10 m, and precipitation are displayed in Figs. 4and 5. Marion Island (d) is a small volcanic island with steeporography (around 20 km of diameter and up to 1200 m altitude),subjected to strong northwesterly winds and high precipitation allyear round. Regardless of the source function and global model,studies have shown systematic overestimations of the sea-saltsurface concentration measured by the UNI-MIAMI station inthis location. At the resolutions used by global models, the Islandis considered as an open-ocean grid cell, and when REG scaleswere adopted, the sea/land interface was properly resolved by themodel. In addition, precipitation was enhanced (up to 200% withrespect to GLOB) windward of the orographic barrier. Conse-quently, an overall decrease of monthly mean concentrations fromroughly 20 mg/m3 (J11-GLOB) to 10 mg/m3 (J11-REG) takes placeover the Island.
Figs. 6 and 7 show the evaluation at the UNI-MIAMI mea-surement sites. The scatterplots indicate the significant improve-ment introduced when using high resolution. The strong positivebias affecting GLOB was reduced from þ63% (J11-GLOB) to þ3.3%(J11-REG) and the overall correlation increased from 0.52 to 0.84.The positive impact of model resolution was at least as large as theintroduction of the SST-dependence in the G03 source function(bias reduced from þ124% (GO3-GLOB) to þ63% (J11-GLOB) and
l panel) model resolutions over New Zealand. 30-year observational climatologies from. Simulated values cover a 5-year period (2002e2006).

Fig. 4. Simulated sea-salt annual emission (upper panels) and annual mean surface concentration (bottom panels) at low (GLOB, left column) and high (REG, right column) modelresolutions over Marion Island using the Jaegl�e et al. (2011) (J11) source function. Simulated averages refer to a 5-year period (2002e2006). The labels emi and sconc refer toemission flux and surface concentration, respectively. Plots are displayed over zoomed regions with respect to simulated domains (covering latitudes from 12.7� E to 62.7� E andlongitudes from 21.9� S to 71.9� S). d indicates the UNI-MIAMI Marion Island station.
M. Spada et al. / Atmospheric Environment 101 (2015) 41e48 45
correlation increased from 0.36 to 0.52), which makes evident thatthese effects may be taken into consideration when evaluatingsource functions at these sites. The positive bias of wind speed at10 m was reduced from þ24.6% to þ15.8% and the correlationincreased from 0.62 to 0.89. Remarkably, the high-resolutionmodel was able to significantly reduce the overestimations ofthe wind speed monthly averages below 6 m/s. The simulation ofprecipitation improved with a reduction of the negative biasfrom �31.4% to �7.1%. In particular, the underestimated highmonthly mean precipitations were corrected towards theobserved values. The precipitation correlation increased from 0.65to 0.86.
We identified three different effects introduced by theenhanced model resolution. When the model was able to properlysolve small islands and represented them as land grid cells insteadof ocean cells, sea-salt aerosol was not directly produced in suchcells and the sea-salt surface concentration strongly decreased:this was mostly the case of Chatam Island (b). At Invercargill (c),the simulated wind circulation was strongly affected by the rep-resentation of the Southern Alps barrier. The model scales wereable to capture the mesoscale circulation, with wind speed re-ductions and changes in wind direction in better agreement with
the measured climatologies. Fig. 3 shows how the unrealistic windrose at Inverncargill (c) with the GLOB simulations was clearlyimproved in the REG simulation, which better matched theobserved dominant western winds and the lower wind speedvalues observed in other directions. Emissions and transport wereconsequently affected and the simulated surface concentrationsdecreased towards the observed monthly averages. We highlightthe significant improvements introduced in the annual trend atInvercargill (c). The spurious maximum value in September ob-tained with GLOB simulations (also found in Liu et al. (2005) andJaegl�e et al. (2011)) was suppressed and replaced by a minimumvalue in August, in better agreement with the measured clima-tology. At Baring Head (a) and Marion Island (d) we observed asignificant increase in simulated precipitation when high-resolution was used, in agreement with measurements, withsubsequent enhancement of sea-salt wet-deposition (not shown)and a decrease in concentration. Being Baring Head (a), Inver-cargill (c) and Marion Island (d) stations located close to thecoastal line, model results in these sites were also affected by thesea/land interface effect discussed for Chatam Island (b). Thequantification of the relative importance of each of these effects iscomplex and beyond the scope of this contribution.
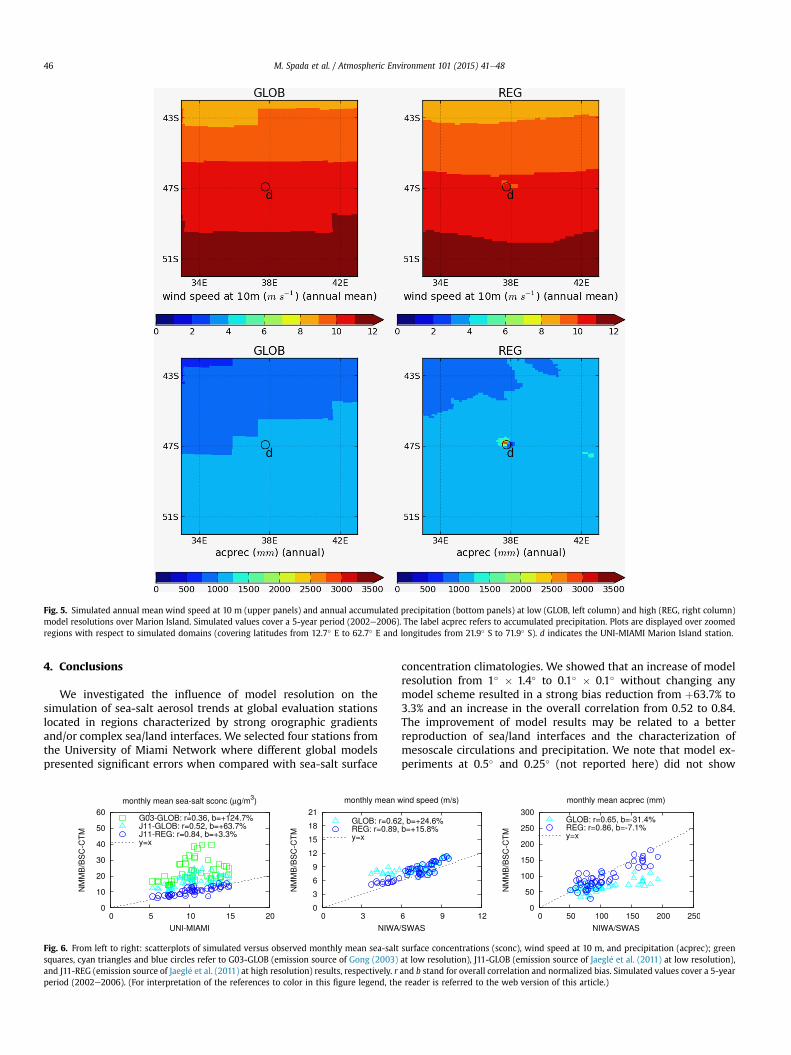
Fig. 5. Simulated annual mean wind speed at 10 m (upper panels) and annual accumulated precipitation (bottom panels) at low (GLOB, left column) and high (REG, right column)model resolutions over Marion Island. Simulated values cover a 5-year period (2002e2006). The label acprec refers to accumulated precipitation. Plots are displayed over zoomedregions with respect to simulated domains (covering latitudes from 12.7� E to 62.7� E and longitudes from 21.9� S to 71.9� S). d indicates the UNI-MIAMI Marion Island station.
M. Spada et al. / Atmospheric Environment 101 (2015) 41e4846
4. Conclusions
We investigated the influence of model resolution on thesimulation of sea-salt aerosol trends at global evaluation stationslocated in regions characterized by strong orographic gradientsand/or complex sea/land interfaces. We selected four stations fromthe University of Miami Network where different global modelspresented significant errors when compared with sea-salt surface
Fig. 6. From left to right: scatterplots of simulated versus observed monthly mean sea-saltsquares, cyan triangles and blue circles refer to G03-GLOB (emission source of Gong (2003)and J11-REG (emission source of Jaegl�e et al. (2011) at high resolution) results, respectively. rperiod (2002e2006). (For interpretation of the references to color in this figure legend, the
concentration climatologies. We showed that an increase of modelresolution from 1� � 1.4� to 0.1� � 0.1� without changing anymodel scheme resulted in a strong bias reduction from þ63.7% to3.3% and an increase in the overall correlation from 0.52 to 0.84.The improvement of model results may be related to a betterreproduction of sea/land interfaces and the characterization ofmesoscale circulations and precipitation. We note that model ex-periments at 0.5� and 0.25� (not reported here) did not show
surface concentrations (sconc), wind speed at 10 m, and precipitation (acprec); greenat low resolution), J11-GLOB (emission source of Jaegl�e et al. (2011) at low resolution),and b stand for overall correlation and normalized bias. Simulated values cover a 5-yearreader is referred to the web version of this article.)
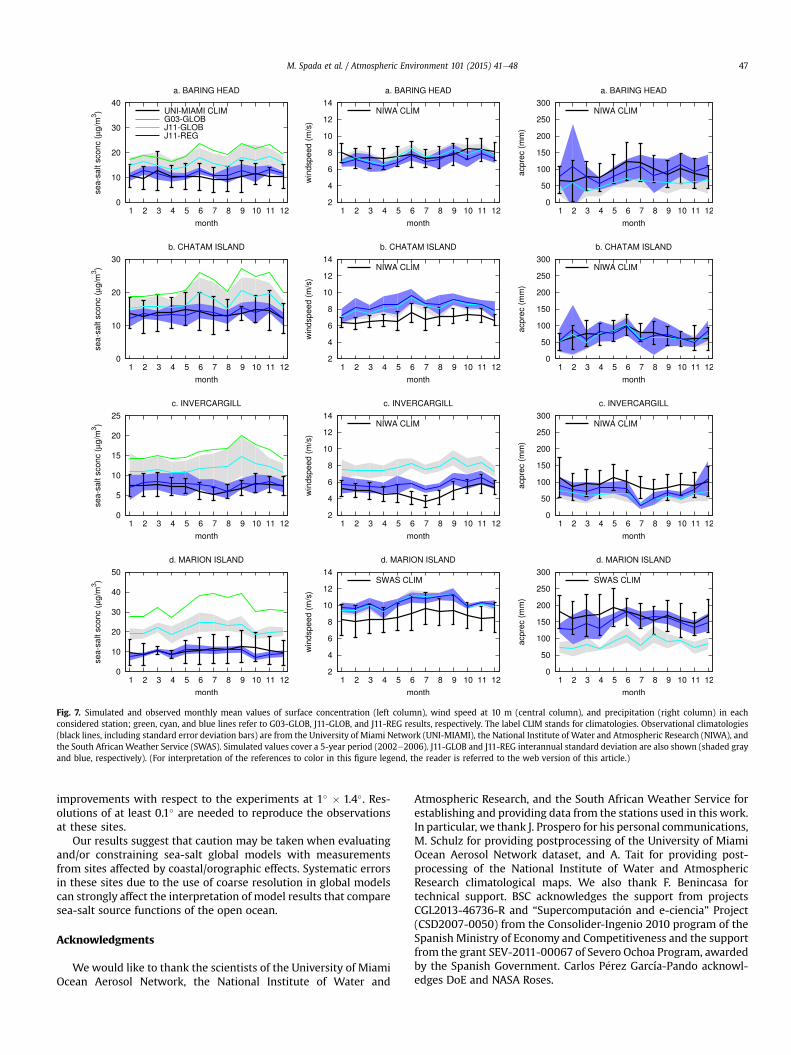
Fig. 7. Simulated and observed monthly mean values of surface concentration (left column), wind speed at 10 m (central column), and precipitation (right column) in eachconsidered station; green, cyan, and blue lines refer to G03-GLOB, J11-GLOB, and J11-REG results, respectively. The label CLIM stands for climatologies. Observational climatologies(black lines, including standard error deviation bars) are from the University of Miami Network (UNI-MIAMI), the National Institute of Water and Atmospheric Research (NIWA), andthe South African Weather Service (SWAS). Simulated values cover a 5-year period (2002e2006). J11-GLOB and J11-REG interannual standard deviation are also shown (shaded grayand blue, respectively). (For interpretation of the references to color in this figure legend, the reader is referred to the web version of this article.)
M. Spada et al. / Atmospheric Environment 101 (2015) 41e48 47
improvements with respect to the experiments at 1� � 1.4�. Res-olutions of at least 0.1� are needed to reproduce the observationsat these sites.
Our results suggest that caution may be taken when evaluatingand/or constraining sea-salt global models with measurementsfrom sites affected by coastal/orographic effects. Systematic errorsin these sites due to the use of coarse resolution in global modelscan strongly affect the interpretation of model results that comparesea-salt source functions of the open ocean.
Acknowledgments
Wewould like to thank the scientists of the University of MiamiOcean Aerosol Network, the National Institute of Water and
Atmospheric Research, and the South African Weather Service forestablishing and providing data from the stations used in this work.In particular, we thank J. Prospero for his personal communications,M. Schulz for providing postprocessing of the University of MiamiOcean Aerosol Network dataset, and A. Tait for providing post-processing of the National Institute of Water and AtmosphericResearch climatological maps. We also thank F. Benincasa fortechnical support. BSC acknowledges the support from projectsCGL2013-46736-R and “Supercomputaci�on and e-ciencia” Project(CSD2007-0050) from the Consolider-Ingenio 2010 program of theSpanish Ministry of Economy and Competitiveness and the supportfrom the grant SEV-2011-00067 of Severo Ochoa Program, awardedby the Spanish Government. Carlos P�erez García-Pando acknowl-edges DoE and NASA Roses.
M. Spada et al. / Atmospheric Environment 101 (2015) 41e4848
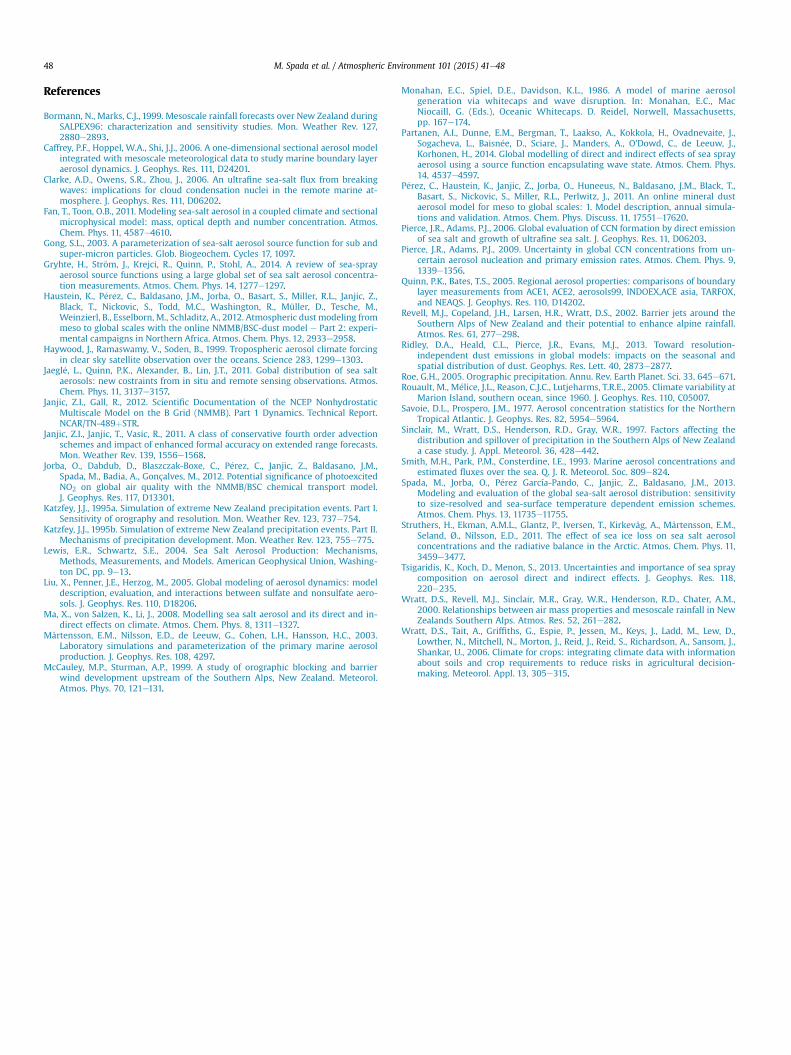
References
Bormann, N., Marks, C.J., 1999. Mesoscale rainfall forecasts over New Zealand duringSALPEX96: characterization and sensitivity studies. Mon. Weather Rev. 127,2880e2893.
Caffrey, P.F., Hoppel, W.A., Shi, J.J., 2006. A one-dimensional sectional aerosol modelintegrated with mesoscale meteorological data to study marine boundary layeraerosol dynamics. J. Geophys. Res. 111, D24201.
Clarke, A.D., Owens, S.R., Zhou, J., 2006. An ultrafine sea-salt flux from breakingwaves: implications for cloud condensation nuclei in the remote marine at-mosphere. J. Geophys. Res. 111, D06202.
Fan, T., Toon, O.B., 2011. Modeling sea-salt aerosol in a coupled climate and sectionalmicrophysical model: mass, optical depth and number concentration. Atmos.Chem. Phys. 11, 4587e4610.
Gong, S.L., 2003. A parameterization of sea-salt aerosol source function for sub andsuper-micron particles. Glob. Biogeochem. Cycles 17, 1097.
Gryhte, H., Str€om, J., Krejci, R., Quinn, P., Stohl, A., 2014. A review of sea-sprayaerosol source functions using a large global set of sea salt aerosol concentra-tion measurements. Atmos. Chem. Phys. 14, 1277e1297.
Haustein, K., P�erez, C., Baldasano, J.M., Jorba, O., Basart, S., Miller, R.L., Janjic, Z.,Black, T., Nickovic, S., Todd, M.C., Washington, R., Müller, D., Tesche, M.,Weinzierl, B., Esselborn, M., Schladitz, A., 2012. Atmospheric dust modeling frommeso to global scales with the online NMMB/BSC-dust model e Part 2: experi-mental campaigns in Northern Africa. Atmos. Chem. Phys. 12, 2933e2958.
Haywood, J., Ramaswamy, V., Soden, B., 1999. Tropospheric aerosol climate forcingin clear sky satellite observation over the oceans. Science 283, 1299e1303.
Jaegl�e, L., Quinn, P.K., Alexander, B., Lin, J.T., 2011. Gobal distribution of sea saltaerosols: new costraints from in situ and remote sensing observations. Atmos.Chem. Phys. 11, 3137e3157.
Janjic, Z.I., Gall, R., 2012. Scientific Documentation of the NCEP NonhydrostaticMultiscale Model on the B Grid (NMMB). Part 1 Dynamics. Technical Report.NCAR/TN-489þSTR.
Janjic, Z.I., Janjic, T., Vasic, R., 2011. A class of conservative fourth order advectionschemes and impact of enhanced formal accuracy on extended range forecasts.Mon. Weather Rev. 139, 1556e1568.
Jorba, O., Dabdub, D., Blaszczak-Boxe, C., P�erez, C., Janjic, Z., Baldasano, J.M.,Spada, M., Badia, A., Gonçalves, M., 2012. Potential significance of photoexcitedNO2 on global air quality with the NMMB/BSC chemical transport model.J. Geophys. Res. 117, D13301.
Katzfey, J.J., 1995a. Simulation of extreme New Zealand precipitation events. Part I.Sensitivity of orography and resolution. Mon. Weather Rev. 123, 737e754.
Katzfey, J.J., 1995b. Simulation of extreme New Zealand precipitation events. Part II.Mechanisms of precipitation development. Mon. Weather Rev. 123, 755e775.
Lewis, E.R., Schwartz, S.E., 2004. Sea Salt Aerosol Production: Mechanisms,Methods, Measurements, and Models. American Geophysical Union, Washing-ton DC, pp. 9e13.
Liu, X., Penner, J.E., Herzog, M., 2005. Global modeling of aerosol dynamics: modeldescription, evaluation, and interactions between sulfate and nonsulfate aero-sols. J. Geophys. Res. 110, D18206.
Ma, X., von Salzen, K., Li, J., 2008. Modelling sea salt aerosol and its direct and in-direct effects on climate. Atmos. Chem. Phys. 8, 1311e1327.
Mårtensson, E.M., Nilsson, E.D., de Leeuw, G., Cohen, L.H., Hansson, H.C., 2003.Laboratory simulations and parameterization of the primary marine aerosolproduction. J. Geophys. Res. 108, 4297.
McCauley, M.P., Sturman, A.P., 1999. A study of orographic blocking and barrierwind development upstream of the Southern Alps, New Zealand. Meteorol.Atmos. Phys. 70, 121e131.
Monahan, E.C., Spiel, D.E., Davidson, K.L., 1986. A model of marine aerosolgeneration via whitecaps and wave disruption. In: Monahan, E.C., MacNiocaill, G. (Eds.), Oceanic Whitecaps. D. Reidel, Norwell, Massachusetts,pp. 167e174.
Partanen, A.I., Dunne, E.M., Bergman, T., Laakso, A., Kokkola, H., Ovadnevaite, J.,Sogacheva, L., Baisn�ee, D., Sciare, J., Manders, A., O'Dowd, C., de Leeuw, J.,Korhonen, H., 2014. Global modelling of direct and indirect effects of sea sprayaerosol using a source function encapsulating wave state. Atmos. Chem. Phys.14, 4537e4597.
P�erez, C., Haustein, K., Janjic, Z., Jorba, O., Huneeus, N., Baldasano, J.M., Black, T.,Basart, S., Nickovic, S., Miller, R.L., Perlwitz, J., 2011. An online mineral dustaerosol model for meso to global scales: 1. Model description, annual simula-tions and validation. Atmos. Chem. Phys. Discuss. 11, 17551e17620.
Pierce, J.R., Adams, P.J., 2006. Global evaluation of CCN formation by direct emissionof sea salt and growth of ultrafine sea salt. J. Geophys. Res. 11, D06203.
Pierce, J.R., Adams, P.J., 2009. Uncertainty in global CCN concentrations from un-certain aerosol nucleation and primary emission rates. Atmos. Chem. Phys. 9,1339e1356.
Quinn, P.K., Bates, T.S., 2005. Regional aerosol properties: comparisons of boundarylayer measurements from ACE1, ACE2, aerosols99, INDOEX,ACE asia, TARFOX,and NEAQS. J. Geophys. Res. 110, D14202.
Revell, M.J., Copeland, J.H., Larsen, H.R., Wratt, D.S., 2002. Barrier jets around theSouthern Alps of New Zealand and their potential to enhance alpine rainfall.Atmos. Res. 61, 277e298.
Ridley, D.A., Heald, C.L., Pierce, J.R., Evans, M.J., 2013. Toward resolution-independent dust emissions in global models: impacts on the seasonal andspatial distribution of dust. Geophys. Res. Lett. 40, 2873e2877.
Roe, G.H., 2005. Orographic precipitation. Annu. Rev. Earth Planet. Sci. 33, 645e671.Rouault, M., M�elice, J.L., Reason, C.J.C., Lutjeharms, T.R.E., 2005. Climate variability at
Marion Island, southern ocean, since 1960. J. Geophys. Res. 110, C05007.Savoie, D.L., Prospero, J.M., 1977. Aerosol concentration statistics for the Northern
Tropical Atlantic. J. Geophys. Res. 82, 5954e5964.Sinclair, M., Wratt, D.S., Henderson, R.D., Gray, W.R., 1997. Factors affecting the
distribution and spillover of precipitation in the Southern Alps of New Zealanda case study. J. Appl. Meteorol. 36, 428e442.
Smith, M.H., Park, P.M., Consterdine, I.E., 1993. Marine aerosol concentrations andestimated fluxes over the sea. Q. J. R. Meteorol. Soc. 809e824.
Spada, M., Jorba, O., P�erez García-Pando, C., Janjic, Z., Baldasano, J.M., 2013.Modeling and evaluation of the global sea-salt aerosol distribution: sensitivityto size-resolved and sea-surface temperature dependent emission schemes.Atmos. Chem. Phys. 13, 11735e11755.
Struthers, H., Ekman, A.M.L., Glantz, P., Iversen, T., Kirkevåg, A., Mårtensson, E.M.,Seland, Ø., Nilsson, E.D., 2011. The effect of sea ice loss on sea salt aerosolconcentrations and the radiative balance in the Arctic. Atmos. Chem. Phys. 11,3459e3477.
Tsigaridis, K., Koch, D., Menon, S., 2013. Uncertainties and importance of sea spraycomposition on aerosol direct and indirect effects. J. Geophys. Res. 118,220e235.
Wratt, D.S., Revell, M.J., Sinclair, M.R., Gray, W.R., Henderson, R.D., Chater, A.M.,2000. Relationships between air mass properties and mesoscale rainfall in NewZealands Southern Alps. Atmos. Res. 52, 261e282.
Wratt, D.S., Tait, A., Griffiths, G., Espie, P., Jessen, M., Keys, J., Ladd, M., Lew, D.,Lowther, N., Mitchell, N., Morton, J., Reid, J., Reid, S., Richardson, A., Sansom, J.,Shankar, U., 2006. Climate for crops: integrating climate data with informationabout soils and crop requirements to reduce risks in agricultural decision-making. Meteorol. Appl. 13, 305e315.