Heterogeneous reactions of HOI, ICl and IBr on sea salt and sea salt proxies
13
Heterogeneous reactions of HOI, ICl and IBr on sea salt and sea salt proxies C. F. Braban, a J. W. Adams, a D. Rodriguez,w a R. A. Cox, a J. N. Crowley b and G. Schuster b Received 18th January 2007, Accepted 27th March 2007 First published as an Advance Article on the web 26th April 2007 DOI: 10.1039/b700829e The heterogeneous chemistry of HOI, ICl and IBr on sea salt and sea salt proxies has been studied at 274 K using two experimental approaches: a wetted wall flow tube coupled to an electron impact mass spectrometer (WWFT-MS) and an aerosol flow tube (AFT) coupled to a differential mobility analyser (DMA) and a chemical ionisation mass spectrometer (CIMS). Uptake of all three title molecules into bulk aqueous halide salt films was rapid and controlled by gas phase diffusion. Uptake of HOI gave rise to gas-phase ICl and IBr, with the latter being the predominant product whenever Br was present. Only partial release of IBr was observed due to high solubility of dihalogens in the film. ICl uptake gave the same yield of IBr as HOI uptake. Uptake of ICl on NaBr aerosol was accommodation limited with a = 0.018 0.004 and gas phase IBr product has a yield of 0.6 0.3. The results show that HOI can act as a catalyst for activation of bromine from sea-salt aerosols in the marine boundary layer, via the reactions: HOI aq + Cl aq +H + aq - ICl aq +H 2 O l and ICl aq + Br aq - IBr aq + Cl aq . 1. Introduction Most iodine in the marine environment is emitted in the form of gas-phase biogenic organic iodine compounds. Several iodocarbons have relatively short photochemical lifetimes, resulting in the release of gas phase I atoms which react mainly with ozone to form the IO radical. IO has been observed at ppt levels at several locations in the marine boundary layer (MBL) at mid latitudes 1,2 and in the polar troposphere. 3 Reactive inorganic halogen species such as IO in the marine boundary layer can directly influence levels of oxidants such as ozone. The IO radical can react with HO 2 or NO 2 in the gas phase, leading to the formation of HOI and IONO 2 (R1, R2): IO þ HO 2 ! HOI þ O 2 ðR1Þ IO þ NO 2 þ M ! IONO 2 þ M ðR2Þ HOI can reform IO via photolysis 4,5 contributing to ozone destruction via R3–R5. HOI þ hn ! OH þ I ðR3Þ I þ O 3 ! IO þ O 2 ðR4Þ OH þ O 3 ! HO 2 þ O 2 ðR5Þ In addition to gas phase processes, both HOI and IONO 2 may undergo heterogeneous reactions on aerosol surfaces. Indeed, the conversion of IONO 2 to HOI can occur by hydrolysis on aqueous particles (R6). IONO 2aq þ H 2 O aq ! HOI aq þ HNO 3aq ðR6Þ Despite its short photochemical lifetime, models predict HOI to be one of the most abundant reservoirs of inorganic iodine in the MBL and therefore its heterogeneous reactions could be very significant. 6–8 Potential heterogeneous loss processes for HOI in the MBL include its reaction with acidified, aqueous halide solutions (e.g., sea salt aerosol) to form di-halogens: HOI aq þ Cl aq þ H þ aq ! ICl aq þ H 2 O l ðR7Þ or HOI aq þ Br aq þ H þ aq ! IBr aq þ H 2 O l ðR8Þ The fate of the ICl and IBr products depends on their solubilities and on the rates of aqueous phase interconversion reactions. As the molar ratio of chlorine to bromine in sea- water is B658, R7 may be expected to dominate, resulting in ICl aq formation. The release of ICl to the gas phase would then constitute an iodine-mediated chlorine activation me- chanism, whereby I atoms are recycled. ICl þ hn ! I þ Cl ðR9Þ This has been discussed by McFiggans et al., 7 who considered the rate of atomic chlorine activation to be related to the rate of attachment of HOI at the aerosol surface, given by: d½ICl g dt ¼ f g cA 4 ½HOI ð1Þ where A is the aerosol surface area of the sea salt, f is the fractional conversion of HOI to gaseous ICl, g is the uptake coefficient and c is the mean speed of the HOI gas molecules. a Department of Chemistry, University of Cambridge, Lensfield Rd, Cambridge, UK CB2 1EW b Max-Planck-Institut fu ¨r Chemie, Division of Atmospheric Chemistry, Postfach 3060, 55020 Mainz, Germany w Present address: Departamento de Quı´mica Fı´sica, Facultad de Ciencias del Medio Ambiente, Universidad Castilla-La Mancha Avda. Carlos III s/n 45071 Toledo, Spain. 3136 | Phys. Chem. Chem. Phys., 2007, 9, 3136–3148 This journal is c the Owner Societies 2007 PAPER www.rsc.org/pccp | Physical Chemistry Chemical Physics Published on 26 April 2007. Downloaded by Univ de Castilla-La Mancha on 06/11/2013 09:14:54. View Article Online / Journal Homepage / Table of Contents for this issue
-
Upload
independent -
Category
Documents
-
view
0 -
download
0
Transcript of Heterogeneous reactions of HOI, ICl and IBr on sea salt and sea salt proxies

Heterogeneous reactions of HOI, ICl and IBr on sea salt and sea salt
proxies
C. F. Braban,a J. W. Adams,a D. Rodriguez,wa R. A. Cox,a J. N. Crowleyb and
G. Schusterb
Received 18th January 2007, Accepted 27th March 2007
First published as an Advance Article on the web 26th April 2007
DOI: 10.1039/b700829e
The heterogeneous chemistry of HOI, ICl and IBr on sea salt and sea salt proxies has been
studied at 274 K using two experimental approaches: a wetted wall flow tube coupled to an
electron impact mass spectrometer (WWFT-MS) and an aerosol flow tube (AFT) coupled to a
differential mobility analyser (DMA) and a chemical ionisation mass spectrometer (CIMS).
Uptake of all three title molecules into bulk aqueous halide salt films was rapid and controlled by
gas phase diffusion. Uptake of HOI gave rise to gas-phase ICl and IBr, with the latter being the
predominant product whenever Br� was present. Only partial release of IBr was observed due to
high solubility of dihalogens in the film. ICl uptake gave the same yield of IBr as HOI uptake.
Uptake of ICl on NaBr aerosol was accommodation limited with a = 0.018 � 0.004 and gas
phase IBr product has a yield of 0.6 � 0.3. The results show that HOI can act as a catalyst for
activation of bromine from sea-salt aerosols in the marine boundary layer, via the reactions:
HOIaq + Cl�aq + H+aq - IClaq + H2Ol and IClaq + Br�aq - IBraq + Cl�aq.
1. Introduction
Most iodine in the marine environment is emitted in the form
of gas-phase biogenic organic iodine compounds. Several
iodocarbons have relatively short photochemical lifetimes,
resulting in the release of gas phase I atoms which react mainly
with ozone to form the IO radical. IO has been observed at ppt
levels at several locations in the marine boundary layer (MBL)
at mid latitudes1,2 and in the polar troposphere.3 Reactive
inorganic halogen species such as IO in the marine boundary
layer can directly influence levels of oxidants such as ozone.
The IO radical can react with HO2 or NO2 in the gas phase,
leading to the formation of HOI and IONO2 (R1, R2):
IOþHO2 ! HOIþO2 ðR1Þ
IOþNO2 þM! IONO2 þM ðR2Þ
HOI can reform IO via photolysis4,5 contributing to ozone
destruction via R3–R5.
HOIþ hn ! OHþ I ðR3Þ
IþO3 ! IOþO2 ðR4Þ
OHþO3 ! HO2 þO2 ðR5Þ
In addition to gas phase processes, both HOI and IONO2 may
undergo heterogeneous reactions on aerosol surfaces. Indeed,
the conversion of IONO2 to HOI can occur by hydrolysis on
aqueous particles (R6).
IONO2aq þH2Oaq ! HOIaq þHNO3aq ðR6Þ
Despite its short photochemical lifetime, models predict HOI
to be one of the most abundant reservoirs of inorganic iodine
in the MBL and therefore its heterogeneous reactions could be
very significant.6–8
Potential heterogeneous loss processes for HOI in the MBL
include its reaction with acidified, aqueous halide solutions
(e.g., sea salt aerosol) to form di-halogens:
HOIaq þ Cl�aq þHþaq ! IClaq þH2Ol ðR7Þ
or
HOIaq þ Br�aq þH þaq ! IBraq þH2Ol ðR8Þ
The fate of the ICl and IBr products depends on their
solubilities and on the rates of aqueous phase interconversion
reactions. As the molar ratio of chlorine to bromine in sea-
water is B658, R7 may be expected to dominate, resulting in
IClaq formation. The release of ICl to the gas phase would
then constitute an iodine-mediated chlorine activation me-
chanism, whereby I atoms are recycled.
IClþ hn ! Iþ Cl ðR9Þ
This has been discussed by McFiggans et al.,7 who considered
the rate of atomic chlorine activation to be related to the rate
of attachment of HOI at the aerosol surface, given by:
d½IClg�dt
¼ f g�cA
4½HOI� ð1Þ
where A is the aerosol surface area of the sea salt, f is the
fractional conversion of HOI to gaseous ICl, g is the uptake
coefficient and �c is the mean speed of the HOI gas molecules.
aDepartment of Chemistry, University of Cambridge, Lensfield Rd,Cambridge, UK CB2 1EW
bMax-Planck-Institut fur Chemie, Division of Atmospheric Chemistry,Postfach 3060, 55020 Mainz, Germany
w Present address: Departamento de Quımica Fısica, Facultad deCiencias del Medio Ambiente, Universidad Castilla-La Mancha Avda.Carlos III s/n 45071 Toledo, Spain.
3136 | Phys. Chem. Chem. Phys., 2007, 9, 3136–3148 This journal is �c the Owner Societies 2007
PAPER www.rsc.org/pccp | Physical Chemistry Chemical Physics
Publ
ishe
d on
26
Apr
il 20
07. D
ownl
oade
d by
Uni
v de
Cas
tilla
-La
Man
cha
on 0
6/11
/201
3 09
:14:
54.
View Article Online / Journal Homepage / Table of Contents for this issue

The presence of aerosol bromide may cause reaction R10 to
compete with ICl release, switching a chlorine activation
mechanism into bromine activation, following release of bro-
mine either as IBr or Br2, leading to f { 1. This process is
important since Br is efficient for depletion of O3 in the marine
boundary layer.9,10 Inorganic bromine in aged sea salt aerosol
is frequently depleted in bromide relative to conservative
tracers of seawater composition, and in fresh sea salt aerosol.10
IClaq þ Br�aq ! IBraq þ Cl�aq ðR10Þ
IBrþ hn ! Iþ Br ðR11Þ
The value of f was estimated to be 0.5 for a mixed-age MBL
aerosol assemblage, by analogy with the efficiency for BrCl
activation by HOBr.3 Note also, that HOI can be formed at
night by the hydrolysis of IONO2 (R6). The likelihood of HOI
reacting with sea-salt aerosol is significantly larger than during
the day, as photolysis stops at dusk. If ICl is released to the gas
phase at nightime, it may accumulate in the absence of
photolysis, and there is a possibility that ICl can re-enter the
sea salt aerosol and participate in the aqueous halide chem-
istry, via the reverse of reaction R7. For this reason the
heterogeneous reactions of both HOI and ICl with sea salt
aerosol need to be understood.
It is noted that the above reactions are a highly simplified
representation of the aqueous phase equilibrium chemistry
that occurs in the aerosol. The linked gas phase and hetero-
geneous chemical cycles of HOX (X = Cl, Br or I) and
formation of gas phase molecular halogens have been de-
scribed in detail previously7,10–12 and have been the subject
of several laboratory and modeling studies.13–20 Two para-
meters that have significant impact on the role of HOI in the
MBL are its rate of processing by marine aerosols, and the
identity of the photolabile halogens that can be released to the
gas-phase.
Marine aerosol includes both submicron (accumulation
mode) and supermicron (coarse mode) particles. They consist
both of inorganic ions and organic compounds present in
seawater, and additional components formed by chemical
reactions during aging. The latter are either taken up from
the gas phase or formed by reactions in the aerosol. Fresh sea
salt particles are aqueous and have a pH of between 7.5 to 8.5.
The pH decreases with time as acidic gases, in particular SO2,
are absorbed from the atmosphere. Initial sea salt alkalinity is
titrated rapidly and near equilibrium pH established on rela-
tively short timescales.21 Modeled aged marine aerosol pHs
are in the range 4.5–5.4 for super micron particles, and 2.6–5.3
for submicron particles.22 The aerosol pH is also regulated by
the HCl partitioning,23 which is, in turn, determined by the
sulfate content of the aerosol. Since the aqueous phase reac-
tions following HOI uptake involve H+ ions, processing rates
are likely to depend on pH.
In this work, we investigated the uptake of both HOI and
ICl onto aqueous salt surfaces, extending a small body of
laboratory studies using solid halide surfaces.13,14,19 A sum-
mary of these studies is presented in Table 1. Most of these
studies were performed using low relative humidities with
either dry or frozen salts as substrates. They show that both
ICl and IBr are released following HOI uptake on solid
surfaces containing sea salt, and that when Br� is present
ICl uptake forms IBr. The rate of HOI uptake appears to be
faster than ICl.
In the present work two experimental techniques have been
used: a wetted wall flow tube system (WWFT) and an aerosol
flow tube coupled to a chemical ionisation mass spectrometer.
With the former technique uptake studies of HOI, ICl and IBr
were carried out onto bulk aqueous film substrates. With the
AFT-CIMS it was possible to study the uptake on to aerosols
of ICl as a proxy for HOI, based on the assumption that R7 is
fast. Experiments were performed mostly using sodium bro-
mide aerosol, in order to ascertain if the release of IBr was
quantitative. The advantage of the aerosol experiment is that
the process is not strongly influenced by volume and mass
transfer effects given the small volume of the particles. The pH
Table 1 Summary of literature data for HOI and ICl uptake onto salt and salt proxies
HOI ICl
Substrate RH T/K g Products Yield g Products Yield Ref.
Seasalt fresh 0 298 0.061 IBr, ICl f(t) 0.0012 IBr 0.3 13Aged 0 298 0.014 ICl IBr 0.3 — — — 13Seasalt fresh 11 278 0.02 none — — — — 13NaBr fresh 0 298 0.034 IBr 1 0.0068 IBr 1 13Aged 0 298 0.008 IBr 0.19 — IBr 0.7 13NaBr fresh 11 278 0.008 IBr — — — — 13NaCl fresh 0 298 0.016 ICl 0.1 o10�4 — — 13Aged 0 298 0.007 ICl 0.1 — — — 13NaCl fresh 11 278 0.008 ICl 0.1 — — — 13NaOH fresh 0 298 0.016 none 0 0.0034 None — 13Aged 0 298 0.0022 none 0 — — — 13NaOH 11 278 40.1 none 0 40.1 None — 13NaCl 0 298 0.04 none — — — 19KBr 0 298 0.06 none — — — 19NaCl/NaBr(s) 0 298 40.01 IBr,ICl 1 — — — 14
0 243 40.01 IBr,ICl 1 — — — 14Frozen film NaCl/NaBr 0 243 40.01 IBr,ICl 1 40.01 IBr 1 14H2SO4 0 298 40.04 IBr,ICl 1 — — — 14
0 243 40.04 IBr,ICl 1 — — — 14
This journal is �c the Owner Societies 2007 Phys. Chem. Chem. Phys., 2007, 9, 3136–3148 | 3137
Publ
ishe
d on
26
Apr
il 20
07. D
ownl
oade
d by
Uni
v de
Cas
tilla
-La
Man
cha
on 0
6/11
/201
3 09
:14:
54.
View Article Online

dependence of product release from salt solutions is consid-
ered and the implications of the results are discussed in the
context of bromide and chloride depletion from marine
aerosols.
2. Experimental
2.1 Wetted wall flow tube-electron impact mass spectrometer
(WWFT-EIMS)
The interaction of HOI and ICl with seawater and seawater
proxies was studied using a vertically mounted wetted wall
flow tube coupled to a mass spectrometer for gas-phase
analysis. Two similar but independent set-ups were used
located at the University of Cambridge (UCAM) and Max-
Planck-Institute (MPI), Mainz (Germany). The MPI appara-
tus has been described in detail previously15,24 and only
pertinent details are given here. The MPI experiments, focuss-
ing on the uptake of ICl only, were conducted at 278 and 293
K and at a range of pressures (approximately 20–200 Torr).
The mean linear velocity of gas flowing in the 1.55 cm diameter
flow tube varied between 30 and 130 cm s�1, according to the
flow rate (E300–700 sccm) and pressure. Reynolds numbers
were typically between 10 and 20, with entrance lengths to
establish laminar flow of 1–2 cm. The thickness and speed of
the liquid film were calculated as described previously24 to be
E100 mm and 3–4 cm s�1, respectively. The halogen gases
diluted in He were introduced into the reactor via a moveable
sliding injector.
The UCAM WWFT was similar to the Mainz equipment
described above. The cylindrical reactor had a larger internal
diameter (2.4 cm), and a slower speed (B0.2 cm s�1) and
smaller thickness (B25 mm) of the aqueous film. The pressure
in the flow tube was in the range 5–20 Torr and at the
temperature of 274 K, in order to minimise the water vapour
pressure. The total gas flow in the flow tube was between
800–1000 cm�3 (STP) min�1 resulting in linear velocities of
between 150–200 cm s�1. The relative humidity (RH) was
maintained at that of the saturated salt solution by maintain-
ing a flow of water saturated He. The gas is sampled into the
mass spectrometer (Extrel Merlin QMS) at the base of the flow
tube through an elevated sampling port. The mass spectro-
meter was operated with electron impact ionisation in these
experiments. The mass spectrometer has two-stage pumping
with ion deflection. HOI, ICl and IBr were measured as the
parent positive ions: m/z 144, 162 and 206, respectively.
The aqueous solutions studied were water, sea salt and sea
salt proxy solutions. These were prepared by the dissolution of
salts in pre-acidified, distilled water. The compositions are
summarised in Table 2. The pH 2 solutions were prepared by
addition of H2SO4 or HCl (no difference was observed in the
experimental results between the two acids). The pH 5.5
solution was prepared using a KHC8O4H4/KOH buffer, pH
7.5 using KH2PO4/KOH buffer. Solutions of pH 10 were
prepared using NaOH(aq). Other salt solutions had neutral pH.
HOI was prepared in situ via the reaction of O atoms
(generated in a microwave discharge) with C2H5I or C3H7I
in a flow of He at reduced pressure. HOI concentrations in the
range (6–80) � 1010 cm�3 were obtained in this way, but it
proved impossible to produce sufficient HOI for experiments
at pressures 476 Torr. The mass spectrometer signal for HOI
(m/z 144) was cross calibrated with the product species ICl
(m/z 162) and IBr (m/z 206) following reaction of HOI on a
solid salt surface containing both chloride and bromide.
Table 2 Summary of HOI, ICl and IBr uptake studies with wetted wall flow tube system
Reactant Temp/K
Film surface composition/M
g/10�3 Diffusion limited? Gas-phase products[Cl�] [Br�] pH
HOI 274 0 0 Unadjusted 2.0 � 0.2b Yb no2 0 2 2.2 � 0.6 Y ICl2 0.01 2 1.8 � 0.2 Y ICl,IBr2 0.01 Unadjusted 2.2 � 0.6 IBr2 0.1 2 2.2 � 0.2 Y IBr2 0.1 5.5a 2.2 � 0.2 IBr0 0.1 2 1.70 Y IBr
ICl(UCAMc) 274 0 0 Unadjusted 3.5 � 0.5b Yb no2 0.003 2 2.5 � 0.1 Y IBr
5.5a 2.6 � 0.2 IBr7.5a 2.6 � 0.1 IBr10 2.9 � 0.2 no
0 2 Unadjusted 2.6 Y IBr
ICl (MPI) 278 0 0 Unadjusted 0.66–2.0d Y —278 0 2 2 0.62–1.4d Y —293 0 0 Unadjusted 0.5–0.6d N —293 0 2 2 0.6–1.6d Y —
IBr(UCAMc) 274 0 0 Unadjusted 1.8 � 0.2b Nb no2 0.003 2 2.0 � 0.2 Y no
Unadjusted
a Buffered solution. b First order kinetics not observed; initial g at short exposure time given. c All UCAM ICl IBr uptakes at 13 Torr nominal
pressure. d Range of g values for different total pressure.
3138 | Phys. Chem. Chem. Phys., 2007, 9, 3136–3148 This journal is �c the Owner Societies 2007
Publ
ishe
d on
26
Apr
il 20
07. D
ownl
oade
d by
Uni
v de
Cas
tilla
-La
Man
cha
on 0
6/11
/201
3 09
:14:
54.
View Article Online
Molecular I2 is generated in the microwave source in addition
to HOI, and was taken up onto the salt surface. A small
constant amount of IBr from I2 reaction was accounted for in
calculating IBr yields from HOI. ICl and IBr in the WWFT
experiments were sampled from storage bulbs that were pre-
pared as follows. Following purification by repetitive free-
ze–pump–thaw cycles, known pressures of the gases were
mixed with an appropriate pressure of helium to give the
desired dilution. The mass spectrometer was calibrated for
ICl and IBr using accurately diluted mixtures of the halogens
in He.
2.2 Aerosol flow tube-chemical ionisation mass spectrometry
(CIMS) system
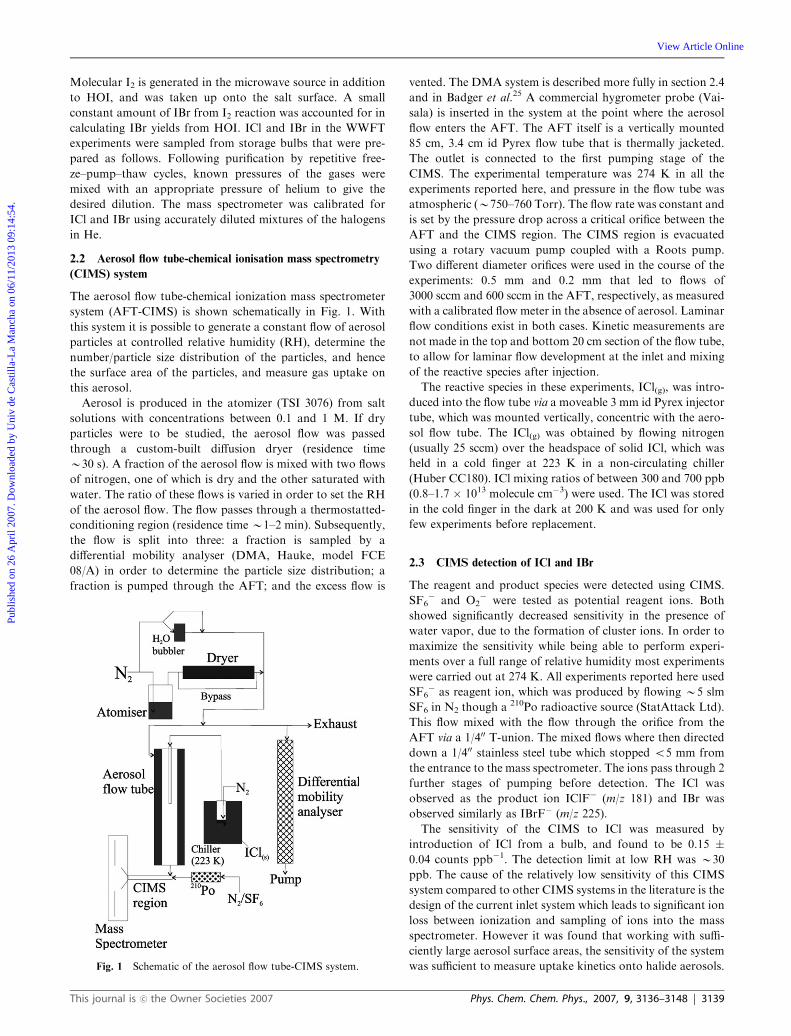
The aerosol flow tube-chemical ionization mass spectrometer
system (AFT-CIMS) is shown schematically in Fig. 1. With
this system it is possible to generate a constant flow of aerosol
particles at controlled relative humidity (RH), determine the
number/particle size distribution of the particles, and hence
the surface area of the particles, and measure gas uptake on
this aerosol.
Aerosol is produced in the atomizer (TSI 3076) from salt
solutions with concentrations between 0.1 and 1 M. If dry
particles were to be studied, the aerosol flow was passed
through a custom-built diffusion dryer (residence time
B30 s). A fraction of the aerosol flow is mixed with two flows
of nitrogen, one of which is dry and the other saturated with
water. The ratio of these flows is varied in order to set the RH
of the aerosol flow. The flow passes through a thermostatted-
conditioning region (residence time B1–2 min). Subsequently,
the flow is split into three: a fraction is sampled by a
differential mobility analyser (DMA, Hauke, model FCE
08/A) in order to determine the particle size distribution; a
fraction is pumped through the AFT; and the excess flow is
vented. The DMA system is described more fully in section 2.4
and in Badger et al.25 A commercial hygrometer probe (Vai-
sala) is inserted in the system at the point where the aerosol
flow enters the AFT. The AFT itself is a vertically mounted
85 cm, 3.4 cm id Pyrex flow tube that is thermally jacketed.
The outlet is connected to the first pumping stage of the
CIMS. The experimental temperature was 274 K in all the
experiments reported here, and pressure in the flow tube was
atmospheric (B750–760 Torr). The flow rate was constant and
is set by the pressure drop across a critical orifice between the
AFT and the CIMS region. The CIMS region is evacuated
using a rotary vacuum pump coupled with a Roots pump.
Two different diameter orifices were used in the course of the
experiments: 0.5 mm and 0.2 mm that led to flows of
3000 sccm and 600 sccm in the AFT, respectively, as measured
with a calibrated flow meter in the absence of aerosol. Laminar
flow conditions exist in both cases. Kinetic measurements are
not made in the top and bottom 20 cm section of the flow tube,
to allow for laminar flow development at the inlet and mixing
of the reactive species after injection.
The reactive species in these experiments, ICl(g), was intro-
duced into the flow tube via a moveable 3 mm id Pyrex injector
tube, which was mounted vertically, concentric with the aero-
sol flow tube. The ICl(g) was obtained by flowing nitrogen
(usually 25 sccm) over the headspace of solid ICl, which was
held in a cold finger at 223 K in a non-circulating chiller
(Huber CC180). ICl mixing ratios of between 300 and 700 ppb
(0.8–1.7 � 1013 molecule cm�3) were used. The ICl was stored
in the cold finger in the dark at 200 K and was used for only
few experiments before replacement.
2.3 CIMS detection of ICl and IBr
The reagent and product species were detected using CIMS.
SF6� and O2
� were tested as potential reagent ions. Both
showed significantly decreased sensitivity in the presence of
water vapor, due to the formation of cluster ions. In order to
maximize the sensitivity while being able to perform experi-
ments over a full range of relative humidity most experiments
were carried out at 274 K. All experiments reported here used
SF6� as reagent ion, which was produced by flowing B5 slm
SF6 in N2 though a 210Po radioactive source (StatAttack Ltd).
This flow mixed with the flow through the orifice from the
AFT via a 1/400 T-union. The mixed flows where then directed
down a 1/400 stainless steel tube which stopped o5 mm from
the entrance to the mass spectrometer. The ions pass through 2
further stages of pumping before detection. The ICl was
observed as the product ion IClF� (m/z 181) and IBr was
observed similarly as IBrF� (m/z 225).
The sensitivity of the CIMS to ICl was measured by
introduction of ICl from a bulb, and found to be 0.15 �0.04 counts ppb�1. The detection limit at low RH was B30
ppb. The cause of the relatively low sensitivity of this CIMS
system compared to other CIMS systems in the literature is the
design of the current inlet system which leads to significant ion
loss between ionization and sampling of ions into the mass
spectrometer. However it was found that working with suffi-
ciently large aerosol surface areas, the sensitivity of the system
was sufficient to measure uptake kinetics onto halide aerosols.Fig. 1 Schematic of the aerosol flow tube-CIMS system.
This journal is �c the Owner Societies 2007 Phys. Chem. Chem. Phys., 2007, 9, 3136–3148 | 3139
Publ
ishe
d on
26
Apr
il 20
07. D
ownl
oade
d by
Uni
v de
Cas
tilla
-La
Man
cha
on 0
6/11
/201
3 09
:14:
54.
View Article Online

2.4 Differential mobility analysis
During a single scan the DMA measures the aerodynamic
particle diameters in the range 20–1000 nm, measurements
being made at 35 size bins over a period of about 5 min;
between 2 and 4 scans are averaged to obtain the size
distribution during a kinetic run. In order to determine the
correct surface area for the aerosol at 274 K, the particle size
distribution was measured ‘‘dry’’ (RH o 5%, 295 K) in each
separate uptake experiment, and then corrected for the RH in
the flow tube, using data obtained from separate particle
growth studies made using a tandem-DMA set-up, described
in Badger et al.25 The measured deliquescence relative humid-
ity of sodium bromide aerosol was 50 � 3%, in agreement
with the literature.26 The aerosol made from Norwegian sea
water showed no deliquescent point in the tandem-DMA
experiment, with continuous growth over all relative humid-
ities, in agreement with the AFT-FTIR studies of Cziczo
et al.,27 which used a laboratory mixed artificial seawater.
Growth factors at RH = 85% were 1.85 and 2.15 for the
sodium bromide and sea salt aerosol, respectively. Although
no literature data is available for growth of sodium bromide
aerosol, the sea salt aerosol growth factor is in good agreement
with the only other study of sea salt particle growth found in
the literature.28
The integrated surface areas used for calculation of the
uptake coefficients were obtained from the measured size
distribution after correction for humidity change. In the
experiments reported here the aerosol surface areas were in
the range 1 � 10�4–8 � 10�3 cm2 cm�3, with the mean area-
weighted radius between 100 and 1000 nm.
3. Results
3.1 Wetted wall flow tube studies
3.1.1 Data analysis. HOI, ICl and IBr uptake onto sea-
water and seawater proxies were studied using the WWFT
systems at MPI and UCAM. The experimental pseudo-first
order loss coefficient of a trace gas, kw, is calculated from the
variation of signal with injector position (eqn (2))
½C�z2 ¼ ½C�z1 exp �kwDzn
� �ð2Þ
where [C]z1,2 are the trace gas concentrations at injection
positions z1 and z2, Dz = z2 � z1, n is the gas flow velocity
in the tube. The overall experimental uptake coefficient gmeas
of gas molecules from the gas-phase into a liquid can be
considered in terms of a sequence of resistances, including
gas-phase diffusion to the interface gdiff, the mass accommoda-
tion coefficient a, liquid phase reaction grxn, and/or solvationgsol of the trace gas:
1
gmeas
¼ 1
gdiffþ 1
aþ 1
gsol þ grxnð3Þ
When one of the parameters becomes rate limiting the expres-
sion can be simplified. In the case of most of the WWFT
experiments reported here, analysis shows that the uptake
coefficients are diffusion limited, i.e. transport of the trace
gas to the liquid surface was limiting and thus 1/gmeas =
1/gdiff + 1/a. Correcting for the geometry of the cylinder gdiff isgiven by:
gdiff �3:66ð2DgÞ
�crð4Þ
where Dg is the overall pressure dependant gas phase diffusion
coefficient, and n is the mean thermal velocity. The factor 3.66
is valid when axial diffusion can be neglected. This is the case
in these experiments, which were characterized by Peclet
numbers29 of E40. The measured uptake coefficient, gmeas is
obtained directly from kw:
gmeas ¼2rkw
�cð5Þ
If loss rates of a trace gas to the aqueous surface are rapid and
irreversible, by re-arranging eqns (3) and (4), it can be shown
that for diffusion limited uptake:
1
gmeas
¼ 1
aþ �cr
7:32DTOTð6Þ
where
1
DTOT¼ pH2O
DH2Oþ pHe
DHeð7Þ
3.1.2 Uptake of HOI. The uptake of HOI (5–50 � 1010
molecules cm�3) to various surfaces was studied in the WWFT
at UCAM. Several combinations of dissolved concentrations
of Cl� and Br� in solutions of different pH were used. Uptake
on pure water films was also measured. Experiments were all
conducted at 274 K and at flow tube total pressures of 13 and
20 Torr. A typical result (uptake onto 2 M NaCl, 0.01 M
NaBr, pH 2 solution, P = 13.1 Torr) is shown in Fig. 2 that
Fig. 2 Calibrated mass spectrometer traces showing the removal of
HOI (black), the formation and uptake of ICl (dotted), and the
formation of IBr (grey) at different exposure lengths to aqueous film
(2 M NaCl, 1 � 10�2 M NaBr, pH = 2). Numbers show length of film
exposed in cm. Temperature = 274 K; pressure = 13 Torr; gas flow
speed = 176 cm s�1.
3140 | Phys. Chem. Chem. Phys., 2007, 9, 3136–3148 This journal is �c the Owner Societies 2007
Publ
ishe
d on
26
Apr
il 20
07. D
ownl
oade
d by
Uni
v de
Cas
tilla
-La
Man
cha
on 0
6/11
/201
3 09
:14:
54.
View Article Online

displays injector position dependent HOI signals (black trace),
which decrease with contact time. There is a concurrent
increase in IBr signal (dashed trace). The ICl signal (dotted
trace) shows a transient increase at short exposure time and
decreases at longer exposure.
Fig. 3 shows a plot of the decay in [HOI] data shown in Fig.
2 according to eqn (2), with reaction time calculated using the
mean flow speed of 175 cm s�1. The plot is linear over most of
the exposure length (i.e. first order uptake kinetics), except in
the initial section of B4 cm where mixing of the gas stream
from the sliding injector is incomplete. The first order rate
coefficient was calculated from the slope of the linear portion
of the plots and uptake coefficients were calculated from
eqn (5).
The measured HOI uptake coefficients, gmeas, are summar-
ized in Table 2. The values given are the mean of several
determinations for each set of conditions. The uptake coeffi-
cient values are close to g = 2.2 � 10�3, independent of
composition or pH of the solution, except for pure water or
very low electrolyte concentration. This suggests that uptake is
diffusion limited in all cases, and this was confirmed by
calculations of gmeas using eqns (6) and (7) and HOI diffusion
coefficients of DH2OHOI = 36.8 cm2 s�1 Torr�1, and DHOI
He =
318.2 cm2 s�1 Torr�1 at 274 K, obtained by extrapolation
from the data of Holmes et al.14 There was no significant
difference between the g values at the two total pressures used,
reflecting the dominant influence of H2O partial pressure on
the diffusion coefficient, and hence on the diffusion limited
uptake rate. The uptake rate coefficient on pure water at
extended exposure times declined, giving non-first order decay,
indicative of surface saturation. These results do not allow
determination of the accommodation coefficient for HOI,
aHOI; only a lower limit of aHOI 4 2.2 � 10�3 can be deduced.
3.1.3 Uptake of ICl. The WWFT experiments at the MPI
were conducted using ICl concentrations in the range 1–5 �1013 molecule cm�3 and mostly using a 2 M bromide solution
that had been acidified to pH 2 using H2SO4. Under these
conditions, reaction at the surface is very rapid, and the
uptake is diffusion limited. The MS signal of ICl was mon-
itored at m/z= 162, and the evolution of this signal at various
injector positions for a given set of conditions was recorded. In
some datasets it was necessary to make a small correction for a
drift in the ICl flow rate over the course of taking the data.
This correction was generally less than 5%.
The pseudo-first order loss coefficient, kw was calculated
from the injector position dependent signals of ICl as de-
scribed by eqn (2) and plotted in Fig. 4. The ICl decay is
strictly exponential over more than two orders of magnitude
change in signal, indicating complete irreversibility of the
uptake process.
The slopes of each dataset (kw) are converted to an uptake
coefficient, gmeas via eqn (5) using temperature dependent
values of �c of 19 070 cm s�1 and 19 575 cm s�1 at 278 and
293 K, respectively. The statistical errors on the slopes are
generally less than 1%. The overall error will be larger, and
associated with corrections to the raw data for drifts in the ICl
signal or mass spectrometer sensitivity (see above).
The values of gmeas thus obtained lay in the range 6–16 �10�4, and showed a strong dependence on the experimental
pressure. Assuming that gas-phase diffusion limits the uptake
of ICl in these experiments, and recognising that at 278 and
(especially) at 293 K a significant fraction of the total pressure
in the reactor is due to water, we combine eqns (6) and (7) to
derive:
1
g¼ 1
aþ �crpH2O
7:32DH2Oþ �cr
7:32DHePHe ð8Þ
Thus, a plot of inverse g versus the pressure of He should give a
straight line with the slope proportional to the diffusion
coefficient of ICl in He, with the x-axis intercept containing
information about the accommodation coefficient, a, and the
Fig. 3 First order plot of decay of HOI exposed to 2 M NaCl, 1 �10�2 M NaBr, pH = 2 (data from Fig. 2). Line obtained by least
squares regression analysis; slope gives kI = 33.6 s�1.
Fig. 4 Reaction of ICl with 2 M NaBr solution: pseudo-first order
decay of ICl at 278 K and 3 different pressures. Statistical errors
(obtained by least squares fitting to recorded MS data) are smaller
than the data symbols.
This journal is �c the Owner Societies 2007 Phys. Chem. Chem. Phys., 2007, 9, 3136–3148 | 3141
Publ
ishe
d on
26
Apr
il 20
07. D
ownl
oade
d by
Uni
v de
Cas
tilla
-La
Man
cha
on 0
6/11
/201
3 09
:14:
54.
View Article Online

diffusion coefficient of ICl in water vapour. The data is plotted
according to eqn (8) for the two experimental temperatures in
Fig. 5. The vertical error bars take into account the effects of
raw data corrections (see above).
Least squares fitting to the data in Fig. 5 yield slopes of (6.99
� 0.46) Torr�1 and (7.03 � 0.36) Torr�1 at 278 and 293 K,
respectively. Using eqn (8) and the values of �c presented above,
we derive diffusion coefficients of ICl in He of DIClHe (278 K) =
(289 � 19) cm2 s�1 Torr and DIClHe (293 K) = (296 � 15) cm2
s�1 Torr. The errors are statistical only and do not include
systematic error in the value of �c which was derived from the
Bolzmann equation. The value of DIClHe at 278 K is in excellent
agreement with the calculation of Mossinger et al.13 who
derived DIClHe (278 K) = (288 � 32) cm2 s�1 Torr in He, and
also a value of DIClH2O
(278 K) = (57 � 6) cm2 s�1 Torr in H2O.
Having established some confidence in the diffusion coeffi-
cients of ICl, we turn to the intercept values (486 � 70) and
(250� 60) derived by least squares fitting to data in Fig. 5. The
large difference between the intercepts at 293 and 278 K is
caused by the difference in the water vapour saturation
pressure at these temperatures, which are 17.5 and 6.55 Torr,
respectively. Taking the calculated value of the diffusion
coefficient of ICl in water vapour at 278 K, and using eqn
(8), we can derive a value of the accommodation coefficient, a,of 0.05. We note that this value is derived from the difference
of two large numbers, and has large, asymmetric errors
associated with it. By considering only statistical errors in
the size of the intercept, the value of a derived could be as large
as 1, or as small as 0.01. This is further compounded by errors
in the diffusion coefficient of ICl in water vapour, which also
impact on a. This is illustrated in Fig. 6, which shows the
dependence of a on the value of the intercept obtained from
plots of inverse g versus pressure and on the diffusion coeffi-
cient of ICl in water vapour.
The vertical lines in Fig. 6 are placed at values of
DH2OICl(278 K) = 57 and 70 cm2 s�1 Torr, the latter being
somewhat greater than the upper bound of the calculated
value of (57 � 6) cm2 s�1 Torr. The plot clearly shows that
the experimental determination of a is subject to considerable
uncertainty, with a range of E0.01 to 1 if DH2OICl(278 K) =
57 cm2 s�1 Torr and a range of 0.009 to 1 if DH2OICl(278 K) =
70 cm2 s�1 Torr. For this reason, we choose to ascribe a value
of a = 0.01, which may be regarded as a lower limit. The
equivalent calculation for the data at 293 K shows that the
offset (486 � 70) can be completely accounted for by diffusion
of ICl through water vapour, removing any experimental
sensitivity to the accommodation coefficient at this tempera-
ture.
A series of experiments were also conducted on ICl uptake
to pure H2O. At 293 K, uptake coefficients obtained were
significantly lower than for the bromide solutions described
above (between 5–6 � 10�4), and also showed significantly
more scatter and no obvious trend with pressure. This can be
interpreted as saturation of the surface layers of the liquid film,
resulting either from insufficient solubility of ICl or decrease
chemical reactivity of solvated ICl in the film. Experiments in
which modulation of the film thickness by variation of the
liquid flow rate was carried out confirmed this, as dissolved ICl
degassed from the thinner film.
In these experiments, g will depend on the film thickness and
speed and also on the gas phase concentration of ICl, which
together probably account for the observed scatter in the data.
At 278 K, the uptake coefficients measured using pure H2O
were slightly lower than those measured using bromide solu-
tions (Table 2), suggesting that, at this temperature, the
solubility of ICl is sufficiently high that the uptake is quasi-
irreversible. The uptake coefficients to H2O at 278 K also
displayed a very similar dependence on pressure as uptake to
the bromide solutions at this temperature, and resulted in a
similar intercept on the plot of inverse g versus He pressure.
This implies that the accommodation coefficient on pure water
is similar to that on the bromide-containing surface, which
Fig. 5 Pressure dependence of the measured uptake coefficient of ICl
on 2 M NaBr solution at 278 and 293 K.Fig. 6 Dependence of a on the diffusion coeffcient of ICl in water
vapour at 278 K. The solid lines labelled 190, 250 and 310 represent
the central and extreme values (250 � 60) for the intercept obtained
in Fig. 5.
3142 | Phys. Chem. Chem. Phys., 2007, 9, 3136–3148 This journal is �c the Owner Societies 2007
Publ
ishe
d on
26
Apr
il 20
07. D
ownl
oade
d by
Uni
v de
Cas
tilla
-La
Man
cha
on 0
6/11
/201
3 09
:14:
54.
View Article Online

may be expected given the relative concentrations of H2O and
Br� ions at the surface.
During experiments to examine the uptake of ICl to the 2 M
bromide surfaces, the mass spectrometer also took data at
m/z=206, a parent ion of IBr, which was expected as aqueous
phase product. A small signal of IBr, less than 5% that of ICl,
was always observed but showed no dependence on the
contact time. A likely explanation for the lack of observation
of the expected product is that IBr has a sufficiently high
solubility to prevent its escape from the aqueous film in
amounts enough to be detected in the gas-phase. Indeed, the
occasional observation of IBr as product was observed to
coincide with the undesired breaking and drying of the flowing
liquid film.
The uptake of ICl and IBr was also measured in the WWFT
system at University of Cambridge on pure water and on
seawater mimic (2.0 M Cl� and 0.003 M Br�) solutions at
274 K and 13 Torr total pressure. The uptake of ICl was also
measured on 2.0 M Br� solutions. The concentrations of ICl
and IBr used in these WWFT uptake experiments were in the
range 0.4–7.0 � 1011 and 0.2–1.0 � 1012 molecules cm�3,
respectively. The ICl concentrations were thus some 2 orders
of magnitude lower than in the MPI experiments. These results
are also summarized in Table 2.
The rate of uptake and thus the measured uptake coefficient
of ICl into the salt solutions was first order in [ICl], was
independent of solution pH, and was diffusion limited, with a
lower limit of approximately gmeas 4 3 � 10�3. The results for
ICl uptake were in agreement within experimental error with
the results from MPI, when corrections for the different
pressures and flow tube dimensions used in the two systems
were taken into account. Only a limited number of studies of
the uptake of IBr onto aqueous solutions were performed. The
uptake was diffusion limited and the measured uptake coeffi-
cient for IBr into seawater mimic (2.0 M Cl� and 0.003 M Br�)
was g = 2.0 � 0.2 � 10�3.
In the Cambridge apparatus the uptake of ICl and IBr onto
pure H2O showed significant departure from exponential
decay, with a decline in apparent kw (and hence in gmeas) with
exposure length. The gmeas for ICl at short exposure length was
similar to that on halide solutions, was independent of [ICl],
and was gas phase diffusion limited. The gmeas for IBr at short
exposure length was substantially lower than the gas phase
diffusion limit. Moreover, on exposure to a fresh surface, the
uptake rate of IBr was time dependent, the initial larger
uptake declining to the lower steady state rate, which was
used to calculate kw and the cited values of g. The observationof a time-dependent uptake rate coefficient strongly suggests
saturation of the surface layer due to limited solubility or
reduced rate of hydrolysis of ICl and IBr in the film. However,
analysis of the data according to the resistance model for
liquid diffusion-limited solubility or reaction did not repro-
duce the time dependence of the uptake coefficient. This may
be due to turbulent mixing in the film, reducing saturation at
low doses.
3.1.4 Product release from halide films. Product release
studies were conducted in the University of Cambridge
WWFT system, where the slower flow and reduced thickness
of the aqueous film provided conditions favourable for the
transfer of the volatile products from the liquid to the gas
phase. In both the HOI and ICl uptake experiments, gas phase
products were observed. However IBr uptake resulted in no
observable gas phase products. For HOI, the gas-phase pro-
ducts released were dependent on the surface composition. In
the case of a sea-salt proxy solution (2 M Cl� 1 � 10�2 M Br�,
pH 2) the major product was IBr with yields of up toB20% of
HOI reacted. As noted above, ICl was observed but shows a
transient increase at short exposure time and decreases at
longer exposure to a value below that when the HOI is not
exposed to the film. We believe this is due to ICl production
from reaction of HOI with solid NaCl on the walls of the
sample manifold downstream from the experimental region,
which declines when [HOI] is reduced by exposure to the
upstream film. The initial transient ICl increase may result
from evaporation of product ICl at short exposure lengths,
due to slow liquid phase reaction at these low [Br�]. Uptake of
HOI into 2 M NaCl solution led to small yields of gas phase
ICl but no IBr.
IBr yields were measured for uptake of HOI into 2 M Cl�/
1 � 10�2 M Br� salt solution as a function of pH. The IBr yield
decreased from 12 to 8% (error: �3%) when pH was changed
from 2 to 5.5. Nevertheless the decrease is barely significant
within the errors, which result from variabilty in measured
values and uncertainty in absolute calibration. There was also
an increase ofB50% in the yield of IBr released as the bromide
was increased from 0.01 to 0.1 M, with a fall in the yield of ICl.
This observation supports the mechanism in which the relative
amounts of ICl and IBr which are formed whenHOI is taken up
depends on the extent to which the sea salt aerosol is depleted in
bromide. However because the release of dihalogens to the gas
phase was non-quantitative, relative reactivity with Br� and Cl�
could not be determined.
The uptake of ICl on salt solutions containing bromide at
pH o 7, resulted in the production of IBr. The yield of gas
phase IBr (per ICl molecule taken up) was found to be
10–20% for a solution of pH 2, 2 M Cl�, 1 � 10�3 M Br�.
This is the same within error as the yield of IBr following
uptake of HOI onto films of similar halide concentration and
pH. Solutions in the pH range 2–10 were used in the ICl
product study, shown in Fig. 7. Under constant conditions
(e.g. constant film speed and salinity) the yield of IBr relative
to the amount of ICl taken up, decreased from 0.18 to 0 as the
pH of the solution increased from 2 to 10.
As noted above, the amount of gas phase IBr observed in
both the HOI and ICl WWFT uptake experiments was much
less than the molar equivalent of HOI or ICl lost. The yield
was also shown to decrease as a function of film thickness,
suggesting that some ICl and IBr may be lost by diffusion and
flow out in the bulk liquid phase. This is consistent with the
observation in this and other studies that dihalogens are taken
up into mobile aqueous films. In the studies of the uptake of
IBr onto aqueous solutions no gas phase products were
observed, in agreement with other studies on solid films.13
The observed rapid uptake of IBr and ICl on pure water is
consistent with larger partitioning into the aqueous phase
compared to BrCl, Br2 and Cl2, reflecting their higher solubi-
lities.30
This journal is �c the Owner Societies 2007 Phys. Chem. Chem. Phys., 2007, 9, 3136–3148 | 3143
Publ
ishe
d on
26
Apr
il 20
07. D
ownl
oade
d by
Uni
v de
Cas
tilla
-La
Man
cha
on 0
6/11
/201
3 09
:14:
54.
View Article Online

3.2 ICl uptake using the AFT-CIMS
The uptake of ICl onto sodium bromide, sodium chloride and
sea salt aerosol was studied with the AFT-CIMS system. The
majority of the work focused on the uptake of ICl onto
sodium bromide; however some experiments were performed
with aerosols generated from sea salt and sodium chloride.
The ICl reactant concentration was measured at the end of the
flow tube for a range of reaction zone lengths corresponding to
reaction time, t, and the first order rate coefficient, k, was
determined from plots of ln[ICl] vs. t. In each case the decay of
[ICl] was measured in the presence and absence of aerosol. The
first order loss rate coefficients were corrected for diffusion and
wall losses under non-plug flow conditions, using the method
of Brown.31 In the corrections the gas-phase diffusion coeffi-
cient, Dg, for ICl was assumed to be 0.150 cm2 s�1 as
calculated by extrapolation of the WWFT experimental va-
lues. The correction procedure resulted in values between 1
and 60% higher than the observed inputs. The corrected first
order rate coefficient, kI, was then used to determine the
uptake coefficient, g, using the aerosol surface area, Sa, and
eqn (9) (see below). The uptake coefficients determined in this
way are given in Table 3.
The rate equation for a heterogeneous reaction in a cylind-
rical flow tube is:
d½X�dt¼ kI½X� where kI ¼ goSa
4ð½X� ¼ ½ICl�Þ ð9Þ
where g is the uptake coefficient, o is the average molecular
speed, Sa is the surface area of the aerosol per unit gas volume.
This equation assumes a monodisperse aerosol of particles
small enough so that gas phase diffusion does not limit the rate
of uptake. The size-averaged values of g obtained from eqn (9)
are representative of the effective radius, i.e. g = g(rs). Theeffective radius is given by rs = 3 Va/Sa where Va is the volume
of the aerosol per unit volume.
However, for polydisperse aerosols such as those used in
this study, the uptake rate coefficient is an average value over
the whole distribution of particles radius ri, i.e.
k1 ¼X
kðriÞ ¼Xi
gðriÞoNipr2i1þ gðriÞ 0:75þ0:283Kni
KniðKniþ1Þ
� � ð10Þ
This equation takes into account the gas phase diffusion
limitation for large particles in the term containing the Knud-
sen number (Kni = 3Dg/ori), as discussed by Fuchs and
Sutugin32 and Fried et al.33 It also specifies a size dependence
of the uptake coefficient g(ri), arising, for example, from slow
chemical processing in small particles, as discussed by Hanson
et al.34
For the case of a size-independent uptake coefficient, we
found that the value of g(rs), derived by iterative solution of
eqn (10), using the data from the DMA to calculate Ni and
using Dg (ICl/N2) = 0.015 cm2 s�1, differs from the value of gobtained using eqn (9) and the total surface area, Sa, byo1%.
We conclude that the particle radii and uptake coefficients are
too small for gas phase diffusion limitations to be significant.
The possible size dependence of the values of g (rs) calculatedusing eqn (9) is discussed further below.
If the uptake process is driven by the reaction in solution of
the ICl to form IBr, as the results suggest, then this analysis is
only valid when initial [Br�(aq)] c D[ICl(g)]. (each in molecules
cm�3). The amounts of Br� present in the aerosol were
estimated using thermodynamic data from the literature for
sodium bromide,35,36 and the measured aerosol volumes. It
was found that for relative humidities 10–70%, the total
[Br�(aq)] per unit volume of gas was B(2 � 1) � 1014 molecules,
i.e. [10 � D[ICl(g)]. Thus the sodium bromide aerosol data
fulfilled the criteria for pseudo-first order kinetics.
The bromide content of sea salt aerosol is much lower and
thus failure of the strictly first order conditions was likely.
Using data for RH dependence of [Cl�] for NaCl aerosol from
the AIM database,37,38 and a fixed Cl/Br molar ratio of 635, it
was estimated that total aerosol [Br] was less than the average
amount of ICl reacted on the aerosol. In some decays there
was indication of a decline in decay rate with time. However
most of the time decay was close to the wall loss, and the
Fig. 7 Left: IBr produced from ICl uptake as a function of solution
pH. Fractional yields of IBr per ICl molecule taken up are 0.18, 0.11,
0.02 and 0 for pH 2, 5.5, 7 and 10 respectively.
Table 3 Summary of ICl uptake onto aerosols
RH (%) [Br�]/M dmean/nm g N Product
NaBr10 432 750–2000 0.020 � 0.005 3 IBr30 28 690–2000 0.010 � 0.005 3 IBr45 20.1 370–410 0.010 � 0.007 3 IBr63 12.8 480 0.020 � 0.01 163 12.8 (pH 2) 1760 0.006 � 0.004 1 IBr63 12.8 (pH 10) 97 o1 � 10�4 1 no70 10.1 380 0.010 � 0.002 1 IBr
Sea salt5 430 217 1 � 10�4 6 no30 18 310 3 � 10�4 3 no55 10.2 375 5 � 10�4 1 no87 3 479 1 � 10�3 1 no
NaCl30 0 o1 � 10�4 1 no
N = number of experiments.
3144 | Phys. Chem. Chem. Phys., 2007, 9, 3136–3148 This journal is �c the Owner Societies 2007
Publ
ishe
d on
26
Apr
il 20
07. D
ownl
oade
d by
Uni
v de
Cas
tilla
-La
Man
cha
on 0
6/11
/201
3 09
:14:
54.
View Article Online

scatter in the data made it difficult to detect non-exponential
decay. Thus measured uptake could not be reliably attributed
to the Br� present in the sea salt aerosol.
3.2.1 Uptake of ICl on sodium bromide. Fig. 8 shows a plot
of ln([ICl]/[ICl]o) as a function of time of exposure to the
aerosol, obtained with different average total surface area
concentrations of aqueous sodium bromide aerosol at 44%
relative humidity and with initial [ICl] = 8 � 1012 molecule
cm�3. The decay due to wall loss, measured in the absence of
aerosol is also shown. The uptake onto the aerosol is sub-
stantially faster than wall loss. The relatively large error bars
on the time axis result from the fluctuation in the flow rate
arising from aerosol deposition in the orifice at the exit of the
flow tube. The corrected first-order rate coefficients, kIcorr, are
plotted as a function of surface area concentration in Fig. 9.
The error bars represent uncertainty in both the aerosol sur-
face area and the corrected kIcorr on the x- and y-axes,
respectively. The uptake rates are clearly proportional to
aerosol surface area.
Uptake coefficients for ICl onto aerosols made from neutral
aqueous sodium bromide and also pH-adjusted solutions are
shown as a function of RH in Fig. 10. For the neutral
solutions it can be seen that the uptake coefficient is invariant
with RH over the range studied within the experimental error.
The average uptake coefficient of the results is 0.018 � 0.004.
For acidic aerosol (pH 2), a barely significant reduction of the
uptake coefficient was observed (grey square, Fig. 10), but
experiments using pH 10 aerosols showed very low ICl uptake,
close to the limit of detection, with g B 1 � 10�4. The uptake
coefficient for ICl uptake onto effloresced sodium bromide
aerosol was significantly lower than deliquesced sodium bro-
mide aerosol, g= (6� 4)� 10�3 (RH= 5%). However due to
the limited availability of NaBr on the surface of the aerosol
particles it is likely that in these experiments the conditions are
not under pseudo-first order conditions with respect to the
ICl : Br� ratio. These results for dry aerosols are consistent
with those of Mossinger and Cox,13 who measured an uptake
coefficient to a fresh sodium bromide powder surface at 11%
RH of g = 0.030, which decreased, as the surface was aged, to
B8 � 10�3.
Upon uptake of ICl, IBr is released into the gas phase in the
cases of the neutral, acidified and solid sodium bromide
aerosols. This result is similar to the observations made in
the WWFT study reported in this work. The production of IBr
is directly proportional to the uptake of ICl, (Fig. 11), except
for a delay at small extent of reaction. The average yield is
0.6 � 0.3, i.e. substantially higher than from uptake onto the
bulk film. The large error bars are due to the scatter in the data
and the uncertainties associated with the IBr and ICl calibra-
tions. No IBr release was observed for alkaline (pH 10) aero-
sols. This could be attributed to a change in mechanism in the
basic solution. IO� can be formed from the reaction sequence:
IClþH2O$ HOIþ Cl� þHþ ðR12Þ
HOI$ H þ þ IO� ðR13Þ
Iodate can then be formed from the disproportionation of HOI,
competing with the formation of IBr. Disproportionation of
HOI to iodate and iodide at high pH has been studied both
experimentally and theoretically.39–41 The overall reaction can
be given by
3HOI! IO�3 þ 2I� þ 3Hþ ðR14Þ
Below pH 5 the disproportionation is not thermodynami-
cally favoured.
3.2.2 Uptake of ICl onto sea salt aerosol. In experiments
with sea salt aerosol, much smaller uptakes than those seen
with sodium bromide were observed. In many cases the uptake
Fig. 8 First order plot of ln ([ICl/IClo) as a function of time. (RH =
44%, 600 ppb ICl, T = 274 K). Wall loss ’; NaBr aerosol surface
areas (10�3 cm2 cm�3): K 0.7; J 1.0; m 1.3; n 1.6; & 4.7.
Fig. 9 Corrected first order rate coefficient kI as a function of aerosol
surface area for ICl uptake onto sodium bromide aerosol at 274 K.
Solid line is a least squares fit to the data forced through the origin.
This journal is �c the Owner Societies 2007 Phys. Chem. Chem. Phys., 2007, 9, 3136–3148 | 3145
Publ
ishe
d on
26
Apr
il 20
07. D
ownl
oade
d by
Uni
v de
Cas
tilla
-La
Man
cha
on 0
6/11
/201
3 09
:14:
54.
View Article Online

rate onto aerosol was not significantly higher than the wall
loss. Uptake coefficients obtained from experiments in which
the aerosol uptake was larger than the wall loss are shown in
Table 3 and Fig. 10. Since these values were measured in
reactant-limited experimental conditions the uptake coeffi-
cients may not be solely attributable to reaction with Br�.
However it can be seen that uptake is an order of magnitude
slower than on NaBr and there is a distinct decline of g with
decreasing RH. This suggests that chemical reaction in the
particles is controlling the uptake rate. Only very small
increases in the IBr signals were observed during uptake,
generally just above the level observed normally in baseline
signal drift. This was consistent with the small amount of Br�
present in the aerosol. When aerosols of pure sodium chloride
were present ICl decay was not significantly higher than wall
loss, with g o 1 � 10�4.
4. Discussion
Uptake of HOI
The uptake of HOI into aqueous solutions is clearly rapid. The
rate of uptake onto the bulk films of halide salts and pure
water was diffusion limited. There was some indication of
surface saturation on pure water as the uptake rate declined
after long exposure to high [HOI]. Experimental constraints
did not allow measurements of uptake of HOI as a function of
pressure (to characterise the diffusion loss rate), or onto
aerosols, and so the results obtained here do not allow
determination of the accommodation coefficient or reactive
uptake coefficient for HOI, and set a lower limit of a c 3 �10�3, the diffusion limited uptake coefficient. A lower limit of
a = 0.3 for HOI on aqueous sulfuric surfaces was reported by
Holmes et al.,14 and Wachsmuth et al.42 report a = 0.6 for
HOBr on aqueous NaBr aerosols. Thus it is highly likely that
the accommodation coefficient of HOI on aqueous surfaces is
40.3 at ambient temperatures. Following uptake into halide
salt solutions, HOI reacts with Cl� or Br� to form ICl or IBr.
Although the rate constant for reaction of HOI with Br� is
faster than with Cl� by a factor of 114; 43,44 ICl is expected to
be the major initial aqueous phase product in fresh sea salt
aerosol. However even when quite small amounts of Br� are
present, ICl is converted in solution to IBr, which is the main
gas-phase product observed. Under the conditions of the
WWFT experiments the yield of IBr relative to the amount
of HOI taken up is onlyB20%; it is probable that the balance
remains in solution and is removed in the flowing aqueous
film. This yield contrasts to that observed with the reactive
uptake of HOBr, investigated under similar conditions in a
WWFT, where the total yield of gas-phase Br2 or BrCl
products is stoichiometric, reflecting the lower solubility of
these dihalogens.15
Uptake of ICl
Measurements of ICl uptake onto aqueous film sea salt
proxies, as well as onto pure water, show that ICl has quite
Fig. 10 Uptake coefficients as a function of relative humidity for sodium bromide (neutral: black squares, pH 2: open square, pH 10: filled
square), sea salt (J) and solid sodium bromide (B) and sodium chloride (n) aerosol.
Fig. 11 IBr production: upper panel: ppm IBr produced as a function
of ppm ICl taken up; lower panel: fractional yield of IBr per ICl taken
up as a function of aerosol solution pH.
3146 | Phys. Chem. Chem. Phys., 2007, 9, 3136–3148 This journal is �c the Owner Societies 2007
Publ
ishe
d on
26
Apr
il 20
07. D
ownl
oade
d by
Uni
v de
Cas
tilla
-La
Man
cha
on 0
6/11
/201
3 09
:14:
54.
View Article Online
high solubility and reacts with Br�. The uptake rate is gas-
phase diffusion limited and the diffusion coefficients and
accommodation coefficient have been determined from the
pressure dependence of the uptake coefficients. An accommo-
dation coefficient of B0.05 has been obtained, with a large
uncertainty covering the range 0.01–1.0, arising from the
uncertainty in the values of Dg. The uptake of ICl on solutions
containing Br� led to gas-phase IBr with a similar yield to that
from HOI uptake on films with the same composition, the
amounts released being limited by mass transfer into the bulk.
Uptake of ICl into Br-containing aerosols was also studied
with a view to avoiding the diffusion and solubility limitations.
In the AFT-CIMS experiment the mean uptake coefficient of
ICl onto deliquescent particles of sodium bromide was g =
0.018� 0.004, invariant with relative humidity between 10 and
70%. IBr was released to the gas phase with a yield of 0.6� 0.3
per molecule ICl reacted, although taking account of the
uncertainty of the calibrations and the experimental error,
the yield could in reality be close to unity.
Since the concentration of Br� in the bulk aqueous phase
changes by approx. a factor of 3 over the RH range (see Table
3), the constant value for g suggests that uptake is accommoda-
tion controlled, as opposed to chemically controlled. The
measured value of g = 0.018 is consistent with the range
suggested for the accommodation coefficient for ICl uptake
based on the WWFT experiments (0.01–1.0), although lower
than the best estimate from the analysis of aICl = 0.05. There-
fore chemical resistance cannot be ruled out. Using the above
values of g and a and assumed values ofH(ICl) = 110 M atm�1
45 and DICll = 0.5 � 10�5 cm2 s�1 at 274 K, in eqn (11):
1
g¼ 1
aþ c
4RTHðDlkhetÞ0:5ð11Þ
a lower limit value of khet can be derived. The results give
khet B 600 s�1 and the corresponding reacto-diffusive length
(=O(Dl/khet)) of 1080 nm; this is larger than the typical aerosol
particle radius, and should have resulted in size dependent
uptake coefficients. There was no significant correlation
between the aerosol size and measured g values for the NaBr
aerosol and it is therefore concluded that khet c 600 s�1 and
uptake was accommodation controlled. Therefore g = a =
0.018 � 0.004.
The much lower uptake coefficients observed for the sea salt
aerosol can be attributed to reduced rate of chemical reaction
of ICl in the aerosol because of the much lower [Br�]. The
concentration of Br� initially present in the aerosol, was
calculated assuming a constant [Br]/[Cl] ratio of 1.55 � 10�3,
and using [Cl�] values at a given RH from the AIM thermo-
dynamic database. These values are given in Table 3. The
average [Br�] present will be at least a factor of 2 lower due to
depletion by reaction with ICl taken up. The uptake coeffi-
cients show a distinct increase with particle size (V/S) indicat-
ing volume limited uptake kinetics. Rate constants for liquid
phase reaction were derived from the measured g values usingthe appropriate form of the resistance model equation, to-
gether with a = 0.018:
1
g¼ 1
aþ c
4RTHðV=SÞkhetð12Þ
The values of khet increased from 55 to 250 s�1 over the
RH range 5–87%, whilst the [Br�] showed the opposite
trend. Clearly the uptake of ICl in these experiments was not
controlled by Br� reaction, as expected, since the total amount
of Br� in the aerosol was less than the ICl reacted. The chemistry
leading to slow ICl uptake into these aged sea salt particles is
unknown. Solubility is insufficient to account for loss of ICl to
the particles.
Mechanism of the reaction
The results from this study confirm suggestion that HOI can
lead to production of dihalogens from neutral or acidic halide
solutions, following its reaction with Cl� or Br�, in the same
manner as has been found for HOBr. They also show that
production of IBr is favoured over ICl, such that IBr is the
predominant product even at [Br]/[Cl] o 10�3. The higher
solubility of ICl and IBr,43 compared to Cl2, Br2 and BrCl,
led to retention of these products in the bulk film of the WWFT
experiments, and did not allow quantitative measurements of
the relative rates of ICl and IBr production in solution. In
particular, ICl release from the films could only be observed at
short exposure times. However the results for the uptake of ICl
on aerosols showed that IBr is rapidly produced from ICl in Br-
containing solution, and is efficiently released to the gas phase.
Since HOI reacts with Cl� to form ICl it can act as a catalyst for
activation of Br from sea-salt aerosols, via the reactions:
HOIaq þ Cl�aq þHþaq ! IClaq þH2Ol ðR7Þ
IClaq þ Br�aq ! IBraq þ Cl�aq ðR10Þ
IBrþ hn ! Brþ I ðR11Þ
IþO3 ! IOþO2 ðR4Þ
IOþHO2 ! HOIþO2 ðR1Þ
It is worth briefly considering the atmospheric implications of
these results. From the experiments presented here and else-
where, it is possible to calculate an uptake coefficient for HOI
onto seawater using the resistance model equations. On small
particles it will be accommodation controlled with a B 0.3; on
particles 43 mm uptake will be gas phase diffusion controlled
(g B 0.1). Bromine depletion is a widely observed phenomenon
in sea salt aerosol. On average, about 50% of bromide in sea
salt aerosol is depleted,10 (bromine depletion factor, DF =
50%), which makes sea salt a potentially large bromine source
to the atmosphere.46
An IBr production rate can be calculated by taking a
background marine aerosol surface area (1.8 � 10�5 cm2
cm�3, Bates et al.47) a modelled ambient HOI concentration,
([HOI] = 5 � 107 molec cm�3 Vogt et al.8) and a 100% yield
of IBr (not unreasonable over the longer timescales in the
atmosphere). An IBr production rate of 1.4 � 104 molecule
cm�3 s�1 is calculated. Using the submicron marine aerosol
volume43 and 64 mg l�1 Br� in seawater, under conditions in
which HOI is not depleted from the gas phase, uptake and
subsequent reaction of HOI could deplete the aerosol bromide
by approximately 8% in 12 h. Moreover the HOBr produced
from the activated Br can itself react with sea salt aerosol to
This journal is �c the Owner Societies 2007 Phys. Chem. Chem. Phys., 2007, 9, 3136–3148 | 3147
Publ
ishe
d on
26
Apr
il 20
07. D
ownl
oade
d by
Uni
v de
Cas
tilla
-La
Man
cha
on 0
6/11
/201
3 09
:14:
54.
View Article Online
produce further Br2. This implies that HOI uptake could
trigger a significant fraction of the observed bromide depletion
in marine aerosol.
The results suggest that HOI-induced Cl activation as ICl
from sea salt aerosol is less likely to be important. Br has to be
very substantially depleted before ICl release to the gas phase
can occur. Thus the value of f = 0.5 for the fractional
conversion of HOI to gaseous ICl in a mixed-age MBL aerosol
assemblage, assumed by McFiggans et al.,7 is likely to give an
overestimate of Cl activation, at least for the first few hours of
processing of the aerosol. Subsequently the value of f = 0.5
may be appropriate for activation, but any ICl formed in the
presence of Br�-containing aerosol will have a lifetime of only
10 min. with respect to heterogeneous conversion to IBr on
background marine aerosol, using the maximum uptake coef-
ficient of 0.018 measured in this work.
Acknowledgements
CFB would like to thank Dr Paul Griffiths and Dr Claire
Badger for assistance particularly with the DMA. This work
was funded in part by NERC COSMAS core strategic
programme (GST/03/2718), and the EU 5th Framework
Programme, THALOZ project(EVK2-CT-2001-00104).
References
1 B. J. Allan, G. McFiggans, J. M. C. Plane and H. Coe, J. Geophys.Res., [Atmos.], 2000, 105, 14363–14369.
2 B. Alicke, K. Hebestreit, J. Stutz and U. Platt, Nature, 1999, 397,572–573.
3 F. Wittrock, R. Muller, A. Richter, H. Bovensman and J. Burrows,Geophys. Res. Lett., 2000, 2, 1471–1474.
4 D. Bauer, T. Ingham, S. A. Carl, G. K. Moortgat and J. N.Crowley, J. Phys. Chem. A, 1998, 102, 2857–2864.
5 D. M. Rowley, J. C. Mossinger, R. A. Cox and R. L. Jones, J.Atmos. Chem., 1999, 34, 137–151.
6 D. Davis, J. Crawford, S. Liu, S. A. McKeen, A. Bandy, D.Thornton, F. Rowland and D. J. Blake, J. Geophys. Res.,[Atmos.], 1996, 101, 2135–2147.
7 G. McFiggans, R. A. Cox, J. C. Mossinger, B. J. Allan and J. M.C. Plane, J. Geophys. Res., [Atmos.], 2002, 107, DOI: 10.1029/2001JD000383.
8 R. Vogt, R. Sander, R. von Glasow and P. J. Crutzen, J. Atmos.Chem., 1999, 32, 375–395.
9 K. L. Foster, R. A. Plastridge, J. W. Botttenheim, P. B. Shepson,B. J. Finlayson-Pitts and C. W. Spicer, Science, 2001, 291, 471–474.
10 R. Sander, W. C. Keene, A. A. Pszenny, R. Arimoto, G. P. Ayers,E. Baboukas, J. M. Cainey, P. J. Crutzen, R. A. Duce, G.Honniger, B. J. Huebert, W. Maenhaut, N. Mihalopoulos, V. C.Turekian and R. Van Dingenen, Atmos. Chem. Phys., 2003, 3,1301–1336.
11 L. J. Carpenter, Chem. Rev., 2003, 103, 4953–4962.12 J. W. Adams and R. A. Cox, J. Phys. IV, Grenoble, France, 2002.13 J. C. Mossinger and R. A. Cox, J. Phys. Chem. A, 2001, 105,
5165–5177.14 N. S. Holmes, J. W. Adams and J. N. Crowley, Phys. Chem. Chem.
Phys., 2001, 3, 1679–1687.
15 S. Fickert, J. W. Adams and J. N. Crowley, J. Geophys. Res.,[Atmos.], 1999, 104, 23, 719–723, 727.
16 G. Deiber, C. George, S. Le Calve, F. Schweitzer and P. Mirabel,Atmos. Chem. Phys., 2004, 4, 1291–1299.
17 L. T. Chu, G. Diao and L. Chu, J. Phys. Chem. B, 2002, 106,5679–5688.
18 Y. Bedjanian, G. Le Bras and G. Poulet, Int. J. Chem. Kinet., 1998,30, 933–940.
19 E. Allanic and M. J. Rossi, J. Geophys. Res., [Atmos.], 1999, 104,18689–18696.
20 J. P. D. Abbatt, Geophys. Res. Lett., 1996, 23, 1681–1684.21 W. L. Chameides and A. Stelson, J. Geophys. Res., [Atmos.], 1992,
97, 20565–20580.22 A. A. Pszenny, J. Moldanova, W. C. Keene, R. Sander, J. R.
Maben, M. Martinez, P. J. Crutzen, D. Perner and R. G. Prinn,Atmos. Chem. Phys., 2004, 4, 147–168.
23 R. Von Glasow and R. Sander, Geophys. Res. Lett., 2001, 28,247–250.
24 S. Fickert, F. Helleis, J. W. Adams, G. K. Moortgat and J. N.Crowley, J. Phys. Chem. A, 1998, 102, 10689–10696.
25 C. L. Badger, I. George, P. T. Griffiths, C. F. Braban, R. A. Coxand J. P. D. Abbatt, Atmos. Chem. Phys., 2006, 6, 755–768.
26 S. T. Martin, Chem. Rev., 2000, 100, 3403–3453.27 D. J. Cziczo, J. B. Nowak, J. H. Hu and J. P. D. Abbatt, J.
Geophys. Res., [Atmos.], 1997, 102, 18843–18850.28 C. Guimbaud, F. Arens, L. Gutzwiller, H. W. Gaggler and M.
Ammann, Atmos. Chem. Phys., 2002, 2, 249–257.29 A. Zasypkin, V. M. Grigor’eva, V. N. Korchak and Y. M.
Gershenson, Kinet. Catal., 1997, 38, 772–781.30 R. Sander, Compilation of Henry’s law constants for inorganic and
organic species of potential importance in environmental chemis-try(version 3), http://www.mpch-mainz.mpg.de/Bsander/res/henry.html, 1999.
31 R. L. Brown, J. Res. Natl. Bur. Stand. (U. S.), 1978, 83, 1–8.32 N. A. Fuchs and A. G. Sutugin, Highly dispersed aerosols, Ann
Arbor Science, Ann Arbor MI, 1970.33 A. Fried, B. E. Henry, J. G. Calvert and M. Mozurkewich, J.
Geophys. Res., [Atmos.], 1994, 99, 3517–3532.34 D. R. Hanson, A. R. Ravishankara and S. Solomon, J. Geophys.
Res., [Atmos.], 1994, 99, 3615–3629.35 D. Lide, CRC Handbook of Chemistry and Physics.36 M. D. Cohen, R. C. Flagan and J. H. Seinfeld, J. Phys. Chem. A,
1987, 91, 4563.37 K. S. Carslaw, S. L. Clegg and P. Brimblecombe, J. Phys. Chem.,
1995, 99, 11557–11574.38 A. S. Wexler and S. L. Clegg, J. Geophys. Res., [Atmos.], 2002,
107, art. no. 4207.39 S. D. Jones and V. W. Truesdale, J. Hydrol., 1996, 179, 67–86.40 V. W. Truesdale, J. Chem. Soc., Faraday Trans., 1997, 93,
1909–1914.41 V. W. Truesdale and C. Canosa-Mas, J. Chem. Soc., Faraday
Trans., 1995, 91, 2269–2273.42 M. Wachsmuth, H. W. Gaggeler, R. von Glasow and M. Am-
mann, Atmos. Chem. Phys., 2002, 2, 121–131.43 R. C. Troy, M. D. Kelly, J. C. Nagy and D. W. Margerum, Inorg.
Chem., 1991, 30, 4838–4843.44 Y. L. Wang, J. C. Nagy and D. W. Margerum, J. Am. Chem. Soc.,
1989, 111, 7838–7842.45 D. D. Wagman, W. H. Evans, V. B. Parker, R. H. Schumm, I.
Halow, S. M. Bailey, K. L. Churney and R. L. Nuttall, J. Phys.Chem. Ref. Data, 1982, 11.
46 X. Yang, R. A. Cox, N. Warwick, J. A. Pyle and G. Carver, J.Geophys. Res., [Atmos.], 2005.
47 T. S. Bates, P. K. Quinn, D. S. Covert, D. J. Coffman, J. E.Johnson and A. Wiedensohler, Tellus, 2000, 52B, 258–272.
3148 | Phys. Chem. Chem. Phys., 2007, 9, 3136–3148 This journal is �c the Owner Societies 2007
Publ
ishe
d on
26
Apr
il 20
07. D
ownl
oade
d by
Uni
v de
Cas
tilla
-La
Man
cha
on 0
6/11
/201
3 09
:14:
54.
View Article Online