Differential phosphoproteomics for the study of olfactory ...
SCIENCE CHINA Life Sciences
© Science China Press and Springer-Verlag Berlin Heidelberg 2010 life.scichina.com www.springerlink.com
*Corresponding author (email: [email protected] )
• RESEARCH PAPER • February 2010 Vol.53 No.2: 257–266 doi: 10.1007/s11427-010-0025-4
Olfactory receptor gene family evolution in stickleback and medaka fishes
CHEN Ming1,2, PENG ZuoGang1 & HE ShunPing1*
1 Laboratory of Fish Phylogenetics and Biogeography, Institute of Hydrobiology, Chinese Academy of Sciences, Wuhan 430072, China; 2 Graduate University of Chinese Academy of Sciences, Beijing 100039, China
Received July 20, 2009; accepted August 20, 2009
Interaction of olfactory receptor (OR) genes with environmental odors is regarded as the first step of olfaction. In this study, OR genes of two fish, medaka (Oryzias latipes) and stickleback (Gasterosteus aculeatus), were identified and an evolutional analysis was conducted. The selection pressure of different TM regions and complete coding region were compared. Three TM regions (TM4, TM5 and TM6) were found to have higher average Ka/Ks values, which might be partly caused by positive se-lection as suggested by subsequent positive selection analysis. Further analysis showed that many PTSs overlap, or are adja-cent to previously deduced binding sites in mammals. These results support the hypothesis that binding sites of fish OR genes may evolved under positive selection.
olfactory receptor, positive selection, binding site
Citation: Chen M, Peng Z G, He S P. Olfactory receptor gene family evolution in stickleback and medaka fishes. Sci China Life Sci, 2010, 53: 257–266, doi: 10.1007/s11427-010-0025-4
Olfaction enable vertebrates to identify foods, mates and avoid danger. Olfaction is initiated by the interaction of en-vironmental ligands with the olfactory Receptors (OR) ex-pressed in sensory neurons of the olfactory epithelia in nasal cavities [1,2]. OR genes were first found in rats [3] and be-long to the rhodopsin-like G-protein coupled receptor (GPCR) gene hyper-family characterized by seven helical TM domains. OR genes constitute one of the largest gene families in the vertebrate genomes, comprising ~1000 genes in the mammalian genome [4–7] and ~100 members in the fish genome [8–10].
Studies of OR genes in mammal genomes showed that human OR genes have different patterns from that of mice and dogs. Niimura and Nei [7] identified 388 potential functional genes and 414 pseudogenes in humans, whereas they identified 1037 functional genes and 354 pseudogenes in mice [11]. The total number of functional genes in the
mouse genome is ~2.7 times of that in the human genome. Furthermore, there are ~75% functional genes in the mouse genome, which is larger than that of the human genome at 48%. There are also more functional OR genes in the dog genome than in the human genome, and the percentage of functional genes in the former, >80% is also significantly larger than in the latter, 48% [12,13]. These differences are consistent with the more sensitive olfaction in mouse and dogs. It was reported that the loss of OR genes coincides with the acquisition of full trichromatic vision in primates, suggesting that full trichromatic vision diminished the need for olfaction for survival [14]. These results showed that olfaction ability may have a positive correlation with the number of functional OR genes in mammals [15]. In the fish genomes, there are relatively fewer (~100) OR genes, as compared with that in the mammalian genome. However, the fish OR genes are more divergent than mammalian OR genes [10]. The odor specialty of OR proteins is determined by relatively fewer amino acids, usually called binding sites
258 Chen Ming, et al. Sci China Life Sci February (2010) Vol.53 No.2
[16,17]. These binding sites are directly involved in odor combination. One hypothesis is that these residues may be targeted by positive selection, which is the case for the pep-tide-binding sites of the major histocompatibility (MHC) antigens [18,19].
Several cases of positive selection upon the members of this large gene family have been identified, which supports the aforementioned hypothesis. It was reported that various human and chimpanzee or genes had evolved under positive selection in each lineage [20]. Amino acid changes were found at the deduced binding sites. Positive selection has also been detected in OR genes in fish genomes. In catfishes, by comparing 3–4 sequences in a subfamily, Ngai et al. [8] found that the Ka/Ks ratio of two TM domains (TM3, TM4) is greater than 1, whereas the Ka/Ks ratio of the remainder is less than 0.5. It was concluded that the diversification in transmembrane domains in the OR genes may likely reflect natural selection for the ability of OR to interact with odors. In medaka, several OR genes of individuals from different strains have been sequenced. At the ancestral node of two related sequences, positive selection has been detected in one lineage. The fixed amino acid changes were observed in several transmembrane domains (TM3, TM5, TM6) [21]. Alioto and Ngai [9] calculated average Ka/Ks ratios of dif-ferent transmembrane regions of zebrafish OR genes and showed that there is no region exhibiting signals of positive selection. However, they identified one site in TM3 and one site in TM4 that have been shaped by positive selection. These studies revealed that OR genes mainly evolved under purifying selection but also positive selection is inclined to occur at functional domains. However, the studies in fish either analyzed limited sequences or identified very limited genes or sites influenced by positive selection. The major objective of this study was to study the evolutionary dy-namic of OR genes in medaka and stickleback, especially to test whether there had been positive selection shaping these genes.
1 Materials and methods
1.1 Identification of stickleback and medaka or genes
A method based on BLAST [22] and Genewise [23] was used to identify potential functional (with intact Open read-ing frames) and non-functional (pseudogenes) OR genes. The genome sequences of stickleback and medaka were downloaded from the following web site: http://www. ensembl.org/. OR genes of different vertebrate species, hu-man (Homo sapiens), frog (Xenopus tropicalis), zebrafish (Danio rerio), tetraodon (Tetraodon nigroviridis) and loach (Misgurnus anguillicaudatus), were collected as query, which were then subjected to a TBLASTN search against draft genome sequences with the E-value set as 1×10⁻⁴. The longest ORFs (Open reading frames, >50 codons) were ex-
tracted from all non-redundant hits with the surrounding 1000 bp sequences. Then a BLASTP search against a data-base containing both representative OR genes and non-OR GPCR genes was used to classified the ORFs as OR or non-OR genes. All ORFs that matched a published OR gene as besthit were regarded as OR gene candidates. Genewise was used to further evaluate these candidates as functional or non-functional. All information such as start codon, frame-shift/premature stop codon was distilled from the Genewise results. After the primary identification pipeline, extensive manual inspection was also performed to ensure the reliability of the results. Duplicates were excluded from the dataset.
1.2 Phylogenetic analysis
For multiple alignments of OR genes, MAFFT6.619 [24] was used with the L-INS-i method. N- and C-terminal tails were trimmed for all alignments. The Neighbor-Joining algorithm as implemented by MEGA3.0 [25] was used to generate unrooted phylogenetic trees from these alignments. One thousand bootstraps were performed to assess the sup-port at each tree node. Maximum likelihood analysis was carried out using PHYML [26] on the same processed amino acid alignments described above. Bootstrap analysis with 100 replicates was carried out using the JTT model of amino acid substitution. The consensus tree including boot-strap support for each node was plotted for each dataset using FigTree.
1.3 Ka/Ks analysis
Only all type1 (except SkgVII.16 for its unique indel) func-tional stickleback OR genes were selected to test whether different TM regions of OR genes were under different se-lection pressures. A similar method by Man et al. [17] was adopted to align the 93 protein sequences and retranslate the protein alignment into DNA alignment. The entire coding regions were partitioned into C- and N-terminals, 7 TM domains, and non-TM regions according to Man et al. [17]. Then the KaKs_calculator [27] was used to calculate the average Ka/Ks ratio for the TM regions and the complete CDS (coding sequences) region. The result based on the method of Nei-Gojobori [28] was used.
The program “codeml” implemented in PAML package [29] was used to infer the residues under positive selection following Yang et al. [30]. This method calculates the maximum likelihood value under a null model that assumes ω<1 with another nested model that allows positive selec-tion. It compares the differences of the likelihood value twice with a χ2 distribution at a proper degree. If the LRT (Likelihood Ratio Test) suggests that a positive selection has occurred, then the Bayesian method will be used to identify the specific codons under positive selection. A
Chen Ming, et al. Sci China Life Sci February (2010) Vol.53 No.2 259
site-specific model analysis that assumes ω could vary among sites but was fixed between different lineages which were first performed. This analysis is conservative because only the amino acid sites with a higher average Ka than the average Ks through the given phylogeny would be identified as positive selection sites. The models M0,M3,M1a,M2a,M7,M8 [30] were used. To reduce false positives, three LRTs were conducted: model 0 vs model 3, model 1a vs model 2a and model 7 vs model 8. Only if at least two LRTs were significant and positive selection sites were detected under M8 or M2, would they be regarded as reliable results. Partial sequences in the N-terminal and C-terminal were cut and excluded from the analysis because the gaps in these regions might cause unreliable results. Positive selection was separately detected on different nodes of the medaka and stickleback OR genes tree, but for the stickleback, only 55 genes were chosen as many genes are similar. The bo-vine rhodopsin gene was used herein as outgroup to con-struct a Neighbor joining (NJ) bootstrap tree (Figure 4) by MEGA3. The tree file of codeml of different clade is either from the Clustal_X [31] alignment or from the topology in the whole tree.
The branch-site analysis was also conducted using an improved branch-site mode [32,33] to test whether the three species-specific clades (text) were under positive selection. For the stickleback, the phylogenetic tree constructed from 55-gene tree was used as a background tree, whereas for the medaka only cladeδ90 (Figure 3) were chosen as a back-ground tree.
2 Results
2.1 Number and distribution of OR genes in the medaka and stickleback genomes
A total of 97 potential functional genes and 46 pseudogenes were identified in the stickleback genome and 62 functional genes and 28 pseudogenes in the medaka genome (Table 1). The sequences files are in attachment files. For comparison, the OR gene numbers of zebrafish and fugu from Niimura and Nei [10] are also shown in the Table 1. The functional gene number of the stickleback is 2.5 times greater than that of the fugu, which has a similar sized genome. The fraction of functional genes of the stickleback (68%) is significantly larger than that of the fugu (43%, P<0.001; Fisher’s exact test). The functional gene number of the stickleback is similar to that of the zebrafish despite the fact that the ge-nome size of the stickleback is only 1/3–1/4 of that of the zebrafish. There are more pseudogenes in the stickleback than in the zebrafish.
For stickleback OR genes (functional genes and pseu-dogenes), the majority are distributed in 3 chromosomes. There are respectively 69, 25 and 23 genes in chromosome XVI, I and VII. This is unlike the human OR genes which
are distributed in all chromosomes except chromosome 20 and Y [34]. There are 3 gene clusters (the distance of two OR genes is <1Mb) in chromosome XVI, 2 clusters in chro-mosome I and 1 cluster in chromosome VII. These gene clusters each contain 10–28 genes. One singleton was found in chromosome III, and another 5 genes located in chromo-some V. For the medaka, 61 genes (including pseudogenes) have definite chromosome positions. A total of 22 genes were located in chromosome 13, 15 in chromosome 14, and 20 in chromosome 21. There was one singleton in both chromosome 17 and 18, and two genes in 22. The genes in chromosome 17, 18 and 22 are pseudogenes.
Table 1 The functional genes and pseudogenes in 4 fish species
Stickleback Medaka Zebrafisha) Fugu
Total 143 90 133 94
Functional genes 97 62 98 40
Pseudogenes 46 28 35 54
Genome sizeb) (Mb) 447 700 1763 393
a) The data source for zebrafish and fugu was from Niimura and Nei [10]; b) from http://www.ensembl.org/.
2.2 Phylogeny of functional OR genes
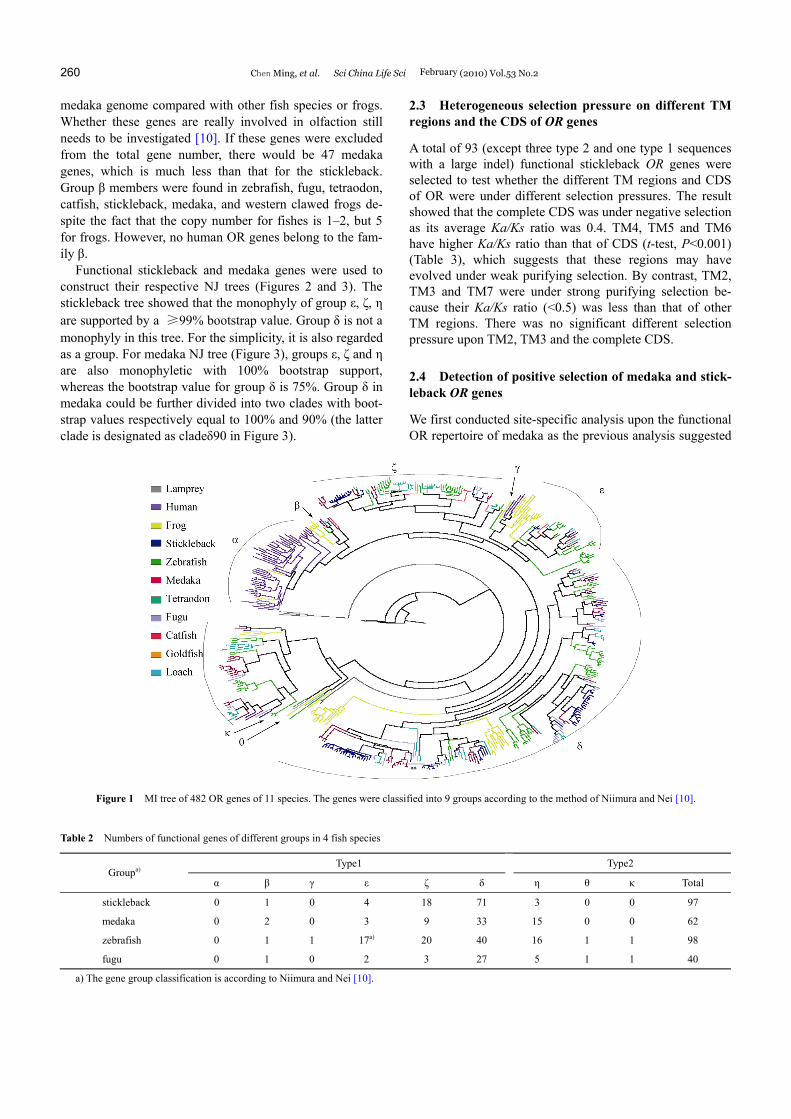
The putative functional OR genes of the stickleback and the medaka and that of zebrafish (Danio rerio), fugu (Takifugu rubripes), western clawed frogs (Xenopus tropicalis [10]), lamprey (Lampetra fluviatilis [35]), tetraodon (Tetraodon nigroviridis [9]), catfish (Ictalurus punctatus [8]), goldfish (Carassius auratus [36]), loach (Misgurnus anguillicauda-tus [37]), and human (Homo sapiens [4]) were used to con-struct a phylogeny using the same method as Niimura and Nei [10]. A NJ tree was first built using 1137 vertebrate OR gene sequences. Genes were selected to represent the group γ and a total of 482 OR genes retained to construct a maxi-mum likelihood (ML) tree (Figure 1). An OR group is de-fined as a clade with a high bootstrap value which diverged before the divergence of fishes and tetrapods. These genes were classified into 9 groups: (type 1: α, β, γ, ε, ζ, δ; type 2: η, θ, κ), similar to Niimura and Nei [10]. OR genes of both the medaka and the stickleback were classified into 5 groups (β, ε, ζ, δ and η). There are no members of groups κ and θ, unlike zebrafish or frogs. Table 2 shows the func-tional OR gene number of different groups of four fish spe-cies. There is an expansion of the δ group in the stickleback genome as gene numbers of this group in the stickleback are larger than that of all other fish species in Table 2. Four species-specific clades of the stickleback containing ≥9 members in group δ were identified. The largest species- specific clade contains 21 genes. It is these organism- specific gains of genes that cause the relatively large num- ber of OR genes in the stickleback among fish genomes. Relatively more OR genes of group η were found in the
260 Chen Ming, et al. Sci China Life Sci February (2010) Vol.53 No.2
2.3 Heterogeneous selection pressure on different TM regions and the CDS of OR genes
medaka genome compared with other fish species or frogs. Whether these genes are really involved in olfaction still needs to be investigated [10]. If these genes were excluded from the total gene number, there would be 47 medaka genes, which is much less than that for the stickleback. Group β members were found in zebrafish, fugu, tetraodon, catfish, stickleback, medaka, and western clawed frogs de-spite the fact that the copy number for fishes is 1–2, but 5 for frogs. However, no human OR genes belong to the fam-ily β.
A total of 93 (except three type 2 and one type 1 sequences with a large indel) functional stickleback OR genes were selected to test whether the different TM regions and CDS of OR were under different selection pressures. The result showed that the complete CDS was under negative selection as its average Ka/Ks ratio was 0.4. TM4, TM5 and TM6 have higher Ka/Ks ratio than that of CDS (t-test, P<0.001) (Table 3), which suggests that these regions may have evolved under weak purifying selection. By contrast, TM2, TM3 and TM7 were under strong purifying selection be-cause their Ka/Ks ratio (<0.5) was less than that of other TM regions. There was no significant different selection pressure upon TM2, TM3 and the complete CDS.
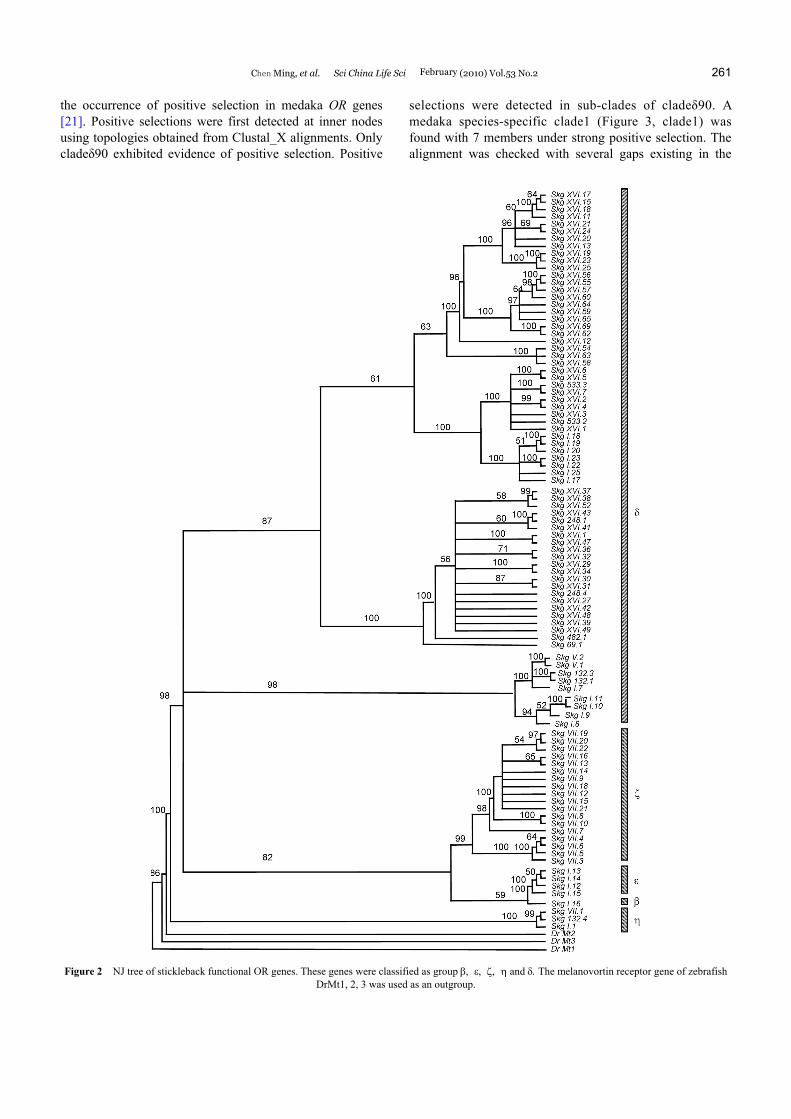
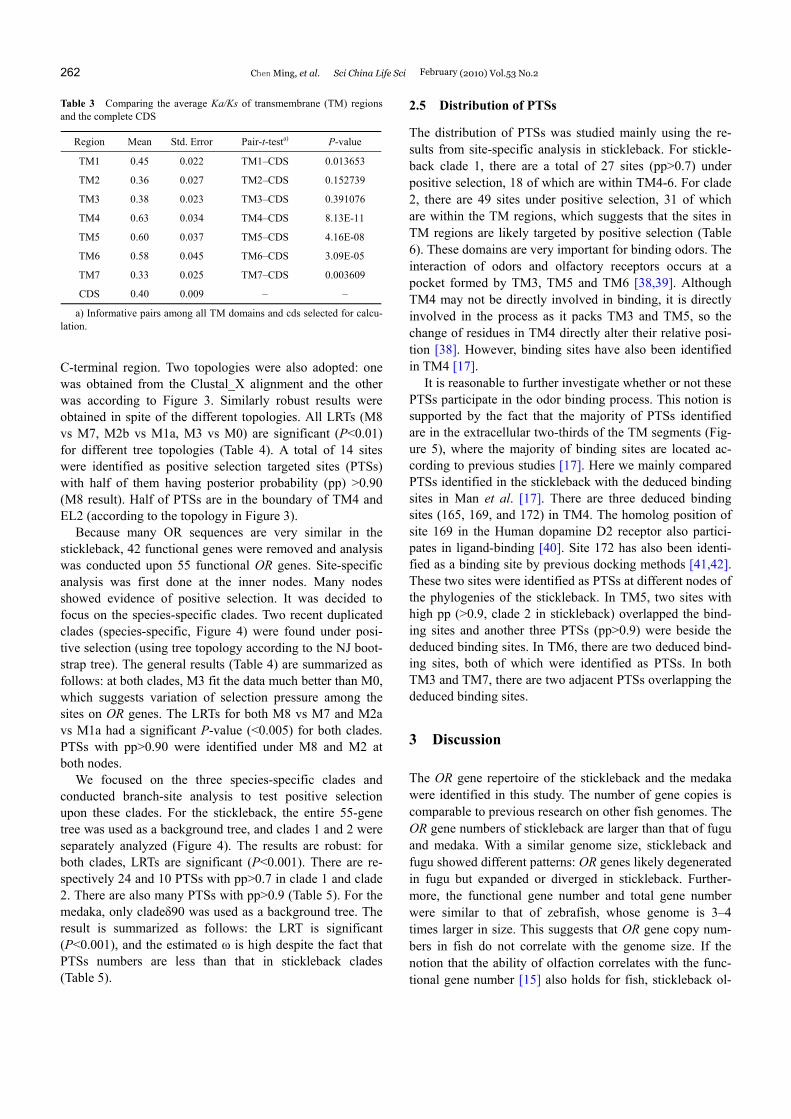
Functional stickleback and medaka genes were used to construct their respective NJ trees (Figures 2 and 3). The stickleback tree showed that the monophyly of group ε, ζ, η are supported by a ≥99% bootstrap value. Group δ is not a monophyly in this tree. For the simplicity, it is also regarded as a group. For medaka NJ tree (Figure 3), groups ε, ζ and η are also monophyletic with 100% bootstrap support, whereas the bootstrap value for group δ is 75%. Group δ in medaka could be further divided into two clades with boot-strap values respectively equal to 100% and 90% (the latter clade is designated as cladeδ90 in Figure 3).
2.4 Detection of positive selection of medaka and stick-leback OR genes
We first conducted site-specific analysis upon the functional OR repertoire of medaka as the previous analysis suggested
Figure 1 MI tree of 482 OR genes of 11 species. The genes were classified into 9 groups according to the method of Niimura and Nei [10].
Table 2 Numbers of functional genes of different groups in 4 fish species
Type1 Type2 Groupa)
α β γ ε ζ δ η θ κ Total
stickleback 0 1 0 4 18 71 3 0 0 97
medaka 0 2 0 3 9 33 15 0 0 62
zebrafish 0 1 1 17a) 20 40 16 1 1 98
fugu 0 1 0 2 3 27 5 1 1 40
a) The gene group classification is according to Niimura and Nei [10].
Chen Ming, et al. Sci China Life Sci February (2010) Vol.53 No.2 261
the occurrence of positive selection in medaka OR genes [21]. Positive selections were first detected at inner nodes using topologies obtained from Clustal_X alignments. Only cladeδ90 exhibited evidence of positive selection. Positive
selections were detected in sub-clades of cladeδ90. A medaka species-specific clade1 (Figure 3, clade1) was found with 7 members under strong positive selection. The alignment was checked with several gaps existing in the
Figure 2 NJ tree of stickleback functional OR genes. These genes were classified as group β, ε, ζ, η and δ. The melanovortin receptor gene of zebrafish DrMt1, 2, 3 was used as an outgroup.
262 Chen Ming, et al. Sci China Life Sci February (2010) Vol.53 No.2
Table 3 Comparing the average Ka/Ks of transmembrane (TM) regions and the complete CDS
Region Mean Std. Error Pair-t-testa) P-value
TM1 0.45 0.022 TM1–CDS 0.013653
TM2 0.36 0.027 TM2–CDS 0.152739
TM3 0.38 0.023 TM3–CDS 0.391076
TM4 0.63 0.034 TM4–CDS 8.13E-11
TM5 0.60 0.037 TM5–CDS 4.16E-08
TM6 0.58 0.045 TM6–CDS 3.09E-05
TM7 0.33 0.025 TM7–CDS 0.003609
CDS 0.40 0.009 – –
a) Informative pairs among all TM domains and cds selected for calcu-lation.
C-terminal region. Two topologies were also adopted: one was obtained from the Clustal_X alignment and the other was according to Figure 3. Similarly robust results were obtained in spite of the different topologies. All LRTs (M8 vs M7, M2b vs M1a, M3 vs M0) are significant (P<0.01) for different tree topologies (Table 4). A total of 14 sites were identified as positive selection targeted sites (PTSs) with half of them having posterior probability (pp) >0.90 (M8 result). Half of PTSs are in the boundary of TM4 and EL2 (according to the topology in Figure 3).
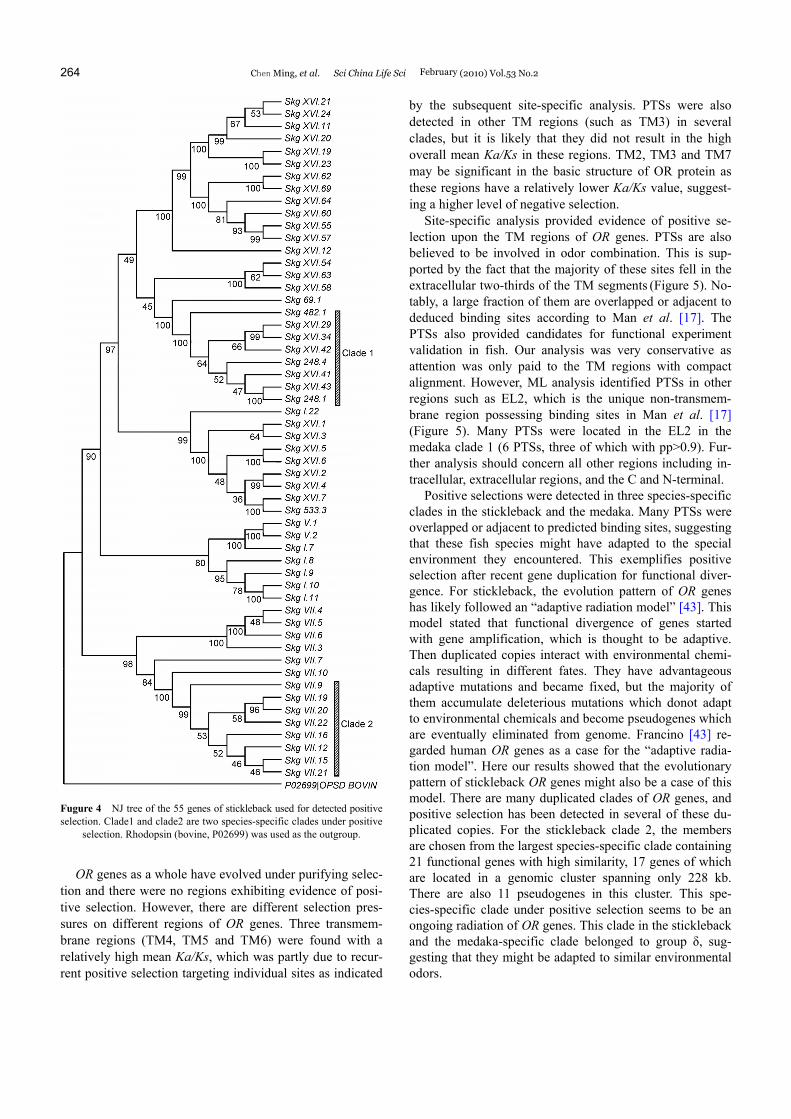
Because many OR sequences are very similar in the stickleback, 42 functional genes were removed and analysis was conducted upon 55 functional OR genes. Site-specific analysis was first done at the inner nodes. Many nodes showed evidence of positive selection. It was decided to focus on the species-specific clades. Two recent duplicated clades (species-specific, Figure 4) were found under posi-tive selection (using tree topology according to the NJ boot-strap tree). The general results (Table 4) are summarized as follows: at both clades, M3 fit the data much better than M0, which suggests variation of selection pressure among the sites on OR genes. The LRTs for both M8 vs M7 and M2a vs M1a had a significant P-value (<0.005) for both clades. PTSs with pp>0.90 were identified under M8 and M2 at both nodes.
We focused on the three species-specific clades and conducted branch-site analysis to test positive selection upon these clades. For the stickleback, the entire 55-gene tree was used as a background tree, and clades 1 and 2 were separately analyzed (Figure 4). The results are robust: for both clades, LRTs are significant (P<0.001). There are re-spectively 24 and 10 PTSs with pp>0.7 in clade 1 and clade 2. There are also many PTSs with pp>0.9 (Table 5). For the medaka, only cladeδ90 was used as a background tree. The result is summarized as follows: the LRT is significant (P<0.001), and the estimated ω is high despite the fact that PTSs numbers are less than that in stickleback clades (Table 5).
2.5 Distribution of PTSs
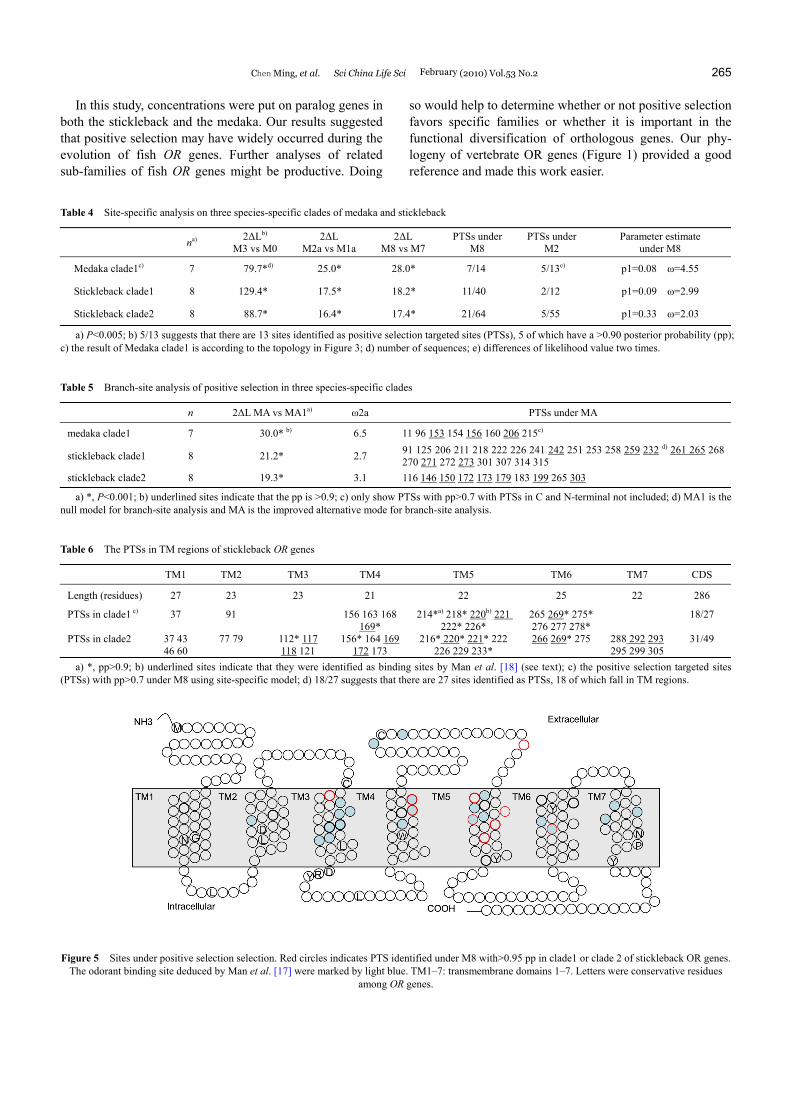
The distribution of PTSs was studied mainly using the re-sults from site-specific analysis in stickleback. For stickle-back clade 1, there are a total of 27 sites (pp>0.7) under positive selection, 18 of which are within TM4-6. For clade 2, there are 49 sites under positive selection, 31 of which are within the TM regions, which suggests that the sites in TM regions are likely targeted by positive selection (Table 6). These domains are very important for binding odors. The interaction of odors and olfactory receptors occurs at a pocket formed by TM3, TM5 and TM6 [38,39]. Although TM4 may not be directly involved in binding, it is directly involved in the process as it packs TM3 and TM5, so the change of residues in TM4 directly alter their relative posi-tion [38]. However, binding sites have also been identified in TM4 [17].
It is reasonable to further investigate whether or not these PTSs participate in the odor binding process. This notion is supported by the fact that the majority of PTSs identified are in the extracellular two-thirds of the TM segments (Fig-ure 5), where the majority of binding sites are located ac-cording to previous studies [17]. Here we mainly compared PTSs identified in the stickleback with the deduced binding sites in Man et al. [17]. There are three deduced binding sites (165, 169, and 172) in TM4. The homolog position of site 169 in the Human dopamine D2 receptor also partici-pates in ligand-binding [40]. Site 172 has also been identi-fied as a binding site by previous docking methods [41,42]. These two sites were identified as PTSs at different nodes of the phylogenies of the stickleback. In TM5, two sites with high pp (>0.9, clade 2 in stickleback) overlapped the bind-ing sites and another three PTSs (pp>0.9) were beside the deduced binding sites. In TM6, there are two deduced bind-ing sites, both of which were identified as PTSs. In both TM3 and TM7, there are two adjacent PTSs overlapping the deduced binding sites.
3 Discussion
The OR gene repertoire of the stickleback and the medaka were identified in this study. The number of gene copies is comparable to previous research on other fish genomes. The OR gene numbers of stickleback are larger than that of fugu and medaka. With a similar genome size, stickleback and fugu showed different patterns: OR genes likely degenerated in fugu but expanded or diverged in stickleback. Further-more, the functional gene number and total gene number were similar to that of zebrafish, whose genome is 3–4 times larger in size. This suggests that OR gene copy num-bers in fish do not correlate with the genome size. If the notion that the ability of olfaction correlates with the func-tional gene number [15] also holds for fish, stickleback ol-
Chen Ming, et al. Sci China Life Sci February (2010) Vol.53 No.2 263
faction may be more essential for its survival than it is for the medaka or the fugu. This is especially true when stick-leback’s smaller genome size was taken into consideration.
Phylogenetic analysis explained why there are relatively more OR genes in the stickleback among all fish genomes. There was an expansion of group δ genes in the stickleback.
Many species-specific clades were found in this group. In species-specific clades, the majority of them are located in gene clusters, suggesting tandem gene duplication may oc- cur and accounts for the larger size of the stickleback OR gene. These genes may duplicate for special odors, so they may be subjected to positive selection pressure.
Figure 3 NJ tree of medaka functional genes. These genes were classified as groups δ, β, ε, ζ and η. There was positive selection in clade 1. Cladeδ90 is used as background tree for the branch-site model detection of positive selection. The melanocortin receptor gene of zebrafish DrMt1, 2, 3 was used as an
outgroup.
264 Chen Ming, et al. Sci China Life Sci February (2010) Vol.53 No.2
Fugure 4 NJ tree of the 55 genes of stickleback used for detected positive selection. Clade1 and clade2 are two species-specific clades under positive
selection. Rhodopsin (bovine, P02699) was used as the outgroup.
OR genes as a whole have evolved under purifying selec-tion and there were no regions exhibiting evidence of posi-tive selection. However, there are different selection pres-sures on different regions of OR genes. Three transmem- brane regions (TM4, TM5 and TM6) were found with a relatively high mean Ka/Ks, which was partly due to recur-rent positive selection targeting individual sites as indicated
by the subsequent site-specific analysis. PTSs were also detected in other TM regions (such as TM3) in several clades, but it is likely that they did not result in the high overall mean Ka/Ks in these regions. TM2, TM3 and TM7 may be significant in the basic structure of OR protein as these regions have a relatively lower Ka/Ks value, suggest-ing a higher level of negative selection.
Site-specific analysis provided evidence of positive se-lection upon the TM regions of OR genes. PTSs are also believed to be involved in odor combination. This is sup-ported by the fact that the majority of these sites fell in the extracellular two-thirds of the TM segments (Figure 5). No-tably, a large fraction of them are overlapped or adjacent to deduced binding sites according to Man et al. [17]. The PTSs also provided candidates for functional experiment validation in fish. Our analysis was very conservative as attention was only paid to the TM regions with compact alignment. However, ML analysis identified PTSs in other regions such as EL2, which is the unique non-transmem- brane region possessing binding sites in Man et al. [17] (Figure 5). Many PTSs were located in the EL2 in the medaka clade 1 (6 PTSs, three of which with pp>0.9). Fur-ther analysis should concern all other regions including in-tracellular, extracellular regions, and the C and N-terminal.
Positive selections were detected in three species-specific clades in the stickleback and the medaka. Many PTSs were overlapped or adjacent to predicted binding sites, suggesting that these fish species might have adapted to the special environment they encountered. This exemplifies positive selection after recent gene duplication for functional diver-gence. For stickleback, the evolution pattern of OR genes has likely followed an “adaptive radiation model” [43]. This model stated that functional divergence of genes started with gene amplification, which is thought to be adaptive. Then duplicated copies interact with environmental chemi-cals resulting in different fates. They have advantageous adaptive mutations and became fixed, but the majority of them accumulate deleterious mutations which donot adapt to environmental chemicals and become pseudogenes which are eventually eliminated from genome. Francino [43] re- garded human OR genes as a case for the “adaptive radia-tion model”. Here our results showed that the evolutionary pattern of stickleback OR genes might also be a case of this model. There are many duplicated clades of OR genes, and positive selection has been detected in several of these du-plicated copies. For the stickleback clade 2, the members are chosen from the largest species-specific clade containing 21 functional genes with high similarity, 17 genes of which are located in a genomic cluster spanning only 228 kb. There are also 11 pseudogenes in this cluster. This spe-cies-specific clade under positive selection seems to be an ongoing radiation of OR genes. This clade in the stickleback and the medaka-specific clade belonged to group δ, sug-gesting that they might be adapted to similar environmental odors.
Chen Ming, et al. Sci China Life Sci February (2010) Vol.53 No.2 265
In this study, concentrations were put on paralog genes in both the stickleback and the medaka. Our results suggested that positive selection may have widely occurred during the evolution of fish OR genes. Further analyses of related sub-families of fish OR genes might be productive. Doing
so would help to determine whether or not positive selection favors specific families or whether it is important in the functional diversification of orthologous genes. Our phy-logeny of vertebrate OR genes (Figure 1) provided a good reference and made this work easier.
Table 4 Site-specific analysis on three species-specific clades of medaka and stickleback
na) 2ΔLb)
M3 vs M0 2ΔL
M2a vs M1a2ΔL
M8 vs M7 PTSs under
M8 PTSs under
M2 Parameter estimate
under M8
Medaka clade1c) 7 79.7*d) 25.0* 28.0* 7/14 5/13e) p1=0.08 ω=4.55
Stickleback clade1 8 129.4* 17.5* 18.2* 11/40 2/12 p1=0.09 ω=2.99
Stickleback clade2 8 88.7* 16.4* 17.4* 21/64 5/55 p1=0.33 ω=2.03
a) P<0.005; b) 5/13 suggests that there are 13 sites identified as positive selection targeted sites (PTSs), 5 of which have a >0.90 posterior probability (pp); c) the result of Medaka clade1 is according to the topology in Figure 3; d) number of sequences; e) differences of likelihood value two times.
Table 5 Branch-site analysis of positive selection in three species-specific clades
n 2ΔL MA vs MA1a) ω2a PTSs under MA
medaka clade1 7 30.0* b) 6.5 11 96 153 154 156 160 206 215c)
stickleback clade1 8 21.2* 2.7 91 125 206 211 218 222 226 241 242 251 253 258 259 232 d) 261 265 268 270 271 272 273 301 307 314 315
stickleback clade2 8 19.3* 3.1 116 146 150 172 173 179 183 199 265 303
a) *, P<0.001; b) underlined sites indicate that the pp is >0.9; c) only show PTSs with pp>0.7 with PTSs in C and N-terminal not included; d) MA1 is the null model for branch-site analysis and MA is the improved alternative mode for branch-site analysis.
Table 6 The PTSs in TM regions of stickleback OR genes
TM1 TM2 TM3 TM4 TM5 TM6 TM7 CDS
Length (residues) 27 23 23 21 22 25 22 286
PTSs in clade1 c) 37 91 156 163 168 169*
214*a) 218* 220b) 221 222* 226*
265 269* 275* 276 277 278*
18/27
PTSs in clade2 37 43 46 60
77 79 112* 117 118 121
156* 164 169 172 173
216* 220* 221* 222 226 229 233*
266 269* 275 288 292 293 295 299 305
31/49
a) *, pp>0.9; b) underlined sites indicate that they were identified as binding sites by Man et al. [18] (see text); c) the positive selection targeted sites (PTSs) with pp>0.7 under M8 using site-specific model; d) 18/27 suggests that there are 27 sites identified as PTSs, 18 of which fall in TM regions.
Figure 5 Sites under positive selection selection. Red circles indicates PTS identified under M8 with>0.95 pp in clade1 or clade 2 of stickleback OR genes.
The odorant binding site deduced by Man et al. [17] were marked by light blue. TM1–7: transmembrane domains 1–7. Letters were conservative residues among OR genes.
266 Chen Ming, et al. Sci China Life Sci February (2010) Vol.53 No.2
We thank Lei YANG , Qi ZHOU, Danielle Sampliner and Caroline Rohner MEILING Yu for helpful comments and discussion. This work was sup-ported by grants from National Natural Science Foundation of China (Grant Nos. 30600062 and 30530120).
1 Firestein S. How the olfactory system makes sense of scents, Nature, 2001, 413: 211–218[DOI]
2 Mombaerts P. Genes and ligands for odorant, vomeronasal and taste receptors. Nat Rev Neurosci, 2004, 5: 263–278[DOI]
3 Buck L, Axel R. A novel multigene family may encode odorant re-ceptors: A molecular basis for odor recognition. Cell, 1991, 65: 175–187[DOI]
4 Zozulya S, Echeverri F, Nguyen T. The human olfactory receptor repertoire. Genome Biol, 2001, 2: RESEARCH0018
5 Young J M. Friedman C, Williams E M, et al. Different evolutionary processes shaped the mouse and human olfactory receptor gene fami-lies. Hum Mol Genet, 2002, 11: 535–546[DOI]
6 Zhang X, Firestein S. The olfactory receptor gene superfamily of the mouse. Nat Neurosci, 2002, 5: 124–133
7 Niimura Y, Nei M. Evolution of olfactory receptor genes in the hu-man genome. Proc Natl Acad Sci USA, 2003, 100: 12235–12240[DOI]
8 Ngai J, Dowling M M, Buck L, et al. The family of genes encoding odorant receptors in the channel catfish. Cell, 1993, 72: 657–666[DOI]
9 Alioto T S, Ngai J. The odorant receptor repertoire of teleost fish. BMC Genomics, 2005, 6: 173[DOI]
10 Niimura Y, Nei M. Evolutionary dynamics of olfactory receptor genes in fishes and tetrapods, Proc Natl Acad Sci USA, 2005, 102: 6039–6044[DOI]
11 Niimura Y, Nei M. Evolutionary changes of the number of olfactory receptor genes in the human and mouse lineages. Gene, 2005, 346: 23–28[DOI]
12 Quignon P, Kirkness E, Cadieu E, et al. Comparison of the canine and human olfactory receptor gene repertoires. Genome Biol, 2003, 4: R80[DOI]
13 Olender T, Fuchs T, Linhart C, et al. The canine olfactory subgenome, Genomics. 2004, 83: 361–372[DOI]
14 Gilad Y, Wiebe V, Przeworski M, et al. Loss of olfactory receptor genes coincides with the acquisition of full trichromatic vision in primates. PLoS Biol, 2004, 2: E5[DOI]
15 Niimura Y, Nei M. Evolutionary dynamics of olfactory and other chemosensory receptor genes in vertebrates. Hum Genet, 2006, 51: 505–517[DOI]
16 Pilpel Y, Lancet D. The variable and conserved interfaces of modeled olfactory receptor proteins. Protein Sci, 1999, 8: 969–977[DOI]
17 Man O, Gilad Y, Lancet D. Prediction of the odorant binding site of olfactory receptor proteins by human-mouse comparisons. Protein Sci, 2004, 13: 240–254[DOI]
18 Hughes A L, Nei M. Pattern of nucleotide substitution at major his-tocompatibility complex class I loci reveals overdominant selection. Nature, 1988, 335: 167–170[DOI]
19 Hughes A L, Nei M. Nucleotide substitution at major histocompati-bility complex class II loci: Evidence for overdominant selection, Proc Natl Acad Sci USA, 1989, 86: 958–962[DOI]
20 Gilad Y, Man O, Glusman G. A comparison of the human and chim-panzee olfactory receptor gene repertoires. Genome Res, 2005, 15: 224–230[DOI]
21 Kondo R, Kaneko S, Sun H, et al. Diversification of olfactory recep-tor genes in the Japanese medaka fish, Oryzias latipes. Gene, 2002, 282: 113–120[DOI]
22 Altschul S F, Madden T L, Schaffer A A, et al. Gapped BLAST and PSI-BLAST: A new generation of protein database search programs.
Nucleic Acids Res, 1997, 25: 3389–3402[DOI] 23 Birney E, Clamp M, Durbin R. GeneWise and Genomewise. Genome
Res, 2004, 14: 988–995[DOI] 24 Katoh K, Toh H. Recent developments in the MAFFT multiple se-
quence alignment program. Brief Bioinform, 2008, 9: 286–298[DOI] 25 Kumar S, Tamura K, Nei M. MEGA3: Integrated software for Mo-
lecular Evolutionary Genetics Analysis and sequence alignment. Brief Bioinform, 2004, 5: 150–163[DOI]
26 Guindon S, Gascuel O. A simple, fast, and accurate algorithm to es-timate large phylogenies by maximum likelihood. Syst Biol, 2003, 52: 696–704[DOI]
27 Zhang Z, Li J, Zhao X Q, et al. KaKs_Calculator: calculating Ka and Ks through model selection and model averaging, Genomics pro-teomics & bioinformatics, Beijing Genomics Institute 2006, 4: 259–263
28 Nei M, Gojobori T. Simple methods for estimating the numbers of synonymous and nonsynonymous nucleotide substitutions. Mol Biol Evol, 1986, 3: 418–426
29 Yang Z. PAML: A program package for phylogenetic analysis by maximum likelihood. Comput Appl Biosci, 1997, 13: 555–556
30 Yang Z, Nielsen R, Goldman N, et al. Codon-substitution models for heterogeneous selection pressure at amino acid sites, Genetics, 2000, 155: 431–449
31 Thompson J D, Gibson T J, Plewniak F, et al. The CLUSTAL_X windows interface: Flexible strategies for multiple sequence align-ment aided by quality analysis tools. Nucleic Acids Res, 1997, 25: 4876–4882[DOI]
32 Yang Z, Nielsen R. Codon-substitution models for detecting molecu-lar adaptation at individual sites along specific lineages. Mol Biol Evol, 2002, 19: 908–917
33 Zhang J, Nielsen R, Yang Z. Evaluation of an improved branch-site likelihood method for detecting positive selection at the molecular level. Mol Biol Evol, 2005, 22: 2472–2479[DOI]
34 Glusman G, Yanai I, Rubin I, et al. The complete human olfactory subgenome. Genome Res, 2001, 11: 685–702[DOI]
35 Freitag J, Beck A, Ludwig G, et al. On the origin of the olfactory re-ceptor family: receptor genes of the jawless fish (Lampetra fluvi-atilis). Gene, 1999, 226: 165–174[DOI]
36 Cao Y, Oh B C, Stryer L. Cloning and localization of two multigene receptor families in goldfish olfactory epithelium. Proc Natl Acad Sci USA ,1998, 95: 11987–11992[DOI]
37 Irie-Kushiyama S, Asano-Miyoshi M, Suda T, et al. Identification of 24 genes and two Pseudogenes coding for olfactory receptors in Japanese loach, classified into four subfamilies: A putative evolu-tionary process for fish olfactory receptor genes by comprehensive phylogenetic analysis. Gene, 2004, 325: 123–135[DOI]
38 Floriano W B, Vaidehi N, Goddard W A 3rd, et al. Molecular mecha-nisms underlying differential odor responses of a mouse olfactory re-ceptor. Proc Natl Acad Sci USA, 2000, 97: 10712–10716[DOI]
39 Katada S, Hirokawa T, Oka Y, et al. Structural basis for a broad but selective ligand spectrum of a mouse olfactory receptor: Mapping the odorant-binding site. J Neurosci, 2005, 25: 1806–1815[DOI]
40 Ballesteros J A, Shi L, Javitch J A. Structural mimicry in G pro-tein-coupled receptors: implications of the high-resolution structure of rhodopsin for structure-function analysis of rhodopsin-like recep-tors. Mol Pharmacol, 2001, 60: 1–19
41 Singer M S. Analysis of the molecular basis for octanal interactions in the expressed rat 17 olfactory receptor. Chem Senses, 2000, 25: 155–165[DOI]
42 Vaidehi N, Floriano W B, Trabanino R, et al. Prediction of structure and function of G protein-coupled receptors. Proc Natl Acad Sci USA, 2002, 99: 12622–12627[DOI]
43 Francino M P. An adaptive radiation model for the origin of new gene functions. Nat Genet, 2005, 37: 573–577[DOI]
Copyright © 2022 FDOKUMEN