Occurrence of microcystin-producing cyanobacteria in Ugandan freshwater habitats
21
Occurrence of microcystin-producing cyanobacteria in Ugandan freshwater habitats William Okello 1,2 , Cyril Portmann 3 , Marcel Erhard 4 , Karl Gademann 3 , and Rainer Kurmayer 1,* 1 Austrian Academy of Sciences, Institute for Limnology, Mondseestrasse 9, 5310 Mondsee, Austria 2 National Fisheries Resources Research Institute (NaFIRRI), Plot No. 39/45 Nile Crescent, P.O. Box 343, Jinja, Uganda 3 Chemical Synthesis Laboratory, Swiss Federal Institute of Technology (EPFL), SB-ISIC-LSYNC, 1015 Lausanne, Switzerland 4 AnagnosTec GmbH, Am Mühlenberg 11, 14476 Potsdam, Germany Abstract Microcystins (MCs) are cyclic heptapeptides that are the most abundant toxins produced by cyanobacteria in freshwater. The phytoplankton of many freshwater lakes in Eastern Africa is dominated by cyanobacteria. Less is known, however, on the occurrence of MC producers and the production of MCs. Twelve Ugandan freshwater habitats ranging from mesotrophic to hypertrophic conditions were sampled in May and June of 2004 and April of 2008 and were analyzed for their physico-chemical parameters, phytoplankton composition, and MC concentrations. Among the group of the potential MC-producing cyanobacteria, Anabaena (0 - 10 7 cells ml −1 ) and Microcystis (10 3 - 10 7 cells ml −1 ) occurred most frequently and dominated in eutrophic systems. A significant linear relationship (n = 31, r 2 = 0.38, p < 0.001) between the Microcystis cell numbers and MC concentration (1.3-93 fg of MC cell −1 ) was observed. Beside [MeAsp 3 , Mdha 7 ]-MC-RR two new microcystins, [Asp 3 ]-MC-RY and [MeAsp 3 ]-MC-RY were isolated and their constitution assigned by LC-MS 2 . In order to identify the MC-producing organism in the water samples (i), the conserved aminotransferase domain part of the mcyE gene that is indicative of MC production was amplified by general primers and cloned and sequenced, and (ii), genus-specific primers were used to amplify the mcyE gene of the genera Microcystis, Anabaena, and Planktothrix. Only mcyE genotypes that are indicative of Microcystis sp. were obtained via the environmental cloning approach (337 bp, 96.1%-96.7% similarity to the Microcystis aeruginosa strain PCC7806). Accordingly, only the mcyE primers, which are specific for Microcystis, revealed PCR products. We concluded that Microcystis is the major MC-producer in Ugandan freshwater. Keywords eutrophication; Anabaena; Microcystis; toxicity; genetic diversity; mcyE; mcyB gene; microcystin-RY INTRODUCTION Uganda, with a total area of 241,000 km 2 astride the equator between latitude 1° 30′ S and 4° N and longitude 29° 30′ E and 35° E, has a significant amount of freshwater resources * Corresponding author: Rainer Kurmayer Austrian Academy of Sciences, Institute for Limnology, Mondseestrasse 9, 5310 Mondsee, Austria [email protected] Phone 0043 6232 3125 32 Fax 0043 6232 3578. Europe PMC Funders Group Author Manuscript Environ Toxicol. Author manuscript; available in PMC 2011 January 20. Published in final edited form as: Environ Toxicol. 2010 August ; 25(4): 367–380. doi:10.1002/tox.20522. Europe PMC Funders Author Manuscripts Europe PMC Funders Author Manuscripts
-
Upload
independent -
Category
Documents
-
view
1 -
download
0
Transcript of Occurrence of microcystin-producing cyanobacteria in Ugandan freshwater habitats

Occurrence of microcystin-producing cyanobacteria in Ugandanfreshwater habitats
William Okello1,2, Cyril Portmann3, Marcel Erhard4, Karl Gademann3, and RainerKurmayer1,*
1Austrian Academy of Sciences, Institute for Limnology, Mondseestrasse 9, 5310 Mondsee,Austria 2National Fisheries Resources Research Institute (NaFIRRI), Plot No. 39/45 NileCrescent, P.O. Box 343, Jinja, Uganda 3Chemical Synthesis Laboratory, Swiss Federal Instituteof Technology (EPFL), SB-ISIC-LSYNC, 1015 Lausanne, Switzerland 4AnagnosTec GmbH, AmMühlenberg 11, 14476 Potsdam, Germany
AbstractMicrocystins (MCs) are cyclic heptapeptides that are the most abundant toxins produced bycyanobacteria in freshwater. The phytoplankton of many freshwater lakes in Eastern Africa isdominated by cyanobacteria. Less is known, however, on the occurrence of MC producers and theproduction of MCs. Twelve Ugandan freshwater habitats ranging from mesotrophic tohypertrophic conditions were sampled in May and June of 2004 and April of 2008 and wereanalyzed for their physico-chemical parameters, phytoplankton composition, and MCconcentrations. Among the group of the potential MC-producing cyanobacteria, Anabaena (0 - 107
cells ml−1) and Microcystis (103 - 107 cells ml−1) occurred most frequently and dominated ineutrophic systems. A significant linear relationship (n = 31, r2 = 0.38, p < 0.001) between theMicrocystis cell numbers and MC concentration (1.3-93 fg of MC cell−1) was observed. Beside[MeAsp3, Mdha7]-MC-RR two new microcystins, [Asp3]-MC-RY and [MeAsp3]-MC-RY wereisolated and their constitution assigned by LC-MS2. In order to identify the MC-producingorganism in the water samples (i), the conserved aminotransferase domain part of the mcyE genethat is indicative of MC production was amplified by general primers and cloned and sequenced,and (ii), genus-specific primers were used to amplify the mcyE gene of the genera Microcystis,Anabaena, and Planktothrix. Only mcyE genotypes that are indicative of Microcystis sp. wereobtained via the environmental cloning approach (337 bp, 96.1%-96.7% similarity to theMicrocystis aeruginosa strain PCC7806). Accordingly, only the mcyE primers, which are specificfor Microcystis, revealed PCR products. We concluded that Microcystis is the major MC-producerin Ugandan freshwater.
Keywordseutrophication; Anabaena; Microcystis; toxicity; genetic diversity; mcyE; mcyB gene;microcystin-RY
INTRODUCTIONUganda, with a total area of 241,000 km2 astride the equator between latitude 1° 30′ S and4° N and longitude 29° 30′ E and 35° E, has a significant amount of freshwater resources
*Corresponding author: Rainer Kurmayer Austrian Academy of Sciences, Institute for Limnology, Mondseestrasse 9, 5310 Mondsee,Austria [email protected] Phone 0043 6232 3125 32 Fax 0043 6232 3578.
Europe PMC Funders GroupAuthor ManuscriptEnviron Toxicol. Author manuscript; available in PMC 2011 January 20.
Published in final edited form as:Environ Toxicol. 2010 August ; 25(4): 367–380. doi:10.1002/tox.20522.
Europe PM
C Funders A
uthor Manuscripts
Europe PM
C Funders A
uthor Manuscripts

covering approximately 16% of its surface area (UNESCO, 2005). Some of these freshwaterbodies are either naturally eutrophic e.g. L. George (Viner and Smith, 1973) or arebecoming increasingly eutrophic due to human activities, e.g. L. Victoria (Verschuren et al.,2001). In general, cyanobacteria have often been found to increase under eutrophicconditions.
Blooms formed by cyanobacteria have recently been reported throughout many parts of L.Victoria (Alweny, 2007). These blooms are a cause of concern to local water consumers,policy makers, as well as the National Water and Sewerage Cooperation (NW&SC) thatsupplies treated water nationally. In their statement to the Ugandan parliament, NW&SCindicated that 11 billion Ugandan shillings (7 million US dollars) would be required in 2008to treat green water. The fishermen reported that areas covered by cyanobacteriaaccumulating on the surface could not be used for fishing anymore. Small dead fish werealso seen floating close to the shoreline while the larger fish caught within the area appearedweak and stressed. In East Africa, massive fish kills were observed in the Nyanza Gulf ofLake Victoria (Kenya) in 1984, coinciding with the occurrence of cyanobacterial blooms(Ochumba, 1990). The toxins produced by cyanobacteria include neurotoxins, hepatotoxins,and irritant-dermal toxins. All of these cause acute harm to humans, animals, and wildlifeafter exposure (Chorus et al., 2000; Carmichael, 2001).
The most widely distributed hepatotoxins in freshwater are the microcystins (MCs). Theyare produced by the planktonic genera Anabaena, Anabaenopsis, Microcystis, Nostoc, andPlanktothrix (Sivonen and Jones, 1999). MCs are cyclic heptapeptides and share thecommon structure cyclo (- D-Ala(1) - X(2) - D-MeAsp(3) - Z(4) - Adda(5) - D-Glu(6) -Mdha(7)), where X and Z are variable L-amino acids (e.g. MC-LR refers to leucine andarginine in the variable positions of this peptide), D-MeAsp is D-erythro-β-iso-methyl-aspartic acid, Adda is (2S, 3S, 8S, 9S)-3-amino-9-methoxy-2,6,8-trimethyl-10-phenyldeca-4,6-dienoic acid, and Mdha is N-methyl-dehydroalanine. Structural variation hasbeen reported most frequently in positions 2, 4, and 7 of the molecule resulting in over 60structural variants that are characterized from field samples or isolated strains (Diehnelt etal., 2006). The elucidation and characterization of the gene cluster that is involved in MCsynthesis significantly increased our understanding of the regulation of toxin synthesis incyanobacteria (Dittmann et al., 1997; Tillett et al., 2000). It was only then that theinvestigation of the genetic basis of MC production both in the laboratory and in theenvironment became possible.
Considering the repetitive occurrence of algal blooms reported in Ugandan lakes,understanding the distribution of toxin-producing cyanobacteria in Ugandan freshwaters isessential. This will form the basis of estimating the health risks associated withcyanobacterial occurrence. A previous study reported the isolation of four MC-producingMicrocystis sp. strains from Kenya and Uganda (Haande et al., 2007). Since it is generallyknown that the bias introduced by strain isolation may be substantial (Wilson et al., 2005)we believe that field studies are required to provide the information that is necessary toestimate a potential health risk. The present paper reports the first results on the occurrenceof MC-producing cyanobacteria in relation to the environmental conditions and theproduction of MC in twelve Ugandan freshwaters ranging from mesotrophic to hypertrophicconditions.
MATERIALS AND METHODSSampling and nutrient analyses
Depth integrated water samples were taken in May and June 2004 from twelve freshwaterbodies (Site no.1-12, Table 1, Fig. 1) using a 2 liter horizontal van Dorn sampler by
Okello et al. Page 2
Environ Toxicol. Author manuscript; available in PMC 2011 January 20.
Europe PM
C Funders A
uthor Manuscripts
Europe PM
C Funders A
uthor Manuscripts
sampling the water column every meter. To confirm the results obtained during this periodthe site no. 4, 5, 7, 10, and 11 were re-sampled in April 2008. In parallel, algae wereconcentrated by taking vertical hauls with a phytoplankton net (30 μm mesh size). Sampleswere filtered using Whatman GF/C filters. For chlorophyll a analysis, filters were storedfrozen (−20°C). For MC and DNA analysis filters were dried overnight (50°C) and storedfrozen (−20°C). The filtrates were subsequently filtered through membrane filters (0.45 μm)for the analyses of dissolved nutrients. Soluble reactive phosphorus (SRP), nitrate (NO3-N),and ammonia (NH4-N) were determined by using the ammonium molybdate method(Wetzel and Likens, 2000), sodium-salycilate method (Müller and Wiedemann, 1955), andindophenol blue method (Krom, 1982), respectively. Soluble reactive silica (SRSi) wasdetermined as yellow molybdate-silicic acid (Wetzel and Likens, 2000). The totalphosphorus (TP) was determined by persulphate digestion from the aliquots of the samplesand analyzed as SRP.
Lake trophic states definitionThe trophic state was assigned according to Vollenweider and Kerekes (1982): Mestrophic:TP (10 - 35 μg L−1), chlorophyll a (3 - 8 μg L−1), secchi disc depth (3 - 1.5 m); eutrophic:TP (35 - 100 μg L−1), chlorophyll a (8 - 25 μg L−1), secchi disc depth (1.5 - 0.7 m);hypertrophic: TP (≥ 100 μg L−1), chlorophyll a (≥ 25 μg L−1), secchi disc depth (≤ 0.7 m).
Phytoplankton composition and abundanceChlorophyll a analysis was based on hot ethanol extraction (ISO, 1992). Algae were countedfrom Lugol fixed samples by using the inverted microscope, as described (Wetzel andLikens, 2000). Cyanobacteria were identified according to the morphological keys publishedby Talling (1987), Komárek and Kling (1991), and Komárek and Anagnostidis (1999). Atleast 400 specimens of the dominant phytoplankton genera were counted at 400×magnification. Most of the genera were counted as single cells (Anabaena, Chroococcus,Merismopedia, Microcystis; the pennate diatom Nitzschia and unidentified centric diatoms,green algae (including desmids) and cryptomonads). Filamentous cyanobacteria werecounted as filaments (Planktolyngbia, Pseudanabaena). Aphanocapsa was counted ascolonies: cells from 20 of these colonies were counted in order to determine the averagenumber of cells per colony. Microcystis was counted as single cells and could bediscriminated from other cyanobacteria due to morphological characters, such as cell size(2.5-3.6±0.2 (SE)-4.9μm) and the formation of small colonies. In order to compare thereproducibility of the Microcystis counting method between two different labs (Kampala vs.Mondsee), a number of depth integrated and plankton net samples (No 4, 5, 7, 11) wererepeatedly counted in September 2004 (Kampala) and in November 2006 (Mondsee). Onaverage the Microcystis cell numbers as determined in November 2006 accounted for76±40% (1 SD, n=13) of the cell numbers as determined in September 2004. This impliesthat Microcystis cells could be reliably identified among other phytoplankton under aninverted microscope. The biovolume was calculated based on the measured dimensions ofcells/filaments (Wetzel and Likens, 2000).
Microcystin analysisThe extraction of MC from filters was performed as described (Kurmayer et al., 2003). Onehundred μL of the extracts were injected into high performance liquid chromatographycoupled to diode array detection (HPLC-DAD) and MCs were identified by their retentiontime and characteristic absorption spectra according to Lawton et al., (1994) and Fastner etal., (1999). MCs were quantified at 240 nm and the concentrations of all the MC variantswere determined as concentration equivalents of [D-MeAsp, D-Mdha]-MC-LR(Cyanobiotech GmbH, Berlin, Germany). HPLC peaks identified as MC were collectedmanually and were analyzed by matrix-assisted laser desorption/ionization time-of-flight
Okello et al. Page 3
Environ Toxicol. Author manuscript; available in PMC 2011 January 20.
Europe PM
C Funders A
uthor Manuscripts
Europe PM
C Funders A
uthor Manuscripts

mass spectrometry (MALDI-TOF MS) as described in Kurmayer et al., (2004) andidentified by the post source decay (PSD) fragment structure analysis as described in Erhardet al., (1997) and Fastner et al., (1999). The constitution of the new MC variants wasassigned by ESI-MS and ESI-MS2 experiments that were performed on a Q-TOF Ultimamass spectrometer (Waters, Milford, MA.) equipped with a nanospray source and operatedin the positive ionization mode under the control of MassLynx 4.1. The sample was loadedinto a PicoTip Emitter (New Objective, Woburn, MA). Single MS measurements werefollowed by MS2 experiments on the selected precursor ions. Fragmentation was operatedby manually increasing the collision energy (4 to 60) to provide optimum fragment ioncoverage over the mass range. External calibration was performed with glu-fibinopeptide-B(standard error 50 ppm) and an additional post-calibration was applied when needed.Assignment of fragments by collision-induced dissociation (CID) enhanced PSD was carriedout following a published procedure (Diehnelt et al., 2006).
Genetic analysis of the field samplesFor DNA extraction, 25 to 200 mL of the depth integrated samples and 25 to 60 mL of theplankton net samples were filtered using Whatman GF/C filters. The filters were dried in theoven at 50°C, overnight. DNA was extracted by the phenol-chloroform method as described(Kurmayer et al., 2003). The DNA was diluted to 2 - 20 ng μL−1 for PCR analyses.
A part of the mcyE gene region was amplified by PCR using the HEPF/HEPR primers(Jungblut and Neilan, 2006). These primers bind to the conserved regions of theaminotransferase domain and, therefore, amplify the mcyE genes of all the MC-producingcyanobacteria (472 bp). Subsequently, the genus-specific primers mcyE-F2/F8 (specific forMicrocystis; 370 bp), mcyE-F2/12R (specific for Anabaena; 370 bp) and mcyE-F2/plaR3(specific for Planktothrix; 370 bp) were used to detect the respective MC-producing species(Rantala et al., 2006). These primers bind to the adenylation domain of the mcyE genewhich is responsible for the activation of the strictly conserved glutamic acid residue duringMC synthesis (Tillett et al. 2000).
For three sites (no. 4, 7 and 11) sampled in 2008, the PCR products that were obtained byusing the HEPF/HEPR primer pair were cloned using the pDrive Cloning Vector system(Qiagen, VWR, Austria) according to the manufacturer's instructions. For the constructionof a clone library, clones were picked for each of the samples and analyzed by usingrestriction fragment length polymorphism (RFLP) using two restriction enzymes (BsuRI andTru1I) following standard protocols. Using the NEBcutter program (Vincze et al., 2003), therestriction of mcyE of the genus Microcystis (472 bp, PCC7806, AF183408) resulted inthree fragments (restriction type A: 176/160, 92, 18/16/8 bp) that were visualized usingethidium-bromide staining and electrophoresis in 2.0% agarose in 0.5× TBE-buffer. Incontrast, the same restriction analysis for mcyE (472 bp) of the genus Anabaena (strainAnabaena 90, AY212249) resulted in two fragments only (352, 110, 8 bp (invisible),denoted as the restriction type B. While the mcyE gene is generally more conserved anduseful to detect all MC-producing cyanobacteria, this gene region cannot reveal the geneticdiversity within a certain genus on a subpopulation level (Rantala et al., 2004; Jungblut andNeilan, 2006). Consequently the tox4F/tox4R primers (Kurmayer et al., 2002) amplifyingthe first adenylation domain of the mcyB gene in Microcystis (mcyBA1, 1313 bp) were usedto estimate the genetic diversity within the MC-producing Microcystis subpopulation. Thetox4F/tox4R PCR products were cloned and the clones were screened by restriction usingBsuRI. Following the NEBcutter program, the BsuRI digestion of mcyBA1 (1313 bp) of theMicrocystis strain PCC7806 (AF183408, representing mcyB1(B), Mikalsen et al., 2003)resulted in two fragments (restriction type I: 973, 340 bp). In contrast, the recombinationtype mcyB1(C), (e.g. strain HUB524, Z28338) revealed one much longer and one muchshorter fragment (restriction type II: 1236, 77 bp).
Okello et al. Page 4
Environ Toxicol. Author manuscript; available in PMC 2011 January 20.
Europe PM
C Funders A
uthor Manuscripts
Europe PM
C Funders A
uthor Manuscripts

From the same sites twelve Microcystis strains were isolated using standard platingprocedures as has been described (Okello, 2004). Six strains were found to contain mcyB(strains no: 1B5, 2D6, 18A8, 20A2, 6C5, 20A5, access no. EU014158-EU014163), and thismcyB genotype was not digested by BsuRI (restriction type III). Both mcyE and mcyBenvironmental sequences that were obtained from various environmental clones identifiedby RFLP were submitted to the DDBJ/EMBL/GenBank database (access. no. FJ429838-FJ429844).
In order to analyze all of the field samples for the occurrence of potentially MC-producingMicrocystis, a PCR test that allows for the detection of lowest Microcystis cell densities wasrequired. In order to check for the quality of the extracted DNA and the presence of potentialPCR inhibitors a gene region part of a housekeeping gene was amplified in parallel to thePCR amplifying the mcyB gene. Primers specified to amplify the intergenic spacer region ofthe phycocyanin operon (PC-IGS) of Microcystis sp. were designed by aligning thesequences of PC-IGS (576 bp) from the twelve freshly isolated Microcystis strains (strainsno: R14, 1B5, 2D6, 18A8, R50, 2A3, 20A2, 21A1, 17B7, 6C5, 19G6, 20A5, access no.EU014146-EU014157). In addition, 128 Microcystis sequences of PC-IGS from the DDBJ/EMBL/GenBank (10 June 2007) were included in a multiple sequence alignment(ClustalW2) to design the primer pair: MaPCnewfwd, 5′-GGAGCTTCCGTAGCTGC-3′(57.6°C), and MaPCnewrev, 5′-TGCAATAAGTTTCCTACGGT-3′ (53.5°C), yielding atotal amplification fragment of 192 bp. Pilot experiments showed that these primers werespecific to PC-IGS of Microcystis. The six freshly isolated Microcystis strains that werefound to contain mcyB (1312 bp) were aligned with eleven sequences from entries in theDDBJ/EMBL/GenBank (10 June 2007) representing the two recombination types that werereported within mcyB of Microcystis sp. (mcyB1 (B), mcyB1(C), Mikalsen et al., 2003).The following primers were designed: MamcyBnewfwd, 5′-GGATATCCTCTCAGATTCGG-3′ (57.3°C), and MamcyBnewrev, 5′-CTGATGTATAAATAACATAGGCTAAA-3′ (55.3°C) yielding a total amplificationfragment of 188 bp for both recombination types (Mikalsen et al., 2003). For both PC-IGSand the mcyB primers, the lower limit of detection was equivalent to two cells ofMicrocystis strain 18A8.
In general, PCR amplifications from field samples were carried out in 20 μL volumescontaining 2 μL PCR buffer (Qiagen, Austria), 1.2 μL MgCl2 (25 mM), 0.6 μLdeoxynucleotide triphosphates (10 μM each, MBI Fermentas, Germany), 1 μL of eachprimer (10 pmol), 0.1 μL Taq DNA polymerase (Qiagen), 13.6 μL sterile Millipore waterand 0.5 μL of 2 - 20 ng μL−1 DNA. The PCR cycling conditions for the two separateregions of the mcyE gene were performed as described (Jungblut and Neilan, 2006; Rantalaet al., 2006). For the PCR amplifying Microcystis specific PC-IGS and mcyB, the thermalcycling protocol included an initial denaturation step at 94°C for 3 min, followed by 40cycles of 94°C for 30 s, 50°C for 30 s, and 72°C for 1 min. PCR products (4 μL of thereaction mix) were visualized by ethidium-bromide staining and electrophoresis in 2.0%agarose in 0.5× TBE-buffer.
RESULTSTrophic characterization of the sampling sites
In the swamp sample (no. 1) the turbidity was high (secchi depth < 10 cm; Table 1) and nochlorophyll a was detected. The three Crater lakes (no. 2, 3, 6) and L. Nabugabo (no. 8)showed low concentrations of chlorophyll a (5-13 μg L−1) resulting in high transparency (>1 m) suggesting a mesotrophic status. In two of the Crater Lakes (no. 2, 3), however, highTP concentrations were recorded, co-occurring with high SRP and NH4-N concentrations.Therefore, they were classified as eutrophic lakes. All three sites (no. 9, 10, and 11) from L.
Okello et al. Page 5
Environ Toxicol. Author manuscript; available in PMC 2011 January 20.
Europe PM
C Funders A
uthor Manuscripts
Europe PM
C Funders A
uthor Manuscripts
Victoria were classified as eutrophic. The highest chlorophyll a values were recorded in L.George (no. 4), L. Edward (no. 5), and L. Mburo (no. 7) and in Jinja pond (no. 12), whichindicates hypertrophic conditions. Correspondingly, the secchi depths were the lowest (< 0.5m) and the pH was the highest under hypertrophic conditions.
Phytoplankton species composition and abundanceThe total biovolume estimated via the microscopical counting correlated significantly withthe chlorophyll a concentration (R2 = 0.76, n = 37). Five major phytoplankton classes wereobserved: Cyanobacteria, green algae and desmids, diatoms, and cryptomonads (Fig 2A).Cyanobacteria occurred in all of the water bodies. The other phytoplankton classes weregenerally of minor importance. The Crater Lakes (no. 2, 3) and mesotrophic L. Nabugabo(no. 8) had the lowest biovolume of cyanobacteria and mostly contained diatoms, i.e. centricdiatoms and Nitzschia (no. 2, 3) or green algae/desmids, i.e. Chlorella, Cosmarium, andStaurastrum (no. 8). Cyanobacterial dominance was only observed under eutrophic andhypertrophic conditions (no. 4, 5, 7, 9, 10, 11, and 12), including the genera Anabaena,Aphanocapsa, Chroococcus, Merismopedia, Microcystis, Planktolyngbia, andPseudanabaena (Fig. 2B). Anabaena was present in the Crater lakes (no. 2, 3) and in thedeep eutrophic L. Victoria (no. 9-11), while Aphanocapsa occurred in both the hypertrophicshallow lakes (no. 4, 5, 7) and the deep eutrophic L. Victoria (no. 9-11). Microcystis wasmost abundant in the hypertrophic shallow lakes (no. 4, 5, 7). In summary, the dominance ofcyanobacteria was positively related with the trophic situation.
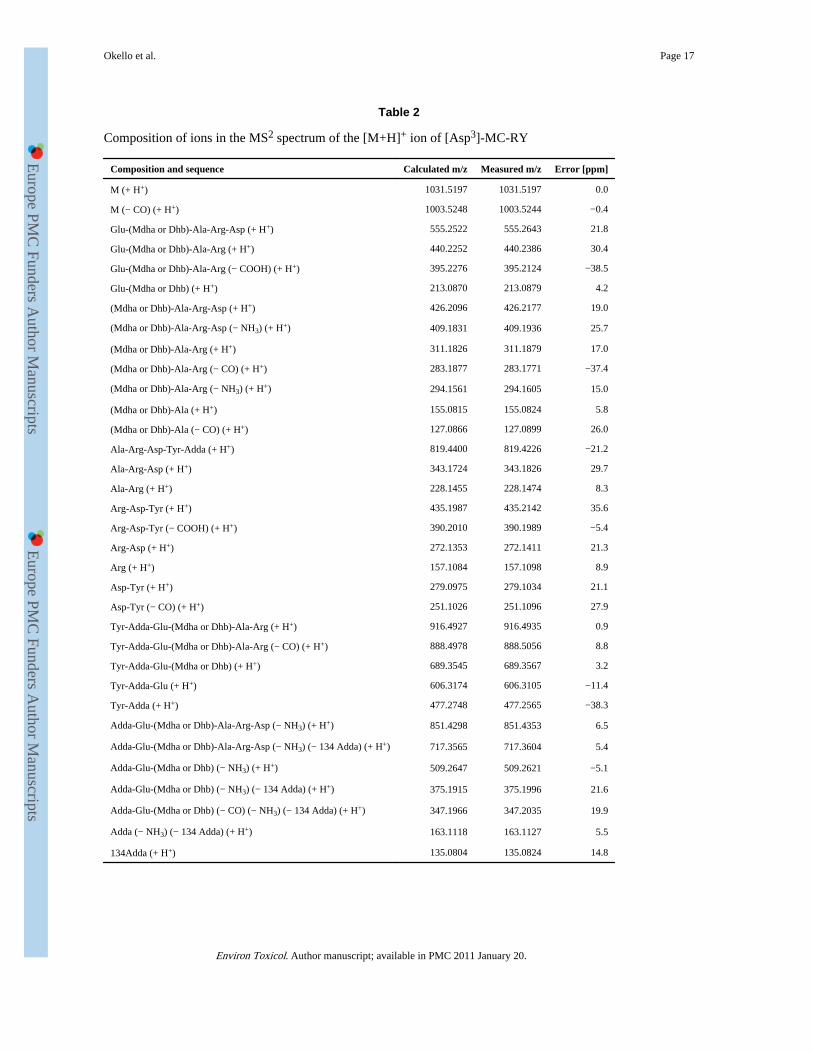
Microcystin analyses of the field samplesMCs were detected in plankton net samples only, i.e. in five plankton net samples in 2004(no. 4, May; no. 5, May and June; no. 7, May and June) and in all five plankton net samplesin 2008. MC 1 [molar weight 1038 (M+H+)] occurred in all samples containing MC andeluted at 15.6 min and was identified by post source decay analysis of the fractionated peakas [D-MeAsp3, Mdha7]-MC-RR. In addition, the MCs extracted from the plankton netsamples (L. Edward, L. George, L. Mburo, June 2004, 2008) eluted at 21.7 min [MC 2,molar weight 1031 (M+H+)] and 23.2 min [MC 3, molar weight 1045 (M+H+)]. MC 2 and 3were also identified in aqueous methanolic extracts of the Microcystis strains 2D6, 6C5,18A8 isolated from L. Edward and L. Mburo. The original UV spectrum as well as the firstorder derivative of the peak apex showed a close match with [MeAsp3, Mdha7]-MC-YR,which is available from the spectrum library. However, MC 2 and MC 3 differed in theretention time from [MeAsp3, Mdha7]-MC-YR. The sequence and constitution of MC 2 andMC 3 were investigated by LC-MS2. CID enhanced PSD produced 34 and 33 fragments forMC 2 and MC 3, respectively, detected with a mass accuracy of < 50 ppm (Tables 2 and 3).The amino acid at position 7 was assigned as either Mdha or Dhb. The distinction betweenthese isomers is difficult by MS, as D labelling experiments on MC 2 and MC 3 wereinconclusive. The assignment of MC 2 as [Asp3]-MC-RY was based on fragments such as[Ala-Arg-Asp+H]+ (343.1826), [Ala-Arg+H]+ (228.1474), [Mdha or Dhb-Ala-Arg+H]+
(311.1879) and [Tyr-Adda-Glu+H]+] (606.3105), [Tyr-Adda +H]+] (477.2565) and manyothers (Table 2). The assignment of MC 3 as [MeAsp3]-MC-RY was based on fragmentssuch as Ala-Arg-MeAsp+H]+ (357.2023), [Ala-Arg-NH3+H]+ (211.1247), [Mdha or Dhb-Ala-Arg+H]+ (311.1938) and [MeAsp-Tyr+H]+] (293.1255), [Tyr-Adda +H]+] (477.2628),[Arg-MeAsp-Tyr+H]+ (449.2364) and many others (table 3). These two MC variants havenot yet been described in the literature, to the best of our knowledge, and thus constitute newmicrocystins.
There was a linear relationship between the Microcystis cell concentrations and the total MCconcentrations: y = 0.03x + 3.54 (R2 = 0.38, n = 31, p < 0.001, Fig. 3), where y is the MC
Okello et al. Page 6
Environ Toxicol. Author manuscript; available in PMC 2011 January 20.
Europe PM
C Funders A
uthor Manuscripts
Europe PM
C Funders A
uthor Manuscripts

concentration in ng ml−1 and x is the cell concentration ml−1. In contrast, the MCconcentrations were found to vary independently from the Anabaena cell concentrations.
Identification of microcystin producers and genetic diversityWith the exception of a plankton net sample from L. Mburo (June 2004), all of the samplesthat contained detectable MCs revealed PCR products for mcyE by using HEPF/HEPRprimers. In order to identify the MC-producing genus, further PCR analyses were performedusing the Microcystis (mcyE-F2/F8) and Anabaena (mcyE-F2/12R) and Planktothrix(mcyE-F2/plaR3) specific primers. In all of the cases, the mcyE products that are indicativeof Microcystis were obtained from the plankton net samples (Table 4), while no PCRproducts that are indicative of mcyE of Anabaena were obtained.
Three samples (lakes George, Mburo and Victoria-Napoleon, no. 4, 7, 11) revealed abundantMicrocystis but also showed a frequent occurrence of Anabaena (Fig. 2B). Using the HEPF/HEPR primers, the mcyE gene was amplified and the clones were analyzed by RFLP. In thevast majority of the clones (n=165), only restriction type A, which is indicative ofMicrocystis, was found (Table 5). No restriction type B, which is indicative of mcyE ofAnabaena, was obtained. Only in L. Mburo three clones were not digested (restriction typeC). Those sequences could not be assigned and consequently restriction type C wasconsidered an unspecific PCR product. Eleven clones of restriction type A were sequenced(337 bp) and revealed a 96.1-96.7% similarity to the M. aeruginosa strain PCC7806,AF183408.
In order to characterize the genetic diversity within MC-producing Microcystis, the firstadenylation domain of the mcyB gene was amplified by PCR, cloned, and then the cloneswere screened by RFLP. Restriction type I, which is indicative of mcyB1(B) and restrictiontype III (undigested), occurred, while restriction type II, which is indicative of mcyB1(C),was not detected. Three environmental clones that were assigned to restriction type I had thehighest sequence similarity to the strain PCC7806 (1190 bp, 97.2-98.1% similarity). Incontrast, clones that were assigned to restriction type III had the highest sequence similarityto the strains 18A8, 20A2, 20A5, and 2D6 (1190 bp, 97.4-98.4%). Restriction type I differedby 24.7-25.7% of the nucleotides (1190 bp) from restriction type III.
Distribution of microcystin-producing MicrocystisUsing the PC-IGS primers that were designed in the present study, the distribution ofMicrocystis was studied in all of the field samples that have been analyzed forphytoplankton composition under the microscope (Table 4). PCR products were obtainedfrom all of the samples containing Microcystis as inferred from the microscope. Vice versain the swamp (no. 1) and in Nyabikere Crater Lake (no. 2), no PC-IGS of Microcystis wasdetected, which was in accordance with the microscopical analysis. Except for the depthintegrated sample from the Nkuruba Crater Lake, all of the samples containing PC-IGS,indicative of Microcystis, were found to contain mcyB.
DISCUSSIONEnvironmental parameters and phytoplankton composition
We recorded high concentrations of nutrients, but low concentrations of chlorophyll a andphytoplankton in the two Crater lakes (no. 2 and 3). Correspondingly, Kizito et al., 1993reported low chlorophyll a, but high nutrient concentrations for Lake Nkuruba (no. 3). Thehighest NH4-N concentration that was observed in the Crater lakes may indicate significantvertical stratification, since the nitrification of ammonia to nitrate requires oxygen. During atwo-year study, Chapman et al., 1998 reported that the average anoxia (0 mg L−1 O2) in
Okello et al. Page 7
Environ Toxicol. Author manuscript; available in PMC 2011 January 20.
Europe PM
C Funders A
uthor Manuscripts
Europe PM
C Funders A
uthor Manuscripts

Lake Nkuruba (no. 3) was down to nine meters. In this study, it is possible that a part of theanoxygenic water column with the highest ammonium concentrations was sampled resultingin a higher average ammonium concentration due to the vertical integration down to 15 m.Despite its shallowness, L. Nabugabo (no. 8) also had the lowest phytoplankton density,which was dominated by green algae and desmids. The soils of the catchment area of LakeNabugabo have a very low salt content, possibly resulting in low calcium carbonate levelsand the lowest conductivity (Beadle, 1981). A belt of mosses (Sphagnum, Miscanthidiumviolaceum) that is surrounding the lake has been suggested to indicate more acidicconditions (Kateyo, 2006). The general low ionic content in combination with a low nutrientconcentration might be responsible for the dominance of green algae and desmids.
The cyanobacterial dominance in L. Victoria (no. 9-11) as well as in Jinja Pond was linkedto a high concentration of nutrients. Kling et al., 2001 reported that the eutrophic conditionin L. Victoria supported a high algal biomass that has risen by a factor of 4 to 5 since the1960s. Hecky (1993), Lipiatou et al., (1996) and Verschuren et al., (2001) reported a shift indominance from diatoms and green algae to cyanobacteria. Mugidde et al., (2003) suggestedthat because of their ability to fix nitrogen cyanobacteria may particularly increase in L.Victoria in response to phosphorus loading and increasing nitrogen limitation.
In all the hypertrophic shallow lakes (no. 4, 5, and 7) Microcystis was abundant. These threelakes situated within the national park had a high pH ranging from 8 to 10. Cyanobacteriaare better competitors due to their efficient carbon-concentrating mechanism at a higher pH(Shapiro 1984). In addition these shallow waters are polymictic while at calm conditions ahigh insolation will penetrate the whole water column. In general these physical conditionsfavour the genus Microcystis sp. at the expense of other genera and very often Microcystissp. is able to dominate phytoplankton for long times (Reynolds et al., 2002). The dominanceof Microcystis sp. probably remained unaltered in Lake George for decades (Ganf, 1974).
Microcystin analysesIn the present study, MCs were found in plankton net samples that were obtained from fivesites (no. 4, 5, 7, 10, and 11). In contrast no MCs were found in aqueous-methanolic extractsobtained from depth-integrated samples. In general, the high silt content that was cloggingthe filters during the filtration process resulted in low filtration volumes (50-200 ml)increasing the lower limit of detection for MC by HPLC significantly above 1 μg L−1. It isexpected that microcystin concentrations would have been in the measurable range, if morephytoplankton biomass would have been extracted. Indeed in the phytoplankton net sampleswith higher Microcystis cell numbers ranging from 2×10⁵ - 1×10⁷ cells mL−1, MCs wererecorded more frequently. Nevertheless, in plankton net samples, the cellular MC contentwas found to be within the range that was also observed in other field studies previously (1.3- 93 fg MC-LR equivalent cell−1, Kurmayer et al. 2003). It is, therefore, concluded that thenet samples were useful for analyzing the mean cellular MC content. These results are inagreement with other studies that document, by means of plankton net samples, that wholewater conditions can be adequately represented (Rogalus and Watzin, 2008).
Genetic diversity and microcystin net productionIn most of the samples, the genera Anabaena, Aphanocapsa, Chroococcus, Merismopedia,Microcystis, Planktolyngbia, and Pseudanabaena were identified under the microscope.Among those, Anabaena, Chroococcus, Microcystis, and Pseudanabaena have been reportedto produce MCs (Jungblut and Neilan, 2006; Sivonen and Börner, 2008). We used theconserved HEPF/HEPR primer pair to amplify all the potential MC-producingcyanobacteria. Surprisingly, only PCR products that are indicative of mcyE of Microcystiswere obtained. Correspondingly, the independent application of the genus specific mcyE
Okello et al. Page 8
Environ Toxicol. Author manuscript; available in PMC 2011 January 20.
Europe PM
C Funders A
uthor Manuscripts
Europe PM
C Funders A
uthor Manuscripts
primers revealed the occurrence of MC-producing Microcystis only. Consequently,Anabaena and other taxa, although rather abundant, did not have the potential to produceMC. In other studies, the populations of Microcystis from all five continents typically havebeen found to contain mcy genotypes as well as MCs (Sivonen and Börner, 2008). Incontrast, other taxa show a more irregular pattern of MC production, for example MC-producing Anabaena have been reported from Europe, Canada, and North Africa, but notfrom Australia (Sivonen and Jones, 1999; Sivonen and Börner, 2008).
Using the more sensitive primers, all of the Microcystis populations were found to be able toproduce MCs. This result is in agreement with other studies showing that Microcystispopulations always contain the mcy genotype. For example, in a European survey includingnine water bodies in seven countries, mcyA and mcyB genes as a part of the Microcystispopulation were always detected (Via-Ordorika et al., 2004). Within mcyBA1, the highestgenetic diversity was found (24.7-25.7%), which has also been reported for populationssampled in Europe, e.g. Lake Wannsee (Kurmayer et al., 2002) and in Scandinavia(Mikalsen et al., 2003). It is generally accepted that this highest genetic diversity resultedfrom frequent recombination processes involving the exchange of shorter fragments (< 1000bp) of DNA. Besides for the mcyBA1 restriction type I showing the highest similarity to theMicrocystis strain PCC7806, a new mcyBA1 restriction type III that is indicative of amcyBA1 genotype, which was so far unknown from the strains of the northern temperatehemisphere (Mikalsen et al., 2003), was found. In contrast, restriction II mcyB (C) was notdetected. Notably, from the same mcyBA1 restriction type two new microcystins, [Asp3]-MC-RY and [MeAsp3]-MC-RY, were isolated. The genetic variation that is causing thebiosynthesis of MC-RY remains to be elucidated.
Although the linear relationship between the Microcystis cell numbers and the total MCconcentration was highly significant, as much as 62% of the variation remained unexplained(Fig. 3). Other studies documenting a significant linear relationship between the Microcystiscell concentration and the total MC concentration, also report a relatively high proportion ofunexplained variation (Kotak et al., 2000; Ozawa et al. 2005; Hotto et al., 2008). It isemphasized that so far no effort has been made to identify the contribution of systematicerrors in cell counting and/or analysis of MC concentrations to the unexplained part ofvariation that is observed. However, during a consecutive field study sampling the samewater bodies during one year consistent lake specific differences in MC cell quotas wereobserved, e.g. MC cell quotas obtained from Lake George were on average 20-fold lowerwhen compared with MC cell quotas obtained from Lake Mburo. We are currentlyinvestigating this phenomenon, however, lake specific differences in MC cell quotas couldexplain the relatively large part of unexplained variation observed.
CONCLUSIONThe trophic conditions and water depth were of profound importance for the occurrence ofMC producing cyanobacteria. Seven of the sampling sites were nutrient rich. However, onlythe shallow sites had favorable environmental conditions that enabled MC-producingcyanobacteria to flourish. From the extensive genetic analysis, it is concluded thatMicrocystis sp. constitute the major MC producing taxon in Ugandan freshwaters. BesideMC-RR the new MC-RY variants constitute abundant structural variants in thephytoplankton dominated by Microcystis sp. in Uganda. However, the annual MCproduction rate in tropical freshwater systems will exceed that of comparable systems in thetemperate region due to the generally higher primary production rate.
Okello et al. Page 9
Environ Toxicol. Author manuscript; available in PMC 2011 January 20.
Europe PM
C Funders A
uthor Manuscripts
Europe PM
C Funders A
uthor Manuscripts

AcknowledgmentsWe are most grateful to Gerold Winkler and Sabine Wanzenböck for their administrative work throughout theInternational Postgraduate Training Course in Limnology (IPGL). Johanna Schmidt provided assistance in fieldsampling and strain isolation. Guntram Christiansen (FWF grant P18185) assisted in cloning and sequencing. Thisstudy was funded by the North-South-Dialogue program through a Ph.D. fellowship awarded to William Okello.The study (EC 650) was approved by the Uganda National Council for Science and Technology in conjunction withthe Uganda Wildlife Authority. The sampling during 2004 was financed by the IPGL, while sampling during 2008was partly supported by the British Ecological Society and International Foundation for Sciences. K.G. is aEuropean Young Investigator (EURYI) and thanks the Swiss National Science Foundation for support (PE002—117136/1). We thank Dr. Laure Menin (MS Service ISIC EPFL) for skilful technical assistance.
REFERENCESAlweny, S. Lake Victoria is critically sick. The Daily Monitor; Uganda: 2007. (Online) [cited 2008
Sept 1] Available from: http://www.monitor.co.ug/artman/publish/insights/Lake_Victoria_is_critically_sick_52775.shtml
Beadle, LC. The Inland Waters of Tropical Africa. An introduction to tropical limnology. 2nd Edition.Longman; London: 1981. p. 475
Carmichael WW. Health effects of toxin-producing cyanobacteria: “The cyanoHABs”. Hum Ecol RiskAssess. 2001; 7:1393–1407.
Chapman LJ, Chapman CA, Crisman TL, Nordlie FG. Dissolved oxygen and thermal regimes of aUgandan crater lake. Hydrobiologia. 1998; 385:201–211.
Chorus I, Falconer IR, Salas HJ, Bartram J. Health risks caused by freshwater cyanobacteria inrecreational waters. J Toxicol Environ Health, Part B. 2000; 3:323–347.
Diehnelt CW, Dugan NR, Peterman SM, Budde WL. Identification of microcystin toxins from a strainof Microcystis aeruginosa by liquid chromatography introduction into a hybrid linear ion trap-fourier transform ion cyclotron resonance Mass Spectrometer. Anal Chem. 2006; 78:501–512.[PubMed: 16408933]
Dittmann E, Neilan BA, Erhard M, von Döhren H, Börner T. Insertional mutagenesis of a peptidesynthetase gene that is responsible for hepatotoxin production in the cyanobacterium Microcystisaeruginosa PCC 7806. Mol Microbiol. 1997; 26:779–787. [PubMed: 9427407]
Erhard M, von Döhren H, Jungblut P. Rapid typing and elucidation of new secondary metabolites ofintact cyanobacteria using MALDI-TOF mass spectrometry. Nature Biotechnol. 1997; 15:906–909.[PubMed: 9306409]
Fastner J, Erhard M, Carmichael WW, Sun F, Rinehart KL, Rönicke H, Chorus I. Characterization anddiversity of microcystins in natural blooms and strains of the genera Microcystis and Planktothrixfrom German freshwaters. Arch Hydrobiol. 1999; 145:147–163.
Ganf GG. Diurnal mixing and the vertical distribution of phytoplankton in a shallow equatorial lake(Lake George, Uganda). J Ecol. 1974; 62:611–629.
Haande S, Ballot A, Rohrlack T, Fastner J, Wiedner C, Edvardsen B. Diversity of Microcystisaeruginosa isolates (Chroococcales, Cyanobacteria) from East-African water bodies. ArchMicrobiol. 2007; 188:15–25. [PubMed: 17333126]
Hecky RE. The eutrophication of Lake Victoria. Verh Internat Verein Limnol. 1993; 25:39–48.
International Organisation for Standardisation. Water quality. Measurement of biochemicalparameters. International Organisation for Standardisation: ISO 10260; Geneva (Switzerland):1992.
Hotto AM, Satchwell MF, Berry DL, Gobler CJ, Boyer GL. Spatial and temporal diversity ofmicrocystins and microcystin-producing genotypes in Oneida Lake, NY. Harmful Algae. 2008;7:671–681.
Jungblut AD, Neilan BA. Molecular identification and evolution of the cyclic peptide hepatotoxins,microcystin and nodularin, synthetase genes in three orders of cyanobacteria. Arch Microbiol.2006; 185:107–114. [PubMed: 16402223]
Kateyo E. Biodiversity of an interface zone of a nutrient-deficient lake (Nabugabo) in Uganda:macrophytes. Afr J Ecol. 2006; 45:130–134.
Okello et al. Page 10
Environ Toxicol. Author manuscript; available in PMC 2011 January 20.
Europe PM
C Funders A
uthor Manuscripts
Europe PM
C Funders A
uthor Manuscripts

Kizito YS, Nauwerck A, Chapman LJ, Koste W. A limnological survey of some western Ugandacrater lakes. Limnologica. 1993; 23:335–347.
Kling, HJ.; Mugidde, R.; Hecky, RE. Recent changes in phytoplankton community of Lake Victoria inresponse to eutrophication. In: Munawar, M.; Hecky, RE., editors. The Great Lakes of the World(GLOW): Food-web, health and Integrity. Backhuys Publisher; Leiden: 2001. p. 47-65.
Komárek, J.; Anagnostidis, K. Cyanoprokaryota, 1. Teil Chroococcales. Gustav Fischer Verlag; Jena:1999. p. 225-236.
Komárek J, Kling H. Variation in six planktonic cyanophyte genera in Lake Victoria (East Africa).Algol Stud. 1991; 61:21–45.
Kotak BG, Lam AKY, Prepas EE, Hrudey SE. Role of chemical and physical variables in regulatingmicrocystin-LR concentration in phytoplankton of eutrophic lakes. Can J Fish Aquat Sci. 2000;57:1584–1593.
Krom MD. Spectrophotometric determination of ammonia: a study of a modified Bertholet reactionusing salicylate and dichlorisocyanurate. Analyst. 1982; 105:305–316.
Kurmayer R, Dittmann E, Fastner J, Chorus I. Diversity of microcystin genes within a population ofthe toxic cyanobacterium Microcystis spp. in Lake Wannsee (Berlin, Germany). Microb Ecol.2002; 43:107–118.
Kurmayer R, Christiansen G, Chorus I. The abundance of microcystin-producing genotypes correlatespositively with colony size in Microcystis and determines its microcystin net production in LakeWannsee. Appl Environ Microbiol. 2003; 69:787–795. [PubMed: 12570996]
Kurmayer R, Christiansen G, Fastner J, Börner T. Abundance of active and inactive microcystingenotypes in populations of the toxic cyanobacterium Planktothrix spp. Environ Microbiol. 2004;6:831–841. [PubMed: 15250885]
Lawton LA, Edwards C, Codd GA. Extraction and high-performance liquid chromatographic methodfor the determination of microcystins in raw and treated waters. Analyst. 1994; 119:1525–1530.[PubMed: 7943743]
Lipiatou, E.; Hecky, RE.; Eisenreich; Lockhart, L.; Wilknson, P. Recent Ecosystem changes in LakeVictoria reflected in sedimentary natural rocks and anthropogenic organic compounds. In:Johnson, TC.; Odada, E., editors. The limnology, climatology and paleoclimatology of the EastAfrican lakes. Gordon and Breach; Toronto: 1996. p. 523-541.
Mikalsen B, Boison G, Skulberg OM, Fastner J, Davies W, Gabrielsen TM, Rudi K, Jakobsen KS.Natural variation in the microcystin synthetase operon mcyABC and impact on microcystinproduction in Microcystis strains. J Bacteriol. 2003; 185:2774–2785. [PubMed: 12700256]
Mugidde R, Hecky RE, Hendzel L, Taylor WD. Pelagic nitrogen fixation in Lake Victoria, Uganda. JGreat Lakes Res. 2003; 29:76–88.
Müller R, Wiedemann O. Die Bestimmung des Nitrations im Wasser. Vom Wasser. 1955; 22:247–271.
Ochumba PBO. Massive fish kills within the Nyanza Gulf of lake Victoria, Kenya. Hydrobiologia.1990; 208:93–99.
Okello, W. Toxic cyanobacteria in Ugandan freshwater habitats. UNESCO-IHE; 2004. p. 60MScThesis ES 04.03
Ozawa K, Fujioka H, Muranaka M, Yokoyama A, Karagami Y, Homma T, Ishikawa K, Tsujimura S,Kumagai M, Watanabe MF, Park H-D. Spatial distribution and temporal variation of Microcystisspecies composition and microcystin concentration in Lake Biwa. Environ Toxicol. 2005; 20:270–276. [PubMed: 15892068]
Rantala A, Rajaniemi-Wacklin P, Lyra C, Lepistö L, Rintala J, Mankiewicz-Boczek J, Sivonen K.Detection of microcystin-producing cyanobacteria in Finnish lakes with genus-specificmicrocystin synthetase Gene E (mcyE) PCR and associations with environmental factors. ApplEnviron Microbiol. 2006; 72:6101–6110. [PubMed: 16957235]
Reynolds CS, Huszar V, Kruk C, Naselli-Flores L, Melo S. Towards a functional classification of thefreshwater phytoplankton. J Plankton Res. 2002; 24:417–428.
Rogalus MK, Watzin MC. Evaluation of sampling and screening techniques for tiered monitoring oftoxic cyanobacteria in lakes. Harmful Algae. 2008; 7:504–514.
Shapiro J. Blue-green dominance in lakes: The role and management significance of pH and CO2.Internat Rev Ges Hydrobiol. 1984; 64:766–779.
Okello et al. Page 11
Environ Toxicol. Author manuscript; available in PMC 2011 January 20.
Europe PM
C Funders A
uthor Manuscripts
Europe PM
C Funders A
uthor Manuscripts
Sivonen, K.; Jones, G. Cyanobacterial toxins. In: Chorus, I.; Bartram, J., editors. Toxic cyanobacteriain water. A guide to their public health consequences, monitoring and management. E & FN Spon;London: 1999. p. 41-112.
Sivonen, K.; Börner, T. Bioactive compounds produced by cyanobacteria. In: Herrero, A.; Flores, E.,editors. The Cyanobacteria: Molecular Biology, Genomics and Evolution. Caister Academic Press;Norfolk, UK: 2008. p. 159-197.
Talling JF. The phytoplankton of Lake Victoria (East Africa). Arch Hydrobiol Beih Ergebn Limnol.1987; 25:229–256.
Tillett D, Dittmann E, Erhard M, von Döhren H, Börner T, Neilan BA. Structural organization ofmicrocystin biosynthesis in Microcystis aeruginosa PCC7806: an integrated peptide-polyketidesynthetase system. Chem Biol. 2000; 7:753–764. [PubMed: 11033079]
UNESCO, World Water Assessment Programme. Uganda National Development Report. 2nd UnitedNations World Water Development Report: Water, a shared responsibility. 2006:220.
Verschuren D, Johnson TC, Kling HJ, Edgington DN, Leavitt PR, Brown ET, Talbot MR, Hecky RE.History and timing of human impact on Lake Victoria, East Africa. Proc Roy Soc Lond B. 2001;269:289–294.
Via-Ordorika L, Fastner J, Kurmayer R, Hisbergues M, Dittmann E, Komarek J, Erhard M, Chorus I.Distribution of microcystin-producing and non-microcystin-producing Microcystis sp. in Europeanfreshwater bodies: detection of microcystins and microcystin genes in individual colonies. SystemAppl Microbiol. 2004; 27:592–603. [PubMed: 15490561]
Vincze T, Posfai J, Roberts RJ. NEBcutter: a program to cleave DNA with restriction enzymes.Nucleic Acids Res. 2003; 31:3688–3691. [PubMed: 12824395]
Viner A, Smith I. Geographical, historical and physical aspects of Lake George. Proc R Soc Lond B.1973; 184:235–270.
Vollenweider, RA.; Kerekes, J. Eutrophication of waters. Monitoring, assessment and control. OECD;Paris: 1982. p. 75-85.
Wetzel, RG.; Likens, GE. Limnological analyses. 3rd edition. Springer-Verlag; New York: 2000. p.429
Wilson AE, Sarnelle O, Neilan BA, Salmon TP, Gehringer MM, Hay ME. Genetic variation of thebloom-forming cyanobacterium Microcystis aeruginosa within and among lakes: Implications forharmful algal blooms. Appl Environ Microbiol. 2005; 71:6126–6133. [PubMed: 16204530]
Okello et al. Page 12
Environ Toxicol. Author manuscript; available in PMC 2011 January 20.
Europe PM
C Funders A
uthor Manuscripts
Europe PM
C Funders A
uthor Manuscripts

Fig. 1.Location of the study area and sampling sites in Uganda. Numbering of the sampling sites asin Table 1.
Okello et al. Page 13
Environ Toxicol. Author manuscript; available in PMC 2011 January 20.
Europe PM
C Funders A
uthor Manuscripts
Europe PM
C Funders A
uthor Manuscripts

Fig. 2.(A) Phytoplankton composition and (B) cyanobacterial composition in various Ugandanfreshwater habitats during May and June 2004. Numbering of the sampling sites as in Table1. No phytoplankton was detected at sites (1) and (6). Only taxa contributing >5% of thetotal phytoplankton biovolume (upper panel) or cyanobacterial biovolume (lower panel) areshown.
Okello et al. Page 14
Environ Toxicol. Author manuscript; available in PMC 2011 January 20.
Europe PM
C Funders A
uthor Manuscripts
Europe PM
C Funders A
uthor Manuscripts

Fig. 3.Relationship between the MC concentrations (in ng ml−1 of MC-LR equivalents) and theconcentration of cells ml−1 of Microcystis during May and June 2004 and April 2008. Fordetails on the regression curve, see the text.
Okello et al. Page 15
Environ Toxicol. Author manuscript; available in PMC 2011 January 20.
Europe PM
C Funders A
uthor Manuscripts
Europe PM
C Funders A
uthor Manuscripts

Europe PM
C Funders A
uthor Manuscripts
Europe PM
C Funders A
uthor Manuscripts
Okello et al. Page 16
Tabl
e 1
Env
iron
men
tal p
aram
eter
s in
Uga
ndan
fre
shw
ater
s sa
mpl
ed d
urin
g M
ay a
nd J
une
2004
. SR
P, s
olub
le r
eact
ive
phos
phor
us, S
RSi
, sol
uble
rea
ctiv
e si
lica,
NH
4-N
, am
mon
ia n
itrog
en, N
O3-
N, n
itrat
e ni
trog
en.
Tem
p(°
C)
Con
duct
ivit
y(μ
S cm
−1)
pHSe
cchi
(cm
)SR
P(μ
gL−1
)T
P(μ
gL−1
)N
H4-
N
(μgL
−1)
NO
3-N
(μgL
−1)
SRSi
(mgL
−1)
Chl
a(μ
gL−1
)T
roph
icSt
ate
Site
Site
No
Coo
rdin
ates
Are
a(k
m2 )
dept
h(m
)L
atit
ude
Lon
gitu
de (
E)
May
June
May
June
May
June
May
June
May
June
May
June
May
June
May
June
May
June
May
June
Swam
p (b
etw
een
Kir
anzi
and
Nab
ingo
ra)
100
°29.
533′
N31
°09.
800′
0.00
10.
528
2066
937
1026
1516
710
918
1729
059
27.3
7.8
00
-
Nya
bike
re C
rate
r L
ake
200
°29.
990′
N30
°19.
729′
0.04
2025
2428
728
87
110
119
7042
533
517
2919
8340
2428
.417
.78
13E
Nku
ruba
Cra
ter
Lak
e3
00°3
1.02
0′N
30°1
8.17
8′0.
0316
2424
387
373
78
314
4134
8271
506
850
2011
4.3
5.7
79
E
Lak
e G
eorg
e (K
ahen
ge)
400
°03.
026′
N30
°03.
274′
270
2.4
2825
343
345
1010
1020
1441
138
191
1852
205
7134
.927
.212
878
H
Lak
e E
dwar
d (K
atw
e)5
00°0
9.09
6′S
29°5
3.07
3′11
.54
2826
590
592
109
3040
128
132
115
2610
8064
8.6
10.5
4423
H
Nku
gute
Cra
ter
Lak
e6
00°3
3.08
6′S
30°1
0.36
2′0.
025
2025
2510
312
09
816
757
2324
820
110.
70.
15
5M
Lak
e M
buro
700
°39.
106′
S30
°56.
537′
158
426
2412
213
610
830
3014
1212
516
119
1314
046
8.3
8.0
3740
H
Lak
e N
abug
abo
800
°21.
283′
S31
°52.
789′
214
4.5
2525
2020
88
100
902
825
2994
1880
193.
22.
28
11M
Lak
e V
icto
ria
(Bun
jako
)9
00°0
4.34
0′S
32°0
7.52
0′60
.15
2325
8210
87
912
012
03
557
5111
825
160.
60.
110
8E
Lak
e V
icto
ria
(Mur
chis
on)
1000
°16.
911′
N32
°38.
398′
184
2626
100
100
680
805
812
210
528
2515
019
91.
00.
413
23E
Lak
e V
icto
ria
(Nap
oleo
n)11
00°2
4.17
7′N
33°1
4.75
6′66
.118
2726
9498
910
011
03
770
7519
545
140.
30.
111
10E
Pond
(Ji
nja)
1200
°29.
227′
N33
°12.
068′
0.00
11
3126
1134
1095
911
2025
1222
221
324
1860
4618
.221
.833
22H
M =
mes
otro
phic
; E =
eut
roph
ic; H
= h
yper
trop
hic;
Environ Toxicol. Author manuscript; available in PMC 2011 January 20.
Europe PM
C Funders A
uthor Manuscripts
Europe PM
C Funders A
uthor Manuscripts
Okello et al. Page 17
Table 2
Composition of ions in the MS2 spectrum of the [M+H]+ ion of [Asp3]-MC-RY
Composition and sequence Calculated m/z Measured m/z Error [ppm]
M (+ H+) 1031.5197 1031.5197 0.0
M (− CO) (+ H+) 1003.5248 1003.5244 −0.4
Glu-(Mdha or Dhb)-Ala-Arg-Asp (+ H+) 555.2522 555.2643 21.8
Glu-(Mdha or Dhb)-Ala-Arg (+ H+) 440.2252 440.2386 30.4
Glu-(Mdha or Dhb)-Ala-Arg (− COOH) (+ H+) 395.2276 395.2124 −38.5
Glu-(Mdha or Dhb) (+ H+) 213.0870 213.0879 4.2
(Mdha or Dhb)-Ala-Arg-Asp (+ H+) 426.2096 426.2177 19.0
(Mdha or Dhb)-Ala-Arg-Asp (− NH3) (+ H+) 409.1831 409.1936 25.7
(Mdha or Dhb)-Ala-Arg (+ H+) 311.1826 311.1879 17.0
(Mdha or Dhb)-Ala-Arg (− CO) (+ H+) 283.1877 283.1771 −37.4
(Mdha or Dhb)-Ala-Arg (− NH3) (+ H+) 294.1561 294.1605 15.0
(Mdha or Dhb)-Ala (+ H+) 155.0815 155.0824 5.8
(Mdha or Dhb)-Ala (− CO) (+ H+) 127.0866 127.0899 26.0
Ala-Arg-Asp-Tyr-Adda (+ H+) 819.4400 819.4226 −21.2
Ala-Arg-Asp (+ H+) 343.1724 343.1826 29.7
Ala-Arg (+ H+) 228.1455 228.1474 8.3
Arg-Asp-Tyr (+ H+) 435.1987 435.2142 35.6
Arg-Asp-Tyr (− COOH) (+ H+) 390.2010 390.1989 −5.4
Arg-Asp (+ H+) 272.1353 272.1411 21.3
Arg (+ H+) 157.1084 157.1098 8.9
Asp-Tyr (+ H+) 279.0975 279.1034 21.1
Asp-Tyr (− CO) (+ H+) 251.1026 251.1096 27.9
Tyr-Adda-Glu-(Mdha or Dhb)-Ala-Arg (+ H+) 916.4927 916.4935 0.9
Tyr-Adda-Glu-(Mdha or Dhb)-Ala-Arg (− CO) (+ H+) 888.4978 888.5056 8.8
Tyr-Adda-Glu-(Mdha or Dhb) (+ H+) 689.3545 689.3567 3.2
Tyr-Adda-Glu (+ H+) 606.3174 606.3105 −11.4
Tyr-Adda (+ H+) 477.2748 477.2565 −38.3
Adda-Glu-(Mdha or Dhb)-Ala-Arg-Asp (− NH3) (+ H+) 851.4298 851.4353 6.5
Adda-Glu-(Mdha or Dhb)-Ala-Arg-Asp (− NH3) (− 134 Adda) (+ H+) 717.3565 717.3604 5.4
Adda-Glu-(Mdha or Dhb) (− NH3) (+ H+) 509.2647 509.2621 −5.1
Adda-Glu-(Mdha or Dhb) (− NH3) (− 134 Adda) (+ H+) 375.1915 375.1996 21.6
Adda-Glu-(Mdha or Dhb) (− CO) (− NH3) (− 134 Adda) (+ H+) 347.1966 347.2035 19.9
Adda (− NH3) (− 134 Adda) (+ H+) 163.1118 163.1127 5.5
134Adda (+ H+) 135.0804 135.0824 14.8
Environ Toxicol. Author manuscript; available in PMC 2011 January 20.

Europe PM
C Funders A
uthor Manuscripts
Europe PM
C Funders A
uthor Manuscripts
Okello et al. Page 18
Table 3
Composition of ions in the MS2 spectrum of the [M+H]+ ion of [MeAsp3]-MC-RY
Composition and sequence Calculated m/z Measured m/z Error [ppm]
M (+ H+) 1045.5353 1045.5353 0.0
M (− CO) (+ H+) 1017.5404 1017.5602 19.5
Glu-(Mdha or Dhb)-Ala-Arg-MeAsp (+ H+) 569.2678 569.2905 39.9
Glu-(Mdha or Dhb)-Ala-Arg (− NH3) (+ H+)or (Mdha or Dhb)-Ala-Arg-MeAsp (− NH3) (+ H+)
423.1987 423.2173 44.0
Glu-(Mdha or Dhb)-Ala-Arg (− COOH) (+ H+) 395.2276 395.2204 −18.2
Glu-Mdha + H 213.0870 213.0916 21.6
(Mdha or Dhb)-Ala-Arg-MeAsp-Tyr-Adda (+ H+)or Tyr-Adda-Glu-(Mdha or Dhb)-Ala-Arg (+ H+)
916.4927 916.5134 22.6
(Mdha or Dhb)-Ala-Arg-MeAsp-Tyr (− NH3) (+ H+) 586.2620 586.2884 45.0
(Mdha or Dhb)-Ala-Arg-MeAsp (+ H+)or Glu-(Mdha or Dhb)-Ala-Arg (+ H+)
440.2252 440.2413 36.6
(Mdha or Dhb)-Ala-Arg-MeAsp (− CO) (+ H+)or Glu-(Mdha or Dhb)-Ala-Arg (− CO) (+ H+)
412.2303 412.2466 39.5
(Mdha or Dhb)-Ala-Arg (+ H+) 311.1826 311.1938 36.0
(Mdha or Dhb)-Ala-Arg (− NH3) (+ H+) 294.1561 294.1656 32.3
(Mdha or Dhb)-Ala-Arg (− CO) (+ H+) 283.1877 283.1843 −12.0
(Mdha or Dhb)-Ala (+ H+) 155.0815 155.0850 22.6
(Mdha or Dhb)-Ala (− CO) (+ H+) 127.0866 127.0922 44.1
Ala-Arg-MeAsp-Tyr-Adda (+ H+) 833.4556 833.4562 0.7
Ala-Arg-MeAsp (+ H+) 357.1880 357.2023 40.0
Ala-Arg (− NH3) (+ H+) 211.1190 211.1247 27.0
Arg-MeAsp-Tyr (+ H+) 449.2143 449.2364 49.2
Arg-MeAsp-Tyr (− COOH) (+ H+) 404.2167 404.2209 10.4
Arg-MeAsp (+ H+) 286.1509 286.1632 43.0
Arg (+ H+) 157.1084 157.1132 30.6
MeAsp-Tyr (+ H+) 293.1131 293.1255 42.3
Tyr-Adda-Glu-(Mdha or Dhb)-Ala-Arg (+ H+) 916.4927 916.5134 22.6
Tyr-Adda-Glu-(Mdha or Dhb)-Ala-Arg (− CO) (+ H+) 888.4978 888.5134 17.6
Tyr-Adda (+ H+) 477.2748 477.2628 −25.1
Adda-Glu-(Mdha or Dhb)-Ala-Arg-MeAsp (− NH3) (+ H+) 865.4454 865.4628 20.1
Adda-Glu-(Mdha or Dhb)-Ala-Arg-MeAsp (− NH3) (− 134 Adda) (+ H+) 731.3722 731.3859 18.7
Adda-Glu-(Mdha or Dhb) (− NH3) (+ H+) 509.2647 509.2813 32.6
Adda-Glu-(Mdha or Dhb) (− NH3) (− 134 Adda) (+ H+) 375.1915 375.2071 41.6
Adda-Glu-(Mdha or Dhb) (− CO) (− NH3) (− 134 Adda) (+ H+) 347.1966 347.2095 37.2
Adda (− NH3) (− 134 Adda) (+ H+) 163.1118 163.1154 22.1
134Adda (+ H+) 135.0804 135.0852 35.5
Environ Toxicol. Author manuscript; available in PMC 2011 January 20.

Europe PM
C Funders A
uthor Manuscripts
Europe PM
C Funders A
uthor Manuscripts
Okello et al. Page 19
Tabl
e 4
Fiel
d sa
mpl
es o
f tw
elve
Uga
ndan
fre
shw
ater
site
s an
alyz
ed f
or c
yano
bact
eria
l bio
volu
me,
Mic
rocy
stis
cel
l num
bers
, by
PCR
for
the
pres
ence
(+
) or
abs
ence
(−
) of
mic
rocy
stin
(M
C)
prod
ucer
s (H
EP)
, mcy
E,
PC-I
GS,
mcy
B o
f M
icro
cyst
is a
nd f
or M
Cs
by H
PLC
. Onl
y th
e pl
ankt
on n
et s
ampl
es f
rom
the
site
nos
. 4, 5
, 7, 1
0, a
nd 1
1 w
ere
anal
yzed
in A
pril
2008
.
Sam
ple
IDSi
teno
.F
ilter
ed v
olum
e(m
L)
Cya
noba
cter
ial
Bio
volu
me
(mm
3 L
−1)
Mic
rocy
stis
(cel
ls m
L−1
)H
EP
-PC
Rpr
oduc
tM
icro
cyst
is
mcy
E-F
2/F
8*P
CR
pro
duct
PC
-IG
S P
CR
prod
uct
Mcy
B P
CR
prod
uct
fg M
C-L
Req
uiva
lent
cel
l−1
M4
J4A
8M
4J4
A8
M4
J4A
8M
4J4
A8
M4
J4A
8M
4J4
A8
M4
J4A
8M
4J4
A8
Dep
th I
nteg
rate
d sa
mpl
es
Kir
anzi
sw
amp
125
025
0−
−−
−−
−−
−−
−−
−
Nya
bike
re C
rate
r L
ake
240
070
04
0.4
−−
−−
−−
−−
−−
−−
Nku
ruba
Cra
ter
Lak
e3
500
500
31
5×10
35×
103
−−
−−
++
−−
−−
Lak
e G
eorg
e4
2550
8860
4×10
57×
105
++
++
++
++
−−
Lak
e E
dwar
d (K
atw
e)5
150
150
5357
2×10
52×
105
++
++
++
++
−−
Nku
gute
Cra
ter
Lak
e6
700
500
Lak
e M
buro
710
020
063
889×
105
9×10
5+
++
++
++
+−
−
Lak
e N
abug
abo
825
025
05
55×
104
2×10
4−
−−
−+
++
+−
−
Lak
e V
icto
ria
(Bun
jako
Bay
)9
800
500
1124
2×10
44×
104
−−
−−
++
++
−−
Lak
e V
icto
ria
(Mur
chis
on B
ay)
1050
050
018
129
4×10
42×
105
++
++
++
++
−−
Lak
e V
icto
ria
(Nap
oleo
n G
ulf)
1150
050
040
463×
104
3×10
4+
++
++
++
+−
−
Jinj
a Po
nd12
200
193×
104
−−
−−
−
Plan
kton
Net
sam
ples
Kir
anzi
sw
amp
140
30N
ot a
pplic
able
−−
−−
−−
−−
−−
−−
Nya
bike
re C
rate
r L
ake
250
50″
−−
−−
−−
−−
−−
−−
Nku
ruba
Cra
ter
Lak
e3
5050
″−
−−
−−
−−
−−
−
Lak
e G
eorg
e4
2550
60″
3×10
63×
106
6×10
6+
−+
+−
++
++
++
+8.
1−
9.6
Lak
e E
dwar
d (K
atw
e)5
3540
60″
1×10
64×
106
2×10
6+
++
++
++
++
++
+92
.931
.267
.1
Lak
e M
buro
735
5060
″3×
106
3×10
64×
106
+−
++
−+
++
++
++
5.2
15.8
52.4
Lak
e N
abug
abo
840
40″
3×10
55×
105
−−
−−
++
++
−−
Lak
e V
icto
ria
(Bun
jako
Bay
)9
5050
″2×
105
2×10
5−
−−
−+
++
+−
−
Lak
e V
icto
ria
(Mur
chis
on B
ay)
1050
2560
″4×
105
4×10
61×
107
++
++
++
++
++
++
−−
1.3
Lak
e V
icto
ria
(Nap
oleo
n G
ulf)
1150
5060
″1×
106
7×10
56×
105
++
++
++
++
++
++
−−
49.1
Jinj
a Po
nd12
50″
M4
= M
ay 2
004;
J4
= J
une
2004
; A8
= A
pril
2008
;
Environ Toxicol. Author manuscript; available in PMC 2011 January 20.

Europe PM
C Funders A
uthor Manuscripts
Europe PM
C Funders A
uthor Manuscripts
Okello et al. Page 20* us
ing
mcy
E-F
2/12
R f
or A
naba
ena
and
plaR
3 fo
r Pl
ankt
othr
ix n
o PC
R p
rodu
cts
wer
e ob
tain
ed
Environ Toxicol. Author manuscript; available in PMC 2011 January 20.

Europe PM
C Funders A
uthor Manuscripts
Europe PM
C Funders A
uthor Manuscripts
Okello et al. Page 21
Tabl
e 5
Num
ber
of r
estr
ictio
n ty
pes
as o
bser
ved
in c
lone
libr
arie
s ob
tain
ed f
rom
HE
P-PC
R p
rodu
cts
(mcy
E, r
estr
ictio
n ty
pes
A-C
) an
d to
x4F/
4R P
CR
pro
duct
s(m
cyB
, res
tric
tion
type
s I-
III)
. For
eac
h re
stri
ctio
n ty
pe th
e re
spec
tive
genu
s (A
, B)
or M
icro
cyst
is s
trai
n (I
, II,
III
) is
indi
cate
d in
par
enth
eses
.
HE
PF
/HE
PR
-PC
R (
mcy
E, 4
70 b
p)T
ox4f
/4r-
PC
R (
mcy
B, 1
330
bp)
Site
s/R
estr
icti
onty
peSi
teN
oD
ate
No
ofcl
ones
A (Mic
rocy
stis
)B (A
naba
ena)
C undi
gest
edN
otas
sign
edN
o of
clon
esI
(PC
C78
06)
II (
HU
B52
4)II
I (S
trai
n18
A8)
2N
otas
sign
ed
L. G
eorg
e4
26 A
pril
2008
2020
00
020
00
200
L. M
buro
727
Apr
il20
0875
710
311
248
015
1
L. V
icto
ria
(Nap
oleo
n)11
26 A
pril
2008
7070
00
035
110
204
1 Sequ
enci
ng r
evea
led
a 38
2 bp
(FJ
4298
39)
with
a 9
6% s
imila
rity
to M
icro
cyst
is s
trai
n PC
C78
06
2 In a
dditi
on, t
wel
ve M
icro
cyst
is s
trai
ns w
ere
isol
ated
fro
m th
e sa
me
site
s (O
kello
, 200
4). S
ix s
trai
ns w
ere
foun
d to
con
tain
mcy
B (
stra
in n
o.: 1
B5,
2D
6, 1
8A8,
20A
2, 6
C5,
20A
5, a
cces
s no
. EU
0141
58-
EU
0141
63).
Environ Toxicol. Author manuscript; available in PMC 2011 January 20.