Algae and Cyanobacteria Diversity and Bioindication of Long ...
20
diversity Article Algae and Cyanobacteria Diversity and Bioindication of Long-Term Changes in the Hula Nature Reserve, Israel Sophia Barinova 1, * and Alla Alster 2 Citation: Barinova, S.; Alster, A. Algae and Cyanobacteria Diversity and Bioindication of Long-Term Changes in the Hula Nature Reserve, Israel. Diversity 2021, 13, 583. https://doi.org/10.3390/d13110583 Academic Editors: Mary Kelly-Quinn and Mario A. Pagnotta Received: 30 September 2021 Accepted: 12 November 2021 Published: 14 November 2021 Publisher’s Note: MDPI stays neutral with regard to jurisdictional claims in published maps and institutional affil- iations. Copyright: © 2021 by the authors. Licensee MDPI, Basel, Switzerland. This article is an open access article distributed under the terms and conditions of the Creative Commons Attribution (CC BY) license (https:// creativecommons.org/licenses/by/ 4.0/). 1 Institute of Evolution, University of Haifa, 199 Abba Khoushi Ave., Mount Carmel, Haifa 3498838, Israel 2 Israel Oceanographic and Limnological Research, The Yigal Allon Kinneret Limnological Laboratory, Migdal 14950, Israel; [email protected] * Correspondence: [email protected]; Tel.: +972-4824-97-99 Abstract: Lake Hula, the core of one of the most extensive wetland complexes in the Eastern Mediterranean, was drained in 1951–1958. However, about 350 hectares of papyrus marshes were allocated in the southwestern part of the previous lake and became the Hula Nature Reserve status, the first of two wetlands in Israel included in the Ramsar List of Wetlands of International Importance. The list of algae and cyanobacteria species of Lake Hula was compiled by us for the first time based on data from publications of 1938–1958, as well as our research in the Hula Nature Reserve, obtained within the framework of the monitoring program for 2007–2013. The list includes 225 species and intraspecies of algae and cyanobacteria belonging to eight phyla. The dynamics of the species richness of algae and cyanobacteria flora for 1938–2013 are shown. Species-bioindicators of water quality have been identified, and the change in their composition by ecological groups for a period of about a hundred years has been shown. Based on the species richness of algae communities, water quality indices were calculated with particular attention to changes in trophic status during the study period. The algae flora of Lake Hula and Hula Nature Reserve was found to be similar, but bioindication has revealed an increase in salinity and organic pollution in recent years. Keywords: phytoplankton; algae and cyanobacteria flora; indicator species; long-term changes; wetlands; trophic state; Ramsar object; Israel 1. Introduction Wetlands cover at least 6% of the Earth’s surface [1]. They play a key role in hydrolog- ical and biogeochemical cycles, harbor a large part of the world’s biodiversity, and provide multiple services to humankind. However, pressure in the form of land reclamation, in- tense resource exploitation, changes in hydrology, and pollution threaten wetlands on all continents. Depending on the region, 30–90% of the world’s wetlands have already been destroyed or strongly modified in many countries with no sign of abatement [1]. Until the fifties of the last century, Lake Hula was the kernel of the unique Hula wet- land ecosystem, one of the most extensive wetland complexes in the Eastern Mediterranean. The wetland complex included the Hula Lake (around 15 km 2 ), extensive peat-based Cyperus papyrus swamps, and seasonally inundated inorganic soils in the north part of the lake jointly covering an area of 45–75 km 2 . The lake and its adjacent swamps provided the habitat with a rich diversity of plants and animals and was a key feeding station for migratory birds [2,3]. Hula Lake and swamps were drained between 1951 and 1958 in an attempt to reduce evapotranspiration, increase the water potential for the whole country, convert 60 km 2 of swamps into arable land and use the peat for fertilizer and for the industry. The Jewish National Fund carried out the draining project, yet its objectives were never achieved. Contrary, the draining led to uncontrollable underground fires that resulted in the formation of dangerous caverns within the peat layer and dust storms in the valley [4]. The “World biomes map” (feow.org, accessed on 21 September 2021) [5] reported that Hula Lake was completely drained for region 438. However, a small (350 hectares) Diversity 2021, 13, 583. https://doi.org/10.3390/d13110583 https://www.mdpi.com/journal/diversity
-
Upload
khangminh22 -
Category
Documents
-
view
1 -
download
0
Transcript of Algae and Cyanobacteria Diversity and Bioindication of Long ...

diversity
Article
Algae and Cyanobacteria Diversity and Bioindication ofLong-Term Changes in the Hula Nature Reserve, Israel
Sophia Barinova 1,* and Alla Alster 2
�����������������
Citation: Barinova, S.; Alster, A.
Algae and Cyanobacteria Diversity
and Bioindication of Long-Term
Changes in the Hula Nature Reserve,
Israel. Diversity 2021, 13, 583.
https://doi.org/10.3390/d13110583
Academic Editors: Mary Kelly-Quinn
and Mario A. Pagnotta
Received: 30 September 2021
Accepted: 12 November 2021
Published: 14 November 2021
Publisher’s Note: MDPI stays neutral
with regard to jurisdictional claims in
published maps and institutional affil-
iations.
Copyright: © 2021 by the authors.
Licensee MDPI, Basel, Switzerland.
This article is an open access article
distributed under the terms and
conditions of the Creative Commons
Attribution (CC BY) license (https://
creativecommons.org/licenses/by/
4.0/).
1 Institute of Evolution, University of Haifa, 199 Abba Khoushi Ave., Mount Carmel, Haifa 3498838, Israel2 Israel Oceanographic and Limnological Research, The Yigal Allon Kinneret Limnological Laboratory,
Migdal 14950, Israel; [email protected]* Correspondence: [email protected]; Tel.: +972-4824-97-99
Abstract: Lake Hula, the core of one of the most extensive wetland complexes in the EasternMediterranean, was drained in 1951–1958. However, about 350 hectares of papyrus marshes wereallocated in the southwestern part of the previous lake and became the Hula Nature Reserve status,the first of two wetlands in Israel included in the Ramsar List of Wetlands of International Importance.The list of algae and cyanobacteria species of Lake Hula was compiled by us for the first time basedon data from publications of 1938–1958, as well as our research in the Hula Nature Reserve, obtainedwithin the framework of the monitoring program for 2007–2013. The list includes 225 species andintraspecies of algae and cyanobacteria belonging to eight phyla. The dynamics of the species richnessof algae and cyanobacteria flora for 1938–2013 are shown. Species-bioindicators of water qualityhave been identified, and the change in their composition by ecological groups for a period of abouta hundred years has been shown. Based on the species richness of algae communities, water qualityindices were calculated with particular attention to changes in trophic status during the study period.The algae flora of Lake Hula and Hula Nature Reserve was found to be similar, but bioindication hasrevealed an increase in salinity and organic pollution in recent years.
Keywords: phytoplankton; algae and cyanobacteria flora; indicator species; long-term changes;wetlands; trophic state; Ramsar object; Israel
1. Introduction
Wetlands cover at least 6% of the Earth’s surface [1]. They play a key role in hydrolog-ical and biogeochemical cycles, harbor a large part of the world’s biodiversity, and providemultiple services to humankind. However, pressure in the form of land reclamation, in-tense resource exploitation, changes in hydrology, and pollution threaten wetlands on allcontinents. Depending on the region, 30–90% of the world’s wetlands have already beendestroyed or strongly modified in many countries with no sign of abatement [1].
Until the fifties of the last century, Lake Hula was the kernel of the unique Hula wet-land ecosystem, one of the most extensive wetland complexes in the Eastern Mediterranean.The wetland complex included the Hula Lake (around 15 km2), extensive peat-basedCyperus papyrus swamps, and seasonally inundated inorganic soils in the north part of thelake jointly covering an area of 45–75 km2. The lake and its adjacent swamps providedthe habitat with a rich diversity of plants and animals and was a key feeding station formigratory birds [2,3]. Hula Lake and swamps were drained between 1951 and 1958 in anattempt to reduce evapotranspiration, increase the water potential for the whole country,convert 60 km2 of swamps into arable land and use the peat for fertilizer and for theindustry. The Jewish National Fund carried out the draining project, yet its objectiveswere never achieved. Contrary, the draining led to uncontrollable underground fires thatresulted in the formation of dangerous caverns within the peat layer and dust storms in thevalley [4]. The “World biomes map” (feow.org, accessed on 21 September 2021) [5] reportedthat Hula Lake was completely drained for region 438. However, a small (350 hectares)
Diversity 2021, 13, 583. https://doi.org/10.3390/d13110583 https://www.mdpi.com/journal/diversity
Diversity 2021, 13, 583 2 of 20
area of papyrus swampland in the southwest of the valley was set aside and, in 1963,became Israel’s first nature reserve [2,6]. Hula Nature Reserve was gradually isolatedfrom the center of the historical wetland, and for 30 years, the water quantity and qualityprovided to the nature reserve totally depended on external factors (such as fishpondneeds or the maintenance of the Einan Reservoir, from which water flowed to the naturereserve). In 1994, 100 ha of the least agriculturally productive peat soils in the Hula Valleywere re-flooded to create the artificial “Agamon” Lake, located where the most extensivepeat deterioration and subsequent winter inundation had occurred. Moreover, a networkof 90 km of shallow flood and drainage canals was created to raise the water table level.The old course of the Jordan River was reconstructed as the water supply canal to thelake. At the beginning of the 2000s, due to the poor water quality in the nature reserveand its deteriorating ecosystem, two important changes occurred: significant progress wasmade toward the recognition of nature’s rights for water, and the western channel, whichsupplies water to the nature reserve, was converted to convey clean Jordan water. Thenature reserve’s second restoration plan began in 2003–2004, with goals: (1) to create theinfrastructure that would provide appropriate water quantities and that would controlthe water system, and (2) reduce water penetration through the dikes and set a system formonitoring and controlling water [7]. From 1996, Hula Nature Reserve included Ramsar’s“List of wetlands of international importance” together with the En Afeq Nature Reservethat only two protected watered areas were established as Ramsar objects in the EasternMediterranean [8].
The system of state monitoring of water quality in Israel includes the determina-tion of only some chemical indicators but does not include the determination of thebiodiversity of organisms. However, leading Israeli experts in this field carried out bio-diversity research in the Lake Hula area on an initiative basis. The algae species of theHula Lake before it is drainage were studied and described by T. Rayss and E. Katchal-sky [9], T. Rayss [10,11], and B. Komarovsky [12]. A. Ehrlich [13], and J.W. Sherman andR. Patrick [14] studied the diatom flora from the lake sediments. Unfortunately, in thosetwo studies, the distinction between fossil and recent species was not always clear. In1998, the list of algae species of Hula Lake was published [2]. The list summarized dataof 1938–1958 and did not describe the algae flora from the Hula Nature Reserve. Thestudies of algae flora in the Hula Nature Reserve, funded by Israel Nature and ParksAuthority, existed in 2007–2013 and included chlorophyll concentration measurementsand analysis of algae and cyanobacteria species composition in samples collected fromseveral sampling stations. As a result of monitoring, the main algae species of Hula Na-ture Reserve were determined. Unfortunately, the algae and cyanobacteria monitoringdata remained “thing in itself”, with a lack of ability to interpret data for understandingthe ecological situation in the nature reserve state and change.
The European Water Framework Directive (WFD) requires an assessment of both theabundance and taxonomic composition of the aquatic communities [15]. The bioindica-tion analysis is based on the hierarchical organization of the biotic community, which isdescribed by the model of the trophic pyramid [16]. The distribution of the groups oforganisms or species over the intervals of environmental factors is also of considerable im-portance. The level of adaptation of the species and the community as a whole determinesthe relationship between algal biodiversity and environmental conditions.
Most of the trophic state indices are based on the chemical and productivity data ofthe lake, such as chlorophyll and phosphorus initially defined by Carlson [17]. Methods forassessing the trophic state of the lakes are of particular interest to us [18,19]. Nevertheless,it is difficult or not adequate to calculate this type of indices when we have the species listonly. Even the trophic state indices developed for the largest close placed Lake Kinneretinclude chemical variables, phytoplankton biomass, and chlorophyll-a concentration thatare not defined yet in the Hula Lake [20]. The studies of ecosystem state for Lake Kinneret,the largest close placed lake, include biochemical variables, phytoplankton biomass, andchlorophyll concentration. For Lake Hula, these data are lacking. Therefore, only using

Diversity 2021, 13, 583 3 of 20
the bioindication method makes it possible to reconstruct and characterize the Lake Hulaecosystem state. For the Lake Hula ecosystem, this turned out to be the only way out inthe analysis of long-term changes. Bioindication is based on the principle of congruencebetween community composition and the complexity of environmental factors. More ofthem, ecology of inhabitants can help to assess such factors as nutrition type correlatedwith ecotoxicology and trophic state of the water body. In the absence of environmentaldata and the available taxonomic composition of algae and cyanobacteria, it is possible toassess the change in water trophicity using the Nygaard index [21]. Therefore, we decidedto implement bioindication methods for the assessment of long-term changes in the aquaticecosystem of the protected Hula Lake.
We hypothesized that bioindication through algae and cyanobacteria species list withthe relative abundance scores coupled with statistical methods could be used to assess thechanges in biodiversity, water quality, and trophic state during the last hundred years inthe Hula Nature Reserve.
The aims of the present study were:
• To compile the list of algae and cyanobacteria species from the past century referencesand our monitoring data and analyze it by bioindication and statistics;
• To compare the algae and cyanobacteria community of Lake Hula before drainagewith it in the Hula Nature Reserve;
• To actualize the bioindication methods for monitoring the ecological situation in theaquatic ecosystem.
2. Materials and Methods2.1. Description of Study Site
Lake Hula was formed about 20,000 years as a result of late Pleistocene volcanicactivity. Basaltic hills intercept the Jordan River, form the “plug” restricted water drainagedownstream into the Lake Kinneret, and separate the northern part of the Dead Sea RiftValley that clearly defines Hula Valley (Figure 1).
Diversity 2021, 13, 583 3 of 21
Kinneret, the largest close placed lake, include biochemical variables, phytoplankton bio-mass, and chlorophyll concentration. For Lake Hula, these data are lacking. Therefore, only using the bioindication method makes it possible to reconstruct and characterize the Lake Hula ecosystem state. For the Lake Hula ecosystem, this turned out to be the only way out in the analysis of long-term changes. Bioindication is based on the principle of congruence between community composition and the complexity of environmental fac-tors. More of them, ecology of inhabitants can help to assess such factors as nutrition type correlated with ecotoxicology and trophic state of the water body. In the absence of envi-ronmental data and the available taxonomic composition of algae and cyanobacteria, it is possible to assess the change in water trophicity using the Nygaard index [21]. Therefore, we decided to implement bioindication methods for the assessment of long-term changes in the aquatic ecosystem of the protected Hula Lake.
We hypothesized that bioindication through algae and cyanobacteria species list with the relative abundance scores coupled with statistical methods could be used to assess the changes in biodiversity, water quality, and trophic state during the last hundred years in the Hula Nature Reserve.
The aims of the present study were: • To compile the list of algae and cyanobacteria species from the past century refer-
ences and our monitoring data and analyze it by bioindication and statistics; • To compare the algae and cyanobacteria community of Lake Hula before drainage
with it in the Hula Nature Reserve; • To actualize the bioindication methods for monitoring the ecological situation in the
aquatic ecosystem.
2. Materials and Methods 2.1. Description of Study Site
Lake Hula was formed about 20000 years as a result of late Pleistocene volcanic ac-tivity. Basaltic hills intercept the Jordan River, form the "plug" restricted water drainage downstream into the Lake Kinneret, and separate the northern part of the Dead Sea Rift Valley that clearly defines Hula Valley (Figure 1).
Figure 1. The Hula Lake historical changes during the last century. The Hula Nature Reserve on theEastern Mediterranean (a); the Hula Valley before 1958 modified according to [22,23] (b), old Hulalake outlined by bold green line, Hula swamp area outlined by thin green line; the Hula Valley withHula Nature Reserve, 1959–2021 modified according to [4,24,25] (c).
Diversity 2021, 13, 583 4 of 20
Appearing after the damming, Lake Hula became the base of the unique wetlandecosystem [6]. Prior to its drainage in the 1950s, Lake Hula was 5.3 km long and 4.4 kmwide, extending over 12–14 km2, depending on the water level. The lake depth fluctuatedfrom about 1.5 m in summer to about 3 m in winter. The north part of the Lake Hula wasextensive peat-based Cyperus papyrus swamps jointly covering an area of 45–75 km2 (de-pending on seasonally fluctuating water levels) with several deeper open-water ponds [2,6].Most of the water flowing into Lake Hula came from Mount Hermon via the Jordan River.Other streams, from the Golan Heights, the eastern Galilee Mountains, and from approxi-mately 70 springs in the Hula Valley itself, also fed the lake and swamps. From the lake’soutlet, the Jordan River flowed another 20 km before emptying into Lake Kinneret. The areais typically Mediterranean, with hot, dry summers and cool, rainy winters. However, themountain-enclosed topography of the Hula Valley leads to more extreme seasonal, as wellas daily, temperature fluctuations. Annual rainfall varies greatly between different partsof the valley and ranges from about 400 millimeters in the south to up to 800 millimetersin the north. More than 1500 millimeters of precipitation falls on the Hermon mountainrange (mostly in the form of snow), feeding underground springs, including the sourcesof the Jordan River, and giving rise to much of the abundant water flowing through thevalley. The wind regime is dominated by regional patterns in the winter, with occasionalstrong northeasterly windstorms. In summer, local warming and cooling patterns producestrong westerly to northerly winds in the afternoons. Due to its shallowness, the watertemperature of Lake Hu1a exhibited large dial fluctuations, sometimes of more than 10 ◦C.In summer, typical afternoon westerly to northerly winds destroy the vertical temperaturegradient, which developed during the calm morning hours. At night, convective mixingcaused vertical turnover of the water layers. Monthly mean temperatures ranged from12 to 27 ◦C, although much more extreme temperatures (4–38 ◦C) were also reported [2].Not much information is available about the chemistry of the Lake. No brackish watersources fed into Lake Hula; therefore, its salinity was lower than that of Lake Kinneret,with chloride concentrations of 15–50 mg L−1 and total dissolved solids 224–373 mg L−1.The pH of the water ranged from 7.2 to 8.6. Of the inorganic nitrogen compounds, onlyammonia was present in measurable concentrations (0.06 ppm), while nitrates were atundetectable levels. No data are available on P concentrations. The soil of the peat swampscontained 50–80% organic matter, mainly decomposed papyrus. Lake Hula and its adjacentswamps provided the habitat for a rich diversity of plants and animals and were a keyfeeding station for migratory birds. Unfortunately, anopheles (malaria) mosquito was acommon part of the swamp fauna. In addition, according to the concept of the first halfof the 20th century, the swamp occupied a significant area suitable for agriculture. Thus,in 1951 the works for drying the region, carried out by the Jewish National Fund, started,and in 1958, the Hula Lake and swamp were drained. Despite the complete transformationof the landscape, the drainage project included some conservation efforts. A 0.3 km2 areaknown as the Hula Nature Reserve (HNR) was established in the southern end of thewetland area in order to maintain the existence of native flora and fauna. In addition tothe HNR, the Einan Reservoir was constructed in 1984 to store and recycle effluent fromfishponds and ultimately reduce nutrient outflow [26].
2.2. Sampling and Laboratory Studies
Samples for algae and cyanobacteria identification were collected monthly at stations 1,4, 6, 8, and “Enan stream” (Figure 2). The 100 mL water samples for algae and cyanobacteriaspecies analysis were fixed with 0.4 mL of Lugol solution and transferred for analysis atthe Kinneret Limnological Laboratory (KLL).
At the Kinneret Limnological Laboratory, 10 mL of the Lugol-fixed samples were ex-amined after 24 h sedimentation in sedimentation chambers under an inverted microscope,Axiovert 135M, Zeiss. For more details, fresh material was examined and photographedwith an Olympus BX50 microscope equipped with a Nomarski DIC system with ×20, ×40,and ×100 DIC objectives (ECHO a BICO company, San Diego, CA, USA) and a PixeLINK

Diversity 2021, 13, 583 5 of 20
PL-662 digital camera (Pixelink (r)a Navitar Company. Gloucester, Canada). Algae wereidentified to genus or species level using the conventional taxonomic handbooks [27–33].To avoid the use of synonyms, the identified species were checked in www.algaebase.org(accessed on 21 September 2021) [34]. All species were recorded and scored according totheir relative abundance in the sample using the species frequencies scale (Table 1) [35,36].
Diversity 2021, 13, 583 5 of 21
At the Kinneret Limnological Laboratory, 10 mL of the Lugol-fixed samples were examined after 24 h sedimentation in sedimentation chambers under an inverted micro-scope, Axiovert 135M, Zeiss. For more details, fresh material was examined and photo-graphed with an Olympus BX50 microscope equipped with a Nomarski DIC system with x20, x40, and x100 DIC objectives (ECHO a BICO company, San Diego, California) and a PixeLINK PL-662 digital camera (Pixelink (r)a Navitar Company. Gloucester, Canada). Algae were identified to genus or species level using the conventional taxonomic hand-books [27–33]. To avoid the use of synonyms, the identified species were checked in www.algaebase.org [34]. All species were recorded and scored according to their relative abundance in the sample using the species frequencies scale (Table 1) [35,36].
Figure 2. The Hula Lake/ Hula Nature Reserve sampling sites in 1938–2013, yellow dots.
Table 1. Species frequencies scale according to the works of [35,36].
Number of Observed Cells Estimate Score 1–5 cells /chamber Occasional 1
10–15 cells /chamber Rare 2 25–30 cells /chamber Common 3 1 cell over a transect Frequent 4
Several cells over a transect Very frequent 5 A cell in every field of view Abundant 6
2.3. Determination of Water Physicochemical Properties The major physicochemical variables of water quality (temperature, pH, electrical
conductivity, total dissolved solids) were measured in parallel with algal sampling in 2011 at each sampling station on the spot by using HANNA HI-98194 multiparameter portable water quality meter.
Figure 2. The Hula Lake/Hula Nature Reserve sampling sites in 1938–2013, yellow dots.
Table 1. Species frequencies scale according to the works of [35,36].
Number of Observed Cells Estimate Score
1–5 cells/chamber Occasional 110–15 cells/chamber Rare 225–30 cells/chamber Common 31 cell over a transect Frequent 4
Several cells over a transect Very frequent 5A cell in every field of view Abundant 6
2.3. Determination of Water Physicochemical Properties
The major physicochemical variables of water quality (temperature, pH, electricalconductivity, total dissolved solids) were measured in parallel with algal sampling in 2011at each sampling station on the spot by using HANNA HI-98194 multiparameter portablewater quality meter.
2.4. Historical Data Analysis
We collected all available references containing the algae and cyanobacteria diversitydata before the Lake Hula drainage. Because the sampling date was usually not clear, weused the paper publication year as the sampling date. The historical data comes from1938 to 1958 was combined with our unpublished monitoring data comes from 2007 to2013. The total species list was compiled and updated with modern taxonomy [34]. All

Diversity 2021, 13, 583 6 of 20
species list was divided into three periods: (1) Hula before draining actually based on thereferences of 1938–1958; (2) Hula after draining, Hula Nature Reserve existing but no anydata 1959–2006; (3) Hula Nature Reserve (HNR) monitoring, 2007–2013.
2.5. Bioindication Analysis
The bioindication methods for a range of environment variables by the ecologicalpreferences of the revealed algae and cyanobacteria species [37] and their abundance wereused for analysis [38]. The bioindication properties of each revealed species came from aworld database [39] compiled by us. The bioindication systems included the most effectiveindication of the organisms’ such as substrate and nutrition type preferences, water salinity,alkalinity, organic pollution, and trophic state. The correlations between major indicativevariables are given in the work of [38]. The saprobic index S was calculated according toV. Sládecek [40,41] to estimate the level of organic pollution. Index values S range from0 (no polluted) to 4.5 (very polluted) for the aquatic environment. All data were rankedaccording to the CIS countries’ classification system [42] to assess the water quality.
2.6. Statistical Analysis
The similarity of species richness was calculated in the BioDiversity Pro program. Thecorrelation was calculated by network analysis in JASP Program [43].
2.7. Nygaard Species Indices for Trophic State Assessment
Nygaard [21] has developed trophic state-related indices (NY) based on large experi-mental observations of the diversity and species richness of the lake’s phytoplankton. Thisbecame possible because both the diversity and abundance of species in taxonomic groupscontrol the functioning of the ecosystem [44] and, thus, can reflect the trophic state of thelake. On the same theoretical basis, the Modified Nygaard Species Index (NS) and thesub-index of Quality Group species (QG) were constructed using the species richness ofcertain taxonomic groups according to the work of [21] and related to water quality [45].The use of these indices is the last opportunity to assess the trophic status of a lake whenthere is no data on the chemistry of its waters.
Indices can be calculated on the basis of species richness of the lake phytoplanktonin certain taxonomic groups. Nygaard Species Index [21] (NY) calculation based on thespecies richness of phytoplankton in higher taxonomic group and related to waterbodytrophic states. It includes five sub-indices, which can be classified in relation to the laketrophic state as in Table 2:
Index 1 (NY-1) = Myxophyceae/DesmidiaceaeIndex 2 (NY-2) = Chlorococcales/DesmidiaceaeIndex 3 (NY-3) = Centrales/PennalesIndex 4 (NY-4) = Euglenineae/(Myxophyceae + Chlorococcales)Index 5 (NY-5) = (Myxophyceae + Chlorococcales + Centrales + Euglenineae)/Desmidiaceae
Table 2. Nygaard Species Index (NY) table for classification of trophic the lake state.
Trophic State Index 1 Index 2 Index 3 Index 4 Index 5
Oligotrophic-dystrophic phase 0 0.0–0.3 0 0 0–0.3Oligotrophic-acidotrophic
phase 0 0–0.1 0 0 0–0.1
Oligotrophic 0–0.4 0–0.7 0 0–0.2 0.25–1.0Mesotrophic 0.1–0.5 0.2–0.6 0–0.75 0.1–1.0 1.1–1.2
Slightly eutrophic 0.8–1.0 0.7–1.0 0.2–1.5 0–0.2 2.0–2.25Moderately eutrophic 1.4–2.0 1.25–1.4 0.6–1.7 0 3.5–4.4
Eutrophic 1.2–3.0 2.1–3.5 1.25–3.0 0 4.3–8.75Eutrophic of mixotrophic phase 0.9–2.7 2.2–2.5 0.2–0.5 0 3.3–5.3

Diversity 2021, 13, 583 7 of 20
Nygaard Species Index (NS) and Quality Group species sub-index (QG) were modifiedby the authors of [46] for assessment of the lake trophic state on the base of modern algaeand cyanobacteria taxonomy (Table 3).
Modified Nygaard Species Index (NS):NS = (cyanobacteria + chlorophytes + euglenophytes)/chrysophytes + desmidsQuality Group species sub-index QG:QG = 5 × chrysophytes + 2 × desmids + dinoflagellates + cryptophytes + diatoms
Table 3. Modified Nygaard Species Index (NS) and Quality Group species sub-index (QG) classifica-tion for assessment of the lake trophic state (according to the work of [46]).
NS QG Trophic State
0–2 >60 Ultraoligotrophic2–4 46–60 Oligotrophic4–6 31–45 Mesotrophic6–8 16–30 Eutrophic>8 <16 Hypertrophic
3. Results3.1. Water Chemistry
Information on the chemistry of waters in Lake Hula is extremely scarce since it stilldoes not have a system of constant monitoring. Table 4 presents the known data fromU. Pollingher [2], R.F. Jones [47], and A. Nishri [48] works summarized the period of1938–1958 before the draining of the lake, as well as our own data for 2011, referring tothe monitoring period. Thus, Table 4 presents combined data that were collected bothfrom literary sources in the historical period and collected by us sporadically, only in thesummer period of 2011, which allows us to determine both changes in some environmentalparameters and the overall amplitude of fluctuations.
Table 4. Chemical variables variation in the Hula Lake/Hula Nature Reserve in 1938–1958 and 2011.
Parameter 1938–1958[2,47,48]
2011Our Data
2011 AverageOur Data
Water temperature, ◦C 4–36 19.9–25.7 22.50TDS, mg L−1 224–373 255–1675 734.75
Sulfate, mg L−1 ≤373 nd ndNitrate-N, mg L−1 nd 1.6–7.7 5.67
Ammonia-N, mg L −1 0.06 nd ndChloride, mg L−1 15–50 nd nd
pH 7.2–8.6 7.1–7.9 7.61Electrical conductivity, ms cm−1 nd 0.36–2.26 1.01
Note: nd—not determined
It can be seen that the water temperature in 1938–1958 corresponds to the climaticnorm, and the data for the spring-summer period 2011 are included in the amplitude.The pH of the water was also fairly stable for both periods. Sulfates, ammonium,and chlorides were measured only for the historical period and did not go beyondfreshwaters. Of interest is the change in TDS upward from 370 mg L−1 in 1938–1958to 1675 mg L−1 in 2007–2013. Moreover, according to our data, this indicator valuechanged from station to station. Similarly, a significant amplitude was found for theelectric conductivity in the monitoring period, the values of which varied at differentstations from 0.36 to 2.26 ms cm−1 that already correspond to slightly brackish waters.The values of the concentration of nitrate nitrogen also fluctuated in the monitoringperiod from 1.6 to 7.7 mg L−1 at different stations, which corresponds to significantorganic pollution and Class 5 of water quality. Thus, the analysis of the values ofchemical parameters shows that the ecosystem of Lake Hula between the historical and
Diversity 2021, 13, 583 8 of 20
monitoring periods underwent changes in water salinity, and organic pollution can beassociated with the water flowing into the lake.
3.2. Species Richness
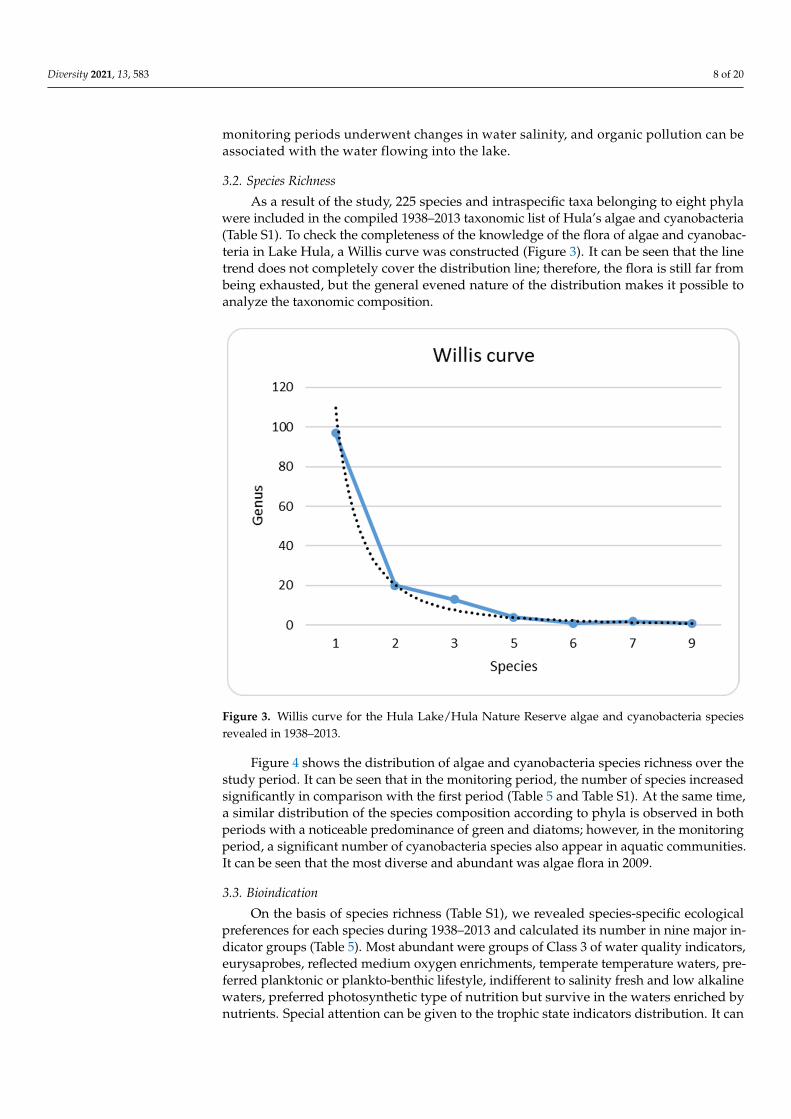
As a result of the study, 225 species and intraspecific taxa belonging to eight phylawere included in the compiled 1938–2013 taxonomic list of Hula’s algae and cyanobacteria(Table S1). To check the completeness of the knowledge of the flora of algae and cyanobac-teria in Lake Hula, a Willis curve was constructed (Figure 3). It can be seen that the linetrend does not completely cover the distribution line; therefore, the flora is still far frombeing exhausted, but the general evened nature of the distribution makes it possible toanalyze the taxonomic composition.
Diversity 2021, 13, 583 8 of 21
Table 4. Chemical variables variation in the Hula Lake/ Hula Nature Reserve in 1938–1958 and 2011.
Parameter 1938–1958 [2,47,48]
2011 Our Data
2011 Average Our Data
Water temperature, °C 4–36 19.9–25.7 22.50 TDS, mg L−1 224–373 255–1675 734.75
Sulfate, mg L−1 ≤ 373 nd nd Nitrate-N, mg L−1 nd 1.6–7.7 5.67
Ammonia-N, mg L −1 0.06 nd nd Chloride, mg L−1 15–50 nd nd
pH 7.2–8.6 7.1–7.9 7.61 Electrical conductivity, ms cm−1 nd 0.36–2.26 1.01
Note: nd—not determined
3.2. Species Richness As a result of the study, 225 species and intraspecific taxa belonging to eight phyla
were included in the compiled 1938–2013 taxonomic list of Hula’s algae and cyanobacteria (Table S1). To check the completeness of the knowledge of the flora of algae and cyano-bacteria in Lake Hula, a Willis curve was constructed (Figure 3). It can be seen that the line trend does not completely cover the distribution line; therefore, the flora is still far from being exhausted, but the general evened nature of the distribution makes it possible to analyze the taxonomic composition.
Figure 3. Willis curve for the Hula Lake/ Hula Nature Reserve algae and cyanobacteria species re-vealed in 1938–2013.
Figure 4 shows the distribution of algae and cyanobacteria species richness over the study period. It can be seen that in the monitoring period, the number of species increased significantly in comparison with the first period (Tables 5 and S1). At the same time, a similar distribution of the species composition according to phyla is observed in both pe-riods with a noticeable predominance of green and diatoms; however, in the monitoring
Figure 3. Willis curve for the Hula Lake/Hula Nature Reserve algae and cyanobacteria speciesrevealed in 1938–2013.
Figure 4 shows the distribution of algae and cyanobacteria species richness over thestudy period. It can be seen that in the monitoring period, the number of species increasedsignificantly in comparison with the first period (Table 5 and Table S1). At the same time,a similar distribution of the species composition according to phyla is observed in bothperiods with a noticeable predominance of green and diatoms; however, in the monitoringperiod, a significant number of cyanobacteria species also appear in aquatic communities.It can be seen that the most diverse and abundant was algae flora in 2009.
3.3. Bioindication
On the basis of species richness (Table S1), we revealed species-specific ecologicalpreferences for each species during 1938–2013 and calculated its number in nine major in-dicator groups (Table 5). Most abundant were groups of Class 3 of water quality indicators,eurysaprobes, reflected medium oxygen enrichments, temperate temperature waters, pre-ferred planktonic or plankto-benthic lifestyle, indifferent to salinity fresh and low alkalinewaters, preferred photosynthetic type of nutrition but survive in the waters enriched bynutrients. Special attention can be given to the trophic state indicators distribution. It can

Diversity 2021, 13, 583 9 of 20
be seen in Table 5 that revealed algae and cyanobacteria species correspond to six fromnine known trophic state groups. Eutrophic species strongly prevail.
Diversity 2021, 13, 583 9 of 21
period, a significant number of cyanobacteria species also appear in aquatic communities. It can be seen that the most diverse and abundant was algae flora in 2009.
Figure 4. Distribution of the phytoplankton species number over taxonomic phyla in the Hula Lake/ Hula Nature Reserve during the study period. (a) Species number, (b) percentage of species in phyla.
3.3. Bioindication On the basis of species richness (Table S1), we revealed species-specific ecological
preferences for each species during 1938–2013 and calculated its number in nine major indicator groups (Table 5). Most abundant were groups of Class 3 of water quality indica-tors, eurysaprobes, reflected medium oxygen enrichments, temperate temperature wa-ters, preferred planktonic or plankto-benthic lifestyle, indifferent to salinity fresh and low alkaline waters, preferred photosynthetic type of nutrition but survive in the waters en-riched by nutrients. Special attention can be given to the trophic state indicators distribu-tion. It can be seen in Table 5 that revealed algae and cyanobacteria species correspond to six from nine known trophic state groups. Eutrophic species strongly prevail.
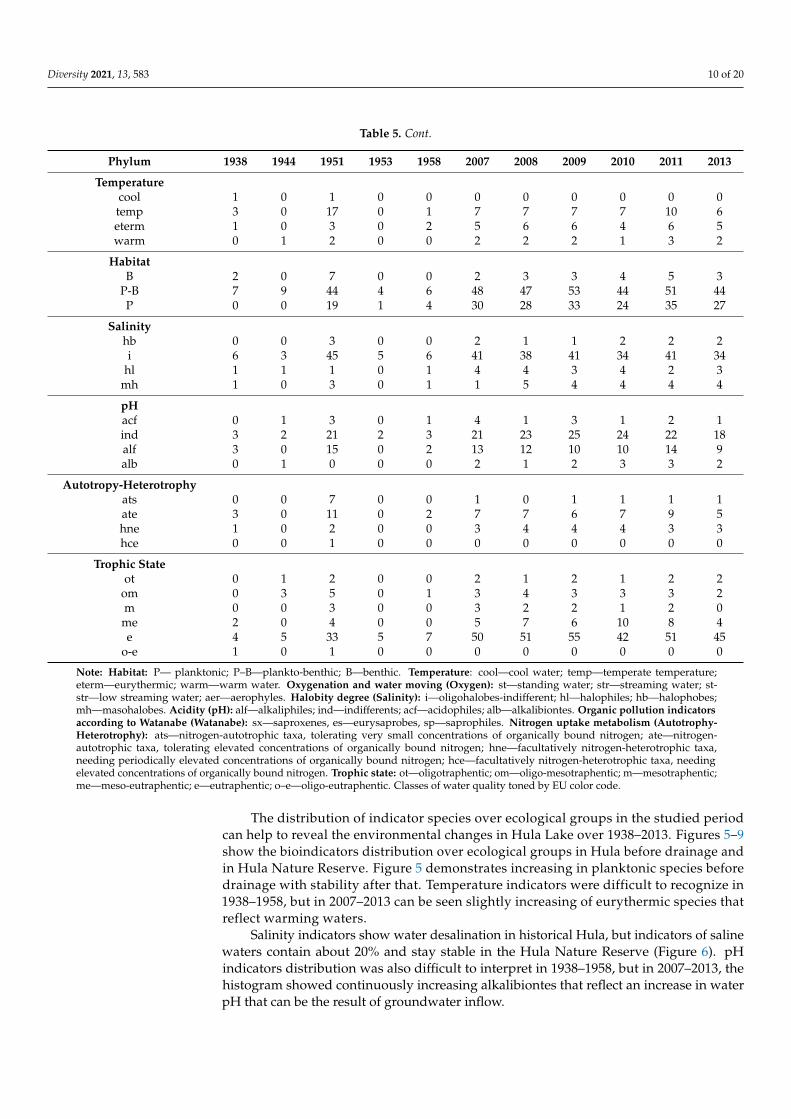
Table 5. Distribution of species richness in algae and cyanobacteria taxonomic phyla and indicator groups over 1938–2013 years in the Hula Lake and Hula Nature Reserve.
Phylum 1938 1944 1951 1953 1958 2007 2008 2009 2010 2011 2013 Hula before drainage Hula Nature Reserve monitoring
Bacillariophyta 5 0 27 0 2 11 11 12 12 15 10 Charophyta 2 0 2 0 0 5 6 6 4 5 3 Chlorophyta 0 0 26 5 2 39 33 37 28 38 33 Cryptophyta 0 0 0 0 0 1 2 2 2 2 1
Cyanobacteria 0 9 0 0 4 15 16 18 15 19 14 Euglenozoa 1 0 7 0 0 8 9 10 8 12 11
Miozoa 1 0 3 0 0 5 3 4 3 3 4 Ochrophyta
(Chrysophyceae) 0 0 1 0 0 0 0 1 0 0 0
Ochrophyta (Eustigmatophyceae) 0 0 0 0 0 2 3 7 4 4 4
Ochrophyta (Xanthophyceae) 0 0 3 0 0 1 2 3 4 1 1
Ochrophyta (Synurophyceae)
0 0 2 0 0 0 0 1 0 0 0
No of Species 9 9 71 5 8 87 85 101 80 99 81 Average Sum of Scores 47.35 59.01 63.01 39 42.8 37.41
Index Saprobity S 2.10 2.13 2.09 2.14 2.01 1.97 Class of Water Quality
Figure 4. Distribution of the phytoplankton species number over taxonomic phyla in the Hula Lake/Hula Nature Reserveduring the study period. (a) Species number, (b) percentage of species in phyla.
Table 5. Distribution of species richness in algae and cyanobacteria taxonomic phyla and indicator groups over 1938–2013years in the Hula Lake and Hula Nature Reserve.
Phylum 1938 1944 1951 1953 1958 2007 2008 2009 2010 2011 2013
Hula before drainage Hula Nature Reserve monitoring
Bacillariophyta 5 0 27 0 2 11 11 12 12 15 10Charophyta 2 0 2 0 0 5 6 6 4 5 3Chlorophyta 0 0 26 5 2 39 33 37 28 38 33Cryptophyta 0 0 0 0 0 1 2 2 2 2 1
Cyanobacteria 0 9 0 0 4 15 16 18 15 19 14Euglenozoa 1 0 7 0 0 8 9 10 8 12 11
Miozoa 1 0 3 0 0 5 3 4 3 3 4Ochrophyta
(Chrysophyceae) 0 0 1 0 0 0 0 1 0 0 0
Ochrophyta(Eustigmatophyceae) 0 0 0 0 0 2 3 7 4 4 4
Ochrophyta(Xanthophyceae) 0 0 3 0 0 1 2 3 4 1 1
Ochrophyta(Synurophyceae) 0 0 2 0 0 0 0 1 0 0 0
No of Species 9 9 71 5 8 87 85 101 80 99 81
Average Sum of Scores 47.35 59.01 63.01 39 42.8 37.41
Index Saprobity S 2.10 2.13 2.09 2.14 2.01 1.97
Class of Water QualityClass 2 1 1 9 1 0 11 5 10 6 9 6Class 3 4 7 36 4 8 52 52 63 50 58 49Class 4 2 0 5 0 0 6 8 7 6 7 4Class 5 0 0 0 0 0 0 0 0 0 0 1
Watanabesx 0 0 7 0 0 0 0 0 0 0 0es 3 0 12 0 2 8 9 9 8 10 7sp 1 0 1 0 0 1 1 1 1 1 1
Oxygenaer 0 0 0 0 0 2 1 1 1 1 2str 0 0 0 0 0 0 0 0 0 0 0
st-str 7 0 48 5 5 45 45 49 41 50 45st 2 0 19 0 2 10 11 12 9 12 10
Diversity 2021, 13, 583 10 of 20
Table 5. Cont.
Phylum 1938 1944 1951 1953 1958 2007 2008 2009 2010 2011 2013
Temperaturecool 1 0 1 0 0 0 0 0 0 0 0temp 3 0 17 0 1 7 7 7 7 10 6eterm 1 0 3 0 2 5 6 6 4 6 5warm 0 1 2 0 0 2 2 2 1 3 2
HabitatB 2 0 7 0 0 2 3 3 4 5 3
P-B 7 9 44 4 6 48 47 53 44 51 44P 0 0 19 1 4 30 28 33 24 35 27
Salinityhb 0 0 3 0 0 2 1 1 2 2 2i 6 3 45 5 6 41 38 41 34 41 34
hl 1 1 1 0 1 4 4 3 4 2 3mh 1 0 3 0 1 1 5 4 4 4 4
pHacf 0 1 3 0 1 4 1 3 1 2 1ind 3 2 21 2 3 21 23 25 24 22 18alf 3 0 15 0 2 13 12 10 10 14 9alb 0 1 0 0 0 2 1 2 3 3 2
Autotropy-Heterotrophyats 0 0 7 0 0 1 0 1 1 1 1ate 3 0 11 0 2 7 7 6 7 9 5hne 1 0 2 0 0 3 4 4 4 3 3hce 0 0 1 0 0 0 0 0 0 0 0
Trophic Stateot 0 1 2 0 0 2 1 2 1 2 2
om 0 3 5 0 1 3 4 3 3 3 2m 0 0 3 0 0 3 2 2 1 2 0me 2 0 4 0 0 5 7 6 10 8 4e 4 5 33 5 7 50 51 55 42 51 45
o-e 1 0 1 0 0 0 0 0 0 0 0
Note: Habitat: P— planktonic; P–B—plankto-benthic; B—benthic. Temperature: cool—cool water; temp—temperate temperature;eterm—eurythermic; warm—warm water. Oxygenation and water moving (Oxygen): st—standing water; str—streaming water; st-str—low streaming water; aer—aerophyles. Halobity degree (Salinity): i—oligohalobes-indifferent; hl—halophiles; hb—halophobes;mh—masohalobes. Acidity (pH): alf—alkaliphiles; ind—indifferents; acf—acidophiles; alb—alkalibiontes. Organic pollution indicatorsaccording to Watanabe (Watanabe): sx—saproxenes, es—eurysaprobes, sp—saprophiles. Nitrogen uptake metabolism (Autotrophy-Heterotrophy): ats—nitrogen-autotrophic taxa, tolerating very small concentrations of organically bound nitrogen; ate—nitrogen-autotrophic taxa, tolerating elevated concentrations of organically bound nitrogen; hne—facultatively nitrogen-heterotrophic taxa,needing periodically elevated concentrations of organically bound nitrogen; hce—facultatively nitrogen-heterotrophic taxa, needingelevated concentrations of organically bound nitrogen. Trophic state: ot—oligotraphentic; om—oligo-mesotraphentic; m—mesotraphentic;me—meso-eutraphentic; e—eutraphentic; o–e—oligo-eutraphentic. Classes of water quality toned by EU color code.
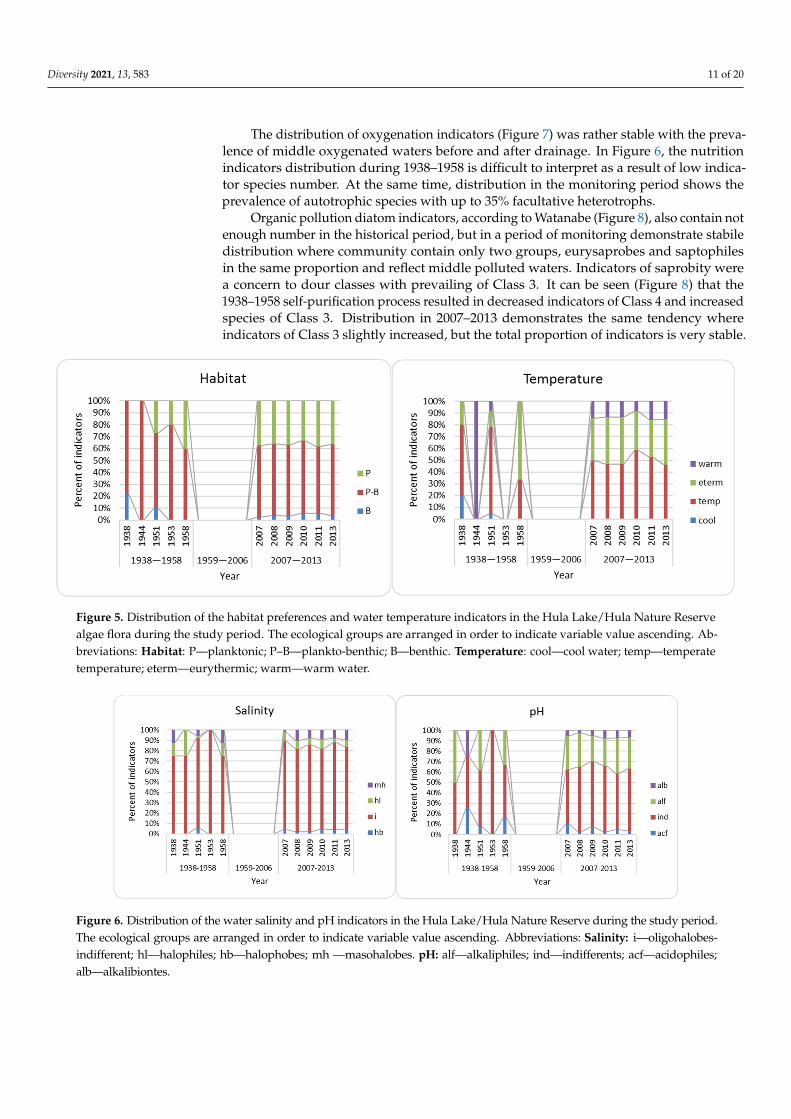
The distribution of indicator species over ecological groups in the studied periodcan help to reveal the environmental changes in Hula Lake over 1938–2013. Figures 5–9show the bioindicators distribution over ecological groups in Hula before drainage andin Hula Nature Reserve. Figure 5 demonstrates increasing in planktonic species beforedrainage with stability after that. Temperature indicators were difficult to recognize in1938–1958, but in 2007–2013 can be seen slightly increasing of eurythermic species thatreflect warming waters.
Salinity indicators show water desalination in historical Hula, but indicators of salinewaters contain about 20% and stay stable in the Hula Nature Reserve (Figure 6). pHindicators distribution was also difficult to interpret in 1938–1958, but in 2007–2013, thehistogram showed continuously increasing alkalibiontes that reflect an increase in waterpH that can be the result of groundwater inflow.
Diversity 2021, 13, 583 11 of 20
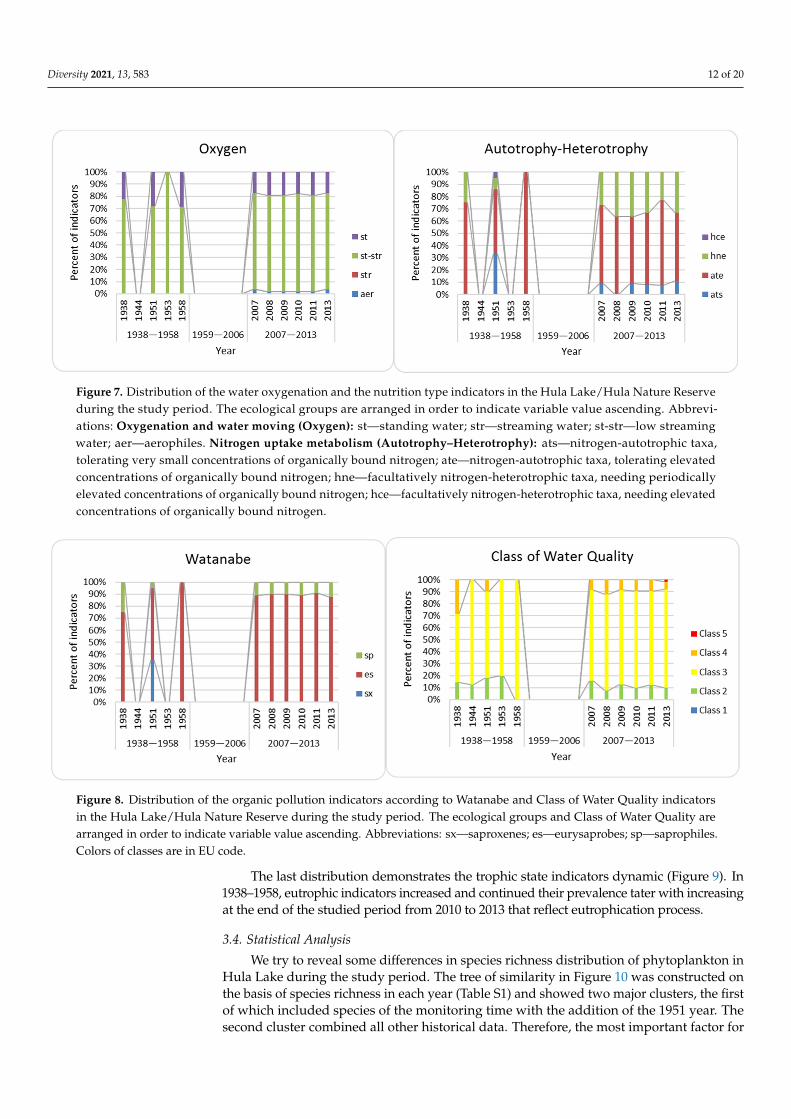
The distribution of oxygenation indicators (Figure 7) was rather stable with the preva-lence of middle oxygenated waters before and after drainage. In Figure 6, the nutritionindicators distribution during 1938–1958 is difficult to interpret as a result of low indica-tor species number. At the same time, distribution in the monitoring period shows theprevalence of autotrophic species with up to 35% facultative heterotrophs.
Organic pollution diatom indicators, according to Watanabe (Figure 8), also contain notenough number in the historical period, but in a period of monitoring demonstrate stabiledistribution where community contain only two groups, eurysaprobes and saptophilesin the same proportion and reflect middle polluted waters. Indicators of saprobity werea concern to dour classes with prevailing of Class 3. It can be seen (Figure 8) that the1938–1958 self-purification process resulted in decreased indicators of Class 4 and increasedspecies of Class 3. Distribution in 2007–2013 demonstrates the same tendency whereindicators of Class 3 slightly increased, but the total proportion of indicators is very stable.
Diversity 2021, 13, 583 11 of 21
tions of organically bound nitrogen; hne—facultatively nitrogen-heterotrophic taxa, needing periodically elevated con-centrations of organically bound nitrogen; hce—facultatively nitrogen-heterotrophic taxa, needing elevated concentra-tions of organically bound nitrogen. Trophic state: ot—oligotraphentic; om—oligo-mesotraphentic; m—mesotraphentic; me—meso-eutraphentic; e—eutraphentic; o–e—oligo-eutraphentic. Classes of water quality toned by EU color code.
The distribution of indicator species over ecological groups in the studied period can help to reveal the environmental changes in Hula Lake over 1938–2013. Figures 5–9 show the bioindicators distribution over ecological groups in Hula before drainage and in Hula Nature Reserve. Figure 5 demonstrates increasing in planktonic species before drainage with stability after that. Temperature indicators were difficult to recognize in 1938–1958, but in 2007–2013 can be seen slightly increasing of eurythermic species that reflect warm-ing waters.
Figure 5. Distribution of the habitat preferences and water temperature indicators in the Hula Lake/Hula Nature Reserve algae flora during the study period. The ecological groups are arranged in order to indicate variable value ascending. Abbreviations: Habitat: P—planktonic; P–B—plankto-benthic; B—benthic. Temperature: cool—cool water; temp—tem-perate temperature; eterm—eurythermic; warm—warm water.
Salinity indicators show water desalination in historical Hula, but indicators of saline waters contain about 20% and stay stable in the Hula Nature Reserve (Figure 6). pH indicators distribution was also difficult to interpret in 1938–1958, but in 2007–2013, the histogram showed continuously increasing alkalibiontes that reflect an increase in water pH that can be the result of groundwater inflow.
Figure 6. Distribution of the water salinity and pH indicators in the Hula Lake/Hula Nature Reserve during the study period. The ecological groups are arranged in order to indicate variable value ascending. Abbreviations: Salinity: i—oligohalobes-indifferent; hl—halophiles; hb—halophobes; mh —masohalobes. pH: alf—alkaliphiles; ind—indifferents; acf—acidophiles; alb—alkalibiontes.
Figure 5. Distribution of the habitat preferences and water temperature indicators in the Hula Lake/Hula Nature Reservealgae flora during the study period. The ecological groups are arranged in order to indicate variable value ascending. Ab-breviations: Habitat: P—planktonic; P–B—plankto-benthic; B—benthic. Temperature: cool—cool water; temp—temperatetemperature; eterm—eurythermic; warm—warm water.
Diversity 2021, 13, 583 11 of 21
tions of organically bound nitrogen; hne—facultatively nitrogen-heterotrophic taxa, needing periodically elevated con-centrations of organically bound nitrogen; hce—facultatively nitrogen-heterotrophic taxa, needing elevated concentra-tions of organically bound nitrogen. Trophic state: ot—oligotraphentic; om—oligo-mesotraphentic; m—mesotraphentic; me—meso-eutraphentic; e—eutraphentic; o–e—oligo-eutraphentic. Classes of water quality toned by EU color code.
The distribution of indicator species over ecological groups in the studied period can help to reveal the environmental changes in Hula Lake over 1938–2013. Figures 5–9 show the bioindicators distribution over ecological groups in Hula before drainage and in Hula Nature Reserve. Figure 5 demonstrates increasing in planktonic species before drainage with stability after that. Temperature indicators were difficult to recognize in 1938–1958, but in 2007–2013 can be seen slightly increasing of eurythermic species that reflect warm-ing waters.
Figure 5. Distribution of the habitat preferences and water temperature indicators in the Hula Lake/Hula Nature Reserve algae flora during the study period. The ecological groups are arranged in order to indicate variable value ascending. Abbreviations: Habitat: P—planktonic; P–B—plankto-benthic; B—benthic. Temperature: cool—cool water; temp—tem-perate temperature; eterm—eurythermic; warm—warm water.
Salinity indicators show water desalination in historical Hula, but indicators of saline waters contain about 20% and stay stable in the Hula Nature Reserve (Figure 6). pH indicators distribution was also difficult to interpret in 1938–1958, but in 2007–2013, the histogram showed continuously increasing alkalibiontes that reflect an increase in water pH that can be the result of groundwater inflow.
Figure 6. Distribution of the water salinity and pH indicators in the Hula Lake/Hula Nature Reserve during the study period. The ecological groups are arranged in order to indicate variable value ascending. Abbreviations: Salinity: i—oligohalobes-indifferent; hl—halophiles; hb—halophobes; mh —masohalobes. pH: alf—alkaliphiles; ind—indifferents; acf—acidophiles; alb—alkalibiontes.
Figure 6. Distribution of the water salinity and pH indicators in the Hula Lake/Hula Nature Reserve during the study period.The ecological groups are arranged in order to indicate variable value ascending. Abbreviations: Salinity: i—oligohalobes-indifferent; hl—halophiles; hb—halophobes; mh —masohalobes. pH: alf—alkaliphiles; ind—indifferents; acf—acidophiles;alb—alkalibiontes.
Diversity 2021, 13, 583 12 of 20
Diversity 2021, 13, 583 12 of 21
The distribution of oxygenation indicators (Figure 7) was rather stable with the prev-alence of middle oxygenated waters before and after drainage. In Figure 6, the nutrition indicators distribution during 1938–1958 is difficult to interpret as a result of low indicator species number. At the same time, distribution in the monitoring period shows the prev-alence of autotrophic species with up to 35% facultative heterotrophs.
Figure 7. Distribution of the water oxygenation and the nutrition type indicators in the Hula Lake/Hula Nature Reserve during the study period. The ecological groups are arranged in order to indicate variable value ascending. Abbreviations: Oxygenation and water moving (Oxygen): st—standing water; str—streaming water; st-str—low streaming water; aer—aerophiles. Nitrogen uptake metabolism (Autotrophy–Heterotrophy): ats—nitrogen-autotrophic taxa, tolerating very small concentrations of organically bound nitrogen; ate—nitrogen-autotrophic taxa, tolerating elevated concentrations of organically bound nitrogen; hne—facultatively nitrogen-heterotrophic taxa, needing periodically elevated concentrations of organically bound nitrogen; hce—facultatively nitrogen-heterotrophic taxa, needing elevated concentrations of organ-ically bound nitrogen.
Organic pollution diatom indicators, according to Watanabe (Figure 8), also contain not enough number in the historical period, but in a period of monitoring demonstrate stabile distribution where community contain only two groups, eurysaprobes and sapto-philes in the same proportion and reflect middle polluted waters. Indicators of saprobity were a concern to dour classes with prevailing of Class 3. It can be seen (Figure 8) that the 1938–1958 self-purification process resulted in decreased indicators of Class 4 and in-creased species of Class 3. Distribution in 2007–2013 demonstrates the same tendency where indicators of Class 3 slightly increased, but the total proportion of indicators is very stable.
Figure 7. Distribution of the water oxygenation and the nutrition type indicators in the Hula Lake/Hula Nature Reserveduring the study period. The ecological groups are arranged in order to indicate variable value ascending. Abbrevi-ations: Oxygenation and water moving (Oxygen): st—standing water; str—streaming water; st-str—low streamingwater; aer—aerophiles. Nitrogen uptake metabolism (Autotrophy–Heterotrophy): ats—nitrogen-autotrophic taxa,tolerating very small concentrations of organically bound nitrogen; ate—nitrogen-autotrophic taxa, tolerating elevatedconcentrations of organically bound nitrogen; hne—facultatively nitrogen-heterotrophic taxa, needing periodicallyelevated concentrations of organically bound nitrogen; hce—facultatively nitrogen-heterotrophic taxa, needing elevatedconcentrations of organically bound nitrogen.
Diversity 2021, 13, 583 12 of 21
The distribution of oxygenation indicators (Figure 7) was rather stable with the prev-alence of middle oxygenated waters before and after drainage. In Figure 6, the nutrition indicators distribution during 1938–1958 is difficult to interpret as a result of low indicator species number. At the same time, distribution in the monitoring period shows the prev-alence of autotrophic species with up to 35% facultative heterotrophs.
Figure 7. Distribution of the water oxygenation and the nutrition type indicators in the Hula Lake/Hula Nature Reserve during the study period. The ecological groups are arranged in order to indicate variable value ascending. Abbreviations: Oxygenation and water moving (Oxygen): st—standing water; str—streaming water; st-str—low streaming water; aer—aerophiles. Nitrogen uptake metabolism (Autotrophy–Heterotrophy): ats—nitrogen-autotrophic taxa, tolerating very small concentrations of organically bound nitrogen; ate—nitrogen-autotrophic taxa, tolerating elevated concentrations of organically bound nitrogen; hne—facultatively nitrogen-heterotrophic taxa, needing periodically elevated concentrations of organically bound nitrogen; hce—facultatively nitrogen-heterotrophic taxa, needing elevated concentrations of organ-ically bound nitrogen.
Organic pollution diatom indicators, according to Watanabe (Figure 8), also contain not enough number in the historical period, but in a period of monitoring demonstrate stabile distribution where community contain only two groups, eurysaprobes and sapto-philes in the same proportion and reflect middle polluted waters. Indicators of saprobity were a concern to dour classes with prevailing of Class 3. It can be seen (Figure 8) that the 1938–1958 self-purification process resulted in decreased indicators of Class 4 and in-creased species of Class 3. Distribution in 2007–2013 demonstrates the same tendency where indicators of Class 3 slightly increased, but the total proportion of indicators is very stable.
Figure 8. Distribution of the organic pollution indicators according to Watanabe and Class of Water Quality indicatorsin the Hula Lake/Hula Nature Reserve during the study period. The ecological groups and Class of Water Quality arearranged in order to indicate variable value ascending. Abbreviations: sx—saproxenes; es—eurysaprobes; sp—saprophiles.Colors of classes are in EU code.
The last distribution demonstrates the trophic state indicators dynamic (Figure 9). In1938–1958, eutrophic indicators increased and continued their prevalence tater with increasingat the end of the studied period from 2010 to 2013 that reflect eutrophication process.
3.4. Statistical Analysis
We try to reveal some differences in species richness distribution of phytoplankton inHula Lake during the study period. The tree of similarity in Figure 10 was constructed onthe basis of species richness in each year (Table S1) and showed two major clusters, the firstof which included species of the monitoring time with the addition of the 1951 year. Thesecond cluster combined all other historical data. Therefore, the most important factor for

Diversity 2021, 13, 583 13 of 20
species similarity can be species richness. It means that important to continue to monitorthe phytoplankton in Hula Lake to reveal the tendency in species richness succession.
Diversity 2021, 13, 583 13 of 21
Figure 8. Distribution of the organic pollution indicators according to Watanabe and Class of Water Quality indicators in the Hula Lake/Hula Nature Reserve during the study period. The ecological groups and Class of Water Quality are ar-ranged in order to indicate variable value ascending. Abbreviations: sx—saproxenes; es—eurysaprobes; sp—saprophiles. Colors of classes are in EU code.
The last distribution demonstrates the trophic state indicators dynamic (Figure 9). In 1938–1958, eutrophic indicators increased and continued their prevalence tater with in-creasing at the end of the studied period from 2010 to 2013 that reflect eutrophication process.
Figure 9. Distribution of the trophic state indicators in the Hula Lake / Hula Nature Reserve during the study period. The ecological groups are arranged in order to indicate variable value ascending. Abbreviations: ot—oligotraphentic; om—oligo-mesotraphentic; m—mesotraphentic; me—meso-eutraphentic; e—eutraphentic; o–e —oligo-eutraphentic.
3.4. Statistical Analysis We try to reveal some differences in species richness distribution of phytoplankton
in Hula Lake during the study period. The tree of similarity in Figure 10 was constructed on the basis of species richness in each year (Table S1) and showed two major clusters, the first of which included species of the monitoring time with the addition of the 1951 year. The second cluster combined all other historical data. Therefore, the most important factor for species similarity can be species richness. It means that important to continue to mon-itor the phytoplankton in Hula Lake to reveal the tendency in species richness succession.
Figure 9. Distribution of the trophic state indicators in the Hula Lake/Hula Nature Reserve duringthe study period. The ecological groups are arranged in order to indicate variable value ascending.Abbreviations: ot—oligotraphentic; om—oligo-mesotraphentic; m—mesotraphentic; me—meso-eutraphentic; e—eutraphentic; o–e —oligo-eutraphentic.
Correlation for the JASP network (Figure 11) was calculated on the basis of Table 5,which included data of the distribution of species richness in phyla and environmentalbioindicators groups over the years in studied periods. Can be seen two clusters, thefirst of which (cluster 1) combines variables from 1938 to 1958, while the second clusterincludes all data from 2007 to 2013. Such a strict division by periods may be the result of the“alignment” of ecological and taxonomic indicators corresponding to different ecosystemsseparated in space and time.
Diversity 2021, 13, 583 14 of 21
Figure 10. Tree of similarity by Bray–Curtis analysis of the Hula Lake/Hula Nature Reserve species in communities during 1938–2013.
Correlation for the JASP network (Figure 11) was calculated on the basis of Table 5, which included data of the distribution of species richness in phyla and environmental bioindicators groups over the years in studied periods. Can be seen two clusters, the first of which (cluster 1) combines variables from 1938 to 1958, while the second cluster in-cludes all data from 2007 to 2013. Such a strict division by periods may be the result of the "alignment" of ecological and taxonomic indicators corresponding to different ecosystems separated in space and time.
Figure 11. JASP network graph of correlation of species richness in algae and cyanobacteria Phyla and environmental bioindicator groups over the years in the Hula Lake/Hula Nature Reserve dur-ing 1938–2013. The line thickness is related to the value of the calculated correlation. Red lines reflect a negative correlation, and blue lines are positive correlations. Dashed lines outlined two different clusters of the Hula Lake ecosystem.
Figure 10. Tree of similarity by Bray–Curtis analysis of the Hula Lake/Hula Nature Reserve speciesin communities during 1938–2013.

Diversity 2021, 13, 583 14 of 20
Diversity 2021, 13, 583 14 of 21
Figure 10. Tree of similarity by Bray–Curtis analysis of the Hula Lake/Hula Nature Reserve species in communities during 1938–2013.
Correlation for the JASP network (Figure 11) was calculated on the basis of Table 5, which included data of the distribution of species richness in phyla and environmental bioindicators groups over the years in studied periods. Can be seen two clusters, the first of which (cluster 1) combines variables from 1938 to 1958, while the second cluster in-cludes all data from 2007 to 2013. Such a strict division by periods may be the result of the "alignment" of ecological and taxonomic indicators corresponding to different ecosystems separated in space and time.
Figure 11. JASP network graph of correlation of species richness in algae and cyanobacteria Phyla and environmental bioindicator groups over the years in the Hula Lake/Hula Nature Reserve dur-ing 1938–2013. The line thickness is related to the value of the calculated correlation. Red lines reflect a negative correlation, and blue lines are positive correlations. Dashed lines outlined two different clusters of the Hula Lake ecosystem.
Figure 11. JASP network graph of correlation of species richness in algae and cyanobacteria Phylaand environmental bioindicator groups over the years in the Hula Lake/Hula Nature Reserve during1938–2013. The line thickness is related to the value of the calculated correlation. Red lines reflecta negative correlation, and blue lines are positive correlations. Dashed lines outlined two differentclusters of the Hula Lake ecosystem.
3.5. Index Saprobity S and Organic Pollution
Based on the known species-specific saprobity indices (Table S1) and data on theoccurrence of algae and cyanobacteria species, which were determined only in the mon-itoring period, the saprobity indices were calculated for each of the communities. Thenwe calculated the average saprobity index for the year, which is presented in Table 5.The saprobity index S reflects the organic pollution of lake waters. The dynamics of theindex S values are presented in Figure 12, along with the average species richness and theaverage sum of abundance scores for each year of monitoring. Figure 12 shows that index Sfluctuated in the narrow range of Class 3 between 1.98 and 2.19. Nevertheless, the S valuesreflected the same Class of water quality; the trend line decreased and proposed organicpollution press during the monitoring period. The same decreasing tendency demonstratedspecies richness and algae and cyanobacteria abundance as the sum of scores. It can be thebeginning of the negative succession of communities under the organic pollution press.
3.6. Trophic State Indices
The indices of the trophic status of the lake were calculated based on the distri-bution of the identified species composition over the main taxonomic groups. Table 6shows the calculated values of the Nygaard Species Index and its modified variantsmade based on Table S1.
For the historical period, it was possible to calculate the NS index for 1951 only, whenthe algae and cyanobacteria community description was most complete and included allgroups necessary for calculation. For 2007–2013, the NS index was calculated for eachyear. It turned out that trophicity of the Hula Lake according to NS index changed fromoligotrophic before drainage to hypertrophic in the monitoring period. At the same time,the QG index turned out to be available for calculation, although species-poor communitiesduring 1938–1958 excluding 1951 showed a hypertrophic state, which is clearly inadequatedue to the calculation method. In 1951, the QG index assessed the lake as oligotrophic, andin 2007–2013 as eutrophic, or in 2009 as mesotrophic.

Diversity 2021, 13, 583 15 of 20
Diversity 2021, 13, 583 15 of 21
3.5. Index Saprobity S and Organic Pollution Based on the known species-specific saprobity indices (Table S1) and data on the oc-
currence of algae and cyanobacteria species, which were determined only in the monitor-ing period, the saprobity indices were calculated for each of the communities. Then we calculated the average saprobity index for the year, which is presented in Table 5. The saprobity index S reflects the organic pollution of lake waters. The dynamics of the index S values are presented in Figure 12, along with the average species richness and the aver-age sum of abundance scores for each year of monitoring. Figure 12 shows that index S fluctuated in the narrow range of Class 3 between 1.98 and 2.19. Nevertheless, the S values reflected the same Class of water quality; the trend line decreased and proposed organic pollution press during the monitoring period. The same decreasing tendency demon-strated species richness and algae and cyanobacteria abundance as the sum of scores. It can be the beginning of the negative succession of communities under the organic pollu-tion press.
Figure 12. Distribution of the Hula Lake/Hula Nature Reserve algae and cyanobacteria species rich-ness, abundance (as sum of scores), and calculated Index of Saprobity S for 2007–2013.
3.6. Trophic State Indices The indices of the trophic status of the lake were calculated based on the distribution
of the identified species composition over the main taxonomic groups. Table 6 shows the calculated values of the Nygaard Species Index and its modified variants made based on Table S1.
For the historical period, it was possible to calculate the NS index for 1951 only, when the algae and cyanobacteria community description was most complete and included all groups necessary for calculation. For 2007–2013, the NS index was calculated for each year. It turned out that trophicity of the Hula Lake according to NS index changed from oligotrophic before drainage to hypertrophic in the monitoring period. At the same time, the QG index turned out to be available for calculation, although species-poor communi-ties during 1938–1958 excluding 1951 showed a hypertrophic state, which is clearly inad-equate due to the calculation method. In 1951, the QG index assessed the lake as oligo-trophic, and in 2007–2013 as eutrophic, or in 2009 as mesotrophic.
The NY index for each of the five sub-indices was calculated for historical and mon-itoring data for individual sub-indices and years. In general, the change in the trophic status of the lake according to the NY index is assessed as a transition from mesotrophic
Figure 12. Distribution of the Hula Lake/Hula Nature Reserve algae and cyanobacteria speciesrichness, abundance (as sum of scores), and calculated Index of Saprobity S for 2007–2013.
Table 6. Nygaard Species Index (NY), Modified Nygaard Species Index (NS), and Quality Group species sub-index (QG)calculated for the Hula Lake/Hula Nature Reserve algae and cyanobacteria communities in 1938–2013. Trophic stateassessment category that can be used in monitoring are in bold.
Hula before Drainage Hula Nature Reserve MonitoringIndex 1938 1944 1951 1953 1958 2007 2008 2009 2010 2011 2013
NS na na 6.6 na na 12.4 11.6 9.3 12.8 17.3 29.0Trophic state na na e na na hy hy hy hy hy hy
QG 6 0 48 0 2 27 26 38 25 28 19Trophic state hy hy o hy hy e e m e e e
NYindex 1 na na 0 na na 3 3.2 3.6 3.75 4.75 7index 2 na na 11 na na 7.6 6.4 7 6.75 8.75 16index 3 0.67 na 0.24 na 1 0.38 0.57 0.5 0.33 0.36 0.43index 4 0.5 0 0.32 0 0.4 0.15 0.19 0.19 0.19 0.22 0.24index 5 na na 17 na na 12.8 12.2 13.4 13.25 17.5 30
Trophic stateindex 1 na na o na na e e na na na naindex 2 na na na o na na na na na na naindex 3 m na m o se m m m m m mindex 4 m o m o m o o o o m mindex 5 na na na na na na na na na na na
The NY index for each of the five sub-indices was calculated for historical and mon-itoring data for individual sub-indices and years. In general, the change in the trophicstatus of the lake according to the NY index is assessed as a transition from mesotrophic or,in some years, oligotrophic before draining to oligotrophic at the beginning of monitoringtime with a transition to mesotrophic at its end.
In general, it can be concluded that the QG index and the NY index, in the case ofcalculating sub-indices 3 and 4, can be used to assess the trophic status of Lake Hula, butonly if algae and cyanobacteria communities are studied during the monitoring process,and not sporadically.

Diversity 2021, 13, 583 16 of 20
4. Discussion
The state of aquatic ecosystems is most often assessed by the chemical compositionof water [37,49,50]. However, biological indicators can seriously complement chemicalanalysis. The bioindication method is integral and allows one to determine the dynamicof ecosystem development under the influence of the sum of factors, and not onlyto quantitatively determine a given physical or chemical parameter at the time ofsampling [39,40,42,51–54]. In addition, the use of bioindicators can help in cases wherechemical analysis data are not available [55], as in our case when a small set of chemicaldata was published for a historical period [2,47,48].
We applied the bioindication method to analyze historical data from Lake Hula and,despite the lack of synchronous chemical data, were able to follow up on the dynamic ofthe wetland ecosystem state.
Nevertheless, despite sporadically studying algae and cyanobacteria species com-position in the Hula Lake and Nature Reserve in a period of about a hundred years(1938–2013), 225 species and intraspecific taxa belonging to eight phyla were revealed.Our calculations confirmed that the flora is still far from exhaustion and can be enrichedwith subsequent monitoring. This is a fairly large list of species for such a small territoryand was sporadically studied compared to other wetlands in Europe, Israel, Ukraine, andKazakhstan [50–54]. The same problem with the unevenness of research was successfullysolved in the study of long-term changes in the lake using a list of algae and cyanobacteriaspecies from publications of previous years [55] on the territory of Ukraine.
The face of the Hula Natural Reserve flora can be considered the predominanceof green algae, followed by diatoms and cyanobacteria. Our analysis showed that thisratio remains constant in Hula Lake and HNR. However, the total species richness isincomparably higher in the HNR, most likely as a result of monitoring and detailedtaxonomic analysis. It should also be noted that during regular studies in 2007–2013, thespecies richness and abundance changed synchronously, and the ratios in the taxonomicaland ecological groups remained fairly constant, which may indicate the stability of theecosystem and the success of the conservation regime.
We found ourselves in a difficult position in determining changes in the ecosystemof Lake Hula over such a long period since we did not have synchronous data on envi-ronmental parameters with data on algae and cyanobacteria communities. As is known,both data sets are needed to determine the state of an ecosystem [56], especially for thepurpose of conservation and management of lakes [51,57]; moreover, it is chemical datathat usually receive more attention in assessing ecosystem dynamics [58]. Indices showingchanges in trophic status are mostly based on hydrochemical variables [59–61], whichin our case is practically not available. We only have data on the species compositionand even similarity of the year’s species lists is important for revealing the differencesbetween communities [62]. Despite the problem, we tried to assess the dynamics of thelake’s ecosystem by establishing the environmental parameters by the communities oforganisms living in it, using bioindication methods.
Although it was difficult to establish some indicator groups in 1938–1958 becauseof low species content, we revealed an increasing percentage of planktonic species in thehistorical period with stability in a period of monitoring that could be the result of thewater body volume stabilization. Temperature indicators demonstrated a slight increasein eurythermic species that reflect warming waters due to significant water swallowingand a decrease in the area of the reservoir. In this regard, we confirmed that the HulaNature Reserve is considered to the subtropical lakes more than to boreal [58,63]. In thiscase, it was very important to reveal some indicators that characterize the warm-waterenvironment of the lake.
Salinity is an important variable in the semi-arid climate. Our analysis shows waterdesalination during 1938–1958, but in 2007–2013, it stayed stable. Water pH slightlyincreased, which can be the result of groundwater inflow, whereas the middle oxygenatedwaters indicators group prevailed during both periods and confirmed the stability of

Diversity 2021, 13, 583 17 of 20
the waterbody. We analyzed some variables that cannot be defined with the chemicalanalysis but are very important for the ecosystem characteristic. It means nutrition typeof planktonic species and trophic state indicators. So, indicators in the Hula Lake weremostly autotrophic species with one-third of facultative heterotrophs. It means that thelake ecosystem periodically can be stressed by environmental factors but successfully avoidit. The analysis of a few aquatic ecosystems such as the Lower Jordan [64], Qishon [65],and Hadera [66] rivers, and especially the Upper Jordan River catchment basin [58,67,68]shows that ecosystem stress by nutrients inflow, toxic substances, salinity or temperaturecan be revealed more effective by bioindicators than by chemical methods.
The trophic state indicators distribution shows increasing in eutrophic species numberin time and reflects the eutrophication process. In this relation, we analyzed the waterquality indicators distribution over the studied periods and revealed that species of Class 3slightly increased, but the total proportion of indicators of water quality is very stable inthe old Hula as well as in the HNR.
Comparison of species richness of algae and cyanobacteria in the Hula Lake dur-ing study years with statistical methods reveal two different clusters, the first of whichcombined taxa of 2007–2013 with the addition of the 1951 year and second with otherhistorical data. This difference in distribution helps us to allow that the most importantfactor for species similarity can be the number of species in the community. It confirms thatimportant to continue the algae and cyanobacteria flora study in Hula Lake for revealingthe tendency in succession. Statistical correlation of the phyla species richness and numberof environmental indicators, on the contrary, revealed to be strong following to drainageperiods that can be the result of the “alignment” of ecological and taxonomic indicatorscorresponding to different ecosystems separated in space and time.
The saprobity index S calculated by us for the monitoring years reflects the organicpollution of lake waters fluctuated in the narrow range of Class 3 with decreasing in timeof 2007–2013. It can be evidence of the self-purification process in the Hula Nature Reserveecosystem on the one hand, but the similar decreasing tendency of species richness andabundance (as the sum of scores) can reflect the beginning of the negative succession of theaquatic community as a result of organic pollution press.
In this case, it is important to reveal the trophic state tendency in the lake ecosys-tem. However, we have the same problem: we have the species list only. For calculationof trophic state indices (many of which are based on a combination of chemical dataand aquatic community productivity), we choose the Nygaard index [21] and its mod-ern derivates [46,69], where the taxonomic composition is enough for the trophic stateassessment. The calculated indices of the trophic state make it possible to classify LakeHula as one that changed from oligotrophic in the historical period to eutrophic or evenhypertrophic in the 2000s. The QG and NY indices [69] can be recommended for assessingthe trophic status of wetlands and aquatic ecosystems, but only if species composition hadbeen studied during monitoring and not sporadically.
A comparison of the floras and bioindicators of the two Ramsar wetlands in Israel, theHula Nature Reserve in the rift valley below sea level, and the Afek Nature Reserve [70]on the Mediterranean coast may also provide a direction for future research. The mecha-nism and criteria have been developed for the well-studied regions of the Mediterraneanbasin [71,72] in the context of climate aridization and anthropogenic transformation. Fur-ther areas of work may be the expansion of the use of bioindication in the monitoring ofsmall water bodies in Israel for a better understanding of ecosystems’ state and identifica-tion of potential objects of protection.
5. Conclusions
1. For the first time, for long-term bioindication analysis used compiled data fromreferences previous decades published and modern monitoring results;
2. Despite the sporadical character of algae and cyanobacteria studies in the HulaLake/Hula Nature Reserve, 225 species and intraspecific taxa belonging to eight

Diversity 2021, 13, 583 18 of 20
phyla were revealed in 1938–2013. This species list is fairly large for such a smallterritory but is still far from exhaustion and can be enriched with subsequent works;
3. Comparison of Lake Hula and Hula Nature Reserve algae and cyanobacteria florareveals many similarities; however, the bioindication noticed salinity and organicpollution increase in a modern time. The increase seems to be caused by water flowinginto the Hula Nature Reserve water body;
4. The use of bioindication methods and our own created database of aquatic floraspecies ecological preferences made it possible to mark the environmental dynamicsof water bodies only based on the species composition of algae and cyanobacteria. Ourwork shows the special relevance of bioindication for monitoring aquatic ecosystemsin situations of impossibility to obtain hydrological data and count the exact speciesabundance and biomass.
Supplementary Materials: The following are available online at https://www.mdpi.com/article/10.3390/d13110583/s1. Table S1. Diversity and ecology of algae and cyanobacteria in the HulaLake/Hula Nature Reserve over 1938–2013.
Author Contributions: Conceptualization, S.B. and A.A.; methodology, S.B. and A.A.; software, S.B.;validation, S.B. and A.A.; formal analysis, S.B. and A.A.; investigation, S.B. and A.A.; resources, S.B.and A.A.; data curation, A.A.; writing—original draft preparation, S.B. and A.A.; writing—reviewand editing, S.B. and A.A.; visualization, S.B.; supervision, S.B.; project administration, S.B. Allauthors have read and agreed to the published version of the manuscript.
Funding: This research received no external funding.
Institutional Review Board Statement: Not applicable.
Informed Consent Statement: Not applicable.
Data Availability Statement: Data available in Table S1.
Acknowledgments: We are very thankful to Yifat Artzi for sampling, who did all fieldwork duringthe Hula Nature Reserve monitoring program and information help while writing the article. IsraelNature and Parks Authority funded the Hula Nature Reserve monitoring. This work was partlysupported by the Israeli Ministry of Aliyah and Integration. We are also thankful to Elena Cherniavskyfor help in the database compilation.
Conflicts of Interest: The authors declare no conflict of interest.
References1. Junk, W.J.; Shuqing, A.; Finlayson, C.M.; Gopal, B.; Kvet, J.; Stephen, A.; Mitchell, S.A.; Mitsch, W.J.; Robarts, R.D. Current state
of knowledge regarding the world’s wetlands and their future under global climate change: A synthesis. Aquat. Sci. 2013, 75,151–167. [CrossRef]
2. Pollingher, U.; Zohary, T.; Fishbein, T. Algal flora in the Hula valley—Past and present. Isr. J. Plant Sci. 1998, 46, 155–168.[CrossRef]
3. Payne, R.J. A longer-term perspective on human exploitation and management of peat wetlands: The Hula Valley, Israel. MiresPeat. 2012, 4, 1–9.
4. Hambright, K.D.; Zohary, T. Lakes Hula and Agmon: Destruction and creation of wetland ecosystems in northern Israel. Wetl.Ecol. Manag. 1998, 6, 83–89. [CrossRef]
5. Freshwater Ecoregions of the World, (FEOW). Available online: https://www.feow.org/ (accessed on 21 September 2021).6. Hambright, K.D.; Zohary, T. The Hula Valley (Northern Israel) Wetlands Rehabilitation Project. In An International Perspective on
Wetland Rehabilitation; Streever, W., Ed.; Kluwer Academic Publishers: Dordrecht, The Netherlands, 1999; pp. 73–180.7. Cohen-Shacham, E.; Dayan, T.; Feitelson, E.; de Groot, R.S. Ecosystem service trade-offs in wetland management: Drainage and
rehabilitation of the Hula, Israel. Hydrol. Sci. 2011, 56, 1582–1601. [CrossRef]8. The List of Wetlands of International Importance. Published 6 July 2021. Available online: https://www.ramsar.org/sites/
default/files/documents/library/sitelist (accessed on 21 September 2021).9. Rayss, T.; Katchalsky, E. On the plankton in Lake Hula. Hatevah Ve’Haaretz 1938, 5, 483–490. (In Hebrew)10. Rayss, T. Materiaux pour Ia flore algologique de Ia Palestine I. Les cyanophycees. Palest. J. Bot. Jerus. Ser. 1944, 3, 94–113. (In French)11. Rayss, T. Materiaux pour Ia flore algologique de Ia Palestine II. Les algues des eaux con tinentales. Palest. J. Bot. Jerusalem Ser.
1951, 5, 71–95. (In French)12. Komarovsky, B. To the knowledge of the Hula plankton. Alon Hadayagim 1958, 15, 20–28. (In Hebrew)
Diversity 2021, 13, 583 19 of 20
13. Ehrlich, A. Quarternary diatoms of the Hula basin (Northern Israel). Geol. Surv. Lsr. Bull. Jerus. Isr. 1973, 58, 1–39.14. Sherman, J.W.; Patrick, R. The waters of Merom: A study of Lake Huleh, 7. Diatom stratigraphy of the 54-m core. Arch. Hydrobiol.
1981, 92, 199–221.15. Directive 2000/60/EC of the European Parliament and of the Council establishing a framework for Community action in the
field of water policy. Off. J. Eur. Communities 2000, 327, 1–72. Available online: http://ec.europa.eu/environment/water/water-framework/index_en.html (accessed on 21 September 2021).
16. UNEP/IPCS. Training Module No. 3. Section C, Ecological Risk Assessment, Prepared by The Edinburgh Centre for Toxicology.Available online: https://www.epa.gov/risk/ecological-risk-assessment (accessed on 21 September 2021).
17. Carlson, R.E. A trophic state index for lakes. Limnol. Oceanogr. 1977, 22, 361–369. [CrossRef]18. Bomfim, E.O.; Kraus, C.N.; Bonnet, M.P.; Lobo, M.T.M.P.S.; Nogueira, I.S.; Peres, L.G.M.; Boaventura, G.R.; Laques, A.E.;
Garnier, J.; Marques, D.M. Trophic state index validation based on phytoplankton functional groups approach in Amazonfloodplains lakes. Inland Waters 2019, 9, 309–319. [CrossRef]
19. Bere, T. Are diatom-based biotic indices developed in eutrophic, organically enriched waters reliable monitoring metrics in cleanwaters? Ecol. Indic. 2016, 62, 312–316. [CrossRef]
20. Gal, G.; Zohary, T. Development and application of a sustainability index for a lake ecosystem. Hydrobiologia 2017, 800, 207–223.[CrossRef]
21. Nygaard, G. Hydrobiological studies on some Danish ponds and lakes, II: The quotient hypothesis and some little known or newphytoplankton organisms. K. Dan. Vidensk. Selsk. 1949, 7, 1–242.
22. Zohary, M.; Orshansky, G. The vegetation of the Huleh plain. Palest. J. Bot. Jerus. Ser. 1947, 4, 90–104.23. Livneh, M. The Hula drainage project. Ecol. Environ. 1994, 4, 211–219. (In Hebrew)24. Salingar, Y. Hula Project Base Map; GIS Division, Keren Kayemet L’Israel: Israel, Jerusalem, 1995.25. Zohary, T.; Hambright, K.D. Lake Hula Lake Agmon. The Israel Review of Arts and Letters 1999, 109. Available online:
https://www.mfa.gov.il/MFA/MFA-Archive/1999/Pages/Lake%20Hula%20%E2%80%93%20Lake%20Agmon.aspx (accessedon 23 September 2021).
26. Avisar, D.; Fox, A.S. Chemical evolution and vegetation response in an altered wetland ecosystem, Hula Valley, Israel (1988–2004).J. Environ. Sci. Health 2012, 47, 1096–1103. [CrossRef]
27. Huber–Pestalozzi, G. Das Phytoplankton des Süßwassers: Systematik und Biologie, Teil 4., Euglenophycean; E. Schweizerbart’scheVerlagsbuchhandlung (Nägele u. Obermiller): Stuttgart, Germany, 1969; pp. 1–405.
28. Ettl, H. Xantophyceae. In Süßwasserflora von Mitteleuropa 3 (1); Gustav Fisher Verlag: Stuttgart, Germany, 1978; 530p.29. Komárek, J.; Fott, B. Chlorophyceae (Griinalgen), Ordnung Chlorococcales. In Huber-Pestalozzi, G. Das Phytoplankton des
Siisswassers 16, Teil 7(1). Die Binnengewasser; Schweizerbartsche Buchhandl: Stuttgart, Germany, 1983; Volume XVI, 1044p.30. Cox, E.J. Identification of Freshwater Diatoms from Live Material; Chapman & Hall: London, UK, 1996; 158p.31. Komárek, J.; Anagnostidis, K. Cyanoprokaryota 1, Teil: Chroococcales. In Süßwasserflora von Mitteleuropa, Bd. 19/1; Ettl, H.,
Gärtner, G., Heynig, H., Mollenhauer, D., Eds.; Gustav Fischer Verlag: Stuttgart, Germany; New York, NY, USA, 1999; 548p.32. Komárek, J.; Anagnostidis, K. Cyanoprokaryota 2. Teil: Oscillatoriales. In Süßwasserflora von Mitteleuropa, Bd. 19(2); Büdel, B.,
Gärtner, G., Krienitz, L., Schagerl, M., Eds.; Elsevier GmbH: München, Germany, 2005; 759p.33. John, D.M.; Whitton, B.A.; Brook, A.J. (Eds.) The Freshwater Algal Flora of the British Isles: An Identification Guide to Freshwater and
Terrestrial Alga; Cambridge University Press: Cambridge, UK, 2002; pp. 1–702.34. Guiry, M.D.; Guiry, G.M. AlgaeBase. World-Wide Electronic Publication, National University of Ireland, Galway. Available online:
http://www.algaebase.org (accessed on 21 September 2021).35. Korde, N.V. The methods of biological studies for the bottom deposits of lakes (the field methods of biological analysis). In Life in
Fresh Waters of USSR; Pavlovsky, E.N., Zhadin, V.I., Eds.; Nauka Press: Moscow, Russia, 1956; pp. 383–413.36. Barinova, S. How to Align and Unify the Cell Counting of Organisms for Bioindication. Int. J. Environ. Sci. Nat. Resour. 2017,
2, 555585. [CrossRef]37. Friedrich, G.; Chapman, D.; Beim, A.; UNESCO/WHO/UNEP. Chapter 5, The use of biological material. In Water Quality
Assessments—A Guide to Use of Biota, Sediments and Water in Environmental Monitoring, 2nd ed.; Chapman, D., Ed.; E & FN Spon:London, UK, 1996; 626p, Available online: https://apps.who.int/iris/handle/10665/41850 (accessed on 21 September 2021).
38. Barinova, S. Systemic Criteria for the Analysis of Alpha- and Gamma-Diversity of Freshwater Algae. Int. J. Environ. Sci. Nat. Res.2017, 4, 555633. [CrossRef]
39. Barinova, S.S.; Belous, Y.P.; Tsarenko, P.M. Algal Indication of Water Bodies in Ukraine; Haifa University Press: Haifa, Israel; Kiev,Ukraine, 2019; pp. 1–367. (In Russian)
40. Sládecek, V. System of water quality from the biological point of view. Arch. Für Hydrobiologie. Beih. Ergeb. Der Limnol. 1973, 7,1–218.
41. Sládecek, V. Diatoms as indicators of organic pollution. Acta Hydroch. Hydrobiol. 1986, 14, 555–566. [CrossRef]42. Barinova, S. On the Classification of Water Quality from an Ecological Point of View. Int. J. Environ. Sci. Nat. Resour. 2017, 2, 1–8.
[CrossRef]43. Love, J.; Selker, R.; Marsman, M.; Jamil, T.; Dropmann, D.; Verhagen, A.J.; Ly, A.; Gronau, Q.F.; Smira, M.; Epskamp, S.; et al.
JASP: Graphical statistical software for common statistical designs. J Stat. Softw. 2019, 88, 1–17. [CrossRef]44. Cardinale, B.J. Biodiversity improves water quality through niche partitioning. Nature 2011, 472, 86–89. [CrossRef]

Diversity 2021, 13, 583 20 of 20
45. Watson, S.B.; McCauley, E.; Dawning, J.A. Patterns in phytoplankton taxonomic composition across temperate lakes of differentnutrient status. Limnol. Oceanogr. 1997, 42, 487–495. [CrossRef]
46. Katsiapia, M.; Moustaka-Gouni, M.; Sommer, U. Assessing ecological water quality of freshwaters: PhyCoI—a new phytoplanktoncommunity Index. Ecol. Inform. 2016, 31, 22–29. [CrossRef]
47. Jones, R.F. Report of the Percy Sladen Expedition to Lake Huleh: A Contribution to the Study of the Fresh Waters of Palestine:The Plant Ecology of the District. J. Ecol. 1940, 28, 357–376. [CrossRef]
48. Nishri, A. Long-Term Impacts of Draining a Watershed Wetland on a Downstream Lake, Lake Kinneret, Israel. Air Soil Water Res.2011, 4, 57–70. [CrossRef]
49. Singh, Y.; Singh, G.; Khattar, J.S.; Barinova, S.; Kaur, J.; Kumar, S.; Singh, D.P. Assessment of water quality condition andspatiotemporal patterns in selected wetlands of Punjab, India. Environ. Sci. Pollut. Res. Int. 2021, 9, 1–17. [CrossRef]
50. Foti, R.; del Jesus, M.; Rinaldo, A.; Rodriguez-Iturbe, I. Signs of critical transition in the Everglades wetlands in response toclimate and anthropogenic changes. Proc. Natl. Acad. Sci. USA 2013, 110, 6296–6300. [CrossRef]
51. Barinova, S.; Nevo, E. Algal diversity of the Akko Park wetlands in the Bahai Gardens (Haifa, Israel). Transylv. Rev. Syst. Ecol. Res.Wetl. Divers. 2012, 14, 55–79.
52. Klymiuk, V.; Barinova, S.; Fatiukha, A. Algal bio-indication in assessment of hydrological impact on ecosystem in wetlands of“Slavyansky Resort”. Transylv. Rev. Syst. Ecol. Res. Wetl. Divers. 2015, 17, 63–70. [CrossRef]
53. Barinova, S.; Krupa, E.; Romanova, S. The role of planktonic algae in the ecological assessment of storage-reservoirs of theIli-Balkhash basin. Transylv. Rev. Syst. Ecol. Res. Wetl. Divers. 2018, 20, 1–14. [CrossRef]
54. Novoselova, T.; Barinova, S.; Protasov, A. Long-term dynamics of trophic state indicators in phytoplankton of the cooling reservoirof a nuclear power plant. Transylv. Rev. Syst. Ecol. Res. Wetl. Divers. 2021, 23, 1–14. [CrossRef]
55. Tsarenko, P.M.; Bilous, O.P.; Kryvosheia-Zakharova, O.M.; Lilitska, H.H.; Barinova, S. Diversity of Algae and Cyanobacteria andBioindication Characteristics of the Alpine Lake Nesamovyte (Eastern Carpathians, Ukraine) from 100 years Ago to the Present.Diversity 2021, 13, 256. [CrossRef]
56. Sigee, D.C. Freshwater Microbiology: Biodiversity and Dynamic Interactions of Microorganisms in the Aquatic Environment; John Wiley& Sons: Chichester, UK; Hoboken, NJ, USA, 2004; 524p. [CrossRef]
57. Khalil, S.; Hussain, M.; Ahmed, I.; Shah, M.; Alam, J.; Gul, S.; Islam, M.; Azhar, N.; Bibi, A.; Safeer, S. Conservation andmanagement of lakes and ponds in the perspective of Banjosa Lake Rawalkot, Azad Kashmir, Pakistan. Sylwan 2021, 165, 25–38.
58. Hambright, K.D.; Bar-Ilan, I.; Eckert, W. General water chemistry and quality in a newly-created subtropical wetland lake. Wetl.Ecol. Manag. 1998, 6, 121–132. [CrossRef]
59. Hering, D.; Feld, C.K.; Moog, O.; Ofenbock, T. Cook book for the development of a multimeric index for biological condition ofaquatic ecosystems: Experiences from the European AQEM and STAR projects and related initiatives. Hydrobiologia 2006, 566,311–324. [CrossRef]
60. Laplace-Treyture, C.; Feret, T. Performance of the Phytoplankton Index for Lakes (IPLAC): A multimetric phytoplankton index toassess the ecological status of water bodies in France. Ecol. Indic. 2016, 69, 686–698. [CrossRef]
61. Marchetto, A.; Bachisio, M.; Padedda, B.M.; Mariani, M.A.; Luglie, A.; Sechi, N. A numerical index for evaluating phytoplanktonresponse to changes in nutrient levels in deep mediterranean reservoirs. J. Limnol. 2009, 68, 106–121. [CrossRef]
62. Barbiero, R.P. A multi-lake comparison of epilithic diatom communities on natural and artificial substrates. Hydrobiologia 2000,438, 157–170. [CrossRef]
63. Serruya, C.; Pollingher, U. Lakes of the Warm Belt; Cambridge University Press: Cambridge, UK; London, UK, 1983; 569p.64. Barinova, S.; Tavassi, M.; Glassman, H.; Nevo, E. Algal indication of pollution in the Lower Jordan River, Israel. Appl. Ecol.
Environ. Res. 2010, 8, 19–38. [CrossRef]65. Barinova, S.S.; Anissimova, O.V.; Nevo, E.; Jarygin, M.M.; Wasser, S.P. Diversity and Ecology of Algae from Nahal Qishon,
Northern Israel. Plant Biosyst. 2004, 138, 245–259. [CrossRef]66. Barinova, S.S.; Tavassi, M.; Nevo, E. Algal communities of the Hadera River (Israel) under dramatic niche changes. Cent. Eur. J.
Biol. 2010, 5, 507–521. [CrossRef]67. Barinova, S.S.; Nevo, E. The Upper Jordan River algal communities are evidence of long-term climatic and anthropogenic impacts.
J. Water Resour. Prot. 2010, 2, 507–526. [CrossRef]68. Barinova, S.; Krassilov, V.A. Algal diversity and bio-indication of water resources in Israel. Int. J. Environ. Resour. 2012, 1, 62–72.69. Florescu, M.H.; Maxim, M.M.; Momeu, L.; Cîmpean, M.; Battes, K.P. Wetland algal communities from Balta Mică a Brăilei Nature
Park (Romania). Transylv. Rev. Syst. Ecol. Research. Wetl. Divers. 2015, 17, 23–44. [CrossRef]70. Barinova, S.; Romanov, R. Charophyte Communities in the Ein Afeq Natural Reserve, Israel. Nat. Resour. Conserv. 2015, 3, 31–44.
[CrossRef]71. Bănăduc, D.; Curtean-Bănăduc, A.; Cianfaglione, K.; Akeroyd, J.R.; Cioca, L.-I. Proposed Environmental Risk Management
Elements in a Carpathian Valley Basin, within the Rosia Montană European Historical Mining Area. Int. J. Environ. Res. PublicHealth 2021, 18, 4565. [CrossRef] [PubMed]
72. Török, Z. The Romanian Wetland Inventory Project. Analele S, tiint, ifice/Sci. Ann. 2003, 9, 161–173.