Observations of infrared radiative cooling in the thermosphere on daily to multiyear timescales from...
16
Click Here for Full Article Observations of infrared radiative cooling in the thermosphere on daily to multiyear timescales from the TIMED/SABER instrument Martin G. Mlynczak, 1 Linda A. Hunt, 2 B. Thomas Marshall, 3 F. Javier Martin‐Torres, 4 Christopher J. Mertens, 1 James M. Russell III, 5 Ellis E. Remsberg, 1 Manuel López‐Puertas, 6 Richard Picard, 7 Jeremy Winick, 7 Peter Wintersteiner, 8 R. Earl Thompson, 3 and Larry L. Gordley 3 Received 30 July 2009; revised 23 September 2009; accepted 22 October 2009; published 24 March 2010. [1] We present observations of the infrared radiative cooling by carbon dioxide (CO 2 ) and nitric oxide (NO) in Earth’s thermosphere. These data have been taken over a period of 7 years by the Sounding of the Atmosphere using Broadband Emission Radiometry (SABER) instrument on the NASA Thermosphere‐Ionosphere‐Mesosphere Energetics and Dynamics (TIMED) satellite and are the dominant radiative cooling mechanisms for the thermosphere. From the SABER observations we derive vertical profiles of radiative cooling rates (W m −3 ), radiative fluxes (W m −2 ), and radiated power (W). In the period from January 2002 through January 2009, we observe a large decrease in the cooling rates, fluxes, and power consistent with the declining phase of solar cycle 23. The power radiated by NO during 2008 when the Sun exhibited few sunspots was nearly one order of magnitude smaller than the peak power observed shortly after the mission began. Substantial short‐term variability in the infrared emissions is also observed throughout the entire mission duration. Radiative cooling rates and radiative fluxes from NO exhibit fundamentally different latitude dependence than do those from CO 2 , with the NO fluxes and cooling rates being largest at high latitudes and polar regions. The cooling rates are shown to be derived relatively independent of the collisional and radiative processes that drive the departure from local thermodynamic equilibrium (LTE) in the CO 2 15 mm and the NO 5.3 mm vibration‐rotation bands. The observed NO and CO 2 cooling rates have been compiled into a separate data set and represent a climate data record that is available for use in assessments of radiative cooling in upper atmosphere general circulation models. Citation: Mlynczak, M. G., et al. (2010), Observations of infrared radiative cooling in the thermosphere on daily to multiyear timescales from the TIMED/SABER instrument, J. Geophys. Res., 115, A03309, doi:10.1029/2009JA014713. 1. Introduction [2] The terrestrial thermosphere and mesosphere have been the least explored regions of Earth’s atmosphere. They are too high for in situ measurements from aircraft or bal- loons. Rocket or ground‐based measurements on a global basis are not practical and do not provide the suite of mea- surements required for a complete characterization of these regions. In the middle 1990s, remote sensing technology became sufficiently advanced to enable comprehensive sat- ellite observations of these regions of the atmosphere. The NASA Thermosphere‐Ionosphere‐Mesosphere Energetics and Dynamics (TIMED) mission was developed to explore the Earth’s atmosphere above 60 km altitude and was launched in December 2001. A fundamental goal of the mission is to quantify the energy budget of mesosphere and thermosphere. One of four instruments on the TIMED mission, the Sounding of the Atmosphere using Broadband Emission Radiometry (SABER) instrument, was specifically designed to measure the energy budget of the mesosphere and lower thermosphere [Mlynczak, 1996, 1997]. [3] The SABER instrument is a 10 channel limb scanning radiometer. It scans the Earth’s limb continuously recording profiles of infrared radiance (W m −2 sr −1 ) from the atmo- sphere in discrete spectral intervals [Russell et al., 1999]. The specific wavelength bands observed by SABER were 1 NASA Langley Research Center, Hampton, Virginia, USA. 2 SSAI, Hampton, Virginia, USA. 3 GATS Inc., Newport News, Virginia, USA. 4 Jet Propulsion Laboratory, California Institute of Technology, Pasadena, California, USA. 5 Hampton University, Hampton, Virginia, USA. 6 IAA, Granada, Spain. 7 AFRL, Hanscom AFB, Bedford, Massachusetts, USA. 8 ARCON Corp., Waltham, Massachusetts, USA. Copyright 2010 by the American Geophysical Union. 0148‐0227/10/2009JA014713 JOURNAL OF GEOPHYSICAL RESEARCH, VOL. 115, A03309, doi:10.1029/2009JA014713, 2010 A03309 1 of 16
-
Upload
independent -
Category
Documents
-
view
1 -
download
0
Transcript of Observations of infrared radiative cooling in the thermosphere on daily to multiyear timescales from...

ClickHere
for
FullArticle
Observations of infrared radiative cooling in the thermosphereon daily to multiyear timescales from theTIMED/SABER instrument
Martin G. Mlynczak,1 Linda A. Hunt,2 B. Thomas Marshall,3 F. Javier Martin‐Torres,4
Christopher J. Mertens,1 James M. Russell III,5 Ellis E. Remsberg,1
Manuel López‐Puertas,6 Richard Picard,7 Jeremy Winick,7 Peter Wintersteiner,8
R. Earl Thompson,3 and Larry L. Gordley3
Received 30 July 2009; revised 23 September 2009; accepted 22 October 2009; published 24 March 2010.
[1] We present observations of the infrared radiative cooling by carbon dioxide (CO2) andnitric oxide (NO) in Earth’s thermosphere. These data have been taken over a period of7 years by the Sounding of the Atmosphere using Broadband Emission Radiometry(SABER) instrument on the NASA Thermosphere‐Ionosphere‐Mesosphere Energetics andDynamics (TIMED) satellite and are the dominant radiative cooling mechanisms for thethermosphere. From the SABER observations we derive vertical profiles of radiativecooling rates (W m−3), radiative fluxes (W m−2), and radiated power (W). In the periodfrom January 2002 through January 2009, we observe a large decrease in the coolingrates, fluxes, and power consistent with the declining phase of solar cycle 23. The powerradiated by NO during 2008 when the Sun exhibited few sunspots was nearly one orderof magnitude smaller than the peak power observed shortly after the mission began.Substantial short‐term variability in the infrared emissions is also observed throughout theentire mission duration. Radiative cooling rates and radiative fluxes from NO exhibitfundamentally different latitude dependence than do those from CO2, with the NO fluxesand cooling rates being largest at high latitudes and polar regions. The cooling ratesare shown to be derived relatively independent of the collisional and radiative processesthat drive the departure from local thermodynamic equilibrium (LTE) in the CO2 15 mmand the NO 5.3 mm vibration‐rotation bands. The observed NO and CO2 cooling rateshave been compiled into a separate data set and represent a climate data record that isavailable for use in assessments of radiative cooling in upper atmosphere generalcirculation models.
Citation: Mlynczak, M. G., et al. (2010), Observations of infrared radiative cooling in the thermosphere on daily to multiyeartimescales from the TIMED/SABER instrument, J. Geophys. Res., 115, A03309, doi:10.1029/2009JA014713.
1. Introduction
[2] The terrestrial thermosphere and mesosphere havebeen the least explored regions of Earth’s atmosphere. Theyare too high for in situ measurements from aircraft or bal-loons. Rocket or ground‐based measurements on a globalbasis are not practical and do not provide the suite of mea-surements required for a complete characterization of these
regions. In the middle 1990s, remote sensing technologybecame sufficiently advanced to enable comprehensive sat-ellite observations of these regions of the atmosphere. TheNASA Thermosphere‐Ionosphere‐Mesosphere Energeticsand Dynamics (TIMED)mission was developed to explore theEarth’s atmosphere above 60 km altitude and was launched inDecember 2001. A fundamental goal of the mission is toquantify the energy budget of mesosphere and thermosphere.One of four instruments on the TIMEDmission, the Soundingof the Atmosphere using Broadband Emission Radiometry(SABER) instrument, was specifically designed to measurethe energy budget of the mesosphere and lower thermosphere[Mlynczak, 1996, 1997].[3] The SABER instrument is a 10 channel limb scanning
radiometer. It scans the Earth’s limb continuously recordingprofiles of infrared radiance (W m−2 sr−1) from the atmo-sphere in discrete spectral intervals [Russell et al., 1999].The specific wavelength bands observed by SABER were
1NASA Langley Research Center, Hampton, Virginia, USA.2SSAI, Hampton, Virginia, USA.3GATS Inc., Newport News, Virginia, USA.4Jet Propulsion Laboratory, California Institute of Technology,
Pasadena, California, USA.5Hampton University, Hampton, Virginia, USA.6IAA, Granada, Spain.7AFRL, Hanscom AFB, Bedford, Massachusetts, USA.8ARCON Corp., Waltham, Massachusetts, USA.
Copyright 2010 by the American Geophysical Union.0148‐0227/10/2009JA014713
JOURNAL OF GEOPHYSICAL RESEARCH, VOL. 115, A03309, doi:10.1029/2009JA014713, 2010
A03309 1 of 16
chosen so that a variety of data products could be retrievedor derived, including kinetic temperature, ozone, watervapor, carbon dioxide, atomic oxygen, atomic hydrogen,rates of energy deposition, rates of energy loss, and rates ofradiative heating and cooling. To this end, SABER mea-sures two of the three key infrared emissions that governradiative cooling of the atmosphere above 100 km: nitricoxide (NO) at 5.3 mm [Kockarts, 1980] and carbon dioxide(CO2) at 15 mm [Curtis and Goody, 1956]. The third emis-sion, the fine structure line of atomic oxygen (O3P) at 63 mm[Bates, 1951] is not measured by SABER but has beenobserved by the CRISTA instrument that flew twice in the1990s on the Space Shuttle [Grossman et al., 2000] and bynumerous rocket experiments [Grossman and Vollmann,1997] and even by high‐altitude balloons [Mlynczak et al.,2004]. The SABER data set is the first global, long‐term,and continuous record of the NO and CO2 emissions fromthe thermosphere.[4] The SABER data set is now 7 years in length and has
already provided some basic insight into the heat budget ofthe thermosphere on a variety of timescales. Mlynczak et al.[2003, 2005] have reported the observed nature of the nitricoxide emission in the thermosphere in response to geo-magnetic storm events, demonstrating a “thermostat” effectin which the infrared emission rapidly and efficiently re-moves storm energy deposited into the thermosphere andthus returns it to its original state in a short period of time.The long‐term effects of the declining phase of solar cy-cle 23 were clearly evident in the NO emission in less than5 years [Mlynczak et al., 2007] and 9 day periodicities inboth the NO and CO2 emissions have been related to theoccurrence of coronal holes on the Sun [Mlynczak et al.,2007].[5] The purpose of this paper is to further examine vari-
ability in the NO 5.3 mm and CO2 15 mm emissions with theSABER data set. In particular, the extent of solar minimumconditions during the end of solar cycle 23 offers a uniqueopportunity to study the radiative cooling in the thermo-sphere under exceptionally quiescent conditions. We alsoexamine the infrared emissions as a function of latitude andaltitude. In addition, the newest version of the SABER dataset (v1.07) is used in this study. Last, the results presentedhere form a climate data record for the thermosphere usefulfor assessing general circulation models of the upper atmo-sphere. The cooling rate data may be obtained from theauthors upon request.[6] In section 2, we review the data processing method-
ology. In section 3, we present the results in the order of theprocessing: vertical profiles of radiative cooling (W m−3),fluxes of infrared emission (Wm−2), and radiated power (W).Discussions on the fundamentally different roles of coolingby NO and CO2 are given. In section 4, we discuss the sen-sitivity of the results to parameters in the SABER retrievalalgorithms and in section 5 we give a summary.
2. Derivation of Infrared Parameters
[7] The fundamental SABER measurement is the infraredradiance (W m−2 sr−1) measured in the limb viewinggeometry as a function of tangent altitude. The instrumentscans the atmosphere from approximately 400 km tangentaltitude down to 5 km below the hard Earth surface, recording
an infrared radiance sample every 0.4 km. The NO 5.3 mmemission is observed as high as 300 km during periods ofintense geomagnetic storms. The CO2 15 mm emission istypically observed up to 139 km. Approximately 1400 pro-files of infrared emission are obtained for each of the 10SABER channels in one day. During the limb scan between100 and 200 km (the nominal range reported in this paper) theTIMED spacecraft moves approximately 1° of latitude. Thenominal instantaneous field of view of the instrument is 2 kmat the tangent point on the Earth’s limb.[8] The TIMED satellite is in an orbit inclined 74° with
respect to the equator. The SABER instrument views per-pendicular to the spacecraft velocity vector. In order to keepthe instrument within its allowable range of operating tem-peratures, the TIMED spacecraft executes a rotation aboutits yaw axis every 60 days to keep the Sun from illuminatingthe instrument’s thermal radiator. While in the “northward”viewing mode the instrument views from approximately 83°N to 55°S. After the yaw maneuver the instrument viewsfrom approximately 55°N to 83°S. This operational scenarioresults in the regions between 55°N and 55°S being viewedcontinuously while the regions above 55° latitude areviewed continuously for two months every other yaw cycle,that is, two months of viewing followed by a two monthgap, followed by two months of viewing, etc. This processrepeats exactly the same temporal gaps in both hemispheresevery year.[9] In the results below for zonal mean cooling rates and
fluxes we present annual averages. Because of the SABERviewing geometry, the averages are over 12 months onlybetween ±55° in latitude (corresponding to 82% of atmo-spheric area). In the regions poleward of 55° we average thesix months of available data every year. While not trulyannual, these 6 month averages cover locally two monthsduring winter, two months during fall, one month duringspring, and one month during summer. There is no obviousdiscontinuity in the cooling rates and fluxes shown inFigures 1 and 2 below and we believe that the results aresubstantially representative of the annual behavior, althoughcomparisons with models are required to verify this asser-tion. More than 50,000 individual cooling rate profiles areobserved in a 6 month period poleward of 55°.[10] The derivation of the infrared radiative cooling rates
(W m−3) is accomplished by different techniques for the NOand CO2 emissions owing to the different opacities of thesemolecules in the limb view, and to account for the differentphysical processes that result in emission and cooling of theatmosphere by these molecules. To further study the energybalance, we vertically integrate each profile of radiativecooling to obtain the flux (W m−2) of energy exiting thethermosphere. The fluxes are then zonally integrated toprovide an estimate of the equator‐to‐pole distribution ofradiative cooling which is central to the large‐scale atmo-spheric circulation. The fluxes are then integrated withrespect to area around a latitude circle, and then, from poleto pole, to estimate the total power (W) radiated each day bythe thermosphere. These analysis procedures with SABERdata are given in the work of Mlynczak et al. [2005]. Wewill review these here since there are fundamental differ-ences in the approaches for analyzing the (more) opticallythick 15 mm band of CO2 and the optically thin 5.3 mm bandof NO.
MLYNCZAK ET AL.: THERMOSPHERIC INFRARED RADIATIVE COOLING A03309A03309
2 of 16
2.1. NO(u) at 5.3 mm[11] Infrared emission from NO is a substantial cooling
mechanism throughout the thermosphere. Because of thelow atmospheric density, the vibration‐rotation bands of theNO molecule depart from local thermodynamic equilibrium(LTE) [e.g., Funke and López‐Puertas, 2000]. The NOvibrational states are excited primarily by collisions withatomic oxygen with a rate coefficient of 4.2 × 10⁻¹¹ exp(−2700/T) cm3 s−1 [Hwang et al., 2003], where T is thekinetic temperature. By comparison, excitation by theabsorption of terrestrial radiation is several orders of mag-nitude smaller. Nitric oxide is also formed through a series ofchemical reactions that excite high‐lying vibration‐rotationbands especially during geomagnetic storms. These havebeen observed near 195 km by the CIRRIS‐1A instrumentthat flew on the Space Shuttle [Dothe et al., 2002; Sharma etal., 1996].[12] The approach to deriving the NO cooling rates from
SABER observations has been discussed by Mlynczak et al.[2005], and is reviewed here. The emission from nitric oxideis in the weak line limit of radiative transfer. The equationof radiative transfer describing a transition in the weak linelimit is given in the limb view by the expression
R Hoð Þ ¼ h c �
4 �
X
x
V xð Þ dx; ð1Þ
where R(Ho) is the measured spectrally integrated radiance(W m−2 sr−1) at tangent altitude Ho, h is Planck’s constant, cis the speed of light, n is the frequency of the transition (wavenumbers, cm−1), V(x) is the volume emission rate of photonsat the tangent altitude, and dx is a path element along the limbline of sight. An Abel or geometric inversion may be appliedto the measured radiance profile, assuming spherical sym-metry about the tangent point, yielding a vertical profile of therate of emission of energy per unit volume (W m−3). Foroptically thin transitions such as those of NO, the energyescapes the thermosphere completely: half of the energy isemitted to space, half to the atmosphere below.[13] As the SABER instrument is a filter radiometer, the
initial result from the Abel inversion process is a cooling/emission rate that is weighted by the filter bandpass of theinstrument. To obtain the total rate of emission, a correctionfactor is applied to the measured in‐band emission rate toobtain the emission rate for the entire band. The correctionfactor varies substantially with altitude for NO and has beencomputed from extensive model calculations discussed byMlynczak et al. [2005]. The correction factor was verifiedthrough observations of NO spectra made by the MIPASinstrument [Gardner et al., 2007] on the EnviSat satellite.Surprisingly, Mlynczak et al. [2005] found relatively smallvariation in this correction (“unfilter”) factor from quiescentto geomagnetically disturbed conditions.[14] In the results presented below, we treat the entire
emission from NO as cooling the atmosphere. Terrestrial(“earthshine”) emission is insignificant as an excitationmechanism of nitric oxide vibrations, relative to collisionswith atomic oxygen. The results from Dothe et al. [2002]indicate that emission from high‐lying NO vibrational le-vels is still well below that of the fundamental (u = 1 to u = 0)band. The correction factor applied to the SABER measured
in‐band emission rate accounts for out‐of‐band contributionsof the 2–1 and 3–2 vibrational states as well. Potentialrefinements to this process will be discussed in section 5.
2.2. CO2(n2) at 15 mm[15] In this section, we outline the method to compute the
cooling rates for the CO2 15 mm n2 fundamental bandtransition, with upper state designation CO2(01
10). Later inthe paper, we will examine the role of cooling by the firsthot band in this mode, i.e., the CO2 (0220 → 0110) transi-tion. Above 100 km, the CO2 15 mm fundamental band isnot exactly optically thin, but neither is it very opticallythick. Because of this, derivation of the cooling rates for theCO2 molecule is not as straightforward as for NO. Specifi-cally, the absence of true weak line radiative transfer pre-cludes application of an Abel or geometric inversion tosimply derive a cooling/emission rate profile. In addition,radiative exchange with other layers of the atmosphereoccurs, although absorption of radiation from the loweratmosphere is relatively small [López‐Puertas and Taylor,2002]. Only emission resulting from collisional excitationresults in a cooling of the atmosphere. In addition, becauseof the opacity, not all emission escapes to space or the at-mosphere below, unlike NO. We must therefore employ atechnique to compute the true cooling of the atmospheregiven these constraints.[16] The SABER experiment measures emission in the n2
bending mode of CO2 at 15 mm for the purpose of retrievingthe kinetic temperature of the atmosphere. The 15 mm bandsare also responsible for the radiative cooling of the atmo-sphere. As with NO, the vibration‐rotation bands of carbondioxide depart from LTE in the upper mesosphere andthermosphere. The SABER temperature derivation includesdetailed modeling of the collisional and radiative processesthat drive the observed transitions from LTE [Mertens et al.,2002]. Specifically, the Curtis matrix approach [López‐Puertas et al., 1986a, 1986b] is employed in the SABERnon‐LTE modeling and temperature derivation process anddirectly yields the infrared radiative cooling rates in kelvinper day. These cooling rates computed at each iteration stepare output and stored as standard data products upon con-vergence of the temperature retrieval.[17] To derive the local rate ∂Q/∂t of radiative cooling in
W m−3 for CO2 at a given altitude we apply the first law ofthermodynamics:
@Q
@t¼ �Cp
@T
@t; ð2Þ
where Cp is the heat capacity at constant pressure, r is thedensity, and ∂T/∂t is the derived radiative cooling rate inkelvin per day. From the ideal gas law this can be written as
@Q
@t¼ p
T
Cp
R
@T
@t: ð3Þ
[18] In equation (3), R is the gas constant. This approachto computing cooling rates and fluxes was successfullyapplied in the stratosphere by Mlynczak et al. [1999]. In ourpresent analyses, the pressure, temperature, and ∂T/∂t areobtained from the SABER v1.07 data set. Although the
MLYNCZAK ET AL.: THERMOSPHERIC INFRARED RADIATIVE COOLING A03309A03309
3 of 16

Figure 1. Zonal average, annual mean cooling rates (W m−3) for nitric oxide from 2002 through 2008.
MLYNCZAK ET AL.: THERMOSPHERIC INFRARED RADIATIVE COOLING A03309A03309
4 of 16
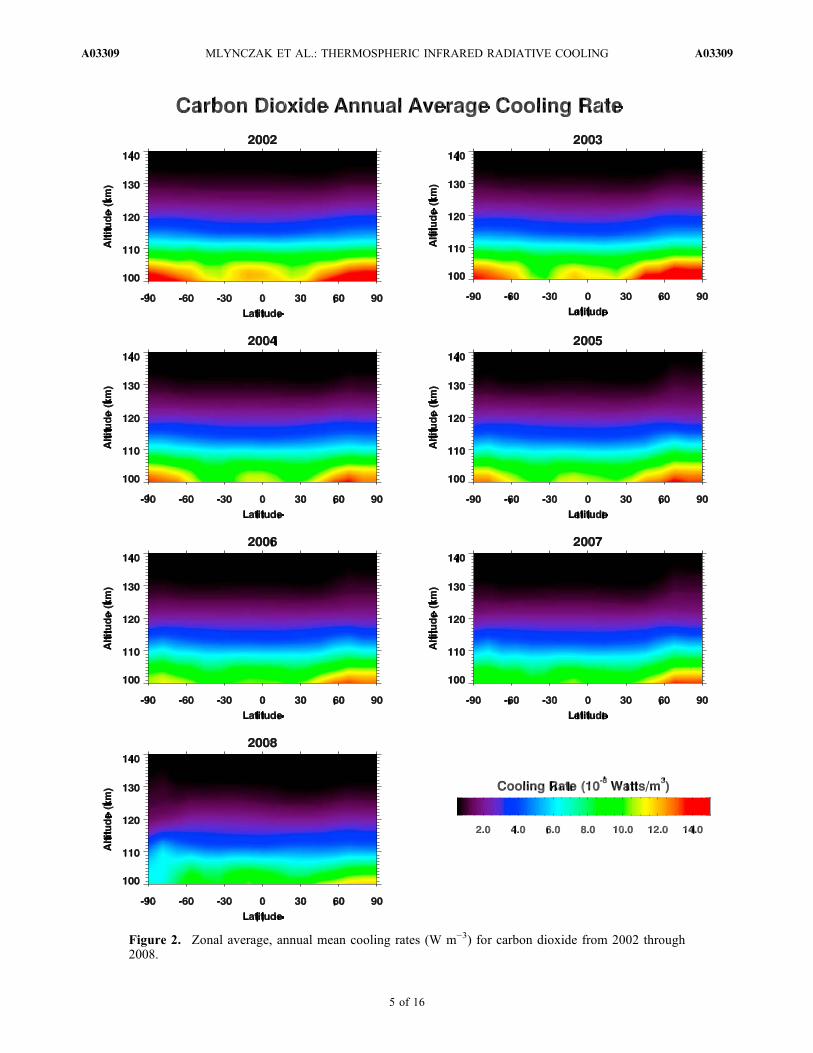
Figure 2. Zonal average, annual mean cooling rates (W m−3) for carbon dioxide from 2002 through2008.
MLYNCZAK ET AL.: THERMOSPHERIC INFRARED RADIATIVE COOLING A03309A03309
5 of 16
effect is small, we also include the variation of the ratio Cp/Rwith altitude to be consistent with that used in the SABERdata processing, thus accounting for the effects of atomicoxygen on Cp.
3. Results
3.1. Cooling Rates for NO at 5.3 mm[19] We begin by examining the cooling rates (W m−3) for
NO over the 7 years of data to date. The SABER instrumentbegan routine operations in mid‐January 2001. To maintainSABER’s orientation on the “cold” side of the spacecraft,the TIMED spacecraft undergoes a 180° yaw maneuverevery 60 days, as dictated by the progression through localtime in the satellite’s 74° inclined orbit. Thus in a year thespacecraft executes a series of six yaw maneuvers, allowingthe same progression of local time to be repeated each year.In all figures presented below, unless noted otherwise, we
display annual averages for each of the seven “yaw years”that have been observed to date. Each “yaw year” runs frommid‐January to the next mid‐January. So year 2002 runsfrom January 2002 to January 2003, and so on.[20] Shown in Figure 1 are the zonally averaged, annual
mean cooling rates in W m−3 for NO observed by SABERfrom January 2002 through January 2009, i.e., yaw years2002 through 2008. There are two features immediatelyobvious from the data. First, the maximum cooling ratesoccur at high latitudes near the poles, implying a stronggeomagnetic influence. Second, the magnitude of the cool-ing rates visibly decreases each year in the series from 2002through 2008. This decrease is concurrent with the decliningphase of solar cycle 23. At the altitude of the cooling ratepeak poleward of 60°, the cooling rates decrease by a factorof ∼4.5. The cooling rate is observed to decrease throughoutthe entire range from 100 to 200 km over the 7 years ofobservations. By 2008, there is very little emission observedby SABER above 180 km.[21] For carbon dioxide, we find a different picture of
cooling rates in the plots shown in Figure 2. Whereas theNO cooling rates showed a clear equator‐to‐pole enhance-ment throughout the thermosphere, CO2 exhibits a relativelysmall gradient in equator‐to‐pole cooling above 105 km.Below 105 km there is evidence of strong cooling near thepoles and also at the equator. The equatorial enhancement inCO2 cooling is visible in all 7 years of data. Similar to theNO cooling, a decrease in the strength of the CO2 coolingover the 7 years is also visible in Figure 2.[22] Figures 1 and 2 demonstrate a decrease in radiative
cooling by NO and CO2 in the thermosphere over the last7 years. This decrease is consistent with a decrease in thetemperature of the thermosphere which affects both NO andCO2, although the temperature sensitivity of the NO emis-sion is substantially larger than for CO2. The strength ofradiative cooling is proportional to exp (DE/kBT) where DEis the photon energy, kB is Boltzmann’s constant, and T isthe kinetic temperature. Since DE for NO is about 2.8 timeslarger than for CO2, NO emission has a substantially largersensitivity to a specific change in temperature. Decreases inatomic oxygen over the solar cycle also contribute to thedecline in infrared cooling from both molecules.[23] The NO cooling will also be affected directly by a
decrease in the NO density that would be expected to occurduring the declining phase of the solar cycle, while the CO2
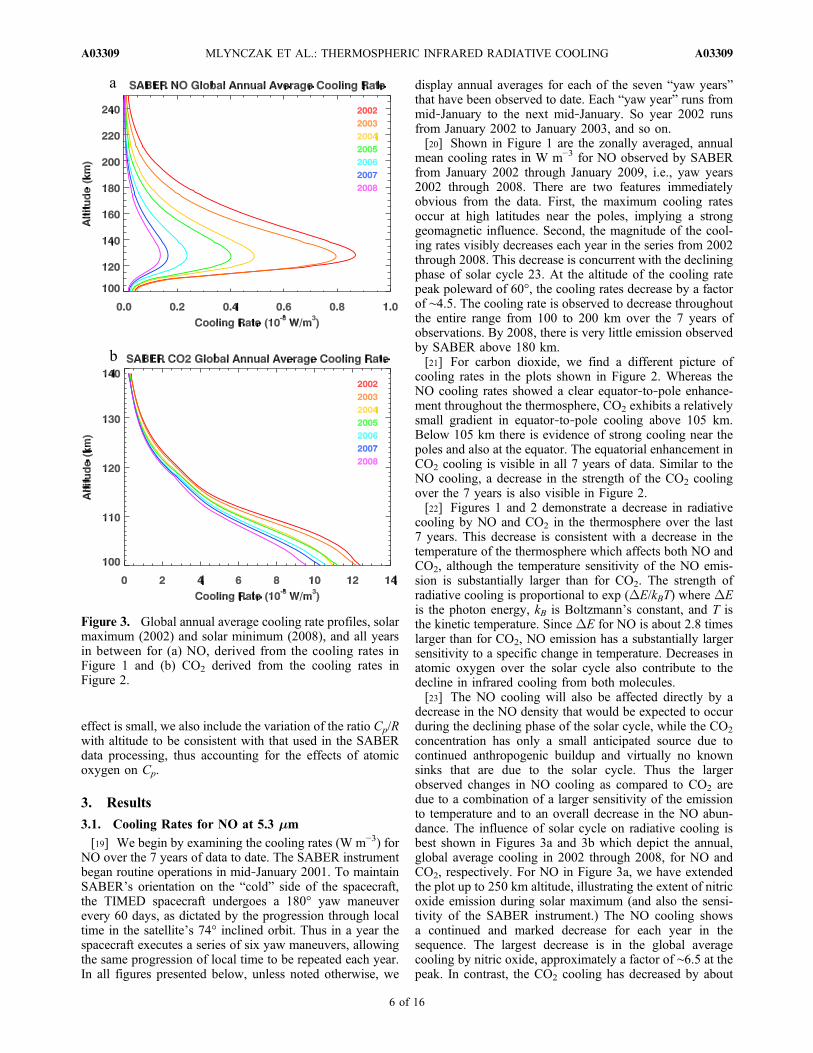
concentration has only a small anticipated source due tocontinued anthropogenic buildup and virtually no knownsinks that are due to the solar cycle. Thus the largerobserved changes in NO cooling as compared to CO2 aredue to a combination of a larger sensitivity of the emissionto temperature and to an overall decrease in the NO abun-dance. The influence of solar cycle on radiative cooling isbest shown in Figures 3a and 3b which depict the annual,global average cooling in 2002 through 2008, for NO andCO2, respectively. For NO in Figure 3a, we have extendedthe plot up to 250 km altitude, illustrating the extent of nitricoxide emission during solar maximum (and also the sensi-tivity of the SABER instrument.) The NO cooling showsa continued and marked decrease for each year in thesequence. The largest decrease is in the global averagecooling by nitric oxide, approximately a factor of ∼6.5 at thepeak. In contrast, the CO2 cooling has decreased by about
Figure 3. Global annual average cooling rate profiles, solarmaximum (2002) and solar minimum (2008), and all yearsin between for (a) NO, derived from the cooling rates inFigure 1 and (b) CO2 derived from the cooling rates inFigure 2.
MLYNCZAK ET AL.: THERMOSPHERIC INFRARED RADIATIVE COOLING A03309A03309
6 of 16

35% over the solar cycle. The smaller sensitivity of the CO2
cooling to the solar cycle is due to the fact that the CO2
emissions originate in the lower (more dense) atmosphere,to the smaller sensitivity of the CO2 emission to temperaturechanges, and to a lack of sinks of CO2 abundance.
3.2. Fluxes of Exiting Longwave Radiation
[24] The next step in the process of assessing the radiativecooling is to integrate vertically the cooling rate profiles andobtain the flux of longwave radiation that exits the ther-mosphere. We choose to call this the “exiting” longwave
Figure 4. Annual average exiting longwave radiative flux (mW m−2) for nitric oxide in the northernhemisphere from 2002 to 2008.
MLYNCZAK ET AL.: THERMOSPHERIC INFRARED RADIATIVE COOLING A03309A03309
7 of 16
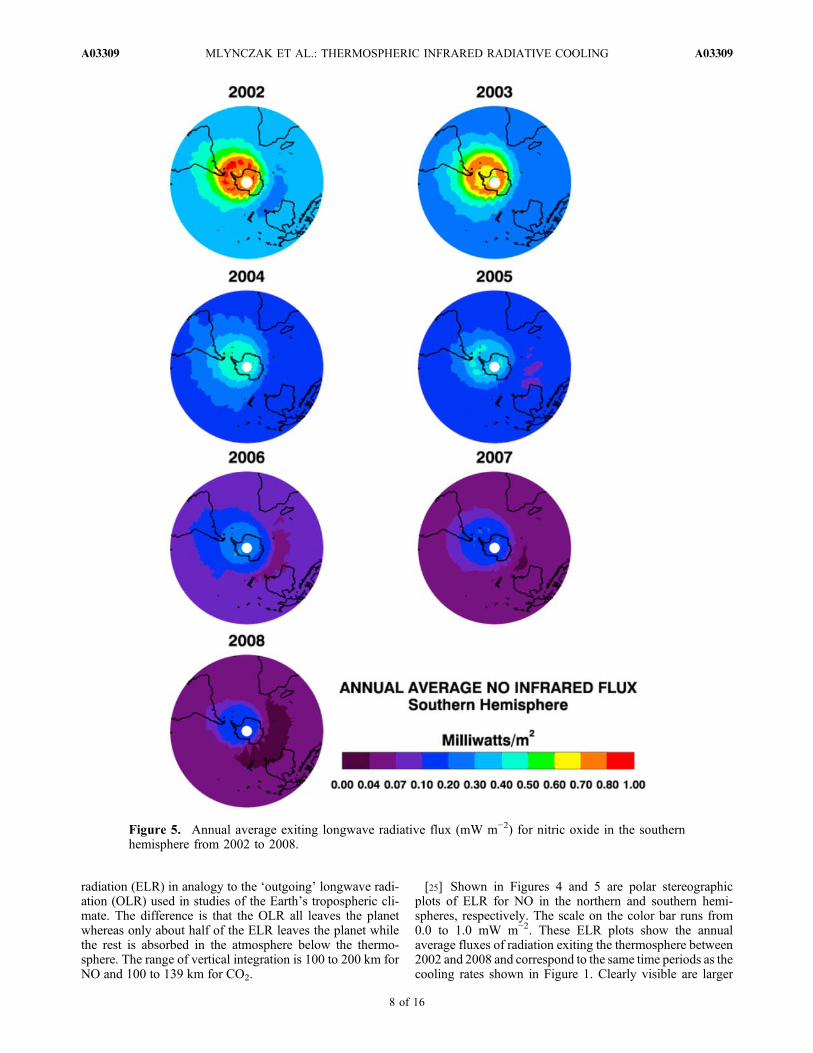
radiation (ELR) in analogy to the ‘outgoing’ longwave radi-ation (OLR) used in studies of the Earth’s tropospheric cli-mate. The difference is that the OLR all leaves the planetwhereas only about half of the ELR leaves the planet whilethe rest is absorbed in the atmosphere below the thermo-sphere. The range of vertical integration is 100 to 200 km forNO and 100 to 139 km for CO2.
[25] Shown in Figures 4 and 5 are polar stereographicplots of ELR for NO in the northern and southern hemi-spheres, respectively. The scale on the color bar runs from0.0 to 1.0 mW m−2. These ELR plots show the annualaverage fluxes of radiation exiting the thermosphere between2002 and 2008 and correspond to the same time periods as thecooling rates shown in Figure 1. Clearly visible are larger
Figure 5. Annual average exiting longwave radiative flux (mW m−2) for nitric oxide in the southernhemisphere from 2002 to 2008.
MLYNCZAK ET AL.: THERMOSPHERIC INFRARED RADIATIVE COOLING A03309A03309
8 of 16
fluxes near the poles in all years, with fluxes in 2002 and 2003peaking in excess of 0.8 mW m−2. Also evident is a dramaticdecrease in flux from 2002 to 2008. In 2002, in most of eachhemisphere the ELR exceeds 0.3 mW m−2. In 2008 the ELRover most of the globe is well below 0.07 mW m−2. Thus theeffect of the declining phase of solar cycle 23 is clearly evi-dent in the ELR.
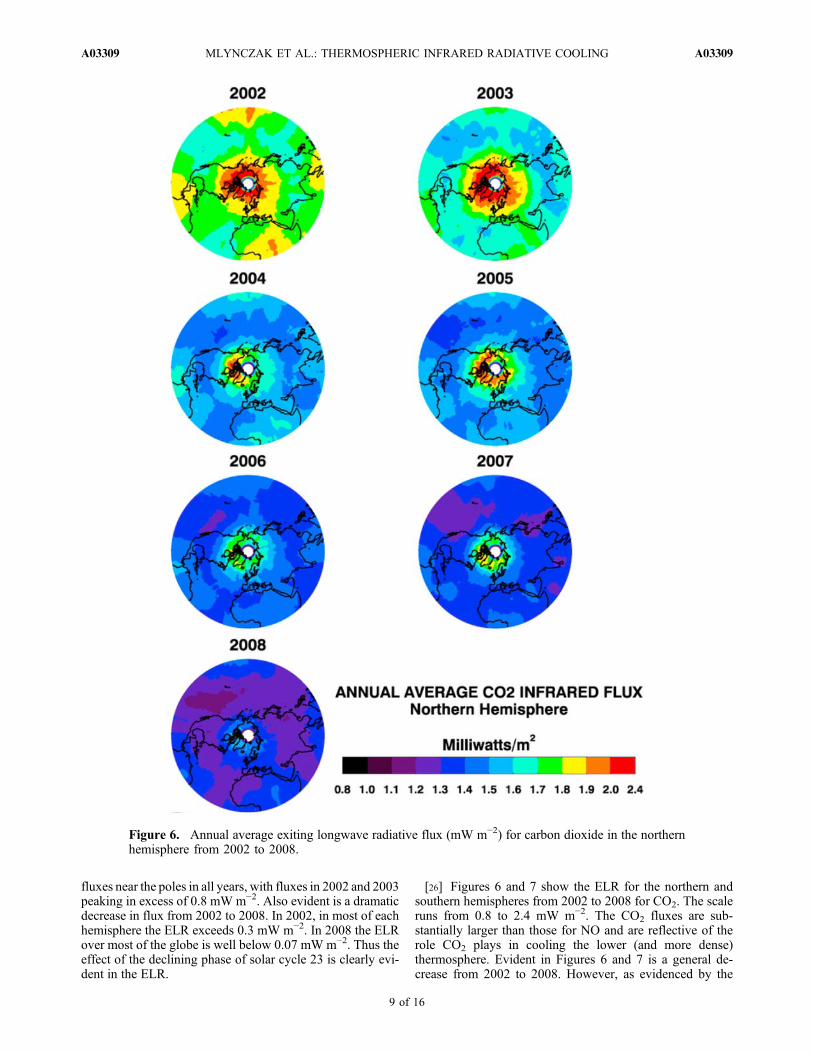
[26] Figures 6 and 7 show the ELR for the northern andsouthern hemispheres from 2002 to 2008 for CO2. The scaleruns from 0.8 to 2.4 mW m−2. The CO2 fluxes are sub-stantially larger than those for NO and are reflective of therole CO2 plays in cooling the lower (and more dense)thermosphere. Evident in Figures 6 and 7 is a general de-crease from 2002 to 2008. However, as evidenced by the
Figure 6. Annual average exiting longwave radiative flux (mW m−2) for carbon dioxide in the northernhemisphere from 2002 to 2008.
MLYNCZAK ET AL.: THERMOSPHERIC INFRARED RADIATIVE COOLING A03309A03309
9 of 16
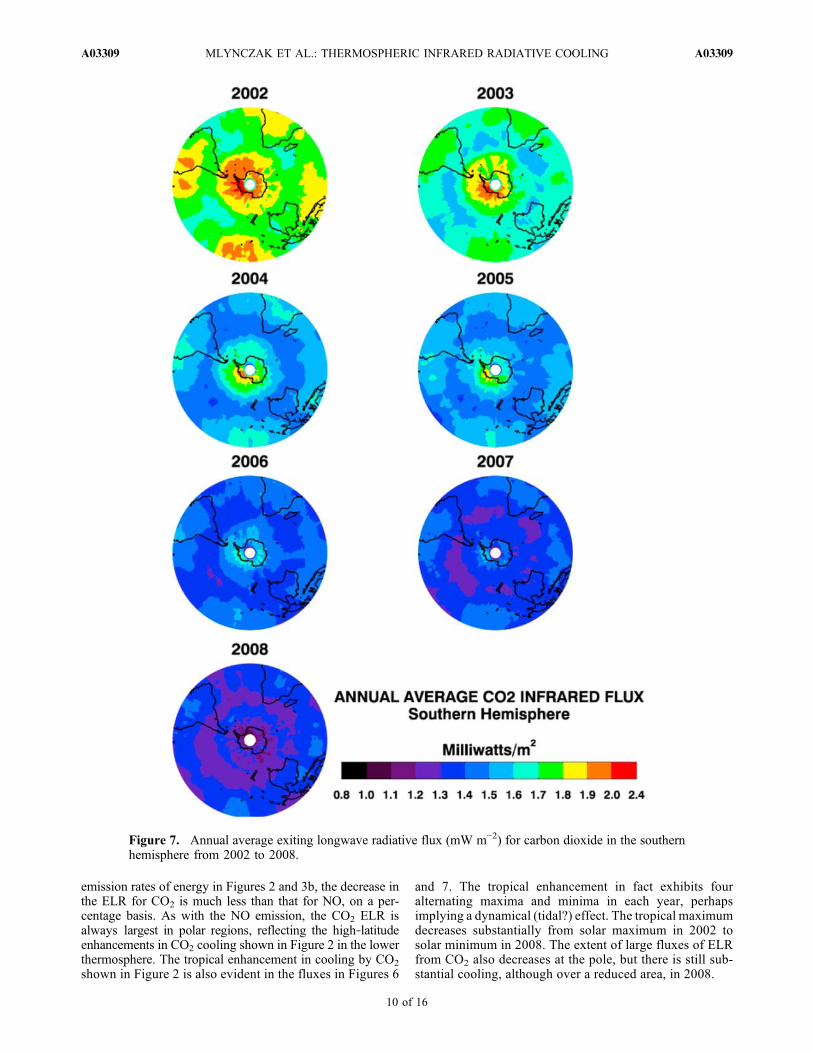
emission rates of energy in Figures 2 and 3b, the decrease inthe ELR for CO2 is much less than that for NO, on a per-centage basis. As with the NO emission, the CO2 ELR isalways largest in polar regions, reflecting the high‐latitudeenhancements in CO2 cooling shown in Figure 2 in the lowerthermosphere. The tropical enhancement in cooling by CO2
shown in Figure 2 is also evident in the fluxes in Figures 6
and 7. The tropical enhancement in fact exhibits fouralternating maxima and minima in each year, perhapsimplying a dynamical (tidal?) effect. The tropical maximumdecreases substantially from solar maximum in 2002 tosolar minimum in 2008. The extent of large fluxes of ELRfrom CO2 also decreases at the pole, but there is still sub-stantial cooling, although over a reduced area, in 2008.
Figure 7. Annual average exiting longwave radiative flux (mW m−2) for carbon dioxide in the southernhemisphere from 2002 to 2008.
MLYNCZAK ET AL.: THERMOSPHERIC INFRARED RADIATIVE COOLING A03309A03309
10 of 16
3.3. Zonal Mean Fluxes of Exiting Longwave Radiation
[27] Next, we zonally average the ELR for NO and CO2
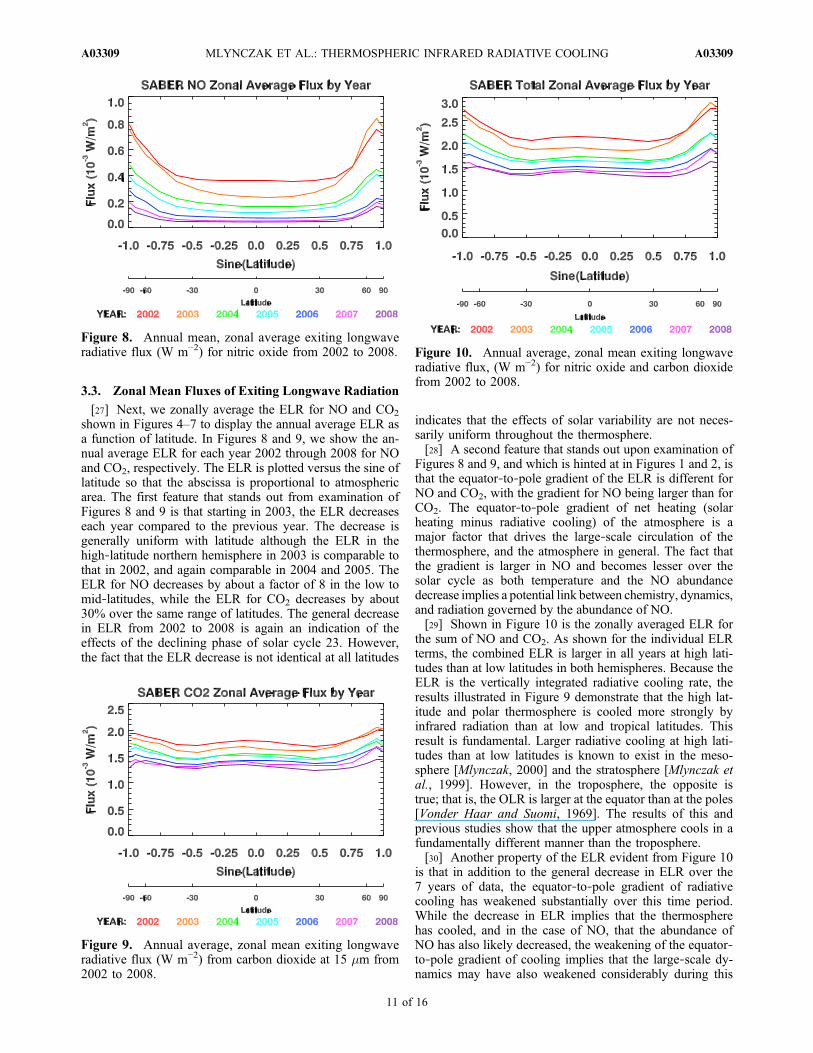
shown in Figures 4–7 to display the annual average ELR asa function of latitude. In Figures 8 and 9, we show the an-nual average ELR for each year 2002 through 2008 for NOand CO2, respectively. The ELR is plotted versus the sine oflatitude so that the abscissa is proportional to atmosphericarea. The first feature that stands out from examination ofFigures 8 and 9 is that starting in 2003, the ELR decreaseseach year compared to the previous year. The decrease isgenerally uniform with latitude although the ELR in thehigh‐latitude northern hemisphere in 2003 is comparable tothat in 2002, and again comparable in 2004 and 2005. TheELR for NO decreases by about a factor of 8 in the low tomid‐latitudes, while the ELR for CO2 decreases by about30% over the same range of latitudes. The general decreasein ELR from 2002 to 2008 is again an indication of theeffects of the declining phase of solar cycle 23. However,the fact that the ELR decrease is not identical at all latitudes
indicates that the effects of solar variability are not neces-sarily uniform throughout the thermosphere.[28] A second feature that stands out upon examination of
Figures 8 and 9, and which is hinted at in Figures 1 and 2, isthat the equator‐to‐pole gradient of the ELR is different forNO and CO2, with the gradient for NO being larger than forCO2. The equator‐to‐pole gradient of net heating (solarheating minus radiative cooling) of the atmosphere is amajor factor that drives the large‐scale circulation of thethermosphere, and the atmosphere in general. The fact thatthe gradient is larger in NO and becomes lesser over thesolar cycle as both temperature and the NO abundancedecrease implies a potential link between chemistry, dynamics,and radiation governed by the abundance of NO.[29] Shown in Figure 10 is the zonally averaged ELR for
the sum of NO and CO2. As shown for the individual ELRterms, the combined ELR is larger in all years at high lati-tudes than at low latitudes in both hemispheres. Because theELR is the vertically integrated radiative cooling rate, theresults illustrated in Figure 9 demonstrate that the high lat-itude and polar thermosphere is cooled more strongly byinfrared radiation than at low and tropical latitudes. Thisresult is fundamental. Larger radiative cooling at high lati-tudes than at low latitudes is known to exist in the meso-sphere [Mlynczak, 2000] and the stratosphere [Mlynczak etal., 1999]. However, in the troposphere, the opposite istrue; that is, the OLR is larger at the equator than at the poles[Vonder Haar and Suomi, 1969]. The results of this andprevious studies show that the upper atmosphere cools in afundamentally different manner than the troposphere.[30] Another property of the ELR evident from Figure 10
is that in addition to the general decrease in ELR over the7 years of data, the equator‐to‐pole gradient of radiativecooling has weakened substantially over this time period.While the decrease in ELR implies that the thermospherehas cooled, and in the case of NO, that the abundance ofNO has also likely decreased, the weakening of the equator‐to‐pole gradient of cooling implies that the large‐scale dy-namics may have also weakened considerably during this
Figure 8. Annual mean, zonal average exiting longwaveradiative flux (W m−2) for nitric oxide from 2002 to 2008.
Figure 9. Annual average, zonal mean exiting longwaveradiative flux (W m−2) from carbon dioxide at 15 mm from2002 to 2008.
Figure 10. Annual average, zonal mean exiting longwaveradiative flux, (W m−2) for nitric oxide and carbon dioxidefrom 2002 to 2008.
MLYNCZAK ET AL.: THERMOSPHERIC INFRARED RADIATIVE COOLING A03309A03309
11 of 16
time. These infrared emissions thus provide solid evidenceas to changes in the thermal structure, photochemistry, anddynamics of the thermosphere, and hint strongly at a cou-pling between NO chemistry and the large‐scale dynamicsand transport in the thermosphere.
3.4. Global Radiative Power
[31] The last parameter that we calculate is the globalradiative power (W) emitted by CO2 and NO. These havepreviously been shown by Mlynczak et al. [2007, 2008] inexamining long‐ and short‐term variations in the energybalance of the thermosphere. We obtain the total globalpower by zonally integrating the fluxes of ELR shownabove, and then integrating the power in each latitude binfrom pole to pole. To compute the power poleward of 55° inthe hemisphere not being observed, we follow Mlynczak etal. [2005] in assuming the ratio of the power between theequator and 55° latitude and between 55° latitude and thepole is the same in both hemispheres. This process providesa measure of the total global power radiated by NO and CO2
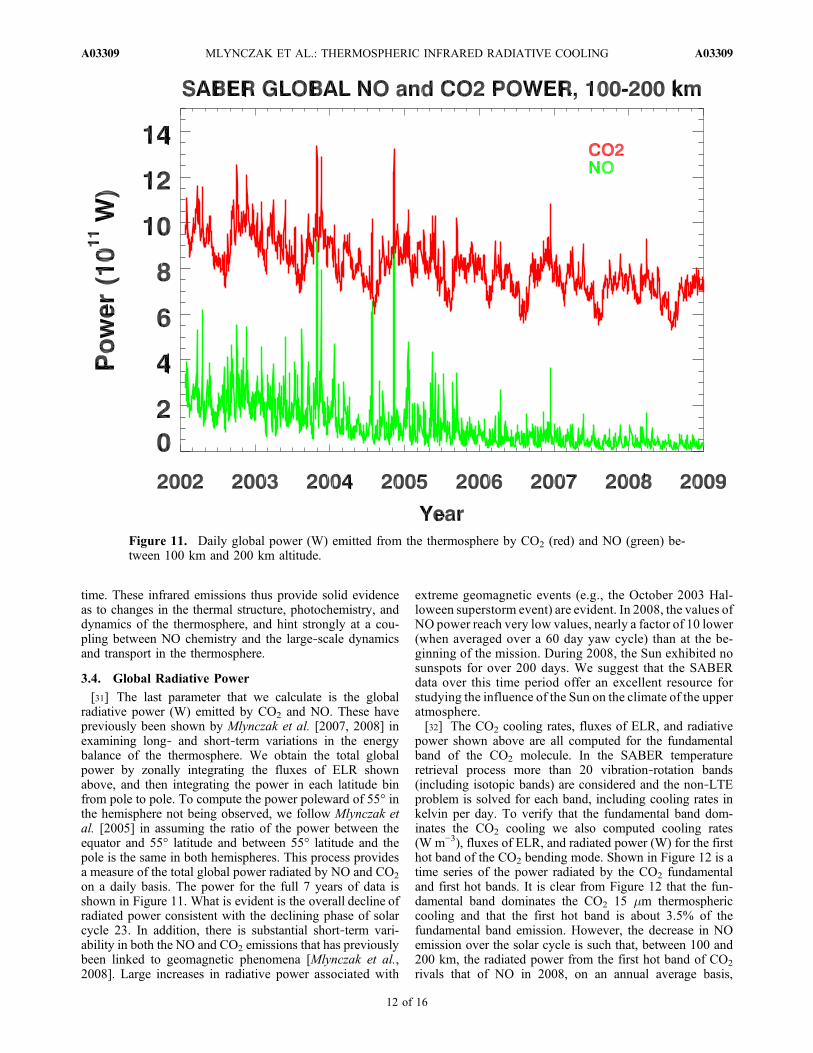
on a daily basis. The power for the full 7 years of data isshown in Figure 11. What is evident is the overall decline ofradiated power consistent with the declining phase of solarcycle 23. In addition, there is substantial short‐term vari-ability in both the NO and CO2 emissions that has previouslybeen linked to geomagnetic phenomena [Mlynczak et al.,2008]. Large increases in radiative power associated with
extreme geomagnetic events (e.g., the October 2003 Hal-loween superstorm event) are evident. In 2008, the values ofNO power reach very low values, nearly a factor of 10 lower(when averaged over a 60 day yaw cycle) than at the be-ginning of the mission. During 2008, the Sun exhibited nosunspots for over 200 days. We suggest that the SABERdata over this time period offer an excellent resource forstudying the influence of the Sun on the climate of the upperatmosphere.[32] The CO2 cooling rates, fluxes of ELR, and radiative
power shown above are all computed for the fundamentalband of the CO2 molecule. In the SABER temperatureretrieval process more than 20 vibration‐rotation bands(including isotopic bands) are considered and the non‐LTEproblem is solved for each band, including cooling rates inkelvin per day. To verify that the fundamental band dom-inates the CO2 cooling we also computed cooling rates(W m−3), fluxes of ELR, and radiated power (W) for the firsthot band of the CO2 bending mode. Shown in Figure 12 is atime series of the power radiated by the CO2 fundamentaland first hot bands. It is clear from Figure 12 that the fun-damental band dominates the CO2 15 mm thermosphericcooling and that the first hot band is about 3.5% of thefundamental band emission. However, the decrease in NOemission over the solar cycle is such that, between 100 and200 km, the radiated power from the first hot band of CO2
rivals that of NO in 2008, on an annual average basis,
Figure 11. Daily global power (W) emitted from the thermosphere by CO2 (red) and NO (green) be-tween 100 km and 200 km altitude.
MLYNCZAK ET AL.: THERMOSPHERIC INFRARED RADIATIVE COOLING A03309A03309
12 of 16
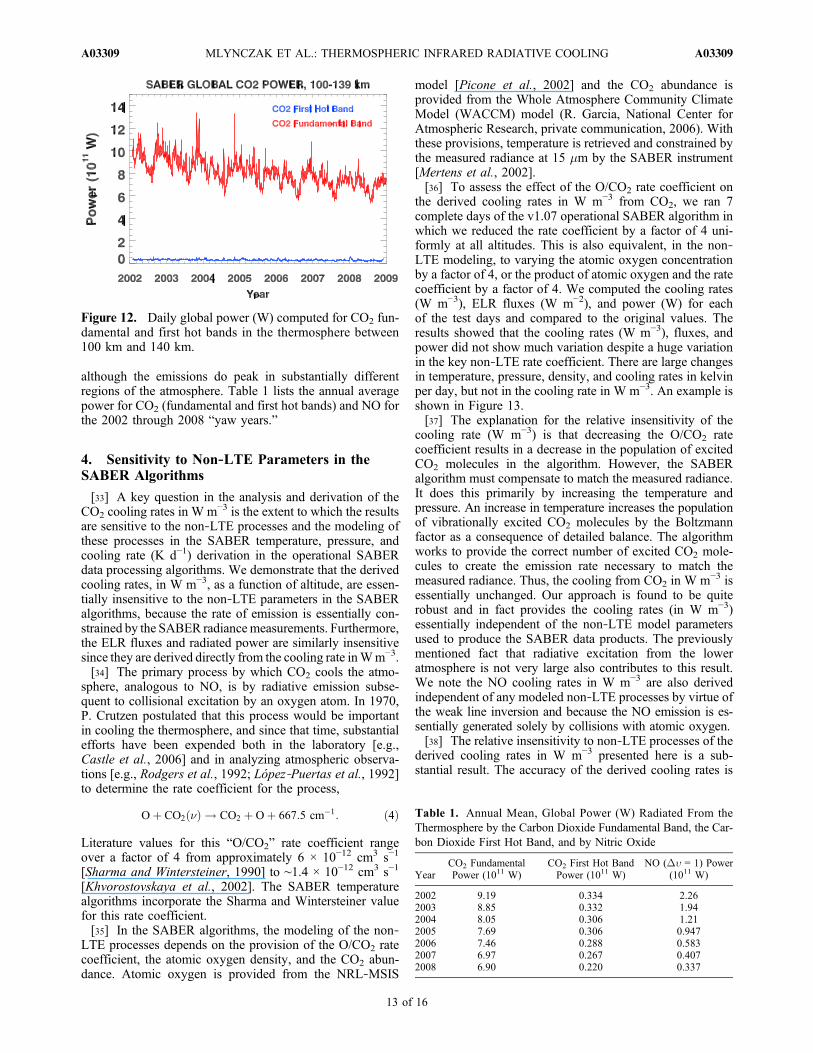
although the emissions do peak in substantially differentregions of the atmosphere. Table 1 lists the annual averagepower for CO2 (fundamental and first hot bands) and NO forthe 2002 through 2008 “yaw years.”
4. Sensitivity to Non‐LTE Parameters in theSABER Algorithms
[33] A key question in the analysis and derivation of theCO2 cooling rates in W m−3 is the extent to which the resultsare sensitive to the non‐LTE processes and the modeling ofthese processes in the SABER temperature, pressure, andcooling rate (K d−1) derivation in the operational SABERdata processing algorithms. We demonstrate that the derivedcooling rates, in W m−3, as a function of altitude, are essen-tially insensitive to the non‐LTE parameters in the SABERalgorithms, because the rate of emission is essentially con-strained by the SABER radiancemeasurements. Furthermore,the ELR fluxes and radiated power are similarly insensitivesince they are derived directly from the cooling rate inWm−3.[34] The primary process by which CO2 cools the atmo-
sphere, analogous to NO, is by radiative emission subse-quent to collisional excitation by an oxygen atom. In 1970,P. Crutzen postulated that this process would be importantin cooling the thermosphere, and since that time, substantialefforts have been expended both in the laboratory [e.g.,Castle et al., 2006] and in analyzing atmospheric observa-tions [e.g., Rodgers et al., 1992; López‐Puertas et al., 1992]to determine the rate coefficient for the process,
Oþ CO2 �ð Þ ! CO2 þ Oþ 667:5 cm�1: ð4Þ
Literature values for this “O/CO2” rate coefficient rangeover a factor of 4 from approximately 6 × 10⁻¹² cm3 s−1
[Sharma and Wintersteiner, 1990] to ∼1.4 × 10⁻¹² cm3 s−1
[Khvorostovskaya et al., 2002]. The SABER temperaturealgorithms incorporate the Sharma and Wintersteiner valuefor this rate coefficient.[35] In the SABER algorithms, the modeling of the non‐
LTE processes depends on the provision of the O/CO2 ratecoefficient, the atomic oxygen density, and the CO2 abun-dance. Atomic oxygen is provided from the NRL‐MSIS
model [Picone et al., 2002] and the CO2 abundance isprovided from the Whole Atmosphere Community ClimateModel (WACCM) model (R. Garcia, National Center forAtmospheric Research, private communication, 2006). Withthese provisions, temperature is retrieved and constrained bythe measured radiance at 15 mm by the SABER instrument[Mertens et al., 2002].[36] To assess the effect of the O/CO2 rate coefficient on
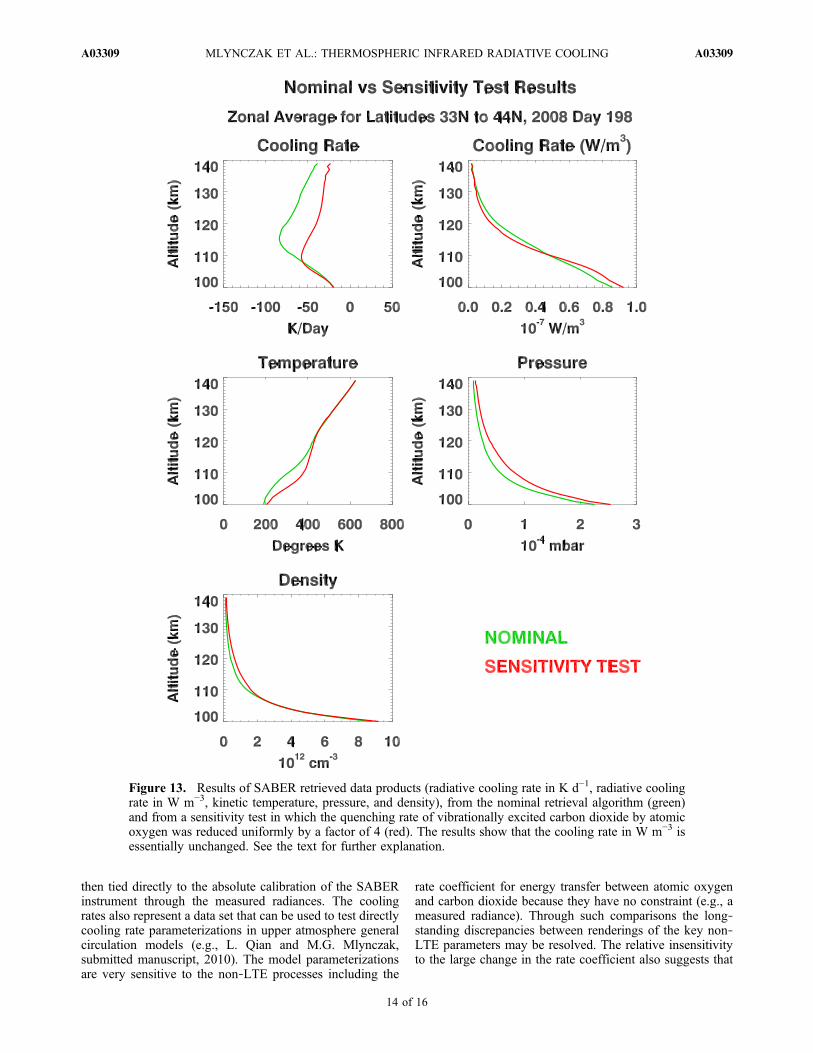
the derived cooling rates in W m−3 from CO2, we ran 7complete days of the v1.07 operational SABER algorithm inwhich we reduced the rate coefficient by a factor of 4 uni-formly at all altitudes. This is also equivalent, in the non‐LTE modeling, to varying the atomic oxygen concentrationby a factor of 4, or the product of atomic oxygen and the ratecoefficient by a factor of 4. We computed the cooling rates(W m−3), ELR fluxes (W m−2), and power (W) for eachof the test days and compared to the original values. Theresults showed that the cooling rates (W m−3), fluxes, andpower did not show much variation despite a huge variationin the key non‐LTE rate coefficient. There are large changesin temperature, pressure, density, and cooling rates in kelvinper day, but not in the cooling rate in W m−3. An example isshown in Figure 13.[37] The explanation for the relative insensitivity of the
cooling rate (W m−3) is that decreasing the O/CO2 ratecoefficient results in a decrease in the population of excitedCO2 molecules in the algorithm. However, the SABERalgorithm must compensate to match the measured radiance.It does this primarily by increasing the temperature andpressure. An increase in temperature increases the populationof vibrationally excited CO2 molecules by the Boltzmannfactor as a consequence of detailed balance. The algorithmworks to provide the correct number of excited CO2 mole-cules to create the emission rate necessary to match themeasured radiance. Thus, the cooling from CO2 in W m−3 isessentially unchanged. Our approach is found to be quiterobust and in fact provides the cooling rates (in W m−3)essentially independent of the non‐LTE model parametersused to produce the SABER data products. The previouslymentioned fact that radiative excitation from the loweratmosphere is not very large also contributes to this result.We note the NO cooling rates in W m−3 are also derivedindependent of any modeled non‐LTE processes by virtue ofthe weak line inversion and because the NO emission is es-sentially generated solely by collisions with atomic oxygen.[38] The relative insensitivity to non‐LTE processes of the
derived cooling rates in W m−3 presented here is a sub-stantial result. The accuracy of the derived cooling rates is
Table 1. Annual Mean, Global Power (W) Radiated From theThermosphere by the Carbon Dioxide Fundamental Band, the Car-bon Dioxide First Hot Band, and by Nitric Oxide
YearCO2 FundamentalPower (1011 W)
CO2 First Hot BandPower (1011 W)
NO (Du = 1) Power(1011 W)
2002 9.19 0.334 2.262003 8.85 0.332 1.942004 8.05 0.306 1.212005 7.69 0.306 0.9472006 7.46 0.288 0.5832007 6.97 0.267 0.4072008 6.90 0.220 0.337
Figure 12. Daily global power (W) computed for CO2 fun-damental and first hot bands in the thermosphere between100 km and 140 km.
MLYNCZAK ET AL.: THERMOSPHERIC INFRARED RADIATIVE COOLING A03309A03309
13 of 16
then tied directly to the absolute calibration of the SABERinstrument through the measured radiances. The coolingrates also represent a data set that can be used to test directlycooling rate parameterizations in upper atmosphere generalcirculation models (e.g., L. Qian and M.G. Mlynczak,submitted manuscript, 2010). The model parameterizationsare very sensitive to the non‐LTE processes including the
rate coefficient for energy transfer between atomic oxygenand carbon dioxide because they have no constraint (e.g., ameasured radiance). Through such comparisons the long‐standing discrepancies between renderings of the key non‐LTE parameters may be resolved. The relative insensitivityto the large change in the rate coefficient also suggests that
Figure 13. Results of SABER retrieved data products (radiative cooling rate in K d−1, radiative coolingrate in W m−3, kinetic temperature, pressure, and density), from the nominal retrieval algorithm (green)and from a sensitivity test in which the quenching rate of vibrationally excited carbon dioxide by atomicoxygen was reduced uniformly by a factor of 4 (red). The results show that the cooling rate in W m−3 isessentially unchanged. See the text for further explanation.
MLYNCZAK ET AL.: THERMOSPHERIC INFRARED RADIATIVE COOLING A03309A03309
14 of 16

the data set of cooling rates can form a climate data record[National Research Council, 2004] for the thermosphere.
5. Discussion and Summary
[39] We have presented 7 years of observations of theradiative cooling in the thermosphere as observed by theSABER instrument on the TIMED mission. The coolingrates in W m−3 are derived for emission from CO2 at 15 mmand NO at 5.3 mm. The emissions exhibit both short‐ andlong‐term variations that illustrate the sensitivity of thethermosphere on timescales ranging from daily to the11 year solar cycle. The cooling by NO is substantiallymore variable than that of CO2 due to a greater sensitivity totemperature and to a much larger variability of NO densitywith solar activity. Decreases in atomic oxygen between2002 and 2008 likely contribute to the observed decrease inboth NO and CO2 cooling.[40] The variability of the cooling has several fundamental
consequences. First, the larger equator‐to‐pole gradient incooling by NO, and its variability, implies a potential link todynamics and transport as the equator‐to‐pole gradient innet heating drives the large‐scale circulation. The observedweakening of the equator‐to‐pole gradient in radiative cool-ing over these 7 years is a strong indication that the large‐scale thermospheric dynamics have also weakened. Inaddition, the larger cooling at the poles than at low latitudesin the thermosphere is consistent with the observed coolingin the mesosphere and stratosphere, but is opposite of whatis observed in the troposphere. Thus the entire upper atmo-sphere behaves in a fundamentally different manner than thetroposphere with regards to radiative cooling as a function oflatitude.[41] We have also shown that the cooling rates derived
herein are essentially insensitive to the parameters and ratecoefficients used to compute the non‐LTE populations ofthe carbon dioxide molecule. This is because the retrievalalgorithm must match the measured radiance, and thus willproduce enough excited CO2 molecules to accomplish this,whether by increasing temperature or pressure (or both) toaccomplish the result. Further study on the sensitivity to thecarbon dioxide abundance used in the retrieval is warranted.We would expect perhaps only minor sensitivity to CO2
abundance given the relative insensitivity to a factor of 4change in the primary process responsible for cooling, andwe do not expect the CO2 used in the SABER retrieval to beoff by a factor of 4. At this time we estimate the coolingrates for CO2 emission to be accurate to better than 15%.[42] In the case of NO, the assumption is that the observed
emission is essentially all cooling, and that the Abel inver-sion and correction factors applied to determine the totalband emission are sufficient. There are uncertainties in thederived cooling, most notably in the process used to derivethe full band cooling from the measured in‐band emission.This correction (“unfilter”) factor is essentially a function ofthe rotational temperature of the NO vibration‐rotationbands. For the v1.07 SABER data we do not make a cor-rection for the rotational temperature as a function of time.As the thermosphere cools, we would expect the rotationaltemperature to decrease and thus there is a possibility thatthe correction factor to generate the total cooling rates wouldalso change. If that were the case, the correction factor
would in general decrease, implying that the changes withsolar cycle may be larger than that presented above. Thesepossibilities will be investigated in future studies by theSABER science team. We also estimate the cooling ratesdue to NO to be accurate to better than 15%. This estimateis based on the accuracy of the SABER radiometric cali-bration (1%), the possible effects of rotational temperatureuncertainties (∼10%), and on emissions that may not beproperly accounted for in correcting for the spectral responsefilter function of the SABER NO channel (∼10%). Assum-ing these uncertainties are uncorrelated, the root sum squareof these is conservatively ∼15%.[43] In closing we suggest that the data set of radiative
cooling of the thermosphere by NO and CO2 constitutes afirst climate data record for the thermosphere. The length ofthe data record and the apparent lack of dependence of thedata products on model parameters results in an accurate setof parameters that can be used to conduct fundamental testsof general circulation models of the thermosphere. Thecooling rates, radiative fluxes, and radiated power can all becompared with model calculations. This should enable testsof model chemistry and physics and in principle, resolvelong‐standing issues with regards to the parameterization ofradiative cooling in these models. As the TIMED missioncontinues, these data derived from SABER will becomeimportant in assessing long‐term changes due to the increaseof carbon dioxide in the atmosphere.
[44] Acknowledgments. M.G.M. would like to acknowledge contin-ued support from the Science Directorate at NASA Langley, from theNASA Heliophysics Division TIMED Project, and from the NASA Helio-physics Division Guest Investigator Program.[45] Zuyin Pu thanks Bernd Funke and another reviewer for their assis-
tance in evaluating this paper.
ReferencesBates, D. R. (1951), The temperature of the upper atmosphere, Proc. Phys.Soc., B64, 805–821.
Castle, K. J., K. M. Kleissas, J. M. Rhinehart, E. S. Hwang, and J. A. Dodd(2006), Vibrational relaxation of CO2(n2) by atomic oxygen, J. Geophys.Res., 111, A09303, doi:10.1029/2006JA011736.
Curtis, A. R., and R. M. Goody (1956), Thermal radiation in the upperatmosphere, Proc. R. Soc. Ser. A, 236, 193–206, doi:10.1098/rspa.1956.0128.
Dothe, H., J. W. Duff, R. D. Sharma, and N. B. Wheeler (2002), A modelof odd nitrogen in the aurorally dosed nighttime terrestrial thermosphere,J. Geophys. Res., 107(A6), 1071, doi:10.1029/2001JA000143.
Funke, B., and M. López‐Puertas (2000), Nonlocal thermodynamic equilib-rium vibrational, rotational, and spin state distribution of NO(v = 0, 1, 2)under quiescent atmospheric conditions, J. Geophys. Res., 105,4409–4426.
Gardner, J. L., B. Funke, M. G. Mlynczak, M. López‐Puertas, F. J. Martin‐Torres, J. M. Russell III, S. M. Miller, R. D. Sharma, and J. R. Winick(2007), Comparison of nighttime nitric oxide 5.3 mm emissions in thethermosphere measured by MIPAS and SABER, J. Geophys. Res.,112, A10301, doi:10.1029/2006JA011984.
Grossman, K. U., and K. Vollmann (1997), Thermal infrared measurementsin the middle and upper atmosphere, Adv. Space Res., 19(4), 631–638,doi:10.1016/S0273-1177(97)00156-7.
Grossman, K. U., M. Kaufmann, and E. Gerstner (2000), A global measure-ment of lower thermosphere atomic oxygen densities, Geophys. Res.Lett., 27, 1387–1390, doi:10.1029/2000GL003761.
Hwang, E. S., K. J. Castle, and J. A. Dodd (2003), Vibrational relaxation ofNO(v = 1) by oxygen atoms between 295 and 825 K, J. Geophys. Res.,108(A3), 1109, doi:10.1029/2002JA009688.
Khvorostovskaya, L. E., I. Y. Potekhin, G. M. Shved, V. P. Ogibalov, andT. V. Uzyukova (2002), Measurement of the rate constant for quenchingCO2 [0110] by atomic oxygen at low temperatures: Reassessment of the
MLYNCZAK ET AL.: THERMOSPHERIC INFRARED RADIATIVE COOLING A03309A03309
15 of 16
rate of cooling by the CO2 15‐mm emission in the lower thermosphere,Atmos. Ocean. Phys, 38, 613–624.
Kockarts, G. (1980), Nitric oxide cooling in the terrestrial thermosphere,Geophys. Res. Lett., 7, 137–140, doi:10.1029/GL007i002p00137.
López‐Puertas, M., and F. Taylor (2002), Non‐LTE Radiative Transfer inthe Atmosphere, Ser. Atmos., Ocean Planet. Phys., vol. 3, World Sci.,Singapore.
López‐Puertas, M., R. Rodrigo, A. Molina, and F. W. Taylor (1986a), Anon‐LTE radiative transfer model for infrared bands in the middle atmo-sphere, I. Theoretical basis and application to the CO2 15 mm bands, J.Atmos. Terr. Phys., 48, 729–748, doi:10.1016/0021-9169(86)90022-X.
López‐Puertas, M., R. Rodrigo, J. J. López‐Moreno, and F. W. Taylor(1986b), A non‐LTE radiative transfer model for infrared bands in themiddle atmosphere, II, CO2 (2.7 and 4.3 mm) and water vapour (6.3 mm)and N2(1) and O, J. Atmos. Terr. Phys., 48, 749–764, doi:10.1016/0021-9169(86)90023-1.
López‐Puertas, M., M. A. López‐Valverde, C. P. Rinsland, and M. R. Gunson(1992), Analysis of the upper atmospheric CO2 (n2) vibrational temperaturesretrieved from ATMOS‐Spacelab 3 observations, J. Geophys. Res., 97,20,469–20,478.
Mertens, C. J., M. G. Mlynczak, M. López‐Puertas, and E. E. Remsberg(2002), Impact of non‐LTE processes on middle atmospheric water vaporretrievals from simulated measurements of 6.8 mm Earth limb emission,Geophys. Res. Lett., 29(9), 1288, doi:10.1029/2001GL014590.
Mlynczak, M. G. (1996), Energetics of the middle atmosphere: Theoryand observation requirements, Adv. Space Res., 17(11), 117–126,doi:10.1016/0273-1177(95)00739-2.
Mlynczak, M. G. (1997), Energetics of the mesosphere and lower thermo-sphere and the SABER experiment, Adv. Space Res., 20(6), 1177–1183,doi:10.1016/S0273-1177(97)00769-2.
Mlynczak, M. G. (2000), A contemporary assessment of the middle atmo-sphere energy budget, in Atmospheric Science Across the Stratopause,Geophys. Monogr. Ser., vol. 123, edited by D. Siskind et al., pp. 37–52, AGU, Washington, D. C.
Mlynczak, M. G., C. J. Mertens, R. R. Garcia, and R. W. Portmann (1999),A detailed evaluation of the stratospheric heat budget: 2. Global radiationbalance and diabatic circulations, J. Geophys. Res., 104, 6039–6066,doi:10.1029/1998JD200099.
Mlynczak, M., et al. (2003), The natural thermostat of nitric oxide emissionat 5.3 mm in the thermosphere observed during the solar storms of April2002, Geophys. Res. Lett., 30(21), 2100, doi:10.1029/2003GL017693.
Mlynczak, M. G., F. J. Martin‐Torres, D. G. Johnson, D. P. Kratz, W. A.Traub, and K. Jucks (2004), Observations of the O(3P) fine structure lineat 63 mm in the upper mesosphere and lower thermosphere, J. Geophys.Res., 109, A12306, doi:10.1029/2004JA010595.
Mlynczak, M. G., et al. (2005), Energy transport in the thermosphere dur-ing the solar storm events of April 2002, J. Geophys. Res., 110, A12S25,
doi:10.1029/2005JA011141, (Correction, J. Geophys. Res., 112,A02303, doi:10.1029/2006JA012008, 2007.)
Mlynczak, M. G., F. J. Martin‐Torres, B. T. Marshall, E. Thompson,J. Williams, T. Turpin, D. P. P. Kratz, J. M. Russell III, T. N. Woods,and L. L. Gordley (2007), Evidence for a solar cycle influence on theinfrared energy budget and radiative cooling of the thermosphere,J. Geophys. Res., 112, A12302, doi:10.1029/2006JA012194.
National Research Council (2004), Climate Data Records From Environ-mental Satellites, Natl. Acad. Press, Washington, D. C.
Picone, J. M., A. E. Hedin, D. P. Drob, and A. C. Aikin (2002),NRLMSISE‐00 empirical model of the atmosphere: Statistical compari-sons and scientific issues, J. Geophys. Res., 107(A12), 1468,doi:10.1029/2002JA009430.
Rodgers, C., F. Taylor, A. Muggeridge, M. López‐Puertas, and M. López‐Valverde (1992), Local thermodynamic equilibrium of carbon dioxide inthe upper atmosphere, Geophys. Res. Lett., 19, 589–592, doi:10.1029/92GL00160.
Russell, J. M., III, M. G. Mlynczak, L. L. Gordley, J. J. Tansock Jr., andR. W. Esplin (1999), Overview of the SABER experiment and prelimi-nary calibration results, Proc. SPIE, 3756, 277, doi:10.1117/12.366382.
Sharma, R., and P. Wintersteiner (1990), Role of carbon dioxide in coolingplanetary thermospheres, Geophys. Res. Lett., 17, 2201–2204,doi:10.1029/GL017i012p02201.
Sharma, R. D., H. Dothe, F. von Esse, V. A. Kharchenko, Y. Sun, andA. Dalgarno (1996), Production of vibrationally and rotationally excitedNO in the night time terrestrial thermosphere, J. Geophys. Res., 101,19,707–19,713.
Vonder Haar, T. H., and V. E. Suomi (1969), Measurements of the Earth’sradiation budget from satellites during a five‐year period: Part I. Extendedtime and space means, J. Atmos. Sci., 28, 305–314, doi:10.1175/1520-0469(1971)028<0305:MOTERB>2.0.CO;2.
L. L. Gordley, R. E. Thompson, and B. Thomas Marshall, GATS Inc.,11864 Canon Blvd., Ste. 101, Newport News, VA 23606, USA.L. A. Hunt, SSAI, 1 Enterprise Pkwy., Ste. 200, Hampton, VA 23666,
USA.M. López‐Puertas, IAA, E‐18008 Granada, Spain.F. J. Martin‐Torres, Jet Propulsion Laboratory, California Institute of
Technology, Pasadena, CA 91109, USA.C. J. Mertens, M. G. Mlynczak, and E. E. Remsberg, NASA Langley
Research Center, Hampton, VA 23681, USA. ([email protected])R. Picard and J. Winick, AFRL, Hanscom AFB, 29 Randolph Rd.,
Bedford, MA 01731, USA.J. M. Russell III, Hampton University, Hampton, VA 23668, USA.P. Wintersteiner, ARCON Corp., 260 Bear Hill Rd., Waltham, MA
02451, USA.
MLYNCZAK ET AL.: THERMOSPHERIC INFRARED RADIATIVE COOLING A03309A03309
16 of 16