Multiple Plagioclase Crystal Populations Identified by Crystal Size Distribution and in situ...
26
Multiple Plagioclase Crystal Populations Identified by Crystal Size Distribution and in situ Chemical Data: Implications for Timescales of Magma Chamber Processes Associated with the 1915 Eruptionof Lassen Peak, CA MORGAN J. SALISBURY 1 *, WENDY A. BOHRSON 1y , MICHAEL A. CLYNNE 2 , FRANK C. RAMOS 3 AND PAUL HOSKIN 4 1 DEPARTMENT OF GEOLOGICAL SCIENCES, CENTRAL WASHINGTON UNIVERSITY, ELLENSBURG, WA 98926, USA 2 US GEOLOGICAL SURVEY, 345 MIDDLEFIELD ROAD, MENLO PARK, CA 94025, USA 3 DEPARTMENT OF GEOLOGICAL SCIENCES, NEW MEXICO STATE UNIVERSITY, LAS CRUCES, NM 88003, USA 4 DEPARTMENT OF GEOSCIENCE, UNIVERSITY OF CALGARY, CALGARY, ALBERTA T2N 1N4, CANADA RECEIVED DECEMBER 20, 2007; ACCEPTED SEPTEMBER 2, 2008 Products of the 1915 Lassen Peak eruption reveal evidence for a magma recharge^magma mixing event that may have catalyzed the eruption and from which four compositional members were identi- fied: light dacite, black dacite, andesitic inclusion, and dark andes- ite. Crystal size distribution, textural, and in situ chemical (major and trace element and Sr isotope) data for plagioclase from these compositional products define three crystal populations that have dis- tinct origins: phenocrysts (long axis40 5 mm) that typically have core An contents between 34 and 36 mol %, microphenocrysts (long axis between 0 1 and 0 5 mm) that have core An contents of 66^69, and microlites (long axis50 1mm) with variable An core contents from 64 to 52. Phenocrysts are interpreted to form in an isolated dacitic magma chamber that experienced slow cooling. Based on tex- tural, compositional, and isotopic data for the magma represented by the dacitic component, magma recharge was not an important process until just prior to the 1915 eruption. Average residence times for phe- nocrysts are in the range of centuries to millennia. Microphenocrysts formed in a hybrid layer that resulted from mixing between end- member reservoir dacite and recharge magma of basaltic andesite composition. High thermal contrast between the two end-member magmas led to relatively high degrees of undercooling, which resulted in faster crystal growth rates and acicular and swallowtail crystal habits. Some plagioclase phenocrysts from the dacitic chamber were incorporated into the hybrid layer and underwent dissolution^preci- pitation, seen in both crystal textures and rim compositions. Average microphenocryst residence times are of the order of months. Microlites may have formed in response to decompression and/or syn-eruptive degassing as magma ascended from the chamber through the volcanic conduit. Chemical distinctions in plagioclase microlite An contents reveal that melt of the dark andesite was more mafic than the melt of the other three compositions.We suggest that mixing of an intrud- ing basaltic andesite and reservoir dacite before magma began ascending in the conduit allowed formation of a compositionally dis- tinct microlite population. Melt in the other three products was more evolved because it had undergone differentiation during the months following initial mixing; as a consequence, melt and microlites among these three products have similar compositions.The results of this study highlight the integrated use of crystal size distribution, tex- tural, and in situ chemical data in identifying distinct crystal popu- lations and linking these populations to the thermal and chemical characteristics of complex magma bodies. KEY WORDS: crystal size distribution; Lassen Peak; magma mixing; timescale; in situ *Present address: Department of Geosciences, Oregon State University, Corvallis, OR 97331, USA. y Corresponding author. Telephone: 509.963.2835. Fax: 509.963.2821. E-mail: [email protected] ß The Author 2008. Published by Oxford University Press. All rights reserved. For Permissions, please e-mail: journals.permissions@ oxfordjournals.org JOURNAL OF PETROLOGY VOLUME 00 NUMBER 0 PAGES 1^26 2008 doi:10.1093/petrology/egn045 Journal of Petrology Advance Access published October 10, 2008 by guest on December 17, 2015 http://petrology.oxfordjournals.org/ Downloaded from
-
Upload
independent -
Category
Documents
-
view
0 -
download
0
Transcript of Multiple Plagioclase Crystal Populations Identified by Crystal Size Distribution and in situ...

Multiple Plagioclase Crystal PopulationsIdentified by Crystal Size Distribution and in situChemical Data: Implications forTimescales ofMagma Chamber Processes Associated with the1915 Eruption of Lassen Peak, CA
MORGAN J. SALISBURY1*,WENDYA. BOHRSON1y,MICHAEL A. CLYNNE2, FRANK C. RAMOS3 AND PAUL HOSKIN4
1DEPARTMENT OF GEOLOGICAL SCIENCES, CENTRAL WASHINGTON UNIVERSITY, ELLENSBURG, WA 98926, USA2US GEOLOGICAL SURVEY, 345 MIDDLEFIELD ROAD, MENLO PARK, CA 94025, USA3DEPARTMENT OF GEOLOGICAL SCIENCES, NEW MEXICO STATE UNIVERSITY, LAS CRUCES, NM 88003, USA4DEPARTMENT OF GEOSCIENCE, UNIVERSITY OF CALGARY, CALGARY, ALBERTA T2N 1N4, CANADA
RECEIVED DECEMBER 20, 2007; ACCEPTED SEPTEMBER 2, 2008
Products of the 1915 Lassen Peak eruption reveal evidence for a
magma recharge^magma mixing event that may have catalyzed the
eruption and from which four compositional members were identi-
fied: light dacite, black dacite, andesitic inclusion, and dark andes-
ite. Crystal size distribution, textural, and in situ chemical (major
and trace element and Sr isotope) data for plagioclase from these
compositional products define three crystal populations that have dis-
tinct origins: phenocrysts (long axis40�5 mm) that typically have
core An contents between 34 and 36 mol %, microphenocrysts (long
axis between 0�1 and 0�5 mm) that have core An contents of 66^69,
and microlites (long axis50�1mm) with variable An core contents
from 64 to 52. Phenocrysts are interpreted to form in an isolated
dacitic magma chamber that experienced slow cooling. Based on tex-
tural, compositional, and isotopic data for the magma represented by
the dacitic component, magma recharge was not an important process
until just prior to the 1915 eruption. Average residence times for phe-
nocrysts are in the range of centuries to millennia. Microphenocrysts
formed in a hybrid layer that resulted from mixing between end-
member reservoir dacite and recharge magma of basaltic andesite
composition. High thermal contrast between the two end-member
magmas led to relatively high degrees of undercooling, which resulted
in faster crystal growth rates and acicular and swallowtail crystal
habits. Some plagioclase phenocrysts from the dacitic chamber were
incorporated into the hybrid layer and underwent dissolution^preci-
pitation, seen in both crystal textures and rim compositions. Average
microphenocryst residence times are of the order of months. Microlites
may have formed in response to decompression and/or syn-eruptive
degassing as magma ascended from the chamber through the volcanic
conduit. Chemical distinctions in plagioclase microlite An contents
reveal that melt of the dark andesite was more mafic than the melt
of the other three compositions.We suggest that mixing of an intrud-
ing basaltic andesite and reservoir dacite before magma began
ascending in the conduit allowed formation of a compositionally dis-
tinct microlite population. Melt in the other three products was more
evolved because it had undergone differentiation during the months
following initial mixing; as a consequence, melt and microlites
among these three products have similar compositions.The results of
this study highlight the integrated use of crystal size distribution, tex-
tural, and in situ chemical data in identifying distinct crystal popu-
lations and linking these populations to the thermal and chemical
characteristics of complex magma bodies.
KEY WORDS: crystal size distribution; Lassen Peak; magma mixing;
timescale; in situ
*Present address: Department of Geosciences, Oregon StateUniversity, Corvallis, OR 97331, USA.yCorresponding author. Telephone: 509.963.2835. Fax: 509.963.2821.E-mail: [email protected]
� The Author 2008. Published by Oxford University Press. Allrights reserved. For Permissions, please e-mail: [email protected]
JOURNALOFPETROLOGY VOLUME 00 NUMBER 0 PAGES1^26 2008 doi:10.1093/petrology/egn045
Journal of Petrology Advance Access published October 10, 2008
by guest on Decem
ber 17, 2015http://petrology.oxfordjournals.org/
Dow
nloaded from

I NTRODUCTIONMixing of thermally and compositionally distinct magmasleads to a diverse array of whole-rock characteristics,mineral and rock textures, and mineral zoning, and alsohas the potential to influence eruption dynamics.Evidence for magma mixing, which ranges from macro-scale banding in erupted products (e.g. banded pumice ofthe 1915 Lassen Peak eruption, Clynne,1999) to micro-scaledisequilibrium textures and compositional zoning (e.g.Nakamura, 1995; Tepley et al., 1999; Browne et al., 2006),provides constraints for numerous models describing thespectrum of possible mixing or mingling mechanisms.Particularly in the case of intermediate composition
magmas, the typical products of magma mixing are basal-tic to andesitic inclusions that are found in dacitic to rhyo-litic volcanic products but are also important componentsin evolved plutonic bodies (Eichelberger, 1980; Bacon,1986). These inclusions are commonly fine-grained, ellip-soidal blobs that have high vesicle contents and disequilib-rium crystal assemblages (i.e. compositional and texturalevidence of disequilibrium) (e.g. Eichelberger, 1980;Bacon, 1986). The combined textural and chemical charac-teristics of these inclusions have led to a formation modelinvolving injection of hotter, more mafic magma into acooler, more silicic body. Depending on volume and tem-perature contrasts, the mafic magma may mix with themore silicic magma, producing a hybrid magma (Sparks& Marshall, 1986). The key aspect of this interaction isthat cooling of the more mafic material enhances crystal-lization, which in turn may cause volatile saturation, exso-lution and formation of a mafic foam. This foam istypically less dense than the host silicic magma, producingpossible instabilities in the magma body. In some cases,these instabilities may catalyze a volcanic eruption(Eichelberger, 1980). Such a cause^effect relationship hasimportant implications for volcanic hazard assessment,particularly if the mixing event can be detected throughseismic and/or other means of active monitoring and if acharacteristic timescale between the mixing event anderuption can be defined.Recent advances in in situ chemical analysis techniques
have permitted the study of mixed magma products at arange of scales. These data, coupled with textural informa-tion, have led to better insights into processes of magmamixing (Singer et al., 1995; Pallister et al., 1996; Tepley et al.1999; Coombs et al. 2000; Izbekov et al., 2004; Browne et al.,2006). Documenting timescales of mixing requires knowl-edge of time-dependent parameters such as diffusion orcrystal growth. Theory developed for crystal size distribu-tions (CSDs, e.g. Randolf & Larson, 1971; Cashman &Marsh, 1988; Marsh, 1988, 1998; Higgins, 2000, 2006) pro-vides a method for determining the average residence timefor a population of crystals by equating the slope of a CSDto ^1/(growth rate � residence time). This method has
been used to determine timescales of magmatic processesin a variety of volcanic settings (e.g. Mangan, 1990;Resmini & Marsh, 1995; Higgins, 1996a, 1996b). The well-documented relationship between rock texture, as mani-fested by crystal size data, and cooling history providespotentially valuable information about the thermal condi-tions of a magma body (Cashman,1993).As documented by Clynne (1999), the 1915 Lassen Peak
(USA) eruption produced four volcanic products inter-preted to result from a magma mixing event. In thisstudy, we combine CSD data, Nomarski differential inter-ference contrast (NDIC) images, and in situ major andtrace element and isotopic data from plagioclase in thefour products to further constrain how and over what time-scales magma mixing occurred. Such integration allowsplagioclase in the four products to be divided into distinctpopulations, each with a unique origin and timescale offormation.
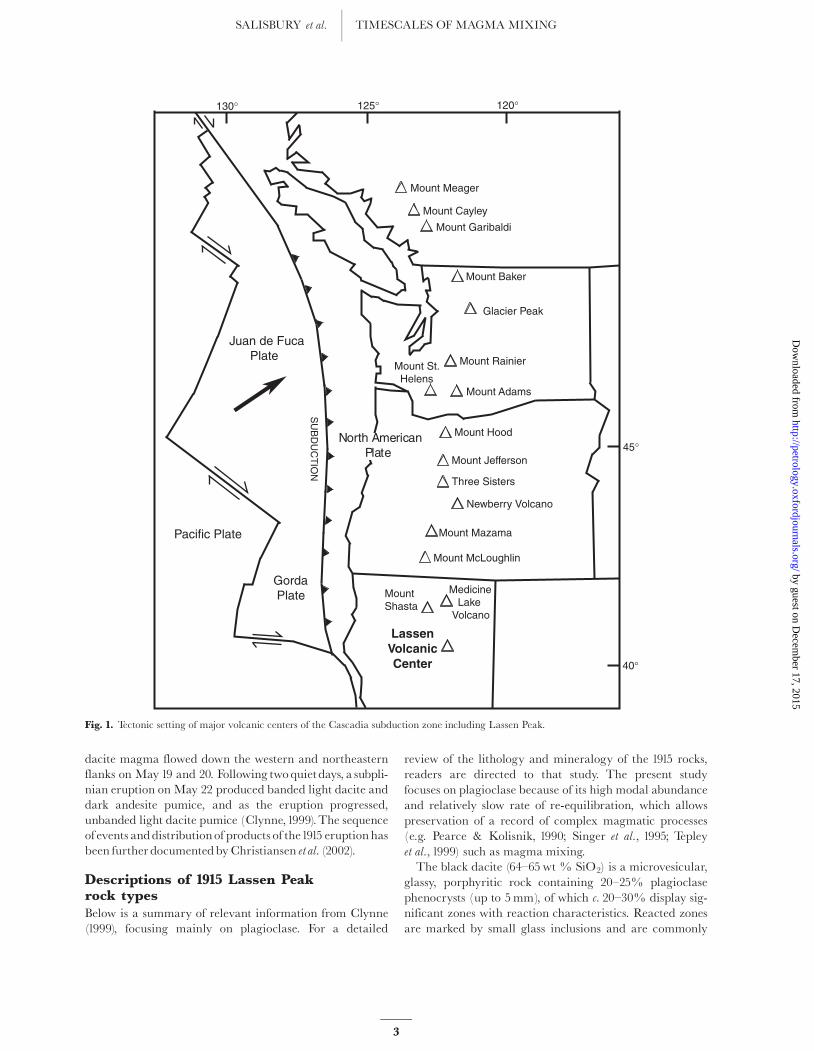
BACKGROUNDGeological setting of Lassen Peak volcanoand chronology of the 1915 eruptionLassen Peak volcano, the southernmost of the Cascade vol-canoes, lies within the Lassen Volcanic Center (LVC) innortheastern California (Fig. 1). The LVC is situatedabove the subducting Gorda plate and lies on the westernedge of the Basin and Range province; both of these tec-tonic regimes contribute to volcanism in the region(Guffanti et al., 1990). The LVC is the youngest of five vol-canic centers that have been active in the LassenVolcanicNational Park region during the past 3 Myr (Clynne,1990). Lassen Peak volcano is the highest and largest of agroup of more than 30 domes that have been emplacedover the past 300 kyr (Clynne et al., 1999). The LassenPeak dome formed in a single, silicic eruption at about 27ka (Turrin et al., 1998), and no additional activity occurreduntil 1915. Nearby Chaos Crags erupted at 1�1 ka (Clynne,1999). Evidence of magma mixing, including disequilib-rium phenocryst assemblages and undercooled mafic inclu-sions, is common in the LVC, including the 27 ka eruptionof Lassen Peak (Turrin et al., 1998) and the 1�1 ka eruptionof Chaos Crags (Tepley et al., 1999).Activity related to the 1915 eruption of Lassen Peak
began on May 30, 1914, and numerous steam explosionspersisted until lava erupted in mid-May 1915. Within aweek, four distinct rock types, as identified by Clynne(1999), erupted from the summit: (1) black dacite contain-ing (2) undercooled andesitic inclusions, (3) composition-ally banded pumice with dark andesite and light dacitebands, and (4) unbanded light dacite. The black dacitebegan to erupt and form a dome on May 14, 1915. Thegrowing dome of black dacite was disrupted on May 19 bya phreatic explosion that unplugged the vent and black
JOURNAL OF PETROLOGY VOLUME 00 NUMBER 0 MONTH 2008
2
by guest on Decem
ber 17, 2015http://petrology.oxfordjournals.org/
Dow
nloaded from
dacite magma flowed down the western and northeasternflanks on May 19 and 20. Following twoquietdays, a subpli-nian eruption on May 22 produced banded light dacite anddark andesite pumice, and as the eruption progressed,unbanded light dacite pumice (Clynne,1999).The sequenceof events anddistributionof products of the1915 eruption hasbeen further documentedbyChristiansen et al. (2002).
Descriptions of 1915 Lassen Peakrock typesBelow is a summary of relevant information from Clynne(1999), focusing mainly on plagioclase. For a detailed
review of the lithology and mineralogy of the 1915 rocks,readers are directed to that study. The present studyfocuses on plagioclase because of its high modal abundanceand relatively slow rate of re-equilibration, which allowspreservation of a record of complex magmatic processes(e.g. Pearce & Kolisnik, 1990; Singer et al., 1995; Tepleyet al., 1999) such as magma mixing.The black dacite (64^65wt % SiO2) is a microvesicular,
glassy, porphyritic rock containing 20^25% plagioclasephenocrysts (up to 5mm), of which c. 20^30% display sig-nificant zones with reaction characteristics. Reacted zonesare marked by small glass inclusions and are commonly
Juan de Fuca Plate
Mount Meager
Mount Cayley
Mount Garibaldi
Mount Baker
Glacier Peak
Mount Rainier
Mount Adams
Mount St. Helens
Mount Hood
Mount Jefferson
Three Sisters
Newberry Volcano
Mount Mazama
Mount McLoughlin
Medicine Lake Volcano
Mount Shasta
LassenVolcanicCenter
Gorda Plate
Pacific Plate
130° 125° 120°
45°
40°
SU
BD
UC
TIO
N
North American Plate
Fig. 1. Tectonic setting of major volcanic centers of the Cascadia subduction zone including Lassen Peak.
SALISBURY et al. TIMESCALES OF MAGMA MIXING
3
by guest on Decem
ber 17, 2015http://petrology.oxfordjournals.org/
Dow
nloaded from
described by such textural terms as sieved, mottled,mantled, cloudy or dusty. These textures probably resultfrom partial dissolution of plagioclase as a reactionto hotter magmas associated with magma mixing(Tsuchiyama & Takahashi, 1983). The black dacite alsocontains phenocrysts of biotite, hornblende, quartz, andolivine, and microphenocrysts of plagioclase, clinopyrox-ene, orthopyroxene, olivine, and titanomagnetite. Theblack dacite contains abundant (�5%) undercooled andes-itic inclusions (57^59�5wt % SiO2) that range up to�50 cm in diameter and are typically subrounded to sub-angular. Morphologically and texturally similar inclu-sions, also known as mafic inclusions or enclaves, havebeen described at a number of subduction-related volca-noes (e.g. Bacon, 1986; Thomas & Tait, 1997; Coombset al., 2002) and are attributed to mixing between magmasof different composition and temperature. In these inclu-sions, phenocrysts of plagioclase, olivine, hornblende, bio-tite, titanomagnetite, and quartz are set in amicrovesicular groundmass composed of �50% interstitialglass, �30% microphenocrysts of plagioclase (commonlyswallow-tailed or hollow-textured), and lesser amounts ofclinopyroxene and orthopyroxene. All plagioclase pheno-crysts in the inclusions exhibit reaction characteristics.Andesitic inclusions are absent in unmixed dark andesiteand are rare in the light dacite.Light dacite is microvesicular to pumiceous, has the
same phenocryst assemblage as the black dacite, and hassimilar to higher SiO2 (64�5^68wt %). The most siliciclight dacite is less porphyritic and has fewer reacted pla-gioclase phenocrysts than the black dacite. The least silicicis very similar in composition to the black dacite. Darkandesite (60^61wt % SiO2) is a glassy, microvesicular topumiceous rock with olivine phenocrysts, pyroxene, andplagioclase microphenocrysts, and rare reacted plagioclasephenocrysts.Typically,unreactedplagioclasephenocrystsarerelatively
clear and characterized by oscillatory zoning. CompositionsnearAn30 are typical, but cores up toAn45 have been docu-mented in addition to rare, ragged xenocrystic cores ascalcic as An80 (Clynne,1999). More calcic rims are common(up toAn50), more so in the black dacite compared with thelight dacite. Reacted crystals have overgrowth rims up to0�10mmthick that aremore calcic (An75) and exhibit strongnormal zoning to the crystal edge (An50). Acicular plagio-clase microphenocrysts up to 0�5mm are most abundant inthe andesitic inclusions, common in the black and lightdacite, and sparse in the dark andesite. Cores of the micro-phenocrysts are in the range of An75, but the crystals arestrongly normally zoned toAn50 at the rims.
Lassen Peak magma mixing modelCompositional diversity, disequilibrium phenocryst assem-blages and reacted plagioclase phenocrysts in the 1915 pro-ducts led Clynne (1999) to develop a model of mixing
between intruding basaltic andesite and a reservoir daciticmagma containing unreacted plagioclase, biotite, amphi-bole, orthopyroxene, quartz, and titanomagnetite.Mineralogy and mixing calculations indicated that theintruding magma was probably a basaltic andesite.Consistent with a magma mixing hypothesis, a conspicu-ous feature of the 1915 Lassen Peak eruption products isthe presence of andesitic inclusions.Turbulent mixing between the two thermally and com-
positionally distinct magmas formed a hybrid andesiticmagma. Heat loss from the hybrid magma to the overlyingdacite resulted in undercooling, which led to rapid crystal-lization of new plagioclase microphenocrysts, resulting insupersaturation of volatiles and the creation of a layer ofmafic foam. The highly vesicular hybrid magma then par-tially broke up and rose into the host dacite formingmicrophenocryst-rich andesitic inclusions. Disaggregationof some of these andesitic inclusions into the host dacite gen-eratedtheblackdacite.Whentheblackdacitecouldnolongercool the hybrid mafic magma to the point of vesiculation,mixing occurred between the mafic magma and the blackdacite, producing the dark andesite magma. Ascent anderuption of the hot, volatile-rich black dacite allowed thedark andesite and light dacite tomix in the conduit en route tothe surface, ultimately formingbandedpumice.
DESCR IPT ION OF SAMPLES ,DATA COLLECT ION ANDANALYT ICAL PROCEDURESA representative sample of each of the four compositionaltypes (black dacite, light dacite, andesitic inclusion, darkandesite) identified by Clynne (1999) was collected fordetailed analysis. For each sample, one 100 mm thickdoubly polished section was produced. From each section,plagioclase crystals were analyzed for four types of data:(1) crystal size distribution (CSD); (2) detailed texturalinformation from Nomarksi differential image contrast(NDIC) imaging (Anderson, 1983; Pearce & Clark, 1989;Tepley et al., 1999); (3) in situ major and trace element con-centrations; (4) in situ Sr isotope ratios.An important aspect of this study is the integration of
data from each of these techniques.To correlate plagioclasecompositional and textural information with size, the loca-tion of each crystal analyzed was recorded by assigning anaddress (x, y coordinate) to each crystal on digital imagesof polished sections. These images were obtained by alumi-num X-ray analysis using the Oregon State UniversityCAMECA SX-50 electron-microprobe (Fig. 2). Plagioclasewas effectively resolved on the images because of theabundance of aluminum in the crystals. For each sample,aluminum X-ray images were obtained at two scalesto effectively resolve both smaller and larger crystals(Fig. 2a and b).
JOURNAL OF PETROLOGY VOLUME 00 NUMBER 0 MONTH 2008
4
by guest on Decem
ber 17, 2015http://petrology.oxfordjournals.org/
Dow
nloaded from
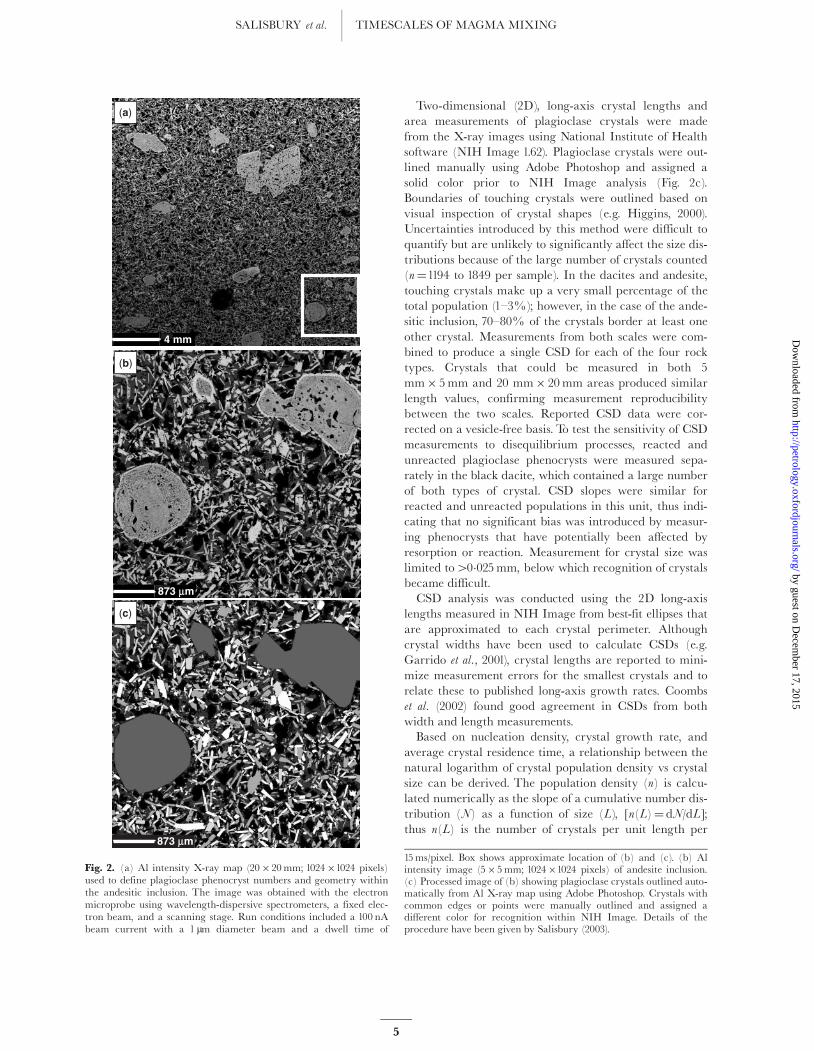
Two-dimensional (2D), long-axis crystal lengths andarea measurements of plagioclase crystals were madefrom the X-ray images using National Institute of Healthsoftware (NIH Image 1.62). Plagioclase crystals were out-lined manually using Adobe Photoshop and assigned asolid color prior to NIH Image analysis (Fig. 2c).Boundaries of touching crystals were outlined based onvisual inspection of crystal shapes (e.g. Higgins, 2000).Uncertainties introduced by this method were difficult toquantify but are unlikely to significantly affect the size dis-tributions because of the large number of crystals counted(n¼1194 to 1849 per sample). In the dacites and andesite,touching crystals make up a very small percentage of thetotal population (1^3%); however, in the case of the ande-sitic inclusion, 70^80% of the crystals border at least oneother crystal. Measurements from both scales were com-bined to produce a single CSD for each of the four rocktypes. Crystals that could be measured in both 5mm� 5mm and 20 mm� 20mm areas produced similarlength values, confirming measurement reproducibilitybetween the two scales. Reported CSD data were cor-rected on a vesicle-free basis. To test the sensitivity of CSDmeasurements to disequilibrium processes, reacted andunreacted plagioclase phenocrysts were measured sepa-rately in the black dacite, which contained a large numberof both types of crystal. CSD slopes were similar forreacted and unreacted populations in this unit, thus indi-cating that no significant bias was introduced by measur-ing phenocrysts that have potentially been affected byresorption or reaction. Measurement for crystal size waslimited to40�025mm, below which recognition of crystalsbecame difficult.CSD analysis was conducted using the 2D long-axis
lengths measured in NIH Image from best-fit ellipses thatare approximated to each crystal perimeter. Althoughcrystal widths have been used to calculate CSDs (e.g.Garrido et al., 2001), crystal lengths are reported to mini-mize measurement errors for the smallest crystals and torelate these to published long-axis growth rates. Coombset al. (2002) found good agreement in CSDs from bothwidth and length measurements.Based on nucleation density, crystal growth rate, and
average crystal residence time, a relationship between thenatural logarithm of crystal population density vs crystalsize can be derived. The population density (n) is calcu-lated numerically as the slope of a cumulative number dis-tribution (N) as a function of size (L), [n(L)¼ dN/dL];thus n(L) is the number of crystals per unit length per
(a)
(b)
(c)
4 mm
873 mm
873 mm
Fig. 2. (a) Al intensity X-ray map (20�20mm; 1024�1024 pixels)used to define plagioclase phenocryst numbers and geometry withinthe andesitic inclusion. The image was obtained with the electronmicroprobe using wavelength-dispersive spectrometers, a fixed elec-tron beam, and a scanning stage. Run conditions included a 100 nAbeam current with a 1 mm diameter beam and a dwell time of
15ms/pixel. Box shows approximate location of (b) and (c). (b) Alintensity image (5�5mm; 1024�1024 pixels) of andesite inclusion.(c) Processed image of (b) showing plagioclase crystals outlined auto-matically from Al X-ray map using Adobe Photoshop. Crystals withcommon edges or points were manually outlined and assigned adifferent color for recognition within NIH Image. Details of theprocedure have been given by Salisbury (2003).
SALISBURY et al. TIMESCALES OF MAGMA MIXING
5
by guest on Decem
ber 17, 2015http://petrology.oxfordjournals.org/
Dow
nloaded from

unit volume. Linear least-squares regression of ln (n) vs Lwas used to calculate the slope and intercept values forCSD data reported in this study. For crystal shapes, noexact transformation from 2D crystal lengths to the thirddimension exists; a commonly used conversion from 2Dto 3D values raises N to the 3/2 power (e.g. Cashman &Marsh, 1988; Cashman, 1990). Higgins (2000) questionedthe use of this conversion on stereological grounds andprovided an alternative method to correct for this problem,called CSDCorrections.CSDCorrections requires 2D length measurements, image
area, average crystal habit, roundness, and sample folia-tion. The 3D crystal habits of the plagioclase crystalswere estimated from 2D short-axis/long-axis measure-ments using CSDslice software (Morgan & Jerram, 2006).Because CSDCorrections cannot, at the time of this writing,input varying shape or rounding estimates for different setsof crystals, all crystals were classified as unrounded, withan average shape of 1:2�1:4�3, based on aspect ratio mea-surements from CSDSlice. All 1915 plagioclase crystals areassumed to be randomly oriented.Nomarski differential image contrast (NDIC) images
were collected at Portland State University. Each 100 mmsection was immersed in fluoroboric (HBF4) acid for15^30 s. HBF4 preferentially dissolves Ca-rich zones in pla-gioclase, thereby producing microtopographic relief ofsodic highs and calcic lows. A carbon coat was added tothe surface to increase reflectivity and decrease internalreflections within crystals. The relief was imaged by a35mm camera using black and white film and a petrog-raphic microscope fitted with Nomarski filters. For each ofthe four 1915 samples, 15 NDIC images were collected.From these, a detailed textural analysis was carried out ona minimum of 40 crystals per composition.Based on NDIC textural data, selected crystals were
chosen for in situ major and trace element analyses. Majorelements of plagioclase and glass were analyzed with theOregon State University CAMECA SX-50 electronmicroprobe, using an accelerating potential of 15 kV, abeam current of 30 nA, 10 s count times, and a 4 mm dia-meter spot size. Lake County Labradorite (USNM115900) and Kakanui Anorthoclase (USNM 133868) wereanalyzed repeatedly prior to analyses of Lassen Peakplagioclase grains. Major element concentration reprodu-cibility ranges from �1% for SiO2, Na2O, and Al2O3, to�3�9% for CaO, and �9�7% for K2O. Glass analyseswere performed using the same calibration procedure andoxide suite as plagioclase and consequently provide a semi-quantitative description.Trace elements (Sc, Rb, Sr, Y, Ba, La, Ce, Nd, Sm, Eu,
Pb) in plagioclase were analyzed by laser ablation induc-tively coupled plasma mass spectrometry (ICP-MS) at theAustralian National University. Instrumentation protocolincludes an ArF (193 nm wavelength) Excimer laser,
custom-built sample cell and transport system, andHP7500 Agilent ICP-MS system. Ion lens settings wereoptimized to give large and stable signals across the mea-sured mass range (44Ca to 238U). Signal optimization wasperformed at the beginning of the analytical session andat regular intervals thereafter during ablation of the refer-ence material NIST SRM 612. Time-resolved spot analysesof three mineral ‘unknowns’ were bracketed by analyses ofNIST SRM 612. Data were standardized using values ofNIST SRM 612 from Eggins (2003). For all analyses, Cafrom electron microprobe analyses was used as an internalstandard for data reduction. Elemental abundances havean estimated uncertainty of� 15% relative standard devia-tion. This value combines uncertainties from counting sta-tistics and the size difference of laser ablation pits(75^100 mm diameter) for trace-element analysis and elec-tron microprobe spots (2^5 mm) for major-element deter-mination for external standardization of laser ablationICP-MS data.Sr isotope analyses of plagioclase crystals were per-
formed by laser ablation using a NewWave UP213TM NdYAG laser ablation sampling system and by inductivelycoupled plasma multiple-collector mass spectrometry(LA-MC-ICPMS) using a ThermoFinniganNeptuneTM
system and by microdrill sampling at Washington StateUniversity. Each reported LA-MC-ICPMS 87Sr/86Sr ratiowas derived from 30 Sr isotopic ratios measured in 8 sintegrations. Laser troughs of 160 mm� 500 mm wereused. Laser and MC-ICPMS settings have been reportedby Ramos et al. (2004). Baselines were measured on-peakfor 180 s while flushing the sample chamber with helium,similar to that used during laser sampling. The effects ofinterfering elements including Yb2þ, Er2þ, and Rbwere accounted for by offline data reduction detailed byRamos et al. (2004). Interference corrected Sr isotoperatios were calculated and exponentially corrected to86Sr/88Sr¼ 0�1194. During the analytical period, 100 ppbsolutions of standard NBS987 averaged 0�710245�37(2 SD).Because a large mass had to be ablated to produce suffi-
cient Sr isotope beam intensities, microphenocrysts werenot analyzed by LA-MC-ICPMS. Therefore, to character-ize the typical Sr isotope signatures of microphenocrystsand average groundmass in each sample, 0�1mm diametermicrodrill samples were obtained from the matrix fromeach of the four 100mm sections in addition to one micro-phenocryst from the andesitic inclusion. Microdrill sam-ples were analyzed by MC-ICPMS following standardcolumn purification (Ramos, 1992).
RESULTSCrystal size distribution dataVesicle-free CSDs using the 3/2 power correction fromeach of the light dacite, dark andesite, black dacite,
JOURNAL OF PETROLOGY VOLUME 00 NUMBER 0 MONTH 2008
6
by guest on Decem
ber 17, 2015http://petrology.oxfordjournals.org/
Dow
nloaded from

and andesitic inclusion are shown in Fig. 3 and selectedCSD data are shown in Table 1. To determine best-fit seg-mentation for each CSD, linear regressions were per-formed on different segments within each CSD. For eachrock type, the best-fit results (e.g. R2
�0�93 for the major-ity of the data,Table 1) yield three plagioclase size popula-tions that are defined by distinct slopes. These threepopulations, which are based on crystal length, are: (1) phe-nocrysts (40�5mm); (2) microphenocrysts (0�1^0�5mm);(3) microlites (50�1mm). It is notable that the designationsassigned by Clynne (1999) for phenocrysts and microphe-nocrysts are similar to those defined here. For the four rocktypes, the absolute values of CSD slopes are greater withdecreasing crystal size: 0�9^2�2 for phenocrysts; 12�7^14�9for microphenocrysts; 26�7^33�5 for microlites (with theexception of inclusion microlites, which have a slope abso-lute value of 2�6). R2 values for all of these are �0�94, withtwo exceptions (Table 1).Because there is some uncertainty about the best method
to use in employing a volume correction (as discussedabove), we also present CSD data using CSDCorrections
analyses. Size designations using CSDCorrections basedon best-fit regression of the CSD segments deviatefrom the 3/2 method and are as follows: (1) pheno-crysts (41�2mm); (2) microphenocrysts (0�116^1�2mm);(3) microlites (50�116mm). Absolute values of slopes are:0�6^1�1 for phenocrysts; 8�2^9�4 for microphenocrysts;23�2^25�4 for microlites (with the exception of inclusionmicrolites, which have a slope absolute value of 11�6). R2
values for these four are �0�89 (Table 1). Although, asnoted above, CSDCorrections results change the size rangesfor the crystal populations, each of the four samples canstill be divided into three size distinctions with strong R2
values, similar to those obtained from the 3/2 volume cor-rection. The longer lengths from CSDCorrections are notunexpected, as the 3/2 volume correction does not affectthe reported length, as it does in CSDCorrections. For thisstudy, the 3/2 results are discussed to preserve correlationbetween the compositional data and crystal lengths thatwere directly measured from images.
Nomarski textural analysis of Lassen1915 plagioclaseMicrophenocryst textures are typically dominated by well-defined oscillatory zoning (e.g. Anderson, 1983) parallel tocrystal edges (Fig. 4a). In some crystals this zoning is trun-cated by a discontinuity (Fig. 4a^c) that may indicate dis-solution of part of the crystal (e.g. Pearce & Kolisnik,1990). Microlite textures are also dominated by well-defined oscillatory zoning, and in rare cases, dissolutionsurfaces are evident, but these are less abundant than inthe microphenocrysts.A spectrum of textures exists among Lassen pheno-
crysts, most of which have been described by Clynne(1999). Unreacted phenocrysts tend to be smooth-textured
with subdued oscillatory zoning (Fig. 4d). In some cases,more pronounced oscillatory zoning is visible, commonlyparallel to crystal edges; truncations of boundaries aremostly absent. Rarely, apparent dissolution surfaces arepresent, but they tend to have subtle expressions (Fig. 4d).The unreacted portions of reacted crystals have texturessimilar to unreacted crystals. Reacted portions, which canbe concentrated near rims or in cores, or dominate most ofthe crystals, are cloudy or mottled (Fig. 4e). In most cases,reaction zones are bounded by rounded boundaries.Cloudy regions, which consist of interconnected channelsof glass and crystal, are similar to those described byTsuchiyama & Takahashi (1983). Many reacted crystalshave thin (50^100 mm) rims that are characterized bywell-defined textural zones that are parallel to crystaledges. A final textural type lacks cloudy zones but showstextural complexity in the form of prominent textural dis-continuities (Fig. 4f). In these, faint oscillatory zoning isalso present. An additional example of this textural type
−4
0
4
8
12
−4
0
4
8
12
−4
0
4
8
12
−4
0
4
8
12
0 0.5 1 1.5 2 2.5
Ln p
opul
atio
n de
nsity
(no
./mm
4 )
Length (mm)
Light dacite
Andesitic inclusion
Black dacite
Dark andesite
ml
mph
ml
ml
ml
mph
mph
mph
ph
ph
ph
ph
Fig. 3. Plagioclase CSD plots for the four compositions erupted in the1915 Lassen Peak eruption. Each CSD plot is characterized by threeline segments representing three distinct populations of plagioclase:phenocrysts (40�5mm), microphenocrysts (0�1^0�5mm), and micro-lites (50�1mm). Lines represent best-fit linear regressions that defineeach population. (See Table 1 for selected CSD data.) ml, microlites;mph, microphenocrysts; ph, phenocrysts.
SALISBURY et al. TIMESCALES OF MAGMA MIXING
7
by guest on Decem
ber 17, 2015http://petrology.oxfordjournals.org/
Dow
nloaded from

is found in a phenocryst from an inclusion that has a mea-sured long dimension of 0�58mm, which is close to thelower size limit for phenocrysts (Fig. 4g).
Plagioclase and glass major elementanalysesTable 2 presents selected major element data for plagio-clase from the 1915 eruption; the full dataset is available inElectronic Appendices 1 and 2 on the Journal of Petrologywebsite at http://www.petrology.oxfordjournals.org.Figure 5a summarizes the relationship between An contentof phenocrysts, microphenocrysts and microlite cores andcrystal sizes measured directly by NIH Image. There is aclear correlation between crystal size (length) and Ancore content.With the exception of rare xenocrystic plagio-clase and two andesitic inclusion phenocrysts, the pheno-cryst core analyses range from An29 to An42, and theaverages �1s for light dacite, black dacite, and dark andes-ite are 33�9�6�3, 36�0� 4�8, 36�1�5�6, respectively(Table 3). This An range is consistent with the more exten-sive database reported for these units by Clynne (1999).The two analyzed inclusion phenocrysts that are transi-tional in size (520 and 580 mm) between microphenocrysts
and phenocrysts have average (�1s) An of 62�4 (�9�8).These two crystals probably belong to the microphenocrystpopulation. Microphenocrysts have core An valuesbetween An59 and An82, with averages (�1s) from66�1�4�1 to 69�5�4�5 (Table 3). Microlites are character-ized byAn40^67 and, with the exception of the ‘transitional’inclusion phenocrysts noted above, are the only crystalpopulation in which a correlation between rock type andanorthite content exists. Microlites from the dark andesiteare more anorthitic (An60^66) than those from the otherthree rock types (An40^59). This distinction is revealed byexamining averages (�1s) for light dacite, black daciteand inclusion: these values are 53�1 (�7�1), 56�7 (�7�7), and51�7 (�5�7), respectively, whereas the dark andesite valuesare 63�5 (� 2�0).Unlike plagioclase cores, the compositions of plagioclase
rims are not correlated with crystal length (Fig. 5b).Phenocryst (An32^72), microphenocryst (An40^67), andmicrolite (An41^64) rims show significant variations withineach size range, and, in contrast to core data, there isa great degree of overlap between composition and size.However, some correlations exist among composition,size, and rock type. Microphenocryst rims in the darkandesite are more anorthitic (An57^66) than those in theother three rock types (An40^58), which are generally simi-lar (see Table 3 for comparison of averages and standarddeviations). Similarly, microlite rims in the dark andesiteare also more anorthitic (An60^64) than the other micro-lites (An41^53). Among the three crystal size populations,most crystals show extensive zoning. Comparison of aver-age core and rim values for the four compositional pro-ducts show that all microlite populations are normallyzoned (Table 3). Zoning is mostly normal for the micro-phenocryst population, and the dark andesite again hasthe most An-rich rims. In all cases, average rim composi-tions of the two populations are within several An mol %for each product. For example, inclusion averages formicrolites and microphenocrysts are An 44�8 and 46�4,respectively. Overgrowths on reacted phenocryst rims arereversely zoned, whereas unreacted rims show minornormal zoning.Glass major element microprobe analyses normalized on
an anhydrous basis for the four compositional types aresummarized in Table 4, including average analyses withstandard deviations. In general, matrix glass from thelight dacite, black dacite, and the andesitic inclusion aresimilar in composition. They have �71^75 average wt %SiO2 and 3�2^4�2 average wt % K2O. Consistent with thehigherAn contents of the dark andesite microlite cores andrims, the dark andesite is characterized by distinctly moremafic (�65wt % average SiO2 and 2�4wt % averageK2O) glass. Some heterogeneity in the matrix glass com-position is evident as illustrated by the higher standarddeviations for SiO2, particularly in the black dacite and
Table 1: Crystal size distribution results
Population No. of
crystals
3/2 power correction� CSDCorrections�
Intercept Slope R2 Intercept Slope R2
Phenocrysts
LD 20 1�5 –1�4 0�96 1�8 –0�9 0�93
BD (total) 69 2�9 –2�0 0�95 0�5 –1�1 0�98
BD (unreacted) 36y 2�3 –2�1 0�95 — — —
INC 18 0�3 –0�9 0�97 3�4 –0�6 0�90
DA 34 2�0 –2�2 0�62 –0�4 –1�5 0�95
Microphenocrysts
LD 139 8�7 –14�9 0�98 7�8 –9�4 0�98
BD 133 8�8 –14�1 0�98 7�5 –8�4 0�90
INC 621 10�5 –12�7 0�94 9�6 –8�2 0�99
DA 147 9�1 –14�2 0�95 7�6 –8�2 0�96
Microlites
LD 1666 11�0 –32�3 0�99 11�8 –25�4 0�98
BD 992 10�9 –33�5 0�94 11�4 –25�0 0�97
INC 1100 9�3 –2�6 0�33 10�3 –11�6 0�89
DA 1678 11�1 –26�7 0�99 11�8 –23�2 0�99
LD, light dacite; BD, black dacite; INC, andesitic inclusion;DA, dark andesite.�Details of volume correction provided in text.yA separate calculation was performed for only unreactedphenocrysts to test the viability of calculating CSDs fromreacted phenocrysts (andesitic inclusion) and reacted þunreacted phenocrysts (light and black dacite, and darkandesite).
JOURNAL OF PETROLOGY VOLUME 00 NUMBER 0 MONTH 2008
8
by guest on Decem
ber 17, 2015http://petrology.oxfordjournals.org/
Dow
nloaded from

c
r
20
30
40
50
60
70
80
0 50 100 150 200
c
r
c
r
30
40
50
60
70
80
90
0 50 100 150Micrometers
c
r
c
r
c
r20
30
40
50
60
70
80
0 100 200 300 400
Micrometers
c r
Micrometers
mo
l. %
An
mo
l. %
An
mo
l. %
An
20
30
40
50
60
70
80
050100150
Micrometers
c
r
mo
l. % A
n
LD22
BD30
DA43
LD8
(a)
(b)
(c)
(d)
Fig. 4. Nomarski differential interference contrast images paired with electron microprobe data (An mol% vs core-to-rim location of microp-robe traverse) for selected microphenocrysts (a^c) and phenocrysts (d^g). Arrows show the location of prominent textural discontinuities. (e)and (f) show locations of troughs generated by laser in situ analyses for Sr isotopes. Trough number corresponds to analysis number inTable 7. c,approximate core of crystal; r, rim of crystal.
SALISBURY et al. TIMESCALES OF MAGMA MIXING
9
by guest on Decem
ber 17, 2015http://petrology.oxfordjournals.org/
Dow
nloaded from

dark andesite. This heterogeneity may reflect analysis ofsmall crystals not resolvable during electron microprobeanalysis or local effects of microlite crystallization.
Plagioclase major element traversescombined with NDIC textural dataElectron microprobe traverses of selected plagioclasemicrophenocrysts (n¼ 9) and phenocrysts (n¼ 4) that dis-play the range of textures described above, and as revealedby NDIC imaging, were conducted to provide composi-tional context for textural variations. Table 5 provides asummary of characteristics for all traverses, and selectedresults are summarized in Fig. 4. A typical traverseinvolved an analysis every 5^10 mm from near the core tothe rim. In one case (DA1), a rim-to-rim traverse of a phe-nocryst was completed. A complete set of NDIC images
has been given by Salisbury (2003) and microprobe tra-verse data are available in Electronic Appendix 3.Microphenocryst traverses are dominated by gradual
(54mol % An per 10 mm) major element compositionalchanges, and Table 5 shows that all analyzed micropheno-crysts are broadly normally zoned. For example, in BD30(Fig. 4b), anorthite content varies from �An70 to An53 overa distance of �150 mm from core to rim; the average Andecrease for each step (�5 mm) is 0�6. In DA12, Andecreases from 68 to 59, with an average 0�3 decrease perstep (�8 mm). Three of the nine microphenocrysts tra-versed (i.e. LD4, LD22, DA43) have rims characterizedby slightly larger An variations, up to 12mol % over thelast few micrometers (see Table 5 for details). A number ofmicrophenocrysts show textural discontinuities (e.g. LD22,BD30, LD4) (Fig. 4a and b), but across these zones, An
20
30
40
50
60
70
80
0200400600Micrometers
Micrometers
Micrometers
r
cr
c
20
30
40
50
60
70
80
0 1000 2000
rr
r
r
cr
20
30
40
50
60
70
80
0 100 200
c
r
mo
l. %
An
mo
l. % A
n
mo
l. %
An
DA3
c
c
(e)
(f)
(g)
DA1
INC9
Fig. 4. Continued
JOURNAL OF PETROLOGY VOLUME 00 NUMBER 0 MONTH 2008
10
by guest on Decem
ber 17, 2015http://petrology.oxfordjournals.org/
Dow
nloaded from
contents change only slightly (up to 4mol %) over dis-tances of �5^10 mm. Major intracrystal An variations arerare. DA43 in the dark andesite is the only traversedmicrophenocryst that has a major decrease in An content(14mol %) in the interior of the crystal (between 30 and41 mm from core); interestingly, the textural discontinuityassociated with this change is not necessarily the most
prominent one (Fig. 4c). Following this change, DA43records small changes in An (0^3mol % over 5 mm inter-vals) to near the rim, which varies from An66 to An58 a fewmicrometers from the rim.Almost all unreacted phenocrysts analyzed with the
Nomarski technique revealed very little textural variation,so those showing the most prominent dissolution surfaces
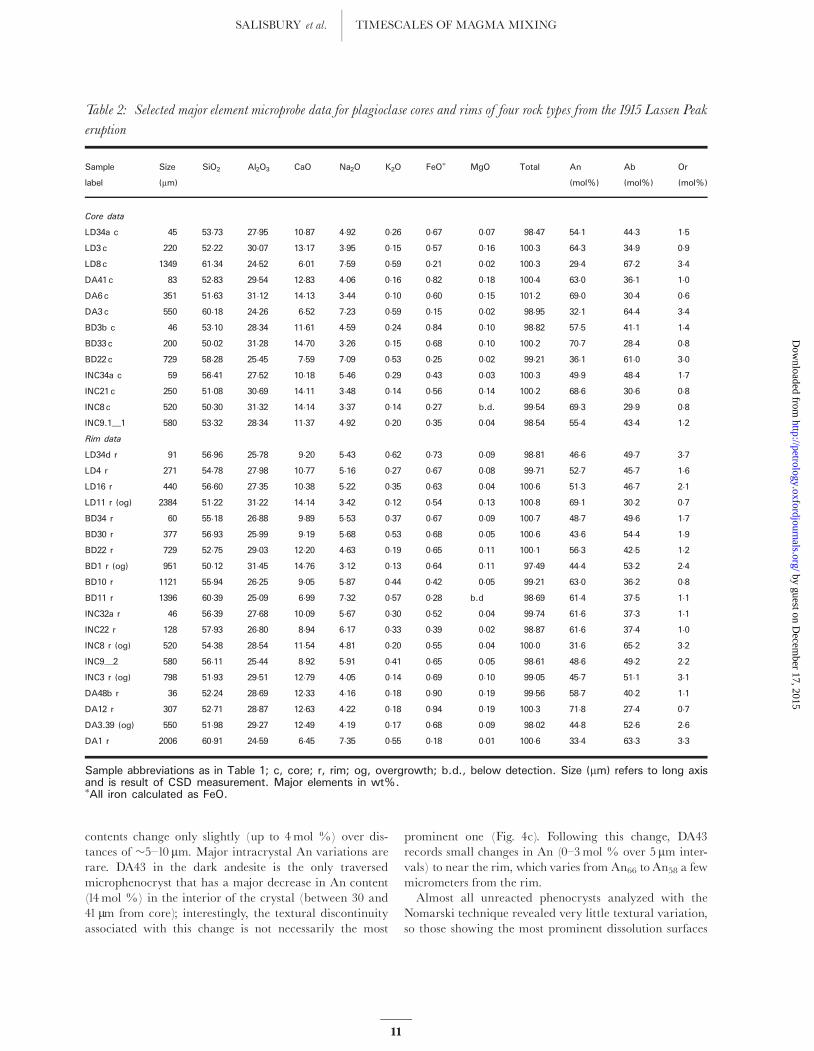
Table 2: Selected major element microprobe data for plagioclase cores and rims of four rock types from the 1915 Lassen Peak
eruption
Sample Size SiO2 Al2O3 CaO Na2O K2O FeO� MgO Total An Ab Or
label (mm) (mol%) (mol%) (mol%)
Core data
LD34a c 45 53�73 27�95 10�87 4�92 0�26 0�67 0�07 98�47 54�1 44�3 1�5
LD3 c 220 52�22 30�07 13�17 3�95 0�15 0�57 0�16 100�3 64�3 34�9 0�9
LD8 c 1349 61�34 24�52 6�01 7�59 0�59 0�21 0�02 100�3 29�4 67�2 3�4
DA41 c 83 52�83 29�54 12�83 4�06 0�16 0�82 0�18 100�4 63�0 36�1 1�0
DA6 c 351 51�63 31�12 14�13 3�44 0�10 0�60 0�15 101�2 69�0 30�4 0�6
DA3 c 550 60�18 24�26 6�52 7�23 0�59 0�15 0�02 98�95 32�1 64�4 3�4
BD3b c 46 53�10 28�34 11�61 4�59 0�24 0�84 0�10 98�82 57�5 41�1 1�4
BD33 c 200 50�02 31�28 14�70 3�26 0�15 0�68 0�10 100�2 70�7 28�4 0�8
BD22 c 729 58�28 25�45 7�59 7�09 0�53 0�25 0�02 99�21 36�1 61�0 3�0
INC34a c 59 56�41 27�52 10�18 5�46 0�29 0�43 0�03 100�3 49�9 48�4 1�7
INC21 c 250 51�08 30�69 14�11 3�48 0�14 0�56 0�14 100�2 68�6 30�6 0�8
INC8 c 520 50�30 31�32 14�14 3�37 0�14 0�27 b.d. 99�54 69�3 29�9 0�8
INC9.1_1 580 53�32 28�34 11�37 4�92 0�20 0�35 0�04 98�54 55�4 43�4 1�2
Rim data
LD34d r 91 56�96 25�78 9�20 5�43 0�62 0�73 0�09 98�81 46�6 49�7 3�7
LD4 r 271 54�78 27�98 10�77 5�16 0�27 0�67 0�08 99�71 52�7 45�7 1�6
LD16 r 440 56�60 27�35 10�38 5�22 0�35 0�63 0�04 100�6 51�3 46�7 2�1
LD11 r (og) 2384 51�22 31�22 14�14 3�42 0�12 0�54 0�13 100�8 69�1 30�2 0�7
BD34 r 60 55�18 26�88 9�89 5�53 0�37 0�67 0�09 100�7 48�7 49�6 1�7
BD30 r 377 56�93 25�99 9�19 5�68 0�53 0�68 0�05 100�6 43�6 54�4 1�9
BD22 r 729 52�75 29�03 12�20 4�63 0�19 0�65 0�11 100�1 56�3 42�5 1�2
BD1 r (og) 951 50�12 31�45 14�76 3�12 0�13 0�64 0�11 97�49 44�4 53�2 2�4
BD10 r 1121 55�94 26�25 9�05 5�87 0�44 0�42 0�05 99�21 63�0 36�2 0�8
BD11 r 1396 60�39 25�09 6�99 7�32 0�57 0�28 b.d 98�69 61�4 37�5 1�1
INC32a r 46 56�39 27�68 10�09 5�67 0�30 0�52 0�04 99�74 61�6 37�3 1�1
INC22 r 128 57�93 26�80 8�94 6�17 0�33 0�39 0�02 98�87 61�6 37�4 1�0
INC8 r (og) 520 54�38 28�54 11�54 4�81 0�20 0�55 0�04 100�0 31�6 65�2 3�2
INC9_2 580 56�11 25�44 8�92 5�91 0�41 0�65 0�05 98�61 48�6 49�2 2�2
INC3 r (og) 798 51�93 29�51 12�79 4�05 0�14 0�69 0�10 99�05 45�7 51�1 3�1
DA48b r 36 52�24 28�69 12�33 4�16 0�18 0�90 0�19 99�56 58�7 40�2 1�1
DA12 r 307 52�71 28�87 12�63 4�22 0�18 0�94 0�19 100�3 71�8 27�4 0�7
DA3.39 (og) 550 51�98 29�27 12�49 4�19 0�17 0�68 0�09 98�02 44�8 52�6 2�6
DA1 r 2006 60�91 24�59 6�45 7�35 0�55 0�18 0�01 100�6 33�4 63�3 3�3
Sample abbreviations as in Table 1; c, core; r, rim; og, overgrowth; b.d., below detection. Size (mm) refers to long axisand is result of CSD measurement. Major elements in wt%.�All iron calculated as FeO.
SALISBURY et al. TIMESCALES OF MAGMA MIXING
11
by guest on Decem
ber 17, 2015http://petrology.oxfordjournals.org/
Dow
nloaded from

were chosen for detailed microprobe traverses. In general,as for microphenocrysts, changes in An content are not sig-nificant over 5^10 mm intervals. The An contents of thecores are nearly constant as shown by the traverse of LD8(Fig. 4d). An increase of only 8mol % An (from An30 toAn38) corresponds to a subtle textural discontinuitylocated �250 mm from the first core analysis.Phenocrysts with mottled zones characteristically show
large variations in An (e.g. crystal DA3, Fig. 4e).The inter-ior portion of this crystal shows little variation, remainingnear An30 until the mottled zone at the exterior, wherecomposition fluctuates from �An35 to An60 over the last�70 mm.Crystal DA1 in the dark andesite does not show mottled
reaction textures, but does show several prominent texturaldiscontinuities. This crystal was analyzed for major ele-ments from rim to rim across the long axis of the crystal(Fig. 4f); from core to rim, An varies from An29 to An52.Most of the crystal is characterized by small (53mol %)changes, but the outer 100 mm contains large anorthite per-turbations. For example, over this distance, the An contentof the left rim of the crystal (as shown in Fig. 4f) varies
from 45 down to 31, up to 51 and down to 32. Similarchanges are observed on the right rim.These An variationsare associated with prominent textural discontinuities.Similarly, several other major textural zones are associatedwith relatively large changes in An over tens of micro-meters, but crystals like DA1 are rare, and the maximumAn recorded in this crystal is 52. INC9 also displays atleast one prominent textural discontinuity (between 159and 182 mm from the core) in the absence of a mottledzone. This discontinuity is correlated with a large(20mol %) change in An (Fig. 4g). Following a rimwardincrease from �An50 to An70, An decreases to An44, includ-ing an abrupt change from An58 to An44 over thelast 13 mm.
Plagioclase trace element dataLaser ablation ICP-MS data for Sc, Rb, Sr, Y, Ba, La, Ce,Nd, Sm, Eu, and Pb are reported inTable 6. Analysis loca-tion (i.e. location of the laser pit) is tied to the electronmicroprobe traverse shown in Fig. 4. Analysis coordinates
Table 3: Average An data for cores and rims of plagioclase
crystal size populations
Microlite Microphenocryst Phenocryst Microlite Microphenocryst Phenocryst
core core core rim rim rim
All types
Average 57�3 68�0 35�5� 53�6 51�7 51�8
SD 29�0 4�1 4�6 7�9 7�2 14�5
n 27 47 8 14 38 11
Light dacite
Average 53�1 66�1 33�9 one
crystal
50�6 52�4
SD 7�1 4�1 6�3 — 5�6 23�7
n 9 11 2 1 13 2
Black dacite
Average 56�7 68�4 36�0 48�7 49�8 52�2
SD 7�7 4�2 4�8 3�2 5�4 16�7
n 4 11 4 5 7 4
Andesitic inclusion
Average 51�7 67�6 62�4� 44�8 46�4 54�6
SD 5�7 2�5 9�8 5�6 4�6 9�4
n 4 10 2 2 10 3
Dark andesite
Average 63�5 69�5 36�1 61�8 61�8 46�6
SD 2�0 4�5 5�6 1�4 2�9 21�2
n 10 15 2 6 8 2
Sample abbreviations as in Table 1; n, number of crystalsin population. SD, standard deviation.�Two inclusion phenocrysts excluded from calculation ofaverage An core value for all phenocrysts.
0
10
20
30
40
50
60
70
80
90
0 0.5 1 1.5 2 2.5 3
Crystal length (mm)
ml
mph
phenocrysts
0
10
20
30
40
50
60
70
80
90
0 0.5 1 1.5 2 2.5 3
Crystal length (mm)
Mo
l. %
An
Mo
l. %
An
mlmph
phenocrysts
(a)
(b)
Light dacite
Black dacite
Andesitic inclusionDark andesite
Light dacite
Black dacite
Andesitic inclusionDark andesite
Fig. 5. (a) Core An content (mol %) vs crystal length measured inNIH Image from X-ray images. Vertical lines represent divisionsbetween three crystal populations. (b) Rim An content (mol %) vscrystal length measured in NIH Image from X-ray images.
JOURNAL OF PETROLOGY VOLUME 00 NUMBER 0 MONTH 2008
12
by guest on Decem
ber 17, 2015http://petrology.oxfordjournals.org/
Dow
nloaded from

are measured in micrometers and start at or near thecore (i.e. a coordinate of 0 represents the start of the elec-tron microprobe traverse). Coordinate mid-pointrepresents the average position of the laser pit. Figures 6and 7 showAn or size vs selected trace element concentra-tion. Analyzed crystals include two microphenocrysts(LD22, INC12), and four phenocrysts (DA3, DA1, LD8,INC9), although of these four, two have crystal sizesnear the microphenocryst^phenocryst boundary (DA3and INC9).
An contents of these crystals range from �70 to 28. Thetwo microphenocrysts have relatively uniform An contentsbetween 65 and 70 whereas three of the four phenocrystshave An between �28 and 41. One phenocryst (INC9,�0�58mm) has An between 51 and 70. Comparison of Ancontents vs trace element concentration reveals three broadtypes of trends, regardless of analysis location (Fig. 6 andTable 6). An vs Pb, Ba, La, Ce, Rb and Sc form negativelycorrelated trends. The An vs Pb, Ba, La and Ce trendsshow a relatively narrow range of concentrations for the
Table 4: Glass major element microprobe data normalized to 100%
Sample SiO2 Al2O3 CaO MgO FeO� Na2O K2O Total1
Light dacite
LD4.2_9 73�51 14�84 2�45 0�28 1�72 3�68 3�52 96�58
LD4.2_10 75�80 13�22 1�45 0�34 1�77 3�46 3�97 96�76
LD12�1_11 75�33 13�75 1�69 0�36 1�97 2�97 3�92 96�23
LD12.1_12 75�43 13�20 1�53 0�36 2�17 3�33 3�98 95�22
LD8.1_50 74�84 13�37 1�64 0�35 2�11 3�71 3�99 96�85
Average 74�98 13�68 1�75 0�34 1�95 3�43 3�87 96�30
SD 0�89 0�69 0�40 0�03 0�20 0�30 0�20 0�66
Black dacite
BD3 glass2 76�95 12�44 0�87 0�22 1�80 3�14 4�58 98�88
BD1 glass 77�49 11�50 0�72 0�53 2�21 2�92 4�63 98�58
BD3a.2_9 65�58 20�30 5�42 0�07 1�16 5�54 1�93 98�09
BD27_13 63�41 22�04 6�76 0�25 1�02 4�99 1�53 98�34
Average 70�86 16�57 3�44 0�27 1�55 4�15 3�16 98�46
SD 7�40 5�37 3�11 0�19 0�56 1�31 1�67 0�33
Andesitic inclusion
INC glass3 74�99 14�39 1�14 0�30 2�35 2�62 4�21 97�02
INC glass2 75�15 14�30 1�08 0�27 1�92 3�01 4�27 98�40
INC glass1 73�85 14�37 1�36 0�40 2�65 3�03 4�33 99�02
INC glass1 71�86 14�39 1�44 0�57 3�00 4�46 4�27 96�99
INC12.2_19 76�01 13�31 1�08 0�22 2�00 3�41 3�97 96�47
INC12.2_20 75�74 13�57 1�01 0�24 2�02 3�21 4�21 96�56
Average 74�60 14�05 1�19 0�33 2�32 3�29 4�21 97�41
SD 1�54 0�49 0�17 0�13 0�43 0�63 0�13 1�05
Dark andesite
DA glass1 70�10 14�54 2�98 0�70 4�51 3�85 3�32 98�94
DA glass2 66�87 12�78 4�27 3�29 6�50 3�26 3�03 97�94
DA glass3 62�21 10�45 5�26 6�88 10�38 2�79 2�02 99�11
DA12.2_19 62�02 18�41 6�73 2�17 4�73 4�06 1�87 97�21
DA12.2_20 65�44 13�96 4�17 2�58 7�46 3�70 2�69 95�95
DA21.2_29 63�97 15�42 5�03 3�25 6�32 3�90 2�11 96�97
DA6.1_22 63�20 17�73 6�31 2�04 4�67 3�92 2�13 96�66
Average 64�61 14�68 5�00 3�23 6�53 3�59 2�37 97�54
SD 2�76 2�57 1�20 1�91 1�99 0�45 0�57 1�18
Abbreviations as in Tables 1 and 2.�All iron calculated as FeO.1Pre-normalized totals.
SALISBURY et al. TIMESCALES OF MAGMA MIXING
13
by guest on Decem
ber 17, 2015http://petrology.oxfordjournals.org/
Dow
nloaded from

microphenocrysts and the rim of INC9, transitional valuesfor the intermediate and core areas of INC9, and highervalues for the remaining phenocrysts (Fig. 6a). Rb and Scform broad negative trends that are more diffuse. Y, Nd,Sm, and Eu exhibit a second type of trend. At higher An,these elements are negatively correlated, but with only afew exceptions, at lower An, element abundances are simi-lar to or lower than values for the An50^60 range (INC9)
(Fig. 6b). A third type of trend characterizes Sr. HigherAn crystals have a range of Sr concentrations from �1200to 700 ppm. INC9, which has intermediate An values,ranges in Sr from �1380 to 1050 ppm, and the remainingphenocrysts with An 541�5 are characterized by Sr con-centrations between 1070 and 700 ppm. There are no clearcorrelations between crystal size and Sc, Rb, Sr (Fig. 7c),and Y, again regardless of analysis location within
Table 5: Summary characteristics of microprobe traverses and textural data for plagioclase microphenocrysts and phenocrysts
Sample Crystal Core An Rim An Average step Average Comments
size (mm) (mol%) (mol%) size (mm) �An�
DA43 246 81 60 5�1 –0�8 At 30–41 mm from core, large change in An from 86 to 72;
at 104–122 mm from core (near rim) An change from 66 to
58; textural complexity observed, but most extreme feature
not correlated with large An changes
LD4 271 68 53 6�9 –1 Last 10 mm, change from An64 to An58; major textural
discontinuities observed but not correlated with large An
change
DA12 307 68 59 7�8 –0�3 Crystal dominated by edge-parallel textural zones
INC12 318 68 56 5�8 –0�5 Some subtle textural discontinuity observed, but no An
changes �3mol% An per step noted
DA21 328 69 62 4�9 –0�2 Some textural discontinuity observed, but no An changes
�3mol% An per step
LD22 336 64 52 6�4 –0�4 Last 12 mm, change from An64 to An52; textural
discontinuity observed, but no An changes �3mol% An
per step
DA6 351 68 58 4�9 –0�5 Some subtle textural discontinuity observed, but no An
changes �3mol% An per step
BD13 361 72 63 9�1 –0�6 Some subtle textural complexity, but no An changes �3
mol% An per step
BD30 394 69 53 5�2 –0�6 Subtle textural discontinuity observed, but no An changes
�3mol% An per step
DA3 550 30 62 13�7 0�8 Crystal zoned from An30 to An46 at 0–480 mm from core;
near rim, zoned from An39 to An62 (at 494–521 mm from
core) in mottled/dusty region
INC9 580 55 44 9�8 –0�4 An change from 50 to 70 at 159–183 mm from core,
associated with prominent textural discontinuity; An
change from 58 to 44 near rim (232–245 mm from core)
LD8 1349 32 32 8�1 0�0 All steps �4mol% (normally zoned) except at 253–261 mm
from core, An change from 30 to 38, where a subtle
textural discontinuity is observed
DA1 2006 45 42 19�6y –0�03 Most of crystal dominated by small An changes (�3mol
%); several regions marked by abrupt changes in An over
small distances; some An changes associated with textural
discontinuities
Abbreviations as in Table 1.�Represents average change in An content from step x to step xþ 1, starting from core. Unless otherwise noted incomments, �An for each step is �4mol%.yAverage includes large steps near core of crystal. Otherwise, average step size is 15�9mm.
JOURNAL OF PETROLOGY VOLUME 00 NUMBER 0 MONTH 2008
14
by guest on Decem
ber 17, 2015http://petrology.oxfordjournals.org/
Dow
nloaded from

a crystal. Phenocryst and microphenocryst ranges overlap.In contrast, microphenocrysts have relatively low Ba, La,Ce, Nd, Sm, Eu, and Pb concentrations compared withmost phenocrysts (Fig. 7a and b). It should be noted thatfor INC9, which is transitional in size, concentrationsapproach or overlap those of phenocrysts. The exceptionis the high An rim value of INC9, which typically has ele-mental abundances similar to those of microphenocrysts.This observation reinforces the correlation observedbetween concentrations of these elements and An contents.Finally, because trace element analyses were
obtained by laser ablation, relationships between elementconcentrations and positions in crystals (i.e. core vs
intermediate vs rim) were evaluated. The position of eachanalysis within the crystal was estimated using the averageof the start and end points of each laser pit along the elec-tron microprobe traverse (Fig. 4 and Table 6). Overall,there are no simple correlations between positions andtrace element concentrations. However, several detailedobservations are relevant to the correlations noted above:(1) with the exception of Sr, trace element concentrationsof the near-rim spot of phenocryst INC9 are similar tothose of the microphenocrysts. Because this spot has�An70 (similar to An contents of the microphenocrysts),this again reinforces the correlation between element con-centration and An content. (2) Of all the crystals analyzed,
Table 6: Laser ablation ICP-MS trace element data for plagioclase
Sample Crystal An Analysis Analysis Coordinate CaO Sc§ Rb Sr Y Ba La Ce Nd Sm Eu Pb
no. length (mm) (mol %) location coordinates� mid-pointy (wt %)z
INC12-C1 318 68�2 core 0–27 13�5 13�89 1�41 0�34 1186 0�16 108 1�52 2�38 0�75 0�11 0�34 1�07
INC12-C2 318 66�6 inter 41–82 61�5 14�07 1�49 0�30 1175 0�14 101 1�77 2�67 0�92 0�10 0�39 1�24
INC12-R1 318 65�2 rim 109–143 126 10�82 1�11 0�15 860 0�10 68 1�18 1�87 0�60 0�07 0�28 0�89
LD22-C-1 336 64�0 core 0–6 3 12�86 1�51 0�71 1032 0�22 83 1�54 2�50 0�83 0�10 0�29 1�19
LD22-R-1 336 64�2 mid 140–172 156 10�40 1�58 0�17 830 0�15 76 1�37 2�06 0�65 0�11 0�26 0�96
LD22-C-2 336 70�1 near rim 45–83 64 13�18 1�34 0�16 1039 0�12 81 1�23 1�95 0�59 0�08 0�27 0�88
DA3-C-1 550 30�0 core 0–14 7 6�13 2�29 1�23 816 0�28 668 11�1 12�5 2�10 0�29 1�04 10�93
DA3-R-1 550 30�9 rim 343–439 391 6�26 2�05 0�78 797 0�23 506 9�92 11�8 1�99 0�27 1�00 9�92
DA3-R-2 550 36�4 rim 439–494 466�5 6�26 2�00 0�69 781 0�18 503 10�2 11�9 2�01 0�20 0�98 9�22
DA3-C-2 550 27�8 inter 151–219 185 5�43 1�83 0�84 712 0�16 509 9�02 10�2 1�75 0�14 0�87 8�37
INC9-C1 580 55�0 core 0–16 8 11�37 1�47 0�49 1165 0�25 152 3�93 5�94 1�52 0�21 0�64 3�06
INC9-C2 580 54�0 inter 79–111 95 10�00 1�27 0�25 1044 0�24 144 4�71 7�15 2�06 0�24 0�68 3�30
INC9-C3 580 50�7 inter 127–159 143 13�88 1�93 0�34 1377 0�30 258 6�88 9�98 2�44 0�28 0�96 4�92
INC9-C4 580 69�4 near rim 182–209 195�5 8�92 0�94 0�12 701 0�10 56 0�87 1�36 0�46 0�09 0�22 0�62
LD8-C-1 1349 31�8 core 0–24 12 6�41 2�03 7�50 787 0�42 534 11�2 13�4 2�34 0�26 0�92 10�96
LD8-R-1 1349 32�3 rim 318–375 346�5 5�77 1�49 0�69 735 0�15 441 9�27 10�6 1�81 0�16 0�86 8�79
LD8-C-2 1349 31�3 inter 212–261 236�5 6�06 1�49 0�66 763 0�15 473 9�94 11�5 1�96 0�16 0�87 8�58
LD8-C-3 1349 30�6 inter 65–114 89�5 6�12 1�66 0�71 775 0�15 512 10�0 11�3 2�01 0�14 0�94 9�30
LD8-C-4 1349 29�4 inter 139–187 163 5�91 1�58 0�68 758 0�15 490 9�31 10�6 1�87 0�15 0�91 8�88
DA1-C-1 2006 41�3 core 874–904 889 9�20 2�29 1�08 1072 0�26 396 8�06 11�0 2�45 0�28 0�98 9�35
DA1-C-2 2006 37�1 inter 491–598 544�5 7�65 1�78 0�43 953 0�17 327 8�12 9�89 1�86 0�16 0�80 8�17
DA1-R-1 2006 32�1 near rim 184–291 237�5 8�61 2�50 0�91 1067 0�22 652 13�9 15�8 2�85 0�21 1�26 12�02
DA1-C-3 2006 37�6 inter 613–736 674�5 6�85 1�48 0�37 806 0�21 282 6�78 9�06 2�05 0�20 0�69 5�92
DA1-C-4 2006 34�9 inter 1381–1473 1427 7�07 1�71 0�48 895 0�17 333 8�23 10�3 1�94 0�17 0�78 7�47
DA1-C-5 2006 38�3 inter 1610–1717 1663�5 7�55 1�74 0�43 954 0�15 331 8�53 10�4 1�93 0�17 0�79 7�50
DA1-C-6 2006 35�0 core 1132–1236 1184 5�90 1�39 0�79 727 0�29 316 4�82 6�63 1�92 0�21 0�69 5�27
DA1-R-2 2006 34�0 near rim 1931–1992 1961�5 8�61 1�61 0�95 843 0�54 301 6�91 9�07 2�08 0�30 0�77 7�68
Abbreviations as in Table 1.�Beginning and ending coordinates of laser ablation spot (in mm). Coordinate measurements referenced to microprobetraverse.yAverage coordinate position is mid-point of laser ablation spot.zCaO (wt %) from electron microprobe analysis was used as an internal standard for data reduction.§Trace elements in ppm.
SALISBURY et al. TIMESCALES OF MAGMA MIXING
15
by guest on Decem
ber 17, 2015http://petrology.oxfordjournals.org/
Dow
nloaded from

0
100
200
300
400
500
600
700(a)
(b)
(c)
0 500 1000 1500 2000 2500
Crystal Size (micrometers)
0 500 1000 1500 2000 2500
Crystal Size (micrometers)
0 500 1000 1500 2000 2500
Crystal Size (micrometers)
0.0
0.5
1.0
1.5
2.0
2.5
3.0
700
800
900
1000
1100
1200
1300
1400
Ba
(ppm
)N
d (p
pm)
Sr
(ppm
)
Fig. 7. Trace element concentrations vs plagioclase crystal size.Gray-filled circles represent analyses of INC9. (See text fordiscussion.)
Ba
(ppm
)N
d (p
pm)
Sr
(ppm
)
0
100
200
300
400
500
600
700(a)
(b)
(c)
20 30 40 50 60 70 80
An
20 30 40 50 60 70 80
An
20 30 40 50 60 70 80
An
0.0
0.5
1.0
1.5
2.0
2.5
3.0
700
800
900
1000
1100
1200
1300
1400
Fig. 6. Trace element concentrations vs An content (mol %) ofplagioclase. Gray-filled circles represent analyses of INC9.(See text for discussion.)
JOURNAL OF PETROLOGY VOLUME 00 NUMBER 0 MONTH 2008
16
by guest on Decem
ber 17, 2015http://petrology.oxfordjournals.org/
Dow
nloaded from

LD8, which has small core-to-rim variations in An(Fig. 4d), shows smooth zoning from core to rim in Baand Sr; both decrease from core to rim. La, Ce, Nd, andPb also decrease from core to rim, but there is more varia-tion in the intermediate points. Sm,Y, and Eu do not showsimple trends. Of the phenocrysts analyzed for trace ele-ments, LD8 has the simplest texture, exhibiting only onesubtle textural discontinuity that is associated with asmall An increase.
Sr isotope dataIn situ laser ablation Sr isotope data for a small number ofphenocrysts from each of the four compositions are pres-ented in Table 7. In all cases, multiple analyses (i.e.troughs) were acquired for each crystal. Figures 4 (crystalsfor which there are microprobe and trace element data)and 8 (crystals for which there are no microprobe data)show NDIC images of each analyzed crystal, togetherwith approximate locations of each laser ablation trough.Figure 9 summarizes the relative locations of each troughvs Sr isotope ratio. 87Sr/86Sr ranges from �0�7040 to0�7045, with an average 2s uncertainty of �0�000053. Ofthe seven phenocrysts analyzed, five display intracrystalvariations outside analytical error (LD12, LD1, DA1, BD11,DA20), whereas multiple analyses of BD7 and DA3 showno resolvable intracrystal variations. Although 87Sr/86Srvaries among and within phenocrysts, systematic core-to-rim variations are not observed, despite textural differ-ences (reacted vs unreacted zones). Similarly, no discern-ible patterns are observed between Sr isotope signaturesand compositions. We recognize, however, that our inter-pretations are limited by the small dataset, the location ofthe ablation troughs, and the resolution of the laser.The small sizes and low Sr contents of some crystals pre-
cluded analysis by laser, so one crystal from the inclusion(INC43; measured NIH Image length 204 mm) wasdrilled. The core of a crystal in sample INC43 has87Sr/86Sr of �0�7041. This crystal has a texture typical ofmicrophenocrysts in all samples. 87Sr/86Sr values frommicrodrill analyses of groundmass from each of the fourrock types are remarkably homogeneous, with an averagevalue of 0�704261�55. Uncertainty of 87Sr/86Sr for the lightdacite sample is fairly large because the high vesicularity ofthe groundmass limited the mass of sample recoveredduring drilling.
ORIGIN OF CRYSTALPOPULAT IONSPlagioclase CSD data for the four compositional productsof the 1915 Lassen Peak eruption confirm the presence ofthree size populations of crystals: phenocrysts, microphe-nocrysts, and microlites. Our goal is to integrate theseresults with textural and in situ chemical data to further
elucidate the origins of these crystal populations andexpand on the conclusions made by Clynne (1999).
Unreacted plagioclase phenocrystsFigure 3 and Table 1 show that phenocrysts from all fourcompositional products of the 1915 eruption share similar
Table 7: 87Sr/86Sr (�2s) laser or microdrill data
Sample 87Sr/86Sr
LD12-1 0�704316� 42
LD12-2 0�704241� 42
LD12-3 0�704293� 80
LD12-7 0�704441� 47
LD12-4 0�704317� 50
LD12-8 0�704533� 47
LD12-5 0�704498� 78
LD1-1 0�704505� 56
LD1-2 0�704318� 44
LD1-3 0�704337� 30
LD1-4 0�704485� 52
LD1-5 0�704369� 50
BD7-1 0�704364� 30
BD7-2 0�704370� 45
BD7-3 0�704382� 59
BD7-4 0�704403� 53
BD11-2 0�703976� 37
BD11-1 0�704284� 41
DA20-1 0�704201� 40
DA20-2 0�704165� 34
DA20-3 0�704238� 68
DA20-4 0�704109� 36
DA20-5 0�704238� 46
DA20-6 0�704202� 46
DA3-1 0�704307� 112
DA3-2 0�704304� 180
DA1-5 0�704199� 40
DA1-6 0�704105� 49
DA1-4 0�704125� 58
DA1-3 0�704081� 35
DA1-2 0�704188� 35
DA1-1 0�704429� 34
INC43� 0�704127� 19
Matrix�
LD 0�704266� 80
DA 0�704275� 21
BD 0�704247� 26
INC 0�704254� 18
Abbreviations as in Table 1.�Samples collected by microdrill. Location of analyses isshown in Figs 2 and 6.
SALISBURY et al. TIMESCALES OF MAGMA MIXING
17
by guest on Decem
ber 17, 2015http://petrology.oxfordjournals.org/
Dow
nloaded from

CSD characteristics. Best-fit linear regression analysesillustrate that, in all four cases, the breaks in slope on theCSD plots occur at similar crystal lengths. In the case ofthe 3/2 volume correction, phenocrysts are defined as crys-tals 40�5mm. This common characteristic suggests that,despite the distinct histories proposed for the four pro-ducts, all phenocrysts share a common cooling history.Phenocryst CSDs have gentle slopes and low intercepts,suggesting crystallization in an environment characterizedby low nucleation rates and small degrees of undercooling(e.g. Marsh, 1988), which implies modest cooling rates(Cashman, 1993). We interpret NDIC images of unreactedphenocrysts, characterized by either smooth textures orpronounced growth zones that are typically parallel tocrystal edges, as support for the hypothesis that plagioclase
growth was a near-equilibrium process. In contrastto other studies (e.g. Tepley et al., 1999), the generallack of dissolution or other disequilibrium texturesrecorded in unreacted phenocrysts in this study suggeststhat prior to the pre-1915 mixing event, mafic rechargewas not common during the time period of phenocrystgrowth.Major element characteristics of phenocryst cores indi-
cate that this phenocryst population is also chemically dis-tinct. Phenocryst cores have An contents that are distinctlylower than those of microphenocrysts and microlites(Table 1 and Fig. 4) with the notable exception of twocores from the inclusion that showAn contents of �55 and69mol % (discussion of these crystals is deferred to a latersection). Core-to-rim traverses confirm that compositional
LD12
LD1
BD11
BD7
DA20
(a)
(b)
(d)
(e)
(c)
Fig. 8. Nomarski differential interference contrast images of plagioclase analyzed for Sr isotope ratios. Locations of analysis troughs are shownin each image. Number of trough corresponds to analysis number inTable 7.
JOURNAL OF PETROLOGY VOLUME 00 NUMBER 0 MONTH 2008
18
by guest on Decem
ber 17, 2015http://petrology.oxfordjournals.org/
Dow
nloaded from

zoning within crystals is subtle, with average changes inAn over 10^20 mm increments being51mol % (Table 5).Dramatic compositional variations are exhibited in somecrystals but are not dominant. In addition, it is importantto note that a strict correlation between large composi-tional changes (e.g. �6mol %) and textural discontinuitiesdoes not exist. This implies that such compositionalchanges can occur in the absence of an obvious textural
response. The inverse is also the case: textural discontinu-ities not associated with large compositional changes maybe the result of changes in parameters such as temperature,pressure, or water content rather than changes in bulkcomposition resulting from processes such as magmamixing. Combined textural^chemical studies are, thus,essential for identifying the nature and number of eventsthat affect magma evolution.
0.7039
0.7041
0.7043
0.7045
0.7047
0.7039
0.7041
0.7043
0.7045
0.7047
0.7039
0.7041
0.7043
0.7045
0.7047
0.7039
0.7041
0.7043
0.7045
0.7047
87S
r/86
Sr
87S
r/86
Sr
87S
r/86
Sr
87S
r/86
Sr
LD12
DA1
DA20
BD 11
0.7039
0.7041
0.7043
0.7045
0.7047
0.7039
0.7041
0.7043
0.7045
0.7047
0.7039
0.7041
0.7043
0.7045
0.7047
0.7039
0.7041
0.7043
0.7045
0.7047
LD1
DA3
BD7
INC43
87S
r/86
Sr
87S
r/86
Sr
87S
r/86
Sr
87S
r/86
Sr
12
4
7
3
85 1
2
4
3 5
1 2 43
1
2
4
3 512
6
12
43
5
1
26
rim core rim
rim core rim
rim core rim
rim core rim rim core rim
core rim
Fig. 9. 87Sr/86Sr laser ablation and microdrill data vs relative position in plagioclase crystals. Vertical line associated with each symbolrepresents analytical uncertainty. Numbers associated with each point correspond to trough numbers from Figs 4 and 8 andTable 7.
SALISBURY et al. TIMESCALES OF MAGMA MIXING
19
by guest on Decem
ber 17, 2015http://petrology.oxfordjournals.org/
Dow
nloaded from

Relatively systematic negative correlations betweentrace elements Pb, Ba, La, Ce, Rb, and Sc and An contentssuggest that these elements behaved incompatibly duringdifferentiation. Phenocrysts, which have the lowest Ancontents of all crystals in the 1915 eruptive products,have the highest trace element concentrations, consistentwith such behavior. In contrast, clustering of Y, Nd, Sm,and Eu concentrations over the range of the Ancontents suggests that these elements were more compati-ble during differentiation. Sr concentrations of plagio-clase phenocrysts are equal to or lower than those ofmicrophenocrysts, suggesting that Sr behaved broadlycompatibly, consistent with plagioclase as a fraction-ating phase. Intracrystal variations of Sr in phenocrystsDA3 and LD8 are small (56%), consistent with crystalsretaining relatively featureless textures (Fig. 4). (Notethat for crystal DA3, no trace element analysis wasconducted in the mottled zone.) In contrast, Sr variationsdocumented in DA1, which has both major element andtextural evidence of non-equilibrium processing, arehigher (�13%). Sr isotope variations in phenocrysts aresubtle. The average 87Sr/86Sr ratio of all phenocrysts is0�70429� 0�00013. Intracrystal variations are minimal,although some texturally complex crystals such as BD11(which is characterized by a distinct mottled zone) andDA1 (which has several prominent textural discontinuitiesand variable major element composition) do show varia-tions in 87Sr/86Sr greater than analytical uncertainty.In general, the data are broadly consistent with pheno-cryst growth in a relatively isotopically homogeneousenvironment.Together these data indicate that plagioclase pheno-
crysts grew in a magma body of dacitic composition thatwas characterized by relatively small degrees of undercool-ing. Texturally simple crystals grew as minor differentia-tion took place, as demonstrated by small variations inAn content and trace element abundances.With the excep-tion of the proposed mixing event that led to the 1915 erup-tion, these crystals do not preserve a record of majorrecharge events. The dominant volume of the daciticmagma body, therefore, can be envisioned as a relativelyisolated mass in which thermal energy is being dissipatedto the surroundings at a rate consistent with low degreesof undercooling. The lack of pronounced crystal 87Sr/86Srvariations (i.e. core to rim) and the lack of substantial var-iations among phenocrysts suggest that either wallrockassimilation was not a dominant mechanism or, if assimila-tion was important, that drastic changes in the characterand mass of assimilant did not occur during phenocrystgrowth. This interpretation supports the idea that, at anygiven time, the Lassen magmatic system consists of anumber of smaller, discrete magma bodies, rather than asingle magma chamber that periodically experiencesrecharge events.
Reacted phenocrystsAs demonstrated by CSD results for reacted vs unreactedphenocrysts in the black dacite (Table 1), the thermal envir-onment in which reacted phenocrysts underwent the domi-nant phase of growth was the same as that for unreactedphenocrysts. We therefore suggest that most of the growthof reacted phenocrysts took place in the pre-mixing daciticchamber and the disequilibrium textures, of which dusty ormottled zones are the most prominent, formed as a resultof the same mixing event that catalyzed the eruption.These crystals also typically have clear overgrowth rims(0�05^0�1mm thick) with calcic (An54^72) compositionssimilar to that of microphenocrysts. A clear example of amottled zone surrounded by an overgrowth rim can beseen in Fig. 4e, which shows the NDIC image and electronmicroprobe traverse for DA3. The association between themottled zones and the overgrowth rims suggests thatmottled zones result from dissolution caused by crystalsbeing entrained in a magma at temperatures higher thanthose of the dacitic magma (seeTsuchiyama & Takahashi,1983; Tsuchiyama, 1985). This is consistent with the obser-vation that these mottled zones are composed of smallglass inclusions, which form by partial melting of the pla-gioclase crystals (e.g. Tsuchiyama, 1985). Two Sr isotopeanalyses of mottled zones vary from 0�70398 (BD11-2) to0�70431 (DA3-1).The former is lower than the average phe-nocryst value whereas the latter is very similar; thus, basedon this small sampling, there is no clear indication that thedissolution process influenced the Sr isotope systematics.Based on the compositional similarity between the over-growth rims and microphenocrysts (described below), weagree with the interpretation of Clynne (1999) thatgrowth of the rims occurred concurrently with microphe-nocryst growth.
MicrophenocrystsCompared with phenocrysts, differences in the slopes ofCSD plots (Fig. 3 andTable 1) for microphenocrysts for allfour compositions of the 1915 Lassen eruption indicate thatthese crystals are a distinct population, and likephenocrysts, microphenocrysts share a common origin.Steeper slopes imply higher rates of nucleation associatedwith higher degrees of undercooling (Marsh, 1988).Acicular, swallowtail, and skeletal textures, common tomicrophenocrysts, also support growth at high degreesof undercooling (Kirkpatrick et al., 1979; Muncill &Lasaga, 1987).Like phenocrysts, microphenocrysts also form a compo-
sitionally distinct group (Fig. 4 and Table 3). Highercore An contents, compared with phenocrysts, suggestcrystallization from a higher temperature, higher CaOmagma. Some differentiation during growth of the micro-phenocrysts took place, as evidenced by generally simplezoning patterns that, on average, trend toward lower An
JOURNAL OF PETROLOGY VOLUME 00 NUMBER 0 MONTH 2008
20
by guest on Decem
ber 17, 2015http://petrology.oxfordjournals.org/
Dow
nloaded from
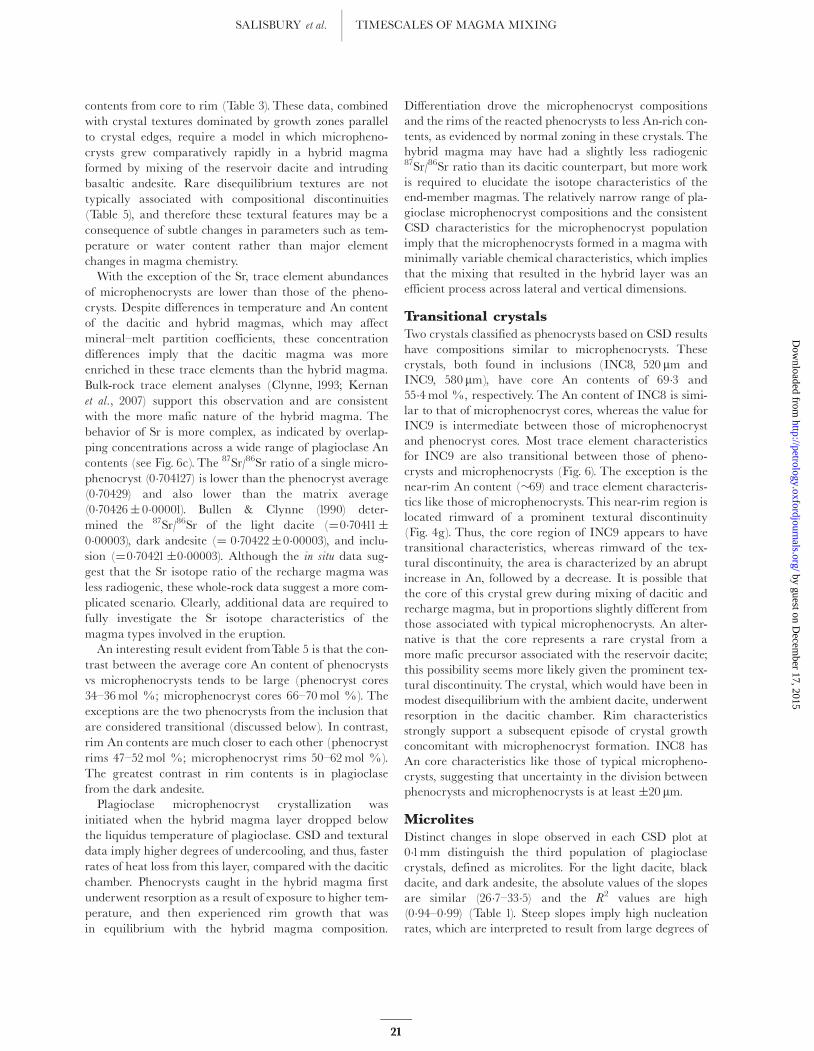
contents from core to rim (Table 3). These data, combinedwith crystal textures dominated by growth zones parallelto crystal edges, require a model in which micropheno-crysts grew comparatively rapidly in a hybrid magmaformed by mixing of the reservoir dacite and intrudingbasaltic andesite. Rare disequilibrium textures are nottypically associated with compositional discontinuities(Table 5), and therefore these textural features may be aconsequence of subtle changes in parameters such as tem-perature or water content rather than major elementchanges in magma chemistry.With the exception of the Sr, trace element abundances
of microphenocrysts are lower than those of the pheno-crysts. Despite differences in temperature and An contentof the dacitic and hybrid magmas, which may affectmineral^melt partition coefficients, these concentrationdifferences imply that the dacitic magma was moreenriched in these trace elements than the hybrid magma.Bulk-rock trace element analyses (Clynne, 1993; Kernanet al., 2007) support this observation and are consistentwith the more mafic nature of the hybrid magma. Thebehavior of Sr is more complex, as indicated by overlap-ping concentrations across a wide range of plagioclase Ancontents (see Fig. 6c). The 87Sr/86Sr ratio of a single micro-phenocryst (0�704127) is lower than the phenocryst average(0�70429) and also lower than the matrix average(0�70426� 0�00001). Bullen & Clynne (1990) deter-mined the 87Sr/86Sr of the light dacite (¼0�70411�0�00003), dark andesite (¼ 0�70422�0�00003), and inclu-sion (¼0�70421�0�00003). Although the in situ data sug-gest that the Sr isotope ratio of the recharge magma wasless radiogenic, these whole-rock data suggest a more com-plicated scenario. Clearly, additional data are required tofully investigate the Sr isotope characteristics of themagma types involved in the eruption.An interesting result evident fromTable 5 is that the con-
trast between the average core An content of phenocrystsvs microphenocrysts tends to be large (phenocryst cores34^36mol %; microphenocryst cores 66^70mol %). Theexceptions are the two phenocrysts from the inclusion thatare considered transitional (discussed below). In contrast,rim An contents are much closer to each other (phenocrystrims 47^52mol %; microphenocryst rims 50^62mol %).The greatest contrast in rim contents is in plagioclasefrom the dark andesite.Plagioclase microphenocryst crystallization was
initiated when the hybrid magma layer dropped belowthe liquidus temperature of plagioclase. CSD and texturaldata imply higher degrees of undercooling, and thus, fasterrates of heat loss from this layer, compared with the daciticchamber. Phenocrysts caught in the hybrid magma firstunderwent resorption as a result of exposure to higher tem-perature, and then experienced rim growth that wasin equilibrium with the hybrid magma composition.
Differentiation drove the microphenocryst compositionsand the rims of the reacted phenocrysts to less An-rich con-tents, as evidenced by normal zoning in these crystals. Thehybrid magma may have had a slightly less radiogenic87Sr/86Sr ratio than its dacitic counterpart, but more workis required to elucidate the isotope characteristics of theend-member magmas. The relatively narrow range of pla-gioclase microphenocryst compositions and the consistentCSD characteristics for the microphenocryst populationimply that the microphenocrysts formed in a magma withminimally variable chemical characteristics, which impliesthat the mixing that resulted in the hybrid layer was anefficient process across lateral and vertical dimensions.
Transitional crystalsTwo crystals classified as phenocrysts based on CSD resultshave compositions similar to microphenocrysts. Thesecrystals, both found in inclusions (INC8, 520 mm andINC9, 580 mm), have core An contents of 69�3 and55�4mol %, respectively. The An content of INC8 is simi-lar to that of microphenocryst cores, whereas the value forINC9 is intermediate between those of microphenocrystand phenocryst cores. Most trace element characteristicsfor INC9 are also transitional between those of pheno-crysts and microphenocrysts (Fig. 6). The exception is thenear-rim An content (�69) and trace element characteris-tics like those of microphenocrysts. This near-rim region islocated rimward of a prominent textural discontinuity(Fig. 4g). Thus, the core region of INC9 appears to havetransitional characteristics, whereas rimward of the tex-tural discontinuity, the area is characterized by an abruptincrease in An, followed by a decrease. It is possible thatthe core of this crystal grew during mixing of dacitic andrecharge magma, but in proportions slightly different fromthose associated with typical microphenocrysts. An alter-native is that the core represents a rare crystal from amore mafic precursor associated with the reservoir dacite;this possibility seems more likely given the prominent tex-tural discontinuity. The crystal, which would have been inmodest disequilibrium with the ambient dacite, underwentresorption in the dacitic chamber. Rim characteristicsstrongly support a subsequent episode of crystal growthconcomitant with microphenocryst formation. INC8 hasAn core characteristics like those of typical micropheno-crysts, suggesting that uncertainty in the division betweenphenocrysts and microphenocrysts is at least �20 mm.
MicrolitesDistinct changes in slope observed in each CSD plot at0�1mm distinguish the third population of plagioclasecrystals, defined as microlites. For the light dacite, blackdacite, and dark andesite, the absolute values of the slopesare similar (26�7^33�5) and the R2 values are high(0�94^0�99) (Table 1). Steep slopes imply high nucleationrates, which are interpreted to result from large degrees of
SALISBURY et al. TIMESCALES OF MAGMA MIXING
21
by guest on Decem
ber 17, 2015http://petrology.oxfordjournals.org/
Dow
nloaded from

undercooling, caused by rapid magma ascent and syn-eruptive degassing (e.g. Hammer et al., 2000). We suggestthat microlites most probably formed during magmaascent immediately prior to eruption.In contrast, the absolute value of slope and R2 (2�6 and
0�33, respectively) for the inclusion microlites are signifi-cantly different from those for the other three rock types(Table 1), implying that these crystals grew in an environ-ment distinct from that represented by the black dacite,light dacite, and dark andesite. Based on the model ofClynne (1999), hybrid magma dispersed into the magmachamber as a mafic foam that ascended into the overlyingdacite. Inclusions are probably quenched blobs of thismaterial. The high microphenocryst density in the anal-yzed inclusion suggests that inclusions may have been char-acterized by comparatively high melt viscosity, which inturn may have retarded microlite growth. Growth on pre-existing microphenocrysts, instead of nucleation of newmicrolites, and/or timescales too short to support forma-tion of a large microlite population are alternatives sug-gested by the work of Coombs et al. (2002).Microlites form the only crystal population that exhibits
a major-element correlation with whole-rock composition.Average microlite core An contents for the black dacite,light dacite, and inclusion are similar (51�7^56�7; Table 3).In contrast, the dark andesite has an average core An con-tent of 63�5mol %, suggesting crystallization from a moreCaO-rich melt. Average rim An contents show that micro-lites are generally normally zoned, although the higheraverage An content is still preserved in microlite rimsin the dark andesite (61�8mol % compared with44�8^48�7mol % for other products). Results of electronmicroprobe glass analyses are relevant to this discussionbecause, of the four compositions, average major-elementdata indicate that the dark andesite is characterized bythe least silicic, most magnesian glass. The preferredmodel of formation for the dark andesite by Clynne (1999)involves mixing between dacite and mafic end-membermagmas.The mafic foam, which formed in a highly under-cooled setting following initial mixing, ascended into themain body of dacite. This foam formed inclusions, and dis-aggregated crystals from the inclusions mixed with thedacite to form the black dacite. As compositional and ther-mal contrasts between the black dacite and basaltic ande-site decreased, direct mixing of these products was possibleand formed the dark andesite.The more An-rich microlitesand more mafic glass compositions are consistent with thishypothesis. Low thermal contrast between the black daciteand basaltic andesite would retard additional crystal for-mation, consistent with the observation that the microphe-nocrysts and phenocrysts present in the dark andesiteformed in the andesitic hybrid layer and the dacitic cham-ber, respectively, and subsequently became part of the darkandesite. Thus, microlites appear to be the only distinct
crystal population that formed in the hybrid dark andesitesenso stricto, and as noted for other microlite populations,probably owe their origin to ascent of magma into thevolcanic conduit.
TIMESCALES OF MIX ING ANDCRYSTALL IZAT ION PR IOR TOTHE 1915 ERUPTIONIn this section, timescale information about the three crys-tal size populations is evaluated. We note that there areassumptions that constrain the applicability of CSD time-scales to natural phenomena. Among the most critical isthe assumption that during crystal growth, growth andnucleation rates remain constant. An additional uncer-tainty originates from our imperfect understanding ofgrowth rates, as applied to natural conditions. In all cases,we apply reasonable ranges of growth rates to bracketpotential timescales.Cashman (1993) demonstrated that for plagioclase form-
ing in a shallow magmatic system, growth rates are rela-tively constant over a wide variety of composition andmelt viscosity. The parameter that exerts the most criticalcontrol on growth rate is magma cooling rate. Based oncomparison of natural and experimental data, in the con-text of textural and CSD data, Cashman (1993) concludedthat growth rates for plagioclase in shallow basaltic sys-tems span a very narrow range of 10^9mm/s to 10^10mm/s.Studies of Mount. St. Helens dome growth by Cashman(1992) show less thananorder ofmagnitude difference inpla-gioclase growth rates between basaltic and dacitic magmas.Higgins (1996a) used a growth rate of 10^10mm/s to deter-mine CSD-derived residence times of decades for magma inthe andesitic crustal chamber beneath Egmont volcano.Using rates of 10^9 to 10^10mm/s and the slopes for pheno-crysts from both the 3/2 and CSDCorrections volume adjust-ment, average phenocryst residence times [residencetime¼ ^1/(growth rate� slope)] are decades to centuries.Assuming that the maximum measured length of a pheno-cryst (�5mm) also provides timescale information, thesame range of growth rates yields timescales of centuries tomillennia. Similar timescales have been reported fromU^Th^Ra disequilibria work for other volcanoes (e.g.Cooper&Reid,2003;Turner et al.,2003).A goal of this work is to constrain the time between
recharge^mixing and eruption. If microphenocrystsformed in response to magma mixing initiated byrecharge, then the average residence time of this crystalpopulation may provide an indication of the time betweenrecharge and eruption. Appropriate growth rates can beestimated based on the work of Coombs et al. (2002),which reported results of experiments designed to repro-duce crystal textures of inclusions from Southwest Tridentvolcano, Alaska, that formed in a manner similar to that of
JOURNAL OF PETROLOGY VOLUME 00 NUMBER 0 MONTH 2008
22
by guest on Decem
ber 17, 2015http://petrology.oxfordjournals.org/
Dow
nloaded from

the 1915 Lassen eruption. In Coombs et al. (2002), experi-mental melts of andesite composition were annealed to10008C and then cooled to 8908C at different rates from1108C/h to 28C/h. Results for 28C/h experiments most clo-sely approximate the euhedral, slightly elongate plagio-clase crystals common to natural enclaves such as those ofthe 1915 eruption. This cooling rate brackets growth ratesfrom 3�10^7 to 6�10^8mm/s based on the empirical cali-bration curve of Cashman (1993). Such growth rates yieldaverage crystal residence times of days to a few months,implying a relatively short time period between mixingand eruption.These same growth rates yield crystallizationtimes for the 0�05^0�1mm phenocryst overgrowth rims ofdays to weeks. Consistent with this result, a maximumcrystal size of 0�5mm yields residence times of up to sev-eral months. Similar timescales were calculated byNakamura (1995) for the 1991^1993 eruptions of Unzen,based on diffusion modeling of zoning profiles in magne-tite formed by mixing low-temperature, crystal-richmagma with a higher temperature melt. Relatively shorttimescales between mixing and eruption were also pro-posed for the 1991 eruption of Pinatubo (Pallister et al.,1992), the 1995^1999 eruption of Soufrie' re Hills,Montserrat (Murphy et al., 2000), and the 1953^1974eruption of Southwest Trident volcano, Alaska (Coombset al., 2000).An interesting observation relevant to this discussion is
that phreatic eruptions at Lassen predated the magmaticeruption by nearly a year (Clynne et al., 1999). Pallisteret al. (1996) speculated that the initial phreatic eruptionsof Mt. Pinatubo in 1991 coincided with initial, slowmixing between intruding basaltic and reservoir magmathat led to the eruption of inclusion-rich lava 2 monthslater. The climactic, plinian eruption followed 2 weekslater and is thought to have been triggered by a larger,more efficient mixing event. If magma recharge triggeredthe onset of phreatic activity at Lassen Peak, then the cal-culated residence times of the microphenocrysts are signif-icantly shorter than the time between such a rechargeevent and eruption. A potential explanation for the mis-match in timescales comes from evaluation of the Coombset al. (2002) experiments; they noted that significant crys-tallization occurred in less than an hour during coolingexperiments that attempted to recreate andesite anddacite interaction. Coombs et al. concluded that an intrud-ing andesitic magma cannot be in prolonged contact witha dacitic magma without crystallization occurring. If thisis the case, then it is likely that crystallization of microphe-nocrysts occurred shortly after mixing. Thus, crystalliza-tion in this environment may have occurred relativelyquickly, and then may have slowed significantly or stoppedas a result of thermal equilibration between host andintruding magma (e.g. Sparks & Marshall, 1986). If crys-tallization were discontinuous, then the calculated CSD
timescales represent a lower limit on the time betweenmixing and recharge. A less likely, but alternativee inter-pretation is that the timescale implied by our CSD data isaccurate. This would suggest that phreatic activity was notdirectly initiated by the recharge event that is representedby the microphenocryst population. Thus, a key questionfor the 1915 Lassen Peak eruption is how recharge and theonset of phreatic activity are related.More rapid cooling rates of 108C/h yield growth rates of
1�10^6 to 2�10^7mm/s based on the empirical calibrationcurve of Cashman (1993).This range encompasses the aver-age microlite growth rate for the 1991 eruption of Mt.Pinatubo of 1�10^7mm/s (Cashman & Blundy, 2000).If this range is appropriate for the 1915 microlite popula-tion, residence times are of the order of hours to days.Calculations using the maximum crystal size (0�1mm)also yield timescales of hours to days. Based on an analysisof microlite crystallinity for samples representing activityduring the 1991 eruption of Mt. Pinatubo, Hammer et al.(1999) proposed similar, short timescales for microlitegrowth. Blundy & Cashman (2005) also proposed shorttimescales (i.e. months) for crystal growth, based on con-straints provided by melt inclusions from 1980 Mount St.Helens dacitic pumice. Such rapid timescales may precludecrystallization caused by dissipation of latent heat. Instead,syn-eruptive degassing and decompression cause crystalliz-ation on relatively short timescales (e.g. Hammer et al.,1999, 2000; Cashman & Blundy, 2000).We therefore suggestthat microlite crystallization in the Lassen system wasassociated with decompression and syn-eruptive degassingas the magma ascended in a conduit system to the surface.
SUMMARY: PROCESSES ANDTIMESCALES OF THE MAGMAMIX ING EVENT ASSOC IATEDWITH THE 1915 LASSEN PEAKERUPT IONPhenocrysts in all of the products from the 1915 LassenPeak eruption provide evidence for the existence of a rela-tively isolated dacitic magma body that was undergoingmoderate rates of cooling. Simple textures, relativelyhomogeneous Sr isotope signatures, and small variationsin trace element concentrations and An content indicatethat the dacitic magma underwent only modest, closed-system differentiation prior to the eruption-inducingmixing event. If assimilation occurred, the mass and char-acter of assimilant was constant during crystallization.Average crystal residence times record crystallization overhundreds to thousands of years.Months prior to the climactic 1915 eruption, basaltic
andesite intruded into the base of the dacitic reservoir.As a hybrid layer of andesite formed, microphenocrysts ofplagioclase crystallized. Textural and CSD data indicate a
SALISBURY et al. TIMESCALES OF MAGMA MIXING
23
by guest on Decem
ber 17, 2015http://petrology.oxfordjournals.org/
Dow
nloaded from
higher degree of undercooling for this layer, comparedwith the reservoir chamber, suggesting more rapid rates ofheat dissipation. Microphenocryst cores have higher Ancontents than phenocryst cores and are also characterizedby lower concentrations of incompatible elements such asBa and Pb. Combined CSD and in situ chemical datatherefore determine microphenocrysts to be a distinctpopulation. Some phenocrysts were incorporated into thehybrid layer, exposing them to higher temperature, higherCaOmagma, causing some resorption, followed by the for-mation of overgrowth rims. These rims, as well as the rimsof the microphenocrysts, are typically normally zoned,suggesting that after the formation of the relatively highAn content portions, differentiation by crystallization ledto reduced An content in the remaining hybrid magma.Crystallization of the hybrid layer led to volatile satura-
tion, which induced vesiculation of the hybrid magma. Amafic foam formed, which was less dense than the ambientdacitic reservoir magma, and rose within the chamber.Inclusions represent discrete blobs of this material incorpo-rated into the black dacite.There is also abundant evidencethat some inclusions disaggregated, as indicated by thepresence of comparable microphenocrysts in the lightdacite, black dacite, and dark andesite.Microlite CSD data suggest short residence times of
hours to days, which most probably reflect decompression^degassing during ascent in the magma conduit system.Growth of microlites in the inclusions was distinct fromthat in the magmas that formed the other three rocktypes. The much higher microphenocryst abundance inthe inclusions may have influenced magma rheology, thusretarding growth of microlites. An alternative is that someof the plagioclase growth that occurred during this phasedid so on pre-existing microphenocrysts. Compositionaldistinctions in microlites and glass between black dacite,light dacite, inclusion, and dark andesite clearly demon-strate microlite growth after formation of the mafic foamand dispersal of the inclusions into the reservoir magma.The melt composition of the dark andesite was moremafic than that of the other compositions, reflectingmixing between black dacite and intruding basaltic andes-ite on timescales so short that little new (pre-microlite)crystallization occurred. Although the average composi-tion of the andesitic inclusion is more mafic than that ofthe dark andesite, by the time the microlites began togrow, the melt composition of the inclusions had evolvedto a composition similar to that of the black dacite andlight dacite.
ACKNOWLEDGEMENTSWe thank Roger Nielsen and Frank Tepley for assistancewith microprobe analyses at Oregon State University,Martin Streck for use of his Nomarski imaging facility atPortland State University, and Darren Tollstrup for
assistance with laser ablation and microdrilling.Thoughtful reviews by Michelle Coombs, Pavel Izbekov,Dougal Jerram, Carl Thornber and Charles Bacon, andexpert handling by executive editor Marjorie Wilson aregreatly appreciated. The authors gratefully acknowledgefunding from the National Science Foundation, Sigma Xi,Geological Society of America, and Central WashingtonUniversity.
SUPPLEMENTARY DATASupplementary data for this paper are available at Journalof Petrology online.
REFERENCESAnderson, A. T. (1983). Oscillatory zoning of plagioclase: Nomarski
interference contrast microscopy of etched polished sections.American Mineralogist 68, 125^129.
Bacon, C. R. (1986). Magmatic inclusions in silicic and intermediatevolcanic rocks. Journal of Geophysical Research 91, 6091^6112.
Blundy, J. & Cashman, K. V. (2005). Rapid decompression-drivencrystallization recorded by melt inclusions from Mount St. Helensvolcano. Geology 33, 793^796.
Browne, B. L., Vogel, T. A., Uto, K., Hoshizumi, H., Eichelberger, J.C. & Patino, L. C. (2006). Magma mingling as indicated by textureand Sr/Ba ratios of plagioclase phenocrysts from Unzen volcano,SW Japan. Journal of Volcanology and Geothermal Research 154, 103^116.
Bullen, T. D. & Clynne, M. A. (1990). Trace element and isotopic con-straints on magmatic evolution at Lassen volcanic center. Journal ofGeophysical Research 95, 19671^19691.
Cashman, K.V. (1990). Textural constraints on the kinetics of crystal-lization of igneous rocks. In: Nicholls, J. & Russell, J. K. (eds)Modern Methods of Igneous Petrology: Understanding Magmatic Processes.
Mineralogical Society of America, Reviews in Mineralogy24, 259^314.Cashman, K. V. (1992). Groundmass crystallization of Mount St.
Helens dacite, 1980^1986: a tool for interpreting shallow magmaticprocesses. Contributions to Mineralogy and Petrology 109, 431^449.
Cashman, K. V. (1993). Relationship between plagioclase crystalliza-tion and cooling rate in basaltic melts. Contributions to Mineralogy
and Petrology 113, 126^142.Cashman, K.V. & Blundy, J. (2000). Degassing and crystallization of
ascending andesite and dacite. Philosophical Transactions of the RoyalSociety of London 358, 1487^1513.
Cashman, K. V. & Marsh, B. D. (1988). Crystal size distribution(CSD) in rocks and the kinetics and dynamics of crystallizationII: Makaopuhi lava lake. Contributions to Mineralogy and Petrology 99,292^305.
Christiansen, R.L., Clynne, M.A. & Muffler, L.J.P. (2002). Geologicmap of the area of Lassen Peak, Chaos Crags, and Upper HatCreek, California. US Geological Survey Miscellaneous Investigations
Map I^2723, scale 1:50 000.Clynne, M. A. (1990). Stratigraphic, lithologic, and major element
geochemical constraints on magmatic evolution at Lassen volcaniccenter, California. Journal of Geophysical Research 95.
Clynne, M. A. (1993). Geologic studies of the Lassen volcanic center,Cascade Range, California. PhD thesis. University of California,Santa Cruz.
Clynne, M. A. (1999). A complex magma mixing origin for rockserupted in 1915, Lassen Peak, California. Journal of Petrology 40,105^132.
JOURNAL OF PETROLOGY VOLUME 00 NUMBER 0 MONTH 2008
24
by guest on Decem
ber 17, 2015http://petrology.oxfordjournals.org/
Dow
nloaded from

Clynne, M. A., Christiansen, R. L., Felger, T. J., Stauffer, P. H. &Hendley, J. W., II (1999). Eruptions of Lassen Peak, California,1914^1917. US Geological Survey Fact Sheet,173^98.
Coombs, M. L., Eichelberger, J. C. & Rutherford, M. J. (2000).Magma storage and mixing conditions for the 1953^1974 eruptionsof Southwest Trident volcano, Katmai National Park, Alaska.Contributions to Mineralogy and Petrology 140, 99^118.
Coombs, M. L., Eichelberger, J. C. & Rutherford, M. J. (2002).Experimental and textural constraints on mafic enclave formationin volcanic rocks. Journal of Volcanology and Geothermal Research 119,125^144.
Cooper, K. M. & Reid, M. R. (2003). Re-examination of crystal agesin recent Mount St. Helens lavas: Implications for magma reser-voir processes. Earth and Planetary Science Letters 213, 149^167.
Eggins, S. M. (2003). Laser ablation ICP-MS analysis of geologicalmaterials prepared as lithium borate glasses. Journal of Geostandardsand Geoanalyses 27, 147^162.
Eichelberger, J. C. (1980).Vesiculation of mafic magma during replen-ishment of silicic magma reservoirs. Nature 288, 446^450.
Garrido, C. J., Kelemen, P. B. & Hirth, G. (2001).Variation of coolingrate with depth in lower crust formed at an oceanic spreadingridge: Plagioclase crystal size distributions in gabbros from theOman ophiolite. Geochemistry, Geophysics, Geosystems 2, doi:10.1029/2000GC000136.
Guffanti, M., Bullen,T. D., Clynne, M. A., Smith, J. G. & Muffler, L.J. P. (1990). Late Cenozoic volcanism, subduction, and extension inthe Lassen region of California, southern Cascade Range. Journalof Geophysical Research 95, 19453^19464.
Hammer, J. E., Cashman, K.V., Hoblitt, R. P. & Newman, S. (1999).Degassing and microlite crystallization during pre-climactic eventsof the 1991 eruption of Mt. Pinatubo, Philippines. Bulletin of
Volcanology 60, 355^380.Hammer, J. E., Cashman, K. V. & Voight, B. (2000). Magmatic pro-
cesses revealed by textural and compositional trends in Merapidome lavas. Journal of Volcanology and Geothermal Research 100,165^192.
Higgins, M. D. (1996a). Crystal size distributions and other quantita-tive textural measurements in lavas and tuff from Egmont volcano(Mt. Taranaki), New Zealand. Bulletin of Volcanology 58, 194^204.
Higgins, M. D. (1996b). Magma dynamics beneath Kameni volcano,Thera, Greece, as revealed by crystal size and shape measure-ments. Journal of Volcanology and Geothermal Research 70, 37^48.
Higgins, M. D. (2000). Measurement of crystal size distributions.American Mineralogist 85, 1105^1116.
Higgins, M. D. (2006). Verification of ideal semi-logarithmic, lognor-mal or fractal crystal size distributions from 2D datasets. Journal ofVolcanology and Geothermal Research 154, 8^16.
Izbekov, P. E., Eichelberger, J. C. & Ivanov, B. V. (2004). The 1996eruption of Karymsky volcano, Kamchatka: Historical record ofbasaltic replenishment of an andesite reservoir. Journal of Petrology45, 2325^2345.
Kernan, R. A., Wenner, J. M., Clynne, M. A., Mahoney, J. B. &Ferguson, J. W. (2007). Dynamic magma chamber processesreflected in trace-element data from the May 1915 eruptionof Lassen Peak, California (abstract). EOS Transactions,
American Geophysical Union 88, Fall Meeting Supplement, AbstractV33C-1522.
Kirkpatrick, R. J., Klein, L., Uhlmann, D. R. & Hays, J. F. (1979).Rates and processes of crystal growth in the system anorthite^albite. Journal of Geophysical Research 84, 3671^3676.
Mangan, M. T. (1990). Crystal size distribution systematics and thedetermination of magma storage times: the 1959 eruption of
Kilauea volcano, Hawaii. Journal of Volcanology and Geothermal
Research 44, 295^302.Marsh, B. D. (1988). Crystal size distribution (CSD) in rocks and the
kinetics and dynamics of crystallization I. Theory. Contributions toMineralogy and Petrology 99, 277^291.
Marsh, B. D. (1998). On the interpretation of crystal size distributionsin magmatic systems. Journal of Petrology 39, 553^600.
Morgan, D. J. & Jerram, D. A. (2006). On estimating crystal shape forcrystal size distribution analysis. Journal of Volcanology and GeothermalResearch 154, 1^7.
Muncill, G. E. & Lasaga, A. C. (1987). Crystal-growth kinetics of pla-gioclase in igneous systems: one-atmosphere experiments andapplication of a simplified growth model. American Mineralogist 72,299^311.
Murphy, M. D., Brewer, T. S., Sparks, R. S. J., Barclay, J. &Carrol, M. R. (2000). Remobilization of andesite magma by intru-sion of mafic magma at the Soufrie' re Hills volcano, Montserrat,West Indies. Journal of Petrology 41, 21^42.
Nakamura, M. (1995). Continuous mixing of crystal mush and replen-ished magma in the ongoing Unzen eruption. Geology 23, 807^810.
Pallister, J. S., Hoblitt, R. P. & Reyes, A. G. (1992). A basalt trigger forthe 1991 eruptions of Pinatubo volcano? Nature 356, 426^428.
Pallister, J. S., Hoblitt, R. P., Meeker, G. P., Knight, R. J. & Siems, D.F. (1996). Magma mixing at Mount Pinatubo: Petrographic andchemical evidence from the 1991 deposits. In: Newhall, C. G. &Punongbayan, R. S. (eds) Fire and Mud: Eruptions and Lahars of Mt.
Pinatubo, Philippines. Seattle, WA, University of Washington Press,pp. 687^732.
Pearce, T. H. & Clark, A. H. (1989). Nomarski interference contrastobservations of textural details in volcanic rocks. Geology 17,757^759.
Pearce, T. H. & Kolisnik, A. M. (1990). Observations of plagioclasezoning using interference imaging. Earth-Science Reviews 29, 9^26.
Ramos, F.C. (1992). Isotope geology of the Grouse Creek Mountains,Box Elder county Utah, MS thesis, University of California LosAngeles, Los Angeles.
Ramos, F. C., Wolff, J. A. & Tollstrup, D. L. (2004). Measuring87Sr/86Sr variations in minerals and groundmass from basaltsusing LA-MC-ICPMS. Chemical Geology 211, 135^158.
Randolf, A. D. & Larson, M. A. (1971).Theory of Particulate Processes.NewYork, Academic Press.
Resmini, R. G. & Marsh, B. D. (1995). Steady-state volcanism,paleoeffusion rates, and magma system volume inferred from plagi-oclase crystal size distributions in mafic lavas: Dome Mountain,Nevada. Journal of Volcanology and Geothermal Research 68, 273^296.
Salisbury, M. J. (2003). Magma mixing histories recorded by plagio-clase crystals from the 1915 eruption of Lassen Peak, California.MS thesis. CentralWashington University, Ellensburg.
Singer, B. S., Dungan, M. A. & Layne, G. D. (1995). Textures and Sr,Ba, Mg, Fe, K, and Ti compositional profiles in volcanic plagio-clase: clues to the dynamics of calc-alkaline magma chambers.American Mineralogist 80, 776^798.
Sparks, R. S. J. & Marshall, L. A. (1986). Thermal and mechanicalconstraints on mixing between mafic and silicic magmas. Journalof Volcanology and Geothermal Research 29, 99^124.
Tepley, F. J., III, Davidson, J. P. & Clynne, M. A. (1999). Magmaticinteractions as recorded in plagioclase phenocrysts of ChaosCrags, Lassen Volcanic Center, California. Journal of Petrology 40,787^806.
Thomas, N. & Tait, S. R. (1997). The dimensions of magmatic inclu-sions as a constraint on the physical mechanism of mixing. Journalof Volcanology and Geothermal Research 75, 167^178.
Tsuchiyama, A. (1985). Dissolution kinetics of plagioclase in themelt of the system: diopside^albite^anorthite, and origin of
SALISBURY et al. TIMESCALES OF MAGMA MIXING
25
by guest on Decem
ber 17, 2015http://petrology.oxfordjournals.org/
Dow
nloaded from

dusty plagioclase in andesites. Contributions to Mineralogy and Petrology
89, 1^16.Tsuchiyama, A. & Takahashi, E. (1983). Melting kinetics of a plagio-
clase feldspar. Contributions to Mineralogy and Petrology 84, 345^354.Turner, S., Hawkesworth, C., George, R., Jerram, D. A. &
Carpenter, N. (2003). Case studies of plagioclase growth and resi-dence times in island arc lavas fromTonga and the Lesser Antilles,
and a model to reconcile discordant age information. Earth and
Planetary Science Letters 214, 279^294.Turrin, B. D., Gerstel, W. J., Muffler, L. J. P., Trimble, D. A.,
Christiansen, R. L., Clynne, M. A. & Champion, D. E. (1998).Age of Lassen Peak, California, and implications for the ages oflate Pleistocene glaciations in the southern Cascade Range.Geological Society of America Bulletin 110, 931^945.
JOURNAL OF PETROLOGY VOLUME 00 NUMBER 0 MONTH 2008
26
by guest on Decem
ber 17, 2015http://petrology.oxfordjournals.org/
Dow
nloaded from