A Multiyear Workplace-Monitoring Program for Refractory Ceramic Fibers: Findings and Conclusions
16
REGULATORY TOXICOLOGY AND PHARMACOLOGY 26, 156–171 (1997) ARTICLE NO. RT971153 A Multiyear Workplace-Monitoring Program for Refractory Ceramic Fibers: Findings and Conclusions L. Daniel Maxim,* John N. Allshouse,* William P. Kelly,² Thomas Walters,‡ and Richard Waugh§ *Everest Consulting Associates, 15 North Main Street, Cranbury, New Jersey 08512; ²Unifrax Corporation, Niagara Falls, New York 14305; ‡Premier Refractories and Chemicals, Erwin, Tennessee 37650; and §Thermal Ceramics, Augusta, Georgia 30906 Received May 7, 1997 produced from melting and spinning/blowing calcined kaolin or a mixture of alumina (Al 2 O 3 ) and silica (SiO 2 ). Results of a monitoring program carried out by Other oxides, such as ZrO 2 ,B 2 O 3 , and TiO 2 , are some- members of the Refractory Ceramic Fibers Coalition as part of a Consent Agreement with the U.S. Environ- times added to alter the properties of the material. mental Protection Agency to measure workplace con- RCF is a valuable high-temperature insulating fiber centrations of refractory ceramic fiber (RCF) are pre- sold chiefly for industrial applications as an insulation sented. More than 700 personal monitoring samples for industrial furnaces, pipes, ducts, and cables, as fire were collected and analyzed annually from workers in protection for buildings and industrial process equip- RCF production and processing plants, as well as from ment, as aircraft/aerospace heat shields, and in auto- those employed by customers/end users. The data indi- motive uses, such as catalytic converters, metal rein- cate that (i) approximately 90% of time-weighted aver- forcements, heat shields, brake pads, and air bags (Ev- age (TWA) workplace concentrations are below the in- erest Consulting Associates, 1996b). RCF is produced dustry’s recommended exposure guideline of 1 fiber in the United States, Mexico, Canada, several countries per cubic centimeter TWA; (ii) workplace concentra- in Europe, Brazil, Venezuela, South Africa, Australia, tions vary with functional job category; (iii) concentra- Japan, China, Korea, Malaysia, and Taiwan. In the tions are approximately lognormally distributed; (iv) United States, it is estimated that approximately workplace concentrations are generally decreasing; 30,000 workers are exposed to RCF in manufacturing, (v) there are significant differences in workplace con- processing, or end-uses (Everest Consulting Associates, centrations among plants operated by both RCF pro- 1992). ducers and customers; (vi) equations can be developed Because these fibers may have nominal diameters to interconvert data analyzed using different measure- less than 3 mm (respirable by humans) and low solubil- ment techniques and counting rules; (vii) usage of res- pirators varies with the functional job category of the ity in biological fluids, RCF might pose a health hazard worker and the average fiber concentration; and (viii) in the workplace. Initial studies (Gross et al., 1955) of workplace samples differ from those used in animal RCF toxicology concluded that this material should be inhalation experiments in terms of the ratio of res- classified solely as a ‘‘nuisance’’ dust. However, later pirable particles to fibers. q 1997 Academic Press animal experiments raised concern, prompting the RCF industry to sponsor a series of state-of-the-art nose-only inhalation studies in rats and hamsters at INTRODUCTION the Research and Consulting Company (RCC) in Ge- neva, Switzerland. The RCC studies (Glass et al., 1992; This article presents the major findings of an ambi- Mast et al., 1992, 1993, 1995a,b; McConnell et al., 1995) tious 5-year workplace monitoring program on refrac- indicated that inhalation of elevated RCF concentra- tory ceramic fiber (RCF) described earlier in this jour- tions could cause pulmonary fibrosis, lung tumors, and nal (Maxim et al., 1994). At that time, only preliminary pleural mesothelioma in these laboratory animals. data were available. Now, more than halfway through Spurred by these results, RCF manufacturers (first the program, a substantial data base has been assem- singly and later under the auspices of the Refractory bled, permitting several useful conclusions to be drawn. Ceramic Fibers Coalition (RCFC)) developed a Product Stewardship Program (PSP) to identify hazards (ani- Background mal experiments and epidemiological studies (Lockey et al., 1993)), study possible risks (dosimetry studies RCF (Chemical Abstract Service (CAS) No. 142844- 00 – 6) is an amorphous synthetic vitreous fiber (SVF) (Yu et al., 1994, 1995, 1996, 1997), develop recom- 156 0273-2300/97 $25.00 Copyright q 1997 by Academic Press All rights of reproduction in any form reserved.
-
Upload
independent -
Category
Documents
-
view
1 -
download
0
Transcript of A Multiyear Workplace-Monitoring Program for Refractory Ceramic Fibers: Findings and Conclusions
REGULATORY TOXICOLOGY AND PHARMACOLOGY 26, 156–171 (1997)ARTICLE NO. RT971153
A Multiyear Workplace-Monitoring Program for Refractory CeramicFibers: Findings and Conclusions
L. Daniel Maxim,* John N. Allshouse,* William P. Kelly,† Thomas Walters,‡ and Richard Waugh§
*Everest Consulting Associates, 15 North Main Street, Cranbury, New Jersey 08512; †Unifrax Corporation, Niagara Falls, New York14305; ‡Premier Refractories and Chemicals, Erwin, Tennessee 37650; and §Thermal Ceramics, Augusta, Georgia 30906
Received May 7, 1997
produced from melting and spinning/blowing calcinedkaolin or a mixture of alumina (Al2O3) and silica (SiO2).Results of a monitoring program carried out byOther oxides, such as ZrO2, B2O3, and TiO2, are some-members of the Refractory Ceramic Fibers Coalition
as part of a Consent Agreement with the U.S. Environ- times added to alter the properties of the material.mental Protection Agency to measure workplace con- RCF is a valuable high-temperature insulating fibercentrations of refractory ceramic fiber (RCF) are pre- sold chiefly for industrial applications as an insulationsented. More than 700 personal monitoring samples for industrial furnaces, pipes, ducts, and cables, as firewere collected and analyzed annually from workers in protection for buildings and industrial process equip-RCF production and processing plants, as well as from ment, as aircraft/aerospace heat shields, and in auto-those employed by customers/end users. The data indi- motive uses, such as catalytic converters, metal rein-cate that (i) approximately 90% of time-weighted aver- forcements, heat shields, brake pads, and air bags (Ev-age (TWA) workplace concentrations are below the in- erest Consulting Associates, 1996b). RCF is produceddustry’s recommended exposure guideline of 1 fiber in the United States, Mexico, Canada, several countriesper cubic centimeter TWA; (ii) workplace concentra-
in Europe, Brazil, Venezuela, South Africa, Australia,tions vary with functional job category; (iii) concentra-Japan, China, Korea, Malaysia, and Taiwan. In thetions are approximately lognormally distributed; (iv)United States, it is estimated that approximatelyworkplace concentrations are generally decreasing;30,000 workers are exposed to RCF in manufacturing,(v) there are significant differences in workplace con-processing, or end-uses (Everest Consulting Associates,centrations among plants operated by both RCF pro-1992).ducers and customers; (vi) equations can be developed
Because these fibers may have nominal diametersto interconvert data analyzed using different measure-less than 3 mm (respirable by humans) and low solubil-ment techniques and counting rules; (vii) usage of res-
pirators varies with the functional job category of the ity in biological fluids, RCF might pose a health hazardworker and the average fiber concentration; and (viii) in the workplace. Initial studies (Gross et al., 1955) ofworkplace samples differ from those used in animal RCF toxicology concluded that this material should beinhalation experiments in terms of the ratio of res- classified solely as a ‘‘nuisance’’ dust. However, laterpirable particles to fibers. q 1997 Academic Press animal experiments raised concern, prompting the
RCF industry to sponsor a series of state-of-the-artnose-only inhalation studies in rats and hamsters at
INTRODUCTION the Research and Consulting Company (RCC) in Ge-neva, Switzerland. The RCC studies (Glass et al., 1992;
This article presents the major findings of an ambi- Mast et al., 1992, 1993, 1995a,b; McConnell et al., 1995)tious 5-year workplace monitoring program on refrac- indicated that inhalation of elevated RCF concentra-tory ceramic fiber (RCF) described earlier in this jour- tions could cause pulmonary fibrosis, lung tumors, andnal (Maxim et al., 1994). At that time, only preliminary pleural mesothelioma in these laboratory animals.data were available. Now, more than halfway through Spurred by these results, RCF manufacturers (firstthe program, a substantial data base has been assem- singly and later under the auspices of the Refractorybled, permitting several useful conclusions to be drawn. Ceramic Fibers Coalition (RCFC)) developed a Product
Stewardship Program (PSP) to identify hazards (ani-Backgroundmal experiments and epidemiological studies (Lockeyet al., 1993)), study possible risks (dosimetry studiesRCF (Chemical Abstract Service (CAS) No. 142844-
00–6) is an amorphous synthetic vitreous fiber (SVF) (Yu et al., 1994, 1995, 1996, 1997), develop recom-
1560273-2300/97 $25.00Copyright q 1997 by Academic PressAll rights of reproduction in any form reserved.
AID RTP 1153 / 6e14$$$$41 10-07-97 17:18:34 rtpa AP: RTP
157MONITORING REFRACTORY CERAMIC FIBERS
mended handling practices, measure and control Consent Agreement are described elsewhere (Maximet al., 1994; RCFC, 1993). In brief, the plan involvesworker exposure, and communicate relevant informa-
tion to employees, customers, and regulatory agencies. sampling workers in RCFC manufacturing and pro-cessing plants (internal samples) and direct customersThis program is described in several papers (see, e.g.,
Barrows et al., 1993; Maxim et al., 1994; Walters, and end users (external samples). To optimize effi-ciency and ensure coverage of all relevant job types,1995).
In response to a Toxic Substances Control Act a stratified sampling plan was developed; individualstrata are based on eight collectively exhaustive and(TSCA), Section 8(e) notification of the RCC findings
and industry briefings, the U.S. Environmental Protec- mutually exclusive functional job categories (FJCs).These FJCs are based on functional job similaritiestion Agency (EPA) initiated an expedited review of RCF
under TSCA Section 4(f) in November 1991. In May and workplace fiber concentrations measured in earliersampling. Annual sampling budgets for each type of1992, the EPA concluded that additional information
(particularly on workplace exposure) was necessary to sample and FJC are shown in Table 1. (As noted below,the actual numbers of samples collected have systemat-evaluate possible risk before it could decide whether
any regulatory action was appropriate and began a Sec- ically exceeded these goals.) Data collected include, in-ter alia, time-weighted average (TWA, both 8-hr andtion 6 investigation. Among other activities, EPA and
RCFC developed a program to provide additional infor- actual) personal monitoring workplace concentrations,task length average (TLA) workplace concentrationsmation on workplace exposure, formalized in a Consent
Agreement. for various tasks included in each FJC, information onthe use of engineering controls, workplace practices,and respiratory protection equipment for each observa-THE WORKPLACE EXPOSURE MONITORINGtion, and relevant characteristics (e.g., size and indus-PROGRAM(S)trial sector) of external firms. Internal samples are se-lected entirely at random; external samples includeRCF workplace monitoring is not new. Since theboth selectees (random selection) and volunteers (cus-early 1970s several firms in the industry gatheredtomers who requested workplace monitoring pursuantthese data (or sponsored such efforts) as part of theirto the industry’s PSP)—separately identified for analy-individual worker health and safety programs (see,sis. Additional samples (described below) are includede.g., Esmen et al., 1979; TIMA, 1990; Corn et al., 1992).for research purposes. As used herein, a ‘‘sample’’ mayHowever, prior to 1990, much of this monitoring wasconsist of data from several cassettes. (Typically aboutsporadic, conducted by different consultants/institu-four cassettes are used for each TWA sample.)tions, focused on unit operations/processes of particular
Over the period from 1990 to 1996, more than 4800interest (purposive, rather than random sampling),personal monitoring TWA workplace samples haveand generally emphasized monitoring of RCF manufac-been collected, of which nearly 3200 have been collectedturing and processing plants, rather than those oper-under the Consent Agreement. This is the most exten-ated by customers and end users. Moreover, the moni-sive database of workplace RCF concentrations evertoring data were collected and analyzed using severaldeveloped, and may be larger at present than that fordifferent sample designs and protocols. With the devel-any other SVF, including rock wool, slag wool, and fi-opment of a unified industry PSP in 1990, sampling,berglass.counting, and analysis protocols were brought into
greater alignment, more data were collected from con-Objectives of Exposure Monitoringsumers and end users, and increased emphasis was
placed on random (rather than purposive) sampling.The purpose of the Consent Agreement monitoring
program is to create a centralized industrywide dataConsent Agreementbank (elements shared with EPA) suitable for assess-ment of workplace exposure to RCF and, when and ifIn May 1993, RCFC signed a 5-year Consent Agree-
ment with EPA which defined the data to be collected, feasible and appropriate, to perform a qualitative orquantitative risk analysis (QRA). To achieve this objec-set numerical sampling targets, established a unified
protocol, identified appropriate statistical analysis tive, it is necessary to collect exposure data using astandardized and mutually agreed protocol for samplemethods, and effected numerous technical improve-
ments to earlier monitoring efforts. The Consent Agree- collection and analysis. Various safeguards are incor-porated into the program—including yearly audits con-ment incorporated a detailed Quality Assurance Proj-
ect Plan (QAPjP) (RCFC, 1993). Although there have ducted by two independent consulting firms, one re-tained by industry and the other by the EPA—to verifybeen minor modifications made to the QAPjP as experi-
ence has been gained with the program, key elements adherence to the QAPjP. Although industry and theEPA are certainly free to disagree on what the datahave stood the test of time.
The experimental design and other features of the mean (in fact, each has employed separate statisti-
AID RTP 1153 / 6e14$$$$41 10-07-97 17:18:34 rtpa AP: RTP
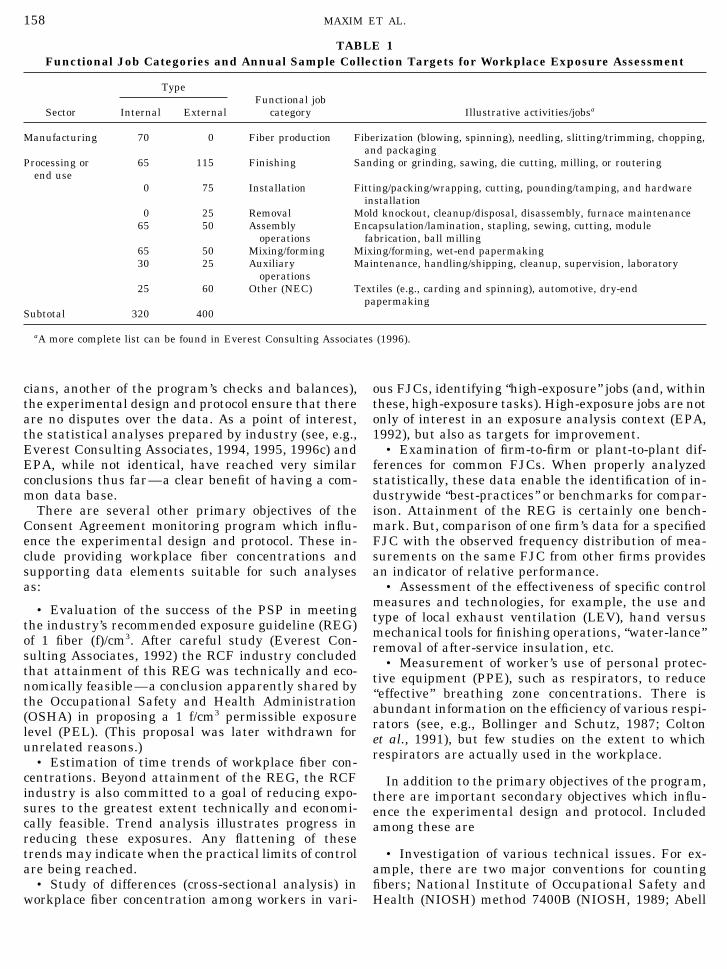
158 MAXIM ET AL.
TABLE 1Functional Job Categories and Annual Sample Collection Targets for Workplace Exposure Assessment
TypeFunctional job
Sector Internal External category Illustrative activities/jobsa
Manufacturing 70 0 Fiber production Fiberization (blowing, spinning), needling, slitting/trimming, chopping,and packaging
Processing or 65 115 Finishing Sanding or grinding, sawing, die cutting, milling, or routeringend use
0 75 Installation Fitting/packing/wrapping, cutting, pounding/tamping, and hardwareinstallation
0 25 Removal Mold knockout, cleanup/disposal, disassembly, furnace maintenance65 50 Assembly Encapsulation/lamination, stapling, sewing, cutting, module
operations fabrication, ball milling65 50 Mixing/forming Mixing/forming, wet-end papermaking30 25 Auxiliary Maintenance, handling/shipping, cleanup, supervision, laboratory
operations25 60 Other (NEC) Textiles (e.g., carding and spinning), automotive, dry-end
papermakingSubtotal 320 400
aA more complete list can be found in Everest Consulting Associates (1996).
cians, another of the program’s checks and balances), ous FJCs, identifying ‘‘high-exposure’’ jobs (and, withinthese, high-exposure tasks). High-exposure jobs are notthe experimental design and protocol ensure that there
are no disputes over the data. As a point of interest, only of interest in an exposure analysis context (EPA,1992), but also as targets for improvement.the statistical analyses prepared by industry (see, e.g.,
Everest Consulting Associates, 1994, 1995, 1996c) and • Examination of firm-to-firm or plant-to-plant dif-ferences for common FJCs. When properly analyzedEPA, while not identical, have reached very similar
conclusions thus far—a clear benefit of having a com- statistically, these data enable the identification of in-dustrywide ‘‘best-practices’’ or benchmarks for compar-mon data base.
There are several other primary objectives of the ison. Attainment of the REG is certainly one bench-mark. But, comparison of one firm’s data for a specifiedConsent Agreement monitoring program which influ-
ence the experimental design and protocol. These in- FJC with the observed frequency distribution of mea-surements on the same FJC from other firms providesclude providing workplace fiber concentrations and
supporting data elements suitable for such analyses an indicator of relative performance.• Assessment of the effectiveness of specific controlas:
measures and technologies, for example, the use and• Evaluation of the success of the PSP in meeting type of local exhaust ventilation (LEV), hand versusthe industry’s recommended exposure guideline (REG) mechanical tools for finishing operations, ‘‘water-lance’’of 1 fiber (f)/cm3. After careful study (Everest Con- removal of after-service insulation, etc.sulting Associates, 1992) the RCF industry concluded • Measurement of worker’s use of personal protec-that attainment of this REG was technically and eco- tive equipment (PPE), such as respirators, to reducenomically feasible—a conclusion apparently shared by ‘‘effective’’ breathing zone concentrations. There isthe Occupational Safety and Health Administration abundant information on the efficiency of various respi-(OSHA) in proposing a 1 f/cm3 permissible exposure rators (see, e.g., Bollinger and Schutz, 1987; Coltonlevel (PEL). (This proposal was later withdrawn for et al., 1991), but few studies on the extent to whichunrelated reasons.) respirators are actually used in the workplace.• Estimation of time trends of workplace fiber con-
centrations. Beyond attainment of the REG, the RCF In addition to the primary objectives of the program,industry is also committed to a goal of reducing expo- there are important secondary objectives which influ-sures to the greatest extent technically and economi- ence the experimental design and protocol. Includedcally feasible. Trend analysis illustrates progress in among these arereducing these exposures. Any flattening of thesetrends may indicate when the practical limits of control • Investigation of various technical issues. For ex-
ample, there are two major conventions for countingare being reached.• Study of differences (cross-sectional analysis) in fibers; National Institute of Occupational Safety and
Health (NIOSH) method 7400B (NIOSH, 1989; Abellworkplace fiber concentration among workers in vari-
AID RTP 1153 / 6e14$$$$41 10-07-97 17:18:34 rtpa AP: RTP
159MONITORING REFRACTORY CERAMIC FIBERS
et al., 1989) is commonly used in the United States. f/cm3): minimum, maximum, sample arithmetic mean,sample median, sample geometric mean, and sampleThe counting convention commonly used in Europe
(and used in the RCC inhalation experiments referred standard deviation. The overall range of measuredTWA concentrations (from 0.002 to 30 f/cm3) spansto above) is the World Health Organization (WHO)
rules (WHO, 1985). The data collected as part of this more than four orders of magnitude. Even within indi-vidual strata, the standard deviation is generally equalprogram enable the correlation between counts to be
determined—an important piece of information when to or greater than the arithmetic mean. As noted below,there is substantial structure in this data set, but thecomparing RCF monitoring data worldwide. As a sec-
ond example, most fiber concentrations are measured sample variability is sufficiently great that it requiresa relatively large sample size to identify statisticallyusing phase contrast optical microscopy (PCOM)—a
cost-effective technique, but one which counts all fibers significant contrasts—which underscores the need foran ambitious sampling program.(regardless of type) and can miss small diameter fibers.
The limit of resolution of PCOM is estimated to range The second point is that the sample medians andgeometric means are nearly equal in many cases: bothfrom 0.2 to 0.4 mm (Breysse, 1991). Transmission elec-
tron microscopy (TEM) can detect (and measure) are substantially less than the arithmetic mean, sug-gesting that the data are lognormally distributed (Ait-smaller diameter fibers than PCOM, but is more expen-
sive (by an order of magnitude) and not typically used chison and Brown, 1969; Gilbert, 1987). (More compel-ling evidence for this assertion is presented below.) Onfor workplace monitoring. The data collected as part
of this program enable the determination of a useful a stratum-by-stratum basis, the sample coefficient ofvariation (ratio of sample standard deviation to arith-regression relationship for RCF so that workplace fiber
concentrations determined by one method can be com- metic mean) is equal to or greater than 1.2 in 65% ofthe cases. A common rule of thumb (Koch and Link,pared to those determined by the other.
• Conduct of additional statistical analyses relative 1980; see also Gilbert, 1987) recommends use of thegeometric mean, rather than the arithmetic mean, asto sampling design optimization, selection of appro-
priate statistical methods, and verification of sampling a measure of location for lognormally distributed datawhenever the coefficient of variation is greater thanassumptions. Several examples follow. Volunteers as
well as random selectees are included in the data base. about 1.2. EPA’s exposure assessment guidelines (EPA,1992) recognize that environmental concentrations areDo these groups differ significantly? Firms included as
selectees are sampled with probability proportional to often approximately lognormally distributed and sug-gest that it is appropriate to present both the arithme-RCF purchases in the preceding year. Is there any evi-
dence that workplace concentrations at larger firms dif- tic and geometric means (or medians) for highly skeweddata. However, according to the EPA, the concentrationfer from those at smaller firms which could result in
biased workplace concentration estimates? Concentra- metric of choice for average daily dose (ADD) calcula-tions ‘‘is best expressed as an estimate of the arithmetictions of RCF (Maxim et al., 1994; DGXI, 1994; Rice et
al., 1997; Esmen and Hammad, 1977) and other con- mean regardless of the distribution of the data’’ (EPA,1992).taminants (Gilbert, 1987; Symanski et al., 1996) in the
workplace appear to be approximately lognormally dis- Another consequence of the fact that workplace con-centration data are approximately lognormal is thattributed, an observation with clear implications for sta-
tistical analysis. Is this observation supported by the it is appropriate to conduct statistical tests, such asanalysis of variance (ANOVA) or trend tests, on log-data?transformed data.
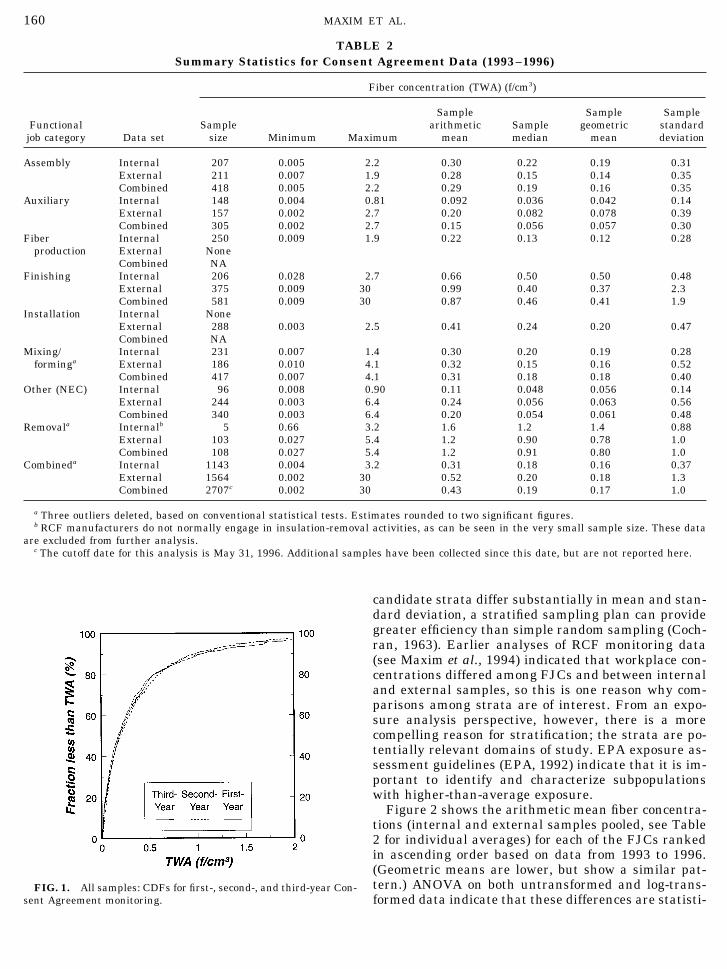
The third point is that, notwithstanding the variabil-DISCUSSION OF RESULTSity in measured TWAs, approximately 90% of observedconcentrations are beneath RCFC’s REG of 1 f/cm3—Preliminary Observations (Summary Statistics)suggesting a high degree of compliance with the indus-try’s recommended handling procedures for RCF. ThisBefore discussing the results in detail, it is important
to make three general observations about workplace is illustrated in the cumulative distribution function(CDF) of all Consent Agreement monitoring data (in-RCF concentration data. The first point is that RCF
concentration data (even for 8-hr TWAs) from personal ternal and external samples) shown in Fig. 1. (Workersare actually exposed to lower fiber concentrations, be-monitoring samples are highly variable. Table 2, for
example, shows a summary of data collected for the cause the statistics presented in Fig. 1 do not take intoaccount the protection afforded by respirators.)first 3 years of the Consent Agreement monitoring pe-
riod (June 1993 to May 1996). These data (more than2700 personal monitoring samples) are partitioned Comparisons among Functional Job Categoriesamong the various FJCs and include both internal andexternal samples. Table entries include the sample size As noted, a stratified sampling plan was used for
monitoring. When there is structure in the data andand the following TWA fiber concentration statistics (in
AID RTP 1153 / 6e14$$$$41 10-07-97 17:18:34 rtpa AP: RTP
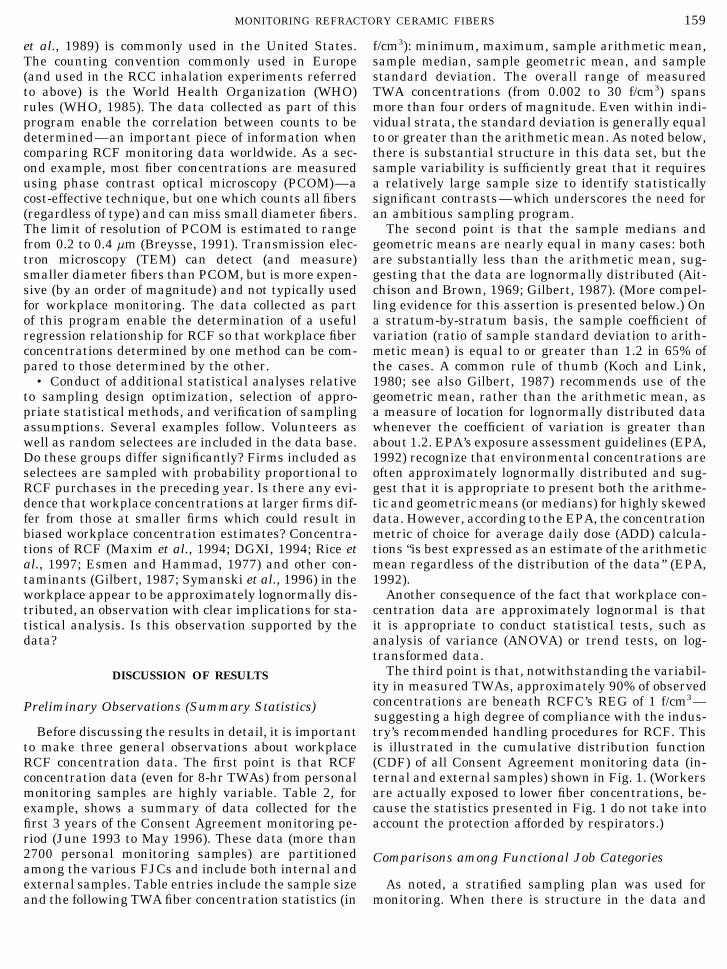
160 MAXIM ET AL.
TABLE 2Summary Statistics for Consent Agreement Data (1993–1996)
Fiber concentration (TWA) (f/cm3)
Sample Sample SampleFunctional Sample arithmetic Sample geometric standard
job category Data set size Minimum Maximum mean median mean deviation
Assembly Internal 207 0.005 2.2 0.30 0.22 0.19 0.31External 211 0.007 1.9 0.28 0.15 0.14 0.35Combined 418 0.005 2.2 0.29 0.19 0.16 0.35
Auxiliary Internal 148 0.004 0.81 0.092 0.036 0.042 0.14External 157 0.002 2.7 0.20 0.082 0.078 0.39Combined 305 0.002 2.7 0.15 0.056 0.057 0.30
Fiber Internal 250 0.009 1.9 0.22 0.13 0.12 0.28production External None
Combined NAFinishing Internal 206 0.028 2.7 0.66 0.50 0.50 0.48
External 375 0.009 30 0.99 0.40 0.37 2.3Combined 581 0.009 30 0.87 0.46 0.41 1.9
Installation Internal NoneExternal 288 0.003 2.5 0.41 0.24 0.20 0.47Combined NA
Mixing/ Internal 231 0.007 1.4 0.30 0.20 0.19 0.28forminga External 186 0.010 4.1 0.32 0.15 0.16 0.52
Combined 417 0.007 4.1 0.31 0.18 0.18 0.40Other (NEC) Internal 96 0.008 0.90 0.11 0.048 0.056 0.14
External 244 0.003 6.4 0.24 0.056 0.063 0.56Combined 340 0.003 6.4 0.20 0.054 0.061 0.48
Removala Internalb 5 0.66 3.2 1.6 1.2 1.4 0.88External 103 0.027 5.4 1.2 0.90 0.78 1.0Combined 108 0.027 5.4 1.2 0.91 0.80 1.0
Combineda Internal 1143 0.004 3.2 0.31 0.18 0.16 0.37External 1564 0.002 30 0.52 0.20 0.18 1.3Combined 2707c 0.002 30 0.43 0.19 0.17 1.0
a Three outliers deleted, based on conventional statistical tests. Estimates rounded to two significant figures.b RCF manufacturers do not normally engage in insulation-removal activities, as can be seen in the very small sample size. These data
are excluded from further analysis.c The cutoff date for this analysis is May 31, 1996. Additional samples have been collected since this date, but are not reported here.
candidate strata differ substantially in mean and stan-dard deviation, a stratified sampling plan can providegreater efficiency than simple random sampling (Coch-ran, 1963). Earlier analyses of RCF monitoring data(see Maxim et al., 1994) indicated that workplace con-centrations differed among FJCs and between internaland external samples, so this is one reason why com-parisons among strata are of interest. From an expo-sure analysis perspective, however, there is a morecompelling reason for stratification; the strata are po-tentially relevant domains of study. EPA exposure as-sessment guidelines (EPA, 1992) indicate that it is im-portant to identify and characterize subpopulationswith higher-than-average exposure.
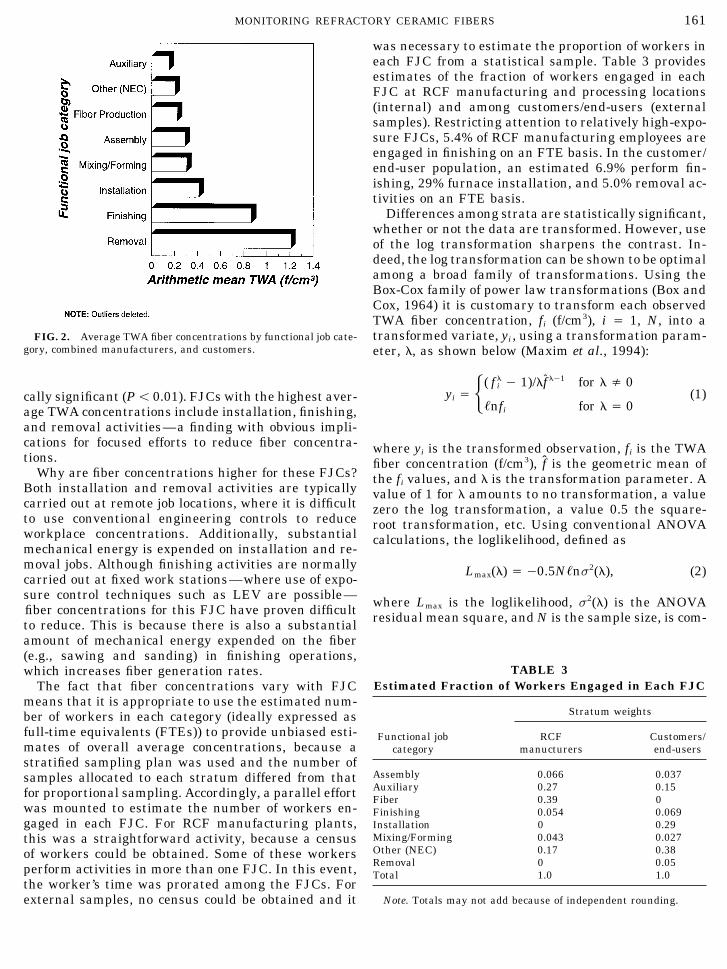
Figure 2 shows the arithmetic mean fiber concentra-tions (internal and external samples pooled, see Table2 for individual averages) for each of the FJCs rankedin ascending order based on data from 1993 to 1996.(Geometric means are lower, but show a similar pat-tern.) ANOVA on both untransformed and log-trans-FIG. 1. All samples: CDFs for first-, second-, and third-year Con-
sent Agreement monitoring. formed data indicate that these differences are statisti-
AID RTP 1153 / 6e14$$$$41 10-07-97 17:18:34 rtpa AP: RTP
161MONITORING REFRACTORY CERAMIC FIBERS
was necessary to estimate the proportion of workers ineach FJC from a statistical sample. Table 3 providesestimates of the fraction of workers engaged in eachFJC at RCF manufacturing and processing locations(internal) and among customers/end-users (externalsamples). Restricting attention to relatively high-expo-sure FJCs, 5.4% of RCF manufacturing employees areengaged in finishing on an FTE basis. In the customer/end-user population, an estimated 6.9% perform fin-ishing, 29% furnace installation, and 5.0% removal ac-tivities on an FTE basis.
Differences among strata are statistically significant,whether or not the data are transformed. However, useof the log transformation sharpens the contrast. In-deed, the log transformation can be shown to be optimalamong a broad family of transformations. Using theBox-Cox family of power law transformations (Box andCox, 1964) it is customary to transform each observedTWA fiber concentration, fi (f/cm3), i Å 1, N, into atransformed variate, yi , using a transformation param-FIG. 2. Average TWA fiber concentrations by functional job cate-
gory, combined manufacturers, and customers. eter, l, as shown below (Maxim et al., 1994):
yi Å H( fli 0 1)/lfO l01 for l x 0
,nfi for l Å 0(1)cally significant (Põ 0.01). FJCs with the highest aver-
age TWA concentrations include installation, finishing,and removal activities—a finding with obvious impli-cations for focused efforts to reduce fiber concentra- where yi is the transformed observation, fi is the TWAtions. fiber concentration (f/cm3), f is the geometric mean of
Why are fiber concentrations higher for these FJCs? the fi values, and l is the transformation parameter. ABoth installation and removal activities are typically value of 1 for l amounts to no transformation, a valuecarried out at remote job locations, where it is difficult zero the log transformation, a value 0.5 the square-to use conventional engineering controls to reduce root transformation, etc. Using conventional ANOVAworkplace concentrations. Additionally, substantial calculations, the loglikelihood, defined asmechanical energy is expended on installation and re-moval jobs. Although finishing activities are normally Lmax(l) Å 00.5N,ns2(l), (2)carried out at fixed work stations—where use of expo-sure control techniques such as LEV are possible— where Lmax is the loglikelihood, s2(l) is the ANOVAfiber concentrations for this FJC have proven difficult residual mean square, and N is the sample size, is com-to reduce. This is because there is also a substantialamount of mechanical energy expended on the fiber(e.g., sawing and sanding) in finishing operations,
TABLE 3which increases fiber generation rates.Estimated Fraction of Workers Engaged in Each FJCThe fact that fiber concentrations vary with FJC
means that it is appropriate to use the estimated num-Stratum weightsber of workers in each category (ideally expressed as
full-time equivalents (FTEs)) to provide unbiased esti- Functional job RCF Customers/mates of overall average concentrations, because a category manucturers end-usersstratified sampling plan was used and the number of
Assembly 0.066 0.037samples allocated to each stratum differed from thatAuxiliary 0.27 0.15for proportional sampling. Accordingly, a parallel effort Fiber 0.39 0
was mounted to estimate the number of workers en- Finishing 0.054 0.069gaged in each FJC. For RCF manufacturing plants, Installation 0 0.29
Mixing/Forming 0.043 0.027this was a straightforward activity, because a censusOther (NEC) 0.17 0.38of workers could be obtained. Some of these workersRemoval 0 0.05perform activities in more than one FJC. In this event, Total 1.0 1.0
the worker’s time was prorated among the FJCs. ForNote. Totals may not add because of independent rounding.external samples, no census could be obtained and it
AID RTP 1153 / 6e14$$$$41 10-07-97 17:18:34 rtpa AP: RTP
162 MAXIM ET AL.
sign, some efficiency in longitudinal analysis was sacri-ficed for other objectives. Nonetheless, the availablemonitoring data can be used to study time trends.
Because (as noted) workplace concentration data arehighly variable, it is desirable to use as much of themonitoring data as possible for evaluation of timetrends. Accordingly, data have been included from 1990to 1996, not just those from the period of the ConsentAgreement. (Data prior to 1990 are too sparse to pro-vide a useful time series for analysis.) Second, tosmooth out within-FJC variation, it is useful to exam-ine weighted average workplace concentrations. Theappropriate weights are the fraction of the employeesin each FJC given in Table 3. The weighted averageworkplace fiber concentration is a useful measure ofthe exposure of the typical employee.
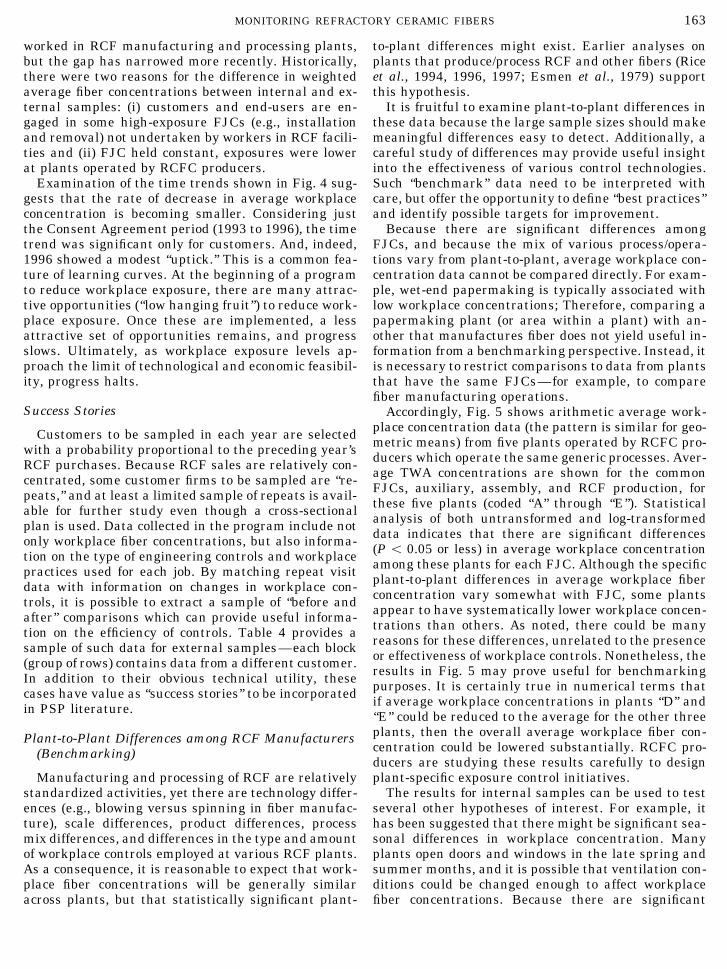
Figure 4 shows the time trend in weighted arithmeticaverage workplace fiber concentration from 1990 (whenthe separate monitoring programs were rationalized) to1996 for both internal and external samples. Although
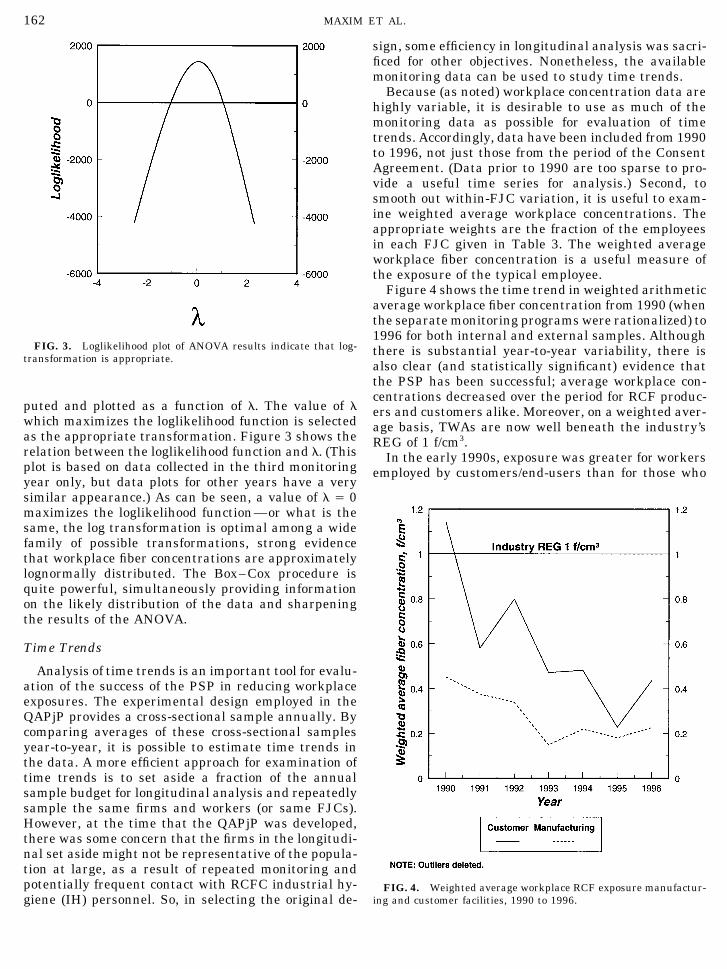
FIG. 3. Loglikelihood plot of ANOVA results indicate that log- there is substantial year-to-year variability, there istransformation is appropriate.
also clear (and statistically significant) evidence thatthe PSP has been successful; average workplace con-centrations decreased over the period for RCF produc-
puted and plotted as a function of l. The value of l ers and customers alike. Moreover, on a weighted aver-which maximizes the loglikelihood function is selected age basis, TWAs are now well beneath the industry’sas the appropriate transformation. Figure 3 shows the REG of 1 f/cm3.relation between the loglikelihood function and l. (This In the early 1990s, exposure was greater for workersplot is based on data collected in the third monitoring employed by customers/end-users than for those whoyear only, but data plots for other years have a verysimilar appearance.) As can be seen, a value of l Å 0maximizes the loglikelihood function—or what is thesame, the log transformation is optimal among a widefamily of possible transformations, strong evidencethat workplace fiber concentrations are approximatelylognormally distributed. The Box–Cox procedure isquite powerful, simultaneously providing informationon the likely distribution of the data and sharpeningthe results of the ANOVA.
Time Trends
Analysis of time trends is an important tool for evalu-ation of the success of the PSP in reducing workplaceexposures. The experimental design employed in theQAPjP provides a cross-sectional sample annually. Bycomparing averages of these cross-sectional samplesyear-to-year, it is possible to estimate time trends inthe data. A more efficient approach for examination oftime trends is to set aside a fraction of the annualsample budget for longitudinal analysis and repeatedlysample the same firms and workers (or same FJCs).However, at the time that the QAPjP was developed,there was some concern that the firms in the longitudi-nal set aside might not be representative of the popula-tion at large, as a result of repeated monitoring andpotentially frequent contact with RCFC industrial hy- FIG. 4. Weighted average workplace RCF exposure manufactur-
ing and customer facilities, 1990 to 1996.giene (IH) personnel. So, in selecting the original de-
AID RTP 1153 / 6e14$$$$41 10-07-97 17:18:34 rtpa AP: RTP
163MONITORING REFRACTORY CERAMIC FIBERS
worked in RCF manufacturing and processing plants, to-plant differences might exist. Earlier analyses onplants that produce/process RCF and other fibers (Ricebut the gap has narrowed more recently. Historically,
there were two reasons for the difference in weighted et al., 1994, 1996, 1997; Esmen et al., 1979) supportthis hypothesis.average fiber concentrations between internal and ex-
ternal samples: (i) customers and end-users are en- It is fruitful to examine plant-to-plant differences inthese data because the large sample sizes should makegaged in some high-exposure FJCs (e.g., installation
and removal) not undertaken by workers in RCF facili- meaningful differences easy to detect. Additionally, acareful study of differences may provide useful insightties and (ii) FJC held constant, exposures were lower
at plants operated by RCFC producers. into the effectiveness of various control technologies.Such ‘‘benchmark’’ data need to be interpreted withExamination of the time trends shown in Fig. 4 sug-
gests that the rate of decrease in average workplace care, but offer the opportunity to define ‘‘best practices’’and identify possible targets for improvement.concentration is becoming smaller. Considering just
the Consent Agreement period (1993 to 1996), the time Because there are significant differences amongFJCs, and because the mix of various process/opera-trend was significant only for customers. And, indeed,
1996 showed a modest ‘‘uptick.’’ This is a common fea- tions vary from plant-to-plant, average workplace con-centration data cannot be compared directly. For exam-ture of learning curves. At the beginning of a program
to reduce workplace exposure, there are many attrac- ple, wet-end papermaking is typically associated withlow workplace concentrations; Therefore, comparing ative opportunities (‘‘low hanging fruit’’) to reduce work-
place exposure. Once these are implemented, a less papermaking plant (or area within a plant) with an-other that manufactures fiber does not yield useful in-attractive set of opportunities remains, and progress
slows. Ultimately, as workplace exposure levels ap- formation from a benchmarking perspective. Instead, itis necessary to restrict comparisons to data from plantsproach the limit of technological and economic feasibil-
ity, progress halts. that have the same FJCs—for example, to comparefiber manufacturing operations.
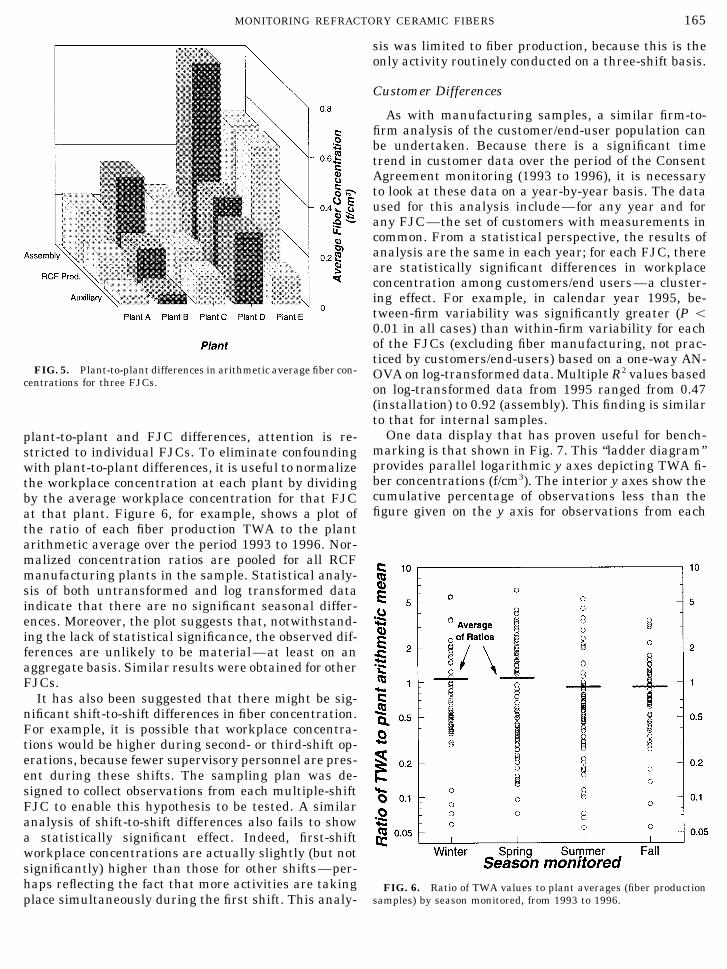
Success Stories Accordingly, Fig. 5 shows arithmetic average work-place concentration data (the pattern is similar for geo-Customers to be sampled in each year are selected metric means) from five plants operated by RCFC pro-with a probability proportional to the preceding year’s ducers which operate the same generic processes. Aver-RCF purchases. Because RCF sales are relatively con- age TWA concentrations are shown for the commoncentrated, some customer firms to be sampled are ‘‘re- FJCs, auxiliary, assembly, and RCF production, forpeats,’’ and at least a limited sample of repeats is avail- these five plants (coded ‘‘A’’ through ‘‘E’’). Statisticalable for further study even though a cross-sectional analysis of both untransformed and log-transformedplan is used. Data collected in the program include not data indicates that there are significant differencesonly workplace fiber concentrations, but also informa- (P õ 0.05 or less) in average workplace concentrationtion on the type of engineering controls and workplace among these plants for each FJC. Although the specificpractices used for each job. By matching repeat visit plant-to-plant differences in average workplace fiberdata with information on changes in workplace con- concentration vary somewhat with FJC, some plantstrols, it is possible to extract a sample of ‘‘before and appear to have systematically lower workplace concen-after’’ comparisons which can provide useful informa- trations than others. As noted, there could be manytion on the efficiency of controls. Table 4 provides a reasons for these differences, unrelated to the presencesample of such data for external samples—each block or effectiveness of workplace controls. Nonetheless, the(group of rows) contains data from a different customer. results in Fig. 5 may prove useful for benchmarkingIn addition to their obvious technical utility, these purposes. It is certainly true in numerical terms thatcases have value as ‘‘success stories’’ to be incorporated if average workplace concentrations in plants ‘‘D’’ andin PSP literature. ‘‘E’’ could be reduced to the average for the other threeplants, then the overall average workplace fiber con-Plant-to-Plant Differences among RCF Manufacturerscentration could be lowered substantially. RCFC pro-(Benchmarking)ducers are studying these results carefully to designplant-specific exposure control initiatives.Manufacturing and processing of RCF are relatively
standardized activities, yet there are technology differ- The results for internal samples can be used to testseveral other hypotheses of interest. For example, itences (e.g., blowing versus spinning in fiber manufac-
ture), scale differences, product differences, process has been suggested that there might be significant sea-sonal differences in workplace concentration. Manymix differences, and differences in the type and amount
of workplace controls employed at various RCF plants. plants open doors and windows in the late spring andsummer months, and it is possible that ventilation con-As a consequence, it is reasonable to expect that work-
place fiber concentrations will be generally similar ditions could be changed enough to affect workplacefiber concentrations. Because there are significantacross plants, but that statistically significant plant-
AID RTP 1153 / 6e14$$$$41 10-07-97 17:18:34 rtpa AP: RTP
164 MAXIM ET AL.
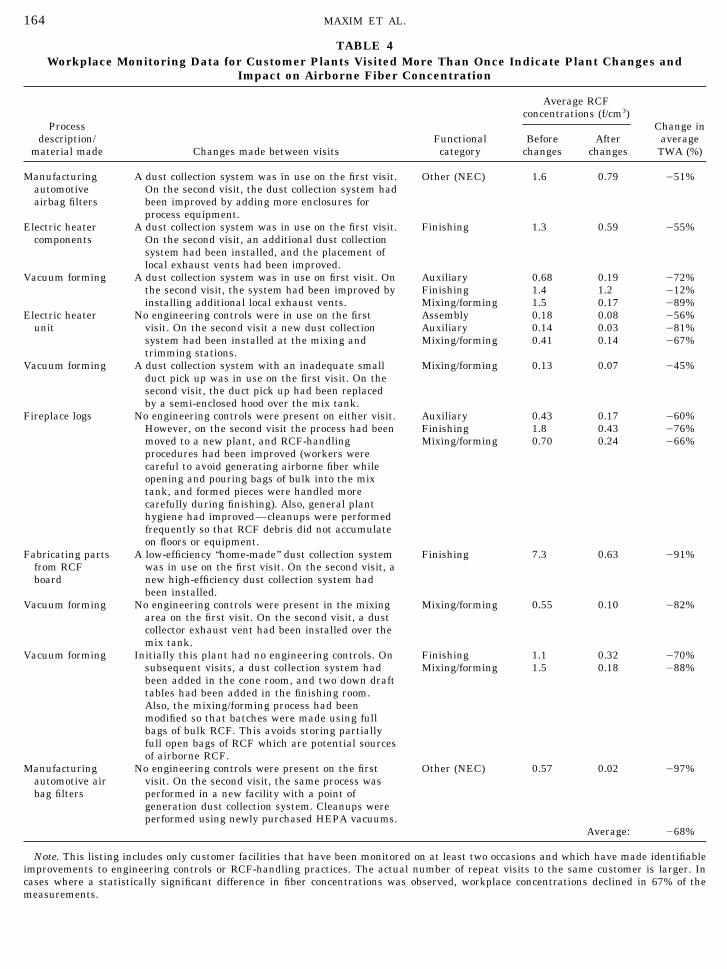
TABLE 4Workplace Monitoring Data for Customer Plants Visited More Than Once Indicate Plant Changes and
Impact on Airborne Fiber Concentration
Average RCFconcentrations (f/cm3)
Process Change indescription/ Functional Before After average
material made Changes made between visits category changes changes TWA (%)
Manufacturing A dust collection system was in use on the first visit. Other (NEC) 1.6 0.79 051%automotive On the second visit, the dust collection system hadairbag filters been improved by adding more enclosures for
process equipment.Electric heater A dust collection system was in use on the first visit. Finishing 1.3 0.59 055%
components On the second visit, an additional dust collectionsystem had been installed, and the placement oflocal exhaust vents had been improved.
Vacuum forming A dust collection system was in use on first visit. On Auxiliary 0.68 0.19 072%the second visit, the system had been improved by Finishing 1.4 1.2 012%installing additional local exhaust vents. Mixing/forming 1.5 0.17 089%
Electric heater No engineering controls were in use on the first Assembly 0.18 0.08 056%unit visit. On the second visit a new dust collection Auxiliary 0.14 0.03 081%
system had been installed at the mixing and Mixing/forming 0.41 0.14 067%trimming stations.
Vacuum forming A dust collection system with an inadequate small Mixing/forming 0.13 0.07 045%duct pick up was in use on the first visit. On thesecond visit, the duct pick up had been replacedby a semi-enclosed hood over the mix tank.
Fireplace logs No engineering controls were present on either visit. Auxiliary 0.43 0.17 060%However, on the second visit the process had been Finishing 1.8 0.43 076%moved to a new plant, and RCF-handling Mixing/forming 0.70 0.24 066%procedures had been improved (workers werecareful to avoid generating airborne fiber whileopening and pouring bags of bulk into the mixtank, and formed pieces were handled morecarefully during finishing). Also, general planthygiene had improved—cleanups were performedfrequently so that RCF debris did not accumulateon floors or equipment.
Fabricating parts A low-efficiency ‘‘home-made’’ dust collection system Finishing 7.3 0.63 091%from RCF was in use on the first visit. On the second visit, aboard new high-efficiency dust collection system had
been installed.Vacuum forming No engineering controls were present in the mixing Mixing/forming 0.55 0.10 082%
area on the first visit. On the second visit, a dustcollector exhaust vent had been installed over themix tank.
Vacuum forming Initially this plant had no engineering controls. On Finishing 1.1 0.32 070%subsequent visits, a dust collection system had Mixing/forming 1.5 0.18 088%been added in the cone room, and two down drafttables had been added in the finishing room.Also, the mixing/forming process had beenmodified so that batches were made using fullbags of bulk RCF. This avoids storing partiallyfull open bags of RCF which are potential sourcesof airborne RCF.
Manufacturing No engineering controls were present on the first Other (NEC) 0.57 0.02 097%automotive air visit. On the second visit, the same process wasbag filters performed in a new facility with a point of
generation dust collection system. Cleanups wereperformed using newly purchased HEPA vacuums.
Average: 068%
Note. This listing includes only customer facilities that have been monitored on at least two occasions and which have made identifiableimprovements to engineering controls or RCF-handling practices. The actual number of repeat visits to the same customer is larger. Incases where a statistically significant difference in fiber concentrations was observed, workplace concentrations declined in 67% of themeasurements.
AID RTP 1153 / 6e14$$1153 10-07-97 17:18:34 rtpa AP: RTP
165MONITORING REFRACTORY CERAMIC FIBERS
sis was limited to fiber production, because this is theonly activity routinely conducted on a three-shift basis.
Customer Differences
As with manufacturing samples, a similar firm-to-firm analysis of the customer/end-user population canbe undertaken. Because there is a significant timetrend in customer data over the period of the ConsentAgreement monitoring (1993 to 1996), it is necessaryto look at these data on a year-by-year basis. The dataused for this analysis include—for any year and forany FJC—the set of customers with measurements incommon. From a statistical perspective, the results ofanalysis are the same in each year; for each FJC, thereare statistically significant differences in workplaceconcentration among customers/end users—a cluster-ing effect. For example, in calendar year 1995, be-tween-firm variability was significantly greater (P õ0.01 in all cases) than within-firm variability for eachof the FJCs (excluding fiber manufacturing, not prac-ticed by customers/end-users) based on a one-way AN-
FIG. 5. Plant-to-plant differences in arithmetic average fiber con- OVA on log-transformed data. Multiple R2 values basedcentrations for three FJCs. on log-transformed data from 1995 ranged from 0.47
(installation) to 0.92 (assembly). This finding is similarto that for internal samples.
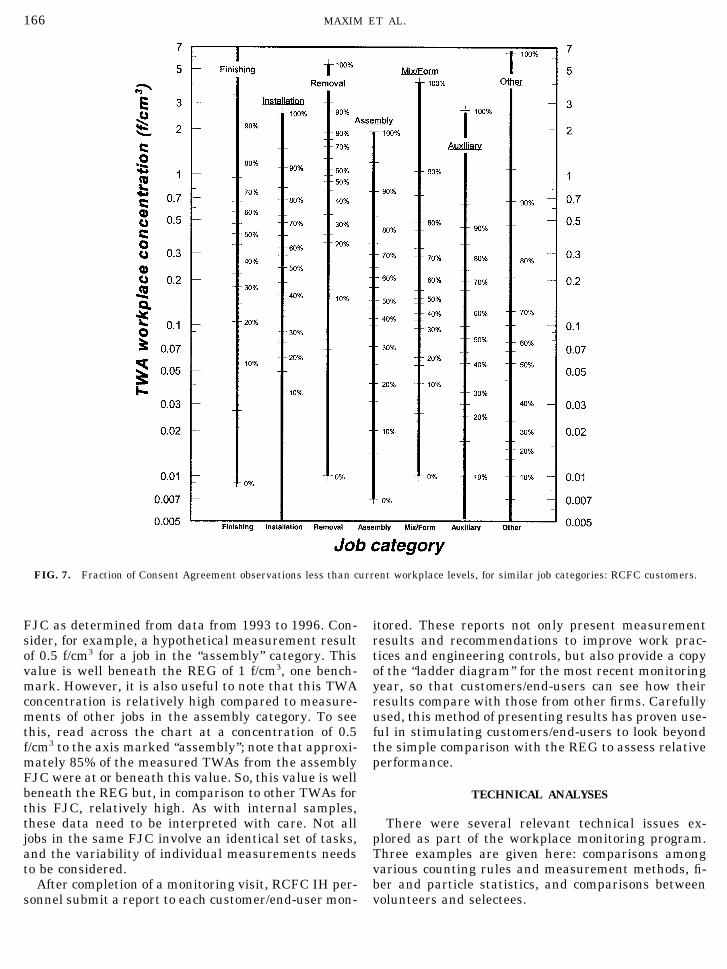
One data display that has proven useful for bench-plant-to-plant and FJC differences, attention is re-marking is that shown in Fig. 7. This ‘‘ladder diagram’’stricted to individual FJCs. To eliminate confoundingprovides parallel logarithmic y axes depicting TWA fi-with plant-to-plant differences, it is useful to normalizeber concentrations (f/cm3). The interior y axes show thethe workplace concentration at each plant by dividingcumulative percentage of observations less than theby the average workplace concentration for that FJCfigure given on the y axis for observations from eachat that plant. Figure 6, for example, shows a plot of
the ratio of each fiber production TWA to the plantarithmetic average over the period 1993 to 1996. Nor-malized concentration ratios are pooled for all RCFmanufacturing plants in the sample. Statistical analy-sis of both untransformed and log transformed dataindicate that there are no significant seasonal differ-ences. Moreover, the plot suggests that, notwithstand-ing the lack of statistical significance, the observed dif-ferences are unlikely to be material—at least on anaggregate basis. Similar results were obtained for otherFJCs.
It has also been suggested that there might be sig-nificant shift-to-shift differences in fiber concentration.For example, it is possible that workplace concentra-tions would be higher during second- or third-shift op-erations, because fewer supervisory personnel are pres-ent during these shifts. The sampling plan was de-signed to collect observations from each multiple-shiftFJC to enable this hypothesis to be tested. A similaranalysis of shift-to-shift differences also fails to showa statistically significant effect. Indeed, first-shiftworkplace concentrations are actually slightly (but notsignificantly) higher than those for other shifts—per-haps reflecting the fact that more activities are taking FIG. 6. Ratio of TWA values to plant averages (fiber production
samples) by season monitored, from 1993 to 1996.place simultaneously during the first shift. This analy-
AID RTP 1153 / 6e14$$$$41 10-07-97 17:18:34 rtpa AP: RTP
166 MAXIM ET AL.
FIG. 7. Fraction of Consent Agreement observations less than current workplace levels, for similar job categories: RCFC customers.
FJC as determined from data from 1993 to 1996. Con- itored. These reports not only present measurementresults and recommendations to improve work prac-sider, for example, a hypothetical measurement result
of 0.5 f/cm3 for a job in the ‘‘assembly’’ category. This tices and engineering controls, but also provide a copyof the ‘‘ladder diagram’’ for the most recent monitoringvalue is well beneath the REG of 1 f/cm3, one bench-
mark. However, it is also useful to note that this TWA year, so that customers/end-users can see how theirresults compare with those from other firms. Carefullyconcentration is relatively high compared to measure-
ments of other jobs in the assembly category. To see used, this method of presenting results has proven use-ful in stimulating customers/end-users to look beyondthis, read across the chart at a concentration of 0.5
f/cm3 to the axis marked ‘‘assembly’’; note that approxi- the simple comparison with the REG to assess relativeperformance.mately 85% of the measured TWAs from the assembly
FJC were at or beneath this value. So, this value is wellbeneath the REG but, in comparison to other TWAs for TECHNICAL ANALYSESthis FJC, relatively high. As with internal samples,these data need to be interpreted with care. Not all There were several relevant technical issues ex-
plored as part of the workplace monitoring program.jobs in the same FJC involve an identical set of tasks,and the variability of individual measurements needs Three examples are given here: comparisons among
various counting rules and measurement methods, fi-to be considered.After completion of a monitoring visit, RCFC IH per- ber and particle statistics, and comparisons between
volunteers and selectees.sonnel submit a report to each customer/end-user mon-
AID RTP 1153 / 6e14$$$$41 10-07-97 17:18:34 rtpa AP: RTP
167MONITORING REFRACTORY CERAMIC FIBERS
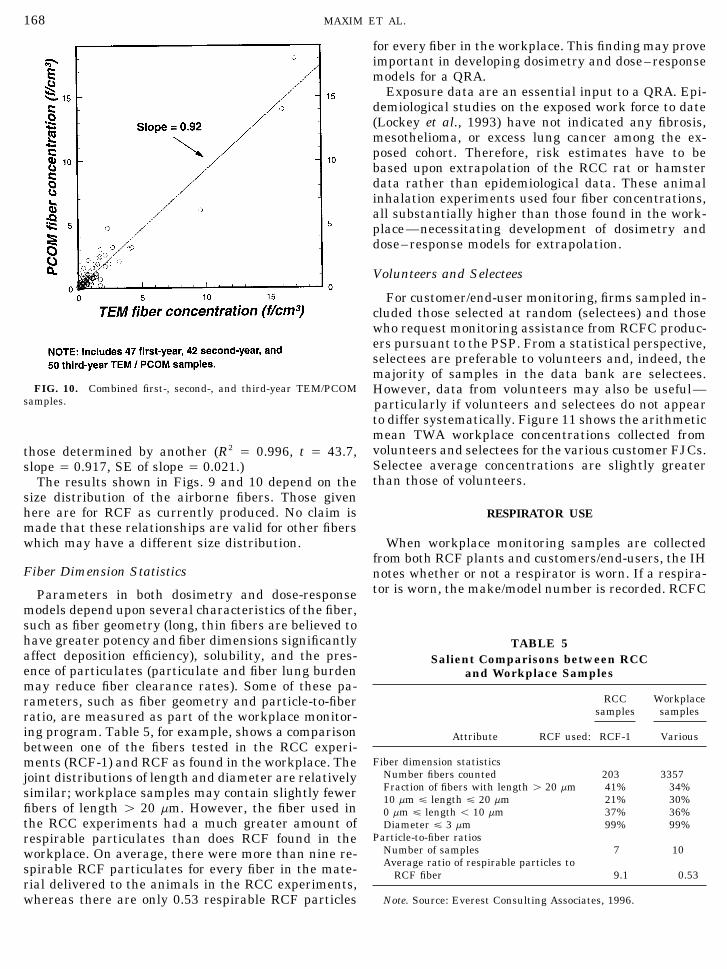
NIOSH 7400B. How much greater depends upon thepercentage of the joint diameter–length distributionof airborne RCF that fall into region ‘‘B’’ in Fig. 8—ultimately an empirical question. As part of the Con-sent Agreement, personal monitoring samples weretaken and counted using both rules. Figure 9 shows theregression relationship between NIOSH 7400B countsand those determined using the WHO rule. The ratioestimator indicates that, for RCF, NIOSH 7400Bcounts are approximately 95% of those determined us-ing the WHO rule (R2 Å 0.998, t Å 296.5, slope Å 0.947,and SE of slope Å 0.003). Thus, European RCF data(counted using the WHO rule) can be adjusted to theequivalent NIOSH 7400B by dividing by 0.95.
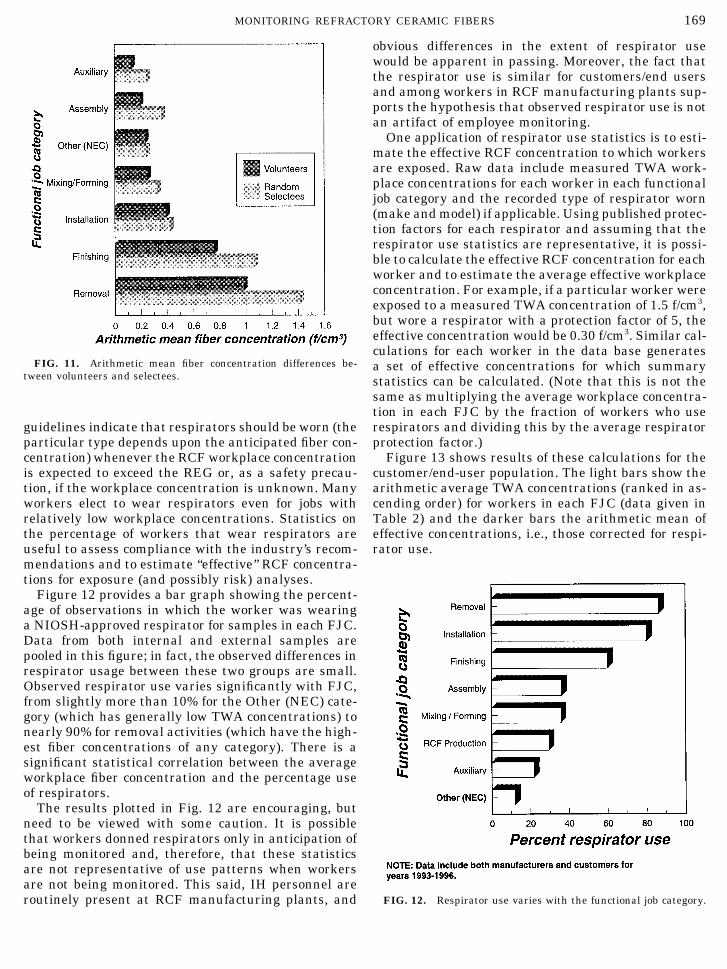
A similar analysis was used to examine the relation-ship between workplace concentrations determined us-ing TEM data and those determined using PCOM. Asnoted, TEM has a lower detection threshold (in terms offiber diameter) than PCOM; workplace concentrationsdetermined from PCOM are expected to be less thanthose determined by TEM. How much greater? Thesampling protocol called for random samples of per-sonal monitoring cassettes to be analyzed by both TEMand PCOM. (Because the filters differ slightly, thesame samples cannot be analyzed using each method,it is necessary to collected two samples.) Figure 10
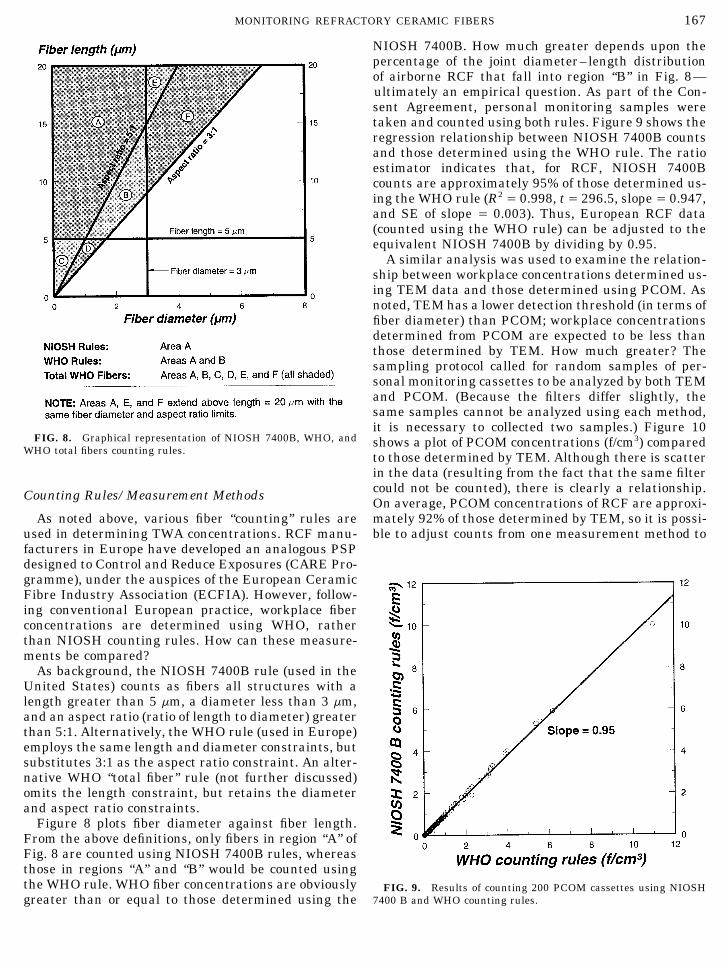
FIG. 8. Graphical representation of NIOSH 7400B, WHO, and shows a plot of PCOM concentrations (f/cm3) comparedWHO total fibers counting rules. to those determined by TEM. Although there is scatter
in the data (resulting from the fact that the same filtercould not be counted), there is clearly a relationship.Counting Rules/Measurement Methods On average, PCOM concentrations of RCF are approxi-mately 92% of those determined by TEM, so it is possi-As noted above, various fiber ‘‘counting’’ rules are
used in determining TWA concentrations. RCF manu- ble to adjust counts from one measurement method tofacturers in Europe have developed an analogous PSPdesigned to Control and Reduce Exposures (CARE Pro-gramme), under the auspices of the European CeramicFibre Industry Association (ECFIA). However, follow-ing conventional European practice, workplace fiberconcentrations are determined using WHO, ratherthan NIOSH counting rules. How can these measure-ments be compared?
As background, the NIOSH 7400B rule (used in theUnited States) counts as fibers all structures with alength greater than 5 mm, a diameter less than 3 mm,and an aspect ratio (ratio of length to diameter) greaterthan 5:1. Alternatively, the WHO rule (used in Europe)employs the same length and diameter constraints, butsubstitutes 3:1 as the aspect ratio constraint. An alter-native WHO ‘‘total fiber’’ rule (not further discussed)omits the length constraint, but retains the diameterand aspect ratio constraints.
Figure 8 plots fiber diameter against fiber length.From the above definitions, only fibers in region ‘‘A’’ ofFig. 8 are counted using NIOSH 7400B rules, whereasthose in regions ‘‘A’’ and ‘‘B’’ would be counted usingthe WHO rule. WHO fiber concentrations are obviously FIG. 9. Results of counting 200 PCOM cassettes using NIOSH
7400 B and WHO counting rules.greater than or equal to those determined using the
AID RTP 1153 / 6e14$$$$42 10-07-97 17:18:34 rtpa AP: RTP
168 MAXIM ET AL.
for every fiber in the workplace. This finding may proveimportant in developing dosimetry and dose–responsemodels for a QRA.
Exposure data are an essential input to a QRA. Epi-demiological studies on the exposed work force to date(Lockey et al., 1993) have not indicated any fibrosis,mesothelioma, or excess lung cancer among the ex-posed cohort. Therefore, risk estimates have to bebased upon extrapolation of the RCC rat or hamsterdata rather than epidemiological data. These animalinhalation experiments used four fiber concentrations,all substantially higher than those found in the work-place—necessitating development of dosimetry anddose–response models for extrapolation.
Volunteers and Selectees
For customer/end-user monitoring, firms sampled in-cluded those selected at random (selectees) and thosewho request monitoring assistance from RCFC produc-ers pursuant to the PSP. From a statistical perspective,selectees are preferable to volunteers and, indeed, themajority of samples in the data bank are selectees.
FIG. 10. Combined first-, second-, and third-year TEM/PCOM However, data from volunteers may also be useful—samples. particularly if volunteers and selectees do not appear
to differ systematically. Figure 11 shows the arithmeticmean TWA workplace concentrations collected fromvolunteers and selectees for the various customer FJCs.those determined by another (R2 Å 0.996, t Å 43.7,Selectee average concentrations are slightly greaterslope Å 0.917, SE of slope Å 0.021.)than those of volunteers.The results shown in Figs. 9 and 10 depend on the
size distribution of the airborne fibers. Those givenhere are for RCF as currently produced. No claim is RESPIRATOR USEmade that these relationships are valid for other fiberswhich may have a different size distribution. When workplace monitoring samples are collected
from both RCF plants and customers/end-users, the IHFiber Dimension Statistics notes whether or not a respirator is worn. If a respira-
tor is worn, the make/model number is recorded. RCFCParameters in both dosimetry and dose-responsemodels depend upon several characteristics of the fiber,such as fiber geometry (long, thin fibers are believed tohave greater potency and fiber dimensions significantly TABLE 5affect deposition efficiency), solubility, and the pres- Salient Comparisons between RCCence of particulates (particulate and fiber lung burden and Workplace Samplesmay reduce fiber clearance rates). Some of these pa-
RCC Workplacerameters, such as fiber geometry and particle-to-fibersamples samplesratio, are measured as part of the workplace monitor-
ing program. Table 5, for example, shows a comparison Attribute RCF-1 VariousRCF used:between one of the fibers tested in the RCC experi-
Fiber dimension statisticsments (RCF-1) and RCF as found in the workplace. TheNumber fibers counted 203 3357joint distributions of length and diameter are relativelyFraction of fibers with length ú 20 mm 41% 34%similar; workplace samples may contain slightly fewer 10 mm £ length £ 20 mm 21% 30%
fibers of length ú 20 mm. However, the fiber used in 0 mm £ length õ 10 mm 37% 36%the RCC experiments had a much greater amount of Diameter £ 3 mm 99% 99%
Particle-to-fiber ratiosrespirable particulates than does RCF found in theNumber of samples 7 10workplace. On average, there were more than nine re-Average ratio of respirable particles tospirable RCF particulates for every fiber in the mate- RCF fiber 9.1 0.53
rial delivered to the animals in the RCC experiments,Note. Source: Everest Consulting Associates, 1996.whereas there are only 0.53 respirable RCF particles
AID RTP 1153 / 6e14$$$$42 10-07-97 17:18:34 rtpa AP: RTP
169MONITORING REFRACTORY CERAMIC FIBERS
obvious differences in the extent of respirator usewould be apparent in passing. Moreover, the fact thatthe respirator use is similar for customers/end usersand among workers in RCF manufacturing plants sup-ports the hypothesis that observed respirator use is notan artifact of employee monitoring.
One application of respirator use statistics is to esti-mate the effective RCF concentration to which workersare exposed. Raw data include measured TWA work-place concentrations for each worker in each functionaljob category and the recorded type of respirator worn(make and model) if applicable. Using published protec-tion factors for each respirator and assuming that therespirator use statistics are representative, it is possi-ble to calculate the effective RCF concentration for eachworker and to estimate the average effective workplaceconcentration. For example, if a particular worker wereexposed to a measured TWA concentration of 1.5 f/cm3,but wore a respirator with a protection factor of 5, theeffective concentration would be 0.30 f/cm3. Similar cal-culations for each worker in the data base generates
FIG. 11. Arithmetic mean fiber concentration differences be- a set of effective concentrations for which summarytween volunteers and selectees. statistics can be calculated. (Note that this is not the
same as multiplying the average workplace concentra-tion in each FJC by the fraction of workers who userespirators and dividing this by the average respiratorguidelines indicate that respirators should be worn (the
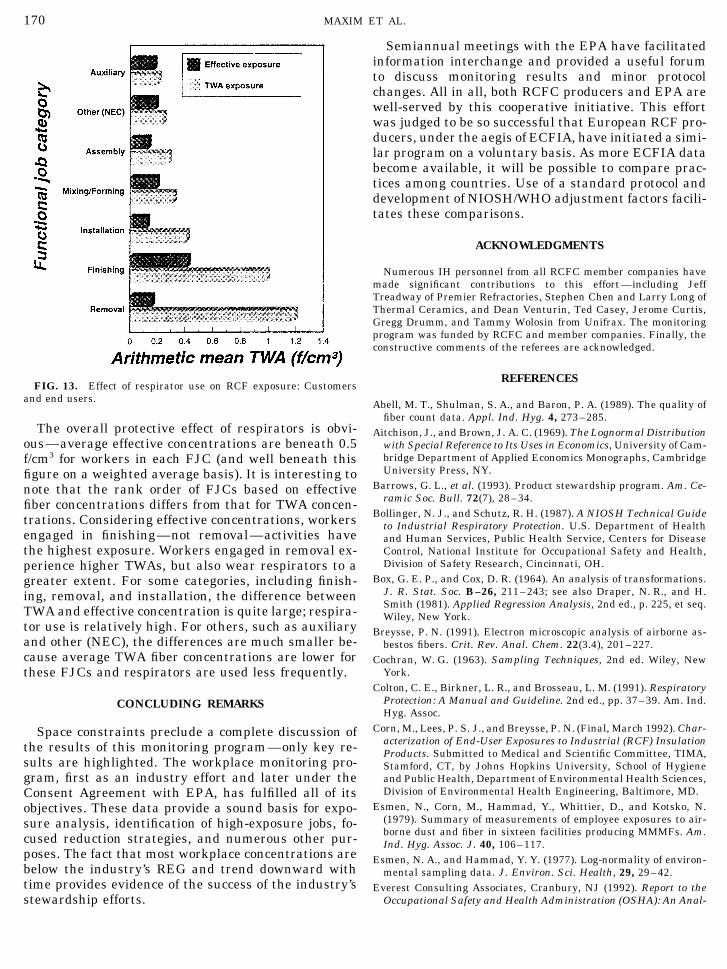
particular type depends upon the anticipated fiber con- protection factor.)Figure 13 shows results of these calculations for thecentration) whenever the RCF workplace concentration
is expected to exceed the REG or, as a safety precau- customer/end-user population. The light bars show thearithmetic average TWA concentrations (ranked in as-tion, if the workplace concentration is unknown. Many
workers elect to wear respirators even for jobs with cending order) for workers in each FJC (data given inTable 2) and the darker bars the arithmetic mean ofrelatively low workplace concentrations. Statistics on
the percentage of workers that wear respirators are effective concentrations, i.e., those corrected for respi-rator use.useful to assess compliance with the industry’s recom-
mendations and to estimate ‘‘effective’’ RCF concentra-tions for exposure (and possibly risk) analyses.
Figure 12 provides a bar graph showing the percent-age of observations in which the worker was wearinga NIOSH-approved respirator for samples in each FJC.Data from both internal and external samples arepooled in this figure; in fact, the observed differences inrespirator usage between these two groups are small.Observed respirator use varies significantly with FJC,from slightly more than 10% for the Other (NEC) cate-gory (which has generally low TWA concentrations) tonearly 90% for removal activities (which have the high-est fiber concentrations of any category). There is asignificant statistical correlation between the averageworkplace fiber concentration and the percentage useof respirators.
The results plotted in Fig. 12 are encouraging, butneed to be viewed with some caution. It is possiblethat workers donned respirators only in anticipation ofbeing monitored and, therefore, that these statisticsare not representative of use patterns when workersare not being monitored. This said, IH personnel are
FIG. 12. Respirator use varies with the functional job category.routinely present at RCF manufacturing plants, and
AID RTP 1153 / 6e14$$$$42 10-07-97 17:18:34 rtpa AP: RTP
170 MAXIM ET AL.
Semiannual meetings with the EPA have facilitatedinformation interchange and provided a useful forumto discuss monitoring results and minor protocolchanges. All in all, both RCFC producers and EPA arewell-served by this cooperative initiative. This effortwas judged to be so successful that European RCF pro-ducers, under the aegis of ECFIA, have initiated a simi-lar program on a voluntary basis. As more ECFIA databecome available, it will be possible to compare prac-tices among countries. Use of a standard protocol anddevelopment of NIOSH/WHO adjustment factors facili-tates these comparisons.
ACKNOWLEDGMENTS
Numerous IH personnel from all RCFC member companies havemade significant contributions to this effort—including JeffTreadway of Premier Refractories, Stephen Chen and Larry Long ofThermal Ceramics, and Dean Venturin, Ted Casey, Jerome Curtis,Gregg Drumm, and Tammy Wolosin from Unifrax. The monitoringprogram was funded by RCFC and member companies. Finally, theconstructive comments of the referees are acknowledged.
REFERENCESFIG. 13. Effect of respirator use on RCF exposure: Customers
and end users. Abell, M. T., Shulman, S. A., and Baron, P. A. (1989). The quality offiber count data. Appl. Ind. Hyg. 4, 273–285.
The overall protective effect of respirators is obvi- Aitchison, J., and Brown, J. A. C. (1969). The Lognormal Distributionous—average effective concentrations are beneath 0.5 with Special Reference to Its Uses in Economics, University of Cam-
bridge Department of Applied Economics Monographs, Cambridgef/cm3 for workers in each FJC (and well beneath thisUniversity Press, NY.figure on a weighted average basis). It is interesting to
Barrows, G. L., et al. (1993). Product stewardship program. Am. Ce-note that the rank order of FJCs based on effectiveramic Soc. Bull. 72(7), 28–34.fiber concentrations differs from that for TWA concen-
Bollinger, N. J., and Schutz, R. H. (1987). A NIOSH Technical Guidetrations. Considering effective concentrations, workers to Industrial Respiratory Protection. U.S. Department of Healthengaged in finishing—not removal—activities have and Human Services, Public Health Service, Centers for Disease
Control, National Institute for Occupational Safety and Health,the highest exposure. Workers engaged in removal ex-Division of Safety Research, Cincinnati, OH.perience higher TWAs, but also wear respirators to a
Box, G. E. P., and Cox, D. R. (1964). An analysis of transformations.greater extent. For some categories, including finish-J. R. Stat. Soc. B–26, 211–243; see also Draper, N. R., and H.ing, removal, and installation, the difference betweenSmith (1981). Applied Regression Analysis, 2nd ed., p. 225, et seq.TWA and effective concentration is quite large; respira- Wiley, New York.
tor use is relatively high. For others, such as auxiliary Breysse, P. N. (1991). Electron microscopic analysis of airborne as-and other (NEC), the differences are much smaller be- bestos fibers. Crit. Rev. Anal. Chem. 22(3.4), 201–227.cause average TWA fiber concentrations are lower for Cochran, W. G. (1963). Sampling Techniques, 2nd ed. Wiley, New
York.these FJCs and respirators are used less frequently.Colton, C. E., Birkner, L. R., and Brosseau, L. M. (1991). Respiratory
Protection: A Manual and Guideline. 2nd ed., pp. 37–39. Am. Ind.CONCLUDING REMARKSHyg. Assoc.
Corn, M., Lees, P. S. J., and Breysse, P. N. (Final, March 1992). Char-Space constraints preclude a complete discussion ofacterization of End-User Exposures to Industrial (RCF) Insulationthe results of this monitoring program—only key re- Products. Submitted to Medical and Scientific Committee, TIMA,
sults are highlighted. The workplace monitoring pro- Stamford, CT, by Johns Hopkins University, School of Hygienegram, first as an industry effort and later under the and Public Health, Department of Environmental Health Sciences,
Division of Environmental Health Engineering, Baltimore, MD.Consent Agreement with EPA, has fulfilled all of itsEsmen, N., Corn, M., Hammad, Y., Whittier, D., and Kotsko, N.objectives. These data provide a sound basis for expo-
(1979). Summary of measurements of employee exposures to air-sure analysis, identification of high-exposure jobs, fo-borne dust and fiber in sixteen facilities producing MMMFs. Am.cused reduction strategies, and numerous other pur- Ind. Hyg. Assoc. J. 40, 106–117.
poses. The fact that most workplace concentrations are Esmen, N. A., and Hammad, Y. Y. (1977). Log-normality of environ-below the industry’s REG and trend downward with mental sampling data. J. Environ. Sci. Health, 29, 29–42.time provides evidence of the success of the industry’s Everest Consulting Associates, Cranbury, NJ (1992). Report to the
Occupational Safety and Health Administration (OSHA): An Anal-stewardship efforts.
AID RTP 1153 / 6e14$$$$42 10-07-97 17:18:34 rtpa AP: RTP
171MONITORING REFRACTORY CERAMIC FIBERS
ysis of the Economic Feasibility of a 1 f/cc Permissible Exposure multiyear workplace-monitoring program for refractory ceramicfibers. Regul. Toxicol. Pharmacol. 20, S200–S215.Limit (PEL) for the Refractory Ceramic Fiber (RCF) Industry.
[Sponsored by the Refractory Ceramic Fibers Coalition (RCFC), McConnell, E. E., Mast, R. W., Hesterberg, T. W., Chevalier, J.,1133 Connecticut Avenue, Suite 1200, Washington, DC 20036] Kotin, P., Bernstein, D. M., Thevenaz, P., Glass, L. R., and Ander-
son, R. (1995). Chronic inhalation toxicity of a kaolin-based refrac-Everest Consulting Associates, Cranbury, NJ (1994). Draft-Firsttory ceramic fiber (RCF) in Syrian golden hamsters. Inhal. Toxicol.Year Report on Workplace Monitoring. [Submitted to the U.S. Envi-7, 503–532.ronmental Protection Agency, Washington, DC, on behalf of the
Refractory Ceramic Fibers Coalition (RCFC), 1133 Connecticut Av- Members of the Ad Hoc DGXI Working Subcommittee of Refractoryenue, NW, Suite 1200, Washington, DC 20036] Ceramic Fibres (RCFs) (March 16, 1994). The Relationship between
Airborne Fibre Concentration and Diameter for Refractory CeramicEverest Consulting Associates, Cranbury, NJ (1995). Draft-SecondFibre (RCF): A Preliminary Working Paper. European CeramicYear Report on Workplace Monitoring. [Submitted to the U.S. Envi-Fibre Industry Association.ronmental Protection Agency, Washington, DC, on behalf of the
National Institute for Occupational Safety and Health (NIOSH) (Rev.Refractory Ceramic Fibers Coalition (RCFC), 1133 Connecticut Av-1989). NIOSH Method 7400: fibers. In Manual of Analytical Meth-enue, NW, Suite 1200, Washington, DC 20036]ods, 3rd edition, 1987.Everest Consulting Associates, Cranbury, NJ (1996a). Particulate-
Refractory Ceramic Fibers Coalition (RCFC) and RCFC Memberto-Fiber Ratios and Fiber Size Distributions in the RCC MaximumCompanies and Consultants (1993). Refractory Ceramic FiberTolerated Dose (MTD) Study and in the Workplace, presented toMonitoring Project: Quality Assurance Project Plan (QAPjP). [Pre-the U.S. Environmental Protection Agency, Washington, DC.pared for Office of Prevention, Pesticides and Toxic Substances
Everest Consulting Associates, Cranbury, NJ (1996b). Refractory Ce- (OPPTS), U.S. Environmental Protection Agency (EPA), Washing-ramic Fibers: A Substitute Study. [Published by the Refractory ton, DC]Ceramic Fibers Coalition (RCFC), 1133 Connecticut Avenue, NW,
Rice, C., et al. (1994). Assessment of current fiber and silica exposureSuite 1200, Washington, DC 20036]in the U.S. refractory ceramic fiber manufacturing industry. Ann.
Everest Consulting Associates, Cranbury, NJ (1996c). Draft—Third- Occup. Hyg. 38(1), 739–744.Year Report on Workplace Monitoring. [Submitted to the U.S. Envi- Rice, C., et al. (1996). Identification of changes in airborne fiber con-ronmental Protection Agency, Washington, DC, on behalf of the centrations in refractory ceramic fiber manufacture related to pro-Refractory Ceramic Fibers Coalition (RCFC), 1133 Connecticut Av- cess or ventilation modifications. Ann. Occup. Hyg. 3, 85–90.enue, NW, Suite 1200, Washington, DC 20036]
Rice, C., et al. (1997). Estimation of historical and current employeeGilbert, Richard O. (1987). Statistical Methods for Environmental exposure to refractory ceramic fibers during manufacturing and
Pollution Monitoring, Chapter 12, p. 152. Van Nostrand Reinhold, related operations. Applied Occup. Envir. Hyg. J. 12, 54–61.New York. Symanski, E., et al. (1996). An investigation of systematic changes
Glass, L. R., Mast, R. W., Hesterberg, T. W., Anderson, R., McCon- in occupational exposure. Am. Ind. Hyg. Assoc. J. 57, 724–735.nell, E. E., and Bernstein, D. M. (1992). Inhalation oncogenicity of TIMA, Inc. (July 10, 1990). Health and Safety Aspects of Man-Maderefractory ceramic fiber (RCF) in rats—Final results. Toxicologist Vitreous Fibers, Information, Data, Comments and Recommenda-12(1), 377. tions Regarding Occupational Exposure to Man-Made Vitreous Fi-
Gross, P., Westrick, M. L., and Schrenk, H. H. (1955). Final Report bers. [Submitted by TIMA, Inc, in response to the National Insti-on an Investigation of the Effects of Fiberfrax Dust Upon the Lungs tute for Occupational Safety and Health’s Request for Commentsof Rats. [For The Carborundum Company, Niagara Falls, NY, by and Secondary Data Relevant to Occupational Exposure to Syn-Industrial Hygiene Foundation of America, Inc., Pittsburgh, PA] thetic and Natural Mineral Fibers. 55 Fed. Reg. 5073 (February
13, 1990)]Koch, G. S., and Link, R. F. (1980). Statistical Analysis of GeologicalU.S. Environmental Protection Agency (EPA) (29 May 1992). Guide-Data. Dover, NY.
lines for exposure assessment. 57 Fed. Reg. 22688–22938.Lockey, J., Lemasters, G., Rice, C., McKay, R., and Gartside, P.Walters, Thomas E. (1995). Refractory ceramic fibers update. Am.(1993). A Retrospective Cohort Morbidity, Mortality and Nested
Ceramic Soc. Bull. 74, 61–64.Case Control Study of the Respiratory Health of Individuals Manu-World Health Organization (WHO) (1985). Reference Methods forfacturing Refractory Ceramic Fiber and RCF Product. Research
Measuring Airborne Man-Made Mineral Fibres (MMMF), WHO/Report, University of Cincinnati, Cincinnati, OH.EURO MMMF Reference Scheme, Monitoring Concentration UsingMast, R. W., McConnell, E. E., Glass, L. R., Hesterberg, T. W., Theve-a Phase Contrast Optical Microscope, Determining Size Using anaz, P., Chevalier, J., and Anderson, R. (1993). A multiple-doseScanning Electron Microscope. [Prepared by the WHO/EUROchronic inhalation toxicity study of kaolin refractory ceramic fiberTechnical Committee for Monitoring and Evaluating Airborne(RCF) in male Fisher 344 rats. Toxicologist 13(1), 43.MMMF, World Health Organization, Copenhagen]
Mast, R. W., McConnell, E. E., Glass, L. R., Hesterberg, T. W., Ander- Yu, C. P., Zhang, L., Oberdorster, G., Mast, R. W., Glass, L. R., andson, R., and Bernstein, D. M. (1992). Inhalation oncogenicity of Utell, J. J. (1994). Deposition modeling of refractory ceramic fiberskaolin refractory ceramic fiber (RCF) in hamsters—Final results. (RCF) in the rat lung. J. Aerosol Sci. 25, 407–417.Toxicologist 12(1), 377.
Yu, C. P., Zhang, L., Oberdorster, G., Mast, R. W., Maxim, L. D., andMast, R. W., McConnell, E. E., Hesterberg, T. W., Chevalier, J., Utell, M. J. (1995). Deposition of refractory ceramic fibers (RCF) in
Kotin, P., Thevenaz, P., Bernstein, D. M., Glass, L. R., Miiller, the human respiratory trace and comparison with rodent studies.W. C., and Anderson, R. (1995a). A multiple-dose chronic inhala- Aerosol Sci. Technol. 23, 291–300.tion toxicity study of size-separated kaolin refractory ceramic fiber Yu, C. P., Ding, Y. J., Zhang, L., Oberdorster, G., Mast, R. W., Maxim,(RCF) in male Fischer 344 rats. Inhal. Toxicol. 7, 469–502. L. D., and Utell, M. J. (1996). A clearance model of refractory ce-
Mast, R. W. McConnell, E. E., Anderson, R., Chevalier, J., Kotin, P., ramic fibers (RCF) in the rat lung including fiber dissolution andBernstein, D. M., Thevenaz, R., Glass, L. R., Miiller, W. C., and breakage. J. Aerosol Sci. 27, 151–160.Hesterberg, T. W. (1995b). Studies on the chronic toxicity (inhala- Yu, C. P., Ding, Y. J., Zhang, L., Oberdorster, G., Mast, R. W., Maxim,tion) of four types of refractory ceramic fiber in male Fischer 344 L. D., and Utell, M. J. (1997). Retention modeling of refractoryrats. Inhal. Toxicol. 7, 425–468. ceramic fibers (RCF) in humans. Regul. Toxicol. Pharmacol. 25,
18–25.Maxim, L. D., Kelly, W. P., Walters, T., and Waugh, R. (1994). A
AID RTP 1153 / 6e14$$$$42 10-07-97 17:18:34 rtpa AP: RTP


![(1994) "Conclusions" [on the foreign policy of Zimbabwe]](https://static.fdokumen.com/doc/165x107/6337923f6f78ac31240ea390/1994-conclusions-on-the-foreign-policy-of-zimbabwe.jpg)